Embed Size (px)
Citation preview
Characterization of Moisture Content in a Concrete PanelUsing Synthetic Aperture Radar ImagesAhmed Alzeyadi, S.M.ASCE1; and Tzuyang Yu, Ph.D., A.M.ASCE2
Abstract: Moisture content in concrete structures is commonly associated with many durability problems (e.g., steel corrosion and freeze-thaw) and can be used in structural health monitoring and nondestructive testing of concrete structures. In this paper, the use of syntheticaperture radar (SAR) imaging for characterizing subsurface moisture content and distribution is proposed, using a concrete panel specimenas an example. A 0.3 × 0.3 × 0.05-m concrete panel specimen cast and conditioned in laboratory was air-dried for almost 5 months andsimultaneously monitored for its moisture variation by SAR imaging. From the analysis of its SAR images at different moisture contents, itwas found that SAR images can not only qualitatively capture the moisture distribution inside concrete but can also quantitatively correlatewith the overall moisture content inside concrete. Higher SAR amplitudes indicate stronger electromagnetic scattering response, suggestinggreater values of dielectric constant. A critical contour in SAR images is proposed as an insightful measure for the subsurface sensing ofconcrete. An approach for determining the critical contour in each SAR image is proposed. DOI: 10.1061/(ASCE)AS.1943-5525.0000945.© 2018 American Society of Civil Engineers.
Introduction
Presence of moisture inside portland cement concrete plays a signifi-cant role in short-term strength development (cement hydration) andlong-term durability of reinforced and prestressed concrete struc-tures. Moisture inside concrete not only facilitates most durabilityproblems [e.g., freezing and thawing (Wang et al. 2014; Zeng et al.2011; Cai and Liu 1998), steel reinforcement corrosion, carbonation,and alkali-silica reaction (ASR)] in concrete structures, but itsamount and distribution are also related to the hydraulic permeabilityof concrete. In the freeze-thaw damage of non-air-entrained concrete,it has been reported that concrete will experience significant damagewhen its moisture content exceeds 80% (Fagerlund 1977). In thechloride-induced corrosion of steel rebar inside concrete structures,moisture facilitates the diffusion of water through the capillary poresinside concrete (Gonzalez et al. 1993; Bentur et al. 1997). Carbona-tion of concrete is encouragedwhen the relative humidity inside con-crete is between 55%–65% (Gonzalez et al. 1993). Research has alsoshown that expansive ASR can occur in concrete having a relativehumidity above 80% (Stark 1991). In addition, it is well known thatsaturated concrete is weaker than dry concrete, generally by 20%(Shoukry et al. 2011; Li et al. 2009).
Despite knowing that moisture content in concrete is crucial tothe performance of concrete structures, it is difficult to determine themoisture content inside concrete in the field without using intrusiveor embedded moisture sensors. To avoid troublesome issues asso-ciated with embedded moisture sensors, nondestructive evaluation/testing (NDE/T) techniques have been applied. Among existing
NDE/T techniques, gravimetric sensors (Akita et al. 1997; Šelihet al. 1996), gamma densitometry (Multon et al. 2004; Amba et al.2010), relative humidity, and thermal and microwave/radar methods(Sbartaï et al. 2006, 2007) have been applied for moisture determi-nation. In general, an ideal NDE/T technique for moisture determi-nation in concrete must be quantitative, capable of detecting internalmoisture distribution, and invulnerable to environmental factors[e.g., temperature and soluble salt content (Cornell and Coote1972)]. Ultimately, it has been suggested that such a techniqueshould be able to quantify different phases (free water, bound water,and chemically bound water) of moisture inside concrete (Quincotet al. 2011).
Electromagnetic techniques such as ground-penetrating radar(GPR), on the other hand, are capable of conducting spatial andquantitative moisture determination in concrete specimens (Sbartaïet al. 2006; Senin and Hamid 2016; Sbartaï et al. 2007; Yu 2010,2011) and structures (Chen and Wimsatt 2010; Yu 2017). The abil-ity of radar signals (electromagnetic waves) to propagate throughdielectrics like concrete makes electromagnetic techniques suitablefor conducting subsurface moisture content measurements insideconcrete. Laurens et al. (2002) used a 1.5-GHz central frequencyGPR system to evaluate the moisture content of 0.5 × 0.5 × 0.07-mconcrete slabs at various saturation levels (0%–100%). They foundthat the GPR signal attenuates linearly with increases of moisturecontent. It was also reported that the presence of moisture reducesthe center frequency of reflected GPR signal in another similarstudy (Laurens et al. 2005). Sbartaï et al. (2006) studied the am-plitudes of GPR signals (direct and reflected) with a center fre-quency of 1.5 GHz inside concrete slabs (0.75 × 0.5 × 0.08 m)at different moisture levels (0%, 20%, 40%, 60%, 80%, and 100%).They also found that amplitudes of direct and reflected GPR signalsdecrease linearly with the increase in moisture content. Klysz andBalayssac (2007) applied a GPR (300–1,200 MHz) system on con-crete slabs (0.6 × 0.6 × 0.12 m) with various moisture contents toinvestigate the effect of moisture on GPR signal amplitude and sig-nal velocity. They found that both amplitude and velocity of theGPR signal reduce with increases in moisture content (an indicationof dielectric dispersion). Although most researchers reported linearattenuation of GPR signals with the increase of moisture content in
1Doctoral Candidate, Dept. of Civil and Environmental Engineering,Univ.of Massachusetts Lowell, Lowell, MA 01854. Email: [email protected]
2Associate Professor, Dept. of Civil and Environmental Engineering,Univ. of Massachusetts Lowell, Lowell, MA 01854 (corresponding author).Email: [email protected]
Note. This manuscript was submitted on February 8, 2018; approvedon June 4, 2018; published online on September 11, 2018. Discussionperiod open until February 11, 2019; separate discussions must besubmitted for individual papers. This paper is part of the Journal ofAerospace Engineering, © ASCE, ISSN 0893-1321.
© ASCE 04018112-1 J. Aerosp. Eng.
J. Aerosp. Eng., 2019, 32(1): 04018112
Dow
nloa
ded
from
asc
elib
rary
.org
by
Tzu
yang
Yu
on 0
9/11
/18.
Cop
yrig
ht A
SCE
. For
per
sona
l use
onl
y; a
ll ri
ghts
res
erve
d.
concrete, some reported a nonlinear attenuation between GPR sig-nal and moisture content (Sbartaï et al. 2009). A literature reviewrevealed that there are no other reported radar imaging techniquesbesides GPR for the determination of moisture content in concrete.
The objective of this paper is to apply synthetic aperture radar(SAR) imaging for determining moisture content in concrete spec-imens. SAR imaging is a relatively new technique in civil engi-neering applications. Unlike GPR, SAR imaging utilizes imagesuperposition to improve resolution and damage detectability. Inthis paper, the principle of SAR imaging is first introduced, fol-lowed by the experimental work on specimen preparation, moisturemonitoring, and laboratory SAR imaging. Research findings aresummarized and finally, conclusions are offered.
Principle of SAR Imaging
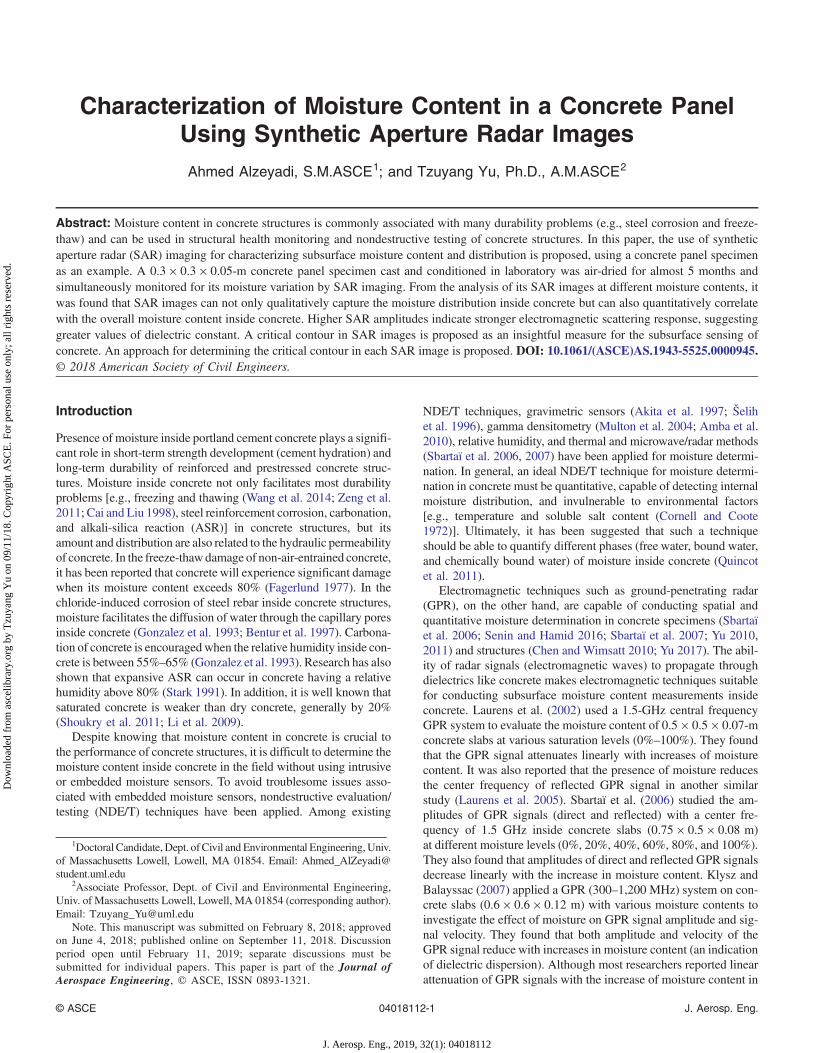
In SAR imaging, high-resolution coherent images are producedwith adjustable frequency bandwidth and radar aperture. Higherfrequencies and wider bandwidths lead to SAR images with betterresolution, and the increased radar aperture due to prolongedradar movement can also produce high-resolution SAR images. Animage-formation algorithm is used to produce such coherent im-ages from raw SAR data. In SAR imaging, the back-scattering pat-tern of any target is first formulated by a planar scattering problemin a domain Ωs containing N scattering points (Fig. 1). Consider anincident wave with unit amplitude as follows (Kong 2000):
ψincðrÞ ¼1
r· expðiki · rÞ ð1Þ
where ki ¼ kixx − kixy is the incident wave vector; and r is theposition vector from the radar to any observation point, jrj ¼ r.The scattered field from scatterer j at rj and observed at r is(Tsang et al. 2000)
ψscatðr; rjÞ ¼sjðr; kiÞjr − rjj
· expðikjr − rjjÞ · ψincðrÞ ð2Þ
where sj ¼ sjðr; kiÞ is the scattered amplitude at scatterer j due toan incident wave at ki and observed at r; i ¼ ffiffiffiffiffiffi−1p
; and k ¼ ω=c.By neglecting the higher-order interactions among scatterers in thisformulation, the total scattered field from N scatterers observed at ris the summation of all the scattered fields, as follows:
ψscatðrÞ ¼XNj¼1
sjðr; kiÞjr − rjj
· expðikjr − rjjÞ · ψincðrÞ ð3Þ
where ks ¼ ksxxþ ksyy is the scattering direction vector, whereks ¼ −ki when the radar operates in monostatic mode. Considering
the case of a single scatterer without losing generality, Eq. (3) canbe written
ψscatðω; θÞ ¼ ψscatðk; rsÞ ¼sθr2
· exp
�ircωð1þ cos2θ − sin2θÞ
�
ð4Þ
where θ ¼ θi ¼ tan−1ðkiy=kixÞ. Eq. (4) is obtained by taking a sliceof the two-dimensional (2D) Fourier transform (FT) of the do-main Ωs.
In other reconstruction algorithms, all projections are superim-posed before 2D inverse fourier transform (IFT) (plane projection)is carried out to obtain the final image. However, in the back-projection algorithm, one-dimensional (1D) IFT is performed firstto generate subimages. The final image is obtained by summing upall subimages. A frequency modulation operator (or time-domainconvolution operator) is applied to ensure that the center in back-projection images coincides with the center of the scatterer. Ashifting-back step in the back-projection algorithm in the frequencydomain is performed by applying a ramp filter in which frequencyωn is shifted back by a carrier frequency ωc
Pðν; θÞ ¼Z
ωmax
ωmin
dω · ψscatðω − ωc; θÞjω − ωcj · expð−iωνÞ
¼ sθr2
·Z
ωmax
ωmin
dω · jω − ωcj
· exp
�ircðω − ωcÞ × ð1þ cos2θ − sin2θÞ − iων
�ð5Þ
where ν = spatial variable of the 1D IFT projection. Translating thelocal 1D IFT coordinate [ν;Pðν; θsÞ] to the global polar coordinateðr;ϕÞ indicates that
ν ¼ r cosðϕ − θsÞ ð6Þ
Upsampling is required when transforming from Pðν; θÞ toP½r cosðϕ − θÞ; θ� to ensure the quality of back-projection images.In other words, P½r cosðϕ − θÞ; θ� is obtained by interpolatingPðν; θÞ. In the polar coordinate system, a back-projection imageis finally obtained by integrating subimages at various azimuth an-gles over the entire inspection range
Iðr;ϕÞ ¼Z
θint=2
−θint=2dθ · Pðr cosðϕ− θÞ;θÞ
¼ sθr2
·Z
θint=2
−θint=2dθ
Zωmax
ωmin
dω · jω−ωcj
· exp
�ircðω− ωcÞ · ð1þ cos2θ− sin2θÞ− iωrcosðϕ− θsÞ
�
ð7Þ
where the polar coordinates ðr;ϕÞ are related to the Cartesiancoordinates by
x ¼ r cosϕ ð8Þ
y ¼ r sinϕ ð9Þ
Therefore, the image plane Iðx; yÞ ¼ Iðr cosϕ; r sinϕÞ can bereconstructed. Fig. 2 illustrates the processing step of the back-projection algorithm.Fig. 1. N point scattering domain.
© ASCE 04018112-2 J. Aerosp. Eng.
J. Aerosp. Eng., 2019, 32(1): 04018112
Dow
nloa
ded
from
asc
elib
rary
.org
by
Tzu
yang
Yu
on 0
9/11
/18.
Cop
yrig
ht A
SCE
. For
per
sona
l use
onl
y; a
ll ri
ghts
res
erve
d.
Experimental Program
Specimen Preparation
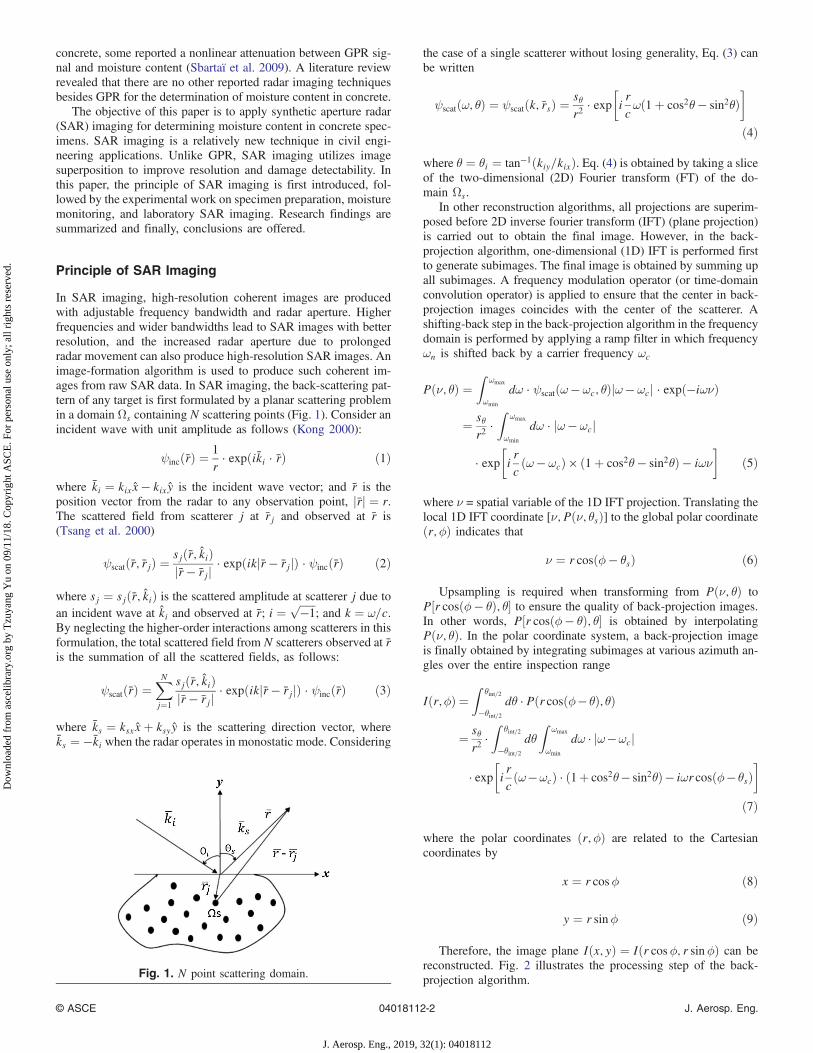
A 0.3 × 0.3 × 0.05-m concrete panel was designed and manufac-tured for the purpose of moisture characterization inside concrete.General-purpose Type I/II portland cement was used. The mix de-sign ratio (by weight) was 1∶2∶4 for cement: fine aggregate: coarseaggregate. The concrete panel was moist-cured for 28 days andstored in room conditions (air-drying) for almost 5 months. Table 1lists the design information of the concrete panel. Fig. 3 shows apicture and schematic diagram of the concrete panel.
Moisture Monitoring
During the SAR imaging process, the mass of the panel was moni-tored using an electronic scale for almost 5 months. After the mois-ture monitoring period, the panel was oven-heated at an elevatedtemperature of 80°C for 1 month (30 days) until the mass stabilized.The last mass measurement was used as the zero-moisture mass ofthe concrete panel. The moisture content of concrete panel was cal-culated by
ψ ¼ mw −md
md· 100 ð10Þ
where ψ = moisture content (%); mw = mass of concrete panel at agiven air-drying time; and md = oven-dried mass of concrete panelat the end of the oven-heating period.
SAR Imaging
SAR images of the concrete panel at various moisture contentswere conducted using a 10-GHz continuous-wave imaging radar(CWIR) system with a 1.5-GHz bandwidth inside an anechoicchamber at the Electromagnetic Remote Sensing Laboratory at
Fig. 2. Back-projection algorithm processing steps.
Fig. 3. (a) Picture; and (b) schematic of concrete panel.
Table 1. Design of concrete panel
Property Value
w/c ratio 0.45Mix ratio 1∶2∶4Maximum coarse aggregate size (cm) 2.50Minimum coarse aggregate size (cm) 0.90
Note: w/c ratio = water-to-cement ratio.
© ASCE 04018112-3 J. Aerosp. Eng.
J. Aerosp. Eng., 2019, 32(1): 04018112
Dow
nloa
ded
from
asc
elib
rary
.org
by
Tzu
yang
Yu
on 0
9/11
/18.
Cop
yrig
ht A
SCE
. For
per
sona
l use
onl
y; a
ll ri
ghts
res
erve
d.

the University of Massachusetts at Lowell. The CWIR system op-erates in the stripmap SAR mode by using a 2D positioner. In allSAR images, the range (r) of the concrete panel was 0.35 m and thecross range rx ¼ 0.80 m. SAR images were collected at differentmoisture contents in the same experimental configuration. Fig. 4shows a picture and schematic setup of the SAR imaging system.
Results and Findings
Moisture Content Quantification
Fig. 5 shows the time-dependent pattern of the air-dried concretepanel. Average temperature in the laboratory was observed 28°C(Fig. 5). It was found that, in the room-condition (oven-drying)environment, the moisture content of concrete panel decreased rap-idly at the early age (0–500 h) at a rate of 0.25% per hour. At thelater stage (500–3,219 h), it lost 0.03% of moisture per hour. Therate of moisture loss during 0–500 h was more than eight timesthe rate during 500–3,219 h. Eq. (11) provides the time-dependentmoisture variation model from curve-fitting. The R2 of the modelwas 0.9953
ψðtÞ ¼ aebt þ cedt ð11Þ
where ψ = moisture content (%) at time t; t = time (h); a ¼ 0.996;b ¼ −0.006298; c ¼ 2.77; and d ¼ −0.0001931. Eq. (11) can beused for quantifying moisture content inside the concrete panel inthis research.
SAR Images of Concrete Panel
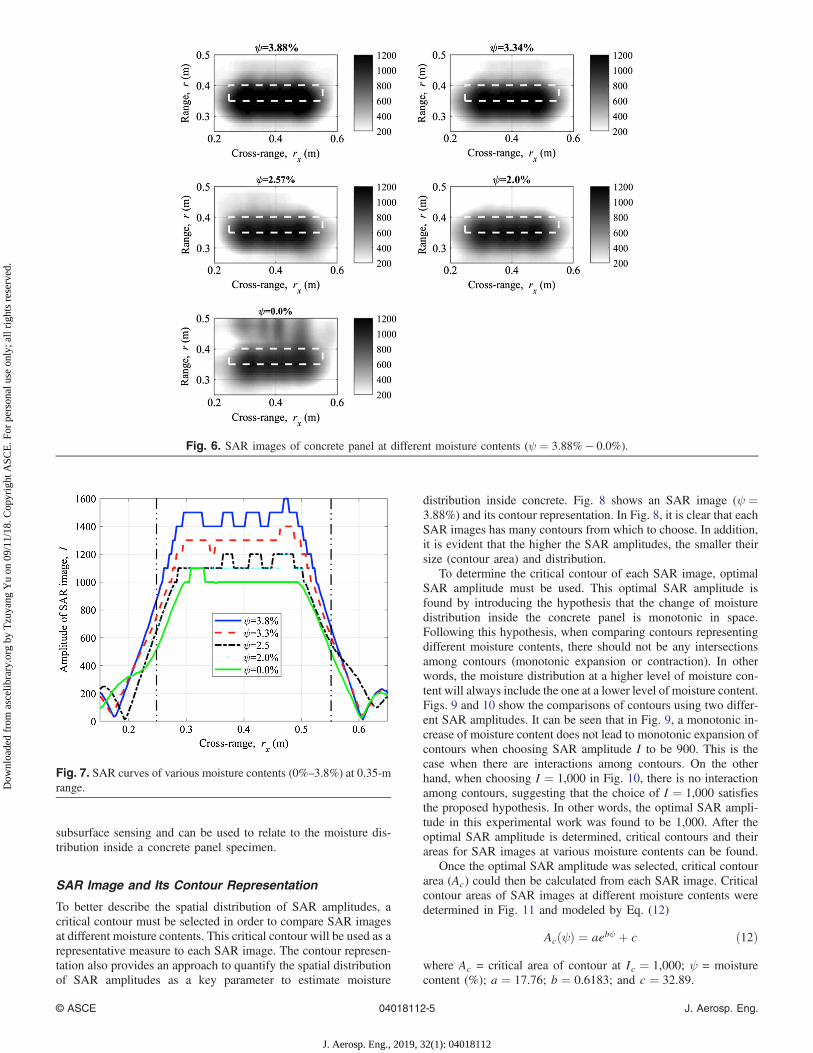
SAR images of the concrete panel at different moisture contentswere collected as shown in Fig. 6. In Fig. 6, the spatial distributionof SAR amplitudes is rendered on the range–cross-range ðr; rxÞplane. Higher SAR amplitudes in Fig. 6 indicate a stronger electro-magnetic scattering response, suggesting greater values of dielec-tric constant (real part of relative complex electric permittivity).Because moisture (liquid water) has a dielectric constant of 78–81and dry concrete has a dielectric constant of 5–15 in the microwavefrequency range, it is expected that the presence of moisture insideconcrete will increase the dielectric constant of dry concrete. Fig. 6provides the experimental validation of dielectric mixture theory inwet/moist concrete as a multiphase porous cementitious composite.
This result is better illustrated by the slice representation in Fig. 7,taken at a 0.35-m range for selected SAR images.
Spatial Distribution (Shape) of SAR Amplitudes
Furthermore, moisture distribution inside concrete was recon-structed in space by SAR imaging in Fig. 6. As shown in Fig. 6,the shape of SAR amplitudes remained basically constant, exceptfor the oven-dried case (ψ ¼ 0%). Greater SAR amplitudes occupymore area in a SAR image when the concrete panel has highermoisture content. This is because of the stronger electromagneticreflection from wet concrete, which were integrated by the back-projection algorithm and eventually projected onto the range–cross-range plane. Also, reflection from the back of the concretepanel was not observed for any of the moisture contents exceptfor the oven-dried case. The sensitivity of electromagnetic waves(radar signals) to the change in dielectric properties (moisture con-tent) of concrete enables use of the SAR imaging technique formoisture characterization. This result indicates that, with the in-crease of moisture content, higher SAR amplitudes also demon-strate wider spatial distribution. This result was attributed to thecapability of SAR imaging to project scattered radar signals backto their estimated spatial locations. It indicates that the spatial dis-tribution of SAR amplitudes shows insightful information for
Fig. 4. (a) Picture; and (b) schematic of SAR imaging system.
Fig. 5. Moisture content variation with time for the concrete panel.
© ASCE 04018112-4 J. Aerosp. Eng.
J. Aerosp. Eng., 2019, 32(1): 04018112
Dow
nloa
ded
from
asc
elib
rary
.org
by
Tzu
yang
Yu
on 0
9/11
/18.
Cop
yrig
ht A
SCE
. For
per
sona
l use
onl
y; a
ll ri
ghts
res
erve
d.
subsurface sensing and can be used to relate to the moisture dis-tribution inside a concrete panel specimen.
SAR Image and Its Contour Representation
To better describe the spatial distribution of SAR amplitudes, acritical contour must be selected in order to compare SAR imagesat different moisture contents. This critical contour will be used as arepresentative measure to each SAR image. The contour represen-tation also provides an approach to quantify the spatial distributionof SAR amplitudes as a key parameter to estimate moisture
distribution inside concrete. Fig. 8 shows an SAR image (ψ ¼3.88%) and its contour representation. In Fig. 8, it is clear that eachSAR images has many contours from which to choose. In addition,it is evident that the higher the SAR amplitudes, the smaller theirsize (contour area) and distribution.
To determine the critical contour of each SAR image, optimalSAR amplitude must be used. This optimal SAR amplitude isfound by introducing the hypothesis that the change of moisturedistribution inside the concrete panel is monotonic in space.Following this hypothesis, when comparing contours representingdifferent moisture contents, there should not be any intersectionsamong contours (monotonic expansion or contraction). In otherwords, the moisture distribution at a higher level of moisture con-tent will always include the one at a lower level of moisture content.Figs. 9 and 10 show the comparisons of contours using two differ-ent SAR amplitudes. It can be seen that in Fig. 9, a monotonic in-crease of moisture content does not lead to monotonic expansion ofcontours when choosing SAR amplitude I to be 900. This is thecase when there are interactions among contours. On the otherhand, when choosing I ¼ 1,000 in Fig. 10, there is no interactionamong contours, suggesting that the choice of I ¼ 1,000 satisfiesthe proposed hypothesis. In other words, the optimal SAR ampli-tude in this experimental work was found to be 1,000. After theoptimal SAR amplitude is determined, critical contours and theirareas for SAR images at various moisture contents can be found.
Once the optimal SAR amplitude was selected, critical contourarea (Ac) could then be calculated from each SAR image. Criticalcontour areas of SAR images at different moisture contents weredetermined in Fig. 11 and modeled by Eq. (12)
AcðψÞ ¼ aebψ þ c ð12Þ
where Ac = critical area of contour at Ic ¼ 1,000; ψ = moisturecontent (%); a ¼ 17.76; b ¼ 0.6183; and c ¼ 32.89.
Fig. 6. SAR images of concrete panel at different moisture contents (ψ ¼ 3.88% − 0.0%).
Fig. 7. SAR curves of various moisture contents (0%–3.8%) at 0.35-mrange.
© ASCE 04018112-5 J. Aerosp. Eng.
J. Aerosp. Eng., 2019, 32(1): 04018112
Dow
nloa
ded
from
asc
elib
rary
.org
by
Tzu
yang
Yu
on 0
9/11
/18.
Cop
yrig
ht A
SCE
. For
per
sona
l use
onl
y; a
ll ri
ghts
res
erve
d.
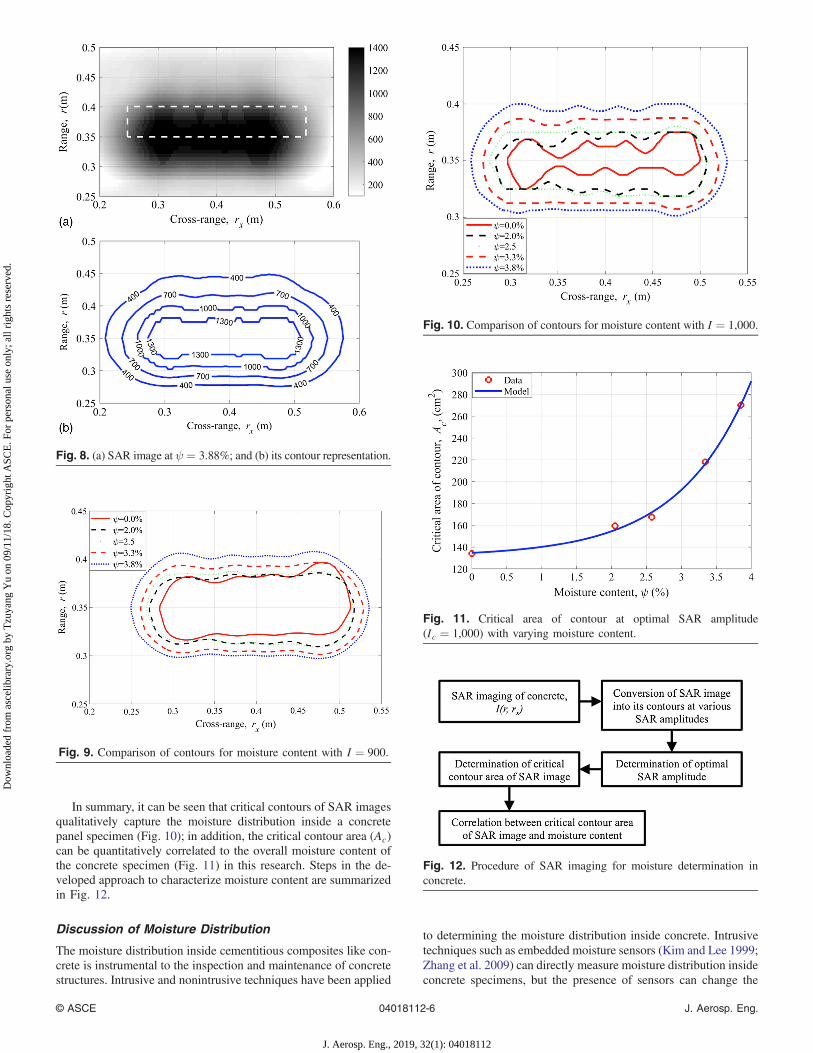
In summary, it can be seen that critical contours of SAR imagesqualitatively capture the moisture distribution inside a concretepanel specimen (Fig. 10); in addition, the critical contour area (Ac)can be quantitatively correlated to the overall moisture content ofthe concrete specimen (Fig. 11) in this research. Steps in the de-veloped approach to characterize moisture content are summarizedin Fig. 12.
Discussion of Moisture Distribution
The moisture distribution inside cementitious composites like con-crete is instrumental to the inspection and maintenance of concretestructures. Intrusive and nonintrusive techniques have been applied
to determining the moisture distribution inside concrete. Intrusivetechniques such as embedded moisture sensors (Kim and Lee 1999;Zhang et al. 2009) can directly measure moisture distribution insideconcrete specimens, but the presence of sensors can change the
Fig. 9. Comparison of contours for moisture content with I ¼ 900.
Fig. 10. Comparison of contours for moisture content with I ¼ 1,000.
Fig. 11. Critical area of contour at optimal SAR amplitude(Ic ¼ 1,000) with varying moisture content.
Fig. 12. Procedure of SAR imaging for moisture determination inconcrete.
Fig. 8. (a) SAR image at ψ ¼ 3.88%; and (b) its contour representation.
© ASCE 04018112-6 J. Aerosp. Eng.
J. Aerosp. Eng., 2019, 32(1): 04018112
Dow
nloa
ded
from
asc
elib
rary
.org
by
Tzu
yang
Yu
on 0
9/11
/18.
Cop
yrig
ht A
SCE
. For
per
sona
l use
onl
y; a
ll ri
ghts
res
erve
d.
boundary condition of moisture diffusion in concrete and providenonrepresentative results. Nonintrusive techniques such as ultra-sounds (Popovic 2005), impedance spectroscopy (Sánchez et al.2013), and magnetic resonance imaging (MRI) signal point imag-ing (Cano-Barrita et al. 2004) can be applied for concrete speci-mens prepared in specific shapes and dimensions. From reporteddata, a double-curvature pattern of moisture distribution has beenexperimentally confirmed by researchers (Cano-Barrita et al. 2004;Garbalinska et al. 2018). In this double-curvature moisture distri-bution pattern, subsurface moisture increases slowly from the sur-face of concrete specimens and increases rapidly to achieve theplateau of the distribution curve after a certain depth.
On the other hand, numerical simulation results using Fick-typediffusion (Garbalinska et al. 2018) and microstructure hydration(Ye et al. 2018) have also been reported to predict the subsurfacemoisture distribution. These numerical models predict a single-curvature moisture distribution pattern and are associated with alarge error in the near-surface region. In this study’s SAR imagingresults, it was found that the double-curvature moisture distributionpattern is very similar to the SAR amplitude distribution in Fig. 7,suggesting a promising potential of SAR imaging for subsurfacemoisture distribution sensing of concrete specimens and structures.
Conclusion
Moisture characterization inside concrete using a nondestructiveapproach is an important and challenging problem for the durabilityof concrete structures. In this experimental work using SAR imag-ing for subsurface moisture characterization, it was found thathigher SAR amplitudes indicate stronger electromagnetic scatter-ing response, suggesting greater values of dielectric constant (realpart of relative complex electric permittivity). The increase in thedielectric constant of wet concrete is attributed to the presence ofmoisture inside the porous structure of theconcrete. Meanwhile,with the increase of moisture content, higher SAR amplitudes alsoexhibit broader spatial distribution in SAR images. This result isdue to the capability of SAR imaging to project scattered radarsignals back to their estimated spatial locations. The spatial distri-bution of SAR amplitudes shows insightful information for subsur-face sensing and can be used to relate to moisture distribution insidea concrete panel specimen. The use of critical contours in SAR im-ages is proposed for both qualitatively correlating with moisturedistribution and quantitatively estimating moisture content insidea concrete penal specimen in this research. A procedure summariz-ing the steps for determining critical contour from SAR images hasalso been presented. From this result, the promising potential ofSAR imaging for moisture characterization inside concrete hasbeen demonstrated.
References
Akita, H., T. Fujiwara, and Y. Ozaka. 1997. “A practical procedure for theanalysis of moisture transfer within concrete due to drying.” Mag.Concr. Res. 49 (179): 129–137. https://doi.org/10.1680/macr.1997.49.179.129.
Amba, J. C., J. P. Balayssac, and C. H. Détriché. 2010. “Characterization ofdifferential shrinkage of bonded mortar overlays subjected to drying.”Mater. Struct. 43 (1–2): 297–308. https://doi.org/10.1617/s11527-009-9489-8.
Bentur, A., S. Diamond, and N. S. Berke. 1997. Steel corrosion in concrete.London: E & FN Spon.
Cai, H., and X. Liu. 1998. “Freeze-thaw durability of concrete: Ice forma-tion process in pores.” Cem. Concr. Res. 28 (9): 1281–1287. https://doi.org/10.1016/S0008-8846(98)00103-3.
Cano-Barrita, P. D. J., B. J. Balcom, T. W. Bremner, M. B. MacMillan, andW. S. Langley. 2004. “Moisture distribution in drying ordinary and highperformance concrete cured in a simulated hot dry climate.” Mater.Struct. 37 (8): 522–531. https://doi.org/10.1007/BF02481576.
Chen, D., and A. Wimsatt. 2010. “Inspection and condition assessmentusing ground penetrating radar.” J. Geotech. Environ. Eng. 136 (1):207–214. https://doi.org/10.1061/(ASCE)GT.1943-5606.0000190.
Cornell, J. B., and A. T. Coote. 1972. “The application of an infrared ab-sorption technique to the measurement of moisture content of buildingmaterials.” J. Appl. Chem. Biotechnol. 22 (4): 455–463. https://doi.org/10.1002/jctb.2720220403.
Fagerlund, G. 1977. “The critical degree of saturation method of assessingthe freeze/thaw resistance of concrete.” Mater. Struct. 10 (4): 217–229.https://doi.org/10.1007/BF02478694.
Garbalinska, H., M. Stasiak, M. Bochenek, and G. Musielak. 2018.“Assessment of a new method for determining the relationship betweeneffective diffusivity and moisture concentration—Exemplified by auto-claved aerated concrete of four density classes.” Int. J. Heat MassTransfer 124: 288–297. https://doi.org/10.1016/j.ijheatmasstransfer.2018.03.051.
Gonzalez, J. A., W. Lopez, and P. Rodriguez. 1993. “Effects of moistureavailability on corrosion kinetics of steel embedded in concrete.”Corrosion 49 (12): 1004–1010.
Kim, J.-K., and C.-S. Lee. 1999. “Moisture distribution of concrete con-sidering self-desiccation at early ages.” Cem. Concr. Res. 29 (12):1921–1927. https://doi.org/10.1016/S0008-8846(99)00192-1.
Klysz, G., and J. P. Balayssac. 2007. “Determination of volumetric watercontent of concrete using ground-penetrating radar.” Cem. Concr. Res.37 (8): 1164–1171. https://doi.org/10.1016/j.cemconres.2007.04.010.
Kong, J. A. 2000. Electromagnetic wave theory. Cambridge, MA: EMW.Laurens, S., J. P. Balayssac, J. Rhazi, and G. Arliguie. 2002. “Influence of
concrete relative humidity on the amplitude of ground-penetrating radar(GPR) signal.” Mater. Struct. 35 (4): 198–203. https://doi.org/10.1007/BF02533080.
Laurens, S., J. P. Balayssac, J. Rhazi, and G. Arliguie. 2005. “Non-destructive evaluation of concrete moisture by GPR experimental studyand direct modeling.”Mater. Struct. 38 (9): 827–832. https://doi.org/10.1617/14295.
Li, K., C. Li, and Z. Chen. 2009. “Influential depth of moisture transportin concrete subject to drying-wetting cycles.” Cem. Concr. Compos.31 (10): 693–698. https://doi.org/10.1016/j.cemconcomp.2009.08.006.
Multon, S., E. Merliot, M. Joly, and F. Toutlemonde. 2004. “Water distri-bution in beams damaged by alkali-silica reaction: Global weighing andlocal gammadensitometry.” Mater. Struct. 37 (5): 282–288. https://doi.org/10.1007/BF02481673.
Popovic, S. 2005. “Effects of uneven moisture distribution on the strengthof and wave velocity in concrete.” Ultrasonics 43 (6): 429–434. https://doi.org/10.1016/j.ultras.2004.09.007.
Quincot, G., M. Azenha, J. Barros, and R. Faria. 2011. State of theart–Methods to measure moisture in concrete. Portugal: Projetos DeInvestigação Científica E Desenvolvimento Tecnologico.
Sánchez, I., C. Anton, G. Vera, J. M. Ortega, and M. A. Climent. 2013.“Moisture distribution in partially saturated concrete studied by imped-ance spectroscopy.” J. Nondestr. Eval. 32 (4): 362–371. https://doi.org/10.1007/s10921-013-0190-z.
Sbartaï, Z. M., S. Laurens, J. P. Balayssac, G. Ballivy, and G. Arliguie.2006. “Effect of concrete moisture on radar signal amplitude.” ACIMater. J. 103 (6): 419–426.
Sbartaï, Z. M., S. Laurens, and D. Breysse. 2009. “Concrete moisture as-sessment using radar NDT technique–comparison between time andfrequency domain analysis.” In Proc., Non-Destructive Testing in CivilEngineering. Nantes, France.
Sbartaï, Z. M., S. Laurens, J. Rhazi, J. P. Balayssac, and G. Arliguie. 2007.“Using radar direct wave for concrete condition assessment: Correlationwith electrical resistivity.” J. Appl. Geophys. 62 (4): 361–374. https://doi.org/10.1016/j.jappgeo.2007.02.003.
Šelih, J., C. S. Antonio, and W. B. Theodore. 1996. “Moisture transport ininitially fully saturated concrete during drying.” Transp. Porous Media24 (1): 81–106. https://doi.org/10.1007/BF00175604.
© ASCE 04018112-7 J. Aerosp. Eng.
J. Aerosp. Eng., 2019, 32(1): 04018112
Dow
nloa
ded
from
asc
elib
rary
.org
by
Tzu
yang
Yu
on 0
9/11
/18.
Cop
yrig
ht A
SCE
. For
per
sona
l use
onl
y; a
ll ri
ghts
res
erve
d.
Senin, S. F., and R. Hamid. 2016. “Ground penetrating radar wave attenu-ation models for estimation of moisture and chloride content in concreteslab.” Constr. Build. Mater. 106 (1): 659–669. https://doi.org/10.1016/j.conbuildmat.2015.12.156.
Shoukry, S. N., G. W.William, B. Downie, andM. Y. Riad. 2011. “Effect ofmoisture and temperature on the mechanical properties of concrete.”Constr. Build. Mater. 25 (2): 688–696. https://doi.org/10.1016/j.conbuildmat.2010.07.020.
Stark, D. 1991. “The moisture condition of field concrete exhibiting Alkali-Silica reactivity.” In Vol. 126 of Proc., CANMET/ACI Second Int. Conf.on Durability of Concrete, 973–987. Farmington Hills, MI: AmericanConcrete Institute.
Tsang, L., J. A. Kong, and K.-H. Ding. 2000. Scattering of electromagneticwaves—Theories and applications. New York: Wiley.
Wang, Z., Q. Zeng, L. Wang, Y. Yao, and K. Li. 2014. “Effect of moisturecontent on freeze-thaw behavior of cement paste by electrical resistancemeasurements.” J. Mater. Sci. 49 (12): 4305–4314. https://doi.org/10.1007/s10853-014-8126-2.
Ye, T., J. Nanguo, and J. Xianyu. 2018. “Coupling effect of temperature andrelative humidity diffusion in concrete under ambient conditions.”
Constr. Build. Mater. 159 (20): 673–689. https://doi.org/10.1016/j.conbuildmat.2017.10.128.
Yu, T. Y. 2010. Damage detection of GFRP-concrete systems using electro-magnetic waves–Theory and experiment. Cologne, Germany: LAPLAMBERT.
Yu, T. Y. 2011. “Distant damage-assessment method for multilayercomposite systems using electromagnetic waves.” J. Eng. Mech.137 (8): 547–560. https://doi.org/10.1061/(ASCE)EM.1943-7889.0000257.
Yu, T. Y. 2017. “Quantitative assessment of CFRP-concrete cylinders usingsynthetic aperture radar images.” Res. Nondestr. Eval. 28 (3): 168–185.https://doi.org/10.1080/09349847.2016.1173266.
Zeng, Q., T. Fen-Chong, P. Dangla, and K. Li. 2011. “A study of freezingbehavior of cementitious materials by poromechanical approach.” Int.J. Solids Struct. 48 (22): 3267–3273. https://doi.org/10.1016/j.ijsolstr.2011.07.018.
Zhang, J., K. Qi, and Y. Huang. 2009. “Calculation of moisture distributionin early-age concrete.” J. Eng. Mech. 135 (8): 871–880. https://doi.org/10.1061/(ASCE)0733-9399(2009)135:8(871).
© ASCE 04018112-8 J. Aerosp. Eng.
J. Aerosp. Eng., 2019, 32(1): 04018112
Dow
nloa
ded
from
asc
elib
rary
.org
by
Tzu
yang
Yu
on 0
9/11
/18.
Cop
yrig
ht A
SCE
. For
per
sona
l use
onl
y; a
ll ri
ghts
res
erve
d.


![The Effect of Temperature on Moisture Transport in Concrete · deterioration of concrete [1–3]. The moisture curing condition strongly affects the hydration degree and strength](https://img.pdfslide.us/doc/110x75/5fb79836fa684745da401635/the-effect-of-temperature-on-moisture-transport-in-concrete-deterioration-of-concrete.jpg)