Embed Size (px)
Citation preview

67
Journal of Environmental Biology ����January 2012����
Characterization of light gaseous hydrocarbons of the
surface soils of Krishna-Godavari basin, India
Author Details
M. Lakshmi Microbiology Laboratory, National Geophysical Research Institute (CSIR), Uppal Road,(Corresponding author) Hyderabad - 500 007, India
e-mail: [email protected]
M.A. Rasheed Microbiology Laboratory, National Geophysical Research Institute (CSIR), Uppal Road,Hyderabad - 500 007, India
T. Madhavi Microbiology Laboratory, National Geophysical Research Institute (CSIR), Uppal Road,Hyderabad - 500 007, India
M. S. Kalpana Microbiology Laboratory, National Geophysical Research Institute (CSIR), Uppal Road,Hyderabad - 500 007, India
D.J. Patil Microbiology Laboratory, National Geophysical Research Institute (CSIR), Uppal Road,Hyderabad - 500 007, India
A.M. Dayal Microbiology Laboratory, National Geophysical Research Institute (CSIR), Uppal Road,Hyderabad - 500 007, India
© 2012 Triveni Enterprises
Vikas Nagar, Lucknow, [email protected] paper available on: www.jeb.co.in
J. Environ. Biol.
33, 67-79 (2012)ISSN: 0254-8704
CODEN: JEBIDP
Abstract
Several techniques are used for the exploration of hydrocarbons, of which; the geochemical techniquesinvolving the microbiological technique use the principle of detecting the light hydrocarbon seepage activitiesfor indication of sub-surface petroleum accumulations. A survey was carried out to characterize the lightgaseous hydrocarbons seeping in oil and gas fields of Krishna-Godavari basin of Andhra Pradesh. A set of 50sub-soil samples were collected at depths of about 3 m for geochemical analyses and 1m for microbiologicalanalysis. The microbial prospecting studies showed the presence of high bacterial population for methane 2.5 x 10²
to 6.0 x 10⁶ cfu g-1, propane 1x10² to 8.0 x 10⁶ cfu g-1 in soil samples. The adsorbed soil gas analysis showedthe presence of moderate to low concentrations of methane (26 to 139 ppb), ethane (0 to 17 ppb), propane (0to 8 ppb), butane (0 to 5 ppb) and pentane (0 to 2 ppb) in the soil samples of the study area. Carbon isotopeanalysis for methane (´13C
1) ranging from
-36.6 to -22.7‰ Pee Dee Belemnite (PDB) suggests these gases
are of thermogenic origin. Geo-microbial prospecting method coupled with adsorbed soil gas and carbonisotope ratio analysis have thus shown good correlation with existing oil/ gas fields of Krishna-Godavaribasin.
Key words
Light gaseous hydrocarbons, Adsorbed soil gas, Carbon isotope analysis, Hydrocarbon oxidizing bacteria,Thermogenic
Publication Data
Paper received:
25 September 2010
Revised received:
13 January 2011
Accepted:
05 February 2011
Introduction
Surface geochemical methods detect the minute quantitiesof migrating hydrocarbons at the sub-surface levels. The migratedhydrocarbons reside in the near surface as free and bound gases;however, only free gases migrate from depth. Free gases occur aseither vapor in pore spaces or as gas dissolved in aqueous solution.If the gas is attached to the sediment matrix or contained within theinterstices of rocks or certain minerals such as calcite or oxide
coatings, it is considered to be bound (Jones et al., 2000). Boundgases include adsorbed and chemi-adsorbed gases. Gases thathave reached the soil horizon may also contain biogenic,thermogenic, and/or abiogenic gases that migrated to the surfacefrom deep sources (Saunders et al., 1999). Near-surface freegases are dominated by gases from deep sources but may alsocontain gases formed during diagenesis, such as biogenic methane(Jenden et al., 1993). To minimize the influence of biogenic or

68
Journal of Environmental Biology ����January 2012����
Lakshmi et al.
another source of C1, some other hydrocarbon constituent (ethane,propane and butanes) should be measured (Jones et al., 2000).
Most of the studies on organic geochemical explorationconcern the analysis of light gaseous hydrocarbons in recentsediments because these compounds migrate easier than theheavier, liquid hydrocarbons. Hydrocarbons reaching to the surfacecan be measured directly - both in the sediment itself and in theoverlying air or water or through geochemical changes they induce.These hydrocarbons are extracted from adsorbed gas by processingof fine sediment fractions as hydrocarbons are sorbed within claylattices. Trace amounts of light hydrocarbons collected near theearth’s surface provide clues to present day subsurface fluidcomposition and migration (Gevirtz, 2002). Recent advances inanalytical technology as well as fundamental and applied researchhave contributed towards lowering detection limits. In particular, themeasurement of carbon isotopic ratios of gas quantities in the micro-liter range has increased the value of the analyses. In sediments,two gas fractions are generally distinguished: 1) interstitial gas whichis dissolved in the pore water and can be released by mechanicaldisintegration of the sediment (Kvenvolden et al., 1981) and 2)adsorbed gas which is bound on mineral surfaces and can bereleased by acid treatment (Horvitz, 1981).
Microbial prospecting method for hydrocarbon researchand exploration is based on the premise that the light gaseoushydrocarbons, namely methane (C1), ethane (C2), propane (C3)migrate upward from subsurface petroleum accumulations by diffusionand effusion, and are utilized by a variety of microorganisms presentin the sub-soil ecosystem. The methane, propane oxidizing bacteriaexclusively use these gases as carbon source for their metabolicactivities and growth. These bacteria are mostly found enriched inthe shallow soils /sediments above hydrocarbon bearing structuresand can differentiate between hydrocarbon prospective and nonprospective areas (Tucker and Hitzman, 1994). The methaneoxidizing bacteria are usually predominant over gas fields as thegas reservoirs are commonly dominated by methane (Jones et al.,2000). The isolation and enumeration of light gaseous oxidizingbacteria are used as indirect indicators in petroleum prospecting.Microbial Prospecting for Oil and Gas (MPOG) method success ratehas been reported to be 90% (Wagner et al., 2002). This methodcan be integrated with geological, geochemical, geophysical methodsto evaluate the hydrocarbon prospect of an area and to prioritizethe drilling locations thereby reducing drilling risks and achievinghigher success in petroleum exploration (Wagner et al., 2002).
This paper reports the amount and composition of adsorbedlight gaseous hydrocarbon, carbon isotopic analysis andmicrobiological analysis of samples collected in part of Krishna-Godavari basin in order to define the geochemical signature andcharacterization of light hydrocarbons over oil and gas provenareas. The originality is in terms of one of the first published worksin the area of microbiological prospecting over a known hydrocarbonoccurrence in Krishna-Godavari basin to establish feasibility of itsapplication in the basin.
Materials and Methods
Geology of the study area: The Krishna-Godavari basin is apericratonic rift margin system with an archean basement on theeast coast of the Indian peninsula. It covers an area of 28,000 km2
on land and 24,000 km2 off land up to 200 m bathymetry. The basinlies between 15o30' to 17oN latitudes and 80o to 82o 30' E longitudes.The basin is divided into Krishna, East Godavari and West Godavaridepressions separated by basement highs at Bapatla and Tanukuhorsts, respectively. The average temperature ranges between amaximum of 32o to 36oC and a minimum of 23o to 24oC; and theaverage rainfall is recorded between 800-1100 mm. The soil typesvary from deltaic alluvium, red soils with clay, red loams, coastalsands and saline soils. The crops grown are paddy, coconut,mango, flowers and sweet orange. Despite the severity of tropicalclimate and vagaries of soil breathing, geochemical techniques cancredibly identify the signatures of gaseous thermogenichydrocarbons emanating from a subsurface petroleum accumulationand the microbiological methods are still able to provide resultswhich are very much complimentary to the results obtained fromgeochemical methods. Thus microbiological methods can beemployed with confidence as cheaper and faster methods to carryout a rapid reconnaissance and semi-detailed surveys to providecredible focus for likely hydrocarbon occurrence demanding apriorityacquisition of costlier seismic surveys. The depositional environmentof the basin varies from continental to lagoonal, marine, littoral,infraneritic and deltaic conditions. The sediment yield rich faunalassemblages. Geological location map of Krishna-Godavari basinis shown in Fig.1.
Sampling: A total of 50 soil samples were collected from a depth of1 - 2.5 m using a hollow metal pipe by manual hammering to therequired depth. About 100 g soil samples were collected in pre-sterilized whirl-pack bags under aseptic conditions from a depth ofabout 1 m (Wagner et al., 2002) and stored at 2-4oC for microbialanalysis. For adsorbed soil gas analysis, the cores collected werewrapped in aluminum foil and sealed in poly-metal packs. Thesamples were collected along a reconnaissance pattern with aspacing of 3 km (Fig. 2).
Isolation of hydrocarbon oxidizing bacteria: Isolation andenumeration of methane and propane oxidizing bacteria for eachsample was carried out by standard plate count (SPC) method.One gram of soil sample was suspended in 9 ml of pre-sterilizedwater for the preparation of decimal dilutions (10-1 to 10-5). A 0.1 mlaliquot of each dilution was plated on to mineral salts medium (MSM)(Ronald and Lawrence, 1996). These plates were placed in aglass desiccator, filled with the desired hydrocarbon gas (methane/propane with 99.99% purity) and zero air (purified atmosphericgas devoid of hydrocarbons) in a ratio of 1:1. For isolation ofmethane oxidizing bacteria, the desiccator was filled with methanegas and zero air. Similarly, for isolation of propane oxidizing bacteria,the desiccators were filled with propane gas and zero air respectively.These desiccators were kept in bacteriological incubators at 35 ±2oC for 10 days. After incubation, the developed bacterial colonies

69
Journal of Environmental Biology ����January 2012����
Light gaseous hydrocarbon characterisation of surface soils
of methane and propane oxidizing bacteria were manually countedusing colony counter and reported in colony forming units (cfu g-1 ofsoil sample) (Sreenivas et al., 2005; Rasheed et al., 2008).
Analysis of hydrocarbons: The light gaseous hydrocarbonswere extracted from the soil samples using a gas extraction system( H o r v i t z , 1 9 8 1 ) . O n e g r a m o f 6 3 µ wet sieved soil sample was usedto extract light gaseous hydrocarbons after acid treatment in glassdegasification apparatus and its subsequent analyses on gaschromatograph (GC) for all samples and gas chromatograph-combustion-isotope ratio mass spectrometer (GC-C-IRMS) analysisfor samples that had higher concentrations of hydrocarbons. Duringacid treatment, the dominant gas released was CO
2 and was trapped
in KOH solution. The light gaseous hydrocarbons were collectedby water displacement in a graduated tube fitted with rubber septa(Kumar et al., 2002). The volume of desorbed gas was recordedand 500 µl of desorbed gas sample was injected into Varian CP3380 gas chromatograph fitted with Porapak Q column, equippedwith flame ionization detector. The gas chromatograph was calibratedusing external standards with known concentrations of methane,ethane, propane, n-butane and n-pentane. The quantitativeestimation of light gaseous hydrocarbon constituents in each samplewas made using peak area measurements and the correction formoisture content on wet basis was also applied. The hydrocarbonconcentration values of individual hydrocarbons from methanethrough pentane are expressed in parts per billion (ppb). The GCaccuracy of measurement of methane (C
1), ethane (C
2), propane
(C3), butane (C
4) and pentane (C
5) components is ~ 1ppb.
Results and Discussion
Microbiological study: The soil samples collected from Krishna-Godavari oil and gas fields were analyzed for the presence ofpropane oxidizing bacteria using standard plate count (SPC) method.The bacteria, which are able to utilize propane gas as a sole carbonsource, are merely developed as bacterial colonies on the MSMplates. Positive control of known hydrocarbon oxidizing bacterialstrain namely, Rhodococcus rhodochrous MTCC 291 wereobtained from the Microbial Type Culture Collection and Gene Bank(MTCC), IMTECH, Chandigarh, which were inoculated onto MSMplates and incubated along with the test soil samples. The growthwas observed in the positive control and in the test samples afterincubation. Results of methane and propane oxidizing bacteria ofKrishna-Godavari basin are given in Table 1.
The bacterial count of methane oxidizing bacteria rangedfrom 2.5 x 10² to 6.0 x 10⁶ cfu gm-1 of soil with a mean of 1.12x10⁶
cfu gm-1. The standard deviation value was 1.71 x 10⁶ cfu gm-1 ofsoil. The bacterial count of propane oxidizing bacteria ranged from1x102 to 8.0 x 10⁶ cfu gm-1 of soil with a mean of 1.1x10⁵ cfu gm-1.The standard deviation value was 1.74 x 10⁵ cfu gm-1 of soil (Table2). A statistical approach was followed and standard deviation valuewas taken as a background value for the demarcation of anomalouszones. The minimum, maximum, average and standard deviationvalues of methane (C
1), ethane (C
2), propane (C
3), butane (nC
4)
and pentane (nC5) are given in Table 2. The results of hydrocarbon
oxidizing bacterial population i.e., methane and propane oxidizingbacteria were plotted on the surveyed map. The samples showingbacterial population less than the background values indicatenegative prospects, while the value above the standard deviationvalue gives the anomalies concentration of these gaseoushydrocarbon oxidizers. In the present study, the anomalous zonesfor methane and propane oxidizing bacteria were observed in thestudy area (Fig. 3,4).
Integration with geochemical studies: To minimize the influenceof biogenic or other sources of C
1 methane, it is important to measure
C2+
hydrocarbons such as propane. The geo-chemical signatureof the near surface sediment, determined mostly by the molecularcomposition of light hydrocarbons and the carbon isotope ratio ofmethane, ethane, is indicative of its seepage/migration and geneticorigin (biogenic versus thermal). The magnitudes of each of thefive organic constituents of the alkane series methane (C
1), ethane
(C2), propane (C
3), butane (nC
4) and pentane (nC
5) were
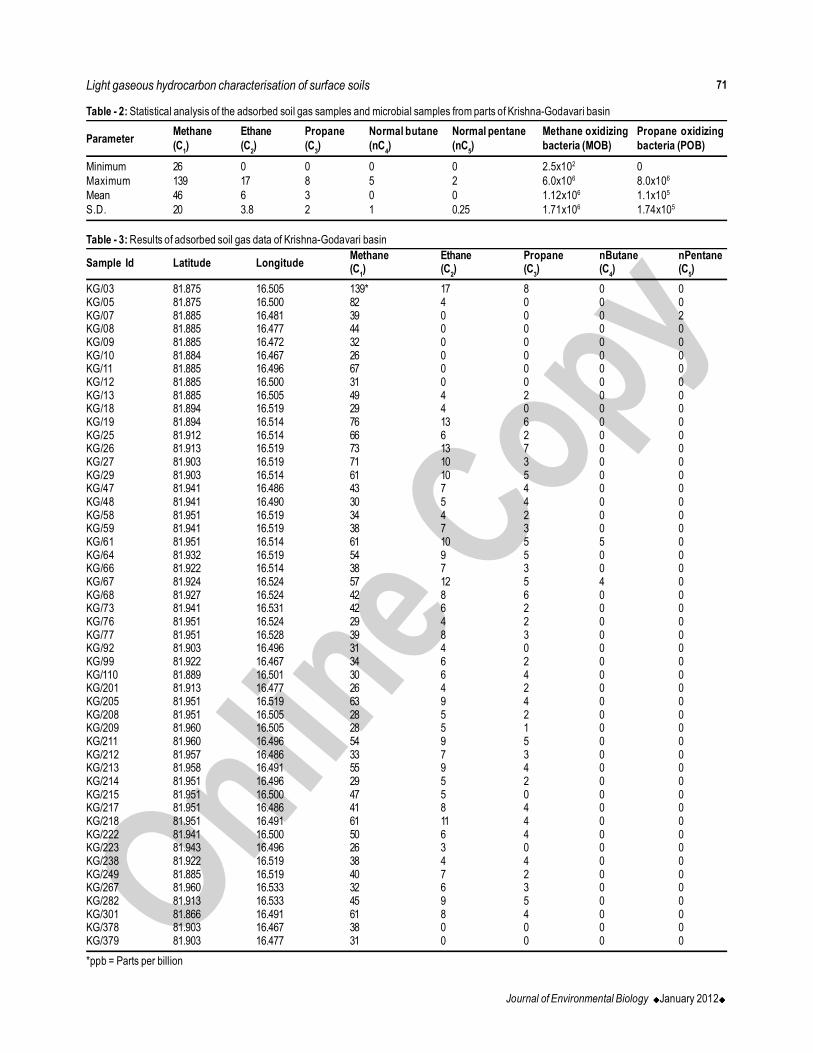
measured and expressed in ppb of gas per unit volume of the soilgas mixture. Results of adsorbed soil gas data of Krishna-Godavaribasin are given in Table 3.
The adsorbed soil gas analysis showed the presence ofmoderate concentrations of methane C
1 (26 to 139 ppb), ethane C
2
(0 to 17 ppb), propane C3 (0 to 8 ppb), butane nC
4 (0 to 5 ppb) and
pentane nC5 (0 to 2 ppb). Adsorbed methane, ethane, propane,
butane and pentane concentration in the soil samples are given inFig. 5, 6, 7, 8 and 9. Pixler’s plot shown in Fig. 10 (Madhavi et al.,2009) is indicative of the zone of occurrence of the accumulatedhydrocarbons; here, the samples fall in oil and oil-gas zone.
The higher hydrocarbon concentration in the samples isthe characteristic of the gases of petroliferous origin and follow thetrend C
1>C
2>C
3>iC
4>nC
4>iC
5>nC
5, which further confirms the
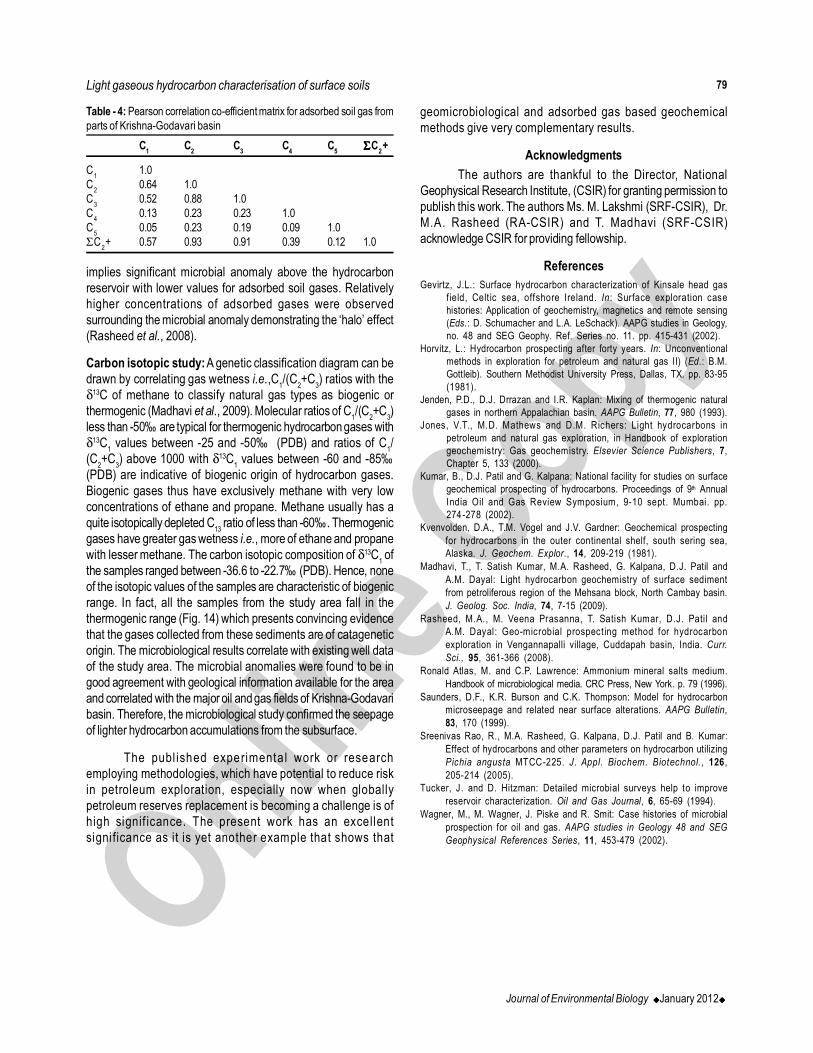
petroliferous nature of these hydrocarbon gases. The Pearsoncorrelation coefficient for adsorbed soil gas between C
1-C
2, C
1-
C3,C
1-C
4, C
1-C
5, C
2-C
3(r=0.88),C
2-C
4, C
2-C
5, C
3-C
4,C
3-C
5,C
4-C
5,
C2-ÓC
2+(r=0.93),C
3-ÓC
2+(r=0.91) (Table 4) show moderate
correlation respectively and indicate that these hydrocarbons aregenetically related and they are not affected by secondary alterationduring their migration form the sub-surface to subsequent adsorptiononto the surface soil and they might have been generated from athermogenic source (Madhavi et al., 2009). Adsorbed soil ΣC
2+
concentration map in the study area is shown in Fig. 11.
This suggests that all the hydrocarbon constituents in themicroseep are genetically related and not influenced by secondaryalterations during migration of microseeps from the sub surface tothe surface and were subsequently adsorbed on to the soil. Geo-microbial counts were integrated with light hydrocarbon (adsorbedsoil gas, C
1 – nC
5) concentrations. Composite maps for light
hydrocarbons and hydrocarbon oxidizing bacteria i.e. C1 vs MOB
and C3 vs POB shown in Fig. 12,13 indicate that anomalies are
adjacent and follow the natural model depicting ‘halo’ pattern. This

70
Journal of Environmental Biology ����January 2012����
Table - 1: Results of methane and propane oxidizing bacteria of Krishna-Godavari basin
Sample Id Latitude Longitude MOB (cfu gm-1)* POB (cfu gm-1)*
KG/03 81.875 16.505 4800000 2900KG/05 81.875 16.500 1100000 28400KG/07 81.885 16.481 2200000 70000KG/08 81.885 16.477 580000 57200KG/09 81.885 16.472 5000 612000KG/10 81.884 16.467 330000 280000KG/11 81.885 16.496 4700000 14000KG/12 81.885 16.500 7000 260000KG/13 81.885 16.505 6000000 2400KG/18 81.894 16.519 18100 1600KG/19 81.894 16.514 4800000 170000KG/25 81.912 16.514 2000000 459200KG/26 81.913 16.519 3500000 284800KG/27 81.903 16.519 3100000 10000KG/29 81.903 16.514 2800000 86400KG/47 81.941 16.486 10000 171000KG/48 81.941 16.490 600 700KG/58 81.951 16.519 22700 4000KG/59 81.941 16.519 3000 47200KG/61 81.951 16.514 2500000 45200KG/64 81.932 16.519 4800000 9000KG/66 81.922 16.514 4000000 11000KG/67 81.924 16.524 2800000 600KG/68 81.927 16.524 22000 800000KG/73 81.941 16.531 250 400KG/76 81.951 16.524 500000 236000KG/77 81.951 16.528 32000 0KG/92 81.903 16.496 2000 124000KG/99 81.922 16.467 2000 520000KG/110 81.889 16.501 10000 22000KG/201 81.913 16.477 20000 312000KG/205 81.951 16.519 2400000 100000KG/208 81.951 16.505 18500 50000KG/209 81.960 16.505 30000 260000KG/211 81.960 16.496 3000 11000KG/212 81.957 16.486 20000 4000KG/213 81.958 16.491 1200000 0KG/214 81.951 16.496 4000 29000KG/215 81.951 16.500 100000 32000KG/217 81.951 16.486 20000 41000KG/218 81.951 16.491 1200000 3900KG/222 81.941 16.500 26000 3000KG/223 81.943 16.496 11000 144000KG/238 81.922 16.519 44000 140000KG/249 81.885 16.519 9000 68000KG/267 81.960 16.533 7200 100KG/282 81.913 16.533 2200 2500KG/301 81.866 16.491 200000 7300KG/378 81.903 16.467 6300 0KG/379 81.903 16.477 189000 0
* cfu gm-1 = Colony forming units per gram, * MOB = Methane oxidizing bacteria, *POB = Propane oxidizing bacteria
Lakshmi et al.
71
Journal of Environmental Biology ����January 2012����
Table - 3: Results of adsorbed soil gas data of Krishna-Godavari basin
Sample Id Latitude LongitudeMethane Ethane Propane nButane nPentane(C
1) (C
2) (C
3) (C
4) (C
5)
KG/03 81.875 16.505 139* 17 8 0 0KG/05 81.875 16.500 82 4 0 0 0KG/07 81.885 16.481 39 0 0 0 2KG/08 81.885 16.477 44 0 0 0 0KG/09 81.885 16.472 32 0 0 0 0KG/10 81.884 16.467 26 0 0 0 0KG/11 81.885 16.496 67 0 0 0 0KG/12 81.885 16.500 31 0 0 0 0KG/13 81.885 16.505 49 4 2 0 0KG/18 81.894 16.519 29 4 0 0 0KG/19 81.894 16.514 76 13 6 0 0KG/25 81.912 16.514 66 6 2 0 0KG/26 81.913 16.519 73 13 7 0 0KG/27 81.903 16.519 71 10 3 0 0KG/29 81.903 16.514 61 10 5 0 0KG/47 81.941 16.486 43 7 4 0 0KG/48 81.941 16.490 30 5 4 0 0KG/58 81.951 16.519 34 4 2 0 0KG/59 81.941 16.519 38 7 3 0 0KG/61 81.951 16.514 61 10 5 5 0KG/64 81.932 16.519 54 9 5 0 0KG/66 81.922 16.514 38 7 3 0 0KG/67 81.924 16.524 57 12 5 4 0KG/68 81.927 16.524 42 8 6 0 0KG/73 81.941 16.531 42 6 2 0 0KG/76 81.951 16.524 29 4 2 0 0KG/77 81.951 16.528 39 8 3 0 0KG/92 81.903 16.496 31 4 0 0 0KG/99 81.922 16.467 34 6 2 0 0KG/110 81.889 16.501 30 6 4 0 0KG/201 81.913 16.477 26 4 2 0 0KG/205 81.951 16.519 63 9 4 0 0KG/208 81.951 16.505 28 5 2 0 0KG/209 81.960 16.505 28 5 1 0 0KG/211 81.960 16.496 54 9 5 0 0KG/212 81.957 16.486 33 7 3 0 0KG/213 81.958 16.491 55 9 4 0 0KG/214 81.951 16.496 29 5 2 0 0KG/215 81.951 16.500 47 5 0 0 0KG/217 81.951 16.486 41 8 4 0 0KG/218 81.951 16.491 61 11 4 0 0KG/222 81.941 16.500 50 6 4 0 0KG/223 81.943 16.496 26 3 0 0 0KG/238 81.922 16.519 38 4 4 0 0KG/249 81.885 16.519 40 7 2 0 0KG/267 81.960 16.533 32 6 3 0 0KG/282 81.913 16.533 45 9 5 0 0KG/301 81.866 16.491 61 8 4 0 0KG/378 81.903 16.467 38 0 0 0 0KG/379 81.903 16.477 31 0 0 0 0
*ppb = Parts per billion
Table - 2: Statistical analysis of the adsorbed soil gas samples and microbial samples from parts of Krishna-Godavari basin
ParameterMethane Ethane Propane Normal butane Normal pentane Methane oxidizing Propane oxidizing
(C1) (C
2) (C
3) (nC
4) (nC
5) bacteria (MOB) bacteria (POB)
Minimum 26 0 0 0 0 2.5x10² 0Maximum 139 17 8 5 2 6.0x10⁶ 8.0x10⁶
Mean 46 6 3 0 0 1.12x10⁶ 1.1x10⁵
S.D. 20 3.8 2 1 0.25 1.71x10⁶ 1.74x10⁵
Light gaseous hydrocarbon characterisation of surface soils

72
Journal of Environmental Biology ����January 2012����
Fig. 1: India map showing location of Krishna-Godavari basin
81.87 81.88 81.89 81.9 81.91 81.92 81.93 81.94 81.95 81.96
16.47
16.48
16.49
16.5
16.51
16.52
16.53
Sampling points
Longitude in degree decimal
Latit
ude
in d
egre
e de
cimal
Fig. 2: Sampling points (����) in the study area of Krishna-Godavari basin
Lakshmi et al.

73
Journal of Environmental Biology ����January 2012����
POB cfu/gm
50000
50000
50000
50000
50000
50000
50000
150000
15000
0
150000
150000
150000
250000
250000
350000
81.87 81.88 81.89 81.9 81.91 81.92 81.93 81.94 81.95 81.96
16.47
16.48
16.49
16.5
16.51
16.52
16.53
0
50000
100000
150000
200000
250000
300000
350000
400000
450000
500000
550000
600000
650000
700000
750000
Longitude in degree decimal
Latit
ude
in d
egre
e de
cimal
Fig. 4: Propane oxidizing bacterial concentration map in the study area
MOB cfu/gm
500000
500000
5000001500000
1500000
1500000
2500000
25000
00
4000000
81.87 81.88 81.89 81.9 81.91 81.92 81.93 81.94 81.95 81.96
16.47
16.48
16.49
16.5
16.51
16.52
16.53
0
500000
1000000
1500000
2000000
2500000
3000000
3500000
4000000
4500000
5000000
5500000
6000000
Longitude in degree decimal
Latit
ude
in d
egre
e de
cimal
Fig. 3: Methane oxidizing bacterial concentration map in the study area
Light gaseous hydrocarbon characterisation of surface soils
MOB cfu g-1
POB cfu g-1

74
Journal of Environmental Biology ����January 2012����
Longitude in degree decimal
Latit
ude
in d
egre
e de
cimal
Fig. 6: Adsorbed soil ethane concentration map in the study area
Longitude in degree decimal
Latit
ude
in d
egre
e de
cimal
Fig. 5: Adsorbed soil methane concentration map in the study area
C1 ppb
81.87 81.88 81.89 81.9 81.91 81.92 81.93 81.94 81.95 81.96
16.47
16.48
16.49
16.5
16.51
16.52
16.53
30
30
40
40
40
4040
40
40
40
404
5
45
4545
45
4545
50
50
50
50
75
95100
0
10
20
30
40
50
60
70
80
90
100
110
120
130
140
C2 ppb
2
2
3
3
4
4
5
5
5
5
5 5
6
666
6
6
7
7
7
7
7
7
9
9
9
10
10
1011
11
12
13
14
81.87 81.88 81.89 81.9 81.91 81.92 81.93 81.94 81.95 81.96
16.47
16.48
16.49
16.5
16.51
16.52
16.53
0
1
2
3
4
5
6
7
8
9
10
11
12
13
14
15
16
17
Lakshmi et al.
C1 ppb
C2 ppb

75
Journal of Environmental Biology ����January 2012����
Longitude in degree decimal
Latit
ude
in d
egre
e de
cimal
Fig. 8: Adsorbed soil butane concentration map in the study area
Longitude in degree decimal
Latit
ude
in d
egre
e de
cimal
Fig. 7: Adsorbed soil propane concentration map in the study area
nC4 ppb
0.2
0.2
0.20.6
0.6
1
1
2
3
81.87 81.88 81.89 81.9 81.91 81.92 81.93 81.94 81.95 81.96
16.47
16.48
16.49
16.5
16.51
16.52
16.53
00.20.40.60.811.21.41.61.822.22.42.62.833.23.43.63.844.24.44.64.855.2
Latitu
de in
Deg
ree d
ecim
al
C3 ppb
81.87 81.88 81.89 81.9 81.91 81.92 81.93 81.94 81.95 81.96
16.47
16.48
16.49
16.5
16.51
16.52
16.53
0.5
0.5
0.5
1
1
1
1
1
1.5
1.5
1.5
1.5
2
2
22
2
2.5
2.5
2. 5
2.5
2.5
2.53 3
3
3
3
33
3.5
3.5
3.5
3.5
3.5
3.5
3.5
3.5
5
5
5
0
0.5
1
1.5
2
2.5
3
3.5
4
4.5
5
5.5
6
6.5
7
7.5
8
Light gaseous hydrocarbon characterisation of surface soils
C3 ppb
nC4 ppb

76
Journal of Environmental Biology ����January 2012����
1
10
100
C1/C2 C1/C3
sample 3
sample 13
sample 19
sample 25
sample 27
sample 29
sample 47
sample 48
sample 58
sample 59
sample 61
sample 64
sample 66
sample 67
sample 68
sample 73
sample 76
sample 77
sample 99
sample 110
sample 201
sample 205
sample 208
sample 209
sample 211
sample 212
sample 213
sample 214
sample 217
sample 218
sample 222
sample 238
sample 239
sample 267
sample 282
sample 301
Oil & Gas window
Non-Productive zone
Oil window
Fig. 10: Pixler’s plot for discriminating oil, oil and gas and gas windows using C1/C
2 and C
1/C
3 ratios
Longitude in degree decimal
Latit
ude
in d
egre
e de
cimal
Fig. 9: Adsorbed soil pentane concentration map in the study area
nC5 ppb
0.1
0. 1
0.2
0.2
0.3
0.3
0.4
0.5
1
81.87 81.88 81.89 81.9 81.91 81.92 81.93 81.94 81.95 81.96
16.47
16.48
16.49
16.5
16.51
16.52
16.53
0
0.1
0 .2
0 .3
0 .4
0 .5
0 .6
0 .7
0 .8
0 .9
1
1 .1
1 .2
1 .3
1 .4
1 .5
1 .6
1 .7
1 .8
Latit
ude
in D
egre
e d
ecim
al
Lakshmi et al.
nC5 ppb

77
Journal of Environmental Biology ����January 2012����
Longitude in degree decimal
Latit
ude
in d
egre
e de
cimal
Fig. 11: Adsorbed soil ΣC2+ concentration map in the study area
EC2+ ppb
22
2
4
4
4
6
6 6
8
8
88
8
8
10
10
10
10
1010
10
12
12
12
12
12
12
14
14
14 14
20
20
81.87 81.88 81.89 81.9 81.91 81.92 81.93 81.94 81.95 81.96
16.47
16.48
16.49
16.5
16.51
16.52
16.53
0
2
4
6
8
10
12
14
16
18
20
22
24
Longitude in degree decimal
Latit
ude
in d
egre
e de
cimal
Fig. 12: Composite anomaly map of adsorbed soil gas methane and methane oxidizing bacteria in the study area
Latitu
de in
Deg
ree d
ecim
al
C1 ppb
500000
500000
5000001500000
1500000
1500000
2500000
25000
00
4000000
81.87 81.88 81.89 81.9 81.91 81.92 81.93 81.94 81.95 81.96
16.47
16.48
16.49
16.5
16.51
16.52
16.53
81.87 81.88 81.89 81.9 81.91 81.92 81.93 81.94 81.95 81.96
16.47
16.48
16.49
16.5
16.51
16.52
16.53
30
30
40
40
40
4040
40
40
40
404
5
45
45
45 45
45
45
50
50
50
50
75
95100
0
5 0 0 0 0
1 0 0 0 0 0
1 5 0 0 0 0
2 0 0 0 0 0
2 5 0 0 0 0
3 0 0 0 0 0
3 5 0 0 0 0
4 0 0 0 0 0
4 5 0 0 0 0
5 0 0 0 0 0
5 5 0 0 0 0
6 0 0 0 0 0
6 5 0 0 0 0
7 0 0 0 0 0
7 5 0 0 0 0
MOB cfu/gm
MOB vs C1
Light gaseous hydrocarbon characterisation of surface soils
MOB cfu g-1
C1 ppb
EC2+ ppb
C1

78
Journal of Environmental Biology ����January 2012����
C3 ppb
50000
5000
0
50000
50000
50000
50000
50000
150000
1500
00
150000
150000
150000
250000
250000
350000
81.87 81.88 81.89 81.9 81.91 81.92 81.93 81.94 81.95 81.96
16.47
16.48
16.49
16.5
16.51
16.52
16.53
0
5 0 0 0 0
1 0 0 0 0 0
1 5 0 0 0 0
2 0 0 0 0 0
2 5 0 0 0 0
3 0 0 0 0 0
3 5 0 0 0 0
4 0 0 0 0 0
4 5 0 0 0 0
5 0 0 0 0 0
5 5 0 0 0 0
6 0 0 0 0 0
6 5 0 0 0 0
7 0 0 0 0 0
7 5 0 0 0 0
81.87 81.88 81.89 81.9 81.91 81.92 81.93 81.94 81.95 81.96
16.47
16.48
16.49
16.5
16.51
16.52
16.53
0.5
0.5
0.5
1
11
1
1.5
1.5
1.5
1.5
2
2
22
2
2.5
2.5
2.5
2.5
2.5
2.53 3
3
3
3
33
3.5
3.5
3.5
3.5
3.5
3.5
3.5
5
5
5 POB cfu/gm
POB vs C3
Longitude in degree decimal
Latit
ude
in d
egre
e de
cimal
Fig. 13: Composite anomaly map of adsorbed soil gas propane and propane oxidizing bacteria in the study area
1
10
100
1000
10000
-90 -80 -70 -60 -50 -40 -30 -20
C1
/C2
+C
3
Zone of Thermogenic origin
Zone of Biogenic origin
Fig. 14: Bernard plot indicating the possible source for the light gaseous hydrocarbons in the study area
POB cfu g-1
C1/
C2+
C3
dC13/dC12
Lakshmi et al.
C3
C3 ppb
79
Journal of Environmental Biology ����January 2012����
Table - 4: Pearson correlation co-efficient matrix for adsorbed soil gas fromparts of Krishna-Godavari basin
C1
C2
C3
C4
C5
ΣΣΣΣC2+
C1
1.0C
20.64 1.0
C3
0.52 0.88 1.0C
40.13 0.23 0.23 1.0
C5
0.05 0.23 0.19 0.09 1.0ΣC
2+ 0.57 0.93 0.91 0.39 0.12 1.0
implies significant microbial anomaly above the hydrocarbonreservoir with lower values for adsorbed soil gases. Relativelyhigher concentrations of adsorbed gases were observedsurrounding the microbial anomaly demonstrating the ‘halo’ effect(Rasheed et al., 2008).
Carbon isotopic study: A genetic classification diagram can bedrawn by correlating gas wetness i.e.,C
1/(C
2+C
3) ratios with the
δ13C of methane to classify natural gas types as biogenic orthermogenic (Madhavi et al., 2009). Molecular ratios of C
1/(C
2+C
3)
less than -50‰ are typical for thermogenic hydrocarbon gases withδ13C
1 values between -25 and -50‰ (PDB) and ratios of C
1/
(C2+C
3) above 1000 with δ13C
1 values between -60 and -85‰
(PDB) are indicative of biogenic origin of hydrocarbon gases.Biogenic gases thus have exclusively methane with very lowconcentrations of ethane and propane. Methane usually has aquite isotopically depleted C
13 ratio of less than -60‰. Thermogenic
gases have greater gas wetness i.e., more of ethane and propanewith lesser methane. The carbon isotopic composition of δ13C
1 of
the samples ranged between -36.6 to -22.7‰ (PDB). Hence, noneof the isotopic values of the samples are characteristic of biogenicrange. In fact, all the samples from the study area fall in thethermogenic range (Fig. 14) which presents convincing evidencethat the gases collected from these sediments are of catageneticorigin. The microbiological results correlate with existing well dataof the study area. The microbial anomalies were found to be ingood agreement with geological information available for the areaand correlated with the major oil and gas fields of Krishna-Godavaribasin. Therefore, the microbiological study confirmed the seepageof lighter hydrocarbon accumulations from the subsurface.
The publ ished experimenta l work or researchemploying methodologies, which have potential to reduce riskin petroleum exploration, especially now when globallypetroleum reserves replacement is becoming a challenge is ofhigh signif icance. The present work has an excellentsigni ficance as it is yet another example that shows that
geomicrobiological and adsorbed gas based geochemicalmethods give very complementary results.
Acknowledgments
The authors are thankful to the Director, NationalGeophysical Research Institute, (CSIR) for granting permission topublish this work. The authors Ms. M. Lakshmi (SRF-CSIR), Dr.M.A. Rasheed (RA-CSIR) and T. Madhavi (SRF-CSIR)acknowledge CSIR for providing fellowship.
References
Gevirtz, J.L.: Surface hydrocarbon characterization of Kinsale head gasfield, Celt ic sea, offshore Ireland. In: Surface exploration casehistories: Application of geochemistry, magnetics and remote sensing(Eds.: D. Schumacher and L.A. LeSchack). AAPG studies in Geology,no. 48 and SEG Geophy. Ref. Series no. 11. pp. 415-431 (2002).
Horvitz, L.: Hydrocarbon prospecting after forty years. In: Unconventionalmethods in exploration for petroleum and natural gas II) (Ed.: B.M.Gottleib). Southern Methodist University Press, Dallas, TX. pp. 83-95(1981).
Jenden, P.D., D.J. Drrazan and I.R. Kaplan: Mixing of thermogenic naturalgases in northern Appalachian basin. AAPG Bulletin, 77, 980 (1993).
Jones, V.T., M.D. Mathews and D.M. Richers: Light hydrocarbons inpetroleum and natural gas exploration, in Handbook of explorationgeochemistry: Gas geochemistry. Elsevier Science Publishers, 7,Chapter 5, 133 (2000).
Kumar, B., D.J. Patil and G. Kalpana: National facility for studies on surfacegeochemical prospecting of hydrocarbons. Proceedings of 9th AnnualIndia Oil and Gas Review Symposium, 9-10 sept. Mumbai. pp.274-278 (2002).
Kvenvolden, D.A., T.M. Vogel and J.V. Gardner: Geochemical prospectingfor hydrocarbons in the outer continental shelf, south sering sea,Alaska. J. Geochem. Explor., 14, 209-219 (1981).
Madhavi, T., T. Satish Kumar, M.A. Rasheed, G. Kalpana, D.J. Patil andA.M. Dayal: Light hydrocarbon geochemistry of surface sedimentfrom petroliferous region of the Mehsana block, North Cambay basin.J. Geolog. Soc. India, 74, 7-15 (2009).
Rasheed, M.A., M. Veena Prasanna, T. Satish Kumar, D.J. Patil andA.M. Dayal: Geo-microbial prospecting method for hydrocarbonexploration in Vengannapalli village, Cuddapah basin, India. Curr.
Sci., 95, 361-366 (2008).Ronald Atlas, M. and C.P. Lawrence: Ammonium mineral salts medium.
Handbook of microbiological media. CRC Press, New York. p. 79 (1996).Saunders, D.F., K.R. Burson and C.K. Thompson: Model for hydrocarbon
microseepage and related near surface alterations. AAPG Bulletin,83, 170 (1999).
Sreenivas Rao, R., M.A. Rasheed, G. Kalpana, D.J. Patil and B. Kumar:Effect of hydrocarbons and other parameters on hydrocarbon utilizingPichia angusta MTCC-225. J. Appl. Biochem. Biotechnol. , 126,205-214 (2005).
Tucker, J. and D. Hitzman: Detailed microbial surveys help to improvereservoir characterization. Oil and Gas Journal, 6, 65-69 (1994).
Wagner, M., M. Wagner, J. Piske and R. Smit: Case histories of microbialprospection for oil and gas. AAPG studies in Geology 48 and SEG
Geophysical References Series, 11, 453-479 (2002).
Light gaseous hydrocarbon characterisation of surface soils