Embed Size (px)
Citation preview

Characterization of Karst Terrain and Regional Tectonics Using Remotely Sensed Data in Jo Daviess County, Illinois
Samuel V. Panno, Donald E. Luman, and Dennis R. Kolata
Circular 589 2015
ILLINOIS STATE GEOLOGICAL SURVEY
Prairie Research Institute
University of Illinois at Urbana-Champaign

© 2015 University of Illinois Board of Trustees. All rights reserved.
For permissions information, contact the Illinois State Geological Survey.
Front Cover: Low-altitude oblique photograph of an alfalfa field exhibiting complex networks of vegetated crop lines taken on July 19, 2012, in eastern Jo Daviess County (photograph by S. Panno).
Circular 589 2015
ILLINOIS STATE GEOLOGICAL SURVEY
Prairie Research Institute
University of Illinois at Urbana-Champaign
615 E. Peabody Drive
Champaign, Illinois 61820-6918
http://www.isgs.illinois.edu
Characterization of Karst Terrain and Regional Tectonics Using Remotely Sensed Data in Jo Daviess County, Illinois
Samuel V. Panno, Donald E. Luman, and Dennis R. Kolata

Suggested citation:Panno, S.V., D.E. Luman, and D.R. Kolata, 2015, Characterization of karst terrain and regional tectonics
using remotely sensed data in Jo Daviess County, Illinois: Illinois State Geological Survey, Circular 589, 29 p., 1 map, 1:62,500, digital appendix at http://isgs.illinois.edu/publications/c589/appendix.
Note: Google¶, ArcGIS¶, Google Earth¶, and Shape2Earth¶ are registered trademarks.
Contents
Introduction 1
Regional Geologic Setting of Jo Daviess County 2
Remote Sensing Data and Methods: Aerial Photography of Vegetated Crop Lines 5
Results and Discussion 6 Vegetated Crop Line Fractures and Crevices 6 Alignments of Silurian Sinkholes 12 Alignments from Lead-Zinc Mining Operations 12 Tectonic Implications of Bedrock Fractures 14
Conclusions 18
Acknowledgments 20
References 20
Appendix: Remote Sensing Data Resources 23 Crop Line Aerial Photographs—August 2012 23 Crop Line Aerial Photographs—September 2012 23 Sinkholes 23 Mine Diggings 23
List of Tables A1 Listing of August 2012 crop line aerial photographs by township–range location 28 A2 Listing of September 2012 crop line aerial photographs by township–range location 28 A3 Listing of sinkholes by township–range location 29 A4 Listing of mine diggings by township–range location 29
List of Figures 1 Karst regions of Illinois 1 2 Ground photograph of a complex network of vegetated crop lines within an alfalfa field taken on July 19, 2012, in eastern Jo Daviess County 2 3 Low-altitude oblique photograph of an alfalfa field exhibiting complex networks of vegetated crop lines taken on July 19, 2012, in eastern Jo Daviess County 3 4 Major structural features in northern Illinois, southern Wisconsin, and eastern Iowa 4 5 Prevailing land cover for Jo Daviess County in 2012 as interpreted from satellite imagery and ancillary data sources 5 6 Example of multitemporal remote sensing data sources used to detect and delineate vegetated crop line areas 7 7 Example of the reconnaissance vertical aerial photography of two alfalfa fields exhibiting pronounced vegetated crop lines acquired on August 28, 2012 8 8 Example of the Google aerial photography of two alfalfa fields exhibiting prominent vegetated crop lines acquired on September 27, 2012 9 9 Example of the Google aerial photography of an alfalfa field exhibiting pronounced vegetated crop lines acquired on September 27, 2012 10 10 Rose diagram showing the azimuth orientations calculated for 17,855 vegetated crop line fractures digitized from the georeferenced aerial photography locations shown on Map 1 and in Figure A2 and Table A2 11 11 Example of the Google vertical aerial photography acquired on September 27, 2012 11 12 Shaded relief model produced from 2008 LiDAR bare-earth elevation data showing aligned sinkholes in highly fractured and creviced Silurian-age dolomite 13 13 Road cut exposure of Silurian-age dolomite near Elizabeth, Illinois, in Jo Daviess County 14 14 Millbrig sheet geologic map showing the distribution of lead and zinc diggings in 1908 for an area north of Galena, Illinois, in northwestern Jo Daviess County 15 15 Vertical aerial photograph acquired in April 2011 showing the original Vinegar Hill Mine site in northwestern Jo Daviess County 16 16 Engineering drawing of the Vinegar Hill Mine diggings as they appeared in 1914, superimposed on 2008 LiDAR bare-earth elevation data 17

17 Shaded relief model produced from 2008 LiDAR bare-earth elevation data 18 18 Rose diagrams showing azimuth orientations for fractures measured at four locations (A, B, C, and D) in Jo Daviess County, Illinois 19 19 Rose diagrams showing dominant and subdominant fracture trends from (A) this study, (B) Heyl et al. (1959), (C) McGarry (2000), and (D, E) Foote (1982) 19 A1 Locations of August 2012 crop line aerial photographs 24 A2 Locations of September 2012 crop line aerial photographs 25 A3 Areas of sinkholes 26 A4 Areas of mine diggings 27

Illinois State Geological Survey Circular 589 1
INTRODUCTIONAn estimated 25% of the bedrock surface
area of Illinois is carbonate rock, 35% of
which is concentrated within the state’s
five known karst regions (Weibel and
Panno 1997; Figure 1). Karst is defined as
“terrain with distinctive hydrology and
landforms arising from a combination
of high rock solubility and well devel-
oped secondary fracture porosity” (Ford
and Williams 1992, p. 1). Characteristic
features of karst terrain include sink-
holes, caves, large springs, fluted rock
outcrops, blind valleys, swallow holes,
solution-enlarged crevices, and a well-
defined epikarst soil–bedrock interface
(White 1988). Epikarst is defined by Wil-
liams (2008) as the
highly weathered carbonate bedrock
immediately beneath the surface or
beneath the soil (when present) or
exposed at the surface. Porosity and
permeability are higher near the
surface than at depth; consequently
after recharge, percolating rainwater
is detained near the base of the epi-
karst, the detention ponding produc-
ing an epikarstic aquifer. (p. 1)
Carbonate rock at or near the ground
surface is typically fractured on a
regional basis because of ancient or
modern tectonic stress (Nelson 1995).
Movement of surface water and shallow
groundwater is initially a diffuse flow
through the rock matrix and fractures.
Recharge into and through these frac-
tures can enlarge them by dissolution of
the calcite and dolomite that constitute
the carbonate rock. Eventually, the frac-
tures, including bedding planes, become
crevices that result in a greater storage
capacity, more rapid recharge, and more
rapid movement of groundwater. When
the crevices become wide enough (>1 cm
or ~0.4 in.; W.B. White, personal com-
munication, 2005), the rock body can
possess matrix, fracture, and conduit
flow regimes and be classified as a karst
aquifer (Quinlan et al. 1991; Ford and
Williams 1992).
The study area for this investigation is Jo
Daviess County, Illinois, which is situ-
ated within the Driftless Area encom-
passing southwestern Wisconsin, north-
eastern Iowa, and parts of northwestern
Jo DaviessCounty
DriftlessArea
LincolnHills
Salem Plateau(Illinois Sinkhole Plain)
ShawneeHills
NorthCentralNorth
Central
Figure 1 Karst regions of Illinois (Weibel and Panno 1997).
Illinois (Figure 1). The bedrock surface
consists of Upper Ordovician [443–460
million years ago (Ma)] carbonate rocks
of the Galena and Platteville Groups,
shale of the Maquoketa Shale, and
Silurian-age (412–443 Ma) dolomite that
makes up much of the upland areas (see
Map 1). Because carbonate bedrock
within the Driftless Area karst region in
northwestern Illinois is typically over-
lain by unconsolidated deposits that
include loess and residuum (Panno et
al. 1997), direct observation of fractures
and crevices is limited to the sparse
occurrences of road cuts, quarries, and
outcrops where bedrock is exposed at
the ground surface.
The fractures and crevices of the car-
bonate bedrock make up the connected
secondary porosity of the primary karst
aquifer within the study area, which is
composed of dolomites of the Galena
and Platteville Groups. Most of the rural
area, as well as some urbanized areas
within the county, depend on this aqui-
fer as an important freshwater resource.
Understanding the character of this
aquifer and its susceptibility to surface-
borne contaminants is necessary to pro-
tect and maintain the integrity of this
water resource. The lack of sufficient and
well-distributed bedrock exposures has
made it difficult to develop a compre-
hensive understanding of the character
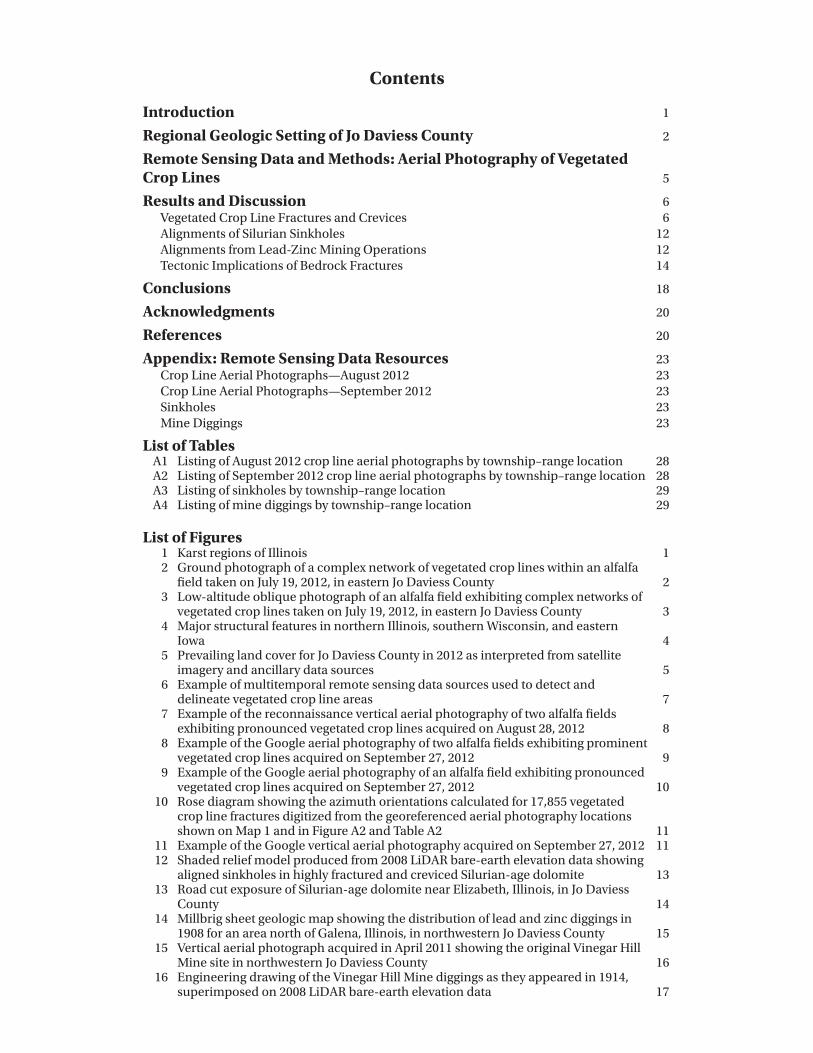
Figure 2 Ground photograph of a complex network of vegetated crop lines within an alfalfa field taken
on July 19, 2012, in eastern Jo Daviess County (areas ST 4 and CL 9, Map 1 T29N, R5E; see Figures
A1–A2 and Tables A1–A2). Normally at this time of year, the alfalfa field would have been cut and har-
vested for hay. Instead, much of the field exhibits stunted and sparse plant growth (photograph by S.
Panno).
2 Circular 589 Illinois State Geological Survey
and geometry of the fractures and crev-
ices of the karst aquifer within the study
area. However, an unforeseen outcome
of the severe 2012 summer drought in
the Midwest was that it provided a rare
opportunity for indirect examination
of the fractured and creviced buried
bedrock surface of the Driftless Area.
Complex vegetated networks, herein
referred to as vegetated crop lines,
began to appear across the dry summer
landscape of Jo Daviess County (Figures
2 and 3), adjacent Stephenson and Car-
roll Counties in Illinois, and a portion
of southwestern Wisconsin. Primarily
confined to alfalfa hayfields, the veg-
etated crop lines resulted from a com-
bination of three factors: (1) persistent,
extremely dry conditions; (2) a relatively
thin soil zone and associated unconsoli-
dated deposits approximately 1.5 to 6.5
ft (0.5 to 2 m) in thickness overlying (3)
highly fractured and creviced bedrock
composed of Ordovician-age Galena
Dolomite (see Map 1). Corroborating
evidence of additional fractures and
crevices came from interpretation of
enhanced elevation data acquired for Jo
Daviess County in 2008 with light detec-
tion and ranging (LiDAR) technology.
The primary objectives of this investiga-
tion were (1) to analyze remote sensing
data resources, including multidate
aerial photography collected during
the 2012 summer drought depicting
vegetated crop lines, and recent LiDAR
elevation data to provide new insights
regarding the karst aquifer of the Galena
Dolomite and karst features within the
Silurian dolomite; and (2) to relate the
findings to previous research on frac-
tures and crevices to better understand
the geology and hydrogeology within
the study area. This information will
provide a focus for future investigations
on the geology as well as on the quality
and quantity of groundwater resources
in the study area.
REGIONAL GEOLOGIC SETTING OF JO DAVIESS COUNTYBedrock within Jo Daviess County is
dominated by Ordovician Galena Dolo-
mite, Maquoketa Shale, and Silurian
dolomite. The Galena Dolomite and
Maquoketa Shale make up the bedrock
of the picturesque hills and valleys
of the county, whereas the Silurian
dolomite is the cap rock responsible
for the distinctive bedrock knobs and
highlands. Additionally, the Galena
Group and underlying Platteville Group
constitute an important and reliable
groundwater resource, collectively

Figure 3 Low-altitude oblique photograph of an alfalfa field exhibiting complex networks of vegetated crop lines taken on
July 19, 2012, in eastern Jo Daviess County. North is to the left. Scale 1 in. = 115 ft (approximate). Areas ST 4 and CL 7,
Map 1 T28N, R5E; see Figures A1–A2 and Tables A1–A2 (photograph by S. Panno).
Illinois State Geological Survey Circular 589 3

4 Circular 589 Illinois State Geological Survey
Figure 4 Major structural features in northern Illinois, southern Wisconsin, and eastern Iowa. Scale 1 in. = 35 mi (approxi-
mate).
referred to as the Galena-Platteville
dolomite (Hackett and Bergestrom 1956;
Csallany and Walton 1963). Csallany and
Walton (1963) found that the most water-
yielding openings occur in the upper
one-third of the shallow dolomite aqui-
fer. They stated that some shallow dolomite
wells have yields in excess of 1,000 gal/
min (3,785 L/min). They also deter-
mined that where the Galena-Platteville
dolomite is overlain by unconsolidated
deposits in northern Illinois, solution
activity has enlarged openings, and
the Galena-Platteville dolomite yields
moderate quantities of water to wells.
However, where it is overlain by the
Maquoketa Shale, the Galena-Platteville
dolomite is a less favorable source of
groundwater and yields little water from
joints, fissures, and solution cavities.
Weibel and Panno (1997) and McGarry
(2000) have mapped much of the county
area as karst.
Jo Daviess County is situated on the
southwest flank of the Wisconsin Arch,
a broad north–south-trending crustal
uplift that extends through central
Wisconsin into north-central Illinois
(Figure 4). The regional dip of bedrock
within the study area is about 17 ft/mi
(3.2 m/km) to the south-southwest (Heyl
et al. 1959). Immediately south is the
Plum River Fault Zone, a major struc-
tural feature that extends from near
Cedar Rapids, Iowa, east-northeast for
approximately 118 mi (190 km) to near
Byron in north-central Illinois (Kolata
and Buschbach 1976; Bunker et al. 1985;
Figure 4). The zone is up to 1 mi (1.6 km)
wide and is composed of largely verti-
cal faults with a cumulative displace-
ment of as much as 400 ft (120 m) to the
north near Savanah, Illinois. A syncline
flanks the north side, whereas domes
and anticlines flank the south side of the
fault zone. The Meekers Grove Anticline
is situated just north of the study area
in southwestern Wisconsin (Figure 4).
Away from the Plum River Fault Zone,
most faults in the region are small,
reverse-bedding-plane normal shear
faults with less than 10 ft (<3 m) of dis-
placement (Kolata and Buschbach 1976;
Bunker et al. 1985).
The regional southward dip of bed-
rock within the county is interrupted
by complex but very gentle anticlines
and synclines in an array that trends
northeastward, eastward, or northwest-
ward (Bradbury et al. 1956). These folds
consist of linear uplifts and depres-
sions that range from 1 mi (1.6 km) to
approximately 30 mi (50 km) in length
and have limbs that dip less than 15
degrees. Thrust faults with as much as
50 ft (15 m) of displacement are locally
present on the northern flanks of the
WISCONSIN
ILLINOIS
IOWA
LakeMichigan
Jo Daviess
CedarRapids
Byron
MilwaukeeMadison
Rockford
Chicago
Davenport
Savannah
Upton CaveSyncline
WIS
CO
NS
I N A
RC
H
Meekers Grove Anticline
Plum River Fault ZoneSandwich Fault Zone
Ashton Anticline

Illinois State Geological Survey Circular 589 5
!(
!(
!(!(
!(!(
!(
!(
!(!(
!(
!(
!(
!( !(
!(
!(!(!(
!(!(
!(!(
!(
!( !(
!(
!(!(!(
!(
!( !(
!(
!(!(
!(
!(
!(!(
!(!(
!( !( !(
!(!(
!(
!(
!(
!(
!(
!(
!(
!(!(
!(
!(
!(!(!(
!(
!(!(!(!(
!(
!(
!( !(!( !(
!(!(
!(!(!(
!(
!( !(!(!(
!(
!(
!(
!(!(!(
!(
!(!(!(
!(
!(
!(
!(
!(
!(
!(
!(
!(
!(
!(
!(!(
!(
!(!(
2012 Land Cover
Pasture/Hay/Alfalfa
Corn and soybeans
Developed/Open space
Herbaceous grassland
Open water
Woody wetlands
Forest and woodland
Developed
Crop line field locations!(
Figure 5 Prevailing land cover for Jo Daviess County in 2012 as interpreted from satellite imagery and ancillary data sources
(USDA 2012). Forty percent of the county surface area is devoted to pasture, hay, or alfalfa. Note the correspondence between
this land cover type and the occurrence of crop line field locations used for this study. Scale 1 in. = 5.5 mi (approximate).
anticlines (Heyl et al. 1959). Most of the
lead and zinc deposits formerly mined in
Jo Daviess County were recovered from
the solution-enlarged fractures, folds,
and faults in the dolomite and limestone
of the Platteville Group, the Decorah
Subgroup, and the Galena Group (Will-
man et al. 1946; Willman and Reynolds
1947; Bradbury et al. 1956). Thus, the
patterns of surface and underground
mine workings reveal fracture patterns
in the underlying bedrock.
REMOTE SENSING DATA AND METHODS: AERIAL PHOTOGRAPHY OF VEGETATED CROP LINES The Mississippi River forms the western
border of Jo Daviess County, and stream
action from several major tributaries has
resulted in a highly dissected landscape
containing the greatest local relief [~645
ft (197 m)] of any county in the state. The
shallow soil and moderate to steeply
sloping land surface are factors limiting
the cultivation of row crops, primarily
corn and soybeans. Agricultural lands
typically account for 90% or more of
the surface area in many rural Illinois
counties, with corn and soybeans con-
stituting nearly that entire amount (ISGS
2000). Within the study area, these two
crops make up only 30% of the total land
area, whereas hayfields and pasture-
lands account for 40% of the county land
area (USDA 2012; Figure 5).
Diseased or stressed vegetation is com-
monly used as an indicator in remote
sensing studies to detect and delin-
eate ephemeral phenomena. The 2012
summer drought adversely affected the
health and vigor of agricultural crops
in Illinois during the entire length of
the growing season. Beginning in early
June 2012, vegetated crop lines confined
mostly to alfalfa hayfields began to man-
ifest as a distinctive landscape feature
across the county.
Alfalfa is described by the Soil and
Health Library (2012) as
a long-lived, very deeply rooted
perennial. Upon germination, a
strong taproot develops rapidly and
penetrates almost vertically down-
ward. It often reaches a depth of 1.5
to 1.8 m [~5–6 ft] the first season, 3.0
to 3.6 m [~10–12 ft] by the end of the
second year, and may ultimately
extend to depths of 6.1 m [20 ft] or
more. It is notably a deep feeder.
Consequently, the vigorous root system
of alfalfa enabled plants near the bed-
rock fractures and crevices of the karst
aquifer to obtain sufficient moisture
and nutrients during the 2012 summer
drought to maintain healthy growth.
Alfalfa plants forming the vegetated
crop lines were taller [~1.5 ft (0.5 m) vs.
0.5 ft (0.15 m)], denser, and greener than
adjacent plants in the field, which exhib-
ited stunted and sparse plant growth
(Figures 2 and 3).
6 Circular 589 Illinois State Geological Survey
In contrast, corn and soybean plants
possess shallower root systems; there-
fore, occurrences of vegetated crop lines
within these two crops were rare. Corn
roots reach depths of approximately
4 ft (1.2 m), with less than 10% of the
moisture absorbed by the root system
occurring below about 3 ft (1 m; McWil-
liams et al. 2004). Soybean roots extend
to a depth of approximately 4 to 8 ft (1.2
to 2.4 m), with most of the roots being in
about the upper 0.5 to 1 ft (0.15 to 0.30
m) of soil (Ransom 2013). Because the
deep-rooted alfalfa is a primary hay
crop and is the predominant land cover
in the study area, it is typically planted
on slopes greater than 5% to control soil
erosion; thus, the potential for vegetated
crop lines to occur across the study area
was significantly increased during the
2012 growing season.
The ephemeral nature of the vegetated
crop lines, restricted to a relatively
brief temporal period during the 2012
growing season, made their detection
problematic. Complicating factors were
that farm operators typically harvest
(alfalfa) hayfields at various times and
frequencies during the summer months;
therefore, optimal field conditions and
subsurface factors were necessary for
vegetated crop lines to appear. Because
of the large geographic area where
vegetated crop lines could potentially
appear within agricultural lands (Figure
5), aerial photography was acquired
from multiple sources on multiple dates
during the period from June to Septem-
ber 2012 for the purpose of mapping
their spatial extent (Figures A1 and A2).
The U.S. Department of Agriculture col-
lects summer-season aerial photography
as part of its nationwide National Agri-
culture Imagery Program (NAIP), and
the annual acquisition period for Illinois
NAIP extends from mid-June through
August. Although NAIP imagery is of
medium resolution [3.3 × 3.3 ft (1 × 1
m), ground sample distance (GSD)] and
was acquired for the study area in June
during an earlier stage of the drought,
vegetated crop lines were nonetheless
detectable at several locations (Figure
6a). In July, low-altitude oblique aerial
photography for preselected areas was
acquired at approximately 984 ft (300
m) above ground level with a handheld
digital camera, which yielded some dra-
matic views of well-developed vegetated
crop lines (Figures 3 and 6b).
Using these two remote sensing sources
as a guide, the Illinois Department of
Transportation (IDOT) Aerial Surveys
flew a reconnaissance mission in August
2012 that captured high-resolution ver-
tical aerial photography [0.25 × 0.25 ft
(~0.08 × 0.08 m), GSD] of vegetated crop
lines for 15 specified locations across
the county (see Figure A1 and Table
A1). Last, Google aerial photography
(unknown GSD) acquired on September
27, 2012, provided the most comprehen-
sive inventory of vegetated crop lines.
One hundred twenty-eight locations
were identified that exhibited a wide
range of vegetated crop line develop-
ment (see Figure A2 and Table A2).
Using these aerial photography sources,
we determined all vegetated crop line
features to be evidence of bedrock frac-
tures and crevices (see next section for
a discussion), and they were digitized
using ArcGIS (http://www.arcgis.com/).
The NAIP imagery is orthorectified and
is therefore geographic information
system (GIS)-ready. Selected frames
from the IDOT digitized aerial photog-
raphy (Figure 7) were manually georef-
erenced using digital orthophotography
acquired in April 2011. The Google aerial
photographs were captured in Google
Earth (https://www.google.com/earth/;
Figures 8 and 9) by using a specialized
program, Shape2Earth (http://shape2
earthengine.com/shape2earth/Home.
html), which transforms the orthgraphic
imagery to a georeferenced format. The
results of the digitizing yielded 17,855
separate fractures (Figure 10). The origi-
nal imagery and digitized fractures are
documented in the Appendix.
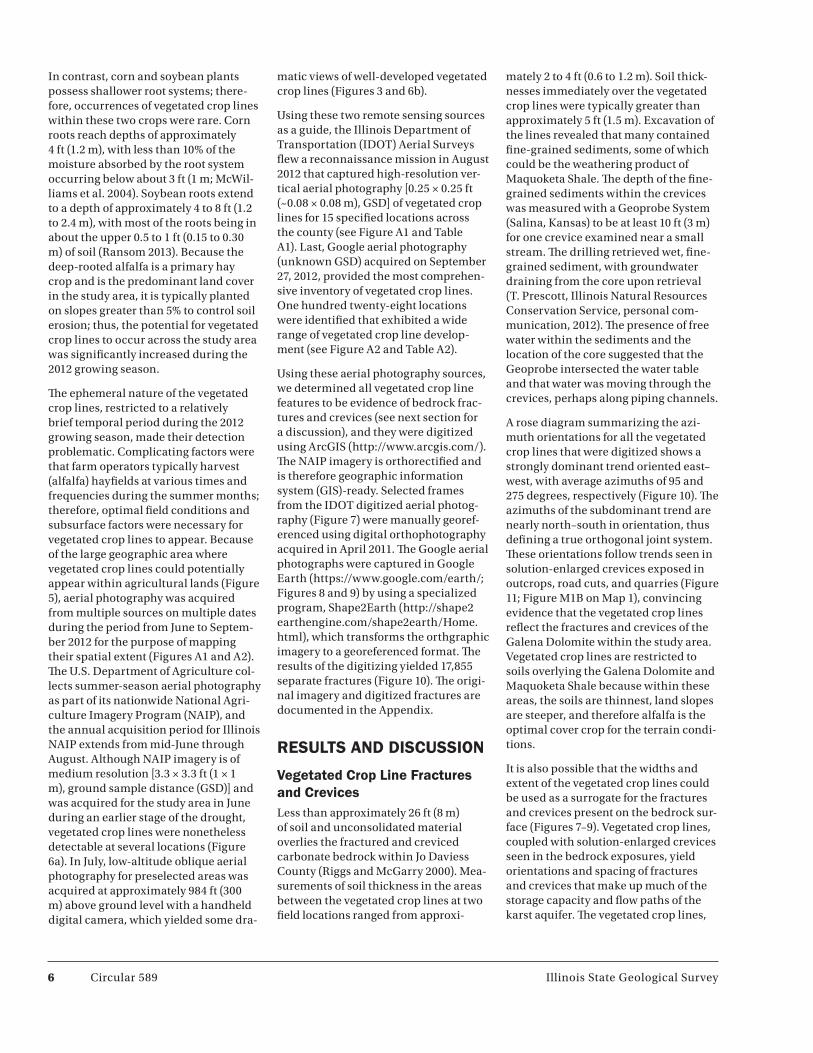
RESULTS AND DISCUSSION
Vegetated Crop Line Fractures and CrevicesLess than approximately 26 ft (8 m)
of soil and unconsolidated material
overlies the fractured and creviced
carbonate bedrock within Jo Daviess
County (Riggs and McGarry 2000). Mea-
surements of soil thickness in the areas
between the vegetated crop lines at two
field locations ranged from approxi-
mately 2 to 4 ft (0.6 to 1.2 m). Soil thick-
nesses immediately over the vegetated
crop lines were typically greater than
approximately 5 ft (1.5 m). Excavation of
the lines revealed that many contained
fine-grained sediments, some of which
could be the weathering product of
Maquoketa Shale. The depth of the fine-
grained sediments within the crevices
was measured with a Geoprobe System
(Salina, Kansas) to be at least 10 ft (3 m)
for one crevice examined near a small
stream. The drilling retrieved wet, fine-
grained sediment, with groundwater
draining from the core upon retrieval
(T. Prescott, Illinois Natural Resources
Conservation Service, personal com-
munication, 2012). The presence of free
water within the sediments and the
location of the core suggested that the
Geoprobe intersected the water table
and that water was moving through the
crevices, perhaps along piping channels.
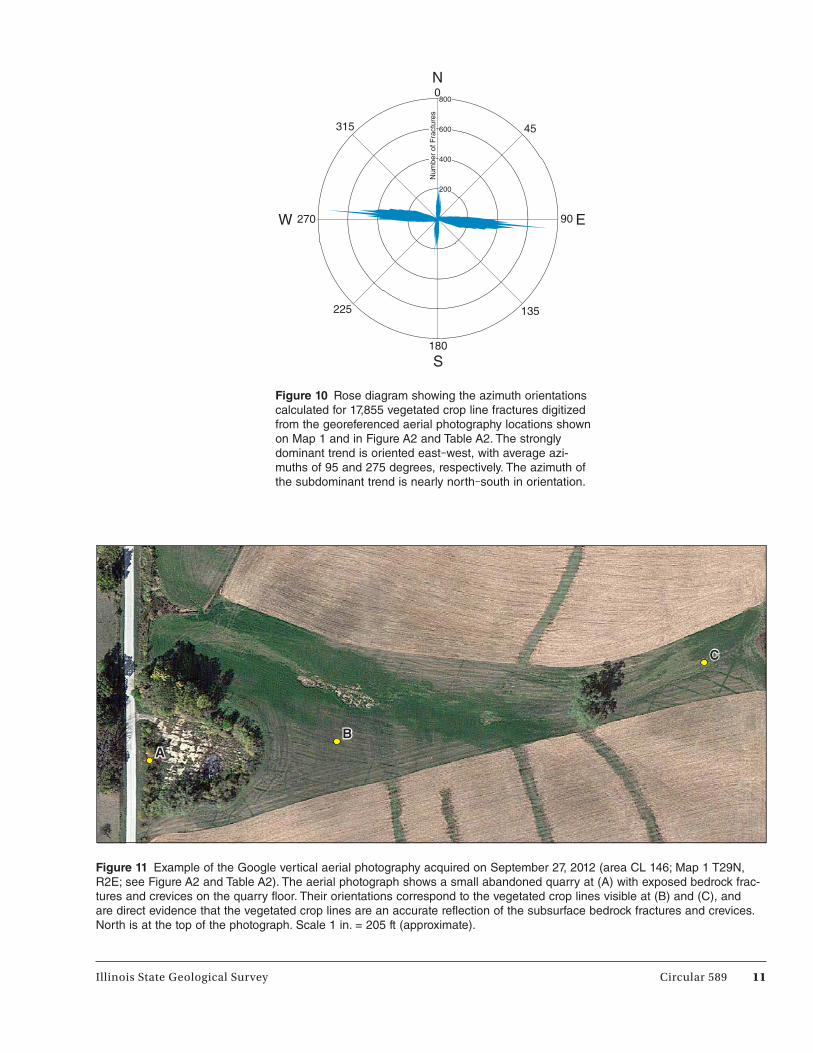
A rose diagram summarizing the azi-
muth orientations for all the vegetated
crop lines that were digitized shows a
strongly dominant trend oriented east–
west, with average azimuths of 95 and
275 degrees, respectively (Figure 10). The
azimuths of the subdominant trend are
nearly north–south in orientation, thus
defining a true orthogonal joint system.
These orientations follow trends seen in
solution-enlarged crevices exposed in
outcrops, road cuts, and quarries (Figure
11; Figure M1B on Map 1), convincing
evidence that the vegetated crop lines
reflect the fractures and crevices of the
Galena Dolomite within the study area.
Vegetated crop lines are restricted to
soils overlying the Galena Dolomite and
Maquoketa Shale because within these
areas, the soils are thinnest, land slopes
are steeper, and therefore alfalfa is the
optimal cover crop for the terrain condi-
tions.
It is also possible that the widths and
extent of the vegetated crop lines could
be used as a surrogate for the fractures
and crevices present on the bedrock sur-
face (Figures 7–9). Vegetated crop lines,
coupled with solution-enlarged crevices
seen in the bedrock exposures, yield
orientations and spacing of fractures
and crevices that make up much of the
storage capacity and flow paths of the
karst aquifer. The vegetated crop lines,
Illinois State Geological Survey Circular 589 7
a June 27, 2012 b July 19, 2012
c August 28, 2012 d September 27, 2012
Figure 6 Example of multitemporal remote sensing data sources used to detect and delineate vegetated crop line
areas: (a) USDA National Agriculture Imagery Program (NAIP), (b) reconnaissance oblique aerial photography, (c)
reconnaissance vertical aerial photography (area ST 4; Map 1 T28–29N, R4–5E; see Figure A1 and Table A1), (d)
Google georeferenced vertical aerial photography (area CL 7; Map 1 T28N, R4–5E; see Figure A2 and Table A2). The
vegetated networks began appearing in June, became more distinct as the summer drought intensified during July
and August, and had largely disappeared by October. North is to the left. Scale for a, c, and d is 1 in. = 225 ft (approxi-
mate).
8 Circular 589 Illinois State Geological Survey
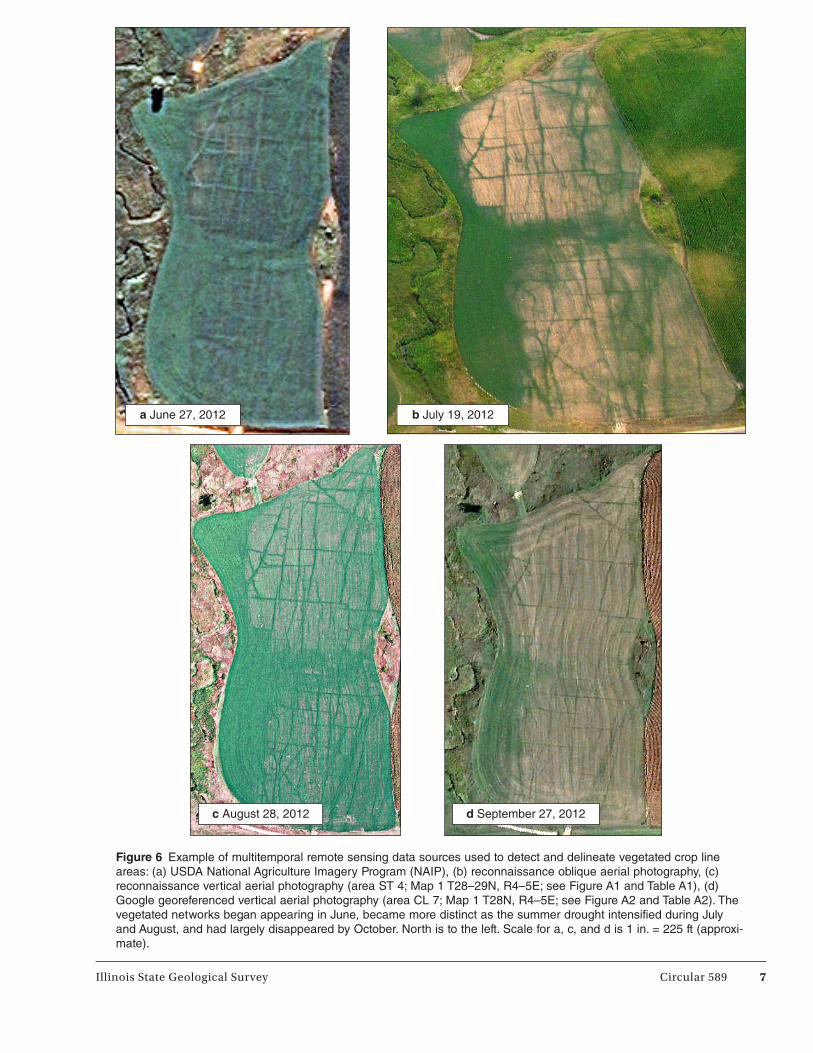
Figure 7 Example of the reconnaissance vertical aerial photography of two alfalfa fields exhibiting pronounced vegetated
crop lines acquired on August 28, 2012 (areas ST 10 and CL 48–49; Map 1 T28N, R3–4E; see Figures A1–A2 and Tables A1–A2, respectively). An enlargement of a small portion of the upper field (A) shows in exceptional detail how the alfalfa plants
mimic the underlying bedrock fracture and crevice patterns. The more prominent vegetated crop lines shown in (A) average
approximately 4 ft (1.2 m) wide, and the varying widths may be indicative of the relative widths of the buried fractures and
crevices. North is at the top of the photographs. Scale 1 in. = 250 ft (upper photograph); 1 in. = 50 ft (enlargement). Scales
are approximate.
A
A

Illinois State Geological Survey Circular 589 9
Figure 8 Example of the Google aerial photography of two alfalfa fields exhibiting prominent vegetated crop lines acquired on
September 27, 2012 (area CL 24; Map 1 T29N, R4E; see Figure A2 and Table A2). Field excavation in the upper field at the
location of the yellow dot revealed a bedrock crevice about 2 in. (5 cm) wide at a depth of approximately 3 ft (1 m), along with
an alfalfa tap root embedded in the crevice. The vegetated crop lines visible in this aerial photograph average from 2 to 3 ft
(0.6 to 1.0 m) to approximately 6 ft (2 m) in width. North is at the top of the photograph. Scale 1 in. = 115 ft (approximate).
10 Circular 589 Illinois State Geological Survey
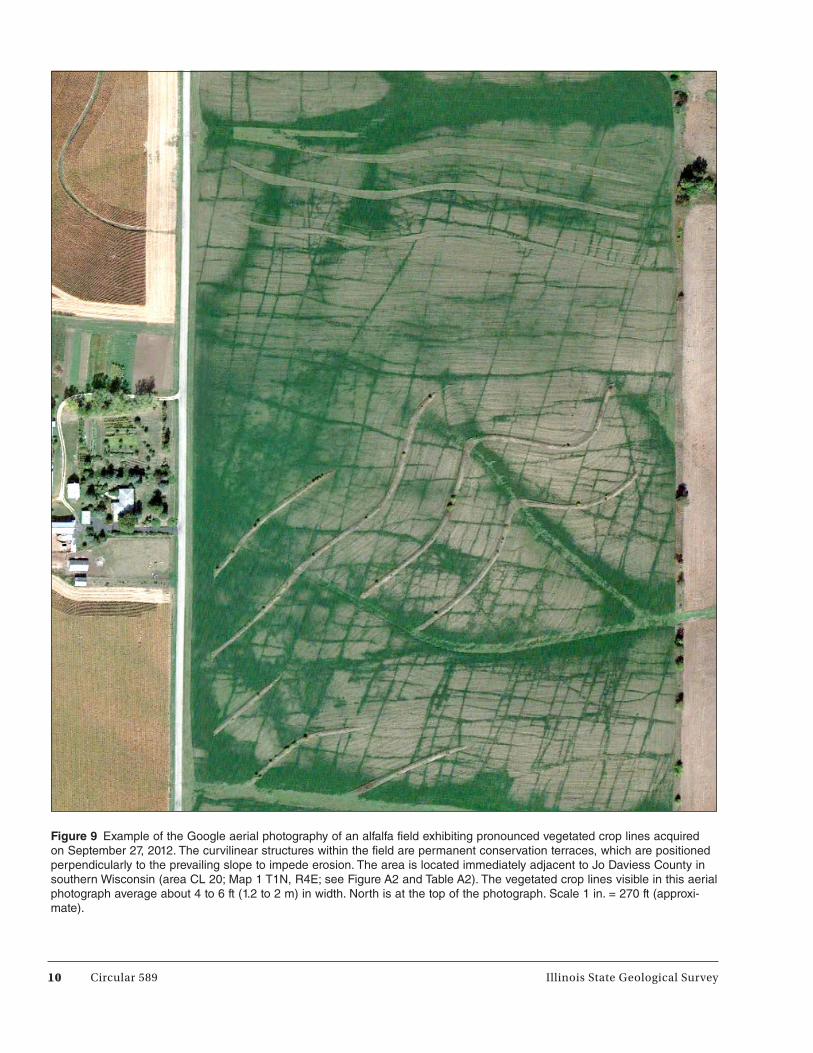
Figure 9 Example of the Google aerial photography of an alfalfa field exhibiting pronounced vegetated crop lines acquired
on September 27, 2012. The curvilinear structures within the field are permanent conservation terraces, which are positioned
perpendicularly to the prevailing slope to impede erosion. The area is located immediately adjacent to Jo Daviess County in
southern Wisconsin (area CL 20; Map 1 T1N, R4E; see Figure A2 and Table A2). The vegetated crop lines visible in this aerial
photograph average about 4 to 6 ft (1.2 to 2 m) in width. North is at the top of the photograph. Scale 1 in. = 270 ft (approxi-
mate).
Illinois State Geological Survey Circular 589 11
200
400
600
800
45
0
135
90270
225
180
315
Num
ber
of F
ract
ures
N
S
W E
Figure 10 Rose diagram showing the azimuth orientations
calculated for 17,855 vegetated crop line fractures digitized
from the georeferenced aerial photography locations shown
on Map 1 and in Figure A2 and Table A2. The strongly
dominant trend is oriented east–west, with average azi-
muths of 95 and 275 degrees, respectively. The azimuth of
the subdominant trend is nearly north–south in orientation.
Figure 11 Example of the Google vertical aerial photography acquired on September 27, 2012 (area CL 146; Map 1 T29N,
R2E; see Figure A2 and Table A2). The aerial photograph shows a small abandoned quarry at (A) with exposed bedrock frac-
tures and crevices on the quarry floor. Their orientations correspond to the vegetated crop lines visible at (B) and (C), and
are direct evidence that the vegetated crop lines are an accurate reflection of the subsurface bedrock fractures and crevices.
North is at the top of the photograph. Scale 1 in. = 205 ft (approximate).
AA
CC
BB

12 Circular 589 Illinois State Geological Survey
coupled with previous work by Bradbury
et al. (1956), Heyl et al. (1959), and Panno
et al. (2015) describing the fractures and
crevices in road cuts and quarries in the
study area, yield spacing of the fractures
and crevices that make up much of the
connected porosity and storage capacity
and many of the flow paths of the Galena
Dolomite karst aquifer.
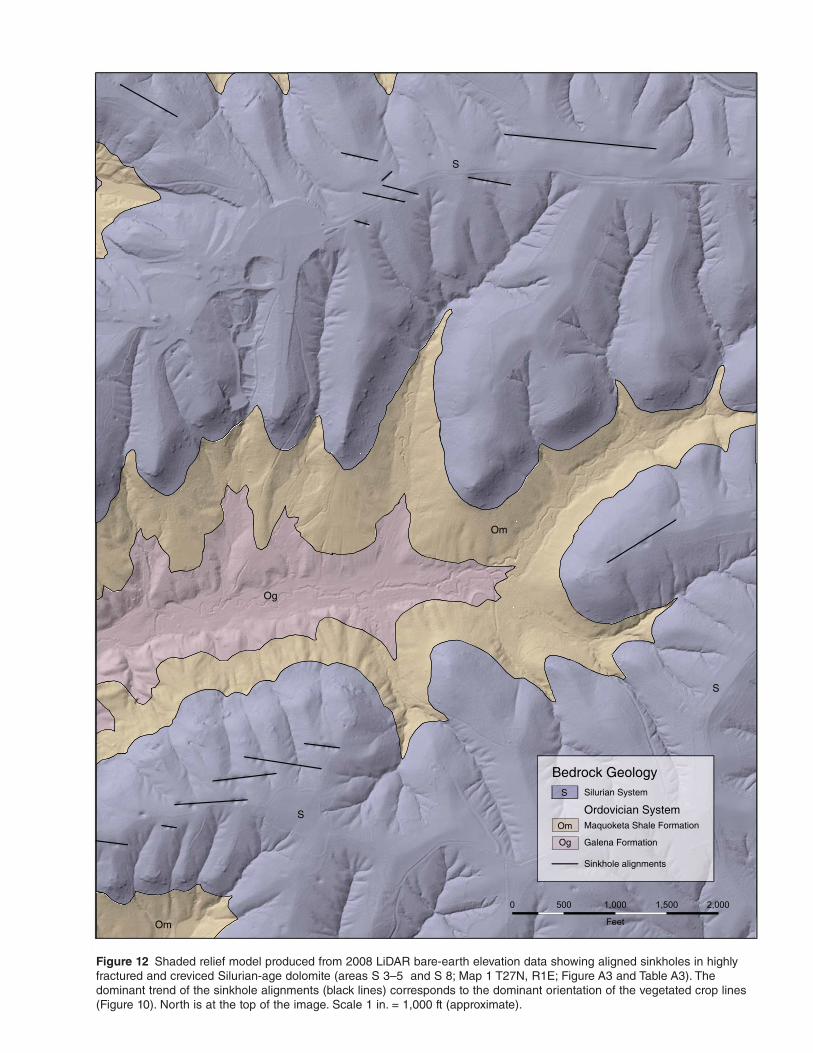
Alignments of Silurian SinkholesAnalysis of LiDAR elevation data
revealed numerous cover-collapse
sinkholes in western Jo Daviess
County developed in the unconsoli-
dated deposits overlying the Silurian
dolomite (Figure 12 and Map 1 ). The
cover-collapse sinkholes that could be
delineated are oriented en echelon in
an approximately east–west orientation
and have average azimuths of 105 and
285 degrees, respectively (Figure A3 and
Table A3). This trend is within 10 degrees
of the dominant orientation of the veg-
etated crop lines (Figure 10), additional
evidence the vegetated crop lines are
an accurate reflection of the fractures
and crevices of the underlying bedrock
within the study area.
Field examination of these areas
revealed solution-enlarged crevices and
small caves in addition to sinkholes.
Karst features present in the western
part of Jo Daviess County in Silurian
dolomite include relatively large crev-
ices or cutters in exposures and road
cuts (Figure 13) as well as cover-collapse
sinkholes in fine-grained sediment over-
lying the dolomite. Solution-enlarged
crevices in the Silurian dolomite can
be up to approximately 3 ft (1 m) in
width and are numerous. Sinkholes in
this area are roughly circular in plan
view, typically bowl-shaped, approxi-
mately 6 to 23 ft (2 to 7 m) deep, and
approximately 60 to 100 ft (20 to 30 m) in
diameter based on measurements from
LiDAR elevation data. Several of these
sinkholes initially seen in aerial photo-
graphs were documented by Weibel and
Panno (1997) and Panno et al. (1997).
Weibel and Panno (1997) and Panno et
al. (1997) reported them to be collapse
features with no evidence of waste piles
that would suggest excavations (Figure
12). Consequently, the features were
interpreted as sinkholes and not as
small-scale mining operations following
veins of ore minerals. Approximately 10
of these cover-collapse sinkholes have
been examined in the field, and it is pos-
sible a few could be related to adjacent
large-scale mining operations (e.g.,
Touseull and Rich 1980).
Although a large cover-collapse sinkhole
area underlain by Silurian dolomite in
the southwestern corner of Jo Daviess
County is near mining operations, the
ore deposits in this area were primar-
ily within the deeper dolomite of the
Galena Group underlying the Silurian
dolomite and Maquoketa Shale. There-
fore, features identified as cover-col-
lapse sinkholes in sediment overlying
the Silurian dolomite are typically not
related to mining operations. Road cuts
in the area between approximately 3 and
5 mi (5 and 8 km) to the east reveal that
these aligned sinkholes probably formed
along almost east–west-trending crev-
ices that range from approximately 1.5 to
3 ft (0.5 to 1 m) in width (Figure 13). The
depth of the crevices is at least approxi-
mately 20 ft (6 m) from the land surface,
as seen in road cuts. The collapse of
sediment into these large crevices prob-
ably created the sinkholes and associ-
ated lineaments observed in the imag-
ery. In addition, it is possible that large
blocks of Silurian dolomite on ridges
could have separated along crevices and
slowly migrated downhill on the under-
lying shale. This would have dilated
existing crevices even more, thereby
creating additional aligned collapse fea-
tures (D. Mikulic, Illinois State Geologi-
cal Survey, personal communication,
2014). In addition, strike-slip shearing
with an extensional component would
have enlarged fractures, making them
highly prone to further widening by
solution.
Alignments from Lead-Zinc Mining OperationsThe Upper Mississippi Valley (UMV)
mining district lies within the Drift-
less Area of northwestern Illinois and
includes the study area, southwestern
Wisconsin, and northeastern Iowa.
From the early 19th century into the
middle of the 20th century, the UMV
mining district was one of America’s
leading producers of lead and zinc.
These ores, primarily galena and
sphalerite, were concentrated along
near-vertical solution-enlarged frac-
tures and shear joints that extend up to
2 mi (3.2 km) in length within middle
Ordovician-age limestone and dolomite,
primarily within the Galena Group.
The crevice deposits trended roughly
east–west along the southwestern flank
of the Wisconsin Arch (Bradbury 1959;
Figure 4). The UMV mining district is
bounded by first-order structural fea-
tures that include the Illinois Basin to
the south, the Wisconsin Arch to the
north, and the Forest City Basin to the
west. The geology of the UMV mining
district and its ore deposits has been
summarized by Heyl et al. (1959) and
Bradbury (1959). Formation of the ore
deposits has been tied to the Allegha-
nian/Ouachita Orogeny that initiated
a regional-scale brine migration across
the Midwest. The timing of ore mineral-
ization is estimated to be approximately
270 Ma before present (Brannon et al.
1992). Bethke (1986) suggested that the
ore-forming brines probably originated
from the Illinois Basin and migrated
along a gravity-driven gradient toward
the north. Recent data by Panno et al.
(2013) on chlorine/bromine (Cl/Br)
ratios of fluid inclusions in sphalerite
samples from the UMV district suggest
that if the Illinois Basin was the source
of the ore-forming brines, they probably
originated from or migrated through
Pennsylvanian-age strata.
Mining in Jo Daviess County extends
back to the Native Americans, who
extracted galena for ornamental use and
later in the late 1600s for trading with
the French. Lacking metal tools, explo-
sives, and smelting technology, Native
Americans were undoubtedly limited in
their mining techniques to picking crys-
tals out of surface exposures. Settlers
moving into the area during the 1830s
forcibly took over lands from the Native
Americans with the assistance of the
U.S. Government (Jelatis 2009). Under-
ground mining commenced soon after
initial settlement, and by 1845, the city
of Galena, Illinois, produced 80% of the
lead in the United States—the last mine
closed in 1979 (Mining History Associa-
tion 2013). Heyl et al. (1978) described
early mining in the area as follows:
S
S
S
Om
Om
Og
0 500 1,000 1,500 2,000
Feet
Bedrock GeologySilurian System
Maquoketa Shale Formation
Galena Formation
Sinkhole alignments
Ordovician System
S
Om
Og
Figure 12 Shaded relief model produced from 2008 LiDAR bare-earth elevation data showing aligned sinkholes in highly
fractured and creviced Silurian-age dolomite (areas S 3–5 and S 8; Map 1 T27N, R1E; Figure A3 and Table A3). The
dominant trend of the sinkhole alignments (black lines) corresponds to the dominant orientation of the vegetated crop lines
(Figure 10). North is at the top of the image. Scale 1 in. = 1,000 ft (approximate).

14 Circular 589 Illinois State Geological Survey
Production was largely from “float”
deposits formed by weathering of
sulfide veins that left concentrations
of residual galena on hillside bed-
rock overlain by varying thicknesses
of residual soil. The miners would dig
a pit to bedrock, extending outward
in all directions, dragging the galena
to the center. The mining limit of
each pit was soon reached, and then
the miners simply moved a short dis-
tance away and dug another pit. This
system of “suckering” produced the
pock-marked hillsides so common in
the district. (p. 4)
Because ore emplacement was the result
of mineralization along preexisting frac-
tures and crevices, the lines of sucker
holes (diggings) provide a means of mea-
suring the orientation of ore-bearing
veins; therefore, fracture trends can be
delineated within the Galena Dolomite
that existed at the time of ore miner-
alization (ca. 270 Ma before present;
Brannon et al. 1992). Mine diggings in
Figure 13 Road cut exposure of Silurian-age dolomite near Elizabeth, Illinois, in
Jo Daviess County. Solution-enlarged crevices in the Silurian dolomite can be up to
approximately 3 ft (1 m) in width (photograph by S. Panno).
Jo Daviess County possess a dominant
trend oriented west to east, and a lesser
north-to-south trend, consistent with
the orientations of the vegetated crop
lines (Figure 10).
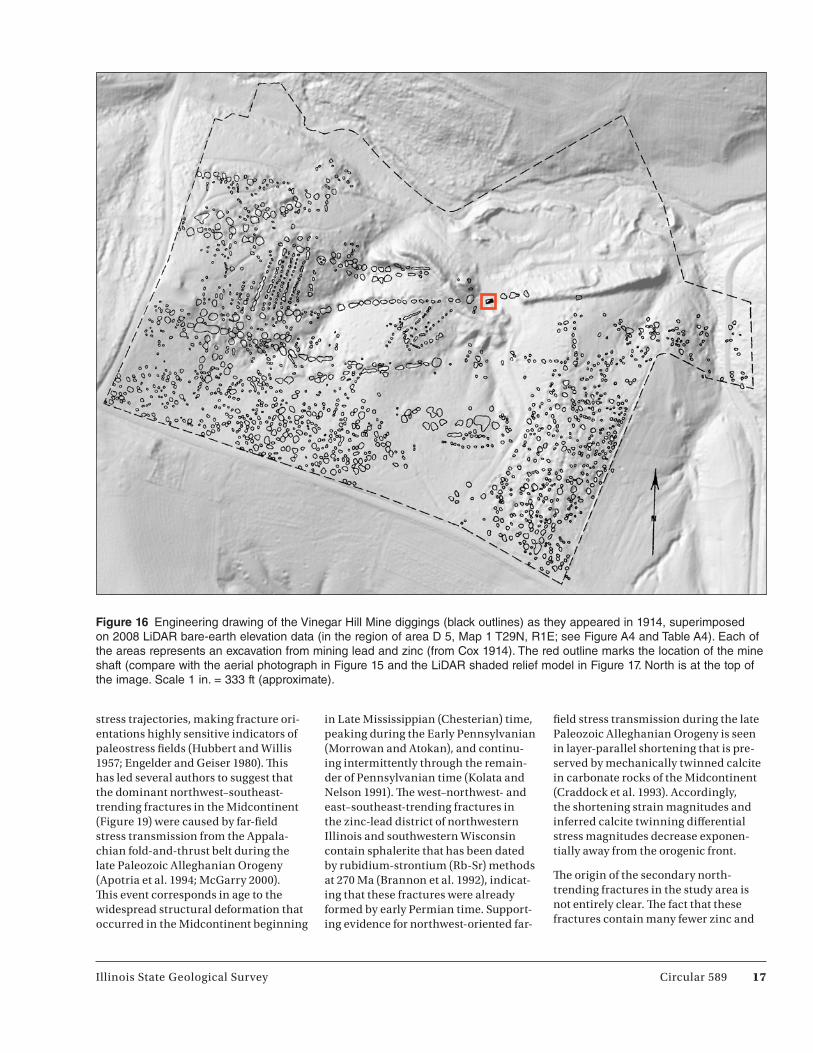
Present-day remnants of large-scale
mining operations are visible on the
ground as waste piles and mine open-
ings at the base of bluffs. The mining
operations and their scars on the land-
scape were first mapped by Grant and
Perdue (1908) on the Millbrig Quad-
rangle, which included the Vinegar Hill
Mine diggings (Figure 14). Subsequent
detailed mapping of these diggings
by the Vinegar Hill Mining Company
revealed aligned diggings that typically
followed veins of ore minerals (Cox
1914). Examination of the LiDAR eleva-
tion data revealed abundant evidence
of mining disturbances throughout the
county (see Map 1 and Figure A4 and
Table A4), including numerous align-
ments of mine diggings. An overlay
of a map of the Vinegar Hill diggings
reported by Cox (1914) combined with a
LiDAR shaded relief model for the same
geographic area illustrates a high degree
of accuracy, as well as evidence of
additional diggings that appear to post-
date the 1914 Cox map (Figures 15–17).
Analysis of the mine digging alignments
digitized from the LiDAR elevation data
shows an almost east–west dominant
trend, with average azimuths of 101 and
281 degrees, respectively, consistent
with those of the vegetated crop lines
(Figure 10) and the aligned sinkholes
developed in the Silurian dolomite (see
Figure A3 and Table A3)—further evi-
dence that the vegetated crop lines are
a surrogate for fractures and crevices in
the underlying bedrock.
Tectonic Implications of Bedrock FracturesBedrock throughout the Midcontinent
of the United States, including northern
Illinois, exhibits vertical fractures or
Illinois State Geological Survey Circular 589 15
Figure 14 Millbrig sheet geologic map showing the distribution of lead and zinc diggings in 1908 for an area north of Galena,
Illinois, in northwestern Jo Daviess County. The outlined area is the location of the Vinegar Hill Mine and diggings (Grant and
Perdue 1908; compare with Figures 15–17). Map has been reduced to 50% of its original size.

16 Circular 589 Illinois State Geological Survey
Figure 15 Vertical aerial photograph acquired in April 2011 showing the original Vinegar Hill Mine site in northwestern Jo
Daviess County (see also Figure 14 for location). Many of the diggings are now obscured by woody vegetation. The light-toned
area represents the spoils from underground mining operations (compare with Figures 16 and 17). North is at the top of the
photograph. Scale 1 in. = 333 ft (approximate).
joints. These fractures or joints have long
been observed in the numerous mines,
quarries, road cuts, and natural expo-
sures in northwestern Illinois. Many of
the vertical fractures are traceable hori-
zontally for 2 mi (3.2 km) or more (Heyl
et al. 1959) and have been observed at
depths of 5,000 ft (1,524 m) in explor-
atory drill holes in adjacent Stephenson
County (Haimson and Doe 1983). In
Jo Daviess County, the predominant
fracture trends, as inferred from the
vegetated crop lines, are oriented nearly
east–west, with average azimuths of
95 and 275 degrees, respectively. The
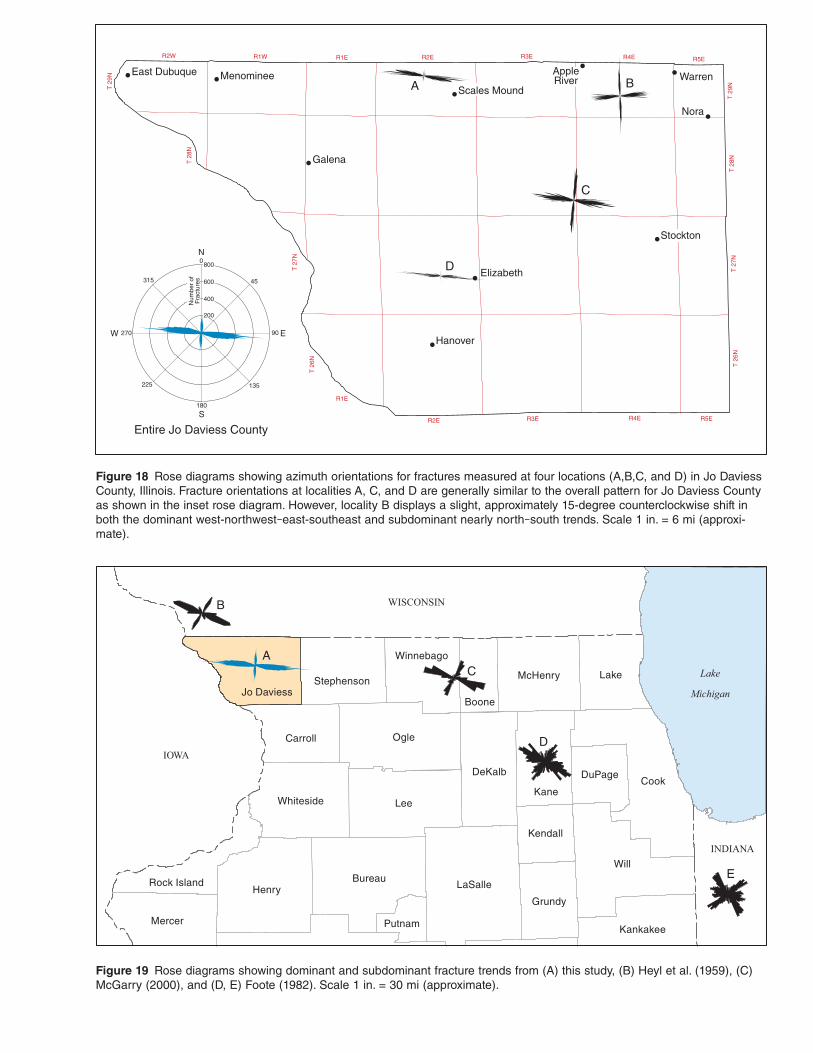
secondary joint trend is oriented nearly
north–south (Figure 10). Locally, the
average trends vary by as much as 10
degrees (Figure 18), but overall, they are
consistent with the bedrock fracture
orientations observed in the zinc-lead
district of northwestern Illinois and
southwestern Wisconsin (Heyl et al.
1959); in Boone and Winnebago Coun-
ties, Illinois (McGarry 2000); and in
northeastern Illinois and northern Indi-
ana (Foote 1982; Figure 19). One of the
areas of greatest divergence in the trend
of fractures and crevices occurs in the
northeastern part of Jo Daviess County
(area B in Figure 18). Here, the primary
fracture trend is oriented almost east–
west at average azimuths of 85 degrees,
and the secondary fractures are oriented
slightly west of north at 175 degrees.
Field and laboratory results indicate
that regional fracture systems form
parallel to maximum compressive
Illinois State Geological Survey Circular 589 17
Figure 16 Engineering drawing of the Vinegar Hill Mine diggings (black outlines) as they appeared in 1914, superimposed
on 2008 LiDAR bare-earth elevation data (in the region of area D 5, Map 1 T29N, R1E; see Figure A4 and Table A4). Each of
the areas represents an excavation from mining lead and zinc (from Cox 1914). The red outline marks the location of the mine
shaft (compare with the aerial photograph in Figure 15 and the LiDAR shaded relief model in Figure 17. North is at the top of
the image. Scale 1 in. = 333 ft (approximate).
stress trajectories, making fracture ori-
entations highly sensitive indicators of
paleostress fields (Hubbert and Willis
1957; Engelder and Geiser 1980). This
has led several authors to suggest that
the dominant northwest–southeast-
trending fractures in the Midcontinent
(Figure 19) were caused by far-field
stress transmission from the Appala-
chian fold-and-thrust belt during the
late Paleozoic Alleghanian Orogeny
(Apotria et al. 1994; McGarry 2000).
This event corresponds in age to the
widespread structural deformation that
occurred in the Midcontinent beginning
in Late Mississippian (Chesterian) time,
peaking during the Early Pennsylvanian
(Morrowan and Atokan), and continu-
ing intermittently through the remain-
der of Pennsylvanian time (Kolata and
Nelson 1991). The west–northwest- and
east–southeast-trending fractures in
the zinc-lead district of northwestern
Illinois and southwestern Wisconsin
contain sphalerite that has been dated
by rubidium-strontium (Rb-Sr) methods
at 270 Ma (Brannon et al. 1992), indicat-
ing that these fractures were already
formed by early Permian time. Support-
ing evidence for northwest-oriented far-
field stress transmission during the late
Paleozoic Alleghanian Orogeny is seen
in layer-parallel shortening that is pre-
served by mechanically twinned calcite
in carbonate rocks of the Midcontinent
(Craddock et al. 1993). Accordingly,
the shortening strain magnitudes and
inferred calcite twinning differential
stress magnitudes decrease exponen-
tially away from the orogenic front.
The origin of the secondary north-
trending fractures in the study area is
not entirely clear. The fact that these
fractures contain many fewer zinc and
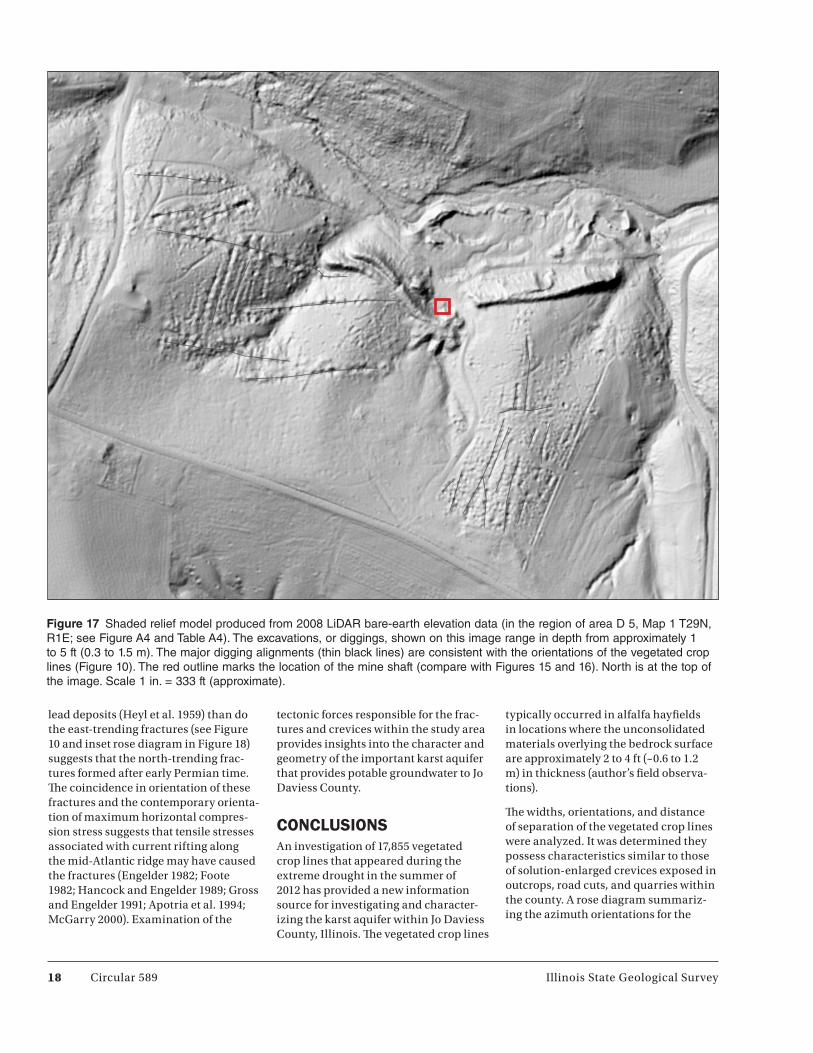
Figure 17 Shaded relief model produced from 2008 LiDAR bare-earth elevation data (in the region of area D 5, Map 1 T29N,
R1E; see Figure A4 and Table A4). The excavations, or diggings, shown on this image range in depth from approximately 1
to 5 ft (0.3 to 1.5 m). The major digging alignments (thin black lines) are consistent with the orientations of the vegetated crop
lines (Figure 10). The red outline marks the location of the mine shaft (compare with Figures 15 and 16). North is at the top of
the image. Scale 1 in. = 333 ft (approximate).
18 Circular 589 Illinois State Geological Survey
lead deposits (Heyl et al. 1959) than do
the east-trending fractures (see Figure
10 and inset rose diagram in Figure 18)
suggests that the north-trending frac-
tures formed after early Permian time.
The coincidence in orientation of these
fractures and the contemporary orienta-
tion of maximum horizontal compres-
sion stress suggests that tensile stresses
associated with current rifting along
the mid-Atlantic ridge may have caused
the fractures (Engelder 1982; Foote
1982; Hancock and Engelder 1989; Gross
and Engelder 1991; Apotria et al. 1994;
McGarry 2000). Examination of the
tectonic forces responsible for the frac-
tures and crevices within the study area
provides insights into the character and
geometry of the important karst aquifer
that provides potable groundwater to Jo
Daviess County.
CONCLUSIONSAn investigation of 17,855 vegetated
crop lines that appeared during the
extreme drought in the summer of
2012 has provided a new information
source for investigating and character-
izing the karst aquifer within Jo Daviess
County, Illinois. The vegetated crop lines
typically occurred in alfalfa hayfields
in locations where the unconsolidated
materials overlying the bedrock surface
are approximately 2 to 4 ft (~0.6 to 1.2
m) in thickness (author’s field observa-
tions).
The widths, orientations, and distance
of separation of the vegetated crop lines
were analyzed. It was determined they
possess characteristics similar to those
of solution-enlarged crevices exposed in
outcrops, road cuts, and quarries within
the county. A rose diagram summariz-
ing the azimuth orientations for the
T 2
9N
T 2
9N
T 2
8N
T 2
8N
T 2
7N
T 2
7N
T 2
6N T 2
6N
R2W R1W R1E R2E R3E R4E R5E
R1E
R2E R3E R4E R5E
Nora
Galena
Warren
Hanover
Stockton
Elizabeth
Menominee AppleRiver
Scales Mound
East DubuqueA B
C
D
Entire Jo Daviess County
200
400
600
800
45
0
135
90270
225
180
315
Num
ber
ofFr
actu
res
N
S
W E
Figure 18 Rose diagrams showing azimuth orientations for fractures measured at four locations (A,B,C, and D) in Jo Daviess
County, Illinois. Fracture orientations at localities A, C, and D are generally similar to the overall pattern for Jo Daviess County
as shown in the inset rose diagram. However, locality B displays a slight, approximately 15-degree counterclockwise shift in
both the dominant west-northwest–east-southeast and subdominant nearly north–south trends. Scale 1 in. = 6 mi (approxi-
mate).
WISCONSIN
IOWA
INDIANA
Lake
MichiganBoone
Bureau
Carroll
CookDeKalb DuPage
GrundyHenry
Jo Daviess
Kane
Kankakee
Kendall
Lake
LaSalle
Lee
McHenry
Mercer
Ogle
Putnam
Rock Island
Stephenson
Whiteside
Will
WinnebagoA
B
C
D
E
Figure 19 Rose diagrams showing dominant and subdominant fracture trends from (A) this study, (B) Heyl et al. (1959), (C)
McGarry (2000), and (D, E) Foote (1982). Scale 1 in. = 30 mi (approximate).
20 Circular 589 Illinois State Geological Survey
vegetated crop lines shows a dominant trend oriented almost east–west at aver-age azimuths of 95 and 275 degrees, respectively. Azimuths of the subdomi-nant trend are almost north–south in orientation (Figure 10; also see Map 1).
Additionally, analysis of LiDAR eleva-tion data of digitized fractures and crevice patterns associated with aban-doned lead and zinc mine diggings, and alignments of cover-collapse sinkholes showed that the orientations of these features are consistent with those of fractures and crevices observed in expo-sures throughout the county and with the vegetated crop lines.
These fractures and crevices probably formed contemporaneously with the Appalachian fold-and-thrust belt during the late Paleozoic Alleghanian Orogeny and are the predominant host of the zinc-lead ore deposits in the Driftless Area. The origin of the subdominant almost north–south-trending fractures and crevices is not so clear, and the pau-city of ore mineralization suggests that the fractures formed after early Permian time, possibly because of current rifting along the Mid-Atlantic Ridge.
The results of this investigation confirm that the vegetated crop lines identified and digitized from the multidate aerial photography and LiDAR elevation data can be used as direct surrogates for mapping the fracture and crevice pat-terns on the buried carbonate bedrock surface. Digitized data sets constituting the vegetated crop lines, and alignments of cover-collapse sinkholes and mine diggings can be used to better charac-terize the geometry and character of the karst aquifer within the Driftless Area of northwestern Illinois.
ACKNOWLEDGMENTSThe authors thank Matthew Altschuler of Jo Daviess County for notifying the authors of the appearance of vegetated crop lines in the summer of 2012, and Jeff Kromer of Mount Carroll, Illinois, for the generous donation of his time, skills, and aircraft to capture recon-naissance aerial photography over Jo Daviess County. The authors also thank Walton Kelly of the Illinois State Water
Survey for his assistance in the field and insightful observations, and Amy Eller of IDOT for contributing Aerial Survey Division resources to acquire the vertical aerial photography in a timely manner.
The authors express their sincere thanks to the staff at the ISGS who were respon-sible for the preparation of the maps, figures, and illustrations; scientific reviews and editing; and production of this publication: Jennifer Carrell, Jane Johnshoy Domier, Michael Knapp, Rich-ard Berg, Steven Brown, Brandon Curry, David Larson, John Nelson, and Susan Krusemark.
REFERENCESApotria, T., C.J. Kaiser, and B.A. Cain,
1994, Fracturing and stress history of the Devonian Antrim Shale, Michigan Basin, in P.P. Nelson, and S.C. Lau-bach, eds., Rock mechanics models and measurements: Challenges from industry: Proceedings of the 1st North American Rock Mechanics Sympo-sium: Rotterdam, Netherlands, A.A. Balkema, p. 809–816.
Bethke, C.M., 1986, Hydrogeologic con-straints on the genesis of the Upper Mississippi Valley mineral district from Illinois Basin brines: Economic Geology, v. 81, p. 233–249.
Bradbury, J.C., 1959, Crevice lead-zinc deposits of northwestern Illinois: Illi-nois State Geological Survey, Report of Investigations 210, 49 p.
Bradbury, J.C., R.M. Grogan, and R.J. Cronk, 1956, Geologic structure map of the northwestern Illinois zinc-lead district: Illinois State Geological Survey, Circular 214, 7 p.
Brannon, J.C., F.A. Podosek, and R.K. McLimans, 1992, Alleghenian age of the Upper Mississippi Valley zinc-lead deposits determined by Rb-Sr dating of sphalerite: Nature, v. 356, p. 509–511.
Bunker, B.J., G.A. Ludvigson, and B.J. Witzke, 1985, The Plum River Fault Zone and the structural and strati-graphic framework of eastern Iowa: Iowa Geological Survey, Technical Information Series 13, 123 p.
Cox, G.H., 1914, Lead and zinc deposits of northwestern Illinois, Illinois State Geological Survey, Bulletin 21, 120 p.
Craddock, J.P., M. Jackson, B.A. van der Pluijm, and R.T. Versical, 1993, Regional shortening fabrics in east-ern North America: Far-field stress transmission from the Appalachian-Ouachita orogenic belt: Tectonics, v. 12, p. 257–264.
Csallany, S., and W.C. Walton, 1963, Yields of shallow dolomite wells in northern Illinois: Illinois State Water Survey, Report of Investigations 46, 43 p.
Engelder, T., 1982, Is there a genetic rela-tionship between selected regional joints and the contemporary stress within the lithosphere of North America? Tectonics, v. 1, p. 161–177.
Engelder, T., and P. Geiser, 1980, On the use of regional joint sets as trajecto-ries of paleostress fields during the development of the Appalachian Pla-teau, New York: Journal of Geophysi-cal Research, v. 85, p. 6319–6341.
Foote, G.R., 1982, Fracture analysis in northeastern Illinois and northern Indiana: University of Illinois at Urbana-Champaign, M.S. thesis, 192 p.
Ford, D.C., and P.W. Williams, 1992, Karst geomorphology and hydrology: New York, Chapman and Hall, p. 1.
Grant, U.S., and M.J. Perdue, 1908, Millbrig sheet of the lead and zinc district of northern Illinois: Illinois State Geological Survey, Bulletin 8, p. 335–343.
Gross, M.R., and T. Engelder, 1991, A case for neotectonic joints along the Niagara Escarpment: Tectonics, v. 10, p. 631–641.
Hackett, J.E., and R.E. Bergstrom, 1956, Groundwater in northwestern Illi-nois: Illinois State Geological Survey Division, Circular 207, 25 p.
Haimson, B.C., and T.W. Doe, 1983, State of stress, permeability, and fractures in the Precambrian granite in north-ern Illinois: Journal of Geophysical Research, v. 88, p. 7355–7371.
Illinois State Geological Survey Circular 589 21
Hancock, P.L., and T. Engelder, 1989, Neotectonic joints: Geological Soci-ety of America Bulletin, v. 101, p. 1197–1208.
Heyl, A.V., A.F. Agnew Jr., E.J. Lyons, and C.H. Behre Jr., 1959, The geology of the Upper Mississippi Valley zinc-lead district: U.S. Geological Survey, Professional Paper 309, 310 p.
Heyl, A.V., W.A. Broughton, and W.S. West, 1978, Geology of the Upper Mis-sissippi Valley base-metal district: University of Wisconsin-Extension, Geological and Natural History Survey, Information Circular 16, 45 p.
Hubbert, M.K., and D.D. Willis, 1957, Mechanics of hydraulic fractur-ing: Transactions of AIME, v. 210, p. 153–168.
Illinois State Geological Survey (ISGS), 2000, Land cover data for Illinois: Illinois State Geological Survey, Illi-nois, Geospatial Data Clearinghouse http://www.isgs.uiuc.edu/nsdihome/webdocs/landcover/index.html (accessed June 10, 2015).
Jelatis, V., 2009, An inflammable region: Indians, Anglo-Americans, and lead mining in northwestern Illinois, 1788–1832: Illinois History Teacher, v. 15, no. 2, p. 2–10.
Kolata, D.R., and T.C. Buschbach, 1976, The Plum River Fault Zone of north-western Illinois: Illinois State Geo-logical Survey, Circular 491, 20 p.
Kolata, D.R., and W.J. Nelson, 1991, Tec-tonic history of the Illinois Basin, in M.W. Leighton, D.R. Kolata, D.F. Oltz, and J.J. Eidel, eds., Interior cratonic basins: Tulsa, Oklahoma, American Association of Petroleum Geologists, Memoir 51, p. 263–285.
McGarry, C.S., 2000, Regional fractur-ing of the Galena-Platteville aquifer in Boone and Winnebago Counties, Illinois: Geometry, connectivity and tectonic significance: University of Illinois at Urbana-Champaign, M.S. thesis, 209 p.
McWilliams, D.A., D.R. Berglund, and G.J. Endres, 2004, Soybean growth and management: Quick guide: North
Dakota State University, Publication A-1174, http://www.ag.ndsu.edu/pubs/plantsci/rowcrops/a1174/a1174.pdf (accessed June 10, 2015).
Mining History Association, 2013, His-tory of the Upper Mississippi Valley zinc-lead mining district: Canon City, Colorado, Mining History Association Annual Conference, June 6–9, 2013, Galena, Illinois, http://www.mining-historyassociation.org/GalenaHis-tory.htm (accessed June 10, 2015).
Nelson, J.W., 1995, Structural features in Illinois: Illinois State Geological Survey, Bulletin 100, 57 p.
Panno, S.V., K.C. Hackley, R.A. Locke, I.G. Krapac, B. Wimmer, A. Iran-manesh, and W.R. Kelly, 2013, For-mation waters from Cambrian-age strata, Illinois Basin, USA: Con-straints on their origin and evolu-tion based on halide composition: Geochimica et Cosmochimica Acta, v. 122, p. 184–197.
Panno, S.V., D.E. Luman, W.R. Kelly, T.H. Larson, and S.J. Taylor, 2015, Karst terrains of northwestern Illinois’ Driftless Area, Jo Daviess County: Illi-nois State Geological Survey, Circular 586.
Panno, S.V., C.P. Weibel, and W.B. Li, 1997, Karst regions of Illinois: Illinois State Geological Survey, Open File 1997-2, 42 p.
Quinlan, J.F., P.L. Smart, G.M. Schindel, E.C. Alexander Jr., A.J. Edwards, and A.R. Smith, 1991, Recommended administrative/regulatory defini-tion of karst aquifer, principles of classification of carbonate aquifers, practical evaluation of vulnerability of karst aquifers, and determination of optimum sampling frequency at springs, in Proceedings of the Third Conference on Hydrogeology, Ecol-ogy, Monitoring, and Management of Ground Water in Karst Terranes: U.S. Environmental Protection Agency and Association of Ground Water Sci-entists and Engineers, p. 573–635.
Ransom, J., 2013, Corn growth and man-agement: Quick guide: North Dakota State University, Publication A-1173,
http://www.ag.ndsu.edu/pubs/plantsci/crops/a1173.pdf (accessed June 10, 2015).
Riggs, M.H., and C.S. McGarry, 2000, Map showing thickness of Quater-nary deposits, Jo Daviess County, Illi-nois: Illinois State Geological Survey, Open File 2000-8c, 1 sheet.
Soil and Health Library, 2012, Chapter 13: Root habits of alfalfa, http://www.soilandhealth.org/01aglibrary/010139fieldcroproots/010139ch13.html (accessed June 10, 2015).
Touseull, J., and C. Rich Jr., 1980, Docu-mentation and analysis of a massive rock failure at the Bautsch Mine, Galena, IL: U.S. Bureau of Mines, Report of Investigation 8453, 49 p.
U.S. Department of Agriculture (USDA), National Agricultural Statistics Ser-vice, Research and Development Division, Geospatial Information Branch, Spatial Analysis Research Section, 2012, 2012 Illinois cropland data layer, http://www.nass.usda.gov/research/Cropland/Release/index.htm (accessed June 10, 2015).
Weibel, C.P., and S.V. Panno, 1997, Karst terrains and carbonate bed-rock of Illinois: Illinois State Geo-logical Survey, Illinois Map Series 8, 1:500,000.
White, W.B., 1988, Geomorphology and hydrology of karst terrains: New York, Oxford University Press, 464 p.
Williams, P.W., 2008, The role of the epi-karst in karst and cave hydrogeology: A review: International Journal of Speleology, v. 37, p. 1–10.
Willman, H.B., and R.R. Reynolds, 1947, Geological structure of the zinc-lead district of northwestern Illinois: Illi-nois State Geological Survey, Report of Investigation 124, 15 p.
Willman, H.B., R.R. Reynolds, and P. Herbert, 1946, Geological aspects of prospecting and areas for prospecting in the zinc-lead district of northwest-ern Illinois: Illinois State Geological Survey, Report of Investigation 116, 48 p.


Illinois State Geological Survey Circular 589 23
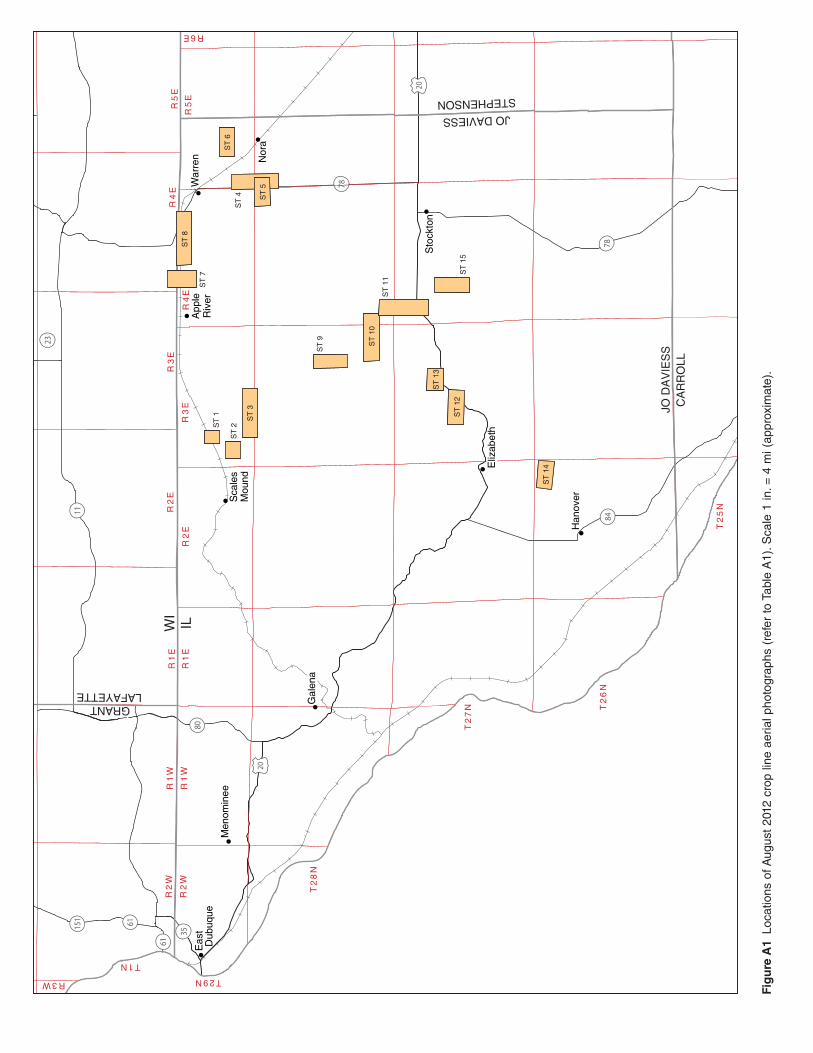
APPENDIX: REMOTE SENSING DATA RESOURCESThe remote sensing data resources, including the aerial photographs, veg-etated crop line features, LiDAR shaded relief images, sinkholes, and mine dig-ging alignments produced and used for this investigation are included with this publication as four online collections. The collections are available for view-ing and download at the following web page: http://isgs.illinois.edu/publica-tions/c589/appendix.Locations of the collections are shown in Figures A1–A4 and Tables A1–A4, and on Map 1.
Crop Line Aerial Photographs—August 2012The August crop line photographs con-tain the natural-color, vertical aerial photographs acquired by IDOT on August 28, 2012, as a reconnaissance mission for this study to record veg-etated crop lines for 15 selected project areas within Jo Daviess County, Illinois. Figure A1 shows the location of each of the 15 flight lines or strips (ST) of aerial photographs on a regional map of the study area, and Table A1 is a listing of the groups of aerial photographs by strip identification number and township–range.
The film-based aerial photography was acquired using a 9 × 9 in. format Wild aerial camera, and the original film was digitized for each 9 × 9 in. frame by using a high-precision Leica aerial film scanning system at 2,032 dpi to produce full-resolution, archival TIFF images (approximately 1 gigabyte per image). The online collection contains 58 individual frames selected from the original 104 aerial photographs, each of which illustrates vegetated crop lines. To reduce the file size for the online collec-tion, high-quality 300-dpi JPEG images were produced from each archival TIFF. The full-resolution TIFF images are available on request.
Although acquired in a vertical orienta-tion, the digitized aerial photographs have not been georeferenced or ortho-rectified by using ground control; there-
fore, the vegetated crop lines visible in each of the aerial photographs were not digitized. Although the images are not georeferenced, each is oriented north-up to facilitate interpretation.
Crop Line Aerial Photographs—September 2012The September crop line photographs contain the vertical aerial photographs (September 27, 2012, acquisition date) captured from Google Earth (https://www.google.com/earth/) using the Shape2Earth (http://shape2earthengine.com/shape2earth/Home.html) image capture program, which preserves the georeferencing information for the pur-pose of facilitating GIS and mapping analyses. Figure A2 shows their location on a regional map of the study area, and Table A2 is a listing of the aerial pho-tographs by identification number and township–range.
The vegetated crop lines exhibited on each of the 128 aerial photographs were digitized by using ArcGIS (http://www.arcgis.com/), and the resulting database of 17,855 vegetated crop lines served as the basis for the fracture and crevice analyses.
The Shape2Earth program captured vertical aerial photographs, and the vegetated crop line features were exported directly from the original GIS project database to create layered PDFs. By selecting the Layers naviga-tion panel in Adobe Acrobat Reader or Acrobat Professional (View>Navigation Panels>Layers), the user can toggle on or off the data layer features to view the vegetated crop line features and the original aerial photograph separately. The original ArcGIS file geodatabase containing the georeferenced aerial photographs and digitized crop line fea-tures is available on request.
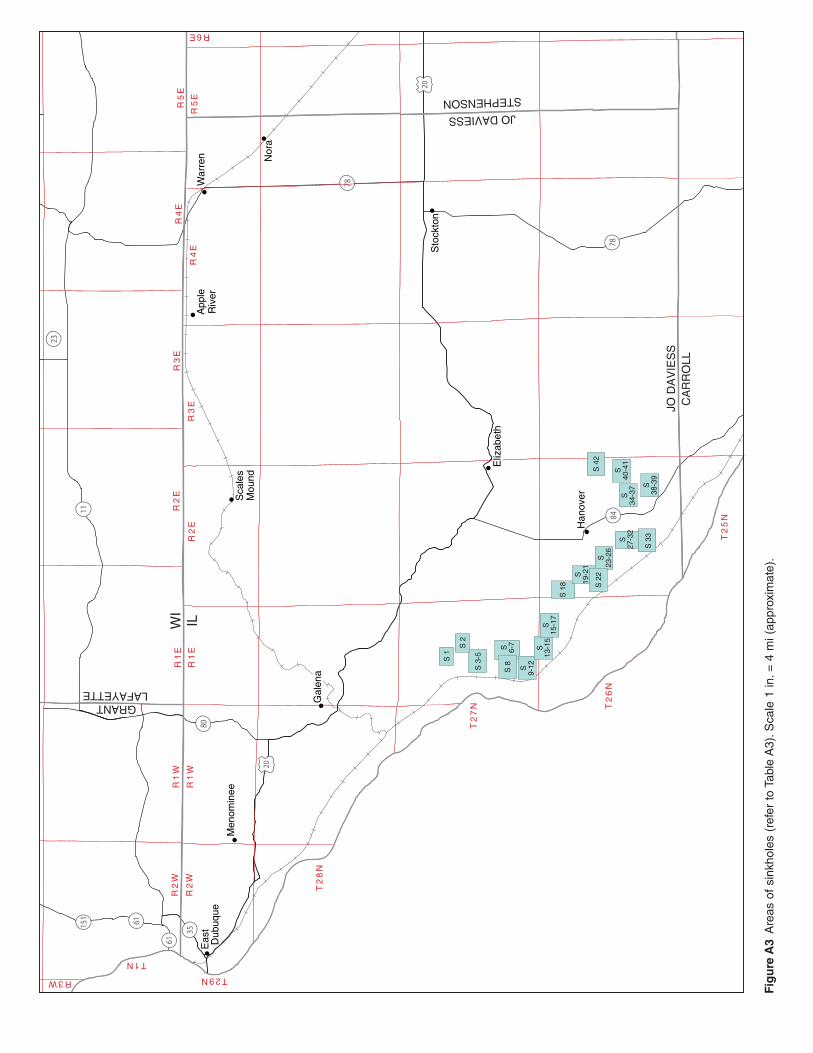
SinkholesThe sinkhole photographs contain shaded relief images produced from
2008 bare-earth LiDAR for 42 areas within Jo Daviess County that illustrate alignments of sinkhole features. The alignments interpreted directly from the LiDAR data were digitized by using ArcGIS. Figure A3 shows their location on a regional map of the study area, and Table A3 is a listing of the sinkhole areas by identification number and township–range. The LiDAR shaded relief images and digitized sinkhole alignments were exported directly from the original GIS project database to create layered PDFs. By selecting the Layers naviga-tion panel in Adobe Acrobat Reader or Acrobat Professional (View>Navigation Panels>Layers), the user can toggle on or off the data layer features to view the sinkhole alignments and the LiDAR shaded relief image separately. The orig-inal ArcGIS file geodatabase containing the LiDAR images and sinkhole align-ments is available on request.
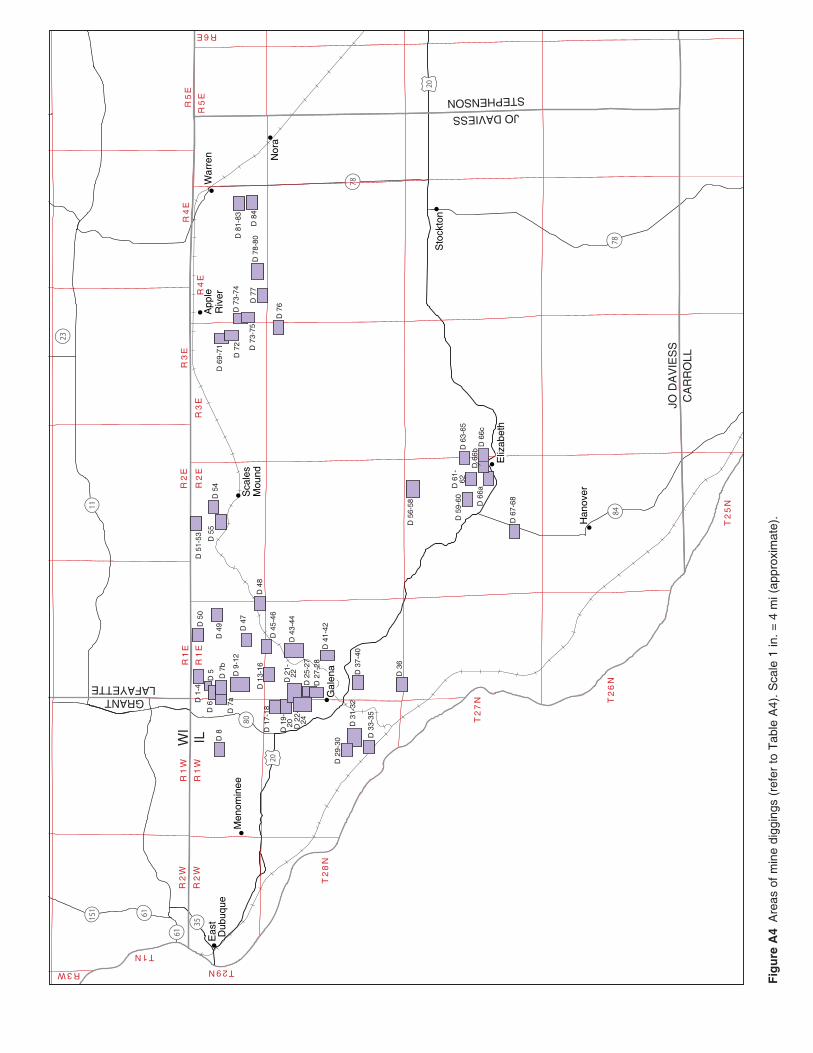
Mine DiggingsPhotographs of the mine diggings con-tain shaded relief images produced from 2008 bare-earth LiDAR for 84 areas within Jo Daviess County that illustrate alignments of lead-zinc mine diggings. The alignments interpreted directly from the LiDAR data were digitized by using ArcGIS. Figure A4 shows the mine digging locations on a regional map of the study area, and Table A4 is a listing of the mine digging areas by identification number and township–range. The LiDAR shaded relief images and digitized mine digging alignments were exported directly from the original GIS project database to create layered PDFs. By selecting the Layers naviga-tion panel in Adobe Acrobat Reader or Acrobat Professional (View>Navigation Panels>Layers), the user can toggle on or off the data layer features to view the mine digging alignments and the LiDAR shaded relief image separately. The orig-inal ArcGIS file geodatabase containing the LiDAR images and mine digging alignments is available on request.
61
61
35
151
80
11
23
78
7884
20
20
ST
3
ST
1
ST
2
ST
9
ST
7
ST
8
ST
6S
T 4 ST
5
ST
11
ST
15
ST
13
ST
12
ST
14
ST
10
WI
IL
GRANTLAFAYETTE
STEPHENSONJO DAVIESS
JO D
AV
IES
SC
AR
RO
LL
T2
8N
T2
7N T
26
N
T2
5N
T29N
R2
WR
1W
R1
ER
2E
R3
ER
4E
R5
E
R6E
R2
WR
1W
R1
ER
2E
R3
ER
4E
R5
E
T1N
R3W
!
!
!
!
!
!
!
!
!
!A
pple
Riv
erE
ast
Dub
uque
Eliz
abet
h
Gal
ena
Han
over
Men
omin
ee
Nor
a
Sca
les
Mou
nd
Sto
ckto
n
War
ren
Fig
ure
A1 Locations o
f A
ugust
2012 c
rop lin
e a
eri
al p
hoto
gra
phs (
refe
r to
Table
A1). S
cale
1 in. =
4 m
i (a
ppro
xim
ate
).

Fig
ure
A2
Loca
tions
of
Sep
tem
ber
2012
cro
p lin
e ae
rial p
hoto
grap
hs (
refe
r to
Tab
le A
2).
Sca
le 1
in.
= 4
mi (
appr
oxim
ate)
.
61
61
35
151
80
11
23
78
7884
20
20
CL
18
CL
17
CL
16C
L 15
CL
19
CL
20
CL
11
CL
156
CL
12
CL
9C
L 10 CL
8C
L 7
CL
14
CL
32
CL
30C
L 31
CL
90C
L 85
CL
91
CL
144
CL
146
CL
143
CL
145
CL
96
CL
95
CL
94
CL
141
CL
93
CL
99C
L 98
CL
92C
L10
4
CL
101
CL
106
CL
103
CL
100
CL
102
CL
36
CL
38C
L 41
CL
40
CL
39
CL
155
CL
44
CL
153
CL
154
CL
157
CL
67
CL
45C
L 49
CL
48C
L 46
CL
47
CL
50
CL
51 CL
52
CL
55
CL
54C
L69
CL
63
CL
64
CL
62C
L 65
CL
58C
L59
CL
53
CL
60C
L 61
CL
70 CL
134
CL
81C
L 82
CL
83
CL
84
CL
124
CL
123
CL
125
CL
126
CL
128
CL
127
CL
129
CL
130
CL
131
CL
133
CL
132
CL
107
CL
108
CL
109
CL
110
CL
112
CL
111
CL
158
CL
113
CL
115
CL
116
CL
117
CL
137 CL
118 CL
119
CL
76
CL
78
CL
74C
L 71
CL
72C
L 73
CL
77C
L 75
CL
136
CL
120
CL
121 CL
122
CL
79
CL
135
CL
27
CL
34C
L 26
CL
25
CL
147
CL
148
CL
149
CL
150
CL
151
CL
1C
L 22
CL
24
CL
23C
L 5
WI
IL
GRANTLAFAYETTE
STEPHENSONJO DAVIESS
JO D
AV
IES
SC
AR
RO
LL
T2
8N
T2
7N T
26
N
T2
5N
T29N
R2
WR
1W
R1
ER
2E
R3
ER
4E
R5
E
R6E
R2
WR
1W
R1
ER
2E
R3
ER
4E
R5
E
T1N
R3W
!
!
!
!
!
!
!
!
!
!A
pple
Riv
erE
ast
Dub
uque
Eliz
abet
h
Gal
ena
Han
over
Men
omin
ee
Nor
a
Sca
les
Mou
nd
Sto
ckto
n
War
ren
61
61
35
151
80
11
23
78
7884
20
20
S 1
S 2
S 3
-5
S 6-7
S 8 S
9-12
S13
-15
S15
-17
S 1
8
S19
-21
S 2
2S
23-2
6
S27
-32
S 3
3S
38-3
9
S34
-37
S40
-41
S 4
2
WI
IL
GRANTLAFAYETTE
STEPHENSONJO DAVIESS
JO D
AV
IES
SC
AR
RO
LL
T2
8N
T2
7N T
26
N
T2
5N
T29N
R2
WR
1W
R1
ER
2E
R3
ER
4E
R5
E
R6E
R2
WR
1W
R1
ER
2E
R3
ER
4E
R5
E
T1N
R3W
!
!
!
!
!
!
!
!
!
!A
pple
Riv
erE
ast
Dub
uque
Eliz
abet
h
Gal
ena
Han
over
Men
omin
ee
Nor
a
Sca
les
Mou
nd
Sto
ckto
n
War
ren
Fig
ure
A3 A
reas o
f sin
khole
s (
refe
r to
Table
A3). S
ca
le 1
in. =
4 m
i (a
ppro
xim
ate
).
Fig
ure
A4
Are
as o
f m
ine
digg
ings
(re
fer
to T
able
A4)
. S
cale
1 in
. =
4 m
i (ap
prox
imat
e).
61
61
35
151
80
11
23
78
7884
20
20
WI
IL
GRANTLAFAYETTE
STEPHENSONJO DAVIESS
JO D
AV
IES
SC
AR
RO
LL
T2
8N
T2
7N T
26
N
T2
5N
T29N
R2
WR
1W
R1
ER
2E
R3
ER
4E
R5
E
R6E
R2
WR
1W
R1
ER
2E
R3
ER
4E
R5
E
T1N
R3W
!
!
!
!
!
!
!
!
!
!A
pple
Riv
erE
ast
Dub
uque
Eliz
abet
h
Gal
ena
Han
over
Men
omin
ee
Nor
a
Sca
les
Mou
nd
Sto
ckto
n
War
ren
D 5
0
D 4
9
D 1
-4
D 7
bD
7a
D 6
D 8
D 5 D
9-1
2D
47
D 4
8
D 5
1-53 D
55
D 5
4D
69-
71
D 7
2 D 7
3-75
D 7
3-74
D 7
6D 7
7D
78-
80
D 8
1-83
D 8
4
D 4
5-46
D 4
3-44
D 4
1-42
D 1
7-18
D 1
3-16
D 1
9-20 D 2
2-24
D 2
1-22
D 2
5-27
D 2
7-28
D 3
7-40
D 3
6
D 6
7-68
D 5
9-60
D 5
6-58
D 6
1-62
D 6
6cD
66a
D 6
6b
D 6
3-65
D 2
9-30
D 3
1-32
D 3
3-35

28 Circular 589 Illinois State Geological Survey
Table A1 Listing of August 2012
crop line aerial photographs by
township–range location1
ID Township Range
ST 1 T29N R3E
ST 2 T29N R3E
ST 3 T28–29N R3E
ST 4 T28–29N R4–5E
ST 5 T28–29N R4–5E
ST 6 T29N R5E
ST 7 T29N R4E
ST 8 T29N R4E
ST 9 T28N R3E
ST 10 T28N R3–4E
ST 11 T27–28N R4E
ST 12 T27N R3E
ST 13 T27N R3E
ST 14 T26N R2E
ST 15 T27N R4E
1Refer to Figure A1.
Table A2 Listing of September 2012 crop line aerial photographs by township–range location1
ID Township Range ID Township Range ID Township Range
CL 1 T29N R4E CL 61 T27N R3E CL 116 T27N R2–3E
CL 5 T29N R4E CL 62 T27N R4E CL 117 T27N R2–3E
CL 7 T28N R4–5E CL 63 T27N R4E CL 118 T27N R2E
CL 8 T28N R4–5E CL 64 T27N R4E CL 119 T27N R2E
CL 9 T29N R4–5E CL 65 T27N R4E CL 120 T27N R2E
CL 10 T29N R4–5E CL 67 T27N R5–6E CL 121 T27N R2E
CL 11 T29N R5E CL 69 T27N R4E CL 122 T27N R2E
CL 12 T29N R5E CL 70 T27N R3E CL 123 T26N R3–4E
CL 14 T29N R5E CL 71 T27N R3E CL 124 T26N R4E
CL 15 T1N R5E CL 72 T27N R3E CL 125 T26N R3–4E
CL 16 T1N R5E CL 73 T27N R3E CL 126 T26N R3–4E
CL 17 T1N R5E CL 74 T27N R3E CL 127 T26N R3–4E
CL 18 T1N R5E CL 75 T27N R3E CL 128 T26N R3–4E
CL 19 T1N R4E CL 76 T27N R3E CL 129 T26N R4E
CL 20 T1N R4E CL 77 T27N R3E CL 130 T25–26N R5E
CL 22 T29N R4E CL 78 T27N R3E CL 131 T25N R5E
CL 23 T29N R4E CL 79 T26N R2E CL 132 T25–26N R5E
CL 24 T29N R4E CL 81 T26N R3E CL 133 T25N R5E
CL 25 T1N R4E CL 82 T26N R3E CL 134 T27N R3E
CL 26 T1N R4E CL 83 T26N R3E CL 135 T27N R2E
CL 27 T1N R3E CL 84 T26N R3E CL 136 T27N R2E
CL 30 T1N R3E CL 85 T1N R1E CL 137 T27N R2E
CL 31 T1N R2E CL 90 T1N R1E CL 141 T29N R2E
CL 32 T1N R3E CL 91 T1 & 29N R1–2E CL 143 T1 & 29N R2E
CL 34 T1N R3E CL 92 T28–29N R2E CL 144 T1 & 29N R2E
CL 36 T29N R3E CL 93 T29N R2E CL 145 T29N R2E
CL 38 T29N R3E CL 94 T29N R2E CL 146 T29N R2E
CL 39 T28–29N R3E CL 95 T29N R2E CL 147 T29N R3E
CL 40 T29N R3E CL 96 T29N R2E CL 148 T29N R3E
CL 41 T29N R3E CL 98 T28N R2E CL 149 T29N R4E
CL 44 T28N R4E CL 99 T28N R2E CL 150 T29N R4E
CL 45 T28N R4E CL 100 T28N R1–2E CL 151 T29N R4E
CL 46 T28N R3–4E CL 101 T28N R1–2E CL 153 T28N R4E
CL 47 T28N R3–4E CL 102 T28–29N R1–2E CL 154 T28N R3–4E
CL 48 T28N R3E CL 103 T28N R1–2E CL 155 T28–29N R3E
CL 49 T28N R3E CL 104 T28–29N R2E CL 156 T29N R5E
CL 50 T27N R4E CL 106 T28N R2E CL 157 T28N R4E
CL 51 T27N R4E CL 107 T28N R2E CL 158 T27N R3E
CL 52 T27N R4E CL 108 T28N R2E
CL 53 T27N R4E CL 109 T28N R2E
CL 54 T27N R4E CL 110 T28N R2E
CL 55 T27N R4E CL 111 T28N R2–3E
CL 58 T27N R4E CL 112 T28N R3E
CL 59 T27N R3–4E CL 113 T27N R2E
CL 60 T27N R3–4E CL 115 T27N R2E
1Refer to Figure A2.

Illinois State Geological Survey Circular 589 29
Table A3 Listing of sinkholes by
township–range location1
ID Township Range
S 1 T27N R1E
S 2 T27N R1E
S 3–5 T27N R1E
S 6–7 T27N R1E
S 8 T27N R1E
S 9–12 T27N R1E
S 13–15 T26–27N R1E
S 15–17 T26N R1E
S 18 T26N R1–2E
S 19–21 T26N R2E
S 22 T26N R2E
S 23–26 T26N R2E
S 27–32 T26N R2E
S 33 T26N R2E
S 34–37 T26N R2E
S 38–39 T26N R2E
S 40–41 T26N R2E
S 42 T26N R2–3E
1Refer to Figure A3.
Table A4 Listing of mine diggings by
township–range location1
ID Township Range
D 1–4 T29N R1E
D 5 T29N R1E
D 6 T29N R1W–1E
D 7a T29N R1W–1E
D 7b T29N R1E
D 8 T29N R1W
D 9–12 T29N R1E
D 13–16 T28–29N R1E
D 17–18 T28N R1W
D 19–20 T28N R1W–1E
D 21–22 T28N R1W–1E
D 22–24 T28N R1 W–1E
D 25–27 T28N R1E
D 27–28 T28N R1E
D 29–30 T28N R1W
D 31–32 T28N R1W
D 33–35 T28N R1W
D 36 T27–29N R1E
D 37–40 T28N R1E
D 41–42 T28N R1E
D 43–44 T28N R1E
D 45–46 T28–29N R1E
D 47 T29N R1E
D 48 T28–29N R1–2E
D 49 T29N R1E
D 50 T29N R1E
D 51–53 T29N R2E
D 54 T29N R2E
D 55 T29N R2E
D 56–58 T27N R2E
D 59–60 T27N R2E
D 61–62 T27N R2E
D 63–65 T27N R2–3E
D 66a–c T27N R2–3E
D 67–68 T27N R2E
D 69–71 T29N R3E
D 72 T29N R3E
D 73–74 T29N R3–4E
D 73–75 T29N R3–4E
D 76 T28N R3–4E
D 77 T28–29N R4E
D 78–80 T29N R4E
D 81–83 T29N R4E
D 84 T29N R4E
1Refer to Figure A4.