Embed Size (px)
Citation preview
Characterization of interfacial integrity and its implication on mechanical behavior of
FRP composites
A thesis submitted in partial fulfillment of the requirement for the
degree of
Master of technology
In
Metallurgical and Materials Engineering
By
Sanghamitra Sethi
Department of Metallurgical and Material Engineering
National Institute Of Technology, Rourkela
Rourkela-769008
2010

Characterization of interfacial integrity and its implication on mechanical behavior of FRP
composites
A thesis submitted in partial fulfillment of the requirements for the degree of
Master of Technology
In Metallurgical and Materials Engineering
By Sanghamitra Sethi
Under the guidance and supervision of
Prof. B.C. Ray Department of Metallurgical and Materials Engineering
Department of Metallurgical and Materials Engineering
National institute of technology, Rourkela
Rourkela-769008
2010
National Institute of Technology
Rourkela CERTIFICATE
This is to certify that the thesis entitled, “characterization of interfacial integrity and
its implication on mechanical behavior of FRP composites” submitted by Ms
Sanghamitra Sethi in partial fulfillment of the requirements for the award of Master of
Technology Degree in Metallurgical and Materials Engineering at the National
Institute of Technology, Rourkela (Deemed University) is an authentic work carried out
by her under my supervision and guidance.
To the best of my knowledge, the matter embodied in the thesis has not been submitted to
any other University / Institute for the award of any Degree or Diploma.
Date-
Prof. B.C. Ray
Dept. of Metallurgical and Materials Engg.
National Institute of Technology
Rourkela – 769008
Acknowledgement I avail this opportunity to extend my hearty indebtedness to my guide Prof. B.C. Ray,
Metallurgical and Materials Engineering for their valuable guidance constant
encouragement and kind help at different stages for the execution of this dissertation
work.
My sincere thanks to Dr. S. K. Sarangi, Director and Prof. B.B. Verma, Head of the
Metallurgical And Materials Engineering Department, National Institute of Technology
Rourkela, for his advice and providing necessary facility for my work.
I am also very thankful towards Prof. S. K. Sen, M. Tech. coordinator, for his constant
concern and encouragement for execution of this work.
I am also thankful to Mr. R. Patnaik, Mr. Sameer Pradhan, Metallurgical & Materials
Engineering, Technical assistants, for their help during the execution of experiment.
Special thanks to my friends and other members of the department for being so
supportive and helpful in every possible way.
Finally yet importantly, I would like to thank my parents, who taught me the value of hard
work by their own example. I would like to share this moment of happiness with my
parents.
They rendered me enormous support during the whole tenure of my stay in NIT Rourkela.
List of figures
1. Composite in Aerospace
2. Composite in automotive industry
3. Composite for chemical resistance and infrastructure application
4. Stree-strain FRP composite
5. Tensile load applied to a composite body
6. Compression load applied to a composite body
7. Shear load applied to a composite body
8. Loading due to epoxy resin with primary amines
9. Curing of epoxy resin with primary amines
10. Different types of reinforcement
11. Polyhedral network of glass fiber
12. Skin –core organization of carbon-fiber
13. Fiber-matrix interface
14. Function of coupling agent
15. Fiber-matrix adhesion
16. Schematic view of free volume in polymer
17. Diffusion process of polymer
18. Interfacial free-volume
19. Model crack –fiber interaction is aimple composite
20. Arrangement of FTIR Spectroscopy
21. TMDSC SET-UP
22. AFM
23. TMDSC analyser
24. Instron 1195
25. FTIR spectrum of glass/epoxy micro-composite at ambient temperature
26. For carbon-epoxy micro-composite
27. Carbon-epoxy after hygrothermal treatment
28. Glass/epoxy after hygrothermal treatment
29. Glass/epoxy after 10 hr
32. Tg variation in hygrothermal treatment
33. Tg curve for carbon/epoxy
34. Tg curve for glass/epoxy
35. Height image of hybrid composite
36. Swelling stress at the interface region
37. Fiber/matrix debonding
38. Fiber fracture
39. Thermal spike at 150◦C
40. Thermal spike at 200◦ C
41. Variation of ILSS value after up-thermal shock treatment
42. Variation of ILSS value after down-thermal shock treatment.

List of tables 1. Composite components used in aerospace
2. Reinforcement used in aerospce
3. Three different IR region
4.Organic compound with different wave number
CONTENTS Page No.
Certificate
Acknowledgement
List of figures
List of tables
Abstract
CHAPTER 1
Introduction
1.1 Background ……………………………………1-3
1.2 Application …………………………………….3-13
1.3 Fibrous composite………………………………13-16
CHAPTER 2
Literature survey
2.1 Interface and interphase………………………………18-20
2.2 Chemical Aspects of interface region…………………20-21
2.3 Mechanical Aspects of interface region………………22-24
2.4 Fiber/Matrix adhesion……………………………….25-26
2.5 Study of moisture ingression by determination of Tg…..26

2.7 Molecular theory of polymer…………………………….27
2.8 Free volume theory………………………………………28
2.9 Free volume theory and Tg………………………………29
2.10 Degree of crosslinking and its impact………………….29
2.11 Assessment of Engineered interface…………………..29-30
2.12 Assessment of mechanical behavior (implication of thermal shock and
thermal spike)
Chapter -3
Techniques
3.1 A Fourier transform infrared spectroscopy (FTIR-Imaging)
Basic principle…………………………………………..31-32
IR frequency range and spectrum presentation…………32-35
3.1 B ATR-FTIR……………………………………………….35-36
Basic Principle
3.2 C Temperature Modulated Differential …………………….36-37
Scanning Calorimetry (TMDSC)
3.3 D Atomic Force Microscopy (AFM)………………………38-39
3.4 E Scanning Electron Microscopy (SEM)…………………40-41
CHAPTER-4
RESULTS AND Discussion
4.1 Hygrothermal treatment
4.1 A Epoxy carbon,glass fiber micro-composite……………….46-48
4.1 A1 FTIR-Imaging Measurement……………………………48-50
4.1 B1 TMDSC Measurement…………………………………..51-53
4.1 C1 ATR-FTIR Measurement…………………………………53-54
4.1 D1 AFM Analysis……………………………………………55
4.1 E1 SEM Analysis……………………………………………56
4.2 Thermal treatment
4.2 A Thermal spike treatment…………………………………..57-59
4.2 B Thermal shock treatment…………………………………59-60
Conclusion………………………………………………………….61
References …………………………………………………………61-67
Abstract
Fiber reinforced composites (FRP) have been gaining much attention recently because of their use in
load carrying parts of new aircraft such as Boeing 787and in non-aerospace applications such as in ships,
in retrofitting of structurally deficient bridges, and transportation. Besides this, composite structures in
service are typically subjected to different environmental conditions, which may affect their mechanical
performance as well as their flammability potential. Water that diffuses in to the composite ends up
either in the matrix or at the interphase region. In the matrix, water would act as a plasticizer, increasing
the free volume, lowering the glass transition temperature (Tg), and relieving the internal stresses that
was built up during processing of the composite. In many cases failures occurs in the interface region due
to chemical reactions/plasticizing when impurities (commonly water) penetrate the interface. The
continuous change in interfacial chemistry and character under the influence of various environment
often leads to a micro changes such as increase of internal voids of the entangling polymer chain,
fiber/matrix interfacial bond failure and microcrack formation in to the matrix.
Recently an active area of investigation related to this work is being explored by
Temperature Modulated differential scanning calorimetry (TMDSC) and Fourier Transform Infrared
Spectroscopy(FTIR-Imaging) ,Ultraviolet spectroscopy (UV),techniques to pin down the causes for a
reduce stress transmissibility at the interface. Surface treated glass fiber, carbon fiber and epoxy matrix
were used to fabricate micro-composite. Change in FTIR spectra shows alternation and deviation of
stoichiometry.The analysis of these suggests that there is a variation in the chemical structure of the
matrix from the fiber to the polymer bulk due to different conversions arising from a gradient in the
initial composition. And in TMDSC the focus has been emphasized on Tg value which increases when
hygrothermal treatment duration is less because of formation of double hydrogen bond and replacing the
covalent bond. The increase in Tg value may often lead to the enhanced mechanical properties like
interlaminar shear strength and fatigue strength.

CHAPTER -1
BACKGROUND
INTRODUCTION
ADVANCED COMPOSITES
Chapter -1
INTRODUCTION
Background:
Composite materials are as much an engineering concept as they are a specific material. They
represent an idea which to the best of knowledge was first recognized in engineering in the composite
construction of the latter clipper ships in the middle of the nineteenth century where wooden planning
was set on iron frames. The modern term composite arose in the aircraft industry in the middle part of the
twentieth century. Its advent can be viewed either as means of using plastics in aircraft construction or as
a means of utilizing the stiffness and strength of fibers which were first made in the late 1950s and early
1960s. . The reinforcement of metals through leading to much smaller market sizes than polymer matrix
composites has played an important part in the development of the field of composite material generally.
In the years after world war II, although the advantages of a composite material were well known to
some people, metal dominated the construction market, particularly for aerospace and defence which are
often the drivers of new development work at NASA initially intended.
The development of composite materials as an engineering concept and its realization has advanced
at the same time as the development of other engineering material.
METAL –MATRIX COMPOSITES
As the name implies, for metal-matrix composites (MMCs) the matrix is a ductile material. This material
may be utilized at higher service temperatures than their base metal counterparts; furthermore, the
reinforcement may improve specific stiffness, specific strength, abrasion resistance, creep resistance,
thermal conductivity, and dimensional stability. Some of the advantages of these materials over the
polymer-matrix composites include higher operating temperatures, non-flammability, and greater
resistance to degradation by organic fluids. Some matrix-reinforcement combinations are highly reactive
at elevated temperature. Consequently; composite degradation may be caused by high-temperature
processing or by subjecting the MMC to elevated temperature during service. This problem is commonly
resolved either by applying a protective surface coating to the reinforcement or by modifying the matrix
alloy composition.
The aerospace industry uses MMCs, structural applications include advanced Al alloy metal-matrix
composites, boron fibers are used as the reinforcement for the space shuttle Orbiter, and continuous
graphite fibers for the Hubble Telescope.
FIBROUS COMPOSITE:
Composite materials provide stiff, light weight materials of high corrosion resistance, excellent fatigue
resistance and may be electrically conducting provided they can be fashioned to shape at acceptable cost
there are many applications emerging. They are gaining ground in civil engineering, where the light
weight and excellent corrosion resistance makes them the preferred materials for repair of the
transportation infrastructure, bridges, roads, tunnels.
A composite, in general, is defined as a combination of two or more components differing two or
more distinct phases having recognizable interface between them. The interfaces and interphases
between different components in the composite, which is the boundary surface with a discontinuity, have
a vital importance in determining the structural properties of the composite. The interfaces and
interphases are expected to be proper, i.e. the interaction and adhesion between the components should
be at the optimum level in order to distribute the load that is borne by the composite evenly.
Polymers are mostly organic compounds based on carbon, hydrogen and other nonmetallic elements.
PMC, are the most developed composite group and they have found widespread applications. This is
easily fabricated into any large complex shape, which is an advantage. PMC (also called reinforced
plastics) are, in general, a synergistic combination of high performance fibers and matrices. In these
systems, the fiber provided the high strength and moduli while the polymer matrix spreads the load and
helps resistance to weathering and to corrosion. Thus in PMC, strength is almost directly proportional to
the basic fiber strength and it can be further improved at the expense of stiffness. Optimization of
stiffness and fiber strength is still one of the unresolved main objectives and is under serious
consideration.
In some cases, mainly due to the differences in flexibilities between reinforcing fibers intra and inter
fibrillar amorphous zones, severe shear stresses can result in the system, eventually leading to a fatigue
crack.

APPLICATION
Composites are the 21st century material to meet the stringent demand of light weight, high strength,
corrosion resistance and near-net shapes. Although composites were known to mankind since prehistoric
times, the concept and technology have undergone a sea change with better understanding the basics like
bonding mechanism between the matrix and fiber.
Modern composites constituents an important class of design and weight efficient structural material that
are encroaching every sphere of engineering applications.
Superior directional properties, high specific strength and stiffness properties, design tailoring ease of
manufacturing complex shapes as well scores of other attributes make these materials ideally designers’
choice[1].
Composite materials and aerospace construction
Fig 1; composite in aerospace
Composite components in Aircraft
Aeronautical constructors have been looking for light weight and robustness from composites since the
earlier times.Currently a large variety of composite components are used in aircrafts. Following the more
or less important role that composites play to assure the integrity of the aircraft, one can cite the
following:
TABLE 1:
Structure components Control components Exterior components Interior components
Wing box Ailerons Fairings Floors
Empennage box Highlift devices Karmans Partitions,buckhead
Characteristics of composites
One can indicate the qualities and weak points of the principal composites used. These serve to justify
their use in the corresponding components [2].
TABLE 2:
Components Pluses Minuses
Glass/epoxy,
Kevlar/epoxy
Fairings,
Leading edges
High rupture strength,
Good fatigue
resistance
High elastic
elongation
Maximum
temperature 80 °C
Carbon/epoxy Wing box, fuselage High rupture
resistance
No dilation until 600
°C
More delicate
fabrication,
Material susceptible
to lightening.
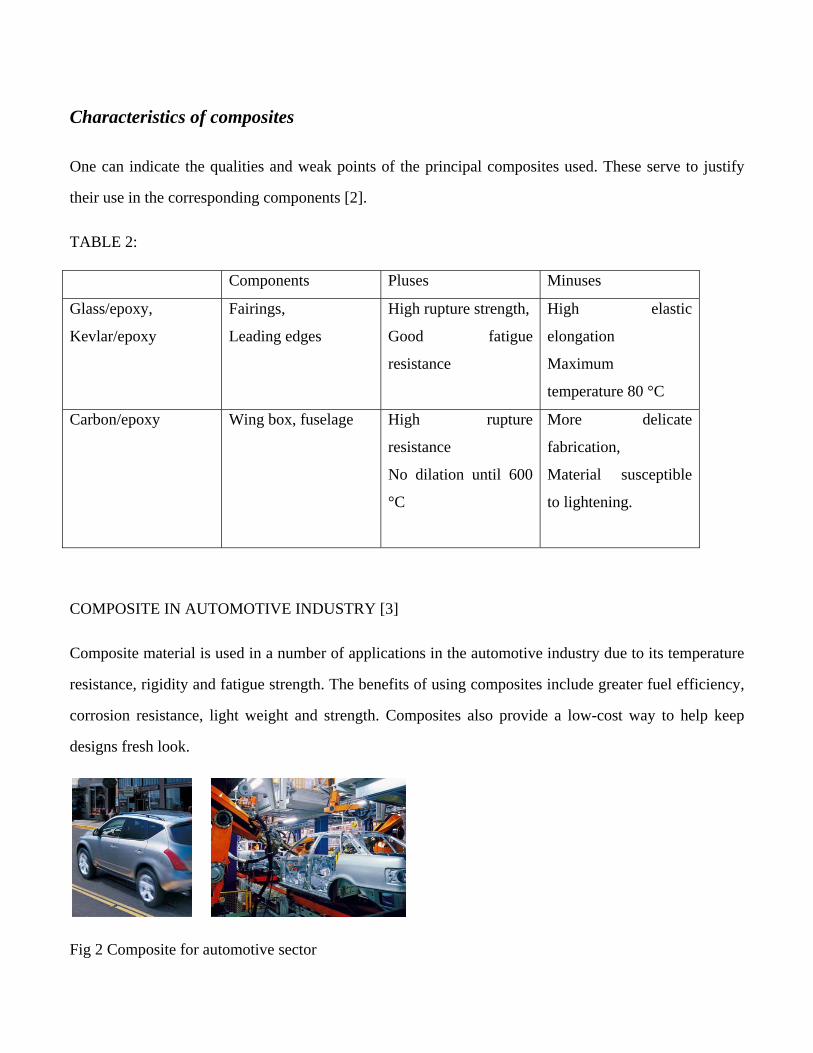
COMPOSITE IN AUTOMOTIVE INDUSTRY [3]
Composite material is used in a number of applications in the automotive industry due to its temperature
resistance, rigidity and fatigue strength. The benefits of using composites include greater fuel efficiency,
corrosion resistance, light weight and strength. Composites also provide a low-cost way to help keep
designs fresh look.
Fig 2 Composite for automotive sector
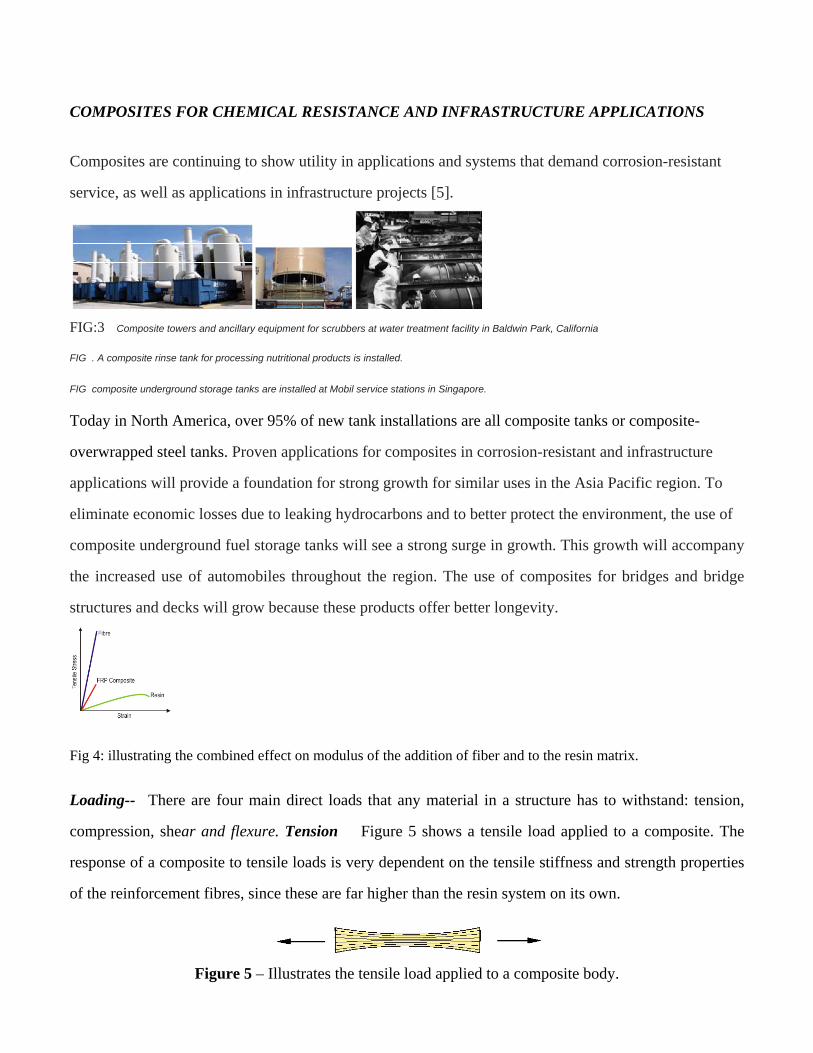
COMPOSITES FOR CHEMICAL RESISTANCE AND INFRASTRUCTURE APPLICATIONS
Composites are continuing to show utility in applications and systems that demand corrosion-resistant
service, as well as applications in infrastructure projects [5].
FIG:3 Composite towers and ancillary equipment for scrubbers at water treatment facility in Baldwin Park, California
FIG . A composite rinse tank for processing nutritional products is installed.
FIG composite underground storage tanks are installed at Mobil service stations in Singapore.
Today in North America, over 95% of new tank installations are all composite tanks or composite-
overwrapped steel tanks. Proven applications for composites in corrosion-resistant and infrastructure
applications will provide a foundation for strong growth for similar uses in the Asia Pacific region. To
eliminate economic losses due to leaking hydrocarbons and to better protect the environment, the use of
composite underground fuel storage tanks will see a strong surge in growth. This growth will accompany
the increased use of automobiles throughout the region. The use of composites for bridges and bridge
structures and decks will grow because these products offer better longevity.
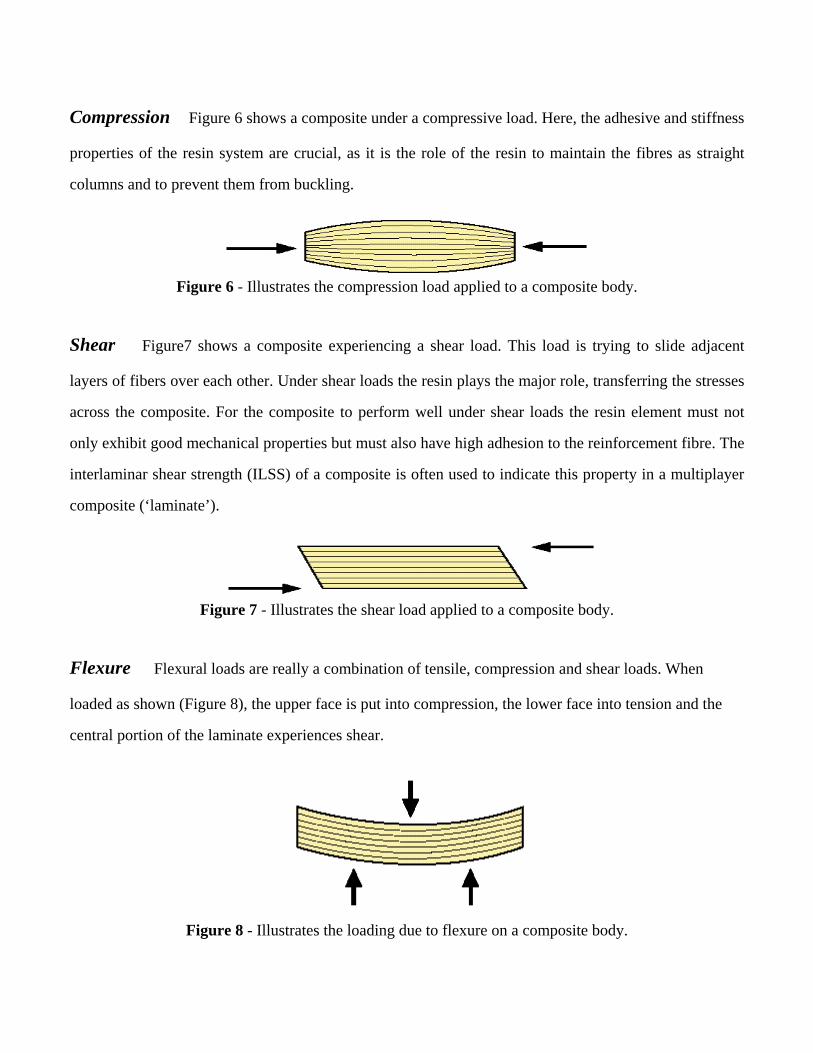
Fig 4: illustrating the combined effect on modulus of the addition of fiber and to the resin matrix.
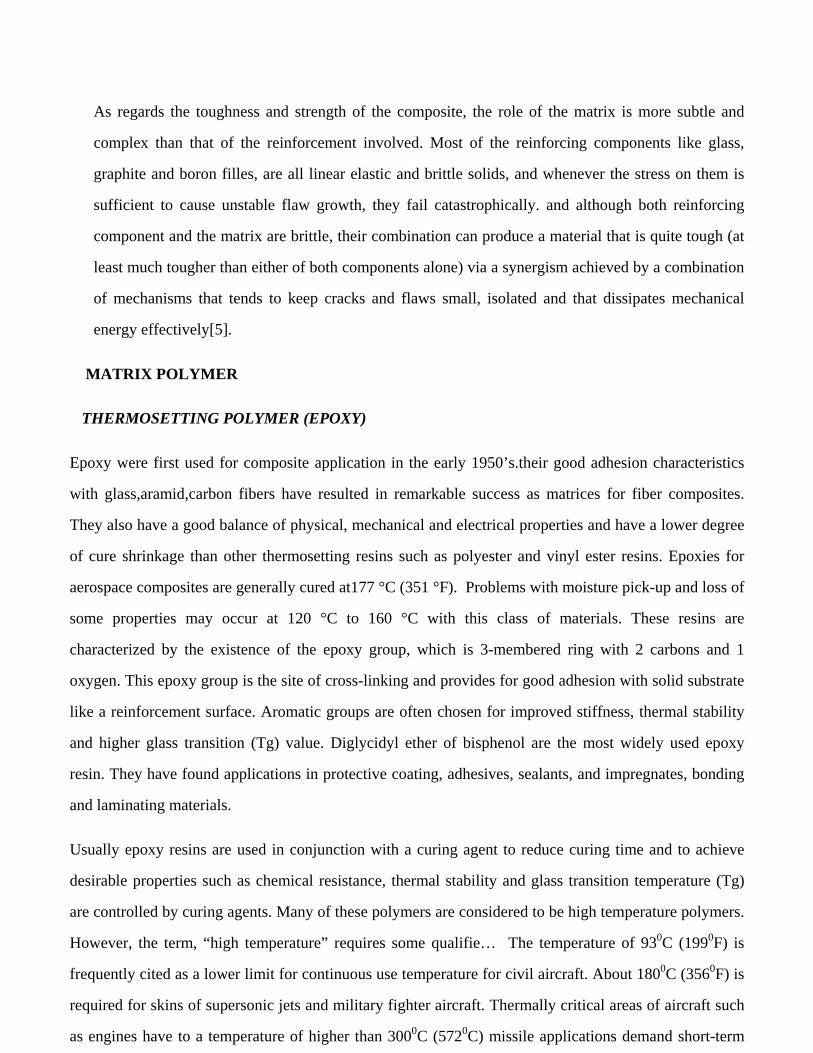
Loading-- There are four main direct loads that any material in a structure has to withstand: tension,
compression, shear and flexure. Tension Figure 5 shows a tensile load applied to a composite. The
response of a composite to tensile loads is very dependent on the tensile stiffness and strength properties
of the reinforcement fibres, since these are far higher than the resin system on its own.
Figure 5 – Illustrates the tensile load applied to a composite body.
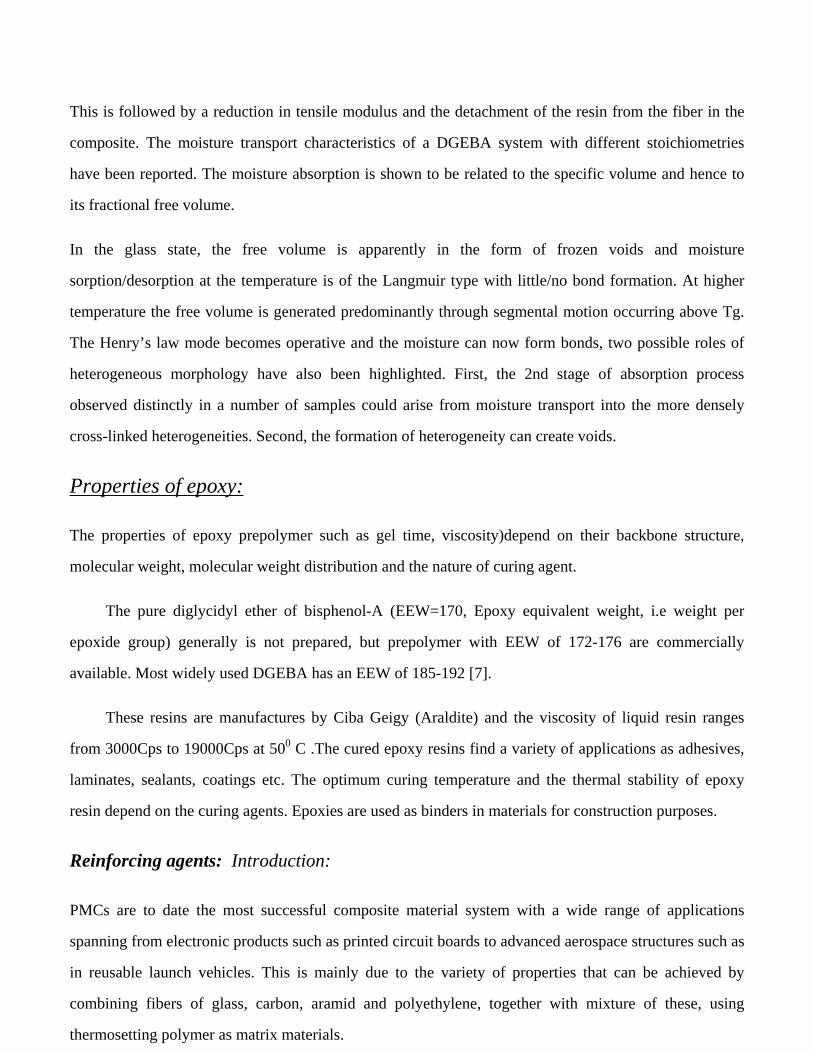
Compression Figure 6 shows a composite under a compressive load. Here, the adhesive and stiffness
properties of the resin system are crucial, as it is the role of the resin to maintain the fibres as straight
columns and to prevent them from buckling.
Figure 6 - Illustrates the compression load applied to a composite body.
Shear Figure7 shows a composite experiencing a shear load. This load is trying to slide adjacent
layers of fibers over each other. Under shear loads the resin plays the major role, transferring the stresses
across the composite. For the composite to perform well under shear loads the resin element must not
only exhibit good mechanical properties but must also have high adhesion to the reinforcement fibre. The
interlaminar shear strength (ILSS) of a composite is often used to indicate this property in a multiplayer
composite (‘laminate’).
Figure 7 - Illustrates the shear load applied to a composite body.
Flexure Flexural loads are really a combination of tensile, compression and shear loads. When
loaded as shown (Figure 8), the upper face is put into compression, the lower face into tension and the
central portion of the laminate experiences shear.
Figure 8 - Illustrates the loading due to flexure on a composite body.

Comparison with Other Structural Materials
Due to the factors described above, there is a very large range of mechanical properties that can be
achieved with composite materials. Even when considering one fibre type on its own, the composite
properties can vary by a factor of 10 with the range of fibre contents and orientations that are commonly
achieved. The comparisons that follow therefore show a range of mechanical properties for the
composite materials. The lowest properties for each material are associated with simple manufacturing
processes and material forms (e.g. spray lay-up glass fibre), and the higher properties are associated with
higher technology manufacture (e.g. autoclave molding of unidirectional glass fibre prepreg), such as
would be found in the aerospace industry.
Composites verses Traditional Materials
A judicious selection of fiber,matrix,and interface conditions can lead to a composite with a combination
of strength and modulus comparable to or better than those of many conventional metallic material.
Composites are superior to metals in specific strength and specific stiffness. Weight reduction is a key
consideration in many industries, notably automotive and aerospace. A lighter vehicle because of higher
specific properties could mean better fuel efficiency. Polymer matrix composites normally exhibit higher
corrosion resistance than metals. However, many polymer-matrix composites tend to absorb moisture
from the surrounding environment, resulting in dimensional changes as well as adverse internal stresses
within the material. Polymer-matrix composites are more advanced in the fabrication technology and are
lower in raw material cost and fabrication cost. When compared to MMCs, PMCs are lower in density.
CONSTITUENT MATERIALS:
INTRODUCTION:
The matrix usually comprises 30%-40% of composite structure. It has a number of functions:
a) It binds the components together and determines the thermo-mechanical stability of the
composite,
b) It protects the reinforcements from wear/abrasion and environment,
c) It helps to distribute the applied load by acting as a stress-transfer medium.
As regards the toughness and strength of the composite, the role of the matrix is more subtle and
complex than that of the reinforcement involved. Most of the reinforcing components like glass,
graphite and boron filles, are all linear elastic and brittle solids, and whenever the stress on them is
sufficient to cause unstable flaw growth, they fail catastrophically. and although both reinforcing
component and the matrix are brittle, their combination can produce a material that is quite tough (at
least much tougher than either of both components alone) via a synergism achieved by a combination
of mechanisms that tends to keep cracks and flaws small, isolated and that dissipates mechanical
energy effectively[5].
MATRIX POLYMER
THERMOSETTING POLYMER (EPOXY)
Epoxy were first used for composite application in the early 1950’s.their good adhesion characteristics
with glass,aramid,carbon fibers have resulted in remarkable success as matrices for fiber composites.
They also have a good balance of physical, mechanical and electrical properties and have a lower degree
of cure shrinkage than other thermosetting resins such as polyester and vinyl ester resins. Epoxies for
aerospace composites are generally cured at177 °C (351 °F). Problems with moisture pick-up and loss of
some properties may occur at 120 °C to 160 °C with this class of materials. These resins are
characterized by the existence of the epoxy group, which is 3-membered ring with 2 carbons and 1
oxygen. This epoxy group is the site of cross-linking and provides for good adhesion with solid substrate
like a reinforcement surface. Aromatic groups are often chosen for improved stiffness, thermal stability
and higher glass transition (Tg) value. Diglycidyl ether of bisphenol are the most widely used epoxy
resin. They have found applications in protective coating, adhesives, sealants, and impregnates, bonding
and laminating materials.
Usually epoxy resins are used in conjunction with a curing agent to reduce curing time and to achieve
desirable properties such as chemical resistance, thermal stability and glass transition temperature (Tg)
are controlled by curing agents. Many of these polymers are considered to be high temperature polymers.
However, the term, “high temperature” requires some qualifie… The temperature of 930C (1990F) is
frequently cited as a lower limit for continuous use temperature for civil aircraft. About 1800C (3560F) is
required for skins of supersonic jets and military fighter aircraft. Thermally critical areas of aircraft such
as engines have to a temperature of higher than 3000C (5720C) missile applications demand short-term

stability in addition to the other properties required for a specific application. The mechanical properties
of polymers normally change dramatically and reversibly near Tg/Tm (depending on the crystalline).
Even when the Tg/Tm is high, degradation such as thermal oxidation and chemicals attack can change
the properties of polymer irreversibly. The presence of aromatic groups in the main chain contributes to
high Tg value and also contributes the high tensile and shear properties. Epoxy shows good hot/wet
strength, excellent mechanical properties, dimensional stability good adhesion to a variety of
reinforcements and better moisture resistance.
Curing of epoxy resin:
The curing of epoxy resins is associated with a change in state from a low molecular weight liquid
mixture to a highly cross-linked network. The molecular mobility in the system decreases as the cure
proceeds due to cross-linking of several chains into network of infinite molecular weight. The sudden
and irreversible transformation from a viscous liquid to an elastic gel is known as gel point. Gelation
typically occurs between 55-80% conversion (degree of cure =.55-.80). beyond , the gel point, reaction
proceeds towards the formation of one infinite network with substantial increase in cross-link density,
glass transition temperature (Tg) and ultimate physical properties.
Fig: 9 The curing of epoxy resin with primary amines [7]
During the curing of epoxy resin by multifunctional amines, the amino group and secondary amino
group open the oxidant ring and a hydroxyl group is produced [7].
Moisture transport:
One of the major limitations of the epoxy resin is their poor performance in wet environment there has,
therefore, been considerable interest in attempting to understand the nature of interaction of water with
epoxy resin, particularly the resins used in the fabrication of FRP. These studies have shown that water
molecules interact with specific groups within these resins. Water absorption initially plasticizes the
matrix.
This is followed by a reduction in tensile modulus and the detachment of the resin from the fiber in the
composite. The moisture transport characteristics of a DGEBA system with different stoichiometries
have been reported. The moisture absorption is shown to be related to the specific volume and hence to
its fractional free volume.
In the glass state, the free volume is apparently in the form of frozen voids and moisture
sorption/desorption at the temperature is of the Langmuir type with little/no bond formation. At higher
temperature the free volume is generated predominantly through segmental motion occurring above Tg.
The Henry’s law mode becomes operative and the moisture can now form bonds, two possible roles of
heterogeneous morphology have also been highlighted. First, the 2nd stage of absorption process
observed distinctly in a number of samples could arise from moisture transport into the more densely
cross-linked heterogeneities. Second, the formation of heterogeneity can create voids.
Properties of epoxy:
The properties of epoxy prepolymer such as gel time, viscosity)depend on their backbone structure,
molecular weight, molecular weight distribution and the nature of curing agent.
The pure diglycidyl ether of bisphenol-A (EEW=170, Epoxy equivalent weight, i.e weight per
epoxide group) generally is not prepared, but prepolymer with EEW of 172-176 are commercially
available. Most widely used DGEBA has an EEW of 185-192 [7].
These resins are manufactures by Ciba Geigy (Araldite) and the viscosity of liquid resin ranges
from 3000Cps to 19000Cps at 500 C .The cured epoxy resins find a variety of applications as adhesives,
laminates, sealants, coatings etc. The optimum curing temperature and the thermal stability of epoxy
resin depend on the curing agents. Epoxies are used as binders in materials for construction purposes.
Reinforcing agents: Introduction:
PMCs are to date the most successful composite material system with a wide range of applications
spanning from electronic products such as printed circuit boards to advanced aerospace structures such as
in reusable launch vehicles. This is mainly due to the variety of properties that can be achieved by
combining fibers of glass, carbon, aramid and polyethylene, together with mixture of these, using
thermosetting polymer as matrix materials.

FIG-10 It shows different types of reinforcement
The fiber configuration or architecture (short, long, straight, woves, braided, laminated etc.) and the fiber
surface treatment for the desired interface characteristics determine the final properties and the composite
durability [8]. The breaking strength and the stiffness of a fiber of given chemical constitution can be
understood in terms of the geometric form which often governs the strength, molecular construction and
internal structure of the fiber which governs the stiffness. The stiffness of the fiber-along its axis-can be
understood with some precision-say within 50% from knowledge of the binding forces between the
component atoms. The fibers are strong because the surface is likely to be smooth-in general the thinner
the smoother [9]. The factors controlling the strength and stiffness of fibers were recognized in the 1960s
and very stiff and strong fiber of boron and graphite were made for the 1st time. They were strong and
stiff, but also because they were made from chemical elements of low molecular weight, they are much
less dense then most metals. A key feature of composite material is that they may be tailored so that their
properties match the required performance. Approximately 1.8 Mt of E-glass fiber is manufactured
annually for use in composites and their represents some 80% of the continuous glass filament produced.
Some 30% is used to reinforce thermoplastics and 50% goes into continuous and long-fiber reinforced
thermosets, which are the traditional composite market. The remaining 20% is used in various textile
forms.
GLASS FIBERS AND SILANE COUPLING AGENTS: A) Structure and Properties of glass fibers:
A variety of chemical compositions of mineral glasses have been used to produce fibers. The most
commonly used are based on silica (SiO2)with additions of oxides of calcium,Al ,Fe. The polyhedron
network structure of sodium silicate glass is shown in Fig
Fig :11 Polyhedral network structure of glass fiber
The three dimensional network of structure of glass results in isotropic properties of glass fibres, in
contrast to those of carbon and Kevlar aramid fibers which are anisotropic. The elastic modulus of glass
fibers measured along the fiber axis is the same as that measured in the transverse direction, a
characteristic unique to glass fibers [5].
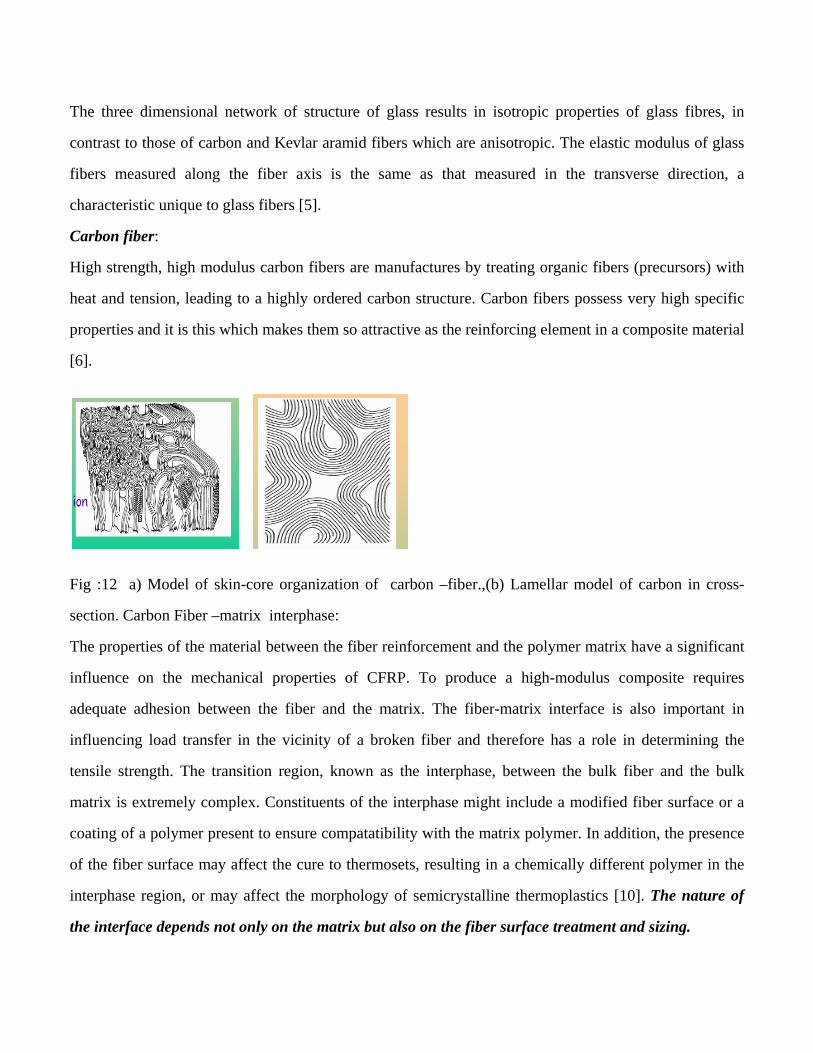
Carbon fiber:
High strength, high modulus carbon fibers are manufactures by treating organic fibers (precursors) with
heat and tension, leading to a highly ordered carbon structure. Carbon fibers possess very high specific
properties and it is this which makes them so attractive as the reinforcing element in a composite material
[6].
Fig :12 a) Model of skin-core organization of carbon –fiber.,(b) Lamellar model of carbon in cross-
section. Carbon Fiber –matrix interphase:
The properties of the material between the fiber reinforcement and the polymer matrix have a significant
influence on the mechanical properties of CFRP. To produce a high-modulus composite requires
adequate adhesion between the fiber and the matrix. The fiber-matrix interface is also important in
influencing load transfer in the vicinity of a broken fiber and therefore has a role in determining the
tensile strength. The transition region, known as the interphase, between the bulk fiber and the bulk
matrix is extremely complex. Constituents of the interphase might include a modified fiber surface or a
coating of a polymer present to ensure compatatibility with the matrix polymer. In addition, the presence
of the fiber surface may affect the cure to thermosets, resulting in a chemically different polymer in the
interphase region, or may affect the morphology of semicrystalline thermoplastics [10]. The nature of
the interface depends not only on the matrix but also on the fiber surface treatment and sizing.
The failure mode at the interface was cohesive at the high levels of treatment, suggesting that the
interface has been optimized at these levels, with shear strength of about 70MPa. The measured yield
strength of the bulk 922 resin was 195 MPa. It would be of interest to be able to comment whether these
data suggest that,1) interface strength being controlled by the matrix shear strength or 2) the interface is
of a significantly different composition to the bulk matrix and hence has different mechanical properties.
For current stiffer and strong fibers and tougher thermosetting resins, interfacial shear strengths
generally seem to lie between 40 and 60 MPa.
Aramid fiber:
Several types of interfaces can exist in composite materials, including mechanical, chemical, and
physical interfaces. Mechanical interfaces are realized by the “key and lock” mechanisms. Primary
factors controlling this type of interface are fiber surface roughness, porosity, surface morphology, and
matrix pore-filling capabilities. This type of interface plays a very important role in ceramic matrix
composites by providing a necessary degree of matrix debonding when the composite is under loading
conditions, which can lead to the optimization of the composite mechanical properties.

CHAPTER -2
LITERATURE SURVEY
INTERFACE AND INTERPHASE
ASSESSMENT OF MECHANICAL BEHAVIOR
Chapter 2
Literature survey
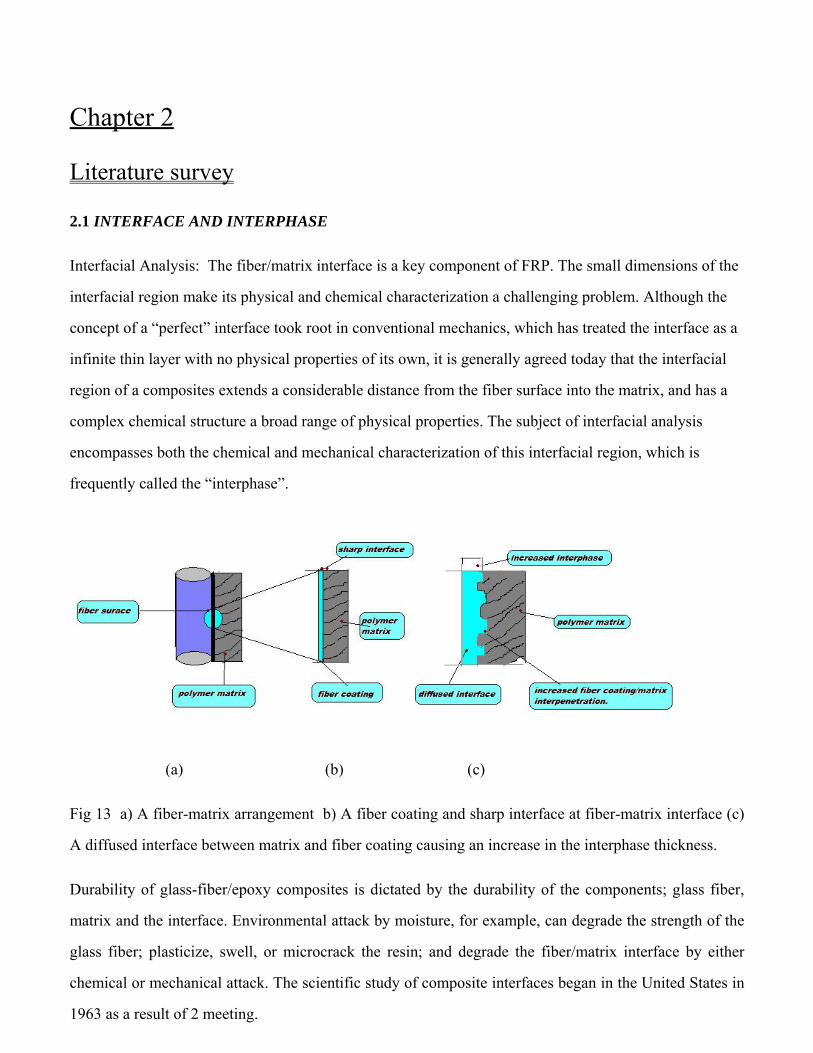
2.1 INTERFACE AND INTERPHASE
Interfacial Analysis: The fiber/matrix interface is a key component of FRP. The small dimensions of the
interfacial region make its physical and chemical characterization a challenging problem. Although the
concept of a “perfect” interface took root in conventional mechanics, which has treated the interface as a
infinite thin layer with no physical properties of its own, it is generally agreed today that the interfacial
region of a composites extends a considerable distance from the fiber surface into the matrix, and has a
complex chemical structure a broad range of physical properties. The subject of interfacial analysis
encompasses both the chemical and mechanical characterization of this interfacial region, which is
frequently called the “interphase”.
(a) (b) (c)
Fig 13 a) A fiber-matrix arrangement b) A fiber coating and sharp interface at fiber-matrix interface (c)
A diffused interface between matrix and fiber coating causing an increase in the interphase thickness.
Durability of glass-fiber/epoxy composites is dictated by the durability of the components; glass fiber,
matrix and the interface. Environmental attack by moisture, for example, can degrade the strength of the
glass fiber; plasticize, swell, or microcrack the resin; and degrade the fiber/matrix interface by either
chemical or mechanical attack. The scientific study of composite interfaces began in the United States in
1963 as a result of 2 meeting.
2.2 Chemical aspects of different fiber on the basis of INTERFACE region
Glass fiber-reinforcement
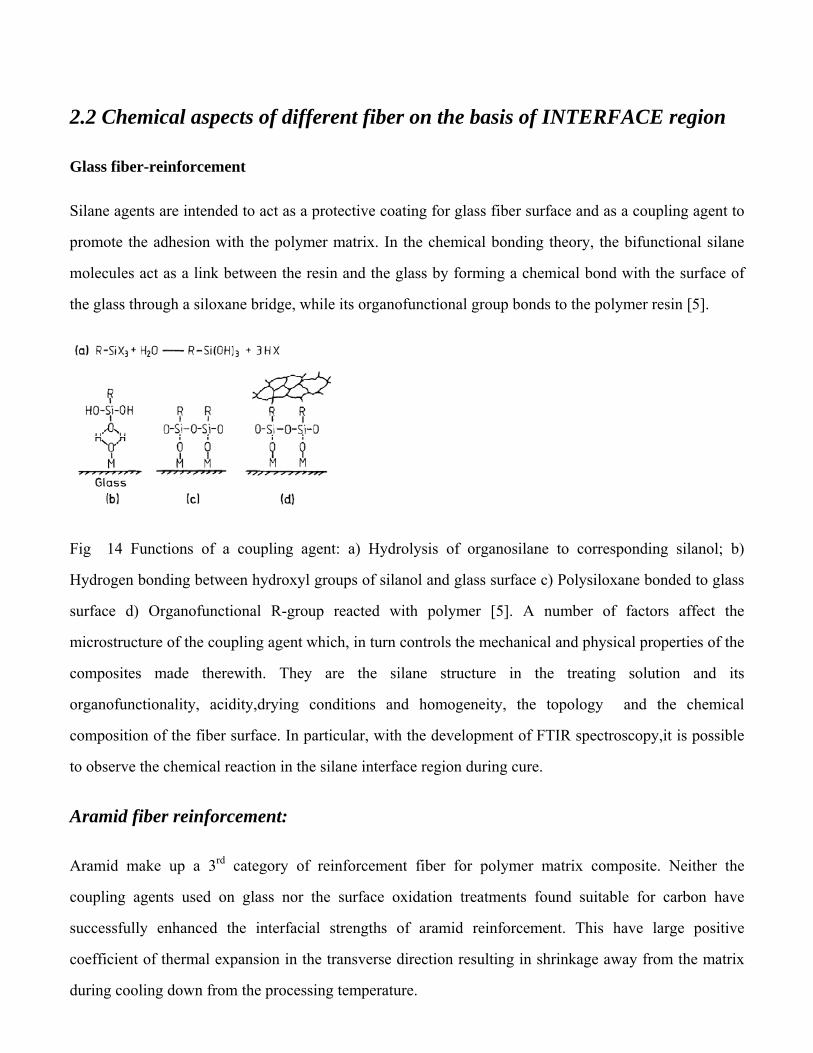
Silane agents are intended to act as a protective coating for glass fiber surface and as a coupling agent to
promote the adhesion with the polymer matrix. In the chemical bonding theory, the bifunctional silane
molecules act as a link between the resin and the glass by forming a chemical bond with the surface of
the glass through a siloxane bridge, while its organofunctional group bonds to the polymer resin [5].
Fig 14 Functions of a coupling agent: a) Hydrolysis of organosilane to corresponding silanol; b)
Hydrogen bonding between hydroxyl groups of silanol and glass surface c) Polysiloxane bonded to glass
surface d) Organofunctional R-group reacted with polymer [5]. A number of factors affect the
microstructure of the coupling agent which, in turn controls the mechanical and physical properties of the
composites made therewith. They are the silane structure in the treating solution and its
organofunctionality, acidity,drying conditions and homogeneity, the topology and the chemical
composition of the fiber surface. In particular, with the development of FTIR spectroscopy,it is possible
to observe the chemical reaction in the silane interface region during cure.
Aramid fiber reinforcement:
Aramid make up a 3rd category of reinforcement fiber for polymer matrix composite. Neither the
coupling agents used on glass nor the surface oxidation treatments found suitable for carbon have
successfully enhanced the interfacial strengths of aramid reinforcement. This have large positive
coefficient of thermal expansion in the transverse direction resulting in shrinkage away from the matrix
during cooling down from the processing temperature.
Promising improvement in the interfacial properties of aramid fibers have been obtained by plasma
treatment. The failure mode changed from predominantly interphase cracking to fiber splitting and
matrix cracking, evidence for bonding between the surface amine groups and the epoxy resins.
2.3 Mechanical Aspects of interface region
The mechanical performance of a FRP depends on the strength and modulus of its principal constituents,
the fiber and the matrix bond in transferring stress through the material. The elastic modulus of a
composite loaded statically in tension will be dominated by the fibers aligned in the direction by stress.
As applied stress is increased, the interface between the low modulus matrix and the high modulus fiber
becomes the most highly stressed region of the composites, thus the quality of the interface affects the
ultimate stress and strain of a unidirectional composites even when loaded in pure tension parallel to the
fibers [10].
CHARACTERISATION OF THE INTERFACE:
PHYSICOCHEMICAL ANALYSIS:
Adhesion physics is a well-established science, with obvious applicability to composite interfaces.
Wetting studies: A stable interface can occur only if its formation yields a reduction in the surface free
energy of the fiber or other solid phase. Increased instrumental sophisticated has permitted much
elaboration on this early theme by among others, the research groups headed by H.Ishida and J.L.Koeing
at case Western Reserve University.
Progressing outward from the glass surface, these are:
1. Chemically reacted monolayer
2. A tightly bound chemisorbed layer
3. Loosely bound chemisorbed layer
4. Physisorbed layer, which is removable with organic solvents.

Surface treatment of fibers and effects on composite properties.
The interlaminar shear, flexural, and tensile strengths are increased as the principal effects of fiber
surface treatment on composite properties. The enhancement of these strength properties depend on the
fiber elastic modulus, the degree of surface treatment and the type of resin and curing agent used. The
largest improvement in ILSS is obtained for high modulus fibers.
2.4 Fiber / matrix adhesion
Fiber-matrix adhesion is viewed as a necessary criterion for achieving acceptable composite properties.
The patent literature contains numerous chemical formulations, processes, and procedures designed to
increase fiber-matrix adhesion levels so that acceptable composite mechanical properties could be
achieved. As our understanding of the relationship of fiber-matrix adhesion to composite mechanical
properties has increased, it has become apparent that adhesion not only is necessary, but also, if properly
designed, can enhance the composite mechanical properties and performance.
FIG: 15 Schematic diagram of the fiber-matrix interphase and some of the factors that contribute to its formation
[12].
2.5 Study of moisture ingression by determination of Tg Moisture absorption in polymer composites leads to changes in the thermo physical, mechanical and
chemical characteristics of polymer matrix by plasticization and hydrolysis [13]. The presence of
moisture and the stresses associated with moisture-induced expansion may cause lowered damage
tolerance and structural durability. Water pick-up kinetics and mechanical test (ILSS) are supposed to be
indicative of evaluating adhesion chemistry at the fiber/matrix interfaces and the integrity of composites.
An attempt has been made here to evaluate the effect of thermal stress on shear strength of moisture
induced swell composites.
The common damage modes are matrix cracking, delamination growth and fiber fracture [14].
Plasticization and swelling are among the adverse consequences of absorbed water. Plasticization
induces plastic deformation in addition to lowering the Tg. whereas swelling is related to the differential
strain which is created by the expansion force exerted by the liquid while stretching polymeric chains.
These two damage mechanisms are believed to generate capillarity in polymeric composites. The stress
transfer efficiency from the matrix to the fibers, the stress build-up in broken fibers and the redistribution
of the stresses in the neighboring intact fibers are all controlled by the interfacial strength and integrity
[15]. Microcracking induced by environment is a long standing problem in polymer composites.
Cracking leads to mechanical degradation of fiber reinforced polymer composites. A typical cured resin
may absorb between 4.5 and 7.0 wt % of water at equilibrium, which may reduce the glass transition
temperature (Tg) by 80-140 °C [16].
From the practical point of view, the glass transition is a key property since it corresponds to the short-
term “Ceiling” temperature, above which there is a catastrophic softening of the material occur. It also
considered as a “floor” temp, because the polymerization (cure) exhibits a very slow/severe negligible
rate in the glass state [7]. For polymers to endure higher temperature (>230 °C) for a long period, the
polymers must have high Tg and good thermal stability. The mechanical properties of polymers normally
change dramatically and reversibly near Tg or Tm. The presence of aromatic groups in the main chain
contributes to high Tg value and also contributes to high tensile and shear properties. Since the Tg
corresponds to a mobility change in a polymer and has a definite free volume associated with it.
2.6 Glass transition temperature (Tg) and relaxation time
“Relaxation time” is a time constant for a system to return to equilibrium in response to a sudden
disturbance, like a pressure jump/temperature. In the glassy state relaxation times becomes very large,
making the continuation of the polymerization reaction difficult. Due to this long relaxation times, and
are not free to absorb the energy of the impact by chain slippage, so almost all of the impact energy must
be absorbed by the chain backbones. If failure occurs, it will be by instantaneous brittle fracture. The
relaxation may be considered as an inherently non-exponential process, usually involving the stretched
exponential relaxation function [17].
In a glassy state, crazing is a major factor in stress relaxation and in creep. Crazing in glassy polymers
greatly increases the creep and stress relaxation. At temperature well below Tg where polymers are
brittle, their molecular weight has a minor effect on creep and stress relaxation. This occurs more easily
in low-molecular-weight polymers, which can increase the creep and stress relaxation rate before failure
takes place. Once craze begins to form at a flaw, the polymer chains in that region reorient in response to
both the applied load and the reduced cross-sectional area/stress concentration at that point due to the
flaw [18].
2.7 Molecular theory of polymer
The interest in environmental effects on composites was rekindled in the mid-1990s due to new
applications contemplated for these materials, which combine severe exposures and higher design
requirements. These new applications occur in the offshore oil industry, in civil infractures and in naval
submersibles. The simplest model for the diffusion of solvent into a solid is given by linear Fick’s Law
(1885). Accordingly, the flux of the solvent, is proportional to the negative of) concentrations gradient
m. In the one dimensional case we have
F=-D /
Where D is the diffusion coefficient. The negative sign in this equation indicates that the flux is directed
from high concentration to low concentrations region [7]. Experimental evidence indicates that for most
of polymeric composite materials the hygrothermal behavior is Fickian nature. Thus, the absorption and
desorption curves when plotted (time) are always concave toward the (time) axis and asymptotically
reach the equilibrium value. But the diffusion behavior of glass polymer doesn’t obey the Fick’s law.
Non-fickian behavior is also a material characteristic. Deviation from Fickian’s law becomes more
pronounced at elevated temperature and for materials immersed in liquids [19].
Causes a
There is
causes w
molecula
time-dep
time-dep
polymer
boundary
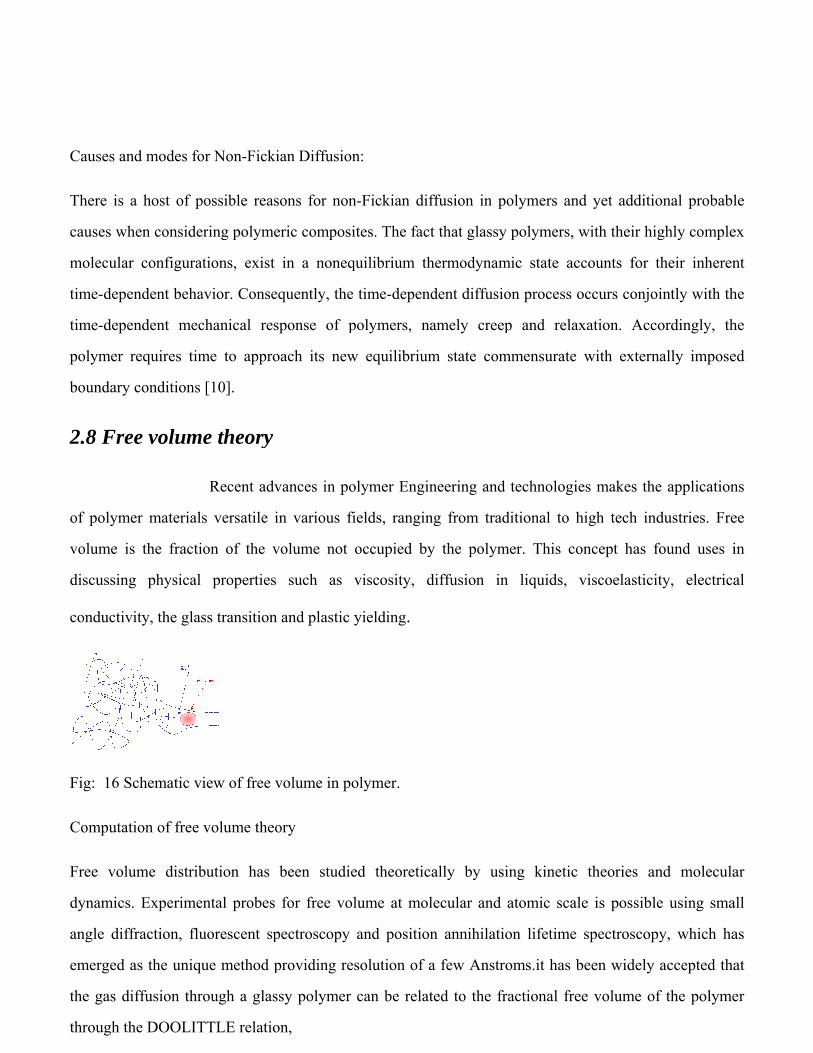
2.8 Fre
of polym
volume i
discussin
conductiv
Fig: 16 S
Computa
Free vol
dynamics
angle dif
emerged
the gas d
through t
and modes fo
a host of p
when conside
ar configura
endent beha
endent mec
requires tim
y conditions
ee volum
mer material
is the fracti
ng physical
vity, the glas
Schematic v
ation of free
lume distrib
s. Experime
ffraction, flu
as the uniqu
diffusion thr
the DOOLIT
or Non-Ficki
possible reas
ering polyme
tions, exist
avior. Conse
chanical res
me to appro
[10].
e theory
Recent adv
s versatile i
ion of the v
properties
ss transition
iew of free v
volume theo
bution has
ental probes
uorescent sp
ue method p
rough a glas
TTLE relatio
ian Diffusion
sons for non
eric composi
in a noneq
quently, the
sponse of p
oach its new
vances in po
in various fi
volume not
such as v
and plastic y
volume in po
ory
been studie
for free vol
pectroscopy
providing re
sy polymer
on,
n:
n-Fickian dif
ites. The fact
quilibrium th
time-depen
polymers, na
w equilibrium
olymer Engin
ields, rangin
occupied by
viscosity, d
yielding.
olymer.
ed theoretic
lume at mol
and position
solution of a
can be relat
ffusion in p
t that glassy
hermodynam
dent diffusio
amely creep
m state com
neering and
ng from trad
y the polym
diffusion in
cally by usi
lecular and
n annihilatio
a few Anstro
ted to the fr
olymers and
y polymers, w
mic state acc
on process o
p and relax
mmensurate
technologie
ditional to h
mer. This co
n liquids, v
ing kinetic
atomic scale
on lifetime
oms.it has b
ractional free
d yet additio
with their hig
counts for t
occurs conjo
xation. Acco
with extern
es makes the
high tech ind
oncept has f
viscoelasticit
theories an
e is possible
spectroscop
been widely
e volume of
onal probabl
ghly comple
their inheren
intly with th
ordingly, th
nally impose
e application
dustries. Fre
found uses i
ty, electrica
nd molecula
e using sma
y, which ha
accepted tha
f the polyme
le
ex
nt
he
he
ed
ns
ee
in
al
ar
all
as
at
er

Where f-fractional free volume
A &B are constant.
As the free volume increases and pores becomes connected, this relation doesn’t adequately model the
experimental data.by adding newly available high free volume polymer that is PARK & PAULI’S an
empirically relation is,
D=α exp(βf)
Where α & β are constants.,is shown all of the data well.
It is known that as the fractional free volume in polymers increases the pores becomes interconnected
and provides a flow through path for the permeating gas which has commonly been identified with a pore
flow diffusion process. Gas molecules are free to move within the maze to connected pores.
Fig- 17 schematic diagram of different diffusion process (a)closely packed glassy polymer (b)high free
volume glassy polymer.
Water penetration in composite materials of different interfacial strengths has been studied
and explained as the result of two parallel processes, i.e., diffusion through the polymer matrix and
through a network of micro-channels formed along the imperfectly bonded polymer-fiber interface. Such
channels along the exterior of the loose fiber are presumed to contribute mesoscopic ‘‘free volume’’ to
the composite which is conductive to diffusion. An analytical method based on an adaptation of the free
volume theory approach is proposed for estimating the incipient looseness and any further interfacial
relaxation caused by water absorption in composite materials.

Fig- 18 Idealized represtation of interfacial free volume of annular thickness h,around an imperfect
bonded fiber radius r in a composite.[]
2.9 Free volume and Tg Upon a gradual temperature decrease polymers (especially whose with irregular structure or composed of
monomers fairly different in their structure and volume) form a glassy state (i.e. undergo the glass
transition). The glass transition temperature is a function of molecular architecture, monomer units,
presence of impurities or low molecular weight species and the rate of temperature changing [20].
Normally there is some free space between polymer monomers even in melt. In general one can
distinguish between the total volume and the occupied volume. The difference between these two
considered to be a free volume. The amount of the free volume changes with temperature.
2.10 Degree of crosslinking and its impact A small no. of chemical cross-links act about the same as entanglements, but the cross-links do not relax/
becomes ineffective at high temperature. Thus cross-linked elastomers show rubberlike elasticity and
recoverable deformation even at high temperature and for long times after being stretched or deformed
[21].The modulus on the rubbery region increases with the number of cross-link points or equivalently,
as the molecular weight between cross-links Mc decreases. In addition to raising the rubbery modulus,
cross-linking produces 3 other effects, first when the cross-link density becomes fairly high, the glass
transition temperature (Tg) is increased, so the drop in the modulus becomes shifted to higher
temperature/ longer times. Second, the transition region is broadened, with the modulus dropping as a
lower rate and platenuing at a higher level[22].

Widely spaced cross-links produce only slightly restrictions on molecular motion, so that Tg tends to be
close to that of the uncross-linked polymers. As the cross-link density is increased, molecular motion
becomes, more restricted and the Tg of the cross-linked polymer chain rises. The final reason for the
broadening is that the nature of the polymer backbone has changed and the highly cross-linked system
has become a copolymer. Cross-linking has rather little effect on the magnitude of the modulus in the
glassy state (i.e at very short times/at temperature below Tg). Both increases and decreases have been
observed [23].
2.11 Assessment of Engineered Interface The local response of the fiber-matrix interface within the composite during fracture is particularly
important. If the interface in a composite is to be designed to resist fracture and thus to enhance the
damage tolerance prior to failure, it is necessary to understand the basic failure mechanisms or origin of
fracture toughness[24]. The cracks in composites can propagate preferentially along the fiber-matrix and
laminar interfaces or transversely right through the fiber-matrix, depending on the properties of the
interface. When the crack presents in the matrix the following failure mechanisms may be takes place:
1. Matrix fracture 2: Fiber-matrix interface debonding 3:Post-debonding friction
4: Fiber fracture 5: Fiber pullout 6: Stress redistribution [25].
All these mechanisms, except fracture of fibers and the matrix, are a direct consequence of shear failure
at the imperfectly bonded fiber-matrix interface. A weak interface bond is detrimental to some
mechanical properties, particularly the longitudinal compressive strength and transverse tensile strength
[6].
Fig : 19 Model of crack-fiber interaction in a simple composites[6].
The ability of a composite material to arrest cracks through longitudinal splitting contributes to the
overall improvement in energy absorption capability and thus its fracture toughness.
Surface treatments of fiber and particle reinforcements are common methods to improve the general
adhesion properties by increasing electrostatic interactions and /or facilitating chemical bonding between
the constituents [26]. Many applications reveal a sensitivity of resin matrix and fiber/matrix interface to
both environmental degradation, with interactions between various mechanisms being possible. With the
increasing applications of these materials, more and more assessment is needed to get a better
understanding of interfacial bonding of the materials. The environmental action, such as high moisture
and high temperature, can limit the usefulness of polymer composites by deteriorating mechanical
properties during service[27]. Usually, it is accepted that the interphase region has a thickness of 100 to
500 nm. Interface between fiber and matrix is believed to play an important role in composite
properties[28]. The effectiveness of load transfer at the interface depends upon the extent of chemical
and mechanical bonding. In addition, composites properties are further compromised by structural
defects such as voids, impurities and microcracks which tend to concentrate at the interface region.
Therefore, the degradation at the interface area is of specific interest in understanding the failure modes
of polymer composite[29].
2.12 Assessment of mechanical behavior (implication of thermal shock and
thermal spike)
Hybrid composite
Different types of fibers can be incorporated into a matrix material to produce a hybrid fiber composite.
Typical hybrid fiber composites are made from glass that are added to brittle carbon fiber composites to
enhance the fracture toughness resulting from the toughening mechanisms associated with the ductile
fibers, while maintaining a high strength and high modulus gained from carbon fibers[30]. The effect of
toughening relies heavily on how the hybrid fibers are mixed and the ply layup is arranged.
Hybridization provides materials designers with an added degree of freedom in tailoring composites to
achieve a better balance of stiffness and strength, increased failure strain, better damage tolerance,
improved ability to absorb impact energy and possibly a significant reduction in cost[31]. Hybrid
composites are attractive structural materials, because the composite properties can be tailored to
requirements, other characteristics of hybrid composite are cost effective utilization of different fiber
materials, possible weight savings, reduced notch sensitivity, improved fracture toughness, larger fatigue
life and improved impact resistance[32]. In general, hybrid effect leads to the enhancement of the failure
strain and strength than that estimated using classical lamination theory and the various failure strain
criteria[33]. The maximum tolerated was the load corresponding to either a gross fiber failure at the back
surface or an inter laminar crack across the composite sample[34]. Also the intermixing of glass and
graphite fiber plies helped decrease the sudden catastrophic failure mode. Chamis et al have studied
glass/carbon hybrid composites and have observed that hybrid composite failed under impact by
combined fracture modes: fiber breakage, fiber pullout and interplay delamination [35].
CHAPTER-3 FTIR-Imaging
ATR-FTIR TMDSC
AFM UV
SEM MATERIALS AND EXPERIMENTAL
CHAPTER-3
TECHNIQUES
3.1 FOURIER TRANSFORM INFRARED SPECTROSCOPY (FTIR)
Infrared (IR) spectroscopy is one of the most common spectroscopic techniques used by organic and
inorganic chemists. Simply, it is the absorption measurement of different IR frequencies by a sample
positioned in the path of an IR beam. The main goal of IR spectroscopic analysis is to determine the
chemical functional groups in the sample. Different functional groups absorb characteristic frequencies
of IR radiation. Using various sampling accessories, IR spectrometers can accept a wide range of sample
types such as gases, liquids, and solids. Thus, IR spectroscopy is an important and popular tool for
structural elucidation and compound identification[36].
BASIC PRINCIPLE:
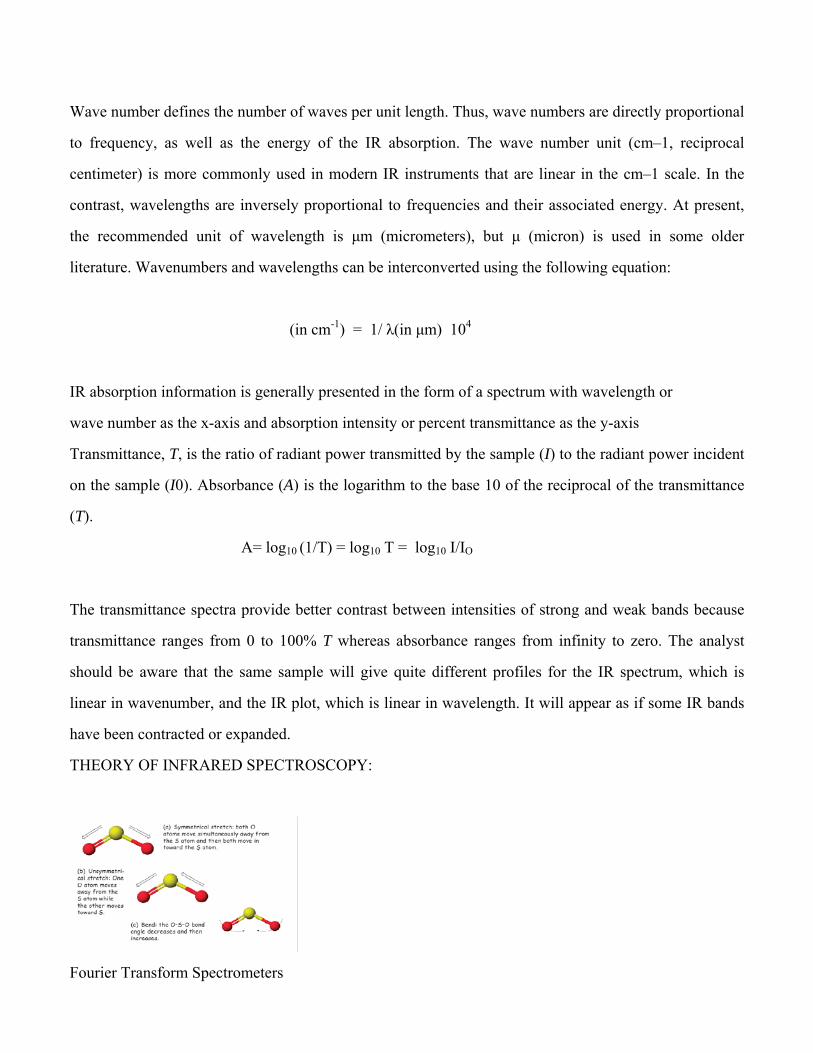
Except at very, very low temperatures, all molecules are in motion in some manner. Molecules translate
(move from place to place), they rotate in space, and, importantly for this experiment, they vibrate. In the
case of the triatomic, bent molecule SO2, the seemingly random vibrations of the molecule can actually
be broken down into three so-called “normal modes” of vibration (Figure 1). These normal modes are a
bending of the molecule and two stretching motions. In the bending motion, the O atoms wag in and out.
In one stretching motion, the two O atoms move symmetrically in and out relative to the S atom, whereas
in the other motion the two O atoms move unsymmetrically in and out. That is, as one moves out the
other moves in, and vice versa. Bending and stretching motions occur in all molecules. The only
difference is that more
complex molecules have many more bending and stretching motions.
IR Frequency Range and Spectrum Presentation
Infrared radiation spans a section of the electromagnetic spectrum having wave numbers from roughly
13,000 to 10 cm–1, or wavelengths from 0.78 to 1000 µm. It is bound by the red end of the visible region
at high frequencies and the microwave region at low frequencies. IR absorption positions are generally
presented as either wave numbers ( ) or wavelengths (l).
Wave number defines the number of waves per unit length. Thus, wave numbers are directly proportional
to frequency, as well as the energy of the IR absorption. The wave number unit (cm–1, reciprocal
centimeter) is more commonly used in modern IR instruments that are linear in the cm–1 scale. In the
contrast, wavelengths are inversely proportional to frequencies and their associated energy. At present,
the recommended unit of wavelength is µm (micrometers), but µ (micron) is used in some older
literature. Wavenumbers and wavelengths can be interconverted using the following equation:
� (in cm-1) = 1/ λ(in µm) 104
IR absorption information is generally presented in the form of a spectrum with wavelength or
wave number as the x-axis and absorption intensity or percent transmittance as the y-axis
Transmittance, T, is the ratio of radiant power transmitted by the sample (I) to the radiant power incident
on the sample (I0). Absorbance (A) is the logarithm to the base 10 of the reciprocal of the transmittance
(T).
A= log10 (1/T) = log10 T = log10 I/IO
The transmittance spectra provide better contrast between intensities of strong and weak bands because
transmittance ranges from 0 to 100% T whereas absorbance ranges from infinity to zero. The analyst
should be aware that the same sample will give quite different profiles for the IR spectrum, which is
linear in wavenumber, and the IR plot, which is linear in wavelength. It will appear as if some IR bands
have been contracted or expanded.
THEORY OF INFRARED SPECTROSCOPY:
Fourier Transform Spectrometers

Fourier transform spectrometers have recently replaced dispersive instruments for most applications due
to their superior speed and sensitivity. They have greatly extended the capabilities of infrared
spectroscopy and have been applied to many areas that are very difficult or nearly impossible to analyze
by dispersive instruments. Instead of viewing each component frequency sequentially, as in a dispersive
IR spectrometer, all frequencies are examined simultaneously in Fourier transform infrared (FTIR)
spectroscopy.
Spectrometer Components
There are three basic spectrometer components in an FT system: radiation source, interferometer, and
detector. A simplified optical layout of a typical FTIR spectrometer is illustrated in Fig. 15.4. The same
types of radiation sources are used for both dispersive and Fourier transforms spectrometers. However,
the source is more often water-cooled in FTIR instruments to provide better power and stability. In
contrast, a completely different approach is taken in an FTIR spectrometer to differentiate and measure
the absorption at component frequencies. The monochromator is replaced by an interferometer, which
divides radiant beams, generates an optical path difference between the beams, and then recombines
them in order to produce repetitive interference signals measured as a function of optical path difference
by a detector. As its name implies, the interferometer produces interference signals, which contain
infrared spectral information generated after passing through a sample. The most commonly used
interferometer is a Michelson interferometer. It consists of three active components: a moving mirror, a
fixed mirror, and a beamsplitter (Fig. 15.4). The two mirrors are perpendicular to each other. The
beamsplitter is a semi reflecting device and is often made by depositing a thin film of germanium onto a
flat KBr substrate. Radiation from the broadband IR source is collimated and directed into the
interferometer, and impinges on the beamsplitter. At the beamsplitter, half the IR beam is transmitted to
the fixed mirror and the remaining half is reflected to the moving mirror. After the divided beams are
reflected from the two mirrors, they are recombined at the beamsplitter. Due to changes in the relative
position of the moving mirror to the fixed mirror, an interference pattern is generated. The resulting beam
then passes through the sample and is eventually focused on the detector.
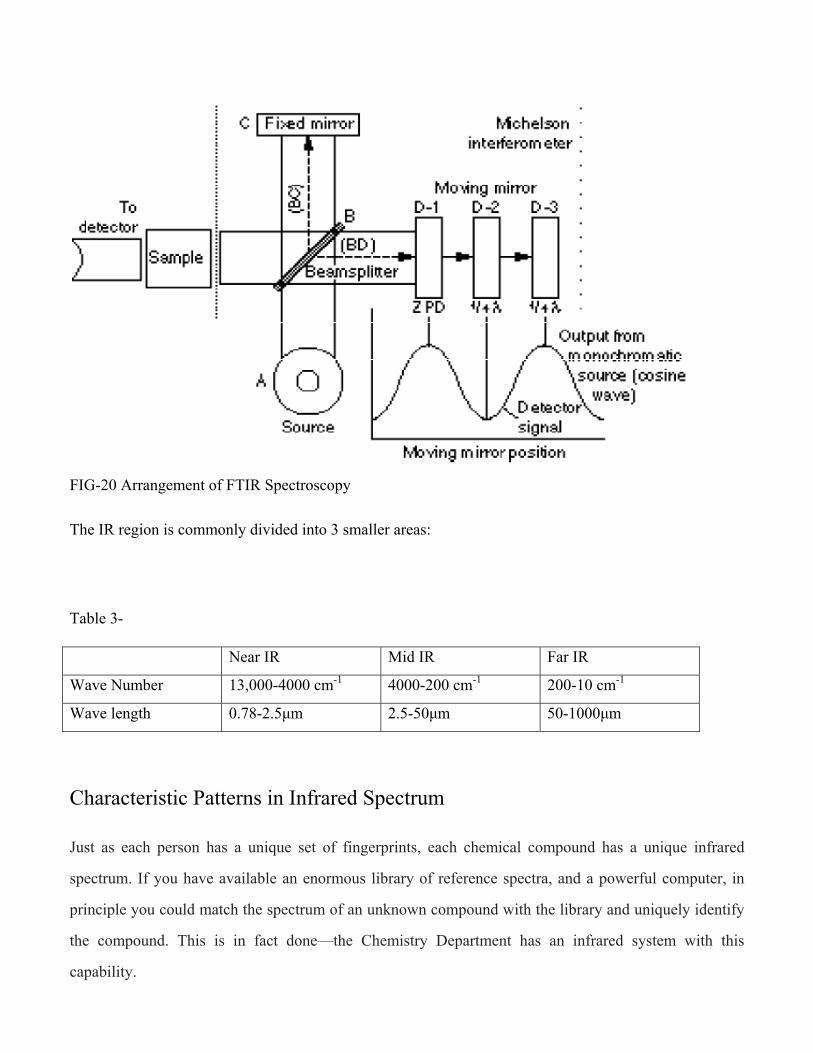
FIG-20 Arrangement of FTIR Spectroscopy
The IR region is commonly divided into 3 smaller areas:
Table 3-
Near IR Mid IR Far IR
Wave Number 13,000-4000 cm-1 4000-200 cm-1 200-10 cm-1
Wave length 0.78-2.5µm 2.5-50µm 50-1000µm
Characteristic Patterns in Infrared Spectrum
Just as each person has a unique set of fingerprints, each chemical compound has a unique infrared
spectrum. If you have available an enormous library of reference spectra, and a powerful computer, in
principle you could match the spectrum of an unknown compound with the library and uniquely identify
the compound. This is in fact done—the Chemistry Department has an infrared system with this
capability.
But what if you have a spectrum of a completely new compound, or one that is not in your database? It
turns out that different parts of a molecule—its functional groups—give rise to infrared vibrations in
reasonably well defined regions of the infrared region. For example, as Figure 3 shows, stretching
vibrations of bonds to H usually occur at higher energies, triple bonds have higher energy stretching
vibrations than those of double bonds, whereas bending vibrations occur at lower energies. Extensive
experience has led to the compilation of correlation tables. For example, chemists know that the
stretching motions of bonds commonly found in organic compounds occur in the ranges given in the
table below.
Table -4 BOND Frequency (cm-1) Shape and intensity
O-H 3650-2500 Often broad,strong
N-H 3400-3200 Sharp,Variable
-C-H 2960-2850 Sharp,Medium
=C-H 3100-3000 Sharp,Mediun
C=C 1680-1620 Sharp,Variable
C=O 1800-1630 Sharp,Strong
C-O 1300-1000 Sharp,Strong
3.1 B ATTUNATED TOTAL REFLECTION (ATR-FTIR)
BASIC PRINCIPLE
Attenuated Total Reflectance (ATR) spectroscopy has been used to measure interdiffusion for a number
of polymer systems. This technique is attractive for several reasons. It is easy, simple and nondestructive,
and the penetration depth ranges between 0.1 to 10 mm. Any concentration change within the penetration
depth due to diffusion of one polymer in another one can be observed in situ. The diffusion of each
polymer can then be followed independently, provided that the compounds have some infrared
distinguishable absorption bands. It is possible to work in a broad range of temperatures (below and
above the Tg) and with a wide variety of interface combinations (amorphous, crystalline, thermoplastic,
thermoset polymers, different molecular weights, etc). The ATR method offers the advantage of
measuring the diffusion coefficients over a wide range of values: 10-5 – 10-16 cm2sec-1, as well as
characterizing chemical interactions occurring within the polymeric system.
3.1 C TEMPERATURE MODULATED DIFFERENTIAL SCANNING
CALORIMETRY (TMDSC)
BASIC PRINCIPLE AND WORKING CONDITION
TMDSC is a technique for measuring the energy necessary to establish a nearly zero temperature
different between a substance and an inert reference material as the two specimens are subjected to
identical temperature regimes in an environment heated / cooled at a controlled rate.
The basic principle underlying this technique is that, when the sample undergoes a physical
transformation such as, phase transitions, more (or less) heat will need to flow to it than the reference to
maintain both at the same temperature. Whether heat will flow to the sample depends on whether the
process is exothermic or endothermic [37].
Differential scanning calorimetry (DSC) is widely used for the characterization of materials with respect
to phase transitions such as melting and crystallization. Recently, a novel technique known as
Temperature Modulated DSC (TMDSC) has been introduced [1,2,3]. In TMDSC a periodic temperature
modulation is superimposed on the constant heating or cooling rate of a conventional DSC measurement.
METTLER TOLEDO has commercialized TMDSC as Alternating Differential Scanning Calorimetry
(ADSC). It allows modulation with either simple waveforms such as steps or sawtooths (“Steady-State
ADSC”), or with sinusoidal waveforms characterized by temperature amplitude AT and an angular
frequency w, defined as 2p/P, where P denotes the period of the sine wave. In this latter case, the
General temperature program, T(t), is given by
T(t) = T0 + β0 t + AT sinωt
where T0 denotes the initial temperature, t the time and β0 the underlying (average) heating rate.
Traditional DSC shows phase transitions, specific heat and chemical reactions in segments with linear
heating and cooling rates or in isothermal temperature steps with high sensitivity and reproducibility. By
varying the heating rates (cooling rates) in consecutive experiments, the sensitivity for individual thermal
effects and sometimes also for the separation of overlapping effects can be influenced.
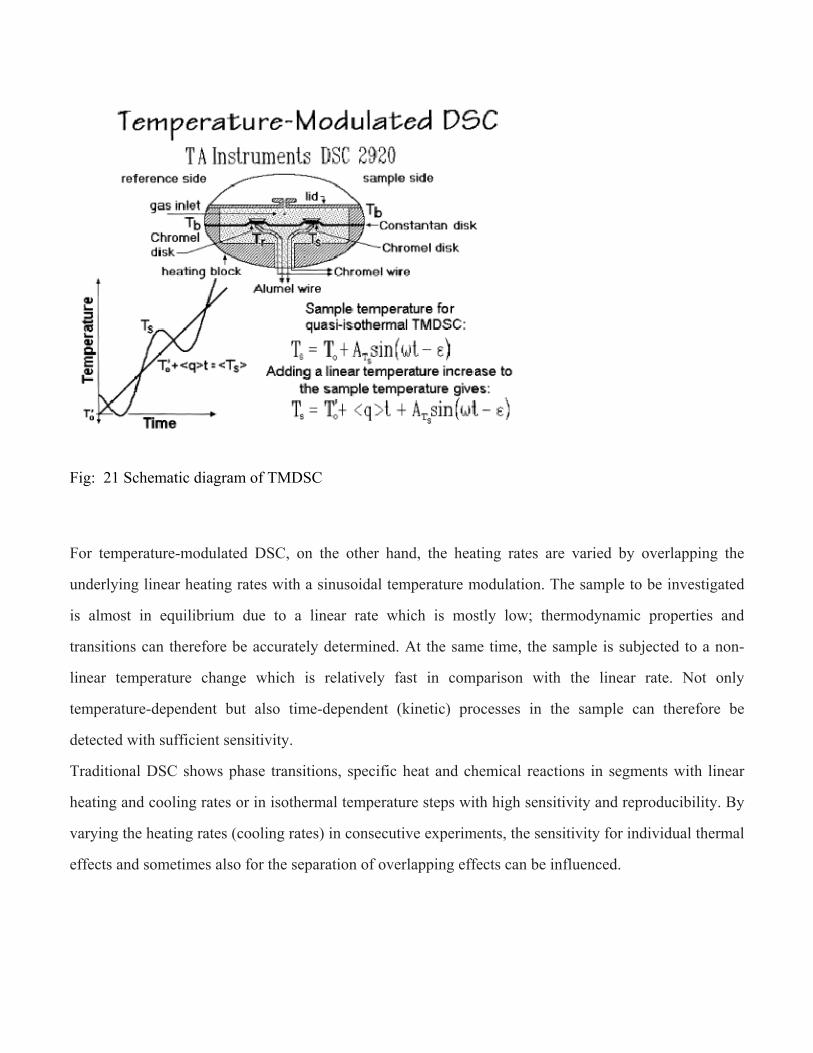
Fig: 21 Schematic diagram of TMDSC
For temperature-modulated DSC, on the other hand, the heating rates are varied by overlapping the
underlying linear heating rates with a sinusoidal temperature modulation. The sample to be investigated
is almost in equilibrium due to a linear rate which is mostly low; thermodynamic properties and
transitions can therefore be accurately determined. At the same time, the sample is subjected to a non-
linear temperature change which is relatively fast in comparison with the linear rate. Not only
temperature-dependent but also time-dependent (kinetic) processes in the sample can therefore be
detected with sufficient sensitivity.
Traditional DSC shows phase transitions, specific heat and chemical reactions in segments with linear
heating and cooling rates or in isothermal temperature steps with high sensitivity and reproducibility. By
varying the heating rates (cooling rates) in consecutive experiments, the sensitivity for individual thermal
effects and sometimes also for the separation of overlapping effects can be influenced.

Thermal Behavior of Polymers
Glass Transition Temperature (Tg)
• At low temperatures, all amorphous polymers are stiff and glassy, sometimes called as the Vitreous
State, especially for inorganic polymers. On Warming, polymers soften in a characteristic temperature
range known as the glass-rubber transition region. The glass transition temperature (Tg), is the
temperature at which the amorphous phase of the polymer is converted between rubbery and glassy
states[38]. Tg constitutes the most important mechanical property for all polymers. In fact, upon
synthesis of a new polymer, the glass transition temperature is among the first properties measured. The
following physical properties undergo a drastic change at the glass transition temperature of any
polymer:
a) Hardness
b) Volume
c) Modulus (Young’s module)
d) Percent elongation-to-break
FIG- Represents the variation of Tg [12].
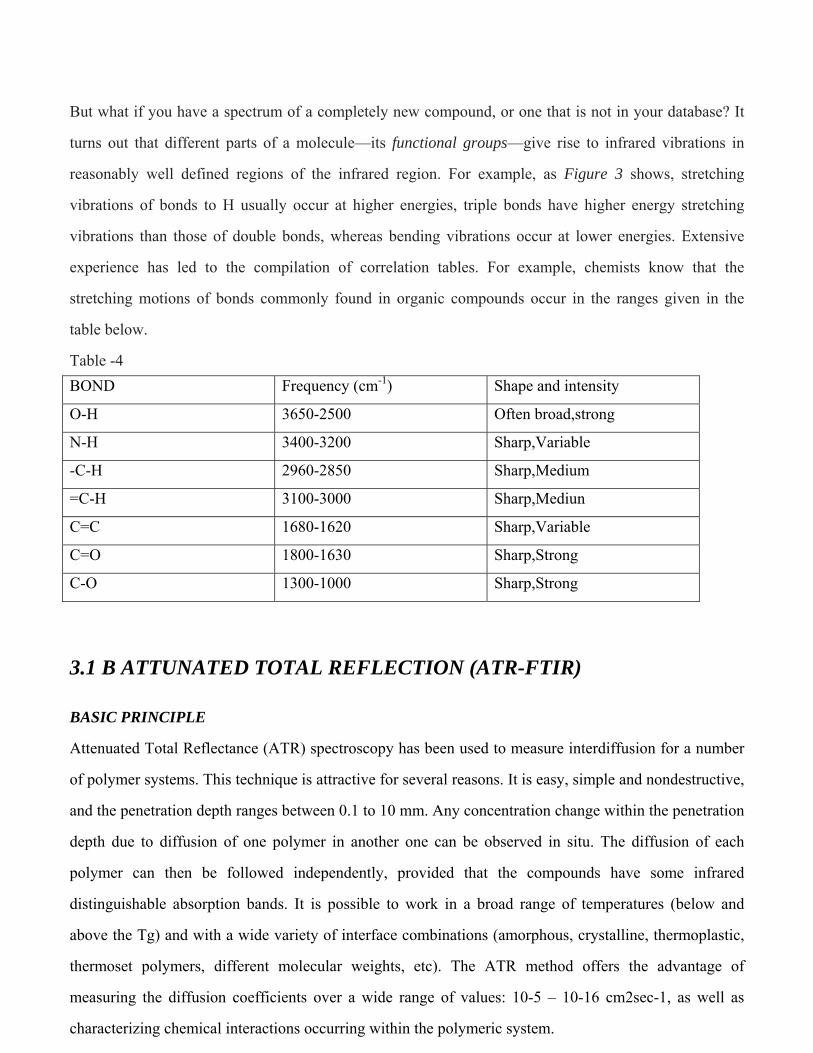
3.1 D Atomic force microscope (AFM)
The atomic force microscope (AFM) or scanning force microscope (SFM) is a very high-resolution
type of scanning probe microscopy, with demonstrated resolution of fractions of a nanometer, more than
1000 times better than the optical diffraction limit.
The precursor to the AFM, the scanning tunneling microscope, was developed by Gerd Binnig and
Heinrich Rohrer in the early 1980s, a development that earned them the Nobel Prize for Physics in 1986.
Binnig, Quate and Gerber invented the first AFM in 1986.
BASIC PRINCIPLE
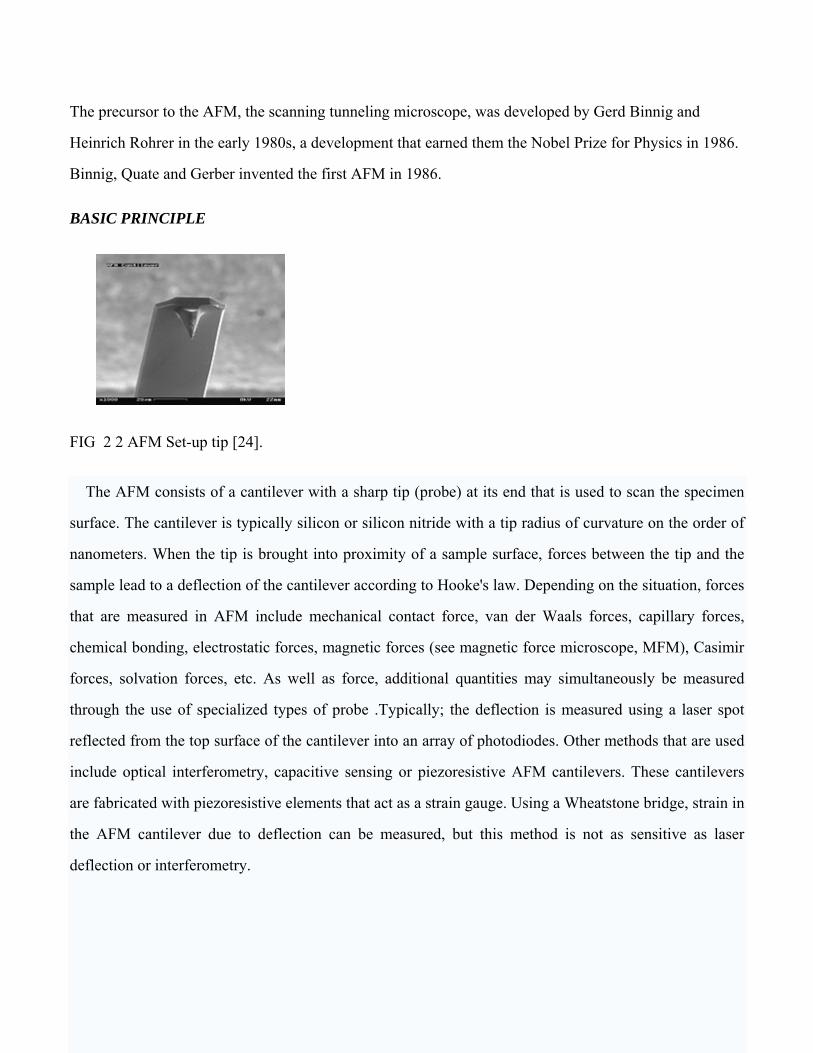
FIG 2 2 AFM Set-up tip [24].
The AFM consists of a cantilever with a sharp tip (probe) at its end that is used to scan the specimen
surface. The cantilever is typically silicon or silicon nitride with a tip radius of curvature on the order of
nanometers. When the tip is brought into proximity of a sample surface, forces between the tip and the
sample lead to a deflection of the cantilever according to Hooke's law. Depending on the situation, forces
that are measured in AFM include mechanical contact force, van der Waals forces, capillary forces,
chemical bonding, electrostatic forces, magnetic forces (see magnetic force microscope, MFM), Casimir
forces, solvation forces, etc. As well as force, additional quantities may simultaneously be measured
through the use of specialized types of probe .Typically; the deflection is measured using a laser spot
reflected from the top surface of the cantilever into an array of photodiodes. Other methods that are used
include optical interferometry, capacitive sensing or piezoresistive AFM cantilevers. These cantilevers
are fabricated with piezoresistive elements that act as a strain gauge. Using a Wheatstone bridge, strain in
the AFM cantilever due to deflection can be measured, but this method is not as sensitive as laser
deflection or interferometry.
3.1 E SCANNING ELECTRON MICROSCOPY (SEM)
The scanning electron microscope (SEM) is a type of electron microscope that images the sample
surface by scanning it with a high-energy beam of electrons in a raster scan pattern. The electrons
interact with the atoms that make up the sample producing signals that contain information about the
sample's surface topography, composition and other properties such as electrical conductivity. The types
of signals produced by an SEM include secondary electrons, back-scattered electrons (BSE),
characteristic X-rays, light (cathodoluminescence), specimen current and transmitted electrons.
Secondary electron detectors are common in all SEMs, but it is rare that a single machine would have
detectors for all possible signals. The signals result from interactions of the electron beam with atoms at
or near the surface of the sample. In the most common or standard detection mode, secondary electron
imaging or SEI, the SEM can produce very high-resolution images of a sample surface, revealing details
about less than 1 to 5 nm in size. Due to the very narrow electron beam, SEM micrographs have a large
depth of field yielding a characteristic three-dimensional appearance useful for understanding the surface
structure of a sample.
Back-scattered electrons (BSE) are beam electrons that are reflected from the sample by elastic
scattering. BSE are often used in analytical SEM along with the spectra made from the characteristic X-
rays. Because the intensity of the BSE signal is strongly related to the atomic number (Z) of the
specimen, BSE images can provide information about the distribution of different elements in the
sample. For the same reason, BSE imaging can image colloidal gold immuno-labels of 5 or 10 nm
diameter which would otherwise be difficult or impossible to detect in secondary electron images in
biological specimens.
3.2 Experimental set-up And Materials
Materials
The unmodified epoxy resin (Araldide LY-556) based on Bisphenol-A and hardener HY- 951 an
aliphatic primary amine (Ciba-Geigy) used as matrix and glass fiber was used for preparing the micro-
composites for hygrothermal treatment.
. The same test was conducted with another matrix i.e. unmodified polyester resin. For cryogenic
treatment laminated composites were prepared from woven and chopped glass fiber for ILLS testing. The
fibre used was E-glass fibre treated with silane-coupling sizing system (Saint-Gobian Vetrotex).
3.2. A Hygrothermal Treatment
The specimens were fabricated using the conventional hand lay-up method. A plane mould was treated
with silicon based releasing agent for easy removal of glass/epoxy micro-composites. A single strand of
glass and carbon fiber was placed on the mould and the layer of catalyzed epoxy was poured on to it
uniformly. Very light rolling was then carried out to remove any gas pockets if present and to uniformly
distribute the epoxy resin throughout the composite. The micro-composites prepared were then cured at
room temperature for 24 hours. Then the samples were treated in microprocessor controlled Brabender
climatic chamber for hygrothermal conditioning. The samples were divided into six batches, they were
hygrothermally treated for 10, 40, 60 and 100 hours in 95% RH and one batch remain untreated.
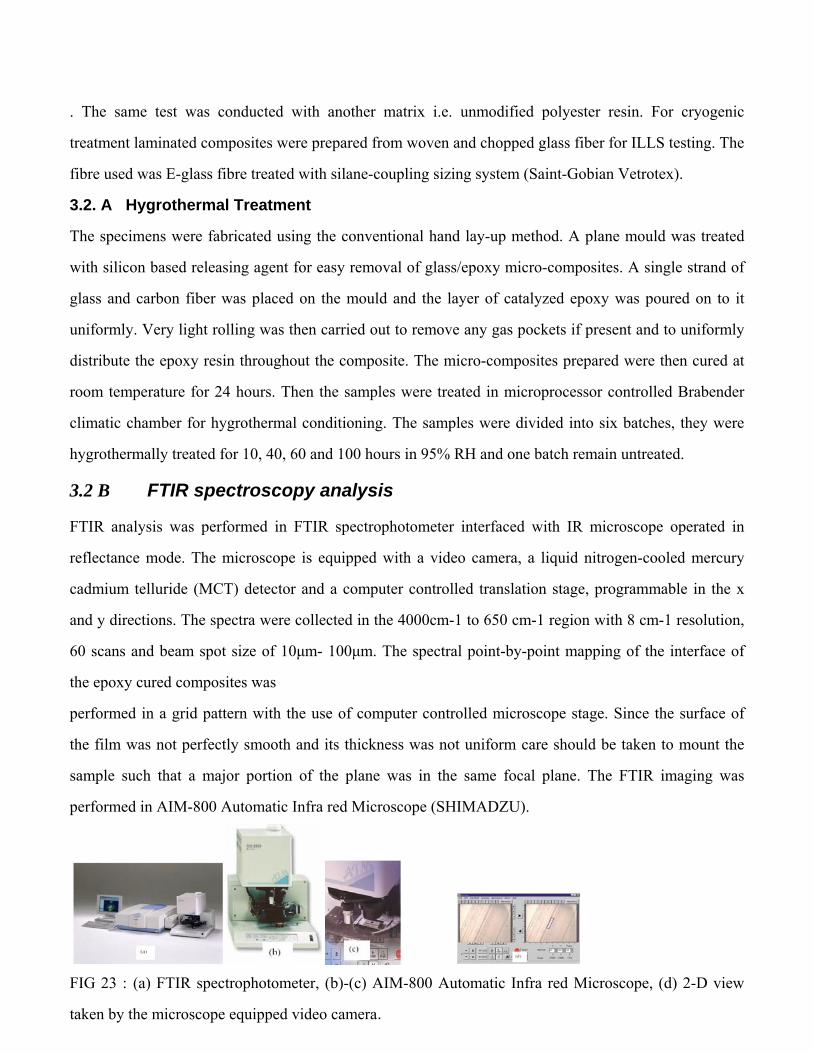
3.2 B FTIR spectroscopy analysis
FTIR analysis was performed in FTIR spectrophotometer interfaced with IR microscope operated in
reflectance mode. The microscope is equipped with a video camera, a liquid nitrogen-cooled mercury
cadmium telluride (MCT) detector and a computer controlled translation stage, programmable in the x
and y directions. The spectra were collected in the 4000cm-1 to 650 cm-1 region with 8 cm-1 resolution,
60 scans and beam spot size of 10µm- 100µm. The spectral point-by-point mapping of the interface of
the epoxy cured composites was
performed in a grid pattern with the use of computer controlled microscope stage. Since the surface of
the film was not perfectly smooth and its thickness was not uniform care should be taken to mount the
sample such that a major portion of the plane was in the same focal plane. The FTIR imaging was
performed in AIM-800 Automatic Infra red Microscope (SHIMADZU).
FIG 23 : (a) FTIR spectrophotometer, (b)-(c) AIM-800 Automatic Infra red Microscope, (d) 2-D view
taken by the microscope equipped video camera.
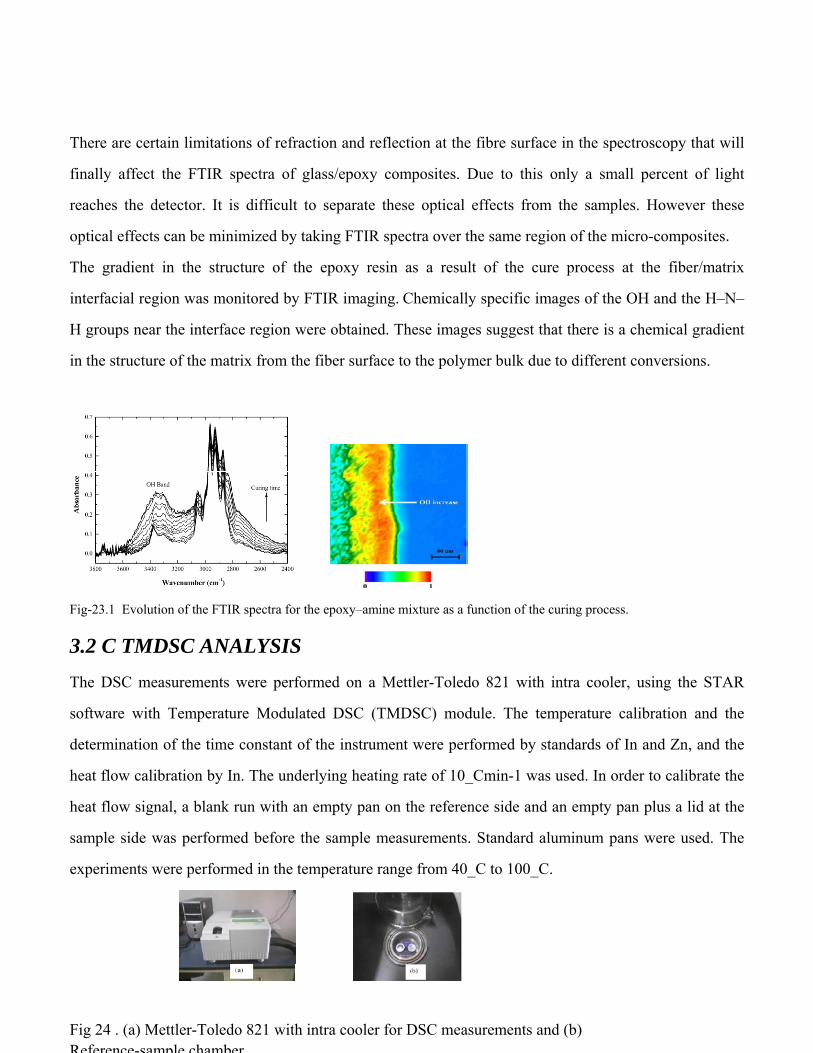
There are certain limitations of refraction and reflection at the fibre surface in the spectroscopy that will
finally affect the FTIR spectra of glass/epoxy composites. Due to this only a small percent of light
reaches the detector. It is difficult to separate these optical effects from the samples. However these
optical effects can be minimized by taking FTIR spectra over the same region of the micro-composites.
The gradient in the structure of the epoxy resin as a result of the cure process at the fiber/matrix
interfacial region was monitored by FTIR imaging. Chemically specific images of the OH and the H–N–
H groups near the interface region were obtained. These images suggest that there is a chemical gradient
in the structure of the matrix from the fiber surface to the polymer bulk due to different conversions.
Fig-23.1 Evolution of the FTIR spectra for the epoxy–amine mixture as a function of the curing process.
3.2 C TMDSC ANALYSIS The DSC measurements were performed on a Mettler-Toledo 821 with intra cooler, using the STAR
software with Temperature Modulated DSC (TMDSC) module. The temperature calibration and the
determination of the time constant of the instrument were performed by standards of In and Zn, and the
heat flow calibration by In. The underlying heating rate of 10_Cmin-1 was used. In order to calibrate the
heat flow signal, a blank run with an empty pan on the reference side and an empty pan plus a lid at the
sample side was performed before the sample measurements. Standard aluminum pans were used. The
experiments were performed in the temperature range from 40_C to 100_C.
Fig 24 . (a) Mettler-Toledo 821 with intra cooler for DSC measurements and (b) Reference-sample chamber

3.2 D SCANNING ELECTRON MICROSCOPE (SEM) The SEM micrographs of as received powder, milled powder samples were obtained using
the scanning electron microscope. The images were taken in both secondary electrons (SE)
And back scattered electron (BSE) mode according to requirement. Microscopic studies to
Examine the morphology; particle size and microstructure were done by a JEOL 6480 LV
Scanning electron microscope (SEM) equipped with an energy dispersive X-ray (EDX)
Detector of Oxford data reference system. Micrographs are taken at suitable accelerating
Voltages for the best possible resolution using the secondary electron imaging.
FIG:23.2 JEOL JSM-6480LV scanning electron microscope. 3.2. E Flexural test (Short Beam Shear Test)
The short beam shear tests were carried out for first batch of samples immediately after exposure to
cryogenic temperature. The former samples after exposure to room temperature and the untreated as-
cured samples were tested in short beam shear test at room temperature. All the mechanical flexural tests
were performed at 2, 50, 100, 200 and 500 mm/min crosshead speeds.
Then breaking load and strain at maximum load was measured from stress vs strain graphs for all
the samples. An Instron1195 tensile testing machine was used to perform SBS tests in accordance with
ASTM D 2344-84 standard. Multiple samples were tested at each point of experiment and the average
value was reported.
FIG 25: Instron 1195

*********************************
Chapter – 4
Hygrothermal treatment
Thermal shock
Thermal spike
Results and discussions
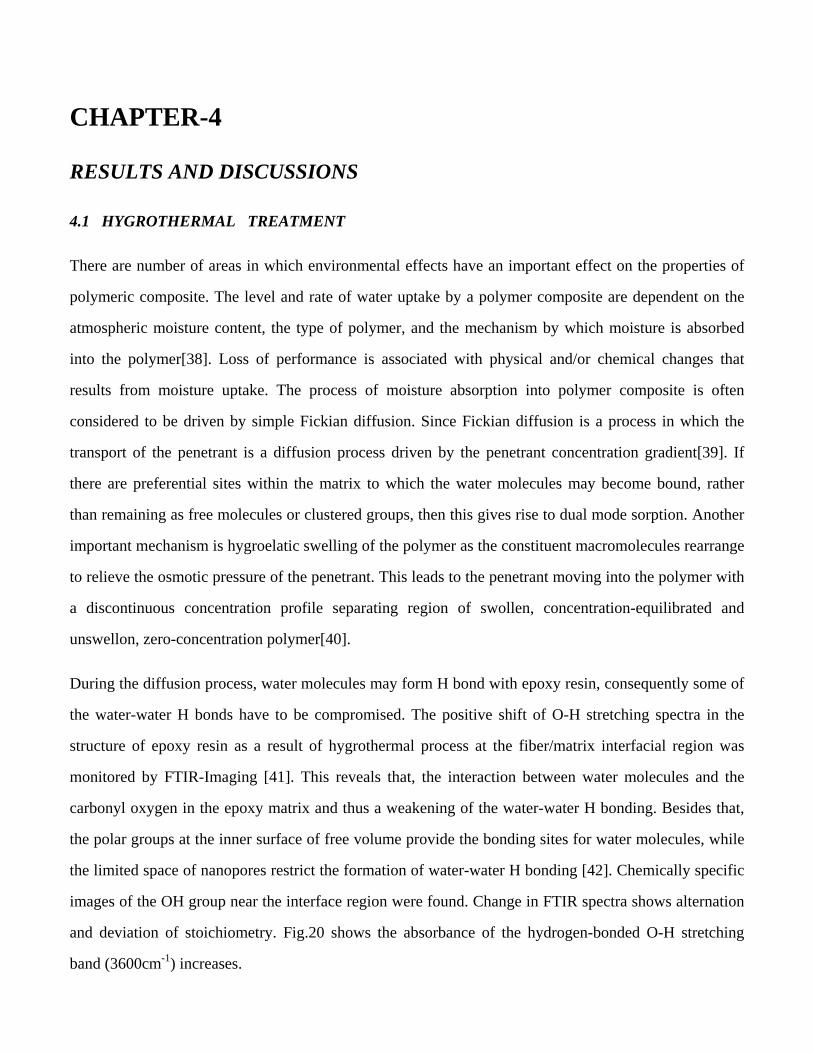
CHAPTER-4
RESULTS AND DISCUSSIONS
4.1 HYGROTHERMAL TREATMENT
There are number of areas in which environmental effects have an important effect on the properties of
polymeric composite. The level and rate of water uptake by a polymer composite are dependent on the
atmospheric moisture content, the type of polymer, and the mechanism by which moisture is absorbed
into the polymer[38]. Loss of performance is associated with physical and/or chemical changes that
results from moisture uptake. The process of moisture absorption into polymer composite is often
considered to be driven by simple Fickian diffusion. Since Fickian diffusion is a process in which the
transport of the penetrant is a diffusion process driven by the penetrant concentration gradient[39]. If
there are preferential sites within the matrix to which the water molecules may become bound, rather
than remaining as free molecules or clustered groups, then this gives rise to dual mode sorption. Another
important mechanism is hygroelatic swelling of the polymer as the constituent macromolecules rearrange
to relieve the osmotic pressure of the penetrant. This leads to the penetrant moving into the polymer with
a discontinuous concentration profile separating region of swollen, concentration-equilibrated and
unswellon, zero-concentration polymer[40].
During the diffusion process, water molecules may form H bond with epoxy resin, consequently some of
the water-water H bonds have to be compromised. The positive shift of O-H stretching spectra in the
structure of epoxy resin as a result of hygrothermal process at the fiber/matrix interfacial region was
monitored by FTIR-Imaging [41]. This reveals that, the interaction between water molecules and the
carbonyl oxygen in the epoxy matrix and thus a weakening of the water-water H bonding. Besides that,
the polar groups at the inner surface of free volume provide the bonding sites for water molecules, while
the limited space of nanopores restrict the formation of water-water H bonding [42]. Chemically specific
images of the OH group near the interface region were found. Change in FTIR spectra shows alternation
and deviation of stoichiometry. Fig.20 shows the absorbance of the hydrogen-bonded O-H stretching
band (3600cm-1) increases.
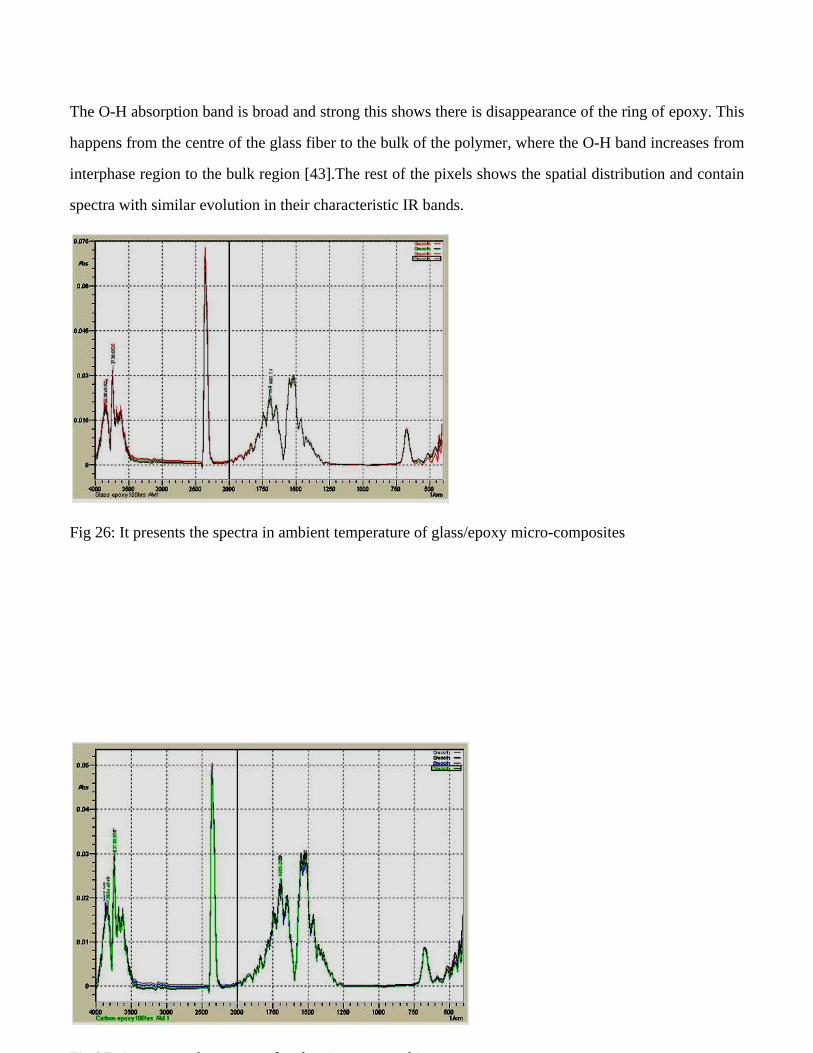
The O-H absorption band is broad and strong this shows there is disappearance of the ring of epoxy. This
happens from the centre of the glass fiber to the bulk of the polymer, where the O-H band increases from
interphase region to the bulk region [43].The rest of the pixels shows the spatial distribution and contain
spectra with similar evolution in their characteristic IR bands.
Fig 26: It presents the spectra in ambient temperature of glass/epoxy micro-composites
Fi 27 i h f b / bi

Fig 28 : It shows the shift of spectra of glass/epoxy micro-composites after hygrothermal treatment.
Fig 29: it shows the shift of spectra of carbon/epoxy after hygrothermal treatment.
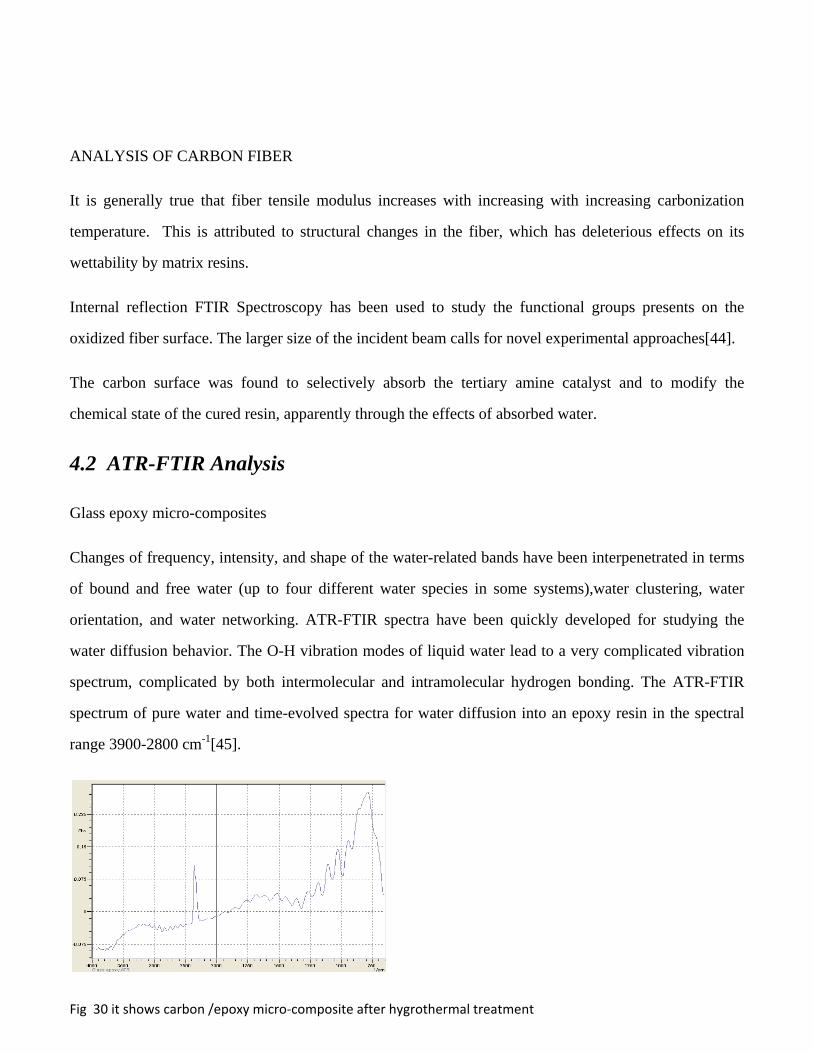
ANALYSIS OF CARBON FIBER
It is generally true that fiber tensile modulus increases with increasing with increasing carbonization
temperature. This is attributed to structural changes in the fiber, which has deleterious effects on its
wettability by matrix resins.
Internal reflection FTIR Spectroscopy has been used to study the functional groups presents on the
oxidized fiber surface. The larger size of the incident beam calls for novel experimental approaches[44].
The carbon surface was found to selectively absorb the tertiary amine catalyst and to modify the
chemical state of the cured resin, apparently through the effects of absorbed water.
4.2 ATR-FTIR Analysis
Glass epoxy micro-composites
Changes of frequency, intensity, and shape of the water-related bands have been interpenetrated in terms
of bound and free water (up to four different water species in some systems),water clustering, water
orientation, and water networking. ATR-FTIR spectra have been quickly developed for studying the
water diffusion behavior. The O-H vibration modes of liquid water lead to a very complicated vibration
spectrum, complicated by both intermolecular and intramolecular hydrogen bonding. The ATR-FTIR
spectrum of pure water and time-evolved spectra for water diffusion into an epoxy resin in the spectral
range 3900-2800 cm-1[45].
Fig 30 it shows carbon /epoxy micro‐composite after hygrothermal treatment
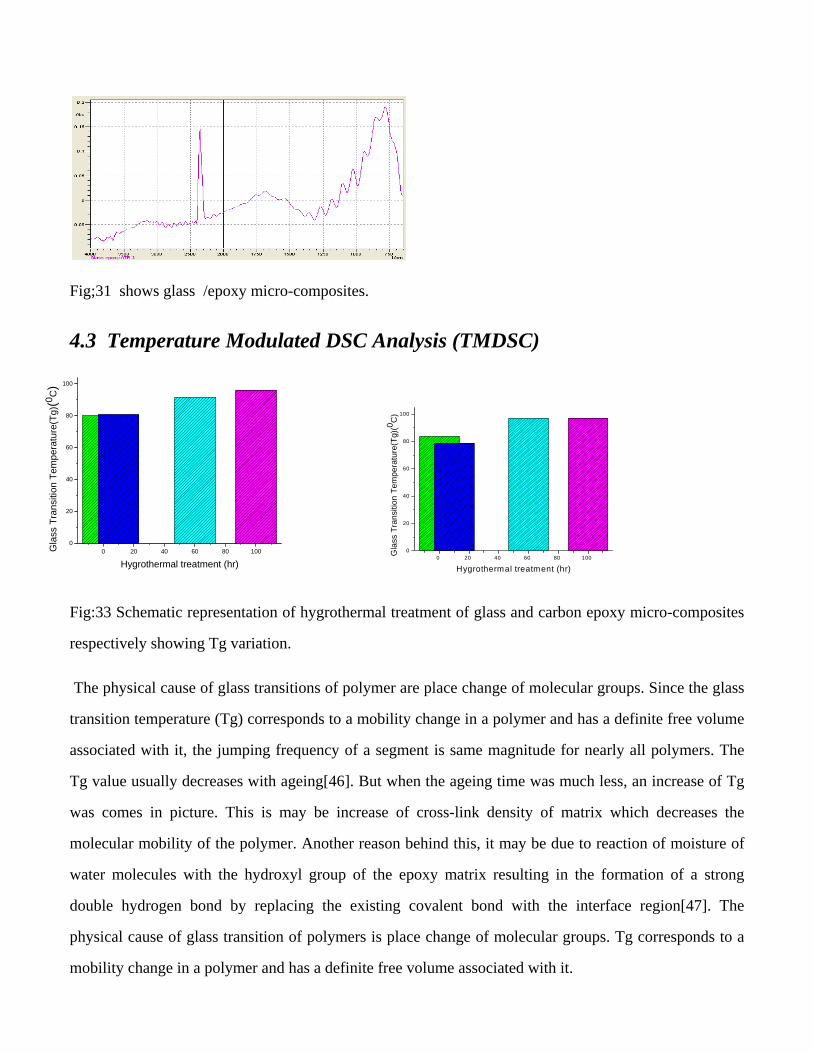
Fig;31 shows glass /epoxy micro-composites.
4.3 Temperature Modulated DSC Analysis (TMDSC)
Fig:33 Schematic representation of hygrothermal treatment of glass and carbon epoxy micro-composites
respectively showing Tg variation.
The physical cause of glass transitions of polymer are place change of molecular groups. Since the glass
transition temperature (Tg) corresponds to a mobility change in a polymer and has a definite free volume
associated with it, the jumping frequency of a segment is same magnitude for nearly all polymers. The
Tg value usually decreases with ageing[46]. But when the ageing time was much less, an increase of Tg
was comes in picture. This is may be increase of cross-link density of matrix which decreases the
molecular mobility of the polymer. Another reason behind this, it may be due to reaction of moisture of
water molecules with the hydroxyl group of the epoxy matrix resulting in the formation of a strong
double hydrogen bond by replacing the existing covalent bond with the interface region[47]. The
physical cause of glass transition of polymers is place change of molecular groups. Tg corresponds to a
mobility change in a polymer and has a definite free volume associated with it.
0 20 40 60 80 1000
20
40
60
80
100
Gla
ss T
rans
ition
Tem
pera
ture
(Tg)
(0C
)
Hygrothermal treatment (hr)0 20 40 60 80 100
0
20
40
60
80
100
Gla
ss T
rans
ition
Tem
pera
ture
(Tg)
(0 C)
Hygrothermal treatment (hr)
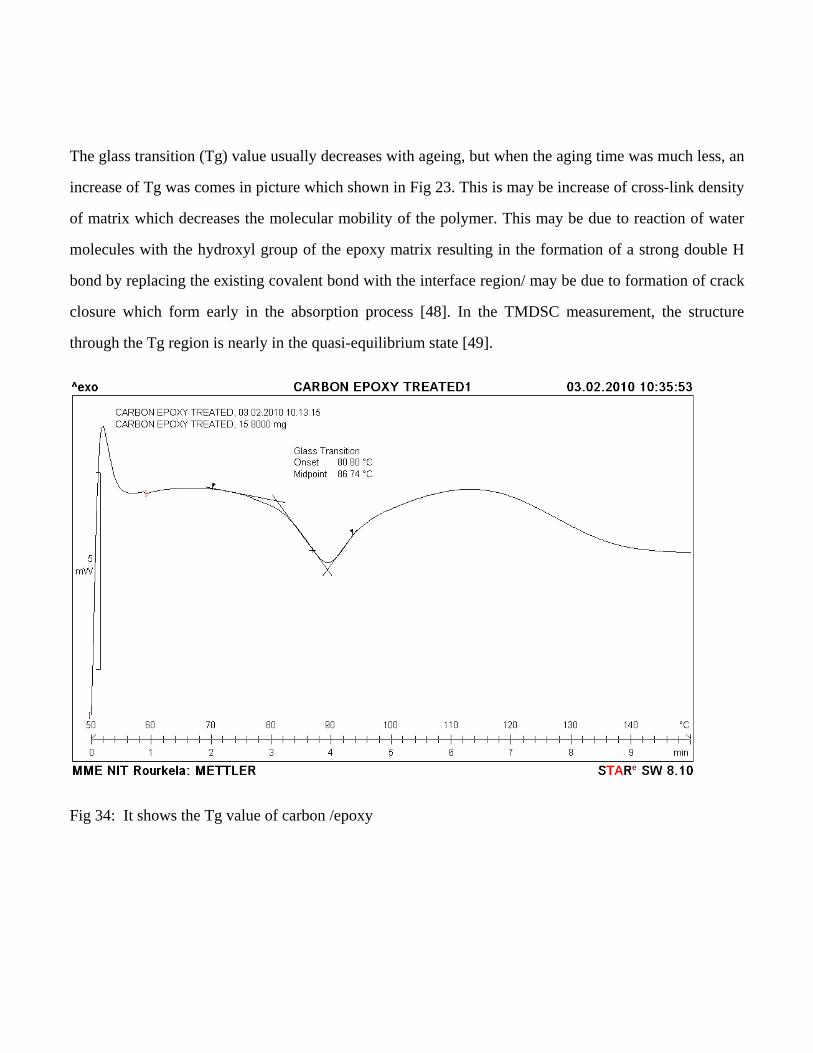
The glass transition (Tg) value usually decreases with ageing, but when the aging time was much less, an
increase of Tg was comes in picture which shown in Fig 23. This is may be increase of cross-link density
of matrix which decreases the molecular mobility of the polymer. This may be due to reaction of water
molecules with the hydroxyl group of the epoxy matrix resulting in the formation of a strong double H
bond by replacing the existing covalent bond with the interface region/ may be due to formation of crack
closure which form early in the absorption process [48]. In the TMDSC measurement, the structure
through the Tg region is nearly in the quasi-equilibrium state [49].
Fig 34: It shows the Tg value of carbon /epoxy
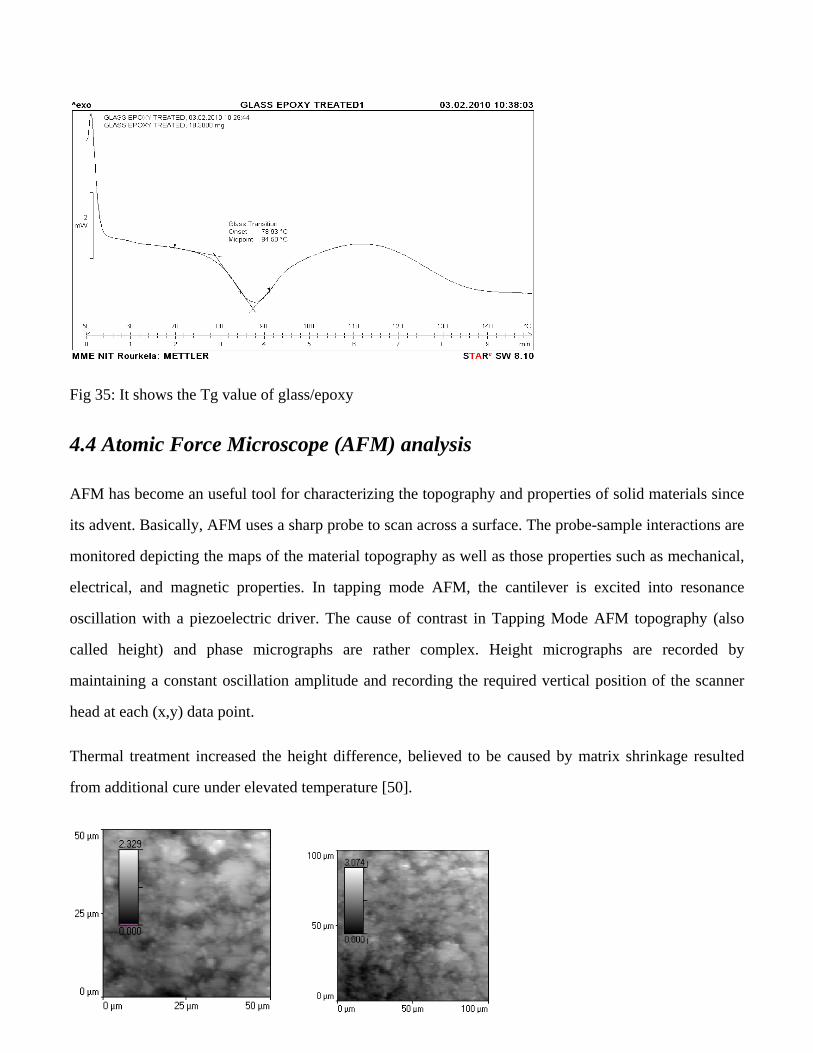
Fig 35: It shows the Tg value of glass/epoxy
4.4 Atomic Force Microscope (AFM) analysis
AFM has become an useful tool for characterizing the topography and properties of solid materials since
its advent. Basically, AFM uses a sharp probe to scan across a surface. The probe-sample interactions are
monitored depicting the maps of the material topography as well as those properties such as mechanical,
electrical, and magnetic properties. In tapping mode AFM, the cantilever is excited into resonance
oscillation with a piezoelectric driver. The cause of contrast in Tapping Mode AFM topography (also
called height) and phase micrographs are rather complex. Height micrographs are recorded by
maintaining a constant oscillation amplitude and recording the required vertical position of the scanner
head at each (x,y) data point.
Thermal treatment increased the height difference, believed to be caused by matrix shrinkage resulted
from additional cure under elevated temperature [50].

Fig 36- it
4.4 M
It is at th
expansio
structure
to moistu
This swe
the liquid
Fig 37 ; s
Fig 38: F
t shows the h
Microscop
he interfacia
n coefficien
and the tim
ure absorptio
elling stress
d while stretc
shows the sw
Fiber/matrix
height image
pic Interp
al region wh
nt between
me of curing s
on [51]. Aft
is related to
ching polym
welling stres
x debonding
e of the hybr
phase An
here stress c
the reinforc
shrinkage. S
ter hygrother
o the differen
meric chains
s of glass/ep
rid composit
nalysis:
concentratio
cement and
Some degree
rmal treatme
ntial strain w
and molecul
poxy micro-c
te after therm
on develop b
the matrix
of debondin
ent this curi
which create
les form dise
composites.
mal shock tre
because of d
phase due
ng at the inte
ng stress co
ed by the ex
entanglemen
eatment.
difference in
to loads ap
erface region
onverts to sw
xpansion forc
nt shown in F
n the therma
pplied to th
n appears du
welling stres
ce exerted b
Fig.37
al
he
ue
s.
by
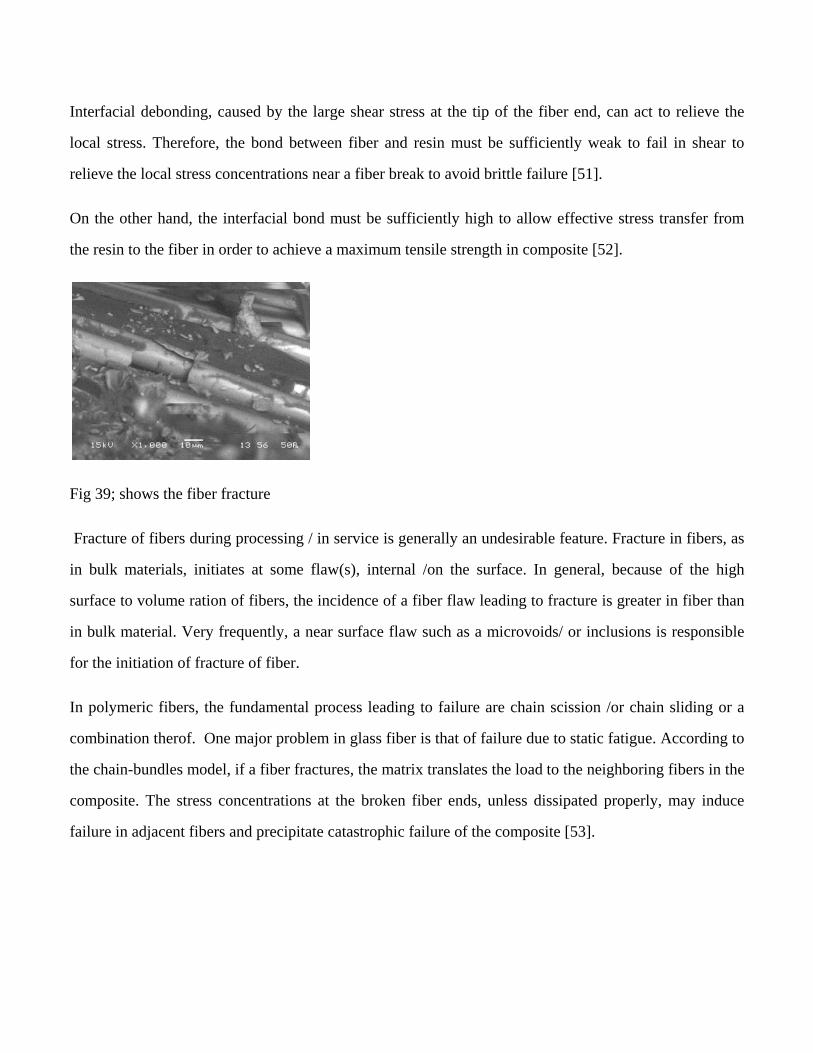
Interfacial debonding, caused by the large shear stress at the tip of the fiber end, can act to relieve the
local stress. Therefore, the bond between fiber and resin must be sufficiently weak to fail in shear to
relieve the local stress concentrations near a fiber break to avoid brittle failure [51].
On the other hand, the interfacial bond must be sufficiently high to allow effective stress transfer from
the resin to the fiber in order to achieve a maximum tensile strength in composite [52].
Fig 39; shows the fiber fracture
Fracture of fibers during processing / in service is generally an undesirable feature. Fracture in fibers, as
in bulk materials, initiates at some flaw(s), internal /on the surface. In general, because of the high
surface to volume ration of fibers, the incidence of a fiber flaw leading to fracture is greater in fiber than
in bulk material. Very frequently, a near surface flaw such as a microvoids/ or inclusions is responsible
for the initiation of fracture of fiber.
In polymeric fibers, the fundamental process leading to failure are chain scission /or chain sliding or a
combination therof. One major problem in glass fiber is that of failure due to static fatigue. According to
the chain-bundles model, if a fiber fractures, the matrix translates the load to the neighboring fibers in the
composite. The stress concentrations at the broken fiber ends, unless dissipated properly, may induce
failure in adjacent fibers and precipitate catastrophic failure of the composite [53].
4.5 Assessment of mechanical behavior (implication of thermal spike)
Hybridization provides materials designers with an added degree of freedom in tailoring composite to
achieve a better balance of stiffness, strength, increased failure strain, better damage tolerances,
improved ability to absorb impact energy and possibly a significant reduction in cost[54]. The structural
integrity and lifetime performance of fibrous polymeric composite are strongly dependent on the stability
of the fiber/polymer interfacial region. This region is the site of synergy in composite materials and its
influence to overall mechanical properties is significant.
Thermal expansion coefficients in polymers are considerably high. Thus the interfacial de-bonding may occur
under extremes of temperature. The cooling from high temperature to low temperature generally produces
tensile stresses at the surface and compressive stresses in the interior[55]. They are also susceptible to
crack initiation and propagation along the laminar interfaces in various failure modes. Thermal stresses
caused by temperature gradient should be given special attention in many application areas. The presence
of these stresses can result in matrix cracking. In an FRP composite, the fiber and the matrix have
different coefficients of thermal expansions (CTE). Hence, excursions through the same temperature
range results in differential expansion. This induces additional stresses at the fiber-matrix interface,
thereby weakening the interfacial region.
The ILSS value calculated as,
ILSS=075P
bt

0 2 4 6 8 1024.5
25.0
25.5
26.0
26.5
27.0
27.5
28.0
28.5
29.0
29.5
30.0
ILS
S V
ALU
E IN
MP
a
conditioning time (min)
1mm/min 500 mm/min
Fig 40: variation of ILSS value with respect of conditioning time at 1500 C.
0 1 2 3 4 5
24
25
26
27
28
29
30
ILSS
Val
ue in
MPa
conditioning time (min)
1mm/min 500mm/min
Fig41: variation of ILSS value with conditioning time at 2000C.
Thermal spike at 1500c temperature might possibly improve adhesion level at the
interface. This effect is supposed to increase with less conditioning time. It is possibly attributed by
surface chemistry principle at the fiber/polymer interface.
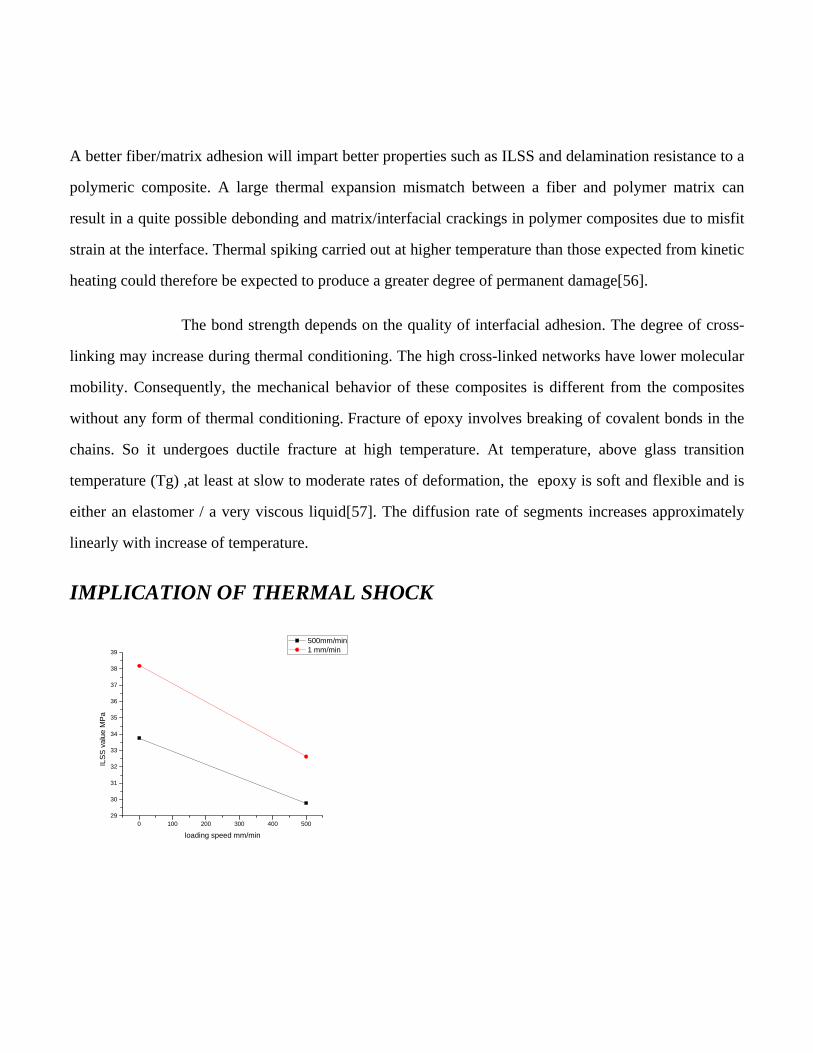
A better fiber/matrix adhesion will impart better properties such as ILSS and delamination resistance to a
polymeric composite. A large thermal expansion mismatch between a fiber and polymer matrix can
result in a quite possible debonding and matrix/interfacial crackings in polymer composites due to misfit
strain at the interface. Thermal spiking carried out at higher temperature than those expected from kinetic
heating could therefore be expected to produce a greater degree of permanent damage[56].
The bond strength depends on the quality of interfacial adhesion. The degree of cross-
linking may increase during thermal conditioning. The high cross-linked networks have lower molecular
mobility. Consequently, the mechanical behavior of these composites is different from the composites
without any form of thermal conditioning. Fracture of epoxy involves breaking of covalent bonds in the
chains. So it undergoes ductile fracture at high temperature. At temperature, above glass transition
temperature (Tg) ,at least at slow to moderate rates of deformation, the epoxy is soft and flexible and is
either an elastomer / a very viscous liquid[57]. The diffusion rate of segments increases approximately
linearly with increase of temperature.
IMPLICATION OF THERMAL SHOCK
0 100 200 300 400 50029
30
31
32
33
34
35
36
37
38
39
ILSS
val
ue M
Pa
loading speed mm/min
500mm/min 1 mm/min
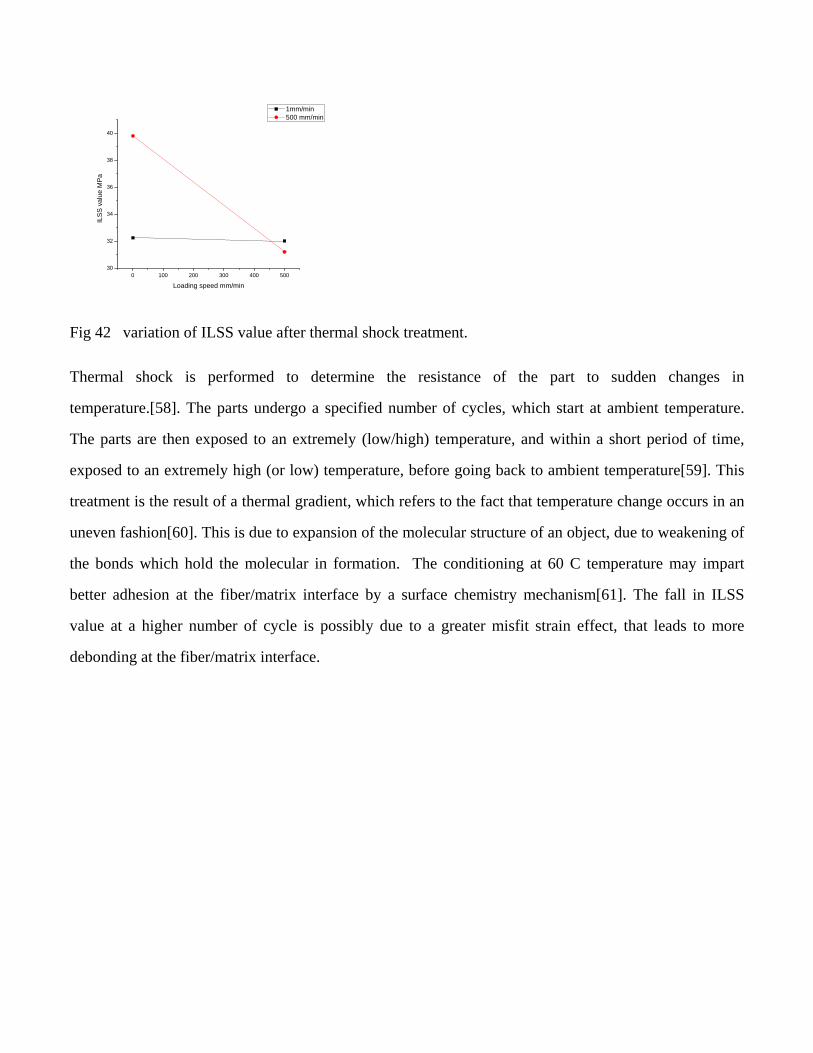
0 100 200 300 400 50030
32
34
36
38
40
ILSS
val
ue M
Pa
Loading speed mm/min
1mm/min 500 mm/min
Fig 42 variation of ILSS value after thermal shock treatment.
Thermal shock is performed to determine the resistance of the part to sudden changes in
temperature.[58]. The parts undergo a specified number of cycles, which start at ambient temperature.
The parts are then exposed to an extremely (low/high) temperature, and within a short period of time,
exposed to an extremely high (or low) temperature, before going back to ambient temperature[59]. This
treatment is the result of a thermal gradient, which refers to the fact that temperature change occurs in an
uneven fashion[60]. This is due to expansion of the molecular structure of an object, due to weakening of
the bonds which hold the molecular in formation. The conditioning at 60 C temperature may impart
better adhesion at the fiber/matrix interface by a surface chemistry mechanism[61]. The fall in ILSS
value at a higher number of cycle is possibly due to a greater misfit strain effect, that leads to more
debonding at the fiber/matrix interface.
CONCLUSION
In this work the process of water uptake kinetics in glass/epoxy micro-composite have been monitored.
The experiments were carried out by TMDSC, FTIR-Imaging, AFM, and SEM to complementary follow
the process in the whole composite system. TMDSC results where there is a marked increase in Tg value,
because of formation of double H bond with the epoxy system by water molecules. The increase in
absorbance peaks of OH stretching bands at the interphase was found in FTIR-Imaging. Thermal
treatment increased the height difference, believed to caused by matrix shrinkage resulted from
additional cure under elevated temperature. There is a wide variation of mechanical behavior needs to be
supported by the understanding of the science at the fiber/polymer interface region. The importance of
this investigation is to explore the interfacial chemistry which decisively controls the integrity and
consistency of mechanical performance.

REFERENCES
1. Callister W D. Materials Science and Engineering-An Introduction. Asia: John Wiley and
Sons, 2001.
2. Kelly A, Zweben C. Comprehensive Composite Materials, Polymer Matrix Composites.
Oxford, U.K: Elsevier Science Publication, 2000.
3. Daniel Gay,Suong V.Hoa, Composite Materials (Design and Applications),CRC Press 2007
4. Jang B Z, Advanced Polymer Composites: Principle and Applications, ASM
International, Materials Park, OH, 1994.
5. Aggarwal B D, Broutman L J. Analysis and performance of Fiber Composites. Canada:
Wiley-Interscience, 1990.
6. Donnet J B, Bansal R C. Carbon Fibers. New York: International Fiber Science and
Technology, 1984.
7. Hull D, Clyne T W. An Introduction to Composite Materials. Cambridge, UK:
Cambridge Univ. Press, 1996.
8. Dao B, Hodgkin J, Krstina J, Mardel J, Tian W, “Accelerated Aging Versus Realistic
Aging in Aerospace Composite Materials. II. Chemistry of Thermal Aging in a Structural
Composite.” Journal of Applied Polymer Science. Volume 102, (2006): p. 3221–3232
9. www.eng.fea.ru/FEA_news_473.html‐‐15/5/2010
10. www.owenscorning.com/.../markets/Automotive.asp‐‐‐‐15/5/2010
11. Jedidi J, Jacquemin F, Vautrin A, “Design of accelerated hygrothermal cycles on polymer
Matrix composites in the case of a supersonic aircraft.” Journal of Composite Structures.
Volume 68, (2005): p. 429–437.
12. ASTM Metal Handbook, vol-21
13. Ray B C, “Temperature effect during humid ageing on interfaces of glass and carbon Fibers
reinforced epoxy composites.” Journal of Colloid and Interface Science. Volume 298, (2006): p.111-117.
14. G.Z Xiao, M.E.R SHANAHAN, Water absorption and desorption in an epoxy resin with degradation,
Journal of Polymer Science,vol-35,(1997),p-2659-2670
15. Ray B C, “Adhesion of Glass/Epoxy Composites Influenced by Thermal and Cryogenic
Environments.” Journal of Applied Polymer Science. Volume 102, No. 2, (2006): p.1943-1949.
16. Costa M L, Muller de Almeida S F, Rezende M C, “Hygrothermal Effects on Dynamic Mechanical
Analysis and Fracture Behavior of Polymeric Composites.” Journal of Materials Research. Volume 8,
No. 3, (2005): p. 335-340.
17. Kim J K, Mai Y W. Engineered Interfaces in Fiber Reinforced Composites. New York: Elsevier,
1998.
18. Lee S M. Handbook of Composite Materials. New York: VCH Publishers, 1993.
19. Abdel-Magid B, Ziaee S, Gass K, Schneider M, “The combined effects of load, moisture
and temperature on the properties of E-glass/epoxy composites.” Composite Structures.
Volume 71, (2005): p. 320-326.
20. Ray B C, Biswas A, Sinha P K, “Hygrothermal effects on the mechanical behaviour of
fibre reinforced Polymeric Composites.” Metals Materials and Processes. Volume 3, No.
2, (1991): p. 99-108.
21. Popineau S, Rondeau-Mouro C, Sulpice-Gaillet C, Shanahan M E R, “Free/bound water
absorption in an epoxy adhesive”. Polymer. Volume 46, (2005): p. 10733-10740.
22. Gonzalez-Benito J, “The nature of structure gradient in epoxy curing at a glass fiber/epoxy matrix
interface using FTIR imaging.” Journal of Colloid Interface Science. Volume 267, (2003): p. 326-332.
23 Bechela V T, Campingb J D, Kim R Y, “Cryogenic/elevated temperature cycling induced
leakage paths in PMCs.” Composites: Part B. Volume 36, (2005): p. 171–182.
25. Jedidia J, Jacquemin F, Vautrin A, “Accelerated hygrothermal cyclical tests for Carbon/epoxy
laminates.” Composites: Part A. Volume 37, (2006): p. 636-647.
26. Kim M G, Kang S G, Kim C G, Kong C W, “Tensile response of graphite/epoxy
Composites at low temperatures.” Composite Structures. Volume 79, (2007): p. 84–89.
27. Michael D.Weir,Christophe Bastide,and Chong Sook Paik Sung, “ Characterisation of interaction of
water in epoxy by UV reflection spectroscopy”, Jof Macromolecules,vol-34,(2001),p-4923-4926
28. Neeti Sharama,M.Surendra Kumar and B.C.Ray, “ Study of the effect of hygrothermal ageing on
glass/epoxy micro-composites by FTIR-Imaging and Alternating DSC Techniques”,J of Reinforced
Plastics and Composites,vol-27,(2008),p-1625-1634
29. James A Hough,Sunil K.Karad,Frank R.Jones, “ The effect of thermal spiking on moisture
absorption,mechanical and viscoelastic properties of carbon fiber reinforced epoxy laminates”. J of
Composites Science and Technology, Vol-65 (2005) p-1299-1305
30. Emile S.Greenhalagh, Failure analysis and fractography of polymer composites,Woodhead
Publishing Limited.
31. B.C Ray, “ Thermal shock on interfacial adhesion of thermally conditioned glass fiber/epoxy
composites,” J of Material Letters ,vol-58,(2004),p-2175-2177
32. Jiming Zhou,James P.Lucas , “ Hygrothermal effects of epoxy resin.Part II-variations of glass
transition temperature”,J of Polymer,vol-40,(1999),p-5513-5522
33. D.Tonchev,S.O.Kasap, “ Effect of aging on glass transformation measurements by temperature
modulated DSC.” J of Material Science and Engineering A,Vol-A328,(2002),P-62-66.
34. W.Noobut,J.L.Koenig, “Interfacial behavior of epoxy/E-glass fiber composites under wet-dry cycles
by Fourier Transform Infrared Microspectroscopy.” J of Polymer composites, vol-20,(1999),p-38-47.
35. D.Olmos,R.Lopez-Moron,J.Gonzalez-Benito, “The nature of the glass fiber surface and its effects in
the water absorption of glass fiber/epoxy composites. The use of fluorescence to obtain information at
the interface”, J of Composites Science And Technology,vol-66,(2006),p-2758-2768.
36.Mohan J. Organic Spectroscopy. New Delhi, India: Narosa Publication House, 2000.
37. Willard H H. Instrumental Methods of Analysis. New Delhi, India: CBS Publishers and
Distributors, 1986.
38. Poljansek I, Krajnc M, “Alternating differential scanning calorimetry: isothermal curing
of the epoxy resin.” Journal of Acta Chimica Slovenica. Volume 50, (2003): p. 461-472.
39. Timmerman J F, Tillman M S, Matthew S, Hayes, Brian S, Seferis J C, “Matrix and fiber
influences on the cryogenic micro cracking of carbon fiber/epoxy composites.” Composites Part A:
Applied Science and Manufacturing. Volume 33, No. 3, (2002): p. 323-329.
40. Taher S T, Mahdi E, Mokhtar A S, Magid D L, Ahmadun F R, Arora P R, “A new composite energy
absorbing system for aircraft and helicopter.” Composite Structures. Volume 75, (2006): p.14-23.
41. Eidelman N, Raghavan D, Forster A M, Amis E J, Karim A, “Combinatorial approach to
Characterizing epoxy curing.” Macromolecular Rapid Communication. Volume 25, (2004): p. 259-263.
42. Zheng Q, Morgan R J, “Synergistic Thermal-Moisture Damage Mechanisms of Epoxies
and Their Carbon Fiber Composites.” Journal of Composite Materials. Volume 27, No.
14, (1993): p. 1465-1478.
43. Liang L, Zhang S Y, Chen Y H, Liu M J, Ding Y F, Luo X W, Pu Z, Zhou W F and Li S,
“Water Transportation in Epoxy Resin.” Chemical Materials. Volume 17, (2005): p. 839- 845.
44. Ray B C, “Effects of crosshead velocity and sub-zero temperature on mechanical
behavior of hygrothermally conditioned glass fibre reinforced epoxy composites.”
Materials Science and Engineering A. Volume 379, (2004): p. 39-44.
45. Ray B C, “Thermal shock on interfacial adhesion of thermally conditioned glass
Fiber/epoxy composites.” Materials Letters. Volume 58, (2004): p. 2175-2177.
46. Gautier L, Mortaigne B, Bellenger V, “Interface damage study of hydrothermally aged
Glass-fibre-reinforced polyester composites.” Composites Science and Technology.
Volume 59, (1999): p. 2329-2337.
47. Olmos D, Lopez-Moron R, Gonzalez-Benito J, “The nature of the glass fibre surface and
its effect in the water absorption of glass/epoxy composites. The use of fluorescence to
obtain information at the interface.” Composites Science and Technology. Volume 66,
(2006): p. 2758-2768.
48. Tsenoglou C J, Pavlidou S, Papaspyrides C D, “Evaluation of interfacial relaxation due to
water absorption in fiber-polymer composites.” Composites Science and Technology.
Volume 66, (2006): p. 2855-2864.
49. Gonzalez-Benito J, Olmos D, Sanchez P G, Aznar A J, Baselga J, “Kinetic study of the
cure process at the silica microfibers/epoxy interface using pyrene fluorescence
response.” Journal of Materials Processing Technology. Volume 143, (2003): p. 153-157.
50. Wu P, Siesler H W, “Water diffusion into epoxy resin: a 2D correlation ATR-FTIR
investigation.” Chemical Physics Letters. Volume 374, (2003): p. 74-78.
51. Clegg D W, Collyer A A. Polymeric Materials. London: The Institute of Materials, 1993.
52. Lin Y C, Chen X, “Moisture sorption–desorption–resorption characteristics and its effect
on the mechanical behavior of the epoxy system.” Polymer. Volume 46, No. 25, (2005):
p. 11994-12003.
53. G.Z.Xiao,M.E.R.Shanahan, “ Water absorption and desorption in an Epoxy Resin with degradation.”
J of Polymer Science Part B: Polymer Physics,vol-35,(1997),p-2659-2670.
54. Ying Wang,Thomas H.Hahn, “AFM characterization of the interfacial properties of carbon fiber
reinforced polymer composites subjected to hygrothermal treatments.J of Composites Science and
Technology,vol-67,(2007),p-92-101.
55. A.F Abdelkader,J.R.White, “ Water absorption in epoxy resins: The effects of the crosslinking agent
and curing temperature,” J of Applied Polymer Science ,vol-98,(2005),p-2544-2549.

56. Saniee F F, Majzoobi G H, Bahrami M, “An experimental study on the behavior of glass–
epoxy composite at low strain rates.” Journal of Materials Processing Technology.
Volume 162, No. 1, (2005): p. 39–45.
57. Rıo T G, Zaera R, Barbero E, Navarro C, “Damage in CFRPs due to low velocity impact
at low temperature.” Composites: Part B. Volume 36, No. 1, (2005): p. 41–50.
58. Surendra K M, Chawla N, Priyadarsini A, Mishra I, Ray B C, “Assessment of
microstructural integrity of glass/epoxy composites at liquid nitrogen temperature.”
Journal of Reinforced Plastics and Composites. (2007) in print.
59. Ray B C, “Thermal shock and thermal fatigue on delamination of glass fiber reinforced
polymeric composites.” Journal of Reinforced Plastics and Composites. Volume 24, No.
1, (2005): p. 111-116.
60. Ray B C, “Effect of thermal and cryogenic conditionings on mechanical behavior of
thermally shocked glass fiber/epoxy composites.” Journal of Reinforced Plastics and
Composites. Volume 24, No. 7, (2005): p. 713-717.
61. Indumathi J, Bijwe J, Ghosh A K, Fahim M, Krishnaraj N, “Wear of cryo-treated
engineering polymers and composites.” Wear. Volume 225, No. 1, (1999): p. 343-353.


![1 Interfacial Rheology System. 2 Background of Interfacial Rheology Interfacial Shear Stress Interfacial Shear Viscosity = [ ]](https://img.pdfslide.us/doc/110x75/56649d1f5503460f949f3d29/1-interfacial-rheology-system-2-background-of-interfacial-rheology-interfacial.jpg)