Embed Size (px)
Citation preview

Characterization of Infield Vehicle Activityand Exhaust Emissions from Diesel Powered
Off-road Equipment
Mridul Gautam, Ph.D.Professor
Department of Mechanical and Aerospace Engineering
West Virginia University
September 6, 2002
Problem Statement
• The current certification test, the ISO-8178 Type C 8-modetest, provides inaccurate estimates of some off-highwayequipment contributions to emission inventories.
• Transient results differ from steady-state results because offactors such as the acceleration and deceleration ratesencountered in the actual operation of the vehicle
• One set of weighting factors created for the 8-mode test ismeant to represent all off-highway equipment
-steady-state equipment (pumps, generators, etc.)
-transient equipment (loaders, street sweepers, etc.)

Global Objective
• To measure emissions from off-road equipment, operatingin steady-state and transient modes, for emission inventorymodels

Specific Objectives
• Derive transient cycles for selected off-road vehicles thataccurately represent their “real world” operations
• Determine if raw CO2 emissions (measured in-field) can beused to accurately predict engine power output
• Determine the effects of cycle re-creation accuracy andcycle nature on brake-specific emissions results
• Operate both engines on ISO-8178 8-mode Type C testsand compare the weighted brake-specific results withintegrated transient results

Approach
• Investigate the feasibility of power inference from rawCO2 emissions in preliminary laboratory tests
• Collect raw CO2 emissions and engine speed data duringinfield operation
• Predict the in-use engine power from infield CO2
emissions, and develop an appropriate transient test cyclefor each vehicle
• Use the transient cycle developed from the infield data tomeasure emissions in the laboratory using a full-flowdilution tunnel

Test Vehicles and Engines
John Deere 444 Rubber-Tired Loader John Deere 6059 Engine
-Naturally-Aspirated -Inline Six-Cylinder-5.9 Liter-111hp @ 2375rpm-281ft-lbs @ 1010rpm-pre-1996

Test Vehicles and Engines
Elgin Series P Streetsweeper John Deere 4039T Engine -Turbocharged -Inline Four-Cylinder -3.9 Liter -114hp @ 2100rpm -300ft-lbs @ 1710rpm -post-1996

Test Vehicles and Engines
Komatsu PC400LC3 Excavator Komatsu S6D 125-1 Engine
-Turbocharged -Inline Six-Cylinder-11.05 Liter-250 hp @ 1800 rpm-745 ft-lbs @ 1350 rpm-pre-1996

Test Vehicles and Engines
Caterpillar D-11R CD Track-Type Tractor Caterpillar 3508B TA Engine
-Turbocharged-V-8 Cylinder-35 Liter-850 hp @ 1800rpm-post-1996

Test Vehicles and Engines
Caterpillar D-11R CD Track-Type Tractor Caterpillar 3508B TA Engine
-Turbocharged-V-8 Cylinder-35 Liter-850 hp @ 1800rpm-post-1996
MEMS & RPM 100MEMS & RPM 100
MEMS
RPM 100
Annubar®
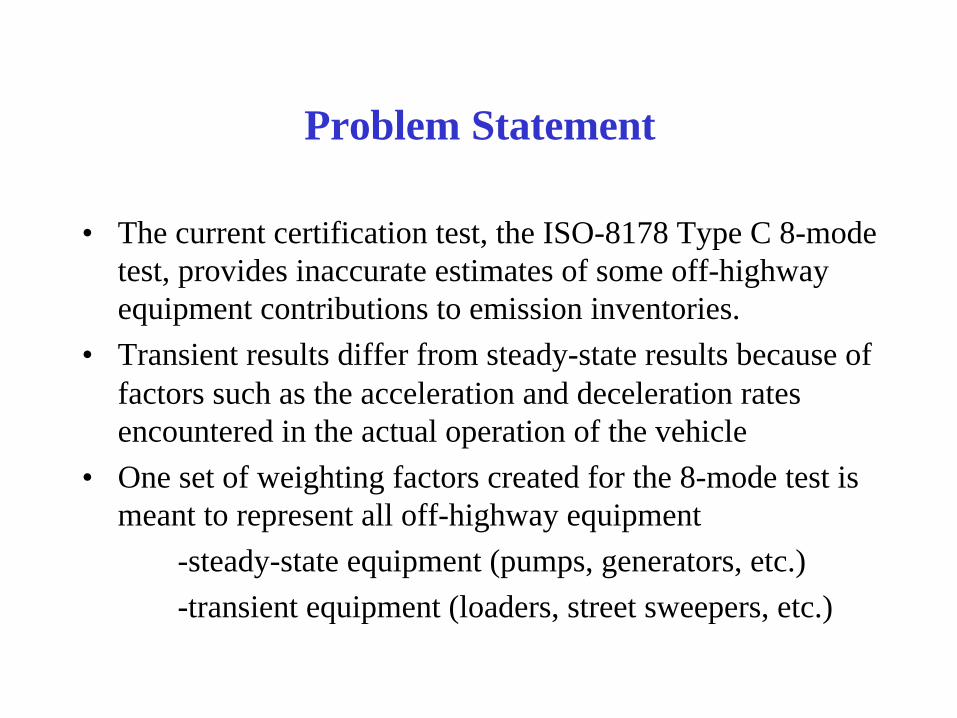
Caterpillar D11 Dozer with a 3508 V-8Engine Operating at a Strip Mine in WV
MEMS & RPM 100
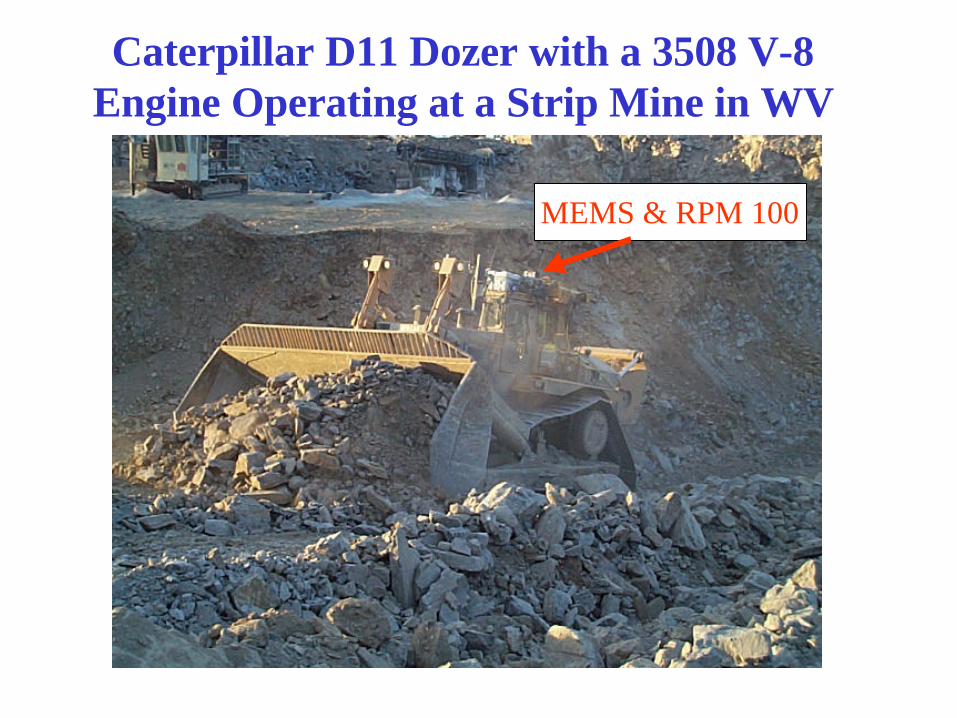
MEMS and RPM 100 on a CAT D11 Dozerwith a 3508 V-8 Engine
MEMS
RPM 100
Annubar®

RPM-100 Packaged for the In-field EmissionsMeasurement from the D-11 Dozer
Sample Conditioning System
Quartz CrystalMicrobalance
12 VDC Pumps
12VDC Power Supply

Schematic of theWVU Mobile Emissions Measurement System
(MEMS)
Flow Meter
Differential Pressure, Absolute Pressure,
Temperature
Ambient Tempera ture,
Pressure, Humidity
NOx, CO2
Diesel Engine
Engine Speed , Vehicle Speed,
To rque
Vehicle Speed and Locat ion
Data Acquisition
Controller
Display
Fuel
Exhaust
Air
Exhaust Sampling and Conditioning
Exhaust Consti tuents
Engine Interface


Infield Data Acquisition System
Engine
SensorsAMB-II
PowerInverter Laptop
Alternator
Tach
Sig
nal L
ine
(RP
M)
Signal
Conditioner
Filter
Sam
pleLine
Serial Cable
Battery
Sam
ple
Pro
be
• Solid-state NDIR
• Exhaust sample transfersystem
• Power inverter
• Engine speed signalconditioning unit
• Laptop computer

Multigas Analyzer
• “Toaster”
• Solid state Non-DispersiveInfrared (NDIR) HC, CO,and CO2 Detection
• Electrochemical Cell NOand O2 Detection
• TTL-Type Signal Inputfor Engine SpeedMeasurement

Preliminary Torque Inference Testing
• Testing was performed on an on-highway CumminsISM370 diesel engine that was available in the EERL
• Five engine load cycles were run while raw emissionswere collected with the Sensors AMB-II (motored, idle,25%, 50%, 75%, and 100%)
• CO2/load curves were created for different speed points(970rpm, 1160rpm, 1500rpm, 1800rpm, and 2200rpm)
• Torque was estimated for the ISM370 operating on a pre-determined load-step cycle from this data

Results of Torque Inference Testing
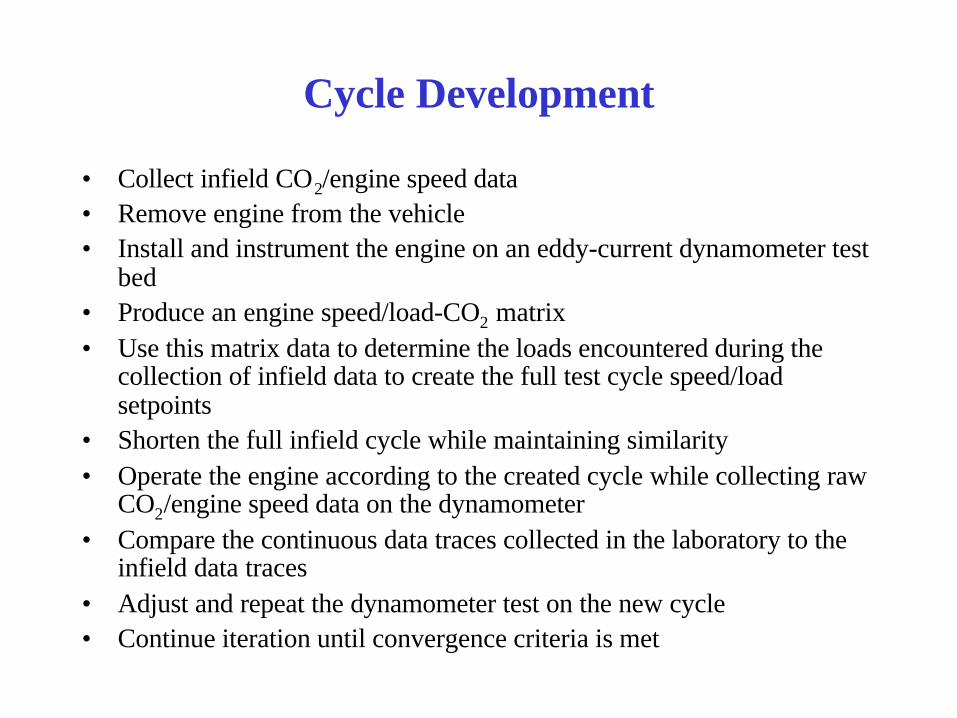
Cycle Development
• Collect infield CO2/engine speed data• Remove engine from the vehicle• Install and instrument the engine on an eddy-current dynamometer test
bed• Produce an engine speed/load-CO2 matrix• Use this matrix data to determine the loads encountered during the
collection of infield data to create the full test cycle speed/loadsetpoints
• Shorten the full infield cycle while maintaining similarity• Operate the engine according to the created cycle while collecting raw
CO2/engine speed data on the dynamometer• Compare the continuous data traces collected in the laboratory to the
infield data traces• Adjust and repeat the dynamometer test on the new cycle• Continue iteration until convergence criteria is met

Co
Collect In-field CO2/Engine Speed Data
Use Matrix/Previous Cycle Resultsto Create/Adjust Dynamometer
Speed/Load Setpoints
Exercise Engine on the Test Bed According tothe Created Setpoint File while Collecting
Raw Emissions/Engine Speed Data
Compare In-field and Laboratory Resultsthrough Correlation and Compare toPredetermined Correlation Criteria
If Correlation Meets Criteria If Correlation Does Not Meet Criteria
Run Final Transient Cycle andCollect Full-Flow Emissions Data
Create Load/Engine Speed-CO2
MatrixIn the Laboratory

Rubber-Tired Loader Full and ShortenedInfield Cycles
Full Infield CycleIntegrated CO2/cycle = 5.9%Average Engine Speed/cycle = 1806 rpm
Shortened Infield CycleIntegrated CO2/cycle = 5.8%Average Engine Speed/cycle = 1810 rpm

Rubber-Tired Loader Full and ShortenedInfield Cycles
Full Infield CycleIntegrated CO2/cycle = 5.9%Average Engine Speed/cycle = 1806 rpm
Shortened Infield CycleIntegrated CO2/cycle = 5.8%Average Engine Speed/cycle = 1810 rpm

Engine Speed/Load-CO2 matrix for theJohn Deere 6059 Loader EngineEngine Speed
% Load
0% 10% 20% 30% 40% 50% 60% 70% 80% 90% 100% 700 1.29 4.99 4.97 4.95 4.98 6.06 7.18 8.24 9.35 10.25 11.77 800 1.31 2.11 2.92 3.80 4.70 5.82 6.88 7.93 9.32 10.21 12.24 900 1.34 2.10 2.93 3.81 4.73 5.85 6.97 8.10 9.31 10.23 12.29 1000 1.35 2.09 2.89 3.86 4.79 5.95 6.95 8.10 9.54 10.48 12.43 1100 1.39 2.11 2.91 3.84 4.84 5.94 6.99 8.09 9.37 10.24 12.21 1200 1.43 2.10 2.91 3.83 4.76 5.84 6.92 7.98 9.24 10.11 12.19 1300 1.46 2.16 2.97 3.83 4.78 5.83 6.89 7.95 9.20 10.06 12.08 1400 1.51 2.19 2.97 3.85 4.76 5.77 6.90 7.94 9.12 9.99 11.86 1500 1.55 2.22 3.04 3.86 4.78 5.77 6.82 7.88 9.17 9.93 11.99 1600 1.60 2.26 3.07 3.91 4.75 5.77 6.85 7.84 9.12 9.90 11.84 1700 1.66 2.30 3.13 4.02 4.84 5.80 6.77 7.86 9.03 9.79 11.75 1800 1.72 2.38 3.13 3.99 4.85 5.82 6.81 7.78 8.92 9.65 11.63 1900 1.81 2.47 3.22 4.08 4.91 5.84 6.84 7.88 8.95 9.68 11.61 2000 1.88 2.56 3.25 4.06 4.92 5.85 6.85 7.79 8.89 9.56 11.49 2100 1.97 2.65 3.33 4.10 5.00 5.94 6.94 7.81 8.85 9.51 11.28 2200 2.10 2.71 3.38 4.13 5.02 5.87 6.85 7.77 8.81 9.38 11.21 2300 2.23 2.76 3.42 4.16 5.01 5.86 6.84 7.71 8.66 9.24 11.02 2400 2.28 2.82 3.41 4.07 4.83 5.60 6.48 7.33 8.20 8.63 10.15 2500 2.35 2.72 2.87 2.93 3.12 3.36 3.56 3.84 4.02 4.10 4.65 2600 2.50 3.47 3.49 3.55 3.48 3.52 3.62 3.68 3.71 3.50 3.81 2700 2.50 3.47 3.49 3.55 3.48 3.52 3.62 3.68 3.71 3.50 3.81

Comparison of Engine Speed DiscretizedAverage Load Values between the Full and
Shortened In-field Loader CyclesEngine Speed
(RPM) Shortened Cycle
Average Load (ft-lbs)
Full Cycle Average Load
(ft-lbs)
% Difference
750 36.1 41.2 -12.47 850 100.4 95.6 4.99 950 73.8 59.5 24.10 1050 128.1 113.8 12.57 1150 109.4 98.8 10.71 1250 106.4 98.6 7.96 1350 115.8 114.3 1.26 1450 123.4 119.4 3.36 1550 116.4 119.5 -2.58 1650 124.0 119.8 3.49 1750 114.6 119.2 -3.85 1850 125.7 127.1 -1.03 1950 114.5 122.5 -6.50 2050 117.3 116.1 1.00 2150 95.3 100.3 -5.04 2250 100.3 104.7 -4.17 2350 103.1 106.0 -2.73 2450 140.5 134.6 4.37 2550 94.4 89.0 6.10 2650 1.4 1.4 0.00

CO2 Correlation for the First and FinalIterations of the Loader Cycle
Final IterationR2 = 0.86Trendline Slope = 1.00Y-Intercept = 0%
y = 1.0037x + 0.0005R2 = 0.8612
0
2
4
6
8
10
12
1 2 3 4 5 6 7 8 9 10
Trans9/Infield CO2Linear (Trans9/Infield CO2)
First IterationR2 = 0.50Trendline Slope = 0.70Y-Intercept = 2.0%

Engine Speed Correlation for the First andFinal Iterations of the Loader Cycle
First IterationR2 = 0.77Trendline Slope = 0.88Y-Intercept = 200 rpm
Final IterationR2 = 0.88Trendline Slope = 0.94Y-Intercept = 119 rpm

Comparison of Normalized WVU and EPALoader Cycles
Shortened WVU Loader Cycle EPA Loader Cycle

Comparison of Normalized WVU and EPALoader Cycles
Shortened WVU Loader Cycle EPA Loader Cycle

Cycle Normalization
Cycle normalization provides a means of evaluating various enginesthat may be used for specific vehicle applications
gsc (governed central speed) = the speed on a power map greater thanmax power at which 50% of max power is achieved
speed particularat that achievable load maximumload measured
Load Normalized =
speed idle curb-gscspeed idle curb-speed measured
Speed Normalized =


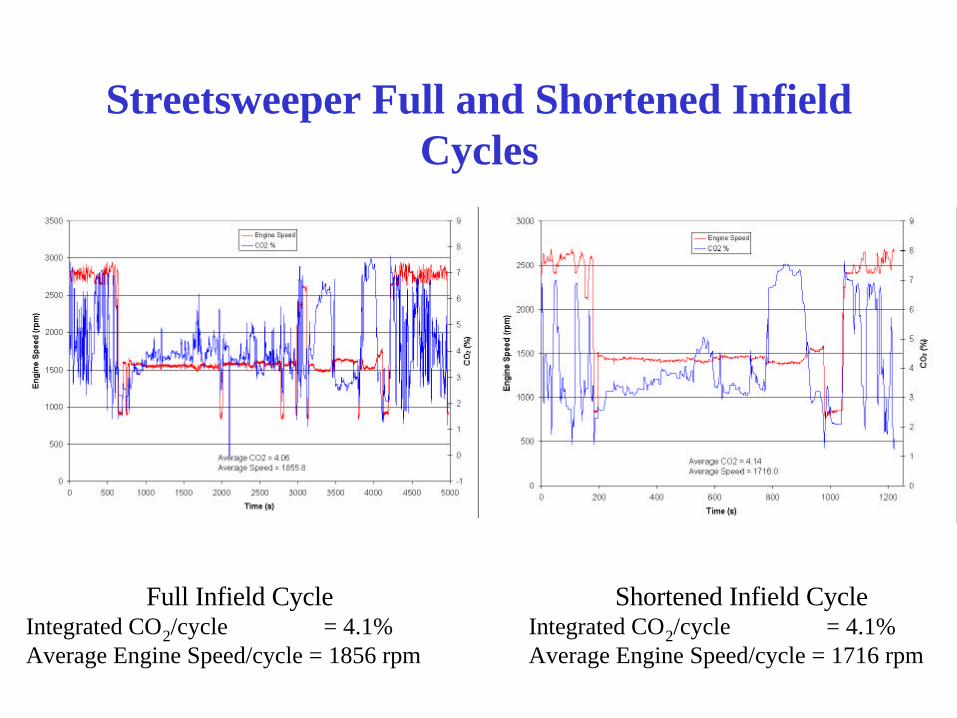
Streetsweeper Full and Shortened InfieldCycles
Full Infield CycleIntegrated CO2/cycle = 4.1%Integrated Engine Speed/cycle = 1856 rpm
Shortened Infield CycleIntegrated CO2/cycle = 4.1%Integrated Engine Speed/cycle = 1716 rpm
Streetsweeper Full and Shortened InfieldCycles
Full Infield CycleIntegrated CO2/cycle = 4.1%Average Engine Speed/cycle = 1856 rpm
Shortened Infield CycleIntegrated CO2/cycle = 4.1%Average Engine Speed/cycle = 1716 rpm

CO2 Correlation for the First and FinalIterations of the Street Sweeper Cycle
First IterationR2 = 0.77Trendline Slope = 0.77Y-Intercept = 0.98%
Final IterationR2 = 0.90Trendline Slope = 0.95Y-Intercept = 0.25%

Engine Speed Correlation for the First andFinal Iterations of the Street Sweeper Cycle
First IterationR2 = 0.97Trendline Slope = 1.01Y-Intercept = 5 rpm
Final IterationR2 = 0.96Trendline Slope = 0.96Y-Intercept = 45 rpm

CO2 and Engine Speed Correlation for TwoRepeat Runs of the Final Loader Transient
Cycle
Repeat Test CO2 CorrelationR2 = 0.95Trendline Slope = 0.97Y-Intercept = 0.2 %
Repeat Test Engine Speed CorrelationR2 = 0.97Trendline Slope = 0.97Y-Intercept = 27 rpm

CO2 and Engine Speed Correlation for theDesired vs. Achieved Speed/Load Setpoints
of the Loader Cycle
Desired/Achieved Torque CorrelationR2 = 0.90Trendline Slope = 0.94Y-Intercept = 8 %
Desired/Achieved Engine Speed CorrelationR2 = 0.73Trendline Slope = 0.83Y-Intercept = 307 rpm

Regression Criteria for CertificationTransient Cycle Test Validity as Outlined
in the CFR 40 Part 86 Subpart N
Criteria Speed Torque Slope of Regression Line, m 0.970-1.030 0.83-1.03
Coefficient of Determination, R2 0.9700 0.8800 Regression line y intercept, b +-50rpm +-15 ft-lb

Test Cycles
John Deere 444 Loader
- ISO-8178 8-mode
- Transient tests on finalloader cycle
Elgin Streetsweeper
- ISO-8178 8-mode
- Transient tests on finalsweeper cycle
- Transient tests on finalloader cycle

Weighted Brake-Specific 8-Mode Resultsfor the John Deere 6059 Loader Engine
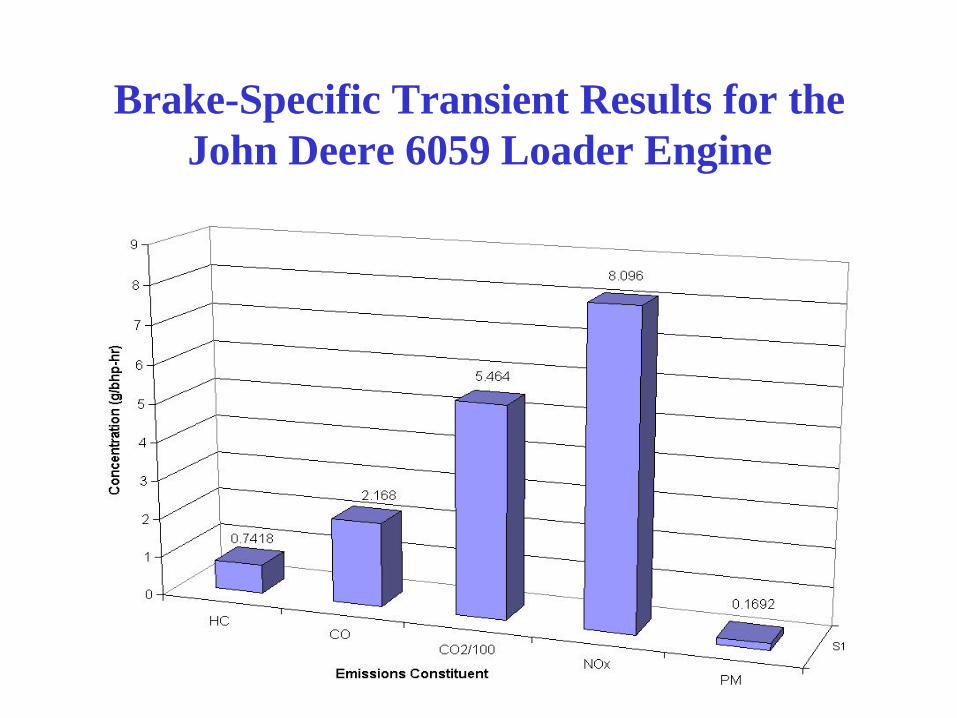
Brake-Specific Transient Results for theJohn Deere 6059 Loader Engine
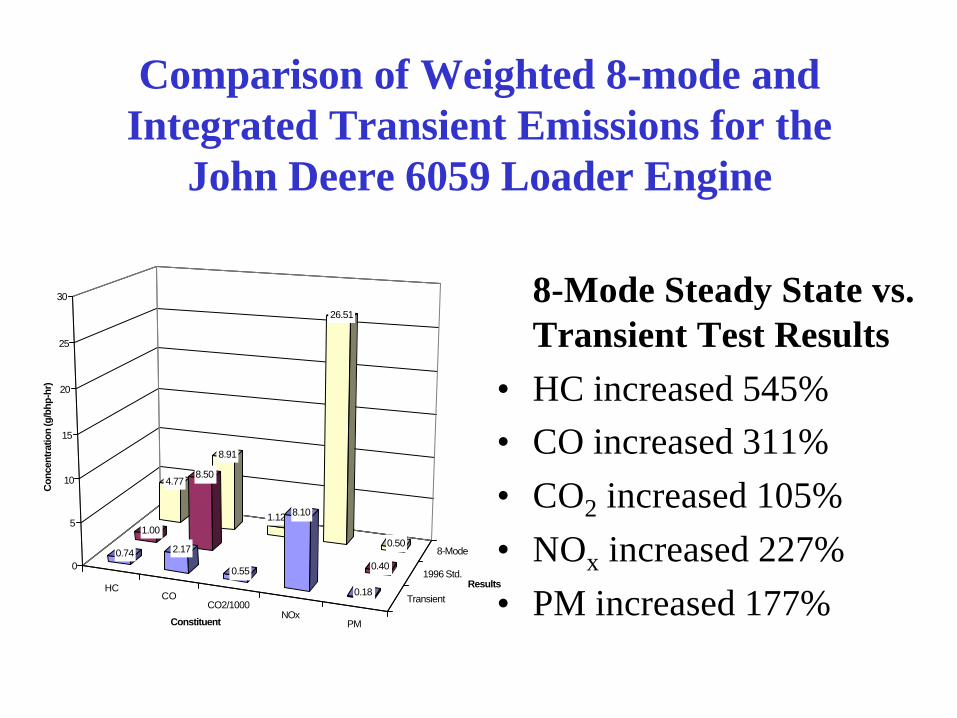
Comparison of Weighted 8-mode andIntegrated Transient Emissions for the
John Deere 6059 Loader Engine
8-Mode Steady State vs.Transient Test Results
• HC increased 545%
• CO increased 311%
• CO2 increased 105%
• NOx increased 227%
• PM increased 177%HC
COCO2/1000
NOxPM
Transient
1996 Std.
8-Mode
4.77
8.91
1.12
26.51
0.501.00
8.50
0.400.74 2.17
0.55
8.10
0.18
0
5
10
15
20
25
30
Co
nce
ntr
atio
n (g
/bh
p-h
r)
Constituent
Results

Weighted Brake-Specific 8-Mode Results for theJohn Deere 4039T Street Sweeper Engine

Brake-Specific Transient Results for theJohn Deere 4039T Street Sweeper Engine
HCCO
CO2/1000NOx
PM
Transient
0.5
1.85
0.63
5.59
0.245
0
1
2
3
4
5
6
Co
ncen
tratio
n (
g/b
hp
-hr)
Constituent
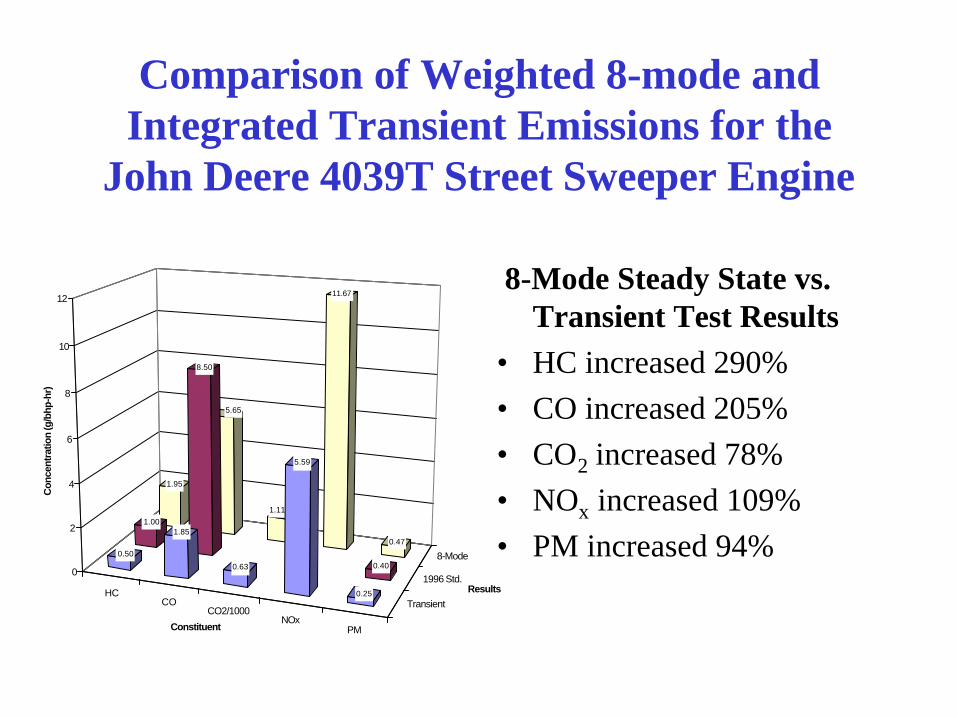
Comparison of Weighted 8-mode andIntegrated Transient Emissions for the
John Deere 4039T Street Sweeper Engine
8-Mode Steady State vs.Transient Test Results
• HC increased 290%
• CO increased 205%
• CO2 increased 78%
• NOx increased 109%
• PM increased 94%HC
COCO2/1000
NOxPM
Transient
1996 Std.
8-Mode
1.95
5.65
1.11
11.67
0.47
1.00
8.50
0.400.50
1.85
0.63
5.59
0.25
0
2
4
6
8
10
12
Co
nce
ntr
atio
n (g
/bh
p-h
r)
Constituent
Results

Comparison of Street Sweeper Results Operatingon the First and Final Street Sweeper Cycles
Final Iteration vs. FirstIteration Results
• HC increased 2%
• CO decreased 5%
• CO2 decreased 1%
• NOx decreased 2%
• PM decreased 7%

Comparison of Street Sweeper ResultsOperating on the Final Street Sweeper and
Loader Cycles
Sweeper Tested onSweeper Cycle vs.Sweeper Tested onLoader Cycle Results
• HC decreased 27%• CO increased 93%• CO2 decreased 10%• NOx increased 32%• PM increased 51%

Excavator Operations
Excavator Tramming (or Hauling)
Trenching
Digging

Komatsu S6D125-1 Excavator EngineWeighted and Average Transient Test Results
(g/bhp-hr)
Weighted 8-Mode Results
Transient Cycle 1 Results
Transient Cycle 2 Results
Transient Cycle 3 Results
% Diff Cycle1 to 8-Mode
% Diff Cycle 2 to 8-Mode
% Diff Cycle 3 to
8-Mode HC 2.49 1.202 1.145 1.100 -51.7 -54.0 -55.8 CO 2.55 0.915 0.871 0.853 -64.1 -65.8 -66.5 CO2 609.91 538.43 533.49 525.59 -11.7 -12.5 -13.8 NOx 8.26 5.366 5.390 5.327 -35.0 -34.7 -35.5 PM 0.633 0.277 0.280 0.332 -56.2 -55.7 -47.5

Load Factor and Cycle Length Data
Cycle Loader Sweeper Sweeper
on Loader Excavator
1 Excavator
2 Excavator
3 Excavator
EPA Load
Factor 57.8 33.7 57.8 78.7 78.4 73.9 74
Cycle Length (s)
1144 1226 1144 650 645 646 1198
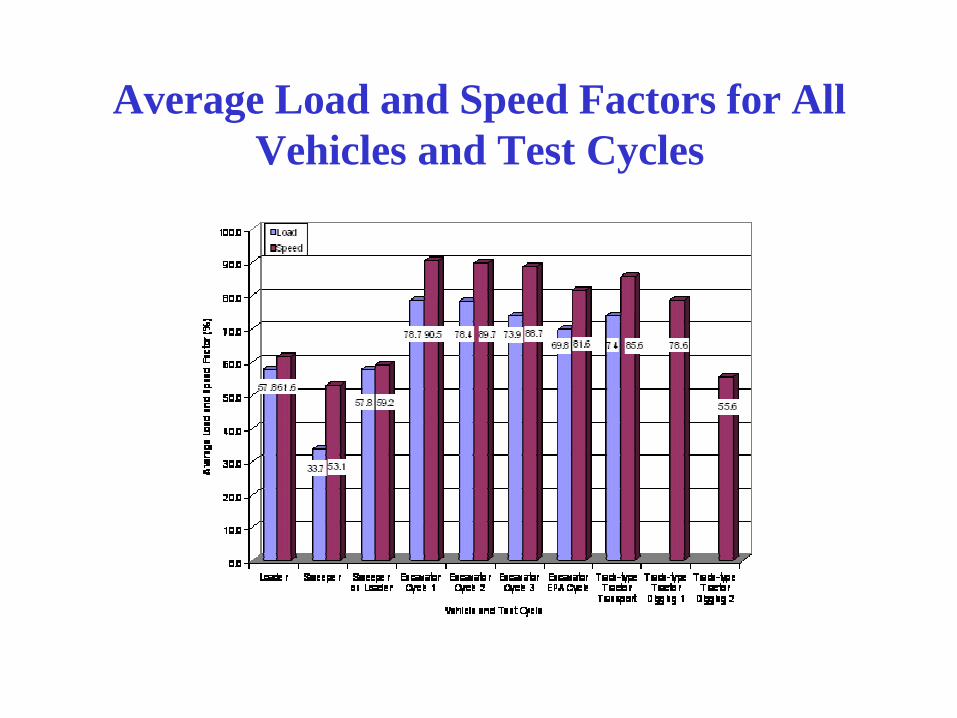
Average Load and Speed Factors for AllVehicles and Test Cycles
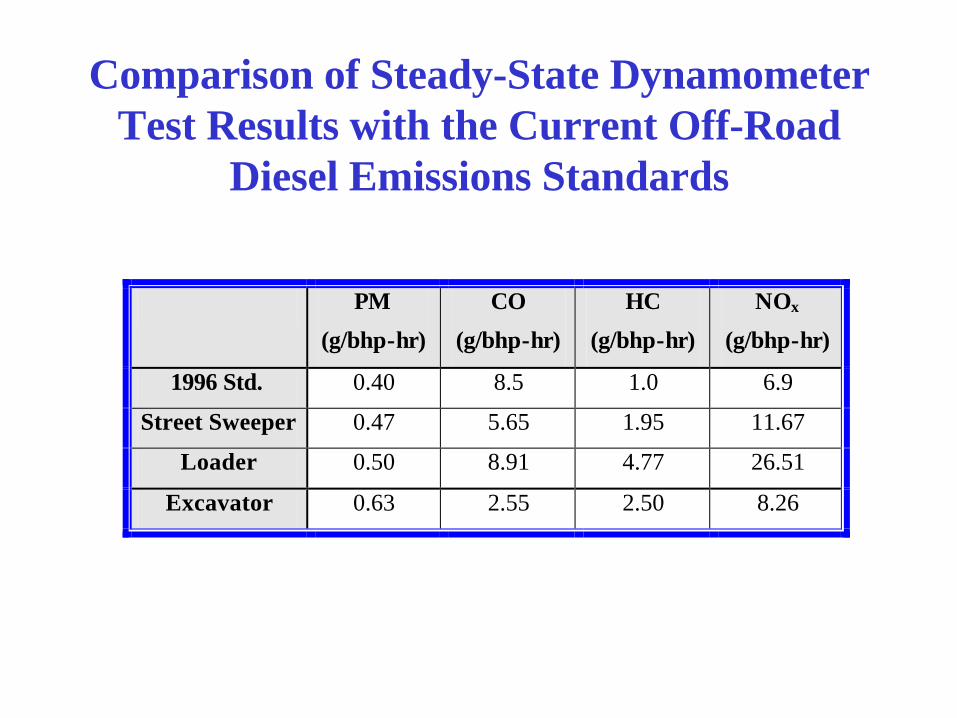
Comparison of Steady-State DynamometerTest Results with the Current Off-Road
Diesel Emissions Standards
PM
(g/bhp-hr)
CO
(g/bhp-hr)
HC
(g/bhp-hr)
NOx
(g/bhp-hr)
1996 Std. 0.40 8.5 1.0 6.9
Street Sweeper 0.47 5.65 1.95 11.67
Loader 0.50 8.91 4.77 26.51
Excavator 0.63 2.55 2.50 8.26

Emission Factors for Test Vehicles
Vehicle Loader Street Sweeper Excavator Track-type Tractor
Model Year <1995 1995+ 1987 2001 Total Hours 2756 6841 3263 2750 HC (g/hp-hr) 1.12 1.30 1.01 0.35 CO (g/hp-hr) 3.74 4.12 4.56 0.97
NOx (g/hp-hr) 9.31 10.13 11.83 6.54 PM (g/hp-hr) 0.83 1.03 0.68 0.17

Percentage of Total Cycle Time SpentIn Each Speed Range for the
John Deere 6059 Loader Engine
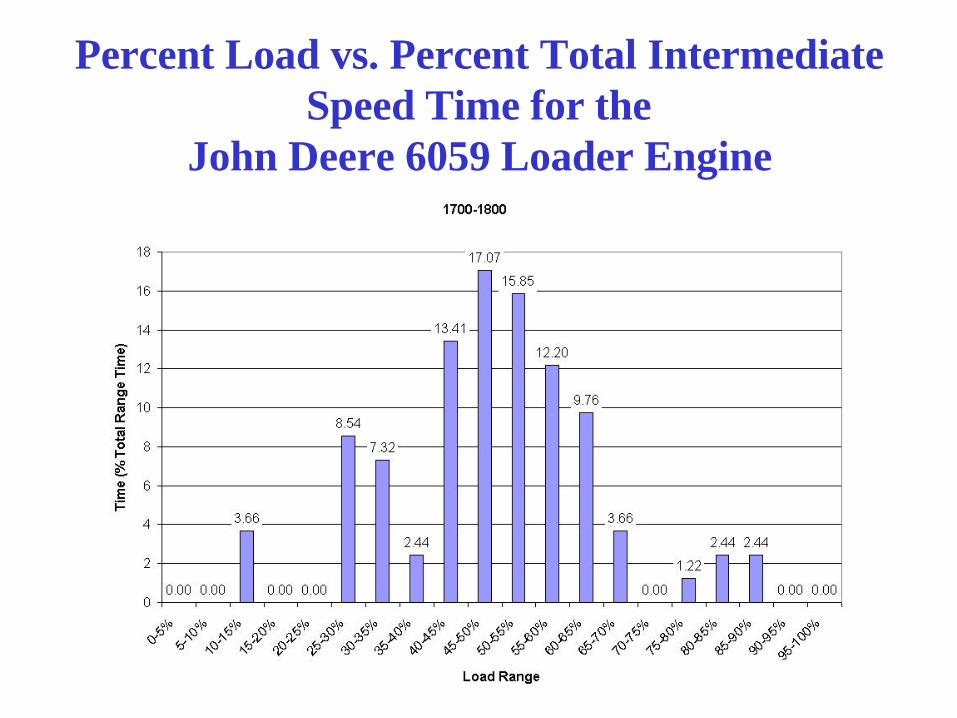
Percent Load vs. Percent Total IntermediateSpeed Time for the
John Deere 6059 Loader Engine
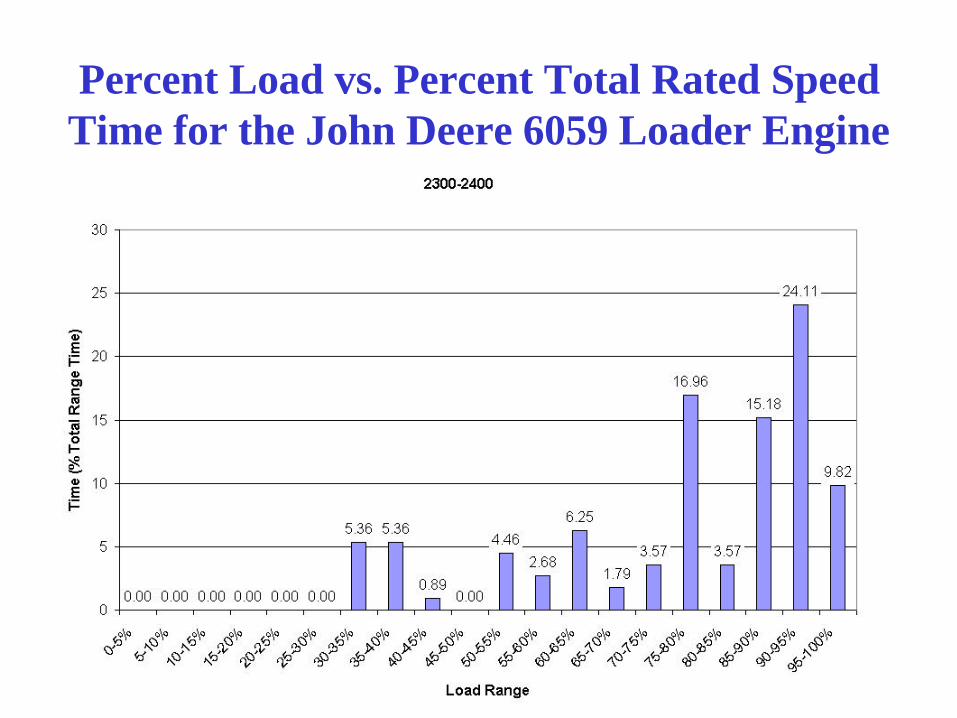
Percent Load vs. Percent Total Rated SpeedTime for the John Deere 6059 Loader Engine

Percentage of Total Cycle Time Spent inEach Speed Range for the
John Deere 4039T Street Sweeper Engine
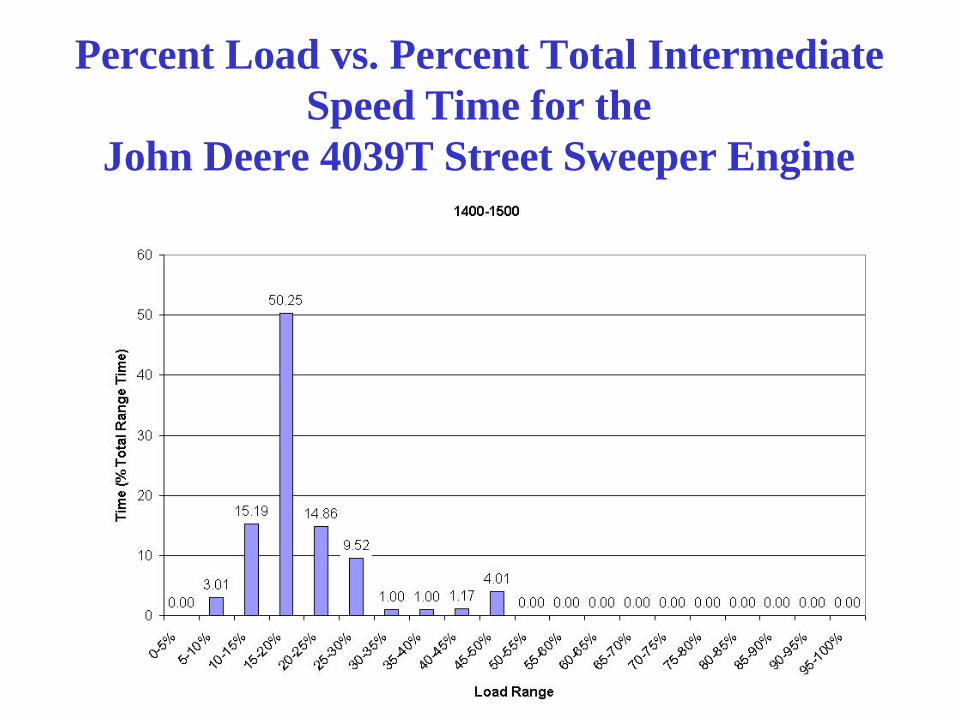
Percent Load vs. Percent Total IntermediateSpeed Time for the
John Deere 4039T Street Sweeper Engine

Percent Load vs. Percent Total Rated SpeedTime for the John Deere 4039T
Street Sweeper Engine
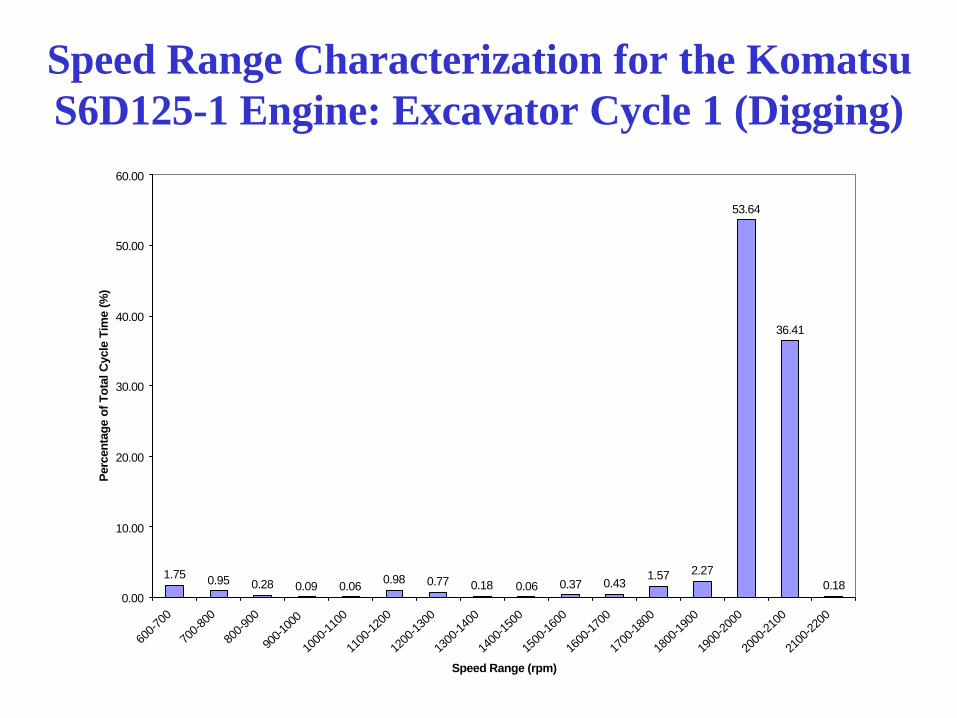
Speed Range Characterization for the KomatsuS6D125-1 Engine: Excavator Cycle 1 (Digging)
1.75 0.95 0.28 0.09 0.06 0.98 0.77 0.18 0.06 0.37 0.431.57 2.27
53.64
36.41
0.180.00
10.00
20.00
30.00
40.00
50.00
60.00
600-7
00
700-8
00
800-9
00
900-1
000
1000
-1100
1100
-1200
1200
-1300
1300
-1400
1400
-1500
1500
-1600
1600
-1700
1700
-1800
1800
-1900
1900
-2000
2000
-2100
2100
-2200
Speed Range (rpm)
Per
cen
tag
e o
f T
ota
l Cyc
le T
ime
(%)

Load Range Characterization for1900-2000 rpm Speed Range for Komatsu
S6D125-1 Engine: Excavator Cycle 1 (Digging)
0.06 0.00 0.00 0.06
2.23
37.06
45.02
15.18
0.400.00
5.00
10.00
15.00
20.00
25.00
30.00
35.00
40.00
45.00
50.00
<0 0-100 100-200 200-300 300-400 400-500 500-600 600-700 >700
Load Range (ft-lb)
Pe
rce
nta
ge
Tim
e (
%)

Load Range Characterization for2000-2100 rpm Speed Range for Komatsu
S6D125-1 Engine: Excavator Cycle 1 (Digging)
0.17 0.08
7.51
34.26
50.55
7.26
0.08 0.080.00
10.00
20.00
30.00
40.00
50.00
60.00
<0 0-100 100-200 200-300 300-400 400-500 500-600 >600
Load Range (ft-lb)
Per
cen
tag
e T
ime
(%)

Speed Range Characterization for KomatsuS6D125-1 Engine: Excavator Cycle 2 (Hauling)
1.76 0.93 0.31 0.09 0.09 0.96 0.74 0.22 0.06 0.40 0.34 0.68 0.80
66.13
26.38
0.090.00
10.00
20.00
30.00
40.00
50.00
60.00
70.00
600-7
00
700-8
00
800-9
00
900-1
000
1000
-1100
1100
-1200
1200
-1300
1300
-1400
1400
-1500
1500
-1600
1600
-1700
1700
-1800
1800
-1900
1900
-2000
2000
-2100
2100
-2200
Speed Range (rpm)
Per
cen
tag
e o
f T
ota
l Cyc
le T
ime
(%)

Load Range Characterization for1900-2000 rpm Speed Range for Komatsu
S6D125-1 Engine: Excavator Cycle 2 (Hauling)
0.05 0.00 0.00 0.05 0.66
36.19
5.20
0.14
57.72
0.00
10.00
20.00
30.00
40.00
50.00
60.00
70.00
<0 0-100 100-200 200-300 300-400 400-500 500-600 600-700 >700
Load Range (ft-lb)
Pe
rce
nta
ge
Tim
e (
%)

Load Range Characterization for2000-2100 rpm Speed Range for Komatsu
S6D125-1 Engine: Excavator Cycle 2 (Hauling)
0.12 0.00
99.88
0.00
20.00
40.00
60.00
80.00
100.00
120.00
<0 0-100 100-200
Load Range (ft-lb)
Pe
rce
nta
ge
Tim
e (
%)

Speed Range Characterization for KomatsuS6D125-1 Engine: Excavator Cycle 3 (Trenching)
1.70 0.99 0.28 0.12 0.09 0.96 0.74 0.22 0.06 0.37 0.37 0.43 0.53
60.06
32.98
0.090.00
10.00
20.00
30.00
40.00
50.00
60.00
70.00
600-7
00
700-8
00
800-9
00
900-1
000
1000
-1100
1100
-1200
1200
-1300
1300
-1400
1400
-1500
1500
-1600
1600
-1700
1700
-1800
1800
-1900
1900
-2000
2000
-2100
2100
-2200
Speed Range (rpm)
Per
cen
tag
e o
f T
ota
l Cyc
le T
ime
(%)

Load Range Characterization for 1900-2000 rpmSpeed Range for Komatsu S6D125-1 Engine:
Excavator Cycle 3 (Trenching)
0.05 0.00 0.00 0.05 1.08
26.04
53.94
0.05
18.79
0.00
10.00
20.00
30.00
40.00
50.00
60.00
<0 0-100 100-200 200-300 300-400 400-500 500-600 600-700 >700
Load Range (ft-lb)
Pe
rce
nta
ge
Tim
e (
%)

Load Range Characterization for 2000-2100 rpmSpeed Range for Komatsu S6D125-1 Engine:
Excavator Cycle 3 (Trenching)
0.09 0.00 1.22
21.37
69.17
8.15
0.00
10.00
20.00
30.00
40.00
50.00
60.00
70.00
80.00
<0 0-100 100-200 200-300 300-400 400-500
Load Range (ft-lb)
Pe
rce
nta
ge
Tim
e (
%)
Conclusions
• Brake-specific 8-mode emissions results were much higherthan transient test results and are not an accurate indicationof in-use vehicle emissions
• Cycle nature has a considerably larger effect on emissionsresults than an accurate recreation of the infield cycle
• For cycle development, refinement of dynamometersetpoints has little effect on full-cycle integrated results butthe differences could be large on second-by-second orother discrete cycle section
• On-board testing in the field would be more representativeof actual performance than steady-state testing on thevehicles tested in a test cell
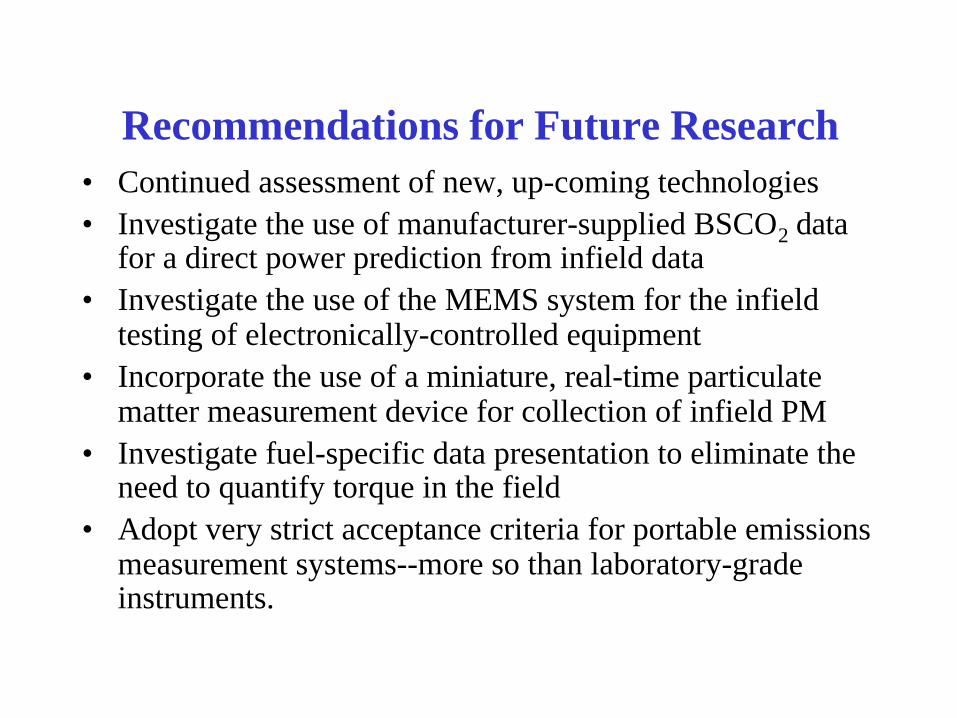
Recommendations for Future Research• Continued assessment of new, up-coming technologies• Investigate the use of manufacturer-supplied BSCO2 data
for a direct power prediction from infield data• Investigate the use of the MEMS system for the infield
testing of electronically-controlled equipment• Incorporate the use of a miniature, real-time particulate
matter measurement device for collection of infield PM• Investigate fuel-specific data presentation to eliminate the
need to quantify torque in the field• Adopt very strict acceptance criteria for portable emissions
measurement systems--more so than laboratory-gradeinstruments.

Acknowledgements
• California Air Resources Board

West Virginia University,Morgantown,WV 26506


![Brochure Exhaust Emissions Reduction en 21A1006397[1]](https://img.pdfslide.us/doc/110x75/577d34f71a28ab3a6b8f4414/brochure-exhaust-emissions-reduction-en-21a10063971.jpg)


![[Flip-Side] 7. IC Engine Exhaust Emissions](https://img.pdfslide.us/doc/110x75/56d6c06d1a28ab30169a58cc/flip-side-7-ic-engine-exhaust-emissions.jpg)