Embed Size (px)
Citation preview

Characterization of hydrocarbons by gas chromatography: means of improving accuracyRijks, J.A.
DOI:10.6100/IR22999
Published: 01/01/1973
Document VersionPublisher’s PDF, also known as Version of Record (includes final page, issue and volume numbers)
Please check the document version of this publication:
• A submitted manuscript is the author's version of the article upon submission and before peer-review. There can be important differencesbetween the submitted version and the official published version of record. People interested in the research are advised to contact theauthor for the final version of the publication, or visit the DOI to the publisher's website.• The final author version and the galley proof are versions of the publication after peer review.• The final published version features the final layout of the paper including the volume, issue and page numbers.
Link to publication
General rightsCopyright and moral rights for the publications made accessible in the public portal are retained by the authors and/or other copyright ownersand it is a condition of accessing publications that users recognise and abide by the legal requirements associated with these rights.
• Users may download and print one copy of any publication from the public portal for the purpose of private study or research. • You may not further distribute the material or use it for any profit-making activity or commercial gain • You may freely distribute the URL identifying the publication in the public portal ?
Take down policyIf you believe that this document breaches copyright please contact us providing details, and we will remove access to the work immediatelyand investigate your claim.
Download date: 19. Jul. 2018
CHARACTERIZATJON OF HYDROCARBONSBY
GAS CHROMATOGRAPHY; MEANS OF
IMPROVING ACCURACY (MET SAMENVATTING IN HET NEDERLANDS)
J4 A. RIJKS
CHARACTERIZATION OF HYDROCARBONSBY
GASCHROMATOGRAPHY; MEANS OF
IMPROVING ACCURACY. (MET SAMENVATTING IN HET NEDERLANDS)
PROEFSCHRIFT TER VERKRIJGING VAN DE GRAAD VAN DOCTOR IN DE TECHNISCHE WETENSCHAPPEN AAN DE TECHNISCHE HOGESCHOOL TE EINDHOVEN, OP GEZAG VAN DE RECTOR MAGNIFICUS, PROF DR. IR. G. VOSSERS, VOOR EEN COMMISSIE AANGEWEZEN DOOR HET COLLEGE VAN DEKANEN IN HET OPEN-
BAAR TE VERDEDIGEN OP VRIJDAG 21 SEPTEMBER 197.3 TE 16.00 UUR
DOOR
JACOBUS ALBERTUS RIJKS GEBOREN TE BRUNSSUM
1973
DRUKKERIJ J. H. PASMANS, 'S-GRAVENHAGE
Dit proefschrift is goedgekeurd door de
promotoren
Prof.dr.ir. A.I.M. Keulemans
Dr.ir. R.S. Deelder.

Aan mijn vrouw,
Aan Jackie, Marian,
Joske en Paul,
Aan mijn ouders.
4
CONTENTS
INTRODUCTION
1. CHARACTERIZATION OF GAS CHROMATOGRAPHIC PEAKS
BY MEANS OF THEIR RETENTION BEHAVIOUR.
1.1 Introduction.
1.2 Standardization of retention data.
1.3 Exchange of retention data between
laboratories.
1.4 Prediction of retention data.
1.5 Combination of gas chromatography and
mass spectrometry.
1.6 Statement of the problem.
2. SOURCES OF INACCURACY IN THE MEASUREMENT OF
RETENTION DATA.
2.1 Introduction.
2.2 Literature survey.
2.3 Definitions and terms.
2.4 Random errors
2.4.l Introduction.
2.4.2 Variations of flow-rate due to
pressure fluctuations.
2.4.3 Temperature fluctuations.
2.4.4 Measurement of retention time.
2.4.5 Influence of quantity of sample.
7
11
11
12
13
16
19
20
23
23
27
28
29
29
30
34
35
38
2.4.6 Effect of sample composition. 39
2.5 EXPERIMENTAL CONDITIONS AND SYSTEM DESIGN. 40
2.6 SYSTEMATIC ERRORS. 43
2.6.l Introduction.
2.6.2 Definition and stability of the
stationary phase.
2.6.3 Incomplete separation.
2.6.4 Non ideality of carrier gas.
2.6.5 Interfacial adsorption.
43
43
45
50
53
5
2.6.6 Gas hold-up time.
2.6.7 Influence of the operator.
3. PERFORMANCE AND PREPARATION OF HIGH RESOLUTION
COLUMNS.
3.1 Introduction.
3.2 Performance parameters.
63
69
ï3
73
74
3.3 Practical limitations of column performance. 77
3.4 Comparison of column types. 83
3.5 Micropacked columns. 86
3.6 Open-hole tubular columns. 95
3.6.1 Introduction. 95
3.6.2 Column efficiency and film thickness. 96
3.6.3 Preparation of open-hole tubular
columns.
4. CHARACTERIZATION OF HYDROCARBONS BY MEANS OF
ACCURATE RETENTION DATA.
4.1 Introduction.
4.2 Reproducibility of retention indices within
our laboratory.
98
107
107
108 4.3 Tabulation of retention data. 111
4.4 Interlaboratory agreement of retention data. 115
4.5 Characterization of types of hydrocarbons by means
of accurate retention data. 119
4.6 Potentialities of precision gas chromatography
for the qualitative analysis of complex mixtures
of hydrocarbons. 123
4.6.1 Introduction. 123
4.6.2 System design. 124
4.6.3 Application of the system. 126
4.6.4 Transfer of one peak per run. 127
4.6.5 Transfer of more than one peak per run. 128

APPENDIX.
SUMMARY SAMENVATTING ACKNOWLEDGEMENTS
LEVENSBERICHT.
6
134
137
139
141
142
7
INTRODUCTION
Arnong the most important techniques in analytical
chemistry are the separation methods. The separation
is followed by the characterîzation of the individual
compounds.
For volatile compounds gas chromatography is the
method of choice considering:
the separation power which îs unparalleled
by any ether technique,
the minimum sample quantity which is some
orders smaller compared wîth spectroscopie
techniques. (Except mass spectrometry).
Although prîmarely a separation method the retention
data directly give qualitative information. Peak areas
are proportional to the quantitative composition of the
sample.
The most recent developments in gas chromatography
have been made in the direction of more sensitive and
specific detectors, faster separations and improvement
of the quantitative aspects of gas chromatography.
Considerably less attention has been paid to the precise
determination of retention data. The number of gas chro
matographic analysis can be estimated to be a.bout 10 6 a
day. The number of publications in thîs field is about
2000 a year.
In contrast to the importance of qualitative analyti
cal data, the number of papers dealing with improvement
of precise and accurate retention data is disappointingly
low.
Apart from the characterization of unknown compounds
retention data are also used for the calculation of
thermodynamic quantities. In both cases the importance of
accurate measurements can not be emphasised enough.
8
For the characterization of a compound by purely gas
chromatographic means it is obvious that the more precise
the results, the easier and faster the characterization.
The number of substances having the "same" retention
diminish with the decreasing range of error of the
measurements.
Apart from an increase in accuracy the characteri
zation of a compound may be enhanced by using stationary
phases of different polarity (AI) or one stationary phase
at different temperatures (dI/dT) or both.
Structure retention relationships, on two stationary
phases of different "polarity 11 can also give additional
information about the identity of an unknown compound
in a chromatogram. Logarithmic plots of retention data
on two stationary phases allow us to determine the class
of compounds, with a limited number of reference com
pounds (homology lines). In such plots isomers are npon or slightly scattered
around straight lines (isomer lines). A further division
in sub-isomer groups is possible.
Also in this case the accuracy of the measurements
is essential to bring out sufficient structural detail.
The purpose of this thesis is f irstly to make a precision of one tenth of a retention index unit attain
able in every laboratory and secondly to make an inter
national agreement possible between the data so obtained. The latter purpose can only be achieved if it is realised
that it is bath necessary and possible to correct for
systematic errors. This will also result in an increasing accuracy of
thermodynamic quantities, calculated from gaschromatogra
phic retention data.
Therefore in the first part of this investigation,
the influence of several sources of error on repeatability is studied. The measurement and control of instrument fac-
9
tors affecting the reliability are iroproved as far as
possible and reasonable froro the point of view of systero
atic error.
Computer programs were developed for the off-line
calculation of reliable peakparameters, including absolute
and relative standard deviation of a series of measurements.
Another limitation for the characterization of an
unknown compound in a chromatograro is the separation.
The properties of different column types have been com
pared. ( Chapter 3) •
For the separation of complex mixtures long capil
lary c~lurons are to be preferred (high resolution and
permeability, sharp peaks and low concentrations, no
solid support, easier temperature and flow control).
For the separation of hydrocarbons a procedure is worked out for the reproducible coating of stainless-steel open
hole columns.
The low boiling hydrocarbons are separated with micro
packed columns. These columns prepared in our laboratory,
according to a new technique, compare favourably with other
types of columns. The efficiency of this column type make
these very well suited for high resolution work, in these
cases where open tubular columns with an appropriate sta
tionary phase are not available.
A low cost self assembled system is described which
enables reproducible roeasurements in the same laboratory
of about 0.05 index units for hydrocarbons.
The main reasons for the choice of hydrocarbons in
this investigation are:
the great number of possible isomers, a special complication in qualitative analysis of
these compounds,
reaction chromatography enables the conversion
of many classes of organic substances into hy
drocarbons. This means an important extension
10
of the scope of the hydrocarbon retention data,
a lot of standard hydrocarbons (the complete
API collection) are available in our laboratory.
With the refined equipment the influence of several param
eters (e.g. temperature, pressure, time measurement etc) is
studied. This resulted in the conclusion that a major factor
iimiting the accuracy of retention data, is the adsorption
of the solute at the gas-liquid and gas-solid interface.
A method is proposed to estimate the contribution of
adsorption to retention behaviour. Platting the relative
retention time of the solute against the inverse of the
capacity ratio, retention data corrected for this adsorp
tion effect are obtained - "!deal" retention data - by
extrapolation.
The diff erence between the retention index measured
on a particular column and the corresponding "ideal"
value for benzene (adsorption shift), is proposed as a
measure for the column inertness.
For a particular substance under ident!cal conditions,
the agreement of the retention index, measured in different
laboratories, will be the better the smaller the adsorption
shift for benzene. Of course the best agreement will be
obtained if this shift is zero.
From this point of view this thesis may be seen as a
contribution to bridge the gap between a precision of about
0.1 index unit and an accuracy of the same order.
A list of retention data of 170 odd hydrocarbons
cc4-c9 ) is presented on a non polar (squalane) and a polar
(acetyltributylcitrate-Citroflex A4 } stationary phase.
The potentialities of accurate measurements as a tool
for the characterization of compounds in a complex mixture
are demonstrated in the last chapter.
11
CHAPTER I
CHARACTERIZATION OF G.C. PEAKS
BY MEANS OF THEIR RETENTION
BEHAVIOUR.
1.1 INTRODUCTION.
The analytica! as well as the physicochemical sig
nif icance of gas chromatographic retention data has
been recognised since the beginning of gas chromatography.
Up to now gas chromatography is lagging in its iden
tifying ability compared with its separation power, which
is unsurpassed by any other technique. The main reason is
the poor reproducibility of retention data which charac
terize a substance.
The standard method for the characterization of a
peak in a chromatogram is most frequently based upon meas
ured retention times or related functions of known sub
stances and the coincidence of these values with those
of unknown in the chromatogram.
Unfortunately there are several factors which limit
the usefulness of this procedure:
Determination of retention data on a particu
lar column is a tedious process. Because of instability, chemica! change (e.g. oxidation)
and the loss of stationary phase, this deter
mination is not always a once for all operation.
For hydrocarbons the pure substances necessary
for calibration may be expensive. In many laboratories they are not available.
The use of not unambiguously def ined stationary
phases.
12
The precision of the aetermination of retention
times may be insufficient. More than one compound may have the "same" re
tention time. Incomplete resolution of peaks can lead to the
shifting of the peak maximum as discussed by Huber and Keulemans (1) and reported by Ettre (2).
Mixed separation mechanisms (solution in the
stationary phase and adsorption at the phase
boundaries) can lead to systematic deviations.
Summarising these limitations it may be conclµded
that there is a need for tables with accurate retention
data, high resolution columns with a negligible adsorption
effect and stable and well defined stationary phases. To increase the precision of the measurements ref ine
ment of instrumentation is the first step (3-6). With a
high quality instrument the influence of the variation of the process parameters on the quantity to be measured can
be estimated. For slight changes of the set values of these
parameters a linear relationship between these parameters
and the measured quantities may be assumed. The proportiona 1 i ty constante correeponding with these relationships
enable the calculation of the extent of control, which is required to achieve a desired precision.
A decrease in the variation of the critical parameters will result in a higher precision of the measurements.
l. 2 STANDARDIZATION OF RETENTJ:ON DATA.
In order to enable the genera! use of published re
tention data, their standardization is required.
Since the beginning of gas chromatography the proper expression of retention data was one of the most discussed
problems. This subject is briefly discussed in the appendix.
13
The retention index was introduced in 1958 by Kováts
(7). It was designed in first instance to minimise the
discrepancies in the reporting of retention data. In this
system retention data are given on a relative basis.
n-Alkanes, bracketing the compound to be characterized,
are used as reference standards. The interpolation is log
arithmic.
Since that time the Kovats index has been advocated
by many authors (2, 8-11), as a means for the standardization of retention data. It appears to be widely accepted
as such or after appropriate modification nowadays.
A survey of the literature on the retention index,
dealing with the concept, its origin, the pro and contra
is given by Walraven (12).
1.3 EXCHANGE OF. RETENTION DATA BETWEEN LABORATORIES.
The characterization of a compound by purely gas
chrornatographic means, requires standards for calibration.
In many laboratories,for hydrocarbons,these standards are
not available.
Therefore comparison of rneasured data and literature
data is necessary. That is, for future work sets of collect
ed retention data will be essential for characterization
purposes. Of course the value of such a collection is de
pendent on the accuracy of the data. The interlaboratory irreproducibility is the main pro
blem in the characterization of G.C. peaks. A review of
the literature, partly accumulated in comp1lat1ons of retention data (8, 13-15), reveals a lack of agreement be
tween different sources. Large ranges of retention values
can be observed f or compounds chromatographed under iden-
t ical conditions on supposedly similar columns. For instance
Icyclohexane on squalane as the stationary phase at loo0 c
14
shows a discrepancy of 60 index units. On this bélisis Kovats
was right in not expecting decimal places in his index
system. To gain insight into primary factors which ~re respon
sible for this large discrepancy, inter laboratory tests
have been organised, with standard mixtures.
In 1964 the first test (8) was made with 9 partici
pating laboratories. A siK-component mixture was analysed
at 3 different temperatures. Packed columns were used, filled
with Celite, coated with 20% squalane. For toluene the max
imum differencefound, was 24 index units. As a chief point
carne to the fore that the use of a stationary phase of the
same batch and preferably unambiguously def ined is essen
tial to enable the study of the influence of other parameters. In 1966 a subgroup of the " Groupement pour l'Avencement
des Mêthodes Spectrographic (GAMS)", the" Commission de
Chromatographie en phase gazeuze", started a series of
inter laboratory tests, with 12 participating laboratories.
Loewenguth (16) reported about the evaluation of
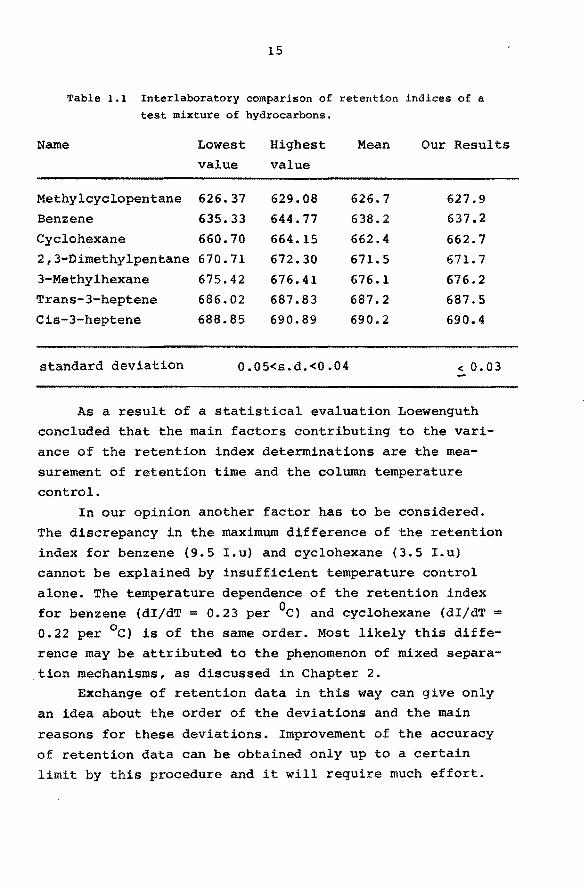
the results. A standard mixture of 1 compounds was analysed on
capillary columns (length 50-lOOm, i.d. 0.25 mm)
with squalane as the stationary phase, at so0 c. ~ethane was considered to be an unretained compound under these
conditions. The choice of the equipment and the method
of time measurement was free. The number of measurements
in each laboratory was ll. The results of this test are
summarised in Table 1.1
As a matter of interest the mean values of all the
laboratories are compared with retention data f irially
obtained in our laboratory, with a high quality instru
ment. Considering the differences between the participa
ting laboratories, the agreement of the mean results of
this ring test and our results is surprisingly good.
15
Table 1.1 Interlaboratory comparison of retention indices of a test mixture of hydrocarbons.
Name Lowest Highest Mean Our Results value value
Methylcyclopentane 626.37 629.08 626.7 627.9 Benzene 635.33 644.77 638.2 637.2
Cyclohexane 660.70 664.15 662.4 662.7 2,3-Dimethylpentane 670.71 672. 30 671.5 671. 7 3-Methylhexane 675.42 676.41 676.1 676.2 Trans-3-heptene 686.02 687.83 687.2 687.5 Cis-3-heptene 688.85 690.89 690.2 690.4
standard deviation 0.05<s.d.<0.04 < o. 03
As a result of a statistica! evaluation Loewenguth concluded that the main factors contributing to the vari
ance of the retention index determinations are the mea
surement of retention time and the column temperature
con trol. In our opinion another factor has to be considered.
The discrepancy in the maximum difference of the retention
index for benzene (9.5 I.u) and cyclohexane (3.5 I.u)
cannot be explained by insufficient temperature control
alone. The temperature dependence of the retention index for benzene (dI/dT = 0.23 per 0c) and cyclohexane (dI/dT = 0.22 per 0 c) is of the same order. Most likely this diffe
rence may be attributed to the phenomenon of mixed separa-
, tion mechanisms, as discussed in Chapter 2. Exchange of retention data in this way can give only
an idea about the order of the deviations and the main
reasons for these deviations. Improvement of the accuracy
of retention data can be obtained only up to a certain
limit by this procedure and it wil! require much effort.
16
Therefore we have chosen for a different
approach, which enables independent variation of the
parameters influencing the precision and accuracy. A
correlation between the variation of the individual
experimental parameters and the resulting fluctuation
in the retention, enables the calculation of the ex
tent of control of these parameters which is required
to achieve a desired precision.
1.4 PREDICTION OF RETENTION DATA.
In addition to a direct characterization by coin
cidence methods (comparison of the retention quantity
of the unknown with standard compounds or tabulated
retention data), the calculation of retention data
must be mentioned.
A large number of correlations between molecular
structure and gas chromatographic retention has been
established. It was Kovats (17) who summarised these
regularities in six genera! rulès.
Since that time many authors have proposed calcu
lation methods to predict retention data. Roughly these
methods can be divided in two groups: Methods using only physical constants (e.g.
boiling points, vapour pressures and acti
vity coefficients calculated theoretically) •
Calculations based on the additivity princi
ple of structural increments, which have been
determined by gas chromatography.
The advantage of the first group is that the reten
tion data can be calculated without any information about
the gas chromatographic behaviour of the compounds. The
agreement between calculated and measured values, how
ever, is poor. Even for hydrocarbons differences up to
15 index units can be expected.
17
The second type of calculations is based upon:
Number, nature and position of functional
groups.
Number, type and position of honds.
Polarity and geometry of the stationary phase.
In this case the agreement between calculated and
measured values is dependent on the quantity of pre-in
formation used in the calculation. The reliability of
the predicted retention value·increases with an increa
sing number of structural elements involved in the
calculation.
This means that the number of compounds which have
to be measured, to enable the calculation of the contri
bution of the structural increments, also increases. The
consequence is that the number of compounds for which the
retention can be predicted is decreasing. Amongst ethers
Schomburg (18-20) and Soják (21-23) have studied extensi
vely the potentialities of these calculation methods, to
predict retention data for hydrocarbons.
1 ... "." .. " ..
...
•oo
400
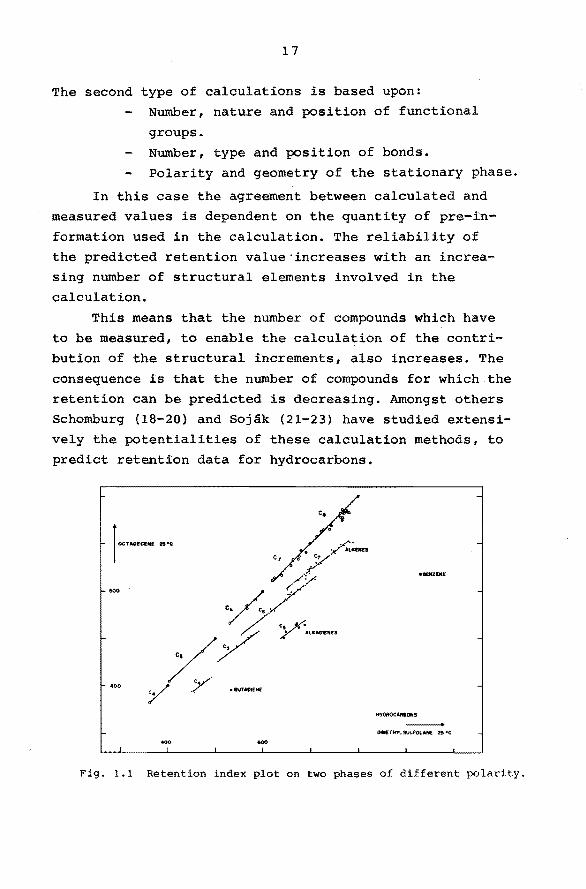
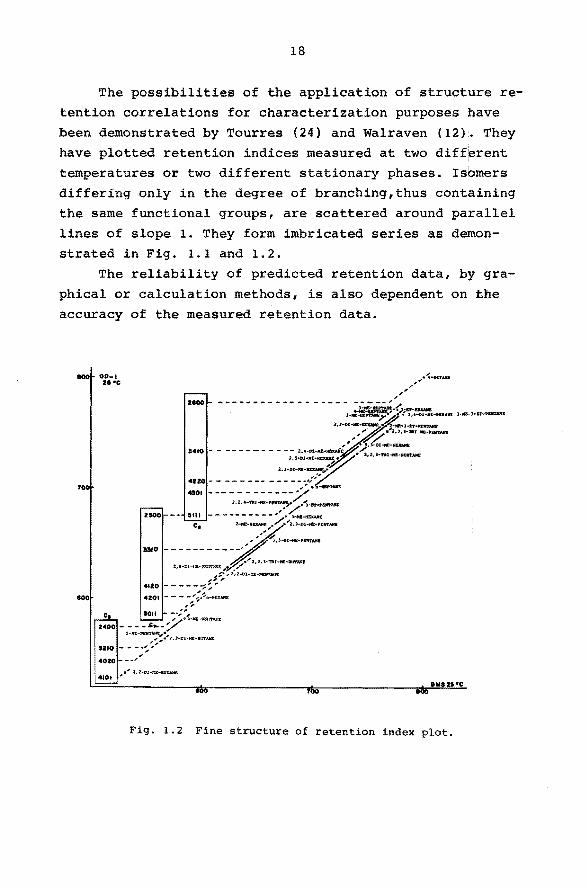
Fig. 1.1 Retention index plot on two phases of different polarity.
18
The possibilities of the application of structure re
tention correlations for characterization purposes have been demonstrated by Tourres (24) and Walraven (12). They
have plotted retention indices measured at two different temperatures or two different stationary phases. Isbmers
differing only in the degree of branching,thus containing
the same functional groups, are scattered around parallel
lines of slope 1. They form imbricated series as demonstrated in Fig. 1.1 and 1.2.
The reliability of predicted retention data, by gra
phical or calculation methods, is also dependent on the
accuracy of the measured retention data.
800 00-1 H"C
100
eoo
4101
•
Fig. 1.2 Fine structure of retention index plot.
19
1.5 COMBINATION OF GAS CHROMATOGRAPHY AND MASS SPECTRO
METRY.
Because of its importance in qualitative analytical
chemistry the combination GC-MS will be discussed very
briefly. The direct coupling GC-MS appears to be an ideal
combination. That is, if the conditions of both methods
are optima! and the problems involved in the coupling are
solved.
The mass speçtrometer provides more structural infor
mation than any ether technique with the smàll sample size
offered by capillary colwnns, which have an unsurpassed
separation power.
The area in which a mass spectrometer is not entire
ly satisfactory for component identification is distinc
tion between structural and geometrical isomers (e.g.
hydrocarbons ) •
The high cost and complex data handling are severe
obstacles to the wider use of this combination. For the
moment there are aiso some practical difficulties liroit
ing their applicabili ty:
sensitivity for column bleeding (choice of
the stationary phase).
capillary link between gas chromatograph and
mass spectrometer (delay of sample, peak
broadening, condensation of sample and sta
tionary phase).
It may be expected that in near future these problems
will be solved. Considering the development of chemica!
ionisation sources and single - or multiple - ion detec
tion, the potentialities of this combination are obvious.
For qualitative analysis of hydrocarbons this combi
nation may not be considered as the final solution. The
identification in this case is complicated by the great
number of possible isomers.
20
1.6 STATEMENT OF THE PROBLEM.
The use of subsequent analytical techniques for the
identification of compounds separated by gas chroma~ography
is limited seriously because of the quantities of sample
required. For instance, the only instrument which can be
used in conjunction with open-hole tubular columns for
identification purposes is the maas spectrometer. For
several reasons this combination can not be used in any
laboratory and for any identif ication problem.
It is mainly due to this lack of complementary iden
tif ication methods that, in spite of their excellent sep
aration power and high sensitivity, open tubular columns
equiped with ionisation detectors, have found very limited
application in the qualitative analysis of complex mixtures.
Considering this, it may be concluded that it is
highly desirable to have means available for the char
act er iza t ion of gas chrornatographic peaks by retention
data only.
The poor interlaboratory agreement of retention
data has given rise to the belief that G.L.C. methods are
fundamentally unsuited for characterization purposes.
Nevertheless these techniques provide a powerfull
method for the characterization and structural studies of
organic compounds. It will be evident that the process
of characterization on the basis of G.C. retention param
eters will gain in efficiency and reliability if highly
discriminating columns are used and the accuracy of the
measurements is improved.
The importance of the resolution can be reduced by
using more columns of different polarity or the samè col
umns at different temperatures. However, for complex
mixtures the recognition of corresponding peaks is .rather
complicated, even if a quantitative estimation of the peak
areas is involved in the determination.
21
Isolation of a peak eluted from the first column and
rerunning on a second column of different polarity can
overcome this difficulties. In most cases the application of this techniques is limited by the quantity of sample,
especially for open tubular columns. Therefore a system
(described in Chapter 4) is developed for open tubular
columns with whicb. all the components separated on the first
(apolar) column can qe directed to a second (polar)
column individually.
Since the characterization of a compound by gaschro
matographic means is an elimination method, obviously,
the number of compounds to be differentiated from the un
known compound decrease if the accuracy with which a par
ticular retention value can be measured is increased.
To improve the accuracy of the measurements the in
fluence of the fluctuations of experimental and physical p~ocess parameters have to be:investigated and decreased to
such a level that the required accuracy is achieved.
l • 7 REFERENCES.
1. Huber J.F.K. and Keulemans A.I.M., z. Anal.Chem., 205, (1964), 263.
2. Ettre L.S., Anal.Chem., 36, (1964), 31A.
3. Keulemans A.I.M. "Gas Chromatography 1966", A.B.
Littlewood ed., Institute of Petroleum, Londen, 1967, p. 211.
4. Goedert M. and Guiochon G., "Gas Chromatography 1969",
A. Zlatkis ed., Presten, Evanstone, III, 1969, p. 68.
5. Goedert M. and Guiochon G. Anal.Chem., 42, (1970}, 962.
6. Lorentz L.J. and Rogers L.B., Anal.Chem., 43, (1971}, 1593.
7. Kovä.ts E., Helv.Chim.Acta., 41, (1958), 1915.
22
8. "The Institute of Petroleum, London, J. of Gaschroma
tog., 1965, p. 348.
9. Guiochon G., Anal.Chem., 36, (1964), 1672.
10. Kaiser R., Chromatographia 3, (1970), 127.
ll. Ibid., p. 383.
12. Walraven J.J., Thesis, Eindhoven, University of Techno
logy, Netherlands, (1968).
13. "Compilation of Gas Chromatographic Data" A.S.T.M.,
Technical Bulletin n° 343, A.S.T.M. Philadelphia, 1963.
14. Me. Reynolds, w.o. "Gas Chromatographic Retention Data"
Presten, Evanstone, Illinois, 1966.
15. Data Subcommittee of the Gaschromatography Discussion
Group of the Institute of Petroleum, J. of Gaschromatog.
1966 (1).
16. Loewenguth J.C., Sth International Symposium on Separa
tion Methods, Ed., Kováts E., Swiss Chemist Association,
1969, p. 182.
17. Kovats E., "Advances in Chromatography", Vol I, M. Dekker
ed., New York, (1965), p. 229.
18. Schomburg G. ' Anal.Chim.Acta, 38, (1967), 45. 19. Schomburg G., J. Chromatog. , 23, (1966)' 1.
20. Schomburg G • , J. Chroma tog. , 23, (1966),18.
21. Soják L., Majer P and Skalák P., J. Chromatog. 65, (1972),
137.
22. Soják L., Majer P. Krupc!k J. and Janák J. J.Chroma
tog • 65 t (1972) t 143.
23. Soják L., Krupcik J., Tesar!k K and Janak J. J. Chro
matog. 65, (1972), 93.
24. Tourres D.A., J. Chromatog. 30, (1967), 357.
23
CHAPTER II
SOURCES OF INACCURACY IN THE
MEASUREMENT OF RETENTION DATA.
2.1 INTRODUCTION.
Improvement of the interlaboratory agreement of reten
tion data will greatly enhance the usefulness of published
retention data, for the characterization of unknown peaks
in a chromatogram. However, there is always some element of doubt in any assignment which is based merely upon re
tention data.
Improvement of the accuracy of retention data can al
ways be justified if tabulation of retention data is intended. For the characterization of a compound in a complex
mixture improvement of accuracy will be only significant
when the separation power keeps step with this improvement.
The interval in retention time, within which a compound can
be eKpected (window), reflects the uncertainty in both, reference values and measured values.
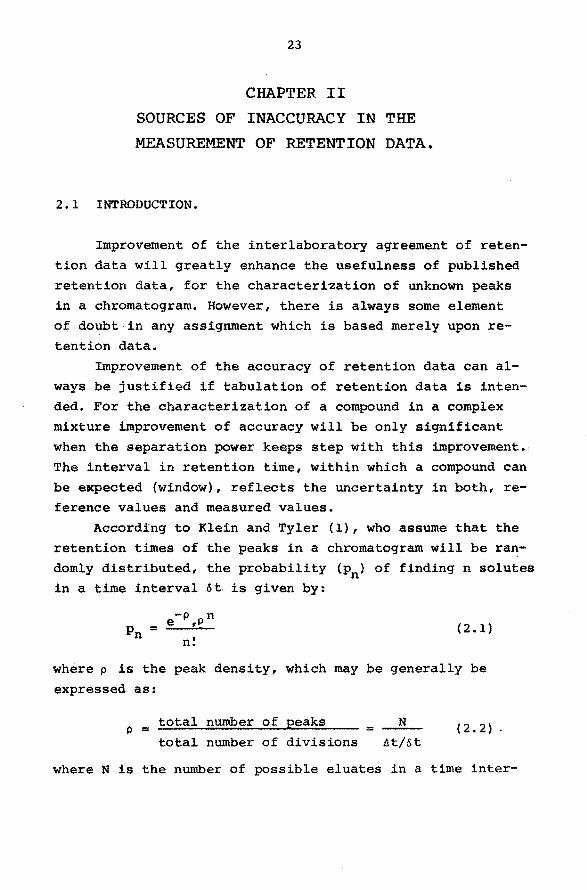
According to Klein and Tyler (1), who assume that the
retention times of the peaks in a chromatogram will be ran
domly distributed, the probability (pn) of finding n solutes
in a time interval öt is given by:
e-p Pn p = •
n ' n. (2.1)
where p is the peak density, which may be generally be
expressed as:
P = total number of peaks total number of divisions
= N (2.2)
where N is the number of possible eluates in a time inter-
24
val At and öt is the smallest difference in retention time,
which can be detected. Ata 95% confidence interval öt = 4at'
at being the standard deviation of a series of measurements.
The probability of simultaneous elution (p9e) of two or
more solutes in an interval öt fellows from equation 2.1:
p = 1 - e-p (l+P) se (2.3)
Calculation of P for different values of p allows se the prediction of the maximum permissible number of compounds
(Np) in a given time interval At, if the accuracy of the
measurements is known, as shown in Table 2.1.
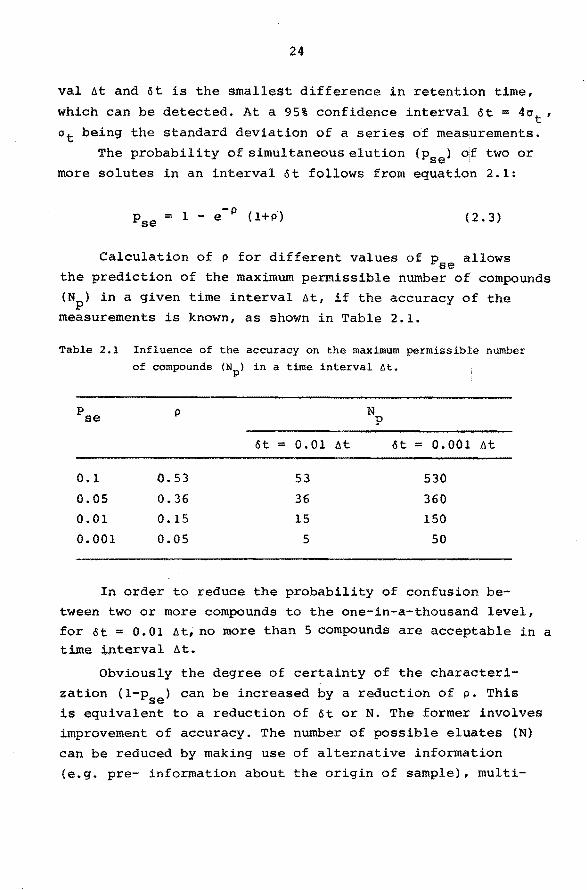
Table 2.1 Inf luence of the accuracy on the maximum permissible number of compounds (Np) in a time interval öt.
Pse N p
öt = 0.01 At öt = 0.001 At
0.1 C.53 53 530
0.05 0.36 36 360
0.01 0.15 15 150
0.001 0.05 5 50
In order to reduce the probability of confusion be
tween two or more compounds to the one-in-a-thousand level, for öt = 0.01 At, no more than 5 compounds are acceptable in a time interval At.
Obviously the degree of certainty of the characteri
zation (l-pse) can be increased by a reduction of p. This is equivalent to a reduction of öt or N. The former involves
improvement of accuracy. The number of possible eluates (N)
can be reduced by making use of alternative information
(e.g. pre- information about the origin of sample), multi-
25
dimensional systems (columns of different polarity or different temperatures) and class-separations in preceding steps.
Improvement of accuracy on to a certain level, which
requires more sophisticated instrumentation, is only justi
fied when resolution is sufficiently high. The relation
between accuracy and resolution will be discussed below.
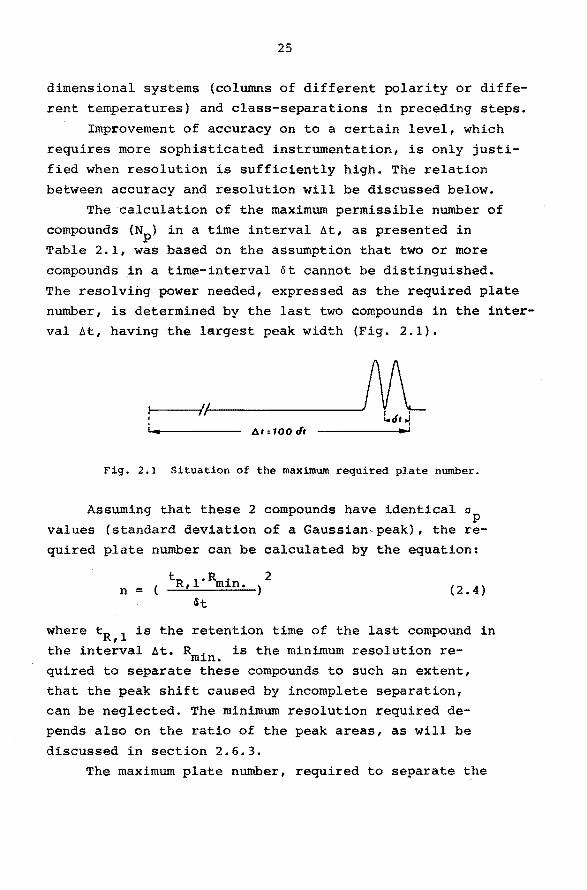
The calculation of the maximum permissible number of
compounds (Np) in a time interval at, as presented in
Table 2.1, was based on the assumption that two or more
compounds in a time-interval ót cannot be distinguished.
The resolving power needed, expressed as the required plate
number, is determined by the last two èompounds in the interval At, having the largest peak width (Fig. 2.1).
At:100Ót
Fig. 2.1 Situation of the maximum required plate number.
Assuming that these 2 compounds have identical op values (standard deviation of a Gaussian~peak), the re
quired plate number can be calculated by the equation:
n = (2.4)
where tR,l is the retention time of the last compound in the interval at. R 1 is the minimum resolution re-m n. quired to separate these compounds to such an extent,
that the peak shift caused by incomplete separation, can be neglected. The minimum resolution required de
pends also on the ratio of the peak areas, as will be
discussed in section 2.6.3. The maximum plate number, required to separate the
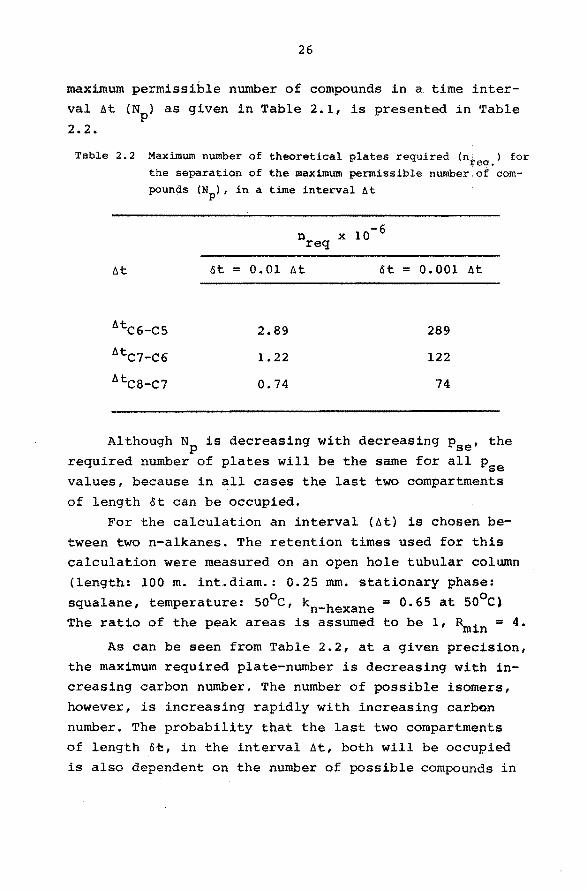
26
maximum permissible number of compounds in a time inter
val At (Np) as given in Table 2.1, is presented in Table
2.2.
Table 2.2 Maximum number of theoretical plates required (n. ) for reo. the separation of the maximum permissible number of com-
pounds (Np), in a time interval At
At at = 0.01 At ot = 0.001 At
AtC6-CS 2.89 289
AtC7-C6 1.22 122
AtC8-C7 0.74 74
Although Np is decreasing with decreasing Pse' the
required number of plates will be the same for all Pse
values, because in all cases the last two compartments
of length öt can be occupied.
For the calculation an interval (At) is chosen be
tween two n-alkanes. The retention times used for this
calculation were measured on an open hole tubular column
(length: 100 m. int.diam.: 0.25 mm. stationary phase: 0 0
squalane, temperature: 50 c, kn-hexane = 0.65 at 50 C} The ratio of the peak areas is assumed to be 1, Rmin = 4.
As can be seen from Table 2.2, at a given precision,
the maximum required plate-number is decreasing with in
creasing carbon number. The number of possible isomers,
however, is increasing rapidly with increasing carbon
number. The probability that the last two compartments
of length ö~, in the interval At, both will be occupied
is also dependent on the number of possible compounds in
27
this interval. If the last two compartments are not
occupied both, the separation power needed will be deter
mined by the last two compounds, which occupy two neighbou
ring compartments in the interval considered.
Therefore the prediction of the required plate num
ber, which is in agreement with a given precision, is
hardly possible. The great irnportance of the use of high
resolution columns for the characterization of a compound
in a complex mixture, however, is clearly demonstrated in
this way.
Of course for thermodynamic studies and listing of
retention data of pure compounds, improvement of accuracy
is less strongly dependent on the resolution.
The performance of the column, which sets limits to
the separation attainable, is compared for different types
of columns in Chapter 3.
To improve the precision and accuracy of the measure
ments the elimination of the relevant sources of error in
the measurement of retention data, as far as possible and
reasonable, is necessary.
Therefore in this thesis, as a contribution to improve
the agreement of retention data between laboratories, not
only random errors but also systematic errors will be
discussed.
The distinction between random and systematic errors
cannot be made very sharply in all cases. However, in this
thesis a subdivision in these two types of errors is pre
ferred for the sake of clearness.
2.2 LITERATURE SURVEY.
Considering the importance of accurate retention
data for qualitative analysis, it is surprising that
the first publications, reporting precise retention
28
data (2.3) appeared only in 1967. Since that time an in
creasing interest in this subject can be observed.
Several authors (4-8) studied the influence of
fluctuations of experimental parameters on the reten
tion time and related functions. They calculated sta
tistically the error in the f inal retention value frorn
the error propagation coefficient of the experirnental
parameters, using the existing theoretica! relation
ships.
With packed columns and a specially designed gas
chromatograph Wicarova, Novak and Janák (6) obtained
a precision corresponding to a coefficient of variation
of 0.2% for the specific retention volume.
Goedert and Guiochon (4) reported an excellent
agreement between the overall precision calculated from
the error propagation coefficients of the individual
parameters and the experirnental values of absolute re
tention time. They concluded that the main lirniting factors
are the measurement and control of ternperature, in- and
outlet-pressure and the method of retention time deter
mina tion. At a precision level of 0.01%, which is extre
mely difficult to obtain,even with the most sophisticated instrumentation, retention time measurements can only
be carried out with a computer.
Oberholtzer and Rogers (5) constructed a gaschroma
tograph which is capable of measuring relative retention
data with a precision better than 0.02%.
The importance of precise retention data f or struc
t ure-retention correlations is demonstrated by Tourres
(4) and Keulemans et al. (9-13).
2.3 DEFINITIONS AND TERMS.
To avoid confusion in terminology, random and
systematic errors, precision and accuracy, repeatability
29
and reproducibility, in this thesis will be defined as follows:
Random error is the effect of a sequence of errors beyond control.
Systematic error is the significant discrepancy be
tween the average of measurements and the true value of
a quantity.
Precision is an indication for the agreement between
successive measurements, with one instrument under similar
conditions, independent of any systematic error involved.
Accuracy refers to the closeness of a measured value
and the true value of a quantity.
Repeatability is the random variation of successive
measurements of one sample, analysed with one instrument,
by one operator, under similar conditions.
Reproducibility is the random variation of a quantity
obtained by different operators, on different instruments,
in one or more laboratories, under similar conditions.
2.4 RANDOM ERRORS.
2.4.l Introduction.
The error sources which cause the random variation of
retention times can be divided into two categories. The first category .concerns the experimental parameters (e.g.
temperature and carrier gas-flow) and the time measurement
itself. The s~cond category consists of errors resulting
from the partition process and concerns deviations from the linear distribution (overloading, adsorption and composition
of sample), resulting in concentration dependent retention
times. The relation between these factors and retention
time, for an ideal carrier-gas, is given by the equa
tion (14):
tR =
L = n = K =
pi =
Po = k =
i:R
2 4.L ·D (l+k)
K
retention time. column length.
30
viscosity of carrier-gas. permeability of the column.
inlet pressure of the column. outlet pressure of the column. capacity ratio.
( 2. 5)
Because of stringent requirements on the constancy
of temperature and pressure of the chromatographic system,
if precision measurements are intended, the influence of
the viscosity of the carrier-gas and the permeability of
the column is negligible. The capacity ratio (k) depends
on both the temperature and the average column pressure. However, measurements of Desty and ethers show (15-17),
that the pressure dependence of k is very small. A varia--3 tion of 10 atm. corresponds with a variation of k in the
order of 0.003%, with carbon dioxide as the carrier-gas.
With nitrogen or hydrogen the effect is much smaller. Therefore, in the following sections the influence
of temperature and time measurement will be discussed, as
are overloading effects and composition of sample.
2.4.2 Variations of Flow-rate due to Pressure Fluctuations.
Carrier-gas flow~rates for open-hole tubular columns -1 are usually of the order 0.5-5 ml.min. • Regulation of
these small flows with flow regulaters is practically im
possible. Therefore with this column type regulation of flow is restricted to in- and outlet pressure regulation
and control. Experirnentally there are two methods to con-
31
trol the flow-rate through an open tubular column:
- Both inlet and outlet pressure are controlled.
- Only the pressure drop over the column is controlled.
A variation in the outlet pressure is partly compen-
sa ted in the inlet pressure with the last method. For prac
tical reasons this is the method of choice, for measurements
of relative retention data.
The error propagation coefficients for the absolute
retention times are given in this case by the equation (14):
dtR p2P = 0
dP0
tR (2P0
+p) (3P~+3P0p+p2 ) Po
(Po+p) (6P2 + 3P p + p2 ) dp 0 0 (2.6)
(2P0
+ p) (3P~ + 3P0
p + p2 ) p
Calculation of the error propagation coeff icients for
P0 and p shows, that the influence of fluctuations in p is
one order of magnitude higher than the influence of the variation of P
0•
Fora constant outlet pressure (P0
= 1 atm.) and a
fluctuation of 0.002 atm. in the inlet pressure, the re
lative variation of the absolute retention time is given
as a function of the pressure-drop (p) in Fig. 2.2.
For open-hole tubular columns langer than 50 m, at
normal operating conditions (p > 1 atm., P0
= atmospheric),
a precision better than 0.2% in absolute retention time can be obtained when the fluctuation of in and outlet pressure is less than 0.002 atm.
Assuming that the variation of atmospheric pressure
will not exceed 0.002 atm., during one analysis, the pre
cision of relative retention times will be even better.
32
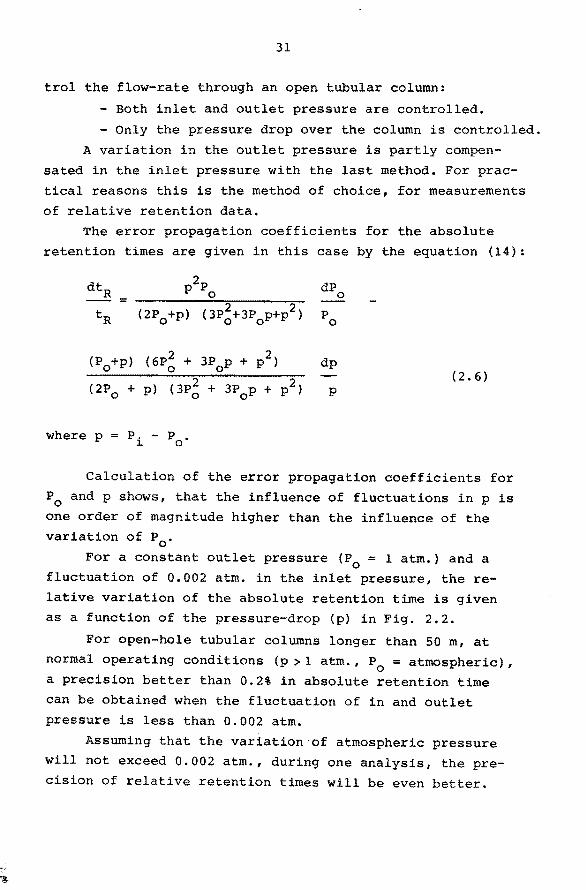
The înfluence of long term drift of in- and outlet
pressures is neglected here because only relative reten
tion data are considered in this investigation.
Fig. 2.2 The relative variation of the absolute retention time as a
function of the pressure drop (p), fora fluctuation of 0.002 atm. in the inlet pressure, at constant outlet pressure.
The influence of upstream pressure (supply pressure)
fluctuations (AP8
) on the performance of pressure control
lers, normally used in our laboratory, is studied with the
equipment given in outline in Fig.2.3.
The operating conditions (flow-rate, in- and outlet pressure) are in agreement with the conditions normally
encountered in a G.C. system provided with long open
tubular columns (100 m ) and an inlet system with splitter.
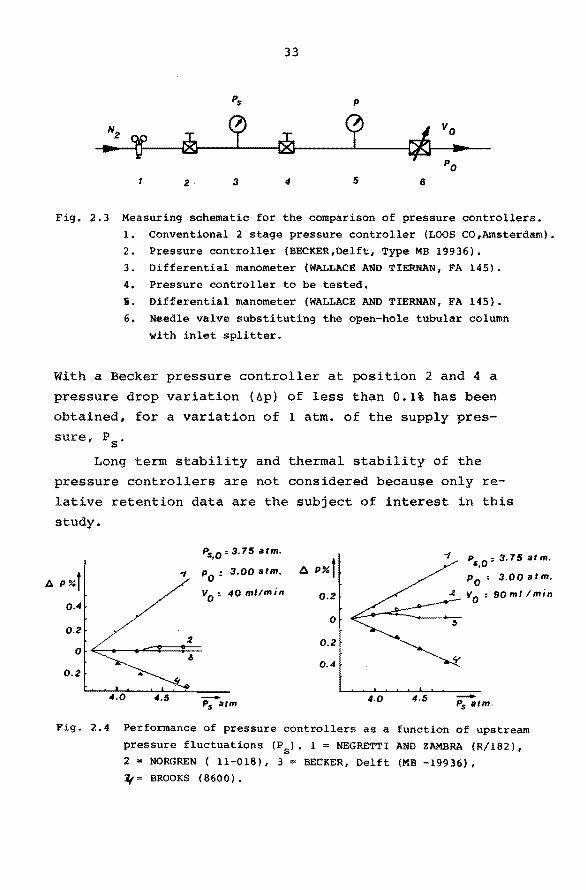
For two representative measurements the results are
given in Fig. 2.4. The upstream pressure variations after
pressure controller l may be estimated to be less than 3%.
A
33
Pis p
N2
' ~ p r& p c/J
vo ... .... PO
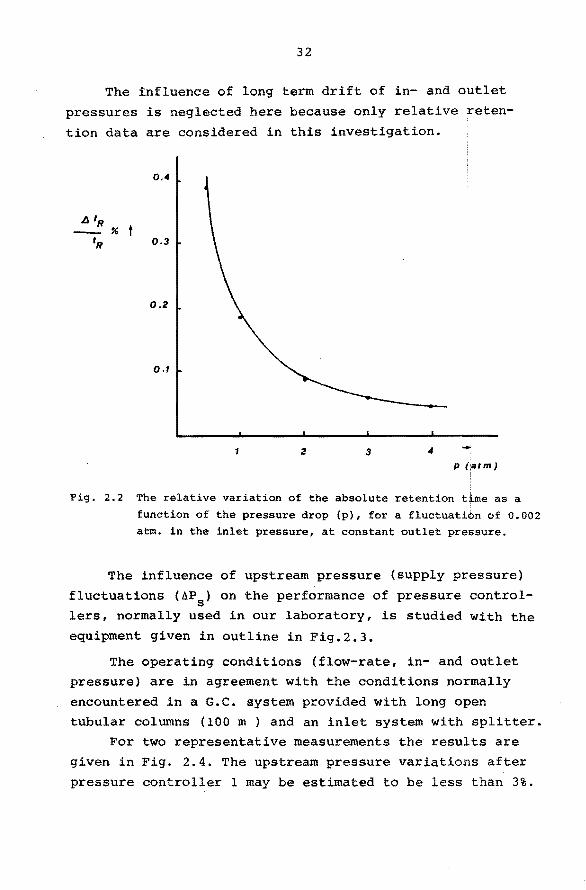
2· 3 4 5 6
Fig. 2.3 Measuring schematic for the comparison of pressure controllers. l. Conventional 2 stage pressure controller (LOOS CO,Amsterdam). 2. Pressure controller (BECKER,Delft, Type MB 19936). 3. Differential manometer (WALLACE AND TIERNAN, FA 145).
4. Pressure controller to be tested.
5. Differential manometer {WALLACE AND TIERNAN, FA 145).
6. Needle valve substituting the open-hole tubular column
with inlet splitter.
With a Becker pressure controller at position 2 and 4 a
pressure drop variation (àp) of less than 0.1% has been
obtained, for a variation of l atm. of the supply pres
sure, P8
•
Long term stability and thermal stability of the
pressure controllers are not considered because only re
lati ve retention data are the subject of interest in this
study.
Pis,o=3.75 atm.
P%t " p
0 : 3.00 atm.
v0
: 40 ml/min 0.4
0.2
0
0.2
4.5 -Pis atm
6 P%t 0.2
0
0.2
0.4
4.0 4.5
Ps,o: 3, 75 at m.
p0
: 3.00 atm.
v0
: 90 ml !min
-Ps atm.
Fig. 2.4 Performance of pressure controllers as a function of upstream
pressure fluctuations (PS). 1 = NEGRETTI AND ZAMBRA {R/182), 2 = NORGREN ( 11-018), 3 = BECKER, Delft (MB -19936), ~= BROOKS (8600).
34
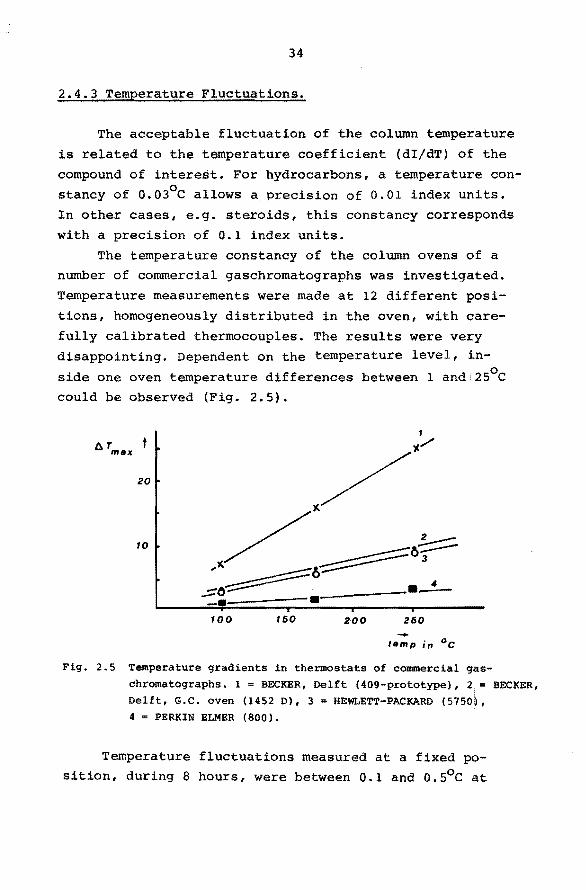
2.4.3 Temperature Fluctuations.
The acceptable fluctuation of the column temperature
is related to the temperature coefficient (dI/dT) of the
compound of interest. For hydrocarbons, a temperature con-o stancy of 0.03 C allows a precision of 0.01 index units.
In other cases, e.g. steroids, this constancy corresponds
with a precision of 0.1 index units.
The temperature constancy of the column ovens of a number of commercial gaschromatographs was investigated.
Temperature measurements were made at 12 different posi
tions, homogeneously distributed in the oven, with care
fully calibrated thermocouples. The results were very disappointing. Dependent on the temperature level, in
side one oven temperature differences between 1 and 2s0 c could be observed (Fig. 2.5).
AT t ... max
20
10
100 150 200 250 -temp in °c
Fig. 2.5 Temperature gradients in thermostats of commercial gas
chromatographs. 1 = BECKER, Delft (409-prototype), 2. = BECKER, Delft, G.C. oven (1452 D), 3 = HEWLETT-PACKARD (5750~,
4 = PERKIN ELMER (800).
Temperature fluctuations measured at a f ixed position, during 8 hours, were between 0.1 and o.s0 c at
35
ioo0 c. Short term fluctuations were about half these
values.
Therefore for accurate measurements a liquid ther
mostate (TEV 70, TAMSON, Zoetermeer) has been selected,
which allows a temperature control at any point inside
the thermostate, within o.01°c. The temperature difference
inside the liquid bath was measured with a quartz thermo
meter (type 2801 A, HEWLETT.,.PACKAruJ.) provided with two
sensors, so that the resolution for differential measure
ments was about o.001°c. The reference sensor was fixed
in the middle of the bath. The second sensor was placed
successively at different positions, symmetrically around
the centre; the distance of this sensor from the side wall,
the top and the bottom level was more than 5 cm. The maximum difference observed, during 8 hours, between all
the points was o.01°c at so0 and 7o0 c. The temperature variations at one point, during 120
hours, corresponds to a standard deviation of o.oos0 c.
2.4.4 Measurement of Retention Time.
To have the full profit of a better measurement and
control of temperature and pressure, the random error of the retention time measurement itself should match to the
precision of these factors.
This random error is dependent on the method of time
measurement, the estimation of the moment of injection and the uncertainty of the position of the peak top.
For compounds with short retention times the influence
of errors in time measurement will be relatively high. Be
cause of peak broadening, for compounds with long retention
times the estimation of the peak top can be problematic
(flat peaks). Therefore the influence of the method of time measure
ment and column length, on the precision of retention data,
will be briefly discussed.
36
With a gaschromatograph assembled in our laboratory
(described in section 2.5) and a 100 m. open tubular co
lumn (stationary phase: squalane, int.diam.:0.25mm., T= 10°c)
the following methods of time measurement have been com-
pared: electronic integrator,
stopwatch,
distance measurements on the chromatogram,
digitizer unit and subsequent off-line pro
cessing of the paper-tape.
The least reliable results were obtained with the
electronic integrator (INFOTRONICS - model C.R.S. 11 H.B.
/41). With this instrument time measurements are in whole
seconds. The registered place of the peak top is dependent
on the width of the peak because of quenching and slope
detection, both resulting in a shift of the peak top.
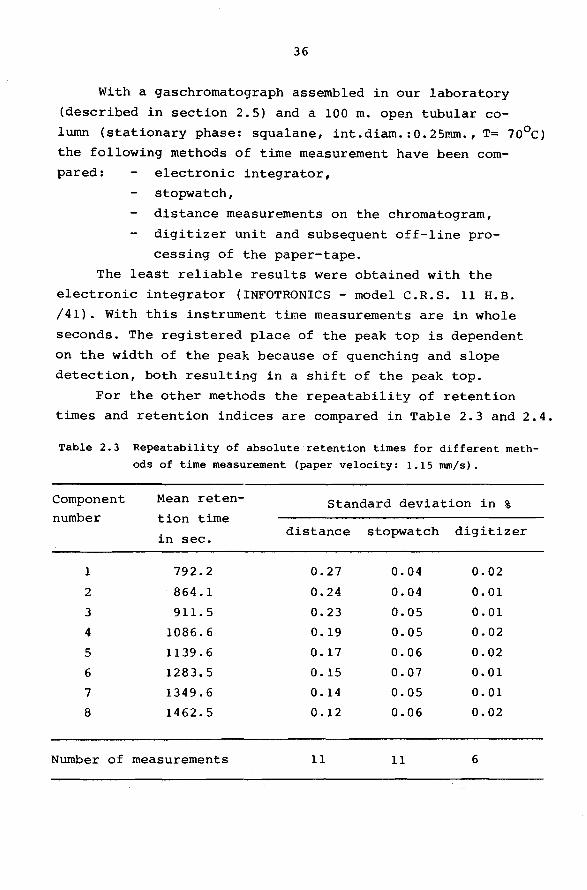
For the other methods the repeatability of retention
times and retention indices are compared in Table 2.3 and 2.4.
Table 2.3 Repeatability of absolute retention times for different meth
ods of time measurement (paper velocity: 1.15 mm/s).
Component Mean reten-
number tion time
in sec.
1
2
3
4
5
6
7
8
792.2
864.1
911. 5
1086. 6
1139. 6
1283.5
1349.6
1462.5
Number of measurements
Standard deviation in %
distance stopwatch digitizer
0.27 0.04 0.02
0.24 0.04 0.01
0.23 0.05 0.01
0.19 0.05 0.02
0.17 0.06 0.02
0.15 0.07 0.01
0.14 0.05 0.01
0.12 0.06 0.02
11 11 6
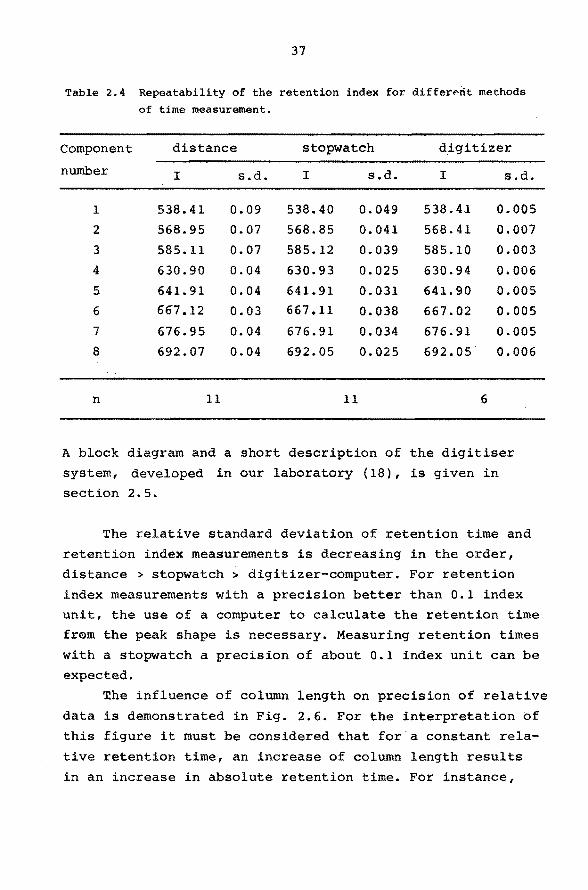
37
Table 2.4 Repeatability of the retention index for differ~rit methods
of time measurement.
Component distance stopwatch digitizer
number I s.d. I s.d. I s.d.
1 538.41 0.09 538.40 0.049 538.41 0.005
2 568.95 0.07 568.85 0.041 568.41 0.007
3 585. 11 0.07 585.12 0.039 585.10 0.003
4 630.90 0.04 630.93 0.025 630.94 0.006
5 641. 91 0.04 641. 91 0.031 641.90 0.005
6 667.12 0.03 667.11 0.038 667.02 0.005
7 676.95 0.04 676.91 0.034 676.91 0.005
8 692.07 0.04 692.05 0.025 692.05 0.006
n 11 11 6
A block diagram and a short description of the digitiser
system, developed in our laboratory (18), is given in
section 2.5.
The relative standard deviation of retention time and
retention index measurements is decreasing in the order,
distance > stopwatch > digitizer-computer. For retention
index measurements with a precision better than O.l index
unit, the use of a computer to calculate the retention time
from the peak shape is necessary. Measuring retention times
with a stopwatch a precision of about 0.1 index unit can be
expected.
The influence of column length on precision of relative
data is demonstrated in Fig. 2.6. For the interpretation of
this figure it must be considered that for a constant rela
tive retention time, an increase of column length results
in an increase in absolute retention time. For instance,
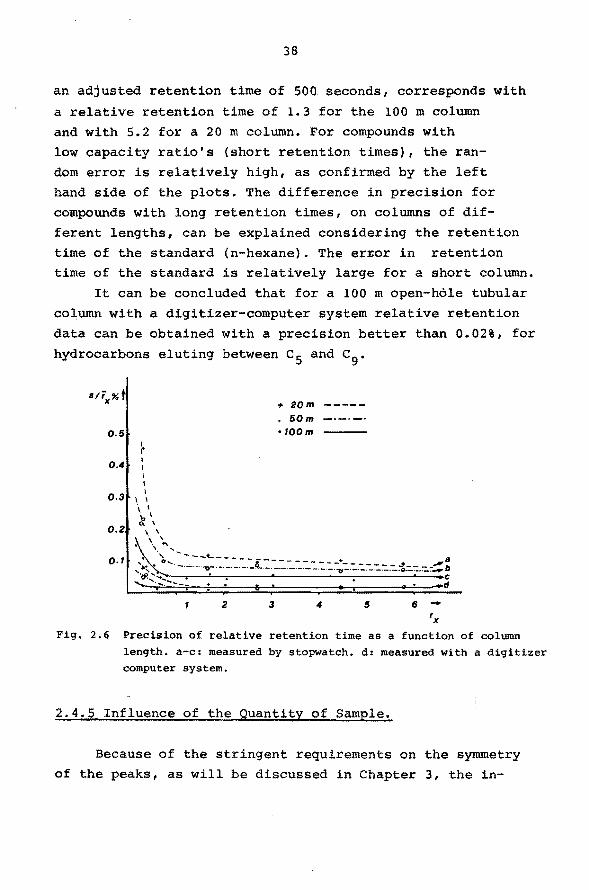
38
an adjusted retention time of 500 seconds, corresponds with
a relative retention time of 1.3 for the 100 m column and with 5.2 for a 20 m column. For compounds with
low capacity ratio's (short retention times), the ran-
dom error is relatively high, as confirmed by the left hand side of the plots. The difference in precision for
compounds with long retention times, on columns of dif
ferent lengths, can be explained considering the retention
time of the standard (n-hexane). The er~or in retention time of the standard is relatively large for a short column.
It can be concluded that for a 100 m open-hóle tubular
column with a digitizer-computer system relative retention
data can be obtained with a precision better than 0.02%, for
hydrocarbons eluting between c 5 and c9 •
o.s
0.4
0.3
0.2
0.1
\ \ 1 \ 1
~\ . . ... \ .... _
+ 2om ----
• 50m -·-·-· •100m
~ ,'~t. 1,-". _:-:.::,~ ::.:::.: :.i.:.:::..::..:-_::.:-_::::;:.:.::.::.::::.:::.:i::.::..::..::::::: 'ff,.::........ . ' . . . . . -..c
........... ·,-. ----; ! . t. • • • " • -<I
2 3 5 6 -
'x Fig. 2.6 Precision of relative retention time as a function of column
length. a-c: measured by stopwatch. d: measured with a digitizer computer system.
2.4.5 Influence of the Quantity of Sample.
Because of the stringent requirements on the symmetry of the peaks, as will be discussed in Chapter 3, the in-
39
fluence of sample size may be neglected in this investi
gation. With synthetic mixtures it was confirmed, that an
increase in sample size with a factor 10, had no influence
on the accuracy of retention indices. The quantity of sample per compound was always between 10-S and 10-lOg.
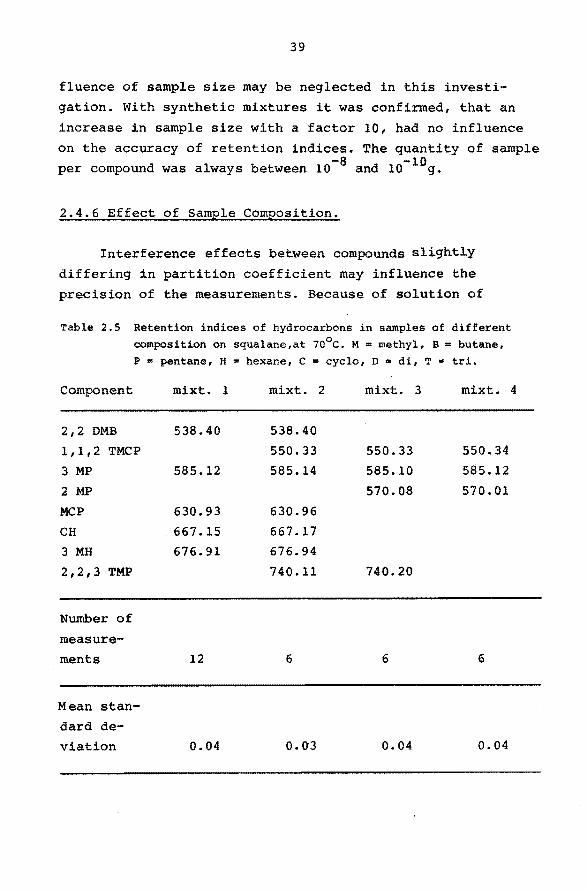
2.4.6 Effect of Sample Composition.
Interference effects between compounds sl!ghtly
differing in partition coeff icient may influence the
precision of the measurements. Because of solution of
Table 2.5 Retention indices of hydrocarbons in samples of different composition on squalane,at 10°c. M = methyl, B = butane, P = pentane, H = hexane, C = cyclo, D = di, T = tri.
Component
2,2 DMB
1,1,2 TMCP
3 MP
2 MP
MCP
CH
3 MH
2,2,3 TMP
Number of
measure
ments
Mean stan
dard de
viation
mixt.
538.40
585.12
630.93
667.15
676.91
12
0.04
1 mixt. 2
538.40
550.33
585.14
630.96
667.17 676.94
740. 11
6
0.03
mixt. 3
550.33
585.10
570.08
740.20
6
0.04
mixt. 4
550.34
585.12
570.01
6
0.04
40
one or more compounds of the sample, the properties of
the stationary phase would be slightly changed, so that
the partition coefficient, at least in principle might
be dependent on the composition of the sample. .
Experimentally this possible effect was investi
gated with 4 different synthetic mixtures, consisting
each of about 30 compounds, which were completely or
almost completely separated. Retention indices measured
with a 100 m squalane column at 70° ± o.01°c, of compounds
present in two or more of these mixtures are given in
Table 2.5.
The results justify the conclusion that this effect
can be neglected.
2.5 EXPERIMENTAL CONDITIONS AND SYSTEM DESIGN.
All the experiments are done with a self assernbled
systern, because of special requirements of pressure ,and
temperature control and sample introduction.
The pressure drop over the column is controlled in
three stages. The first stage is a conventional pressure
controller (e.g. LOOS-CO., Amsterdam) normally used on
gas cylinders. It delivers a gas-flow under a pressure of
4-5 atm., with possible fluctuations of less than 3%. For the second and third stage two pressure ê.ontrollers (BECKER,
Delft, type MB-19936) are placed in series.
This permits a pressure constancy, during one analysis,
of about 0.002 atm. The pressure drop over the column is
rneasured with a dif f erential manometer (WALLACE and TIERNAN
model F.A. 145). This pressure regulation system allows
measurernent of retention indices, with a precision of
about 0.1% (see Section 2.3.2).
No further irnprovement in precision could be obtained
with a TEXAS INSTRUMENTS precision pressure controller {type
41
150-01 and 150-02), provided with the pressure gauge (model
145). The precision of this system is 10-5 atm.
For the temperature control a liquid thermostate(TEV 70,
TAMSON, Zoetermeer), is used. The temperature constancy at
any point inside the bath is better than 0.01 degree, be
tween 50 and 10°c (see Section 2.4.3).
Since direct injection systems for open hole tubular
columns are still in the development stage, a sample intro
duction system with splitter is ernployed (HAMILTON inlet
system, with splitter). The temperature of the injection was
always 20°c above the boiling point of the highest boiling
compound, as proposed by Cramers (2).
To permit full utilisation of the column performance
and to realise a small input peak, any dead space or mixing
volume in the sampling and detection system has to be
avoided.
Therefore split ratios between 1/300 and 1/500 have
been used in all experiments. The residence time in the
mixing tube of the sample introduction system was less than
0.2 seconds.
Varying the split ratio between 1/300 and 1/500,
no influence could be observed, on the accuracy of the re
tention indices of hydrocarbons of different structural
type and boiling point.
The rneasurements are done on stainless steel columns,
0.02" o.d., 0.01" 1.d., bright finish (HANDY and HARTMAN Co,
Norristown, Penna u.s.A.). The column temperature was held
at 50 and 7o0 c ± o.01°c. The column liquids were squalane
(MERCK, Darmstadt) and Citroflex A4 (APPLIED SCIENCE LAB).
The number of theoretica! plates for the squalane columns
(length lOOm) was about 5.10 5 , for the Citroflex A4 columns
(50 and 75 m) between 2.10 5 and 3.10 5 , for n-hexane. The
carrier gas was nitrogen of high purity. The detector was
a cornmercially available flarne ionisation.detector (BECKER, -15 Delft), coupled toa low noise (10 A) amplifier, devel-
42
oped in our laboratory. The sensitivity of the detection system was l0-11A/10mv (full scale). Sample sizes varied
-8 -10 between 10 and 10 g per component. The time measurements
were done with a stopwatch. Only during the last period of
this study a digitizer unit with subsequent off-line pro
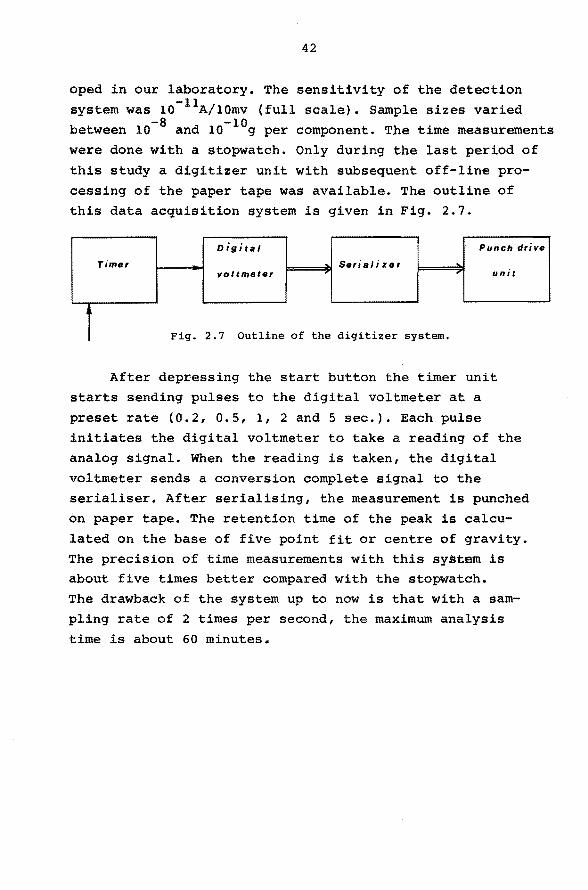
cessing of the paper tape was available. The outline of this data acquisition system is given in Fig. 2.7.
oigital Punch drive
Timer - Seri al i zer -voltmeter , , unit
î Fig. 2.7 Outline of the digitizer system.
After depressing the start button the timer unit
starts sending pulses to the digital voltmeter at a
preset rate (0.2, 0.5, 1, 2 and 5 sec.). Each pulse
initiates the digital voltmeter to take a reading of the
analog signal. When the reading is taken, the digital
voltmeter sends a conversion complete signal to the
serialiser. After serialising, the measurement is punched
on paper tape. The retention time of the peak is calcu
lated on the base of five point fit or centre of gravity. The precision of time measurements with this system is about five times better compared with the stopwatch. The drawback of the system up to now is that with a sam
pling rate of 2 times per second, the maximum analysis
time is about 60 minutes.
43
2.6 SYSTEMATIC ERRORS.
2.6.l Introduction.
Sofar, only the influence of random errors on the
precision of relativa retention data has been discussed.
The interlaboratory agreement of retention data,
however, mainly depends on systematic errors, which
cannot be easily detected.
The main factors affecting the accuracy of retention data which will be discussed in the next sections,
are the following:
definition and stability of the stationary
phase, incomplete separation,
non ideality of carrier gas,
interfacial adsorption,
gas hold-up time,
operator.
2.6.2 Definition and Stability of the Stationary Phase.
The general usefulness of published retention data
is drastically limited by the wide and indiscriminate
use of stationary phases.
Compilations of literature data present lists of
retention data on about 250 stationary phases, at dif
ferent temperatures (19-21).
Improvement of this situation can only be expec
ted if the number of stationary phases is strongly reduced by international agreement.
This implicates a careful selection of the best
stationary phases. To enable this selection the stationary phases must be characterized, so that their
44
properties can be compared. A literature survey of this
subject, discussed by several authors, is given by
Walraven ( 12) • The complexity of the standardization of stationary
phases was clearly demonstrated at the Lausanne Sympo
sium in 1969 (22). In an informal discussion the gene
ral opinion of the participants was that for the time
being this procedure is premature. Because of a lack
of generally accepted norms for the choice, the most
important requirements for the selection and specifi
cation öf the stationary phase were summarised inl 10
statements.
Therefore, in the writers opinion, the stati.onary
phase should be an unambigeously defined pure substance. Mixed stationary phases, e.g. P.E.G., apiezon, etc,
shou~d be avoided. Column characteristics should not change during
use, because of loss, or chemical changes of stationary
phase. Oxidation due to traces of oxygen in the carrier
gas is one of the most common reasons for changes in the
nature of stationary phase. Therefore the use of high
purity carrier gases and removal of traces of oxygen is
strongly recommended.
In addition to these requirements in the ideal case, the stationary phase selected should fulfil the following conditions:
sample components should have a reasonable
solubility in the liquid phase and exhibit
different partition coef~icients,
the vapeur pressure of the liquid phase must be negligible,
the liquid phase should be thermally stable,
the stationary phase should be chemically
inert towards the sample components under separating conditons.
45
Considering these requirements squalane is chosen
as the a-polar phase and acetyltributylcitrate as the
polar phase, in this investigation. An additional argu
ment f or the choice of squalane was that a lot of reten
tion data for this phase are available in the literature
for comparison.
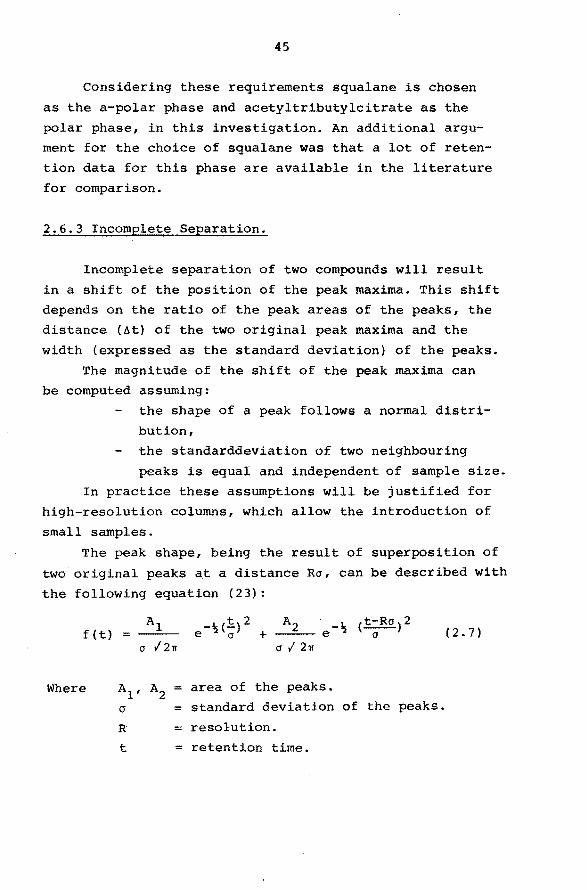
2.6.3 Incomplete Separation.
Incomplete separation of two compounds will result
in a shift of the position of the peak maxima. This shift
depends on the ratio of the peak areas of the peaks, the
distance (~t) of the two original peak maxima and the
width (expressed as the standard deviation) of the peaks.
The magnitude of the shift of the peak maxima can
be computed assuming:
the shape of a peak fellows a normal distri
bution,
the standarddeviation of two neighbouring
peaks is equal and independent of sample size.
In practice these assumptions will be justified for
high-resolution columns, which allow the introduction of
small samples.
The peak shape, being the result of superposition of
two original peaks at a distance Ra, can be described with
the following equatian (23):
f(t) = A2 · .;..~ (t-Ro) 2
+---e· a (2.7) a 1 211
Where area of the peaks.
cr standard deviation of the peaks.
R = resolution.
t = retention time.
46
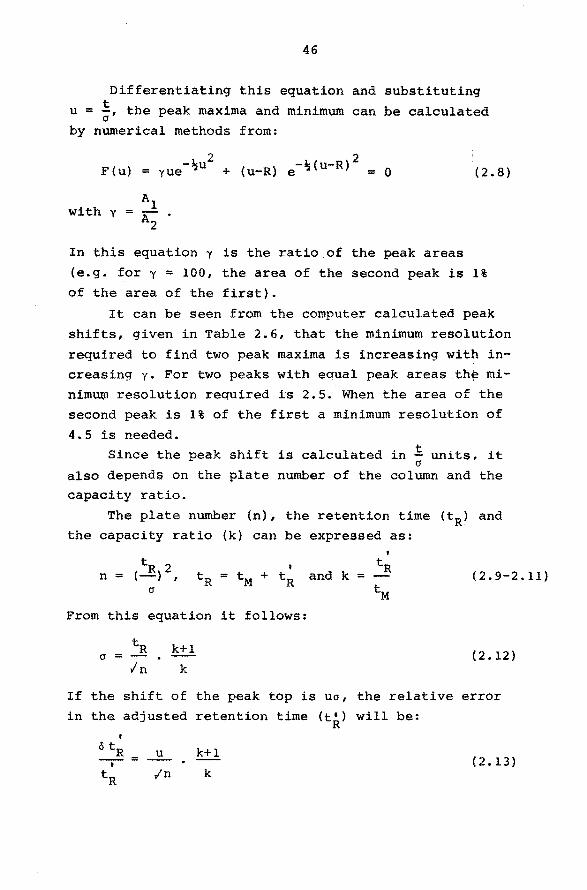
Differentiating this equation and substituting
u = !, the peak maxima and minimum can be calculated C1
by numerical methods from:
F (u) ~u2 i. ) 2 = yue + (u-R) e-~cu-R = o
Al with y = A .
2
(2.8)
In this equation y is the ratio of the peak areas
(e.g. for y = 100, the area of the second peak is 1%
of the area of the first).
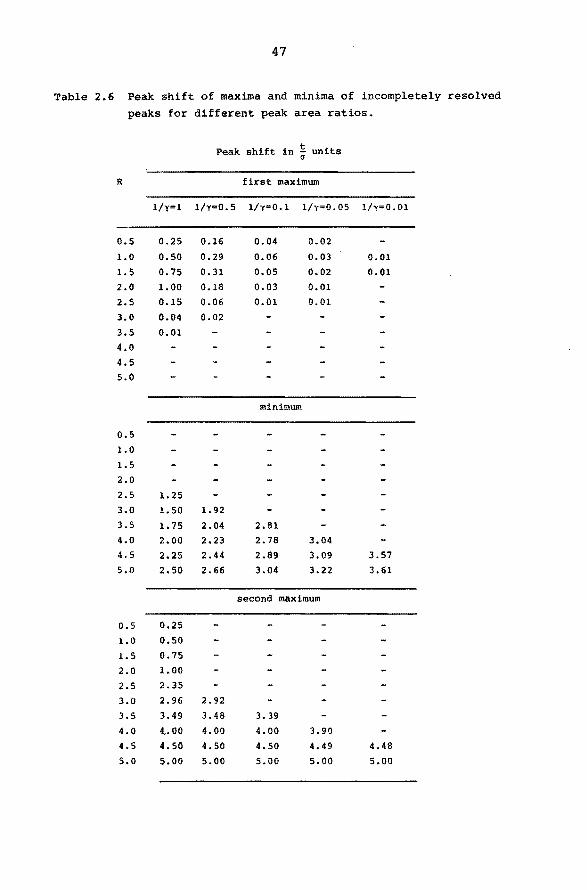
It can be seen f rom the computer calculated peak
shifts, given in Table 2.6, that the minimum resolution
required to find two peak maxima is increasing with in
creasing y. For two peaks with eaual peak areas the mi
nimu~ resolution required is 2.5. When the area of the
second peak is 1% of the first a minimum resolution of
4.5 is needed.
Since the peak shift is calculated in 1 units, it C1
also depends on the plate number of the column and the capacity ratio.
The plate number (n), the retention time (tR) and
the capacity ratio (k) can be expressed as:
n = and k =
From this equation it fellows:
If
in
the shift
k+l
k
of
the adjusted 1
ó tR = u -,-
tR In
the peak top is ucr, the relative
retention time ( t' ) R
will be:
k+l
k
(2.9-2.11)
(2.12)
error
(2.13)
47
Table 2.6 Peak shift of maxima and minima of incompletely resolved
peaks for different peak area ratios.
Peak shift in ~ units
R first maximum
1/y=l l/y=0.5 l/y=O.l l/y=0.05 l/y=0.01
0.5 0.25 0.16 0.04 0.02
1.0 0.50 0.29 0.06 0.03 0.01
1.5 0.75 0.31 0.05 0.02 0.01
2.0 1.00 0.18 0.03 0.01
2.5 0.15 0.06 0.01 0.01
3.0 0.04 0.02
3.5 0.01
4.0
4.5
5.0
minimum
0.5
1.0
l. 5
2.0
2.5 1. 25
3.0 l. 50 l. 92
3.5 1.75 2.04 2.81
4.0 2.00 2.23 2.78 3.04
4.5 2.25 2.44 2.89 3.09 3.57
5.0 2.50 2.66 3.04 3.22 3.61
second maximum
o.5 0.25
1.0 o.so 1.5 0.75
2.0 1.00
2.5 2.35
3.0 2.96 2.92
3.5 3.49 3.48 3.39
4.0 4.. 00 4.00 4.00 3.90
4.5 4.50 4.50 4.50 4.49 4.48
5.0 5.00 5.00 5.00 5.00 5.00
48
The dependence of the retention index on the peak
shift can be calculated in the foliowing way:
The retention index is defined as:
ln t' - ln t' x z • 100 + lOOz. (2.14) t
ln t z+l - ln t'z
Where t' is the adjusted retention time of a component x
x and t'z+l and t'z are the adjusted retention times of
the bracketing n-alkanes, z being the number of carbon
atoms.
Since only t'x is influenced by the peak shift,
ln t'z+l and l~ t'z can be considered as constant.
Differentiation of equation 2.14 gives:
100 1
ln t' - ln t' z+l z t' x
Since ln t' - ln t' "' 0, 4 (Table 2. 11) for a z+l z 0 squalane column between 50 and 7o0 c, this results
in:
"' 250 öt' x
t' x
(2.15)
(2.16)
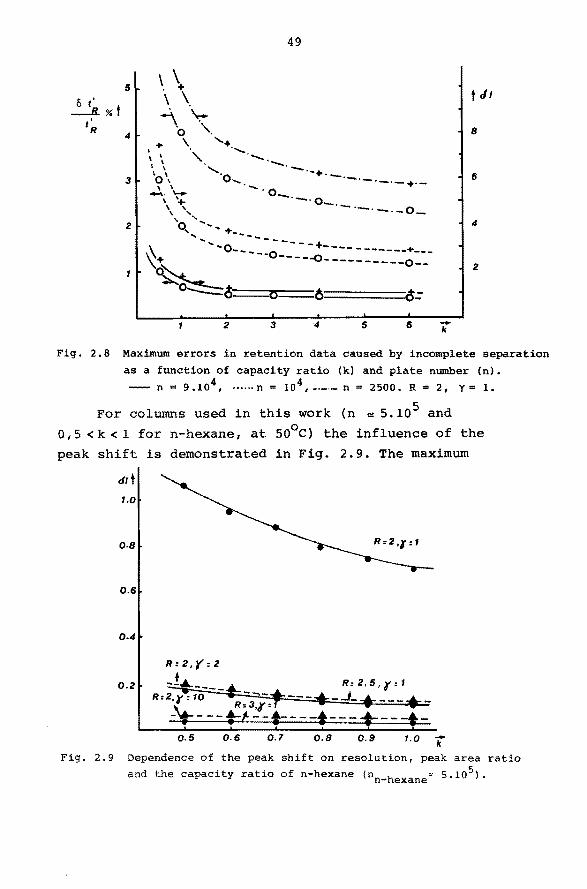
The maximum peak shift will be found for y = 1 and
R = 2. In this case the error in retention time and re
tention index, calculated by equation 2.13 and 2.15 is
presented in Fig. 2.8 as a function of the capacity ra
tio for different plate nurnbers. These plate numbers can
be considered to be representative for packed and open
hole tubular columns of moderate length.
These results stress the importance of the use
of high resolution columns for the deterrnination of accurate retention data.
5
ö t' --1i ~id
t~ 4
3
2
\ \ \ \ . .\--\ .
·o '· + \ '+
~ \ ., '""- '---~
49
\ \ ' -·-·-+ 'o\ ·o, ·-·-·-·-·-+·-
..:... \"... ·-·o \ \.+ --·--~ 0- . .._ \ ', ·-·-·-0-
'o ' ......... '.... ..... + ...... __ ........ ------+
\\+ -0-----0-----0 -----------+---'\ ----------0--
~à---o---ó=======o= 2 3 4 5 6
telt
8
6
4
2
-k
Fig. 2.8 Maximum errors in retention data caused by incomplete separation
as a function of capacity ratio (k) and plate number (n).
-- n = 9.104 , ······n = io 4 ,-·-·- n = 2500, R = 2, yc: 1.
For columns used in this work (n 1:t 5. io5 and
O, 5 < k < 1 for n-hexane, at so0 c) the influence of the
peak shift is demonstrated in Fig. 2.9. The maximum
c1/t 1.0
0.8
0.6
0.2
-k o.5 o.r 1.0 0.6 0.8 0.9
Fig. 2.9 Dependence of the peak shift on resolution, peak area ratio
and the capacity ratio of n-hexane (nn-hexane~ 5.105).
50
peak shift (R=2, y=l) is between 0.7 and 1.1 index
units for capacity ratios for n-hexane between 0.5
and 1.0. Fora change in resolution from 2 to 2.5 or
a change in y from 1 to 2 the maximum peak shift of the
first peak will be between 0 .1 and 0. 2 index units.'
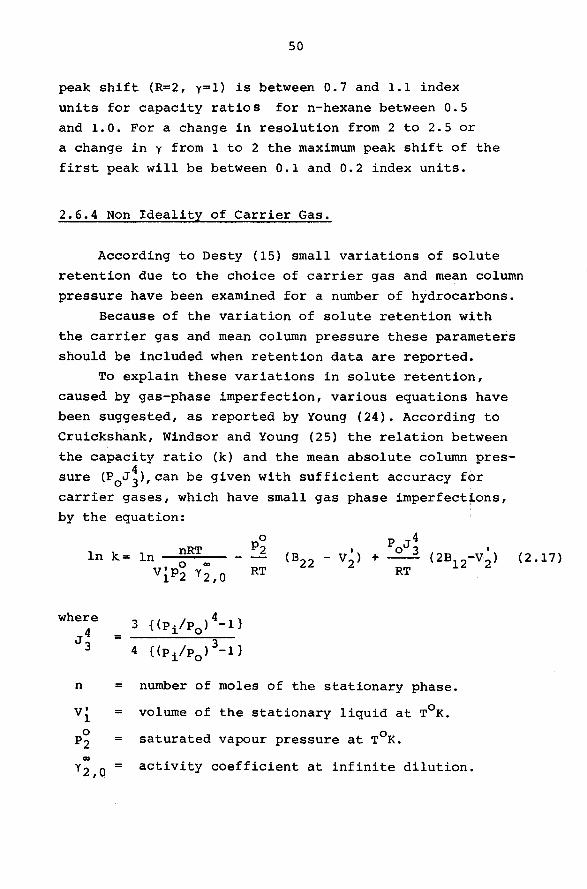
2.6.4 Non Ideality of Carrier Gas.
According to Desty (15) small variations of solute
retention due to the choice of carrier gas and mean column
pressure have been examined for a number of hydrocarbons.
Because of the variation of solute retention with
the carrier gas and mean column pressure these parameters
should be included when retention data are reported.
To explain these variations in solute retention,
caused by gas-phase imperfection, various equations have
been suggested, as reported by Young (24). According to
Cruickshank, Windsor and Young (25) the relation between
the capacity ratio (k) and the mean absolute column pres
sure (P0Jj),can be given with sufficient accuracy for
carrier gases, which have small gas phase imperfections, by the equation:
where J4
3
n number of moles of the stationary phase.
volume of the stationary liquid at T°K.
saturated vapeur pressure at T°K.
activity coefficient at infinite dilution.
(2.17)
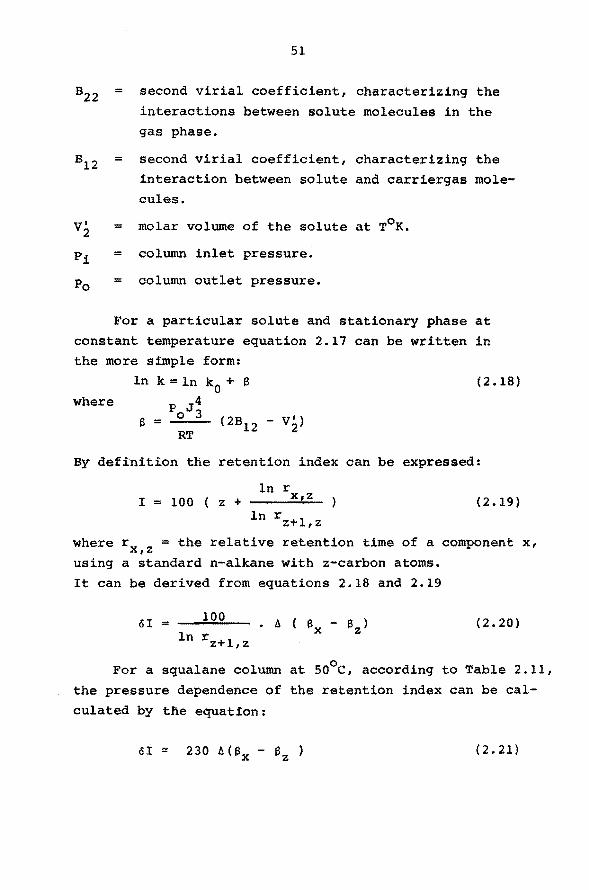
51
B22 = second virial coefficient, characterizing the interactions between solute molecules in the gas phase.
8 12 second virial coefficient, characterizing the înteraction between solute and carriergas mole-cules.
v• = molar volume of the solute at T°K. 2
pi = column in let pressure.
Po = column out let pressure.
For a particular solute and stationary phase at
constant temperature equation 2.17 can be written in the more simple form:
ln k = ln k0 + J3 ( 2 • 18)
where P J4 0 3
J3 = -- (2Bl2 - V2) RT
By definition the retention index can be expressed:
I = 100 ( z + ln r x,z
ln rz+l,z (2.19)
where r = the relative retention time of a component x, x,z using a standard n-alkane with z-carbon atoms.
It can be derived from equations 2.18 and 2.19
öI = (2.20)
For a squalane column at so0 c, according to Table 2.11,
the pressure dependence of the retention index can be cal
culated by the equation:
(2.21)
52
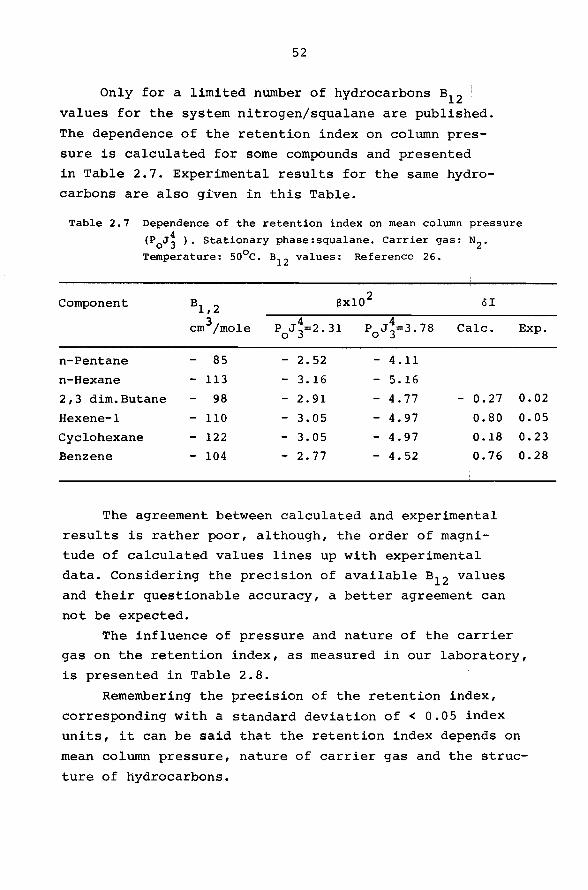
Only for a limited number of hydrocarbons s12 values for the system nitrogen/squalane are published.
The dependence of the retention index on column pres
sure is calculated for some compounds and presentea!
in Table 2.7. Experimental results for the same hydro
carbons are also given in this Table.
Table 2.7 Dependence of the retention index on mean column pressure
(P0J~ ). Stationary phase:squalane. Carrier gas: N2 •
Temperature: so0 c. B12 values: Reference 26.
Component 81,2 f3x10 2 öI
cm3/mole 4 P0
J 3=2.31 4 P0
J 3=3. 78 Calc.
n-Pentane 85 - 2.52 - 4.11
n-Hexane - 113 - 3.16 - 5.16
2,3 dim.Butane 98 - 2.91 - 4. 77 - 0.27
Hexene-1 - 110 - 3.05 - 4.97 0.80
Cyclohexane - 122 - 3.05 - 4.97 0.18
Benzene - 104 - 2.77 - 4.52 0.76
The agreement between calculated and experimental
results is rather poer, although, the order of magni
tude of calculated values lines up with experimental
data. Considering the precision of available s12 values
and their questionable accuracy, a better agreement can
not be expected.
Exp.
0.02
0.05
0.23
0.28
The influence of pressure and nature of the carrier
gas on the retention index, as measured in our laboratory,
is presented in Table 2.8.
Remembering the preeision of the retention index,
corresponding with a standard deviation of < 0.05 index
units, it can be said that the retention index depends on
mean column pressure, nature of carrier gas and the struc
ture of hydrocarbons.
53
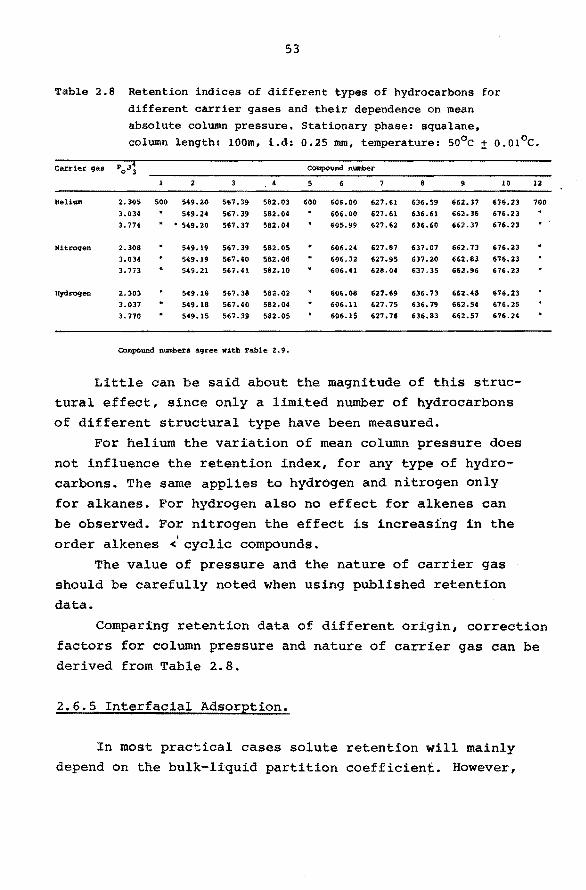
Table 2.8 Retention indices of different types of hydrocarbons for different carrier gases and their dependence on mean absolute column pressure, Stationary phase: squalane, column length: lOOm, i.d: 0.25 mm, temperature: so0 c :!: o.01°c.
Carrier gas POJ3 Compound number
3 5 6 9 10
Heli Wil 2.305 500 549.20 567. 39 582.03 600 606.00 627 .61 636.59 662.37 676.23
3.034 549.24 567. 39 582.04 606. 00 627 .61 636.61 662. 36 676.23
3. 774 . • 549.20 567 .37 582.04 605.99 627 .62 636.60 662.37 676.23
Nitrogen 2.308 549.19 567. 39 582.05 606.24 627.87 637 .07 662. 73 676.23
3.034 549.19 567 .40 582.08 606.32 627.95 637.20 662.83 676. 23
3. 773 549.21 567.41 582.10 606.41 628.04 637 .35 662.96 676.23
Hydrogen 2.303 549.18 567. 38 582.02 606.08 627.69 636. 73 662.48 676.23
3.037 549.18 567. 40 582.04 606.ll 627. 75 636. 79 662.54 676.25
3.770 549.15 567.39 582.05 606.1$ 627. 76 636.83 662.57 676.24
Compound numbera agree with Tal:>le 2. 9.
Little can be sa id about the magnitude of this struc-
tural effect, since only a limited nurnber of hydrocarbons
of different structural type have been measured.
For helium the variation of mean column pressure does
not influence the retention index, for any type of hydrocarbons. The same applies to hydrogen and nitrogen only
for alkanes. For hydrogen also no effect for alkenes can
be observed. For nitrogen the effect is increasing in the
order alkenes <1
cyclic compounds.
The value of pressure and the nature of carrier gas
should be carefully noted when using published retention
data.
12
700
Comparing retention data of different origin, correction
factors for column pressure and nature of carrier gas can be derived from Table 2.8.
2.6.5 Interfacial Adsorption.
In most practical cases solute retention will mainly
depend on the bulk-liquid partition coefficient. However,
54
more often than is generally recognised the solute may
also be retained as a result of adsorption at one or more
· interfaces in the system. Solid supports for the stationary phase have long been
known bo interact with several types of solutes.and preven
tive measures (e.g. acid washing, silanisation, addition of
tail reducers) are widely taken.
According to Urone and Parcher (27), support effects
can be observed even in columns with 20% or more stationary
phase.
Interactions of the solute with the gas-liquid inter
face received little theoretica! and no practical conside
ration until Martin {28,29) demonstrated that solute ad
sorption on the bulk-liquid surface (Gibbs adsorption) ex
ists for polar phases.
This result was reproduced and extended by Pecsok (30)
and confirmed by statie measurements (31-33).
According to Martire (34) the effect of adsorption on the
liquid surface is small compared to solution effects, except
in these instances when a highly polar liquid coating is
used and the solute is only slightly soluble.
In practice,however, it appears difficult to determine
the separate contributions of bulk-liquid partition and
liquid-interfacial and solid support adsorption.
Assuming that all these retention mechanisms operate
essentially independently, the contribution to the adjusted
retention volume (V~) of a compound is given by equation (35,
36}:
V' = x (2.22)
In this equation K1 , K911
and Ks are respectively
the gradients of the distribution isotherm for the re
tention mechanism in the bUlk-liquid, gas-liquid inter-
55
face and the solid support. A1 and,As are the active surface areas of the liquid and the support. v 1 is the
total volume öf the liquid phase in the column.
The bulk-liquid partition coefficient can be ob
tained by plotting V~/v1 vs. l/v1 and extrapolating
L-o. vl
For asymmetrical peaks, assuming thet the asymme
try is not caused by extra column factors, V~ becomes
concentration dependent. Adjusting the sample size to maintain constant inlet concentration, the variation of
the distribution coefficients can be eliminated experi
mentally as described previously (37). Even at constant solute concentration in gas and liquid
1
phase, the plot of vx;v1 vs l/V1 cannot be expected to be
linear, since both A1 and As are functions of v1 •
These problems can be reduced by taking the follo-
wing measures:
reduction of sample size so that retention
times become concentration independent
(constant distribution càefficients, symme
trical peaks).
decrease of liquid- and support surface. improvement of the precision of the measure
ments. These conditions are fulfilled to a great extent in
open-~ole tubular columns and also partly in eff iciently packed columns with an internal diameter less than 1 mm (e.g. micropacked columns). Considering as a first appro
ximation, K911
A1 and KsAs to be constant for these column
types equation 2.22 can be rewritten:
56
At effective infinite dilution (symmetrical peaks) a 1
linear relationship can be expected, plotting Vx/v1 vs. l/V1 •
Relative retention data derived from bulk liquid par
tition coefficients,obtained from these plots, will be not 1
very precise, because of variation of V and v 1 . . x To improve the precision of calculated relative re-
tention data, corrected for adsorption effects, equation
2.23 can be rearranged. The relative retention time can be
expressed as :
r x,s = V' x
V' s
(2.24)
where V'x and V'9
are the adjusted retention volumes of the component and the standard.
Assuming that for the selected standard Ax = O, it follows from equation 2.23:
(2.25)
Kl,s being the bulk-liquid partition coefficient of the standard.
Substituting eqn. 2.23 and 2.25 in eqn. 2.24, yields:
rx,s V' x
V' s
From the relation between
capacity ratio (k118
) and standard it fellows:
k v l,s g
K l,s
(2.26)
partition co~fficient (K118
),
phase ratio(_!.) of the vg
(2.27)
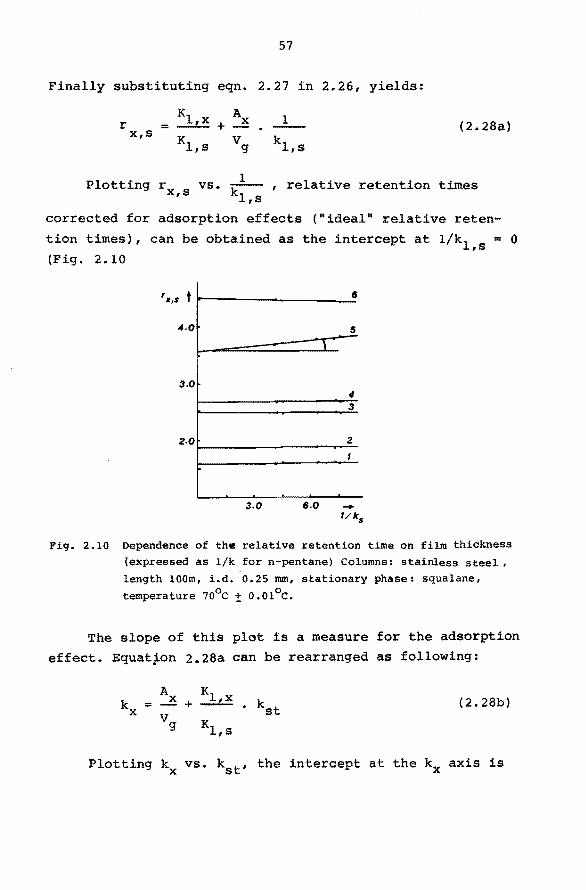
57
Finally substituting eqn. 2.27 in 2.26, yields:
K Ax l r = l,x + x,s
Kl,s vg k 1,s
(2.28a)
Plotting rx,s vs. ~k1 , relative retention times 1,s
corrected for adsorption effects ("ideal" relative reten
tion times), can be obtained as the intercept at l/k1 = 0 ,s (Fig. 2.10
'11,s t 6
4.0 ~ \
3.0 4 3
2.0 2
3.0 6.0
Fig. 2.10 Dependence of the relative retention time on film thickness (expressed as l/k for n-pentane) Columns: stainless steel,
length lOOm, i.d. 0.25 mm, stationary phase: squalane,
temperature 70°c t O.Ol°C.
The slope of this plot is a rneasure for the adsorption
effect. Equation 2.28a can be rearranged as following:
Ax K
kx = + 1,x . kst (2.28b) vg K l,s
Plotting k vs. kst' the intercept at the kx axis is x
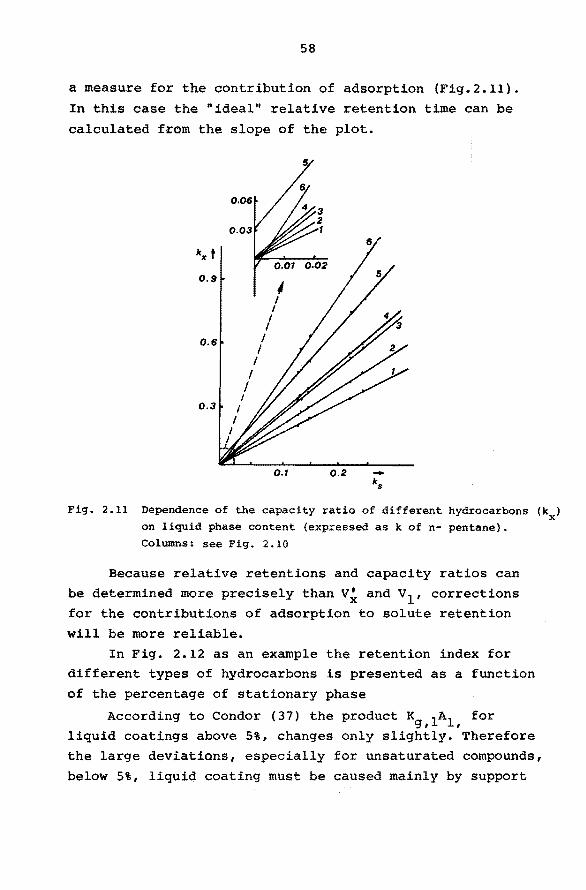
58
a measure for the contribution of adsorption (Fig.2.11).
In this case the "ideal" relative retention time can be
calculated from the slope of the plot.
kx t 0.01 0.02
0.9 Î I
I I
I 0.6 I
I I
I I
I 0.3 I
I I
I J.
0.1 0.2 -ks
Fig. 2.ll Dependence of the capacity ratio of different hydrocarbons (kx) on liquid pbase content (expressed as kof n- pentane).
Columns: see Fig. 2.10
Because relative retentions and capacity ratios can
be determined more precisely than V~ and v1 , corrections for the contributions of adsorption to solute retention
wil! be more reliable.
In Fig. 2.12 as an example the retention index for different types of hydrocarbons is presented as a function
of the percentage of stationary phase
According to Condor (37) the product Kg 11A11
for liquid coatings above 5%, changes only slightly. Therefore the large deviations, especially for unsaturated compounds,
below 5%, liquid coating must be caused mainly by support
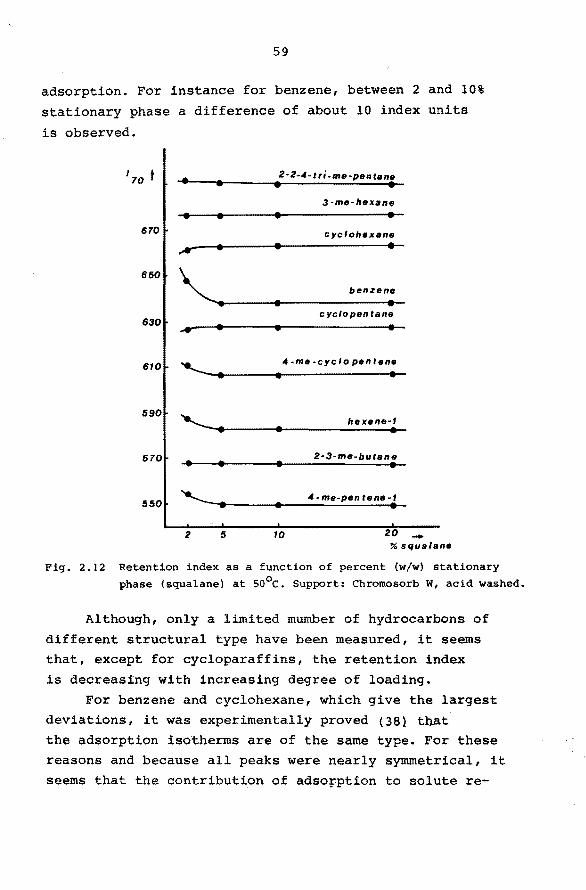
59
adsorption. For instance for benzene, between 2 and 10%
stationary phase a difference of about 10 index units
is observed.
• •
670
Ar • 650
"'· 630 • ..... 610 ............ . 590
'--· 570
550 '--· 2 5
2·2-4-tri-me-pen tane
• • 3-me-hexane
cyclohexane
• • benzene
• • cyclopentane
• • 4-me-cyclo pent ene
• •
•
• 10
hexene-1
• 2·3-me-butane
4 ·me-pen ten• ·1 • 20 -
% squalane
Fig. 2.12 Retention index as a function of percent {w/w) stationary phase {squalane) at so0 c. Support: Chromosorb W, acid washed.
Although, only a limited mumber of hydrocarbons of
different structural type have been measured, it seems that, except for cycloparaffins, the retention index
is decreasing with increasing degree of loading.
For benzene and cyclohexane, which give the largest
deviations, it was experimentally proved (381 tb.at the adsorption isotherms are of the same type. For these
reasons and because all peaks were nearly symmetrical, it
seems that the contribution of adso~ption to solute re-
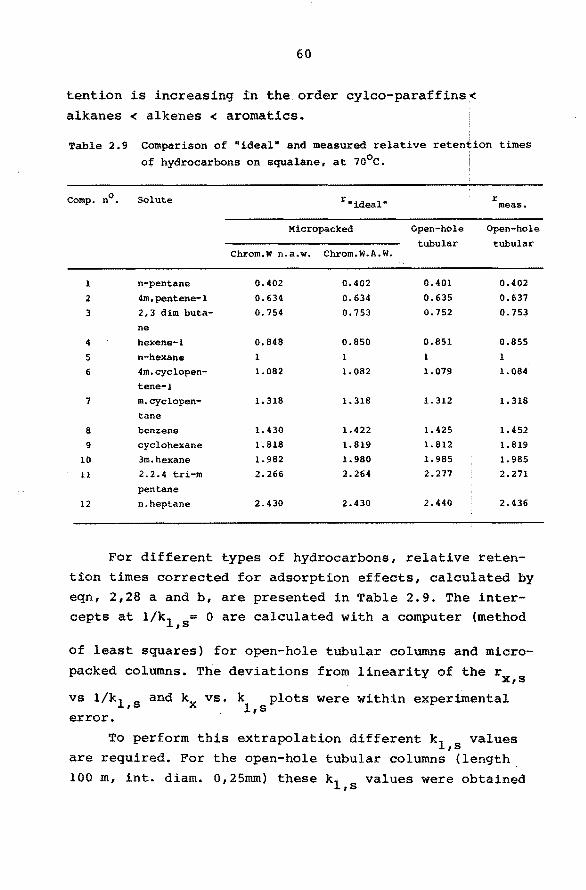
60
tention is increasing in the order cylco-paraffins<
alkanes < alkenes < aromatics.
Table 2.9 Comparison of "ideal" and measured relative retention times of hydrocarbons on squalane, at 70°c.
Comp. n°. Solute
l
2
3
4
5
6
7
8
9
10
11
12
n-pentane
4m,pentene-l
2,3 dim buta-ne
hexene-1
n-hexane 4m.cyclopen
tene-l
m.cyclopentane
benzene cyclohexane
3m.hexane 2.2.4 tri-m
pentane n.heptane
r "ideal"
Micropacked
Chrom.W n.a.w. Chrom.W.A.W.
0.402
0.634
o.754
0.848
l
1. 082
1.318
1.430 1.818
1.982
2.266
2.430
0.402
0.634 o.753
0.850
l
1.082
1. 318
1.422 1.819
1.980
2.264
2.430
Open-hole
tubular
0.401
0.635 0.752
0.851
1.079
1. 312
1.425
1.812
1.985 2.277
2.440
r meas.
Open-hole
tubular
0.402
0.637 0.753
0.855
1
1.084
l. 318
1.452 1.819
1.985 2.271
2.436
For different types of hydrocarbons, relative reten
tion times corrected for adsorption effects, calculated by
eqn, 2,28 a and b, are presented in Table 2.9. The intercepts at l/k1 = O are calculated with a computer (method ,s
of least squares) for open-hole tubular columns and micro
packed columns. The deviations from linearity of the rx,s
vs l/k1 s and kx vs. k plots were within experimental ' l,s
error.
To perforrn this extrapolation different k1 values ,s are reguired. For the open-hole tubular columns (length
100 m, int. diam. 0,25mm) these k1 values were obtained ,s
61
by recoa ting the column several times ( 0. 3 < k1 < 0. 8 for 0 . ,s
n-hexane, at 50 C). For the micropacked columns (length
15m, int. diam 0.8 nun) two different supports, (chrornosorb w a.w. and n.a.w.) coated with 2, 5, 10,and 20 % The
stationary phase was squalane ( MERCK, Darmstadt).
The column temperature was 70 ± o.01°c and the carrier
gas nitrogen.
Because calculated ("ideal") values are obtained by
extrapolation, they can be expected to be less precise
than the values experimentally obtained. Within experi
mental and calculation errors the accuracy of relative
retention data of alkanes and cycloparaffins is not
influenced by adsorption ef f ects for the open-hole tu
bular column considered. (kn-hexane = o.7 at so0 c). For benzene and also for unsaturated hydrocarbons the
influence of adsorption cannot be neglected. Comparing
the difference between experimental and "!deal" relative
retention {adsorption shift) and remembering Fig. 2.11,
it can be concluded that benzene is most strongly ad
sorbed.
In the following an attemp; is made to decide if
the observed adsorption effect is due to either support
adsorption or adsorption at the gas-liquid interface.
Assuming that adsorption at the gas-liquid inter-
face can be neglected, the adsorption shift will depend
on the nature of the support and/or column wall, the degree of liquid loading and the regularity of the liquid
film. In this case it may be expected that the adsorption
shift will decrease with increasing film-thickness.
Plotting kx vs k 1 ,sthese plots will pass the origin for
all hydrocarbons if the liquid film is homogeneously
distributed on support and/or column wall. For an irre
gular liquid film the adsorption shift can be expected to be different for various supports and column walls, which
have dissimilar surfaces.
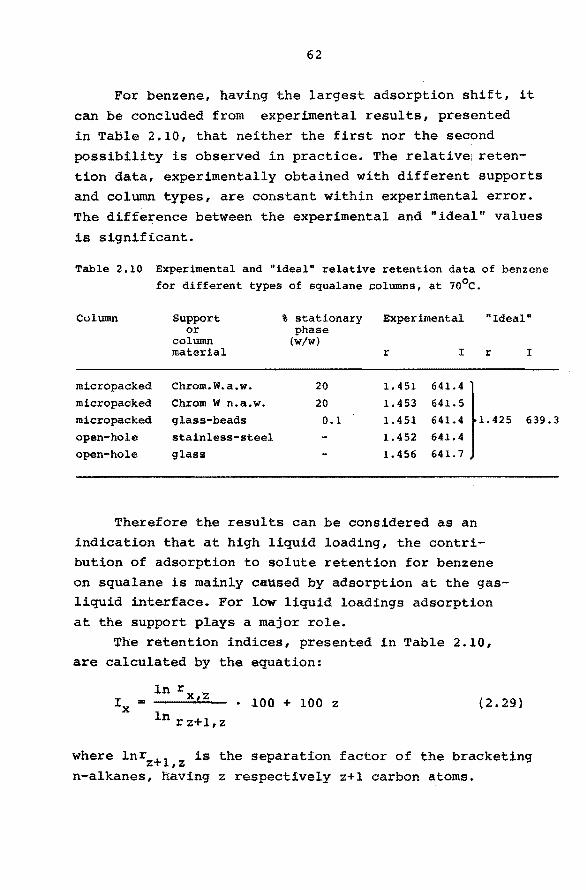
62
For benzene, having the largest adsorption shift, it
can be concluded from experimental results, presented
in Table 2.10, that neither the first nor the second
possibility is observed in practice. The relative1 reten
tion data, experimentally obtained with different supports and column types, are constant within experimental error.
The difference between the experimental and "ideal" values
is significant.
Table 2.10 Experimental and "ideal" relative retention data of benzene for different types of squalane columns, at 10°c.
Column Support or
column material
% stationary phase
(w/w)
Experimental "Ideal"
r I r I
micropacked Chrom.W.a.w. 20 1. 451 641.41 micropacked Chrom W n.a.w. 20 1.453 641.5
micropacked glass-beads 0.1 1.451 641.4 1. 425
open-hole stainless-steel 1.452 641.4
open-hole glass 1.456 641. 7
Therefore the results can be considered as an
indication that at high liquid loading, the contribution of adsorption to solute retention for benzene
on squalane is mainly caused by adsorption at the gasliquid interface. For low liquid loadings adsorption
at the support plays a major role.
The retention indices, presented in Table 2.10,
are calculated by the equation:
= ln rx,z
ln r z+l, z • 100 + 100 z (2.29)
639.3
where lnr +l is the separation factor of the bracketing z ,z n-alkanes, having z respectively z+l carbon atoms.
63
For the calculation of the"idea1"retent~on index of
benzene the apparent separat~on factor of benzene is used.
This factor is obtained by interpolation of the separation factors of n-alkanes, presented in Table 2.11.
The procedure described before can also be applied
to study the aging of the column. As is generally known
the quantity of stationary phase is decreasing during
life-time. For a lOOm open-hole tubular squalane column
experimentally a decrease of the capacity ratio of n-o
hexane at 50 C from 0.80 to 0.56 was found, during 18
months. At the same time the retention index of benzene
increased from 641.7 to 642.3.
With this column, plotting r vs l/k1 for benzene x,s ,s an "ideal" relative retention time of l.426 was obtained as
the intercept, l/kl,s = 0. This can be seen as an indication that the influence
of the chemica! change of the stationary phase (e.g.oxidation)
is neglegibly small. The change of retention data, as a re
sult of aging of the column, is most likely mainly caused
by the "stripping" effect.
As a final result of the foregoing considerations the
adsorption shift of benzene is proposed as a measure for the
interlaboratory agreement of relative retention data, for
hydrocarbons.
2.6.6 The Gas Hold-up Time.
The retention time of an inert compound (tm) which passes through the column without being retarded (usu
ally helium or air) must be known for the calculation of relativa retention data.
Direct measurement is not always possible e.g.
the flame ionisation detector, under normal operating conditions does not respond to helium or air. Therefore
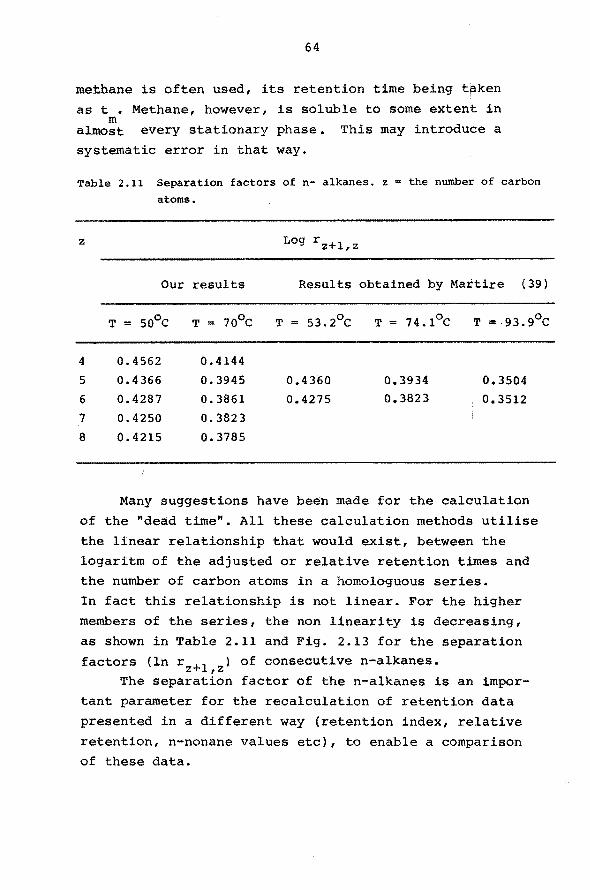
64
methane is often used, its retention time being t~ken
as t • Methane, however, is soluble to some extent in m
almost every stationary phase. This may introduce a
systematic error in that way.
Table 2.11 Separation factors of n- alkanes. z the number of carbon
atoms.
z Log rz+l,z
Our results Results obtained by Martire (39)
T = 50°C T = 70°C T = 53.2°C T=74.1°C T=·93.9°C
4 0.4562 0.4144
5 0. 4366 0.3945 0.4360 o.3934 0.3504
6 0.4287 0.3861 0.4275 0.3823 0.3512
7 0.4250 0.3823
8 0.4215 0.3785
Many suggestions have been made for the calculation
of the "deàd time". All these calculation rnethods utilise
the linear relationship that would exist, between the
logaritrn of the adjusted or relative retention times and the nurnber of carbon atorns in a homologuous series.
In fact this relationship is not linear. For the higher
mernbers of the series, the non linearity is decreasing,
as shown in Table 2.11 and Fig. 2.13 for the separation factors (ln r +l ) of consecutive n-alkanes. z ,z
The separation factor of the n-alkanes is an; impor-
tant parameter for the recalculation of retention data
presented in a different way (retention index, relative
retention, n-nonane values etc), to enable a comparison of these data.
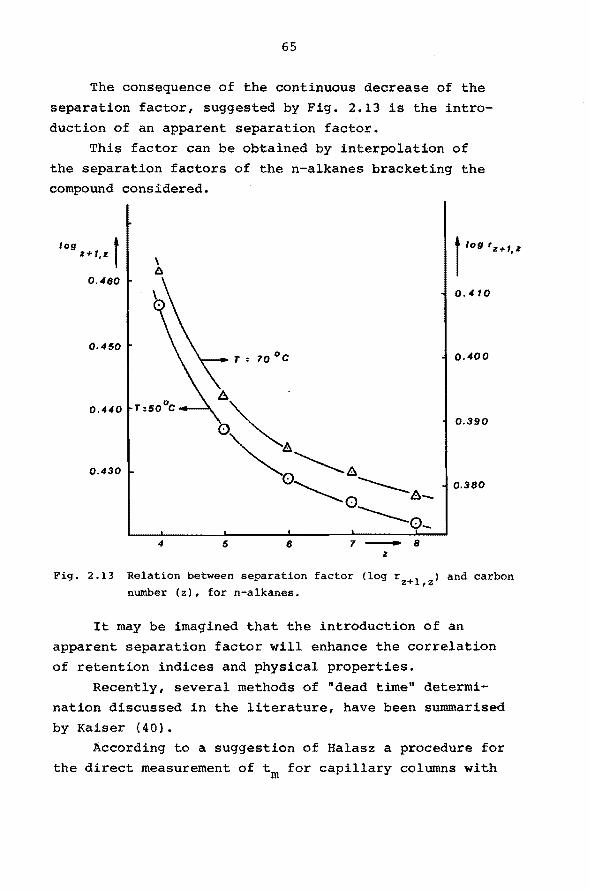
65
The consequence of the continuous decrease of the
separation factor, suggested by Fig. 2.13 is the intro
duction of an apparent separation factor.
This factor can be obtained by interpolation of
the separation factors of the n-alkanes bracketing the compound considered.
log l Z+f,z
0.460
0.450
0.430
\ tl
4 5
T • 70 °c
6 1- 8 z
t log 'z+1,z
o. 410
o.4oo
0.390
0.380
Fig. 2.13 Relation between separation factor (log rz+l,z) and carbon number (z), for n-alkanes.
It may be imagined that the introduction of an
apparent separation factor will enhance the correlation
of retention indices and physical properties.
Recently, several methods of "dead time" determi
nation discussed in the literature, have been summarised
by Kaiser ( 40).
According to a suggestion of Halasz a procedure for
the direct measurement of tm for capillary columns with
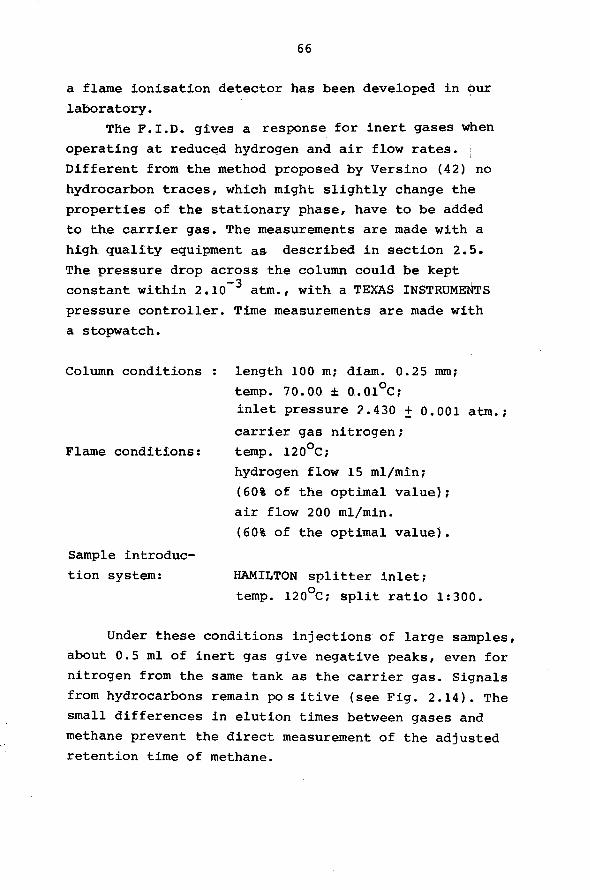
66
a flame ionisation detector has been developed in our
laboratory. The F.I.D. gives a response for inert gases when
operating at reduc~d hydrogen and air flow rates.
Different from the method proposed by Versino (42) no
hydrocarbon traces, which might slightly change the
properties of the stationary phase, have to be added
to the carrier gas. The measurements are made with a
high quality equipment as described in section 2.5.
The pressure drop across the column could be kept
constant within 2.10-3 atm., with a TEXAS INSTRUMENTS
pressure controller. Time measurements are made with
a stopwatch.
Column conditions
Flame conditions:
Sample introduc
tion system:
length 100 m; diam. 0.25 mm;
temp. 70. 0.0 :1: O. 01°c; inlet pressure 7.430 ± 0.001 atm.;
carrier gas nitrogen;
temp. 120°c;
hydrogen flow 15 ml/min;
(60% of the optima! value);
air flow 200 ml/min.
(60% of the optima! value).
HAMILTON splitter inlet;
temp. 120°c; split ratio 1:300.
Under these conditions injections of large samples,
about 0.5 ml of inert gas give negative peaks, ev.en for
nitrogen from the same tank as the carrier gas. Signals
from hydrocarbons remain pos itive ( see Fig. 2. 14). The
small differences in elution times between gases and
methane prevent the direct measurement of the adjusted
retention time of methane.
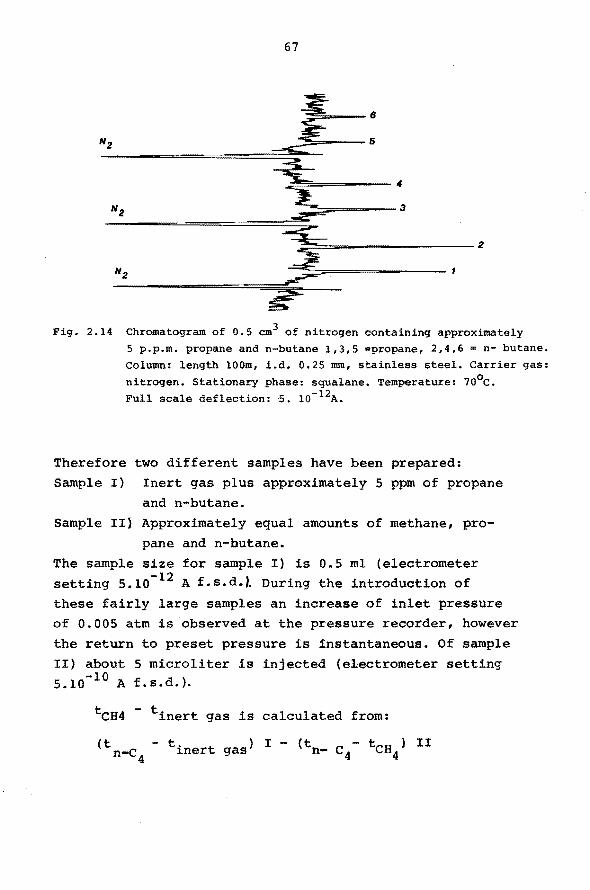
67
6
N2 5
4
N2 3
2
N2
Fig. 2.14 Chromatogram of 0.5 cm3 of nitrogen containing approximately 5 p.p.m. propane and n-butane 1,3,5 =propane, 2,4,6 = n- butane. Colwnn: length lOOm, i.d. 0.25 mm, stainless steel. Carrier gas:
nitrogen. Stationary phase: squalane. Temperature: 7o0 c. Full scale deflection: 5. io-12A.
Therefore two different samples have been prepared:
Sample I) Inert gas plus approximately 5 ppm of propane and n-butane.
Sample II) Approximately equal amounts of methane, pro-
pane and n-butane.
The sample size for sample I) is 0.5 ml (electrometer setting 5.lo-12 A f.s.d.L During the introduction of
these fairly large samples an increase of inlet pressure of 0.005 atm is observed at the pressure recorder, however
the return to preset pressure is instantaneous. Of sample
II) about 5 microliter is injected (e1ectrometer setting -10 5.10 A f.s.d.).
tCH4 - tinert gas is calculated from:
(t - t ) I - (t - tCH ) II n-c 4
inert gas n- c 4 4
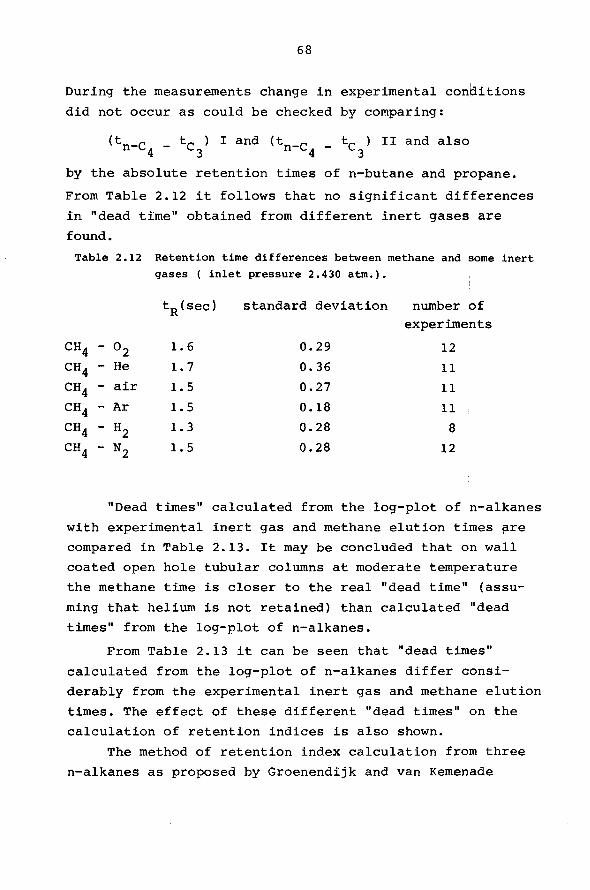
68
During the measurements change in experimental conditions
did not occur as could be checked by comparing:
(tn-e _ te ) I and (tn-e _ te ) II and also 4 3 4 3
by the absolute retention times of n-butane and propane.
From Table 2.12 it fellows that no significant differences
in "dead time" obtained from different inert gases are
found.
Table 2.12 Retention time differences between methane and some inert
gases ( inlet pressure 2.430 atm.).
tR(sec) standard deviation number of
experiments
eH4 - 02 1. 6 0.29 12
eH4 - He 1. 7 0.36 11
eH4 - air 1. 5 0.27 11
eH4 - Ar 1. 5 0.18 11
eH4 - H2 1. 3 0.28 8
eH4 - N2 1. 5 0.28 12
"Dead times" calculated from the log-plot of n-alkanes
with experimental inert gas and methane elution times pre
compared in Table 2.13. It may be concluded that on wal!
coated open hole tubular columns at moderate temperature
the methane time is closer to the real "dead time" (assu
ming that helium is not retained) than calculated "dead
times" from the log-plot of n-alkanes.
From Table 2.13 it can be seen that "dead times"
calculated from the log-plot of n-alkanes differ consi
derably from the experimental inert gas and methane elution
times. The effect of these different "dead times" on the
calculation of retention indices is also shown.
The method of retention index calculation from three
n-alkanes as proposed by Groenendijk and van Kemenade
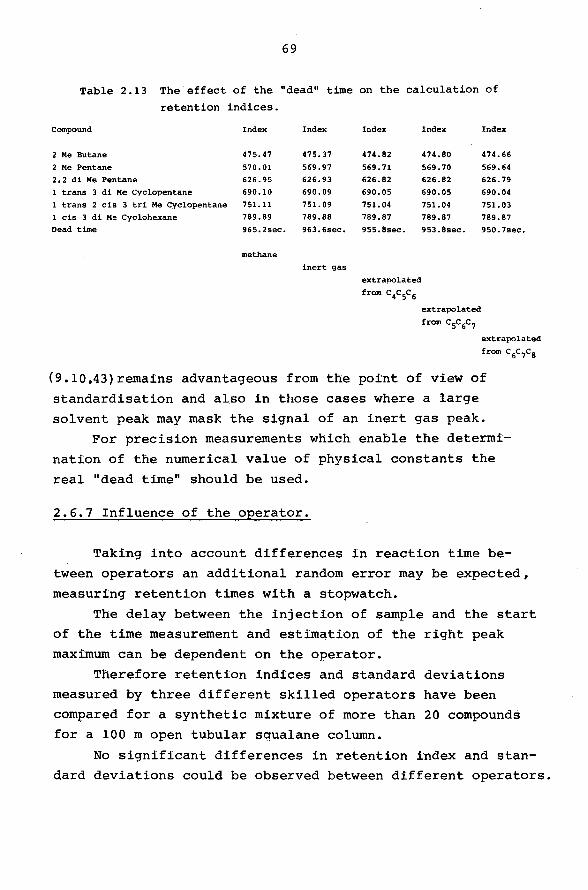
69
Table 2.13 The effect of the "dead" time on the calculation of
retention indices.
Compound Index Index
2 Me Butane 475.47 475.37
2 Me Pentane 570.01 569.97
2,2 di Me Pentane 626.95 626.93
l trans 3 di Me Cyclopentane 690.10 690.09
l trans 2 cis 3 tri Me Cyclopentane 751.11 751. 09
l cis 3 di Me Cyclohexane 789.89 789.88
Dead time 965.2sec. 963.6sec.
methane
inert gas
Index
474.82
569. 71
626.82
690.05
751. 04
789.87
955.8sec.
extrapolated
from c 4c 5c 6
Index
474.80
569.70
626.82
690.05
751. 04
789.87
953.8sec.
extrapolated
from c 5c 6c 7
Index
474.66
569.64
626.79
690.04
751.03
789.87
950.7sec.
extrapolated
from c 6c 7c 8
(9.I0.43)remains advantageous from the po.i:nt of view of
standardisation and also in these cases where a large
solvent peak may mask the signal of an inert gas peak.
For precision measurements which enable the determi
nation of the numerical value of physical constants the
real "dead time" should be used.
2.6.7 Influence of the operator.
Taking into account diff erences in reaction time be
tween operators an additional random error may be expected,
measuring retention times with a stopwatch.
The delay between the injection of sample and the start
of the time measurement and estimation of the right peak
maximum can be dependent on the operator.
Therefore retention indices and standard deviations
measured by three different skilled operators have been
compared for a synthetic mixture of more than 20 compounds
for a 100 m open tubular squalane column.
No significant differences in retention index and stan
dard deviations could be observed between different operators.
70
2.7 REFERENCES.
1. Klein P.D. and Tyler S.A. Anal.Chem., 37, (1965), 1280.
2. Cramers C.A., Thesis, 1967, Eindhoven, University of
Technology.
3. Tourres D.A., J. Chromatog. 30, (1967), 357.
4. Goedert M. and Guiochon G., Anal.Chem., 42, (1970), 962.
5. Oberholtzer J.E. and Rogers D.B., Anal.Chem., 41, (1969},
1234.
6. Wicarová o., Novak J. and Jának J,J.Chromatog. 51, (1970),
3.
7. Dondi F. Betti A., and Bighi c.,J. Chromatog. 60 (1971),
l.
8. Swingle R.S., and Rogers L.B., Anal.Chem. 43, (1971),
811.
9. Groenendijk J.H., and v. Kemenade A.H.C. Chromatographia
1, (19681, 472.
10. v. Kemenade A.H.C. and Groenendijk J.H., ibid 2, (1969),
148.
ll. v. Kemenade A.H.C. and Groenendijk ,J.H. ,ibid 2, (1969),
316.
12. Walraven J .J., Thesis,. 1968, Eindhoven, University of
Technology.
13. Cramers C.A., Rijks J.A., Pacáková v. and de Andrade I.R.,
J. Chromatog. 51, (197.0), 13.
14. Guiochon G., "Chromatographic Reviews", M. Lederer, ed.,
Vol. 8, Elsevier Amsterdam1p.1.
15. Desty D.H., Goldup A. Luckhurst G.R. and Swanton W.T.,
"Gaschromatography 1962", M. v. swaay ed., Butte:rworths,
London, 1962;667.
16. Everett D.H., Trans Farad.Soc. 61, (1965), 1637.
17. Cruikshank A.J.B., Gainey B.W. and Young C.L.
"Gaschromatography 1968", C.L.A. Harbourn 1 ed, Institute
of Petroleum Londen, 1968.
71
18. Wijtvliet J.J.M., Thesis, Eindhoven, University of
Technology, 1972.
19. Me. Reinolds w.o., Gaschromatographic Retention Data,
Presten, Evanston, illinois, 1966.
20. Applied Science Laboratories, Ine. Catal. No.Il, 1967.
21. A.S.T.M. Special Technical Publication No DS 25 A.
22. Sth International Symposium on Separation Methods,
Ed. E. Kováts, Swiss Chemist Assoc!ation, 1969, p.9.
23. Huber J.F.K. and Keulemans A.I.M."z. Anal.Chem.
205, (1964)' 263.
24. Young C.L., Chrom.Rev. 10, (1968), 129.
25. Cruikshank A.J.B. Windso:tl M.L. and Young C.L",
Proc.Roy.Soc. (London), A295, (1966), 259.
26. Cruikshank A.J.B.,Trans Farad Soc. 64, (1968}, 337.
27. Urone P.and Parcher J.F.,Anal.Chem. 38, (1966), 270.
28. Martin R.L. anal.Chem. 33, (1961}, 347.
29. Martin R.L. !bid, 35, (1963}, 116.
30. Pecsok R.L., de Yllana A. and Abdul-Kar!m A., Anal. Chem., 36, (1964}, 452.
31. Martire D.E., Pecsok R.L. and Purnell J.H., Nature 203 t (1964) , 203.
32. Martire D.E., Pecsok R.L. and Purnell J.H.,Trans.
Farad.Sec. 61, (1965), 2496.
33. Pecsok R.L. and Gump B.H., Journ.of Phys.Chem.
71, (1967), 2202.
34. Martire D.E.,,,Anal.Chem. 38, ( 1966), 244.
35. Berezkin V.G. et al.~Dokl.Acad.Nauk. SSSR., 180,
(1968), 1135.
36. Condor J.R., Locke O.C. and Purnell J.H.,_,Journ.of
Phys.Chem. 73, (1969), 700.
37. Condor J.R., J.Chromatog. 39., (1969}, 273.
38. Private communication Pacakova v., Charles University Prague.
39. Martire D.E. and Pollara L.Z.,,J. Chem. and Eng. Data
10, (1965), 40.
72
40. Kaiser R.,Chromatographia 2 (1969), 215.
41. Cramers C.A., Luyten J.A. and Rijks J.A.,
Chromatographia 3, (1970), 441.
42. Versino B.,Chromatographia 3 (1970), 231.
43. Groenendijk H.,Thesis, Eindhoven,University of
Technology.
73
CHAPTER III
PERFORMANCE AND PREPARATION
OF HIGH RESOLUTION COLUMNS
3.1 INTRODUCTION
For the characterization of a substance by purely
gaschromatographic means, the separation power of the column, is at least as important as the factors
discussed in Chapter 2.
The column performance sets limits to the separation
attainable and determines the time of analysis. Therefore
the use of high resolutions columns may become necessary,
especially for complex mixtures (section 2.1). In high resolution gaschromatography the following
basic types of columns are in use:
open hole tubular columns, Golay 1957 (l) porous-layer open tubular columns (2)
packed capillary columns, introduced by
Halasz and Heine (3,4). Theoretically, open hole tubular columns give the
best separations. They combine high plate numbers with
high permeability and a high production of plates per
unit time. In practice however diff iculties with injection
technique, sample size and in the choiee of stationary phases are encountered. Stream splitters are unsuitable
for high boiling compounds, on account of the desirable
fast injection. The quantitative results are unsatisfactory for
samples with a wide boiling range. Also, the loss of
sample associated with stream splitters is unacceptable in a number of cases (e.g. trace analysis). Direct injec
tion is still in the development stage (5-7).
74
Fortunately the above considerations mostly do
not àpply to the work dealt with in this thesis, which
confines itself to hydrocarbons below c 9•
Reproducible coating of openhole tubular col\ilillns,
especially for glass columns, remains difficult (7-10).
The formation of a film of sufficient homogeneity on the wall is the critica! step.
To find out if there is an optima! column type
for a particular separation problem, the performance
of high resolution columns will be compared in the
first part of this chapter.
"Micropacked columns", prepared according toa
new technique, compare favourable in sorne cases with
the column types mentioned before. The preparation of "micropacked columns" - which
combine to a large extent the advantages of packed and
capillary columns - is discussed in the second part of this chapter.
The preparation of open hole-tubular columns, with homogeneous liquid layers, for the separation of
hydrocarbons, is also disqussed in the last part.
3.2 PERFORMANCE PARAMETERS.
To compare the performance of different column types, a great number of characteristic parameters may
be used. In an attempt to clarify the confusion which
still exists in comparing the performance of columns of
different design, a survey of the most important column
characteristics will be given below.
As a first approximation according to chromatogra
phic theory, three main characteristics of column per
formance may be distinguished: a). efficiency b). resolution c). speed of
resolution.
75
a). Efficiency.
The efficiency may be expressed as the number of theoretical plates n, which can be derived from
the chromatogram by the equation:
tR 2 n = ( - )
C1 p ( 3. 1)
The standard deviation crp (in time units) is
equal to half the peak width at 0.607 of the height of
the Gaussian peak.
The theoretica! plate number i:s related to column
length by the heiglit equivalent to a theoreti:cal plate:
L H = n
(3.2)
H is dependent on a number of experimental parameters
and is a function of the carriergas velocity (u}.
At a certain flowrate H is minimal, which means the
plate number n is optimal.
b). Resolution.
The resolution (R) expresses the degree of separa
tion of two components, leaving the column shortly
after each other.
R = (3.3)
Using the relation tR = tm(l+k) and equation 3.1 it
follows:
R = (r-1) k k+l In (3.4)
r being the ratio of the partition coefficients.
76
With this equation, the number of plates required for the
separation of two components with a relative retention r,
can be calculated. The separation is almost complete for
R = 6 and just acceptable for R = 4.
The effective plate number (N), introduced by Desty,
is obtained from the chromatogram by the equation:
N (tR-tm)
02 p
2
(3.5)
This is a goed parameter describing the resolving
power of the column, because it is proportional to the
extent by which two peak maxima will be separated.
This may be simply derived from e.q. (3.4), using
the relation:
k 2 N ~ n ( k+l ) (3.6)
This relation simply fellows from equation 3.1, 3.5
and the definition of retention time.
Substituting (3.6) in (3.4) it fellows:
R =(r-1)/N (3.7)
The third characteristic may be defined as the rate
of production of effective plates N/t. It takes into
account the often neglected time factor and allows the
overall performance of columns to be compared.
In practice factors like permeability and pressure
drop, detector sensitivity, velocity of sample introduc
tion limit the efficiency, resolution and speed of analysis
attainable.
77
3. 3 PRACTICAL LIMITATIONS OF COLUMN PERFORMANCE.
Permeability and pressure drop.
The permeability is a very important property of
a gaschromatographic column, because of its direct and
indirect influence on a number of separation parameters.
It sets a practical maximum for the column length, i.e.
the maximum separation power of a column type and plays
a major role in the final value of the retention time.
Unfortunately it is not mentioned very often. Experimentally the permeability of the column may be ob
tained from a plot of the column outlet flow-rate (u0
)
versus the corresponding values of P2-1. P is the ra-
tio of the column in- and outlet pressure.
This relation may be derived from the relation
between the gas velocity at any point in the column u(x) and the pressure gradient (dp/dx):
K u(x) = n
(3.8)
This is the Darcy equation, which is valid at
low flow velocities (less than 100 cm/sec. for argon
and 300 cm/sec. for hydrogen), normally encountered in linear gas chromatography (11).
Integrating equation 3.8, it follows:
="Po (P2-l)
2nL ( 3. 9)
Theoretically the permeability of an open-hole
tubular column only depends on its diameter. In prac
tice the permeability is somewhat less (10-30%) than
the theoretica! value r0
2/8 ( 12), which is probably be
cause of the wall roughness or fluctuations in the
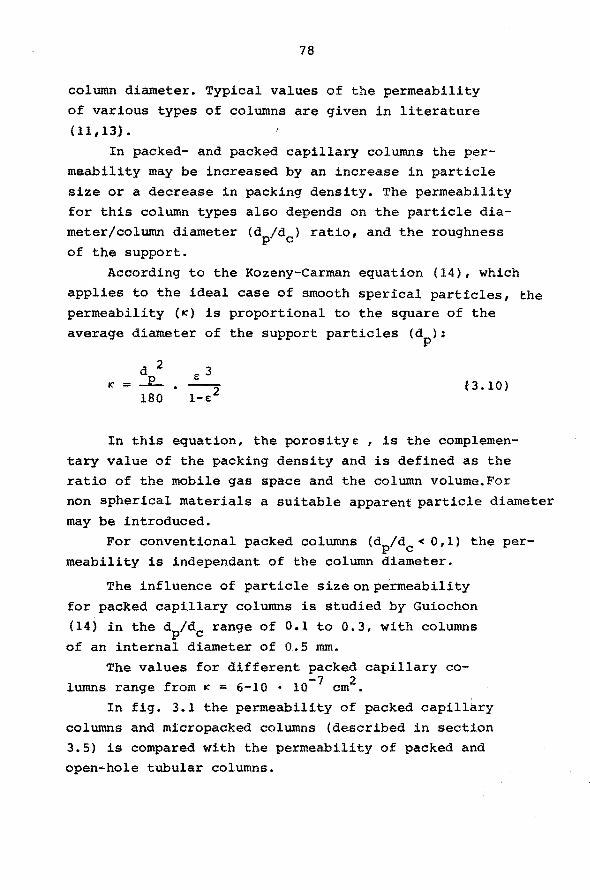
78
column diameter. Typical values of the permeability
of various types of columns are given in literature (11,13).
In packed- and packed capillary columns the per
meabili ty may be increased by an increase in particle
size or a decrease in packing density. The permeability
for this column types also depends on the particle dia
meter /column diameter (dp/dc) ratio, and the roughness
of the support.
According to the Kozeny-Carman equation (14), which
applies to the ideal case of smooth sperical particles, the permeability (K) is proportional to the square of the
average diameter of the support particles (dp):
d 2 e 3 K = _E._ • --2
180 1-E: (3.10)
In this equation, the porositye , is the complemen
tary value of the packing density and is defined a.s the
ratio of the mobile gas space and the column volume.For
non spherical materials a suitable apparent particle diameter
may be introduced.
For conventional packed columns (dp/dc < 0, 1) the permeability is independant of the column diameter.
The influence of particle size on permeability
for packed capillary columns is studied by Guiochon
(14) in the dp/dc range of 0.1 to 0.3, with columns
of an internal diameter of 0.5 mm.
The values for different packed capillary columns range from K = 6-10 • 10-7 cm2 •
In fig. 3.1 the permeability of packed capillary
columns and micropacked columns (described in section
3.5) is compared with the permeability of packed and
open-hole tubular columns.
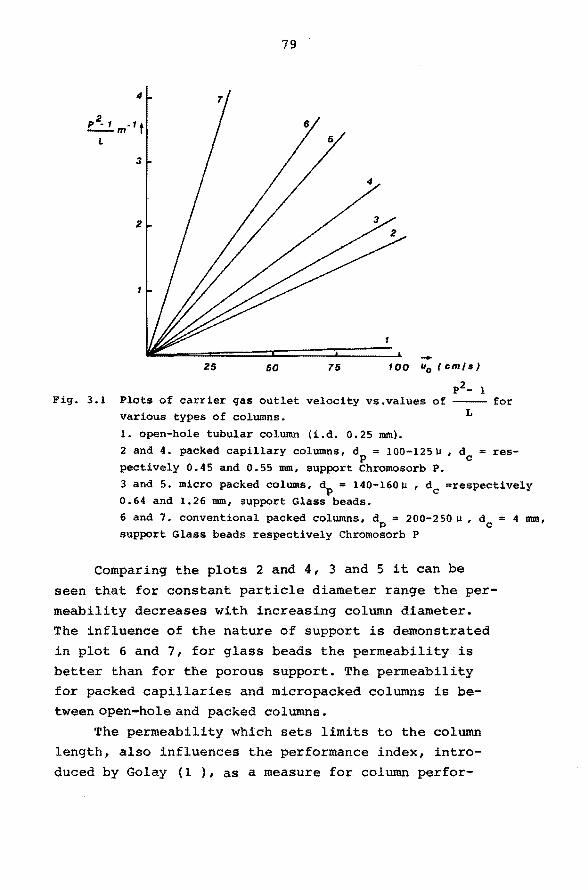
Fig. 3.1
79
4
3
2
-25 50 75 too u0 ( cm/11}
p2- 1 Plots of carrier gas outlet velocity vs.values of ~~ for various types of columns. L
1. open-hole tubular column (i.d. 0.25 mm). 2 and 4. packed capillary columns, d = 100-125µ, d = res-
p c pectively 0.45 and 0.55 mm, support Chromosorb P. 3 and 5, micro packed colums, d = 140-160µ , d =respectively p c 0.64 and 1.26 mm, support Glass beads. 6 and 7. conventional packed columns, d = 200-250 µ , d = 4 mm,
p c support Glass beads respectively Chromosorb P
Comparing the plots 2 and 4, 3 and 5 it can be
seen that for constant particle diameter range the per
meabili ty decreases with increasing column diameter. The influence of the nature of support is demonstrated
in plot 6 and 7, for glass beads the permeability is
better than for the poreus support. The permeability for packed capillaries and micropacked columns is be
tween open-hole and packed columns.
The permeability which sets limits to the column length, also influences the performance index, intro
duced by Golay (1 ), as a measure for column perfor-
80
mance. At optimum carriergas velocity (uopt) the per
formance index is given by equation:
4 t 256.crp • m PI = 0. 12 4 • tR. p q.11)
tR (tR-15/lGtm)
where O"p = peak width at 0.607 of the total height
tR = retention time
tm = retention time of a component which is
not retarded.
p = pressure drop over the column.
The performance index has the dimensions of visco
si ty g/crnsec (pressure in dynes/cm2 ). The performance
index has a minimum value of 0.1 when the carriergas is
helium. Values greater than this are usually obtained
although PI's approaching 0.2 have been reported for
open-hole tubular columns. Packed columns range from
20-1000 poises.
The performance index shows a large dependence on
the product tR. p, which indicates the price to be paid
in waiting time and pressure drop, to obtain maximum per
formance of the column.
Rewriting eqn. 3.11 in terms of uopt yields:
PI·= 31. 2 H2
min l+k .....E k. L.
(3.12)
The latter equation shows the importance of pressure
drop/unit length.
Speed of sample introduation.
Up till now one important aspect has been left out
of consideration, the capacity of the column, which de
termines the most practical parameter, the sample size.
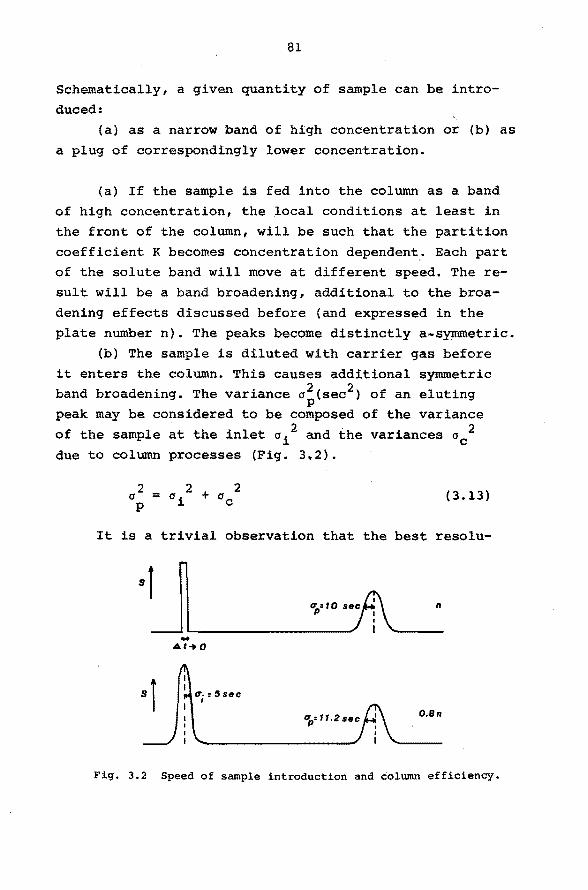
81
Schematically, a given quantity of sample can be intro
duced:
(a) as a narrow band of high concentration or (b) as
a plug of correspondingly lower concentration.
(a) If the sample is fed into the column as a band
of high concentration, the .local conditions at least in
the front of the column, will be such that the partition
coeff icient K becomes concentration dependent.- Each part
of the solute band will move at different speed. The re
sul t will be a band broadening, additional to the broa
dening effects discussed before (and expressed in the
plate number n). The peaks become distinctly a-symmetric.
(b) The sample is diluted with carrier gas before
it enters the column. This causes additional symmetrie
band broadening. The variance a~(sec2 ) of an eluting
peak may be considered to be composed of the variance . 2 . 2
of the sample at the inlet a1 and the variances ac due to column processes (Fig. 3.2).
2 a p
(3.13)
It is a trivia! observation that the best resolu-
ap•IO sec n
" A.t• 0
sî tT.:5sec I
ap:11.2sec O.Bn
Fig. 3.2 Speed of sample introduction and column efficiency.
82
tion will be obtained at cr12 = 0 (infinitely narrow'
sample band) I\nax = ~tR/crc. For finite sample volumes
R will be smaller than Rmax· However, from the eqn.above
and the definition of resolution it fellows that for
cri= 0.5 ac the resulting decrease in resolution will
be only 10%. From this the permissible input width of
the input peak a1 can be calculated.
From the definition of plate number, n, and the
equation for retention time tR = tm( l+k), where tm =
L/u0it can be derived that:
(3.14)
Time consta.nts.
According to Schmauch (1) the time constant of
the detection system must be less than one fifth of
standard deviation cr if the peak is to be truly rep
corded. Only for very fast analysis this will be-
come a limiting factor.
Detector sensitivity.
The signal of ionization detectors, commonly used,
are proportional to the mass flow rates. This means the
minimum amount of sample that can be detected is strongly
dependent on the speed of passage of a peak through the
detector and therefore on column dimensions. Columns of
small diameter and accordingly higher optima! gas-velocity
enable the detection of smaller quantities.
Assuming an ionisation efficiency, A, of 0.25
coulomb/g at c and a noise level of io-13A for a
flame ionisation detector (as reported in literature)
it can be calculated that the signa! h ( ~ Signal
to noise ratio), to be obtained from a column, is given by:
h 0
cr / 2rr c
= M. ( %C) • ).
12. /21T
83
( l+k) I LH (3.15)
M = weight of injected sample; h and o respectively
are the height and area of a gaussian peak; u0
= the
carrier gas velocity at the column outlet.
3.4 COMPARISON OF COLUMN TYPES.
Considering above mentioned factors, it appears that open-hole tubular columns are theoretically the
most favourable ones and that the packed capillaries
according to Halasz and the micro packed columns pre
pared in our laboratory take an intermediate position.
The micro packed columns will be discussed in section
3.5. Besides these theoretical considerations there are,
however still many practical factors which anyhow do
turn the scales to the packed columns, which in practice
are used in 90% of the cases. The open-hole tubular co
lumns are used in most other cases, the packed capillaries
according to Halasz are, for the major part still in the
developing stage. With packed columns any support material can be
used, these supports can be coated or impregnated previ
ously with stationary liquid or used as such {e.g. porapak,
mol.sieves). Packing of the columns as well as coating can
be done in a reproducible way. Column overloading does not likely occur and therefore sample introduction off ers no
serious problems. The choice of open hole tubular (Golay) columns, how
ever is fairly restricted, especially glass columns, for the analysis of sensitive biologica! materials,are hardly commer
cially available.The coating of the column with a uniform layer of stationary phase is difficult to achieve.
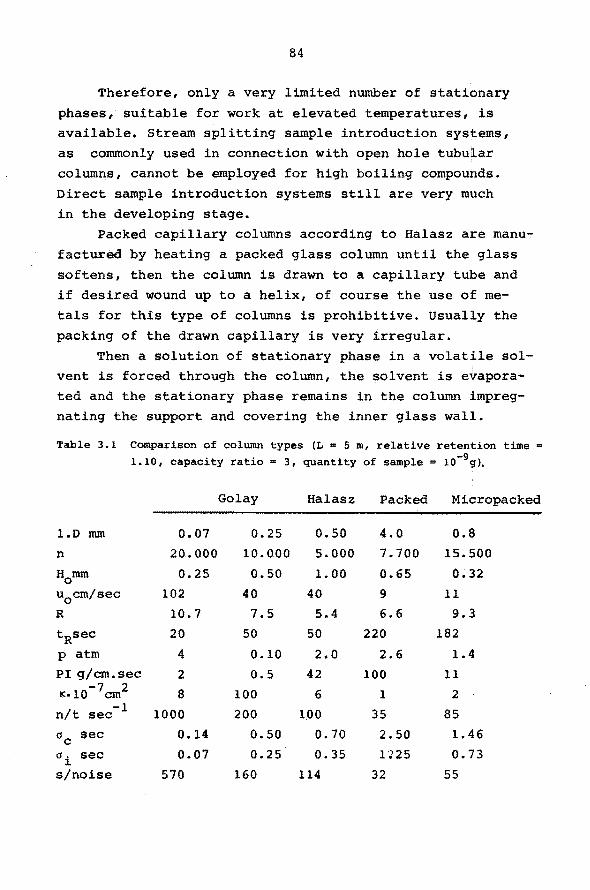
84
Therefore, only a very limited number of stationary
phases, suitable for work at elevated temperatures, i.s
available. Stream splitting sample introduction systems,
as commonly used in connection with open hole tubu~ar
columns, cannot be employed for high boiling compounds.
Direct sample introduction systems still are very much
in the developing stage.
Packed capillary columns according to Halasz are manu
factured by heating a packed glass column until the glass
softens, then the column is drawn to a capillary tube and
if desired wound up to a helix, of course the use of me
tals for this type of columns is prohibitive. Usually the
packing of the drawn capillary is very irregular.
Then a solution of stationary phase in a volatile sol
vent is forced through the column, the solvent is evapora
ted and the stationary phase remains in the column impreg
nating the support and covering the inner glass wall.
Table 3.1 Comparison of column types (L = 5 m, relative retention time = 1.10, capacity ratio= 3, quantity of sample= l0-9g).
1.D mm
n
H0
mm
u0
cm/sec R
tRsec p atm PI g/cm.sec K·l0- 7 cm2
n/t sec-l
ac sec
ai sec s/noise
0.07
20.000
0.25
102
10.7
20
4
2
8
1000
0.14
0.07
570
Go lay
0.25
10.000
0.50
40
7.5
50
0.10
0.5
100
200
0.50
0.25
160
Halasz
0.50
s.ooo 1.00
40
5.4
50
2.0
42
6
1.00
0.70
0.35
114
Packed
4.0
7.700
0.65
9
6.6
220
2.6 100
1
35
2.50
l'.?25
32
Micropacked
0.8
15.500
0.32
11
9.3
182
1.4
11
2
85
1.46
0.73
55
85
The amount of stationary phase as well as the film forma
tion on the inner wall of the capillary tube cannot be
controlled sufficiently well. This makes the choice of
available liquid phases smaller as in the case of openhole tubular columns. Another drawback is that the support
material must be resistant to the heating, necessary to
soften the glass. Therefore the choice_of support material
is restricted e.g. silanized supports or glass beads can
not be used. The permissible sample size is somewhat lar
ger than with open-hole tubular columns, therefore sample
introduction gives less difficulties.
In Table 3.1 literature data together with results
obtained in our laboratory on a new micro type of packed
columns are summarized. For the sake of easier comparison all column lengths are chosen to be 5 m; H2 is the carrier
gas and squalane the stationary liquid phase. For the cal
culation of resolution a solute pair with relative reten
tion 1.10 is selected; the capacity ratio of the first
,eluting component is chosen to be 3.
The signal to noise ratio is calculated for a flame
ionization detector assuming A = 0.25 Coulomb/g. at.c and
a noise level of the detector system of l0-13A. The injec
ted amount of sample is fixed on l0-9g.C.
In Table 3.2 micropacked columns, packed capillary
columns conventional packed and open-hole tubular columns
all prepared in our laboratory are compared. The packed
columns are prepared following the same packing procedure
(see section 3.5). For the open-hole tubular glass column,
prepared according to a coating procedure of Tesarik
(15) , a direct sample introduction system described by Kuppens ( 6) is used.
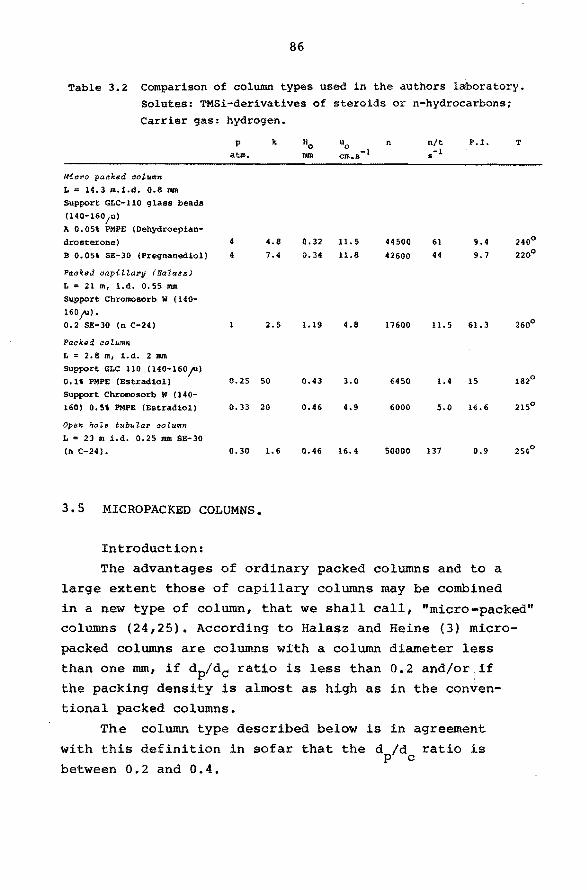
86
Table 3.2 Comparison of column types used in the authors laboratory. Solutes: TMSi-derivatives of steroids or n-hydrocarbons;
Carrier gas: hydrogen.
Miaro paaked aolumn L = 14.3 m.i.d. 0.8 111111
Support GLC-110 9lass beads
(140-160;u) A 0.05% PMPE (Oehydroepian
drosterone) B 0.05% SE-30 (Pregnanediol)
Paaked aapillary (Halass)
L • 21 in, i.d. 0.55 mm Support Chromosorb W (140-
160 ;u>. 0.2 SE-30 (n C-24)
Paaked "" lumn L = 2.8 m, i.d. 2 mm Support GLC 110 (140-l60jll) O.lt PMPE (Estradiol)
Support Chromosorb W (140-160) 0.5\ PMPE (Estradiol)
Open hole tubular aolumn
L = 23 in i.d. 0.25 111111 SE-30 (n C-24).
p
atm.
4
4
k
4.8 7.4
2.5
0.25 50
0.33 20
0.30 1.6
3. 5 MICROPACKED COLUMNS.
Introduction:
o.n 11.5
o. 34 11.8
1.19 4.8
0.43 3.0
0.46 4.9
0.46 16.4
44500
42600
17600
6450
6000
61 44
P.I.
9.4 9.7
11.5 61.3
1.4 15
s.o 16.6
50000 137 0.9
The advantages of ordinary packed columns and to a
large extent those of capillary columns may be combined
T
in a new type of column, that we shall call, "micro-packed" columns (24,25). According to Halasz and Heine (3) micro
packed columns are columns with a column diameter less
than one mm, if dp/dc rat:l.o is less than 0.2 and/or if the packing density is almost as high as in the conven
tional packed columns.
The column type described below is in agreement
with this definition in sofar that the d /d ratio is p c
between 0.2 and 0.4.
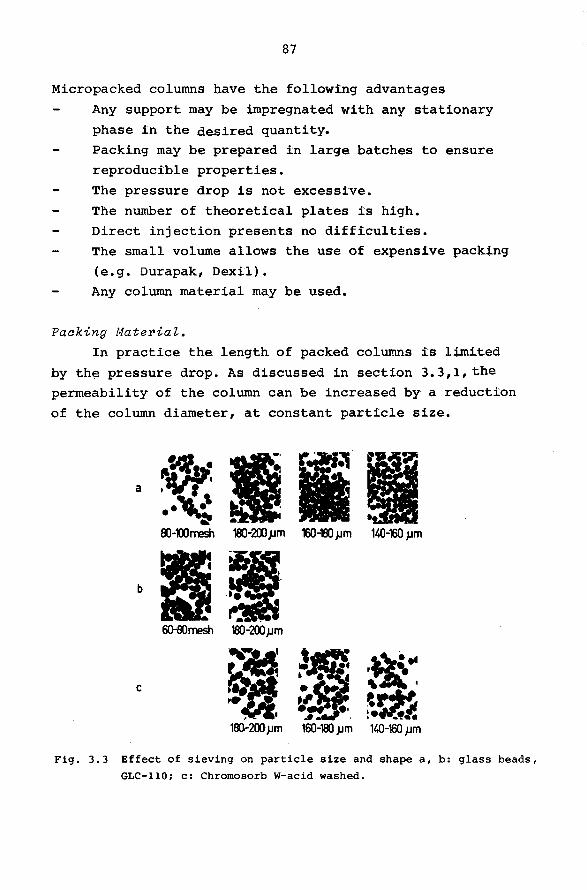
87
Micropacked columns have the following advantages
Any support may be irnpregnated with any stationary
phase in the desired quantity.
Packing may be prepared in large batches to ensure reproducible properties.
The pressure drop is not excessive.
The nurnber of theoretical plates is high.
Direct injection presents no difficulties.
The small volume allows the use óf expensive packing
(e.g. Durapak, Dexil).
Any column material may be used.
Paaking Materiat.
In practice the length of packed columns is lirnited
by the pressure drop. As discussed in section 3.3,1, the permeability of the column can be increased by a reduction
of the column diameter, at constant particle size.
~ 1 1 1 . a
·~ •• • '
" oo-mrresh 180-200pm 160-180}Jm 140-160 JJm
b 1 1 ... 60-BOmesh 180-200JJm
~«S !I ~~ • • • • , " c
~- ·. . ... ' ' _, ~~ • :.Jl •. ... ' ~· -~·· 100-200}Jm 160-180 JJm 140-160 JJm
Fig. 3. 3 Effect of sieving on particle size and shape a, b: glass beads,
GLC-110; c: Chromosorb W-acid washed.
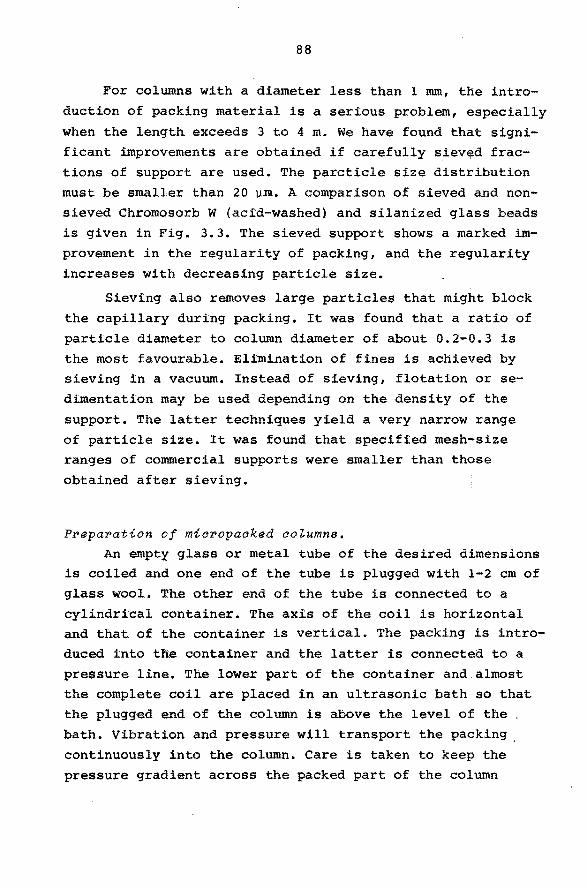
88
For columns with a diameter less than 1 mm, the intro
duction of packing material is a serieus problem, especially
when the length exceeds 3 to 4 m. We have found that signi
ficant improvements are obtained if carefully siev~d frac
tions of support are used. The parcticle size distribution
must be smaller than 20 µlill. A comparison of sieved and non
sieved Chromosorb W (acid-washed) and silanized glass beads
is given in Fig. 3.3. The sieved support shows a marked im
provement in the regularity of packing, and the regularity
increases with decreasing particle size.
Sieving also removes large particles that might block
the capillary during packing. It was found that a ratio of
particle diameter to column diameter of about 0.2-0.3 is
the most favourable. Elimination of fines is achieved by
sieving in a vacuum. Insteaà of sieving, flotation or se
dimentation may be used depending on the density of the
support. The latter techniques yield a very narrow range
of particle size. It was found that specified mesh-size ranges of commercial supports were smaller than those
obtained after sieving.
Preparation of miaropaaked aoiumna.
An empty glass or metal tube of the desired dimensions is coiled and one end of the tube is plugged with 1-2 cm of
glass wool. The other end of the tube is connected to a
cylindrical container. The axis of the coil is horizç::mtal and that of the container is vertical. The packing is intro
duced into the container and the latter is connected to a
pressure line. The lower part of the container and almost
the complete coil are placed in an ultrasonic bath so that the plugged end of the column is above the level of the _
bath. Vibration and pressure will transport the packing ,
continuously into the column. Care is taken to keep the
pressure gradient across the packed part of the column
89
about constant, to ensure a homogeneous packing density along
the column.
At the start of the procedure, the·increase in pressure
should be very g+adual so as not to.blow out the plug. The
final pressure depends on the material used but will be in the order of 0.4-2 atm per m of column length. The lower value applies to glass beads and the higher to Chromosorb.
With glass columns, the packing can be followed visually. In the case of metal columns, packing up to a constant weight
should be carried out. The time necessary for packing is
1-2 min perm of column length. Table 3.3 shows the reproducibility of packing density.
Table 3.3 Reproducibility of packing density.
Column I.D. Len9th Particle size of glass beads Packing Wei9ht of packin9 (-) (m) support ( pim) on support per m of colwnn
length
ss 1.0 6.0 140-160 PMPE 1.35 ss 1.0 6.0 140-160 PMPE 1.35 ss 1,0 6.0 140-160 PMPE 1.34 ss 1.0 6.0 140-160 PMPE 1,33 ss 1.0 6.0 160-180 PMPE 1.29 ss 1.0 6.0 160-180 PMPE l.29 Glass 0.8 14.6 140-160 PMPE 0.66 Glass 0.8 14.6 140-160 Sll-30 0.65 Glass 0.8 10.0 140-160 SE-30 0.65 Glass 0.6 26.0 140-160 PMPE 0.33 Glass 0,6 7.6 140-160 PMPE 0.33
AppaPatus.
A home-made gas chromatograph equipped with means
for direct sample introduction and a stream splitter
(Hamilton) was used in our measurements. Direct injection is illustrated in Fig. 3.4.
(9/m).
The inlet port was provided with a glass insert tube
of 11 cm length and 0.8 mm i.d.; One end of the insert for the connection to the column was wider and conically
shaped. The column was inserted about 2 mm into the cone.
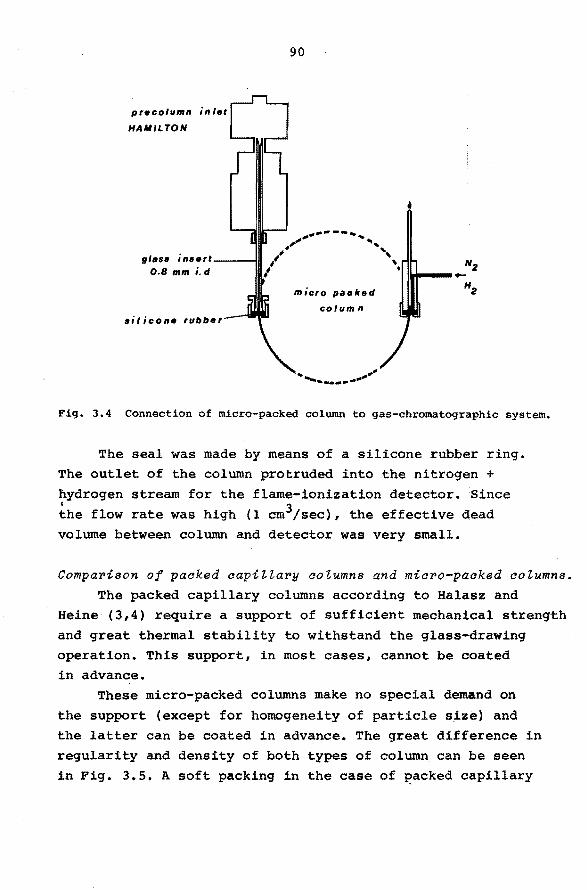
pre column in let
HAMILTON
•il icon• rubb•t
90
micro paoked
cotum n
' .,." , _______ _
•
Fig. 3.4 Connection of micro-packed column to gas-chromatographic system.
The seal was made by means of a silicone rubber ring. The outlet of the column protruded into the nitrogen + hydrogen stream for the flame-ionization detector. Since
the flow rate was high (1 cm3/sec), the effective dead volume between column and detector was very small.
CompaPison of packed capillary columns and micro-packed columns.
The packed capillary columns according to Halasz and Heine (3,4) require a support of sufficient mechanica! strenqth
and great thermal stability to withstand the glass-drawing operation. This support, in most cases, cannot be coated in advance.
These micro-packed columns make no special demand on
the support (except for homogeneity of particle size) and
the latter can be coated in advance. The great difference in regularity and density of both types of column can be seen
in Fig. 3.5. A soft packing in the case of ~acked capillary
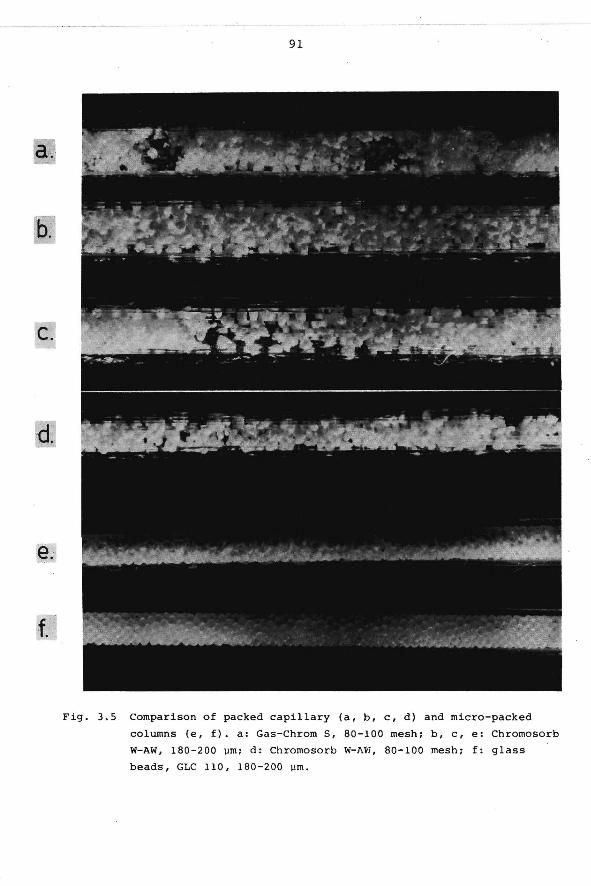
a..
ó.
C.
·{].
f.
91
Fig. 3.5 Comparison of packed capillary (a, b, c, d) and micro-packed
columns (e, f). a: Gas-Chrom S, 80-100 mesh; b, c, e: Chromosorb
W-AW, 180-200 µm; d: Chromosorb W-AW, 80-100 mesh; f: glass
beads, GLC 110, 180-200 µm.
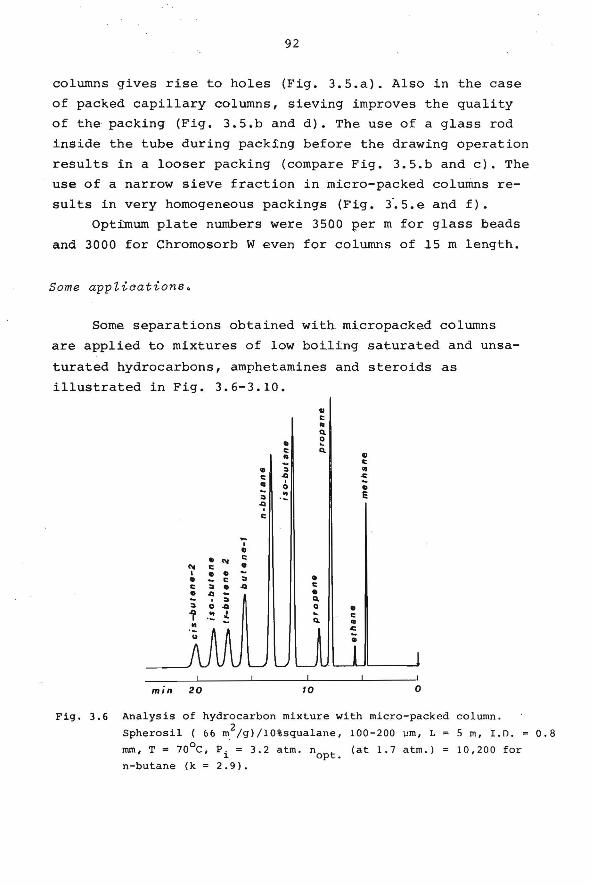
92
columns gives rise to holes (Fig. 3.5.a). Also in the case
of packed capillary columns, sieving improves the quality
of the packing (Fig. 3.5.b and d). The use of a glass rod
inside the tube during packing before the drawing operation
results in a looser packing (compare Fig. 3.5.b and c). The
use of a narrow sieve fraction in micro-packed columns re
sul ts in very homogeneous packings (Fig. 3-.5.e and f).
Optimum plate numbers were 3500 per m for glass beads
and 3000 for Chromosorb W even for columns of is rn length.
Some appliaations.
Some separations obtained witn micropacked columns
are applied to mixtures of low boiling saturated and unsa
turated hydrocarbons, amphetamines and steroids as
illustrated in Fig. 3.6-3.10.
u c • ~
• ~ c ~
• u ; c
• • c f ~ • 0 • - " e ~
~ c
-1 • • ~ c ~ c • 1 ! • -• c ~ • c ~ • 4 c • 4 - • ; ' ~ ~
0 4 0 • ~ " ! ~ c - ~ • " ~ -• 0
Fig. 3.6 Analysis of hydrocarbon mixture with micro-packed column. 2 Spherosil ( 66 m /g)/10%squalane, 100-200 µm, L 5 m, I.n. 0.8
mm, T = 70°C, Pi= 3.2 atm- nopt . (at 1.7 atm . } = 10 ,200 for n-butane (k = 2.9).
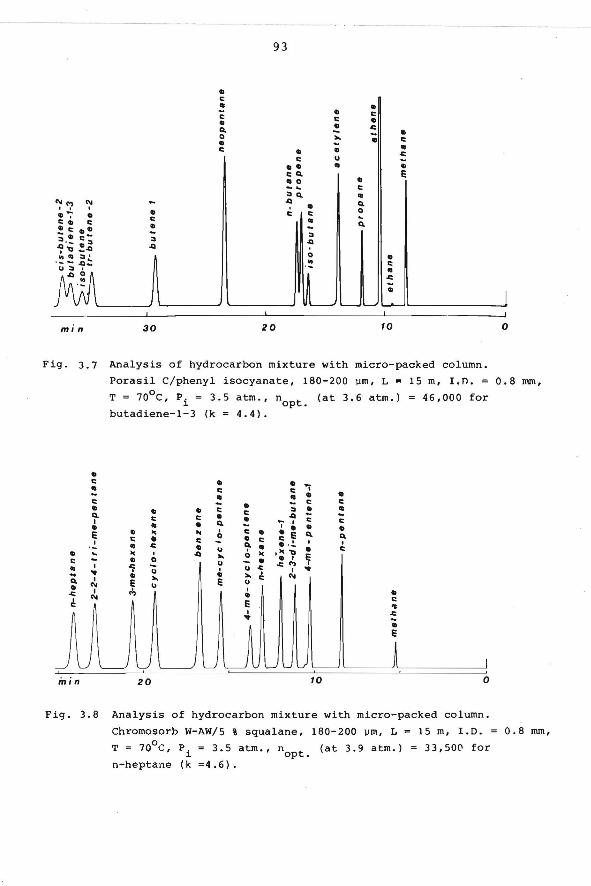
Fig. 3.7
• c:
" c: • Q. 1 • e 1
ID c:
" 1
" "lt Q. 1
• .... 1 .c: .... .;
;,,; n
93
ID c: " c: ID Q. 0 ID c: • c:
•• c: Q. •o -" ::. Q. .Q
ê • ID c: c: "' ID
::. ::. .Q
.Q
0
"
30 20
ID c: • ... ID
" "
ID c: ID .c: - ID
• c: " .c: ID
ID e
c:
"' Q. 0
" Q.
10
micro-packed column.
µm, L = 15 m, I. r>. =
Analysis of hydrocarbon mixture with
Porasil C/phenyl isocyanate, 180-200 0 T = 70 C, Pi= 3.5 atm., nopt. (at 3.6 atm.) = 46,000 for
butadiene-1-3 (k = 4.4) .
• • c: c: .,.
" " • • • c: c:
• • c: c: ::. ! " c: c: • • .Q c: Q. ... .. c: " • ' . • • • "' "
1 c: • • e Q. c: • 0 • Q. c: c: c: ' ' 1
" .c: Q. • ·-• " " • c: "' ' .Q ... 0 "' '"' 'Q e ID 0 • ID 1
" .c:.., 1 "i' ' " .c: 1 "lt ID " • ... . .... e ... e "
c:
" • cl, ID • c: e " 1 .c: "lt ID
e
20 0
0
0.8 mm,
Fig. 3.8 Analysis of hydrocarbon mixture with micro-packed column.
Chromosorb W-AW/5 % squalane, 180-200 µm, L = 15 m, I.O. = 0.8 mm,
T = 10°c, P.= 3.5 atm., n (at 3.9 atm.) = 33,500 for i opt.
n-heptane (k =4.6).
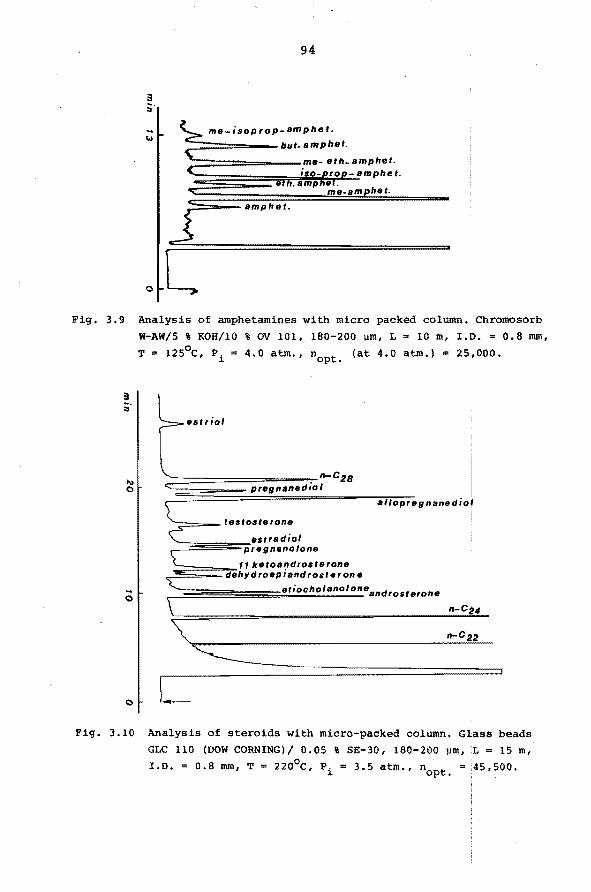
0
94
me-isop rop-amphe t.
:====---but- amphet.
amphet.
Fig. 3.9 Analysis of amphetamines with micro packed column. Chromosorb
W-AW/S % KOH/10 % OV 101, 180-200 µm, L = 10 m, I.D. = 0.8 mm,
'l' = 12S0 c, Pi = 4.0 atm., nopt. (at 4.0 atm.) = 25,000.
!\) 0
.... 0
estriol
::::::::============-~-.-n-C28 pregnanedio I
'""::==- testosterone
estradiol :::_:::::=!§§~=D'p re 9 na no I one
~~;;;;;;:::::-;;;e11 ketoandrosterone _ dehydroepiandrosterone
allopregnanediol
etiocholanoloneandrosterone
0 -
Fig. 3.10 Analysis of steroids with micro-packed column. Glass beads
GLC 110 (DOW CORNING)/ O.OS % SE-30, 180-200 µm, L = 15 m, I.o. = 0.8 mm, T = 220°c, Pi= 3.5 atm., nopt. = ,SOO.
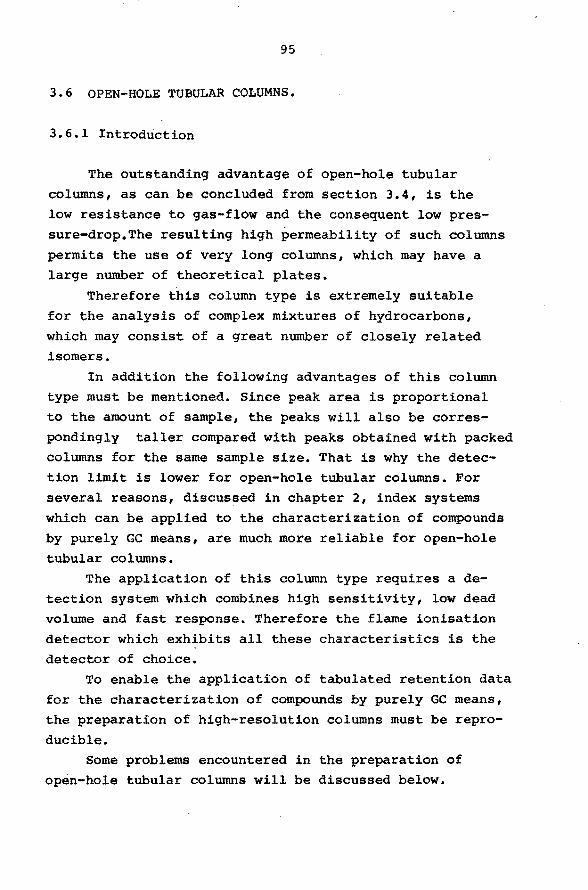
95
3.6 OPEN-HOLE TUBULAR COLUMNS.
3.6.1 Introduction
The outstanding advantage of open-hole tubular
columns, as can be concluded from section 3.4, is the
low resistance to gas-flow and the consequent low pres
sure-drop. The resulting high permeability of such columns
permits the use of very long columns, which may have a
large number of theoretica! plates.
Therefore this column type is extremely suitable
for the analysis of complex mixtures of hydrocarbons,
which may consist of a great number of closely related isomers.
In addition the following advantages of this column type must be mentioned. Since peak area is proportional
to the amount of sample, the peaks will also be corres
pondingly taller compared with peaks obtained with packed
columns for the same sample size. That is why the detection limit is lower for open-hole tubular columns. For
several reasons, discussed in chapter 2, index systems
which can be applied to the characterization of compounds
by purely GC means, are much more reliable for open-hole
tubular columns. The application of this column type requires a de
tection system which combines high sensitivity, low dead
volume and fast response. Therefore the flame ionisation
detector which exhibita all these characteristics is the
detector of choice. To enable the application of tabulated retention data
for the characterization of compounds by purely GC means,
the preparation of high-resolution columns must be repro
ducible. Some problems encountered in the preparation of
open-hole tubular columns will be discussed below.
96
A simple procedure is described which guarantees a
constant column quality for qualitive analysis of hydro
carbons.
3.6.2 Column efficiency and film thickness.
Column efficiency is usually expressed as the number of theoretica! plates or the height equivalent to a theo
retical plate, H,(16). According to Giddings et al (26}
the column efficiency of open-hole tubular columns can be
expressed by:
H = c!! + c v) v g fl + c1 vf2 ( 3. 16)
B, cg and cl are given by:
B = 2 D g (3.17)
Cg = 1+6k+llk2 r2
24(l+k) 2 Dg (3.18)
Cl= k3 r2
6 (l+k) 2 ;ç 1
(3.19)
In these equations,
f 1 , f 2 = correction factors for non ideal gas phase
v linear velocity of a not retarded component. r radius of the column.
09 = diffusion coefficient of the solute in the gas phase. Dl = diffusion coefficient of the solute in the liquid phase. k = capacity ratio.
Substituting the relation,
K = ~ k = Bk (3. 20 )
97
in eqn. 3.19, yields:
k = (l+k) 2 (3.21)
where
Vg = volume of the gas phase.
v 1 = volume of the stationary phase.
The relation between S and the film thickness (df) is
given by:
tl ~ (r-df)2 a! r ( 3.22) = 2 2 vl r -(r-df) 2df
for r >> df.
Substituting eqn.3.22 in 3.21 it follows:
d 2 f 2k ( 3.23)
since
K r k
Since c1 and Cg decrease with decreasing film
thickness the plate number will increase with decrea
sing film thickness.
A second reason to strive after a thin film is the
analysis time, which increases with increasing film
thickness.
There are also some arguments, however, for the
application of a thick film. Firstly, the capacity rat1o
is directly proportional to film thickness, so that the
number of theoretica! plates required for complete sepa-
98
ration (nh) of two peaks, is increasing with decreasing
capacity ratio (k), as can be seen from the equation:
R2 k+l 2 --..... 2·< ) (r-1) k
( 3. 25)
Where R = resolution required for complete separation.
r = relative retention of the compotlnds to be
separated.
At the same time the sample capacity will decrease
with decreasing film thickness, which may result in over
loading of the column.
The third argument concerns the adsorption effect of the column wall.
At low liquid loadings the column wall will be not
sufficiently desactivated and interact with the solute
which will result in concentration dependent retention
times, as discussed in section 2.6.5.
Weighing these factors one against another it can
be concluded that a minimum film thickness is requfred,
so that the adsorption effect of the column wall can be
neglected. For an optima! analysis time in addition the
liquid film should also be homogeneous.
Generally it can be said from personal experience that with a mean film thickness between 0.5 and 1.5 µ, the
best results are obtained in practice.
3.6.3.Preparation of Open-hole Tubular Columns.
Column cteaning. Prior to coating metal column tubings must be cleaned
in order to eliminate the material that may have been left
inside as a result of the manufacturing process. Open-hole
tubular columns as received appear to have capacity ratios
for n-hexane at 25°c of more than 1.5.
99
Several cleaning procedures reported in literature (17-
19) were tried during this investigation. The metal capilla
ries are subjected to a number of cleaning steps, forcing
subsequently different organic solvents through the tubing.
After washing the tube is dried in a stream of inert gas
prior to coating.
In order to control the cleaning procedure the column
is subjected to an intermediate test. This test indicates
whether the column allows a successful coatinq or the pre-.
treatment must be repeated.
At 2s0 c a mixture of methane and n-hexane and benzene
vapours, is injected to the column. As discussed in section
2.6.5., n-hexane and benzene have different adsorption pro
perties; benzene being the most strongly adsorped hydrocarbon
in the studied range, c4-c9 •
Benzene and n-hexane appeared to be separated in all
cases. It was observed that the more intensive the cleaning
the more asymmetrie the benzene peaks. For thouroughly
cleaned columns even the n-hexane peaks were asymmetrical.
Columns with a very asymmetrical benzene peak give
rise to serieus coating problems if squalane was used as
the stationary phase. The reproducibility of retention in
dices for unsaturated hydrocarbons was rather poor (l-3 index
units) and the life time of the columns was short (about 3
weeks). This problem could not be solved by recoating the
column several times.
Such columns, which are unemployable for coating
with squalane, appeared to be particularly useful for coating with polar stationary phases, e.g. dimethyl
sulfolane and acetyltributylcitrate. The reproducibili
ty of retention indices for all types of hydrocarbons
for different columns coated with acetyltributylcitrate,
at so0 and 7o0 c, was within 0.1 index unit. In all cases
the first coating was successful. The quality of the
columns was excellent ( n > 3000, life time> 1 year, the
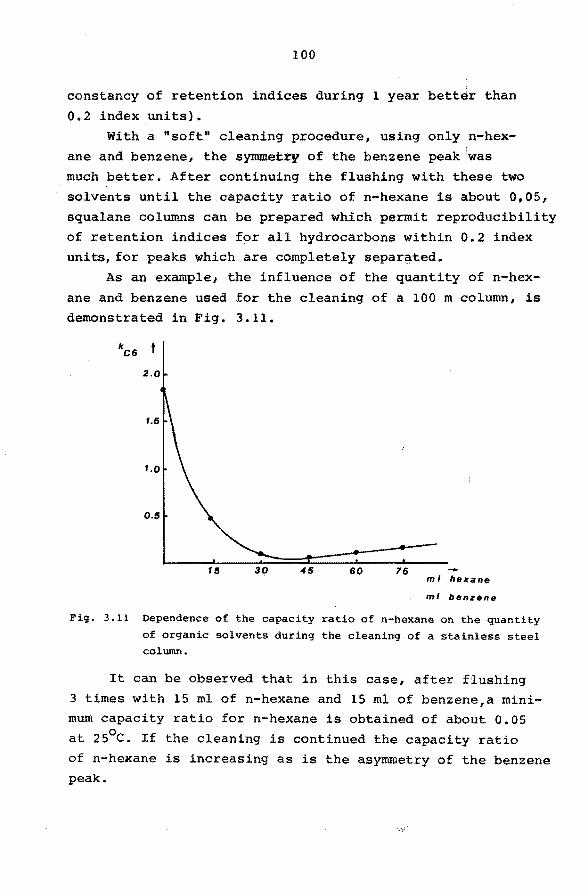
100
constancy of retention indices during l year bettJr than
0.2 index units).
With a "soft" cleaning procedure, using only n-hex-
ane and benzene, the symmet:ty of the benzene peak !was
much better. After continuing the flushing with these two
solvents until the capacity ratio of n-hexane is about 0,05,
squalane columns can be prepared which permit reproducibility
of retention indices for all hydrocarbons within 0.2 index
units, for peaks which are completely separ~ted.
As an example 1 the influence of the quantity of n-nex
ane and benzene used for the cleaning of a 100 m column, is
demonstrated in Fig. 3.11.
2.0
1.5
1.0
0.5
15 45 60 75 ml hexane
ml benzene
Fig. 3.11 Dependence of the capacity ratio of n-hexane on the quantity
of organic solvents during the cleaning of a stainless steel column.
It can be observed that in this case, after flushing
3 times with 15 ml of n-hexane and 15 ml of benzene,a mini
mum capacity ratio for n-hexane is obtained of about 0.05
at 2s0 c. If the cleaning is continued the capacity ratio
of n-heKane is increasing as is the asymmetry of the benzene peak.
101
Following the cleaning and test procedure described
before, it can be expected that the reproducibility of
retention data between laboratories can be within 0.2 index units, for hydrocarbons.
CoZ.umn Coating.
There are two different methods to deposite the sta
tionary phase on the column wall, the statie method, de
veloped by Golay (1) and modified by Bouche and Verzele (20)
and the dynamic method introduced by Dijkstra and de Goey (21).
The last method is used in this investigation. In this
method, a solution of the stationary phase in a volatile
organic solvent is forced through the tubing, with the aid
of an inert gas. The inside wall of the column is wetted
by the solution. Subsequently the solvent is evaporated by a small flow of the inert gas through the column for a few
hours.
The advantages of this method are that it does not requires special equipment and that it can be carried out
relatîvely quîckly and easily.
The volume of the coating solution can be smaller or larger than the column volume. The first method is called
the "plug method".
As discussed in section 3.6.2.the quality of the column
is determined by the thickness and uniformity of the liquid layer on the inside column wall. In the case of a thin layer adsorption on the column wall predominates.
Thick films on the ether hand are not stable and will
clog the end of the column. Mean film thicknesses between
0.5 and 1.5 are therefore applied in this investigation.
The thickness of the film will mainly depend on the roughness of the wall, the viscosity and polarity of the
solvent and the linear speed of the coating solution. According to Desty and Kaiser (22,23) the best results
will be obtained with 5-15% concentrations of stationary
102
phase in the solvent and linear velócities between 2 and
iO cm.sec-1 • To obtain a uniform film the velocity of the
coating solution through the column must be constant.
At constant pressure drop across the column, using
the plug method, the length of the plug will decrease by
wetting of the column wall, so that the linear velocity of
the plug will increase. When the volume of the coating
solution is larger than the column volume the linear ve
locity will also be not constant in the beginning and at
the end of the coating.
To prevent the decrease of the length of the plug
a combination of both these methods can be used. In first
instance a coating solution of three times the column vo
lume is forced through the column at constant inlet pressure.
Immediately after the total quantity of this solution has
passed the column, a plug of about 10% of column volume is
forced through the column, also at constant inlet pressure.
After drying with a gentle stream of inert gas, during 8
hours, the column is placed in the gaschromatograph for
conditioning.
In all experiments the concentration of stationary phase
in the solvent was 10%, the linear velocity of th~ coating -1 solution was always between 5 and 10 cm.sec •
The regularity of the f ilrn along the column, for the
three variants of the dynarnic method mentioned before, is
investigated as fellows: The quantity of stationary phase was determined for a
100 m stainless steel column by weighing the column be
fore and after coating. The mean film thickness was calcu
lated by the equatian:
(3.26}
21T.d.l.p
where g = weight of stationary phase (g)
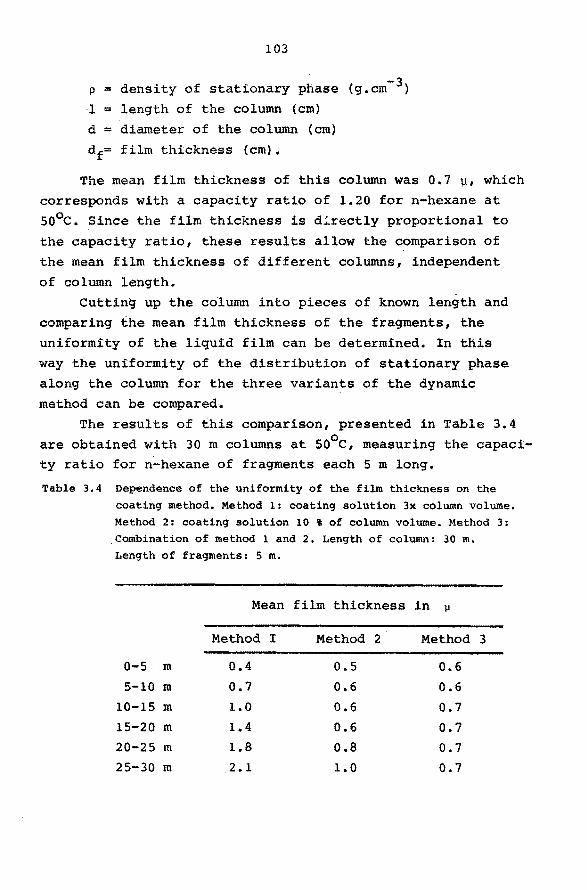
p =
1 =
d =
df=
103
density of stationary phase
length of the column (cm)
diameter of the column (cm)
film thickness (cm).
-3 (g. cm ).
The mean film thickness of this column was 0.7 µ, which
corresponds with a capacity ratio of 1.20 for n-hexane at
5o0 c. Since the film thickness is d~rectly proportional to
the capacity ratio, these results allow the cornparison of
the mean film thickness of different columns, independent
of column length.
cutting up the column into pieces of known length and
comparing the mean film thickness of the fragments, the
uniformity of the liquid film can be determined. In this
way the uniformity of the distribution of stationary phase
along the column for the three variants of the dynamic
method can be compared.
The results of this comparison, presented in Table 3.4
are obtained with 30 m columns at so0 c, measuring the capaci
ty ratio for n-hexane of fragrnents each 5 m long.
Table 3.4 Dependence of the uniformity of the film thickness on the coating method. Method l: coating solution 3x column volume. Method 2: coating solution 10 % of column volume. Method 3: Combination of method l and 2. Length of column: 30 m. Length of fragments: 5 m.
Mean film thickness in µ
Method I Method 2 Method 3
o-s m 0.4 o.s 0.6
5-10 m 0.7 0.6 0.6 10-15 m 1.0 0.6 0.7 15-20 m 1.4 0.6 0.7 20-25 m 1.8 0.8 0.7 25-30 m 2.1 1.0 0.7
104
It can be seen from Table 3.4 that the uniformity of
the film obtained by the combination of method l and 2 gives
the best results. Therefore this method, which is! used in
all cases in this investigation, has to be recomm.ended for !
the preparation of long open-hole tubular columns for the
separation of hydrocarbons.
Coiumn Conditioning.
After the freshly prepared column is dried, it has to
be conditioned. To achieve this, the column is placed in
the gaschromatograph and the temperature is raised in steps of 1S0 c to. a maximum operating temperature, 7o0 c in this
case. The temperature is kept constant for all the steps
during about 4 hours, under a small flow of carrier-gas -1 (0.5 - 1.0 ml.min ).
After the last step the conditioning of the column is
continued about 100 hours at the maximum operating tempera
ture, after which the column is ready for use. Conditioning
the column in this way improves its stability and results
in a lower background signa! as compared with a freshly prepared column.
QuaZity Control of the Column.
For all columns, cleaned, prepared and conditioned
as described before, the reproducibflity of retention indices of hydrocarbons was better than 0.2 index units.
The capacity ratio of n-hexane, at so0 c, for squalane co
lumns was between 0.8 and 2.5. For the acetyltributylci
trate columns this value was between 0.4 and 0.8. The ratio of the front-side and the back-side peak width at
half the height of the peak, which is a measure for the
peak symmetry, was larger than 0.9 for benzene, at so0 c, in all cases. The sample quantity was always less than
-8 10 g.
105
3.7 References.
1. Golay M.J .E., "Gaschromatography 1958", D.H. Desty
ed., Academie Press, New York, 1958, p. 36.
2. Halász I. and Horvath c., Anal.Chem., 35, (1963), 499.
3. Halász I. and Heine E., Nature, 194, (1962), 1971.
4. Halász I and Heine E., Anal.Chem., 37, (1965), 495.
5. Cramers C.A., and van Kessel M.M., J. of Gaschromat.,
6, ( 1968), 577.
6. Kuppens P.S.H., Chem.Weekblad, 65, (1969), 7.
7. Grob K., and Grob G., J. of Chromatog. Sci., 7, (1969)
584.
8. Grob K and Grob G., Helv. Chim.Acta, 51, (1968), 718.
9. Novotny M. and Tesarik K., Chromatographia 1, (1968),
332.
10. Novotny M., Blomberg Land Bartle K.D., J. of Chroma
tog. Sci., 8, (1970 )·, 390.
ll. Guiochon G.,Chromatog. Rev., 8, (1966), 1.
12. Landault C. and Guiochon G., "Gaschromatography 1964",
A. Goldup, ed., Institute of Petroleum, Londen, i965,
p. 121.
13. Halász I and Heine E., "Advances in Çhromatography"
Vol. IV, p. 21 7.
14. Guiochon G. "Advances in Chromatography" Vol. VIII,
p.192.
15. Tesarik K., "Gaschromatography 1968", H.G. Struppe,
ed., Deutsche Academie der Wissenschaften, Berlin.
16. v. Deemter J.J., Zuiderweg F.J. and Klinkenberg A.,
Chem. Eng. Sci. 5., (1956), 271.
1 7. Ettre L.S. p "Open Tubular Column·s in Gaschromatography",
Plenum Press, New York, 1965, p. 79.
18. Cramers C.A., Thesis 2967. Eindhoven, University of
Technology.
19. Street H.V., J. of Chromatog. 29 (1967), 68.
106
20. Bouche J. and Verzele M., J. of Gas Chromatog., 6,
(1968), 501.
21. Dijkstra G. and de Goey J. "Gaschromatography il958",
D.H. Desty, ed., Butterworths, London, 1958, p. 56.
22. Kaiser R. , "Capillary Gas Chromatography", ed.,
Butterworths, Washington, 1963.
23. Desty D.H., and Goldup A., "Gaschromatography 1960"
P.P.W. Scott, Ed., Butterworths, London.
24. Cramers C.A., Rijks J.A. and Bocek P.,Clin.Chim.
Acta 34, (1971) 159.
25. Cramers C.A., Rijks J.A. and Bocek P.,J. Chromatog.,
65, (1972), 29.
26. Giddings J.C., Seager S.L., Stucki L.R., Stewart G.H.,
Anal. Chem., 32#, (1960) 867.
107
CHAPTER IV
CHARACTERIZATION OF HYDROCARBONS
BY MEANS OF ACCURATE RETENTION DATA
4.1 INTRODUCTION.
Although gas chroroatography is essentially a method of
separating a mixture into its constituents, qualitative and
quantitative information can be obtained for each component.
A gas chroroatogram yields, for each component, one character
istic retention value and one typical detector response f actor.
For qualitative analysis use can be made of the different
selectivities of various detectors. A mass spectrometer used
as a detector will give a highly characteristic response
for each compound in the form of its mass spectrum. There
are however cases, where different substances, e.g. hydro
carbon isomers, exhibit almost identical mass spectra. In
those cases the retention value remains important even if
a coupled mass spectrometer is available. Retention values will become more characteristic with
increasing accuracy and precision. At the same time the sepa
ration power of the column should be made as high as tech
nically possible (section 2.1).
The use of different temperatures and of different columns adds considerably to the final characterization. The
possibility of coincidence of various retention data can be
greatly reduced in this way. Since in many laboratories collections of standard sub
stances are incomplete or not available, sets of collected
accurate retention data will be essential for characterization purposes. Apart from this it will save very much time
if tables of accurate retention data are available.
108
To enable the exchange of retention data within and
between laboratories, all possible sources of error in the
gas chrornatographic systern have to be eliminated td such • 1
an extent that the accuracy of the retention data Meeps
step with the separation power of the column. With a high
quality equipment (2.5) and high resolution open-hole tu
bular columns (3.6.3), retention indices óf some 170 hydro
carbons have been rneasured at so0 c and 10°c, with squalane
and acetyltributylcitrate as the column liquids.
The agreement between the results presented in this
thesis and retention indices given in the literature and the
reproducibility within our laboratory will be discussed in
the following sections.
The application of precise retention data and the tem
perature dependence of the retention index for type classi
fication will be dernonstrated by two examples. Finally the potentialities of precise retention data
for the characterization of compounds in complex mixtures
of hydrocarbons is shown. For this purpose a systern of
coupled high resolution columns of different polarity, with
out valves in the sample path, was developed. This systern enables the transfer of a part of a selected peak, eluted
frorn the first column, on to a second column of different
polarity. In this way cornpounds which are not or not comp
letely resolved on the first column, can be separated and
characterized on the second column. The accuracy of reten
tion data obtained with this system is as good as the accu
racy obtained with single columns.
4.2 REPRODUCIBILITY OF RETENTION INDICES WITHIN OUR
LABORATORY.
The reproducibility of retention indices within our laboratory is shown in Table 4.1 (stationary phase:
squalane) and Table 4.2 (stationary phase: acetyltributyl-
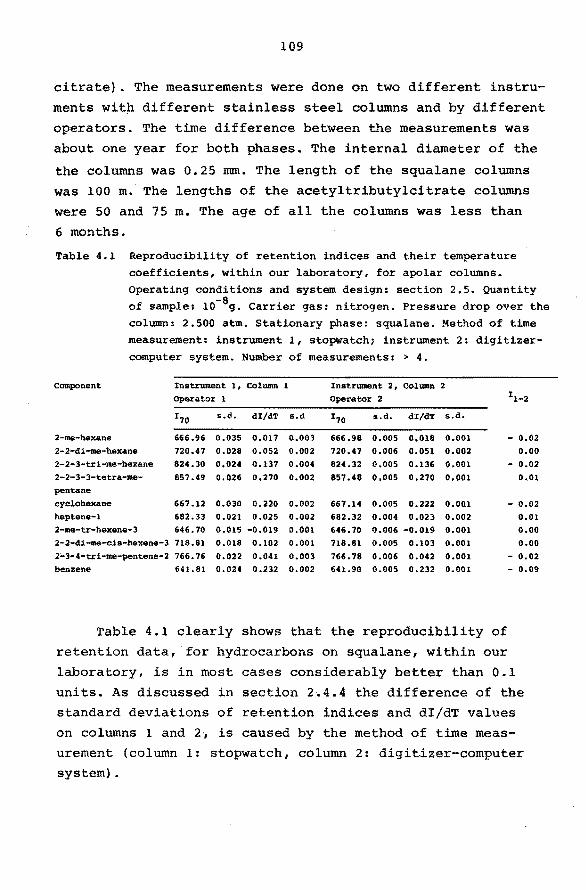
109
citrate). The measurements were done on two different instru
ments with different stainless steel columns and by different
operators. The time difference between the measurements was
about one year for both phases. The internal diameter of the
the columns was 0.25 mm. The length of the squalane columns
was 100 m. The lengths of the acetyltributylcitrate columns
were 50 and 75 m. The age of all the columns was less than
6 months.
Table 4.1 Reproducibility of retention indices and their temperature coefficients, within our laboratory, for apolar columns. Operating conditions and system design: section 2.5. Quantity of sample: l0-8g. Carrier gas: nitrogen. Pressure drop over the column: 2.500 atm. Stationary phase: squalane. Method of time measurement: instrument l, stopwatch; instrument 2: digitizer-computer system. Number of measurements: > 4.
Component Instrument 1, Column 1 InstrU111ent 2, Column 2 Operator l Operator 2 11-2
170 s.d. dI/d'l' s.d 170 s.d. dI/dT s.d.
2-me-hexane 666.96 0.035 0.011 0.003 666.98 0.005 0.018 0.001 - 0.02 2-2-di-me-hexane 720.47 0.028 0.052 0,002 720.47 0.006 0.051 0.002 o.oo 2-2-3-tri-me-hexane 824.30 0.024 0.137 0.004 824.32 0.005 0.136 0.001 - 0.02 2-2-3-3-tetra-me- 857.49 0.026 0.270 0.002 857.48 0.005 0.270 0.001 0.01 pentane cyclohexane 667.12 0.030 0.220 0.002 667.14 o.oos 0.222 0.0111 - 0.02 heptene-1 682.33 0.021 0.025 0.002 682.32 0,004 0,023 0.002 0.01 2-me-tr-hexene-3 646.70 0.015 -0.019 0.001 646. 70 0.006 -0.019 0.001 o.oo 2-2-di-me-cis-hexene-3 718.81 0.018 0.102 0.001 718.81 0.005 0.103 0.001 o.oo 2~3-4-tri-me-pentene-2 766.76 0.022 0.041 0.003 766,78 0.006 0.042 0.001 - 0.02 benzene 641.81 0.024 0.232 0.002 641,90 0.005 0.232 0.001 - 0.09
Table 4.1 clearly shows that the reproducibility of
retention data, for hydrocarbons on squalane, within our
laboratory, is in most cases considerably better than 0.1
units. As discussed in section 2.4.4 the difference of the
standard deviations of retention indices and dI/dT values
on columns 1 and 2·, is caused by the method of time meas
urement (column 1: stopwatch, column 2: digitizer-computer system).
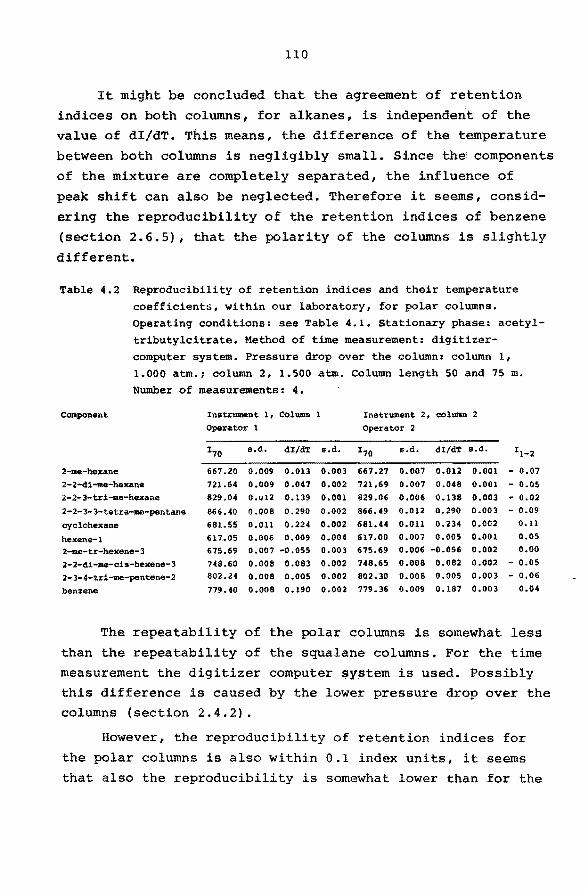
110
It might be concluded that the agreement of retention
indices on both columns, for alkanes, is independent of the value of dI/dT. This means, the difference of the temperature
between both columns is negligibly small. Since thei components
of the mixture are completely separated, the influence of
peak shift can also be neglected. Therefore it seems, consid
ering the reproducibility of the retention indices of benzene
(section 2.6.5), that the polarity of the columns is slightly
different.
Table 4.2 Reproducibility of retention indices and their temperature coefficients, within our laboratory, for polar columns. Operatinq conditions: see Tabla 4.1. Stationary phase: acetyltributylcitrate. Method of time measurement: diqitizer-computer system. Pressure drop over the column: column 1,
1.000 atm.; column 2, 1. 500 atm. Column length 50 and 75 m.
Number of measurements: 4.
COlllponent Instrument l, Column l Instrument 2, column 2 Operator l Operator 2
110 s.d. dI/dT s.d. I70 s.d. dI/dT s.d. Il-2
2-me-hexane 667.20 0,009 0.013 0.003 667.27 0.007 0.012 0.001 - 0.07 2-2-di-itle-hexane 721.64 0.009 0.047 0.002 721.69 0.007 0.048 0.001 - 0.05 2-2-3-tri-me-hexane 829.04 o.u12 0.139 0.001 829.06 0,006 0.138 0.003 - 0.02 2-2-3-3-tetra-me-pentane 866.40 0.008 0.290 0.002 866.49 0.012 0.290 0.003 - 0.09
cyclohexane 681.55 0.011 0.224 0.002 681.44 o.ou 0.234 0.002 0.11
b.exene-1 617 .os 0.006 0.009 0.004 617.00 0.007 o.oos 0.001 0.05
2-me-tr-hexene-3 675.69 0,007 -o.oss 0.003 675.69 0.006 -1).056 0.002 o.oo 2-2-di-me-cis-hexene-3 748.60 0.008 0.083 0.002 748.65 0.008 0.082 0.002 - 0.05
2-3-4-tr1-it1e-pentene-2 802.24 0.008 0.005 0.002 802. 30 0.008 0.005 0,003 - o.06
benzene 779.40 0.008 0.190 0.002 779.36 0.009 0.187 0.003 0.04
The repeatability of the polar columns is somewhat less
than the repeatability of the squalane columns. For the time
measurement the digitizer computer ~y$tem is used. Possibly this difference is caused by the lower pressure drop over the columns (section 2.4.2).
However, the reproducibility of retention indices for
the polar columns is also within 0.1 indèx units, it seems
that also the reproducibility is somewhat lower than for the
111
squalane columns.
The excellent reproducibility of the dI/dT values for
both'phases allows its application to the characterization
of hydrocarbons in complex mixtures, as will be discussed
in section 4.5.
4.3 TABULATION OF RETENTION DATA.
Under the experimental conditions given in section 2.5
and with columns prepared according to the procedure de
scribed in section 3.6.3, retention indices of 170 odd hydrocarbons are given in Table 4.3, at so0 c and 7o0 c. Squalane
and acetyltributylcitrate are the stationary phases.
The measurements were done with synthetic mixtures of a
bout 30 hydrocarbons each, which all were completely separated
at both temperatures. The composition of the mixtures was
different for both phases. Normally the standard compounds
(n-alkanes) were included in these mixtures. In those cases where a compound was not or noticompletely separated from a
standard, this n-alkane was omitted in the mixture. The ad
justed retention time of this n-alkane was calculated from
its relative retention time in the other mixtures. The reten
tion time of methane was taken as the "dead time" in.all the
measurements (2.6). The quantity of sample was always less
than 10-Sg per component. The carrier gas was nitrogen. For
the squalane columns the pressure drop across the column was 2.500 atm. ± 0.002 atm. The column length was 100 m, the internal diameter 0.25 mm. The column material was stainless steel.
The pressure drop over the acetyltributylcitrate columns was 1.000 respectively 1.500 ± 0.002 atm., for column lengths res
pectively of 50 and 75 m. The column material and the internal
diameter of the columns was the same as for the squalane col
umns.
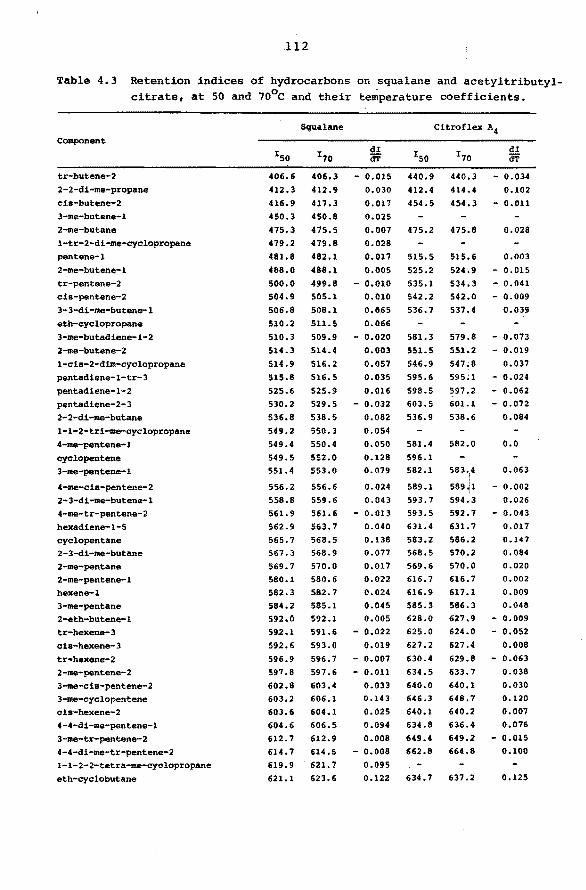
112
Table 4.3 Retention indices of hydrocarbons on squalane and acetyltributyl-citrate, at 50 and 7o0 c and their temperature coefficients.
Squalane Citroflex A4 ColftPOnent
I50 I70 dI
ISO I7(i dI
dT dT
tr-butene-2 406.6 406.3 - 0.015 440.9 440.3 - 0.034 2-2-di-me-propane 412.3 412.9 0.030 412.4 414.4 0.102 eis-butene-2 416.9 417.3 0.017 454. 5 454.3 - 0.011 3-me-butene-1 450. 3 450.8 0.025 2-me-butane 475.3 475.5 0.007 475.2 475.8 0.028 1-tr-2-di-me-eyelopropane 479.2 479.8 0.028 pentene-1 481.8 482.1 0.017 515.5 515.6 0.003
2-me-butene-l 488.0 488.l 0.005 525.2 524;9 - 0.015 tr-pentene-2 500.0 499.8 - 0.010 535.l 534.3 - 0.041 eis-pentene-2 504.9 505.l 0.010 542.2 542.0 - 0.009 3-3-di-me-butene-l 506.8 508.l 0.865 536.7 537.4 0.039
eth-cyelopropane 510.2 511.5 0.066
3-me-butadiene-1-2 510.3 509.9 - 0.020 581.3 579.8 - 0.073 2-me-butene-2 514.3 514.4 0.003 551.5 551.2 - 0.019 1-eis-2-dim-eyelopropane 514.9 516.2 0.057 546.9 547•8 0.037
pentadiene-l-tr-3 515.8 516.5 0.035 595.6 595;1 - 0.024
pentadiene-1-2 525.6 525.9 0.016 598.5 597.2 - 0.062 pentadiene-2-3 530.2 529.5 - 0.032 603.5 601.1 - 0.072 2-2-di-me-butane 536.8 538.5 0.082 536.9 538.6 0.084
1-1-2-tri-me-cyelopropane 549.2 550.3 0.054
4-me-pentene-l 549.4 550.4 0.050 581.4 582.0 o.o cyelopentene 549.5 552.0 0.128 596.l
3-me-pentene-l 551.4 553.0 0.079 582.l 583.4 0.063
4-me-cis-pentene-2 556.2 556.6 0.024 589.1 599J1 - 0.002
2-3-di-me-butene-l 558.8 559.6 0.043 593.7 594.3 0.026
4-me-tr-pentene-2 561.9 561.6 - 0.013 593.5 592. 7 - 0.043
hexadiene-1-5 562.9 563.7 0.040 631.4 631. 7 0.017
cyelopentane 565.7 568.5 0.138 583.2 586.2 0.147
2-3-di-me-butane 567.3 568.9 0.077 568.5 570.2 0.084
2-me-pentane 569.7 570.0 0.017 569.6 570.0 0.020
2-me-pentene-l 580.l 580.6 0.022 616. 7 616.7 0.002
hexene-1 582.3 582.7 0.024 616.9 617.1 0.009
3-me-pentane 584.2 585.l 0.045 585.3 586.3 0.048
2-et:h-butene-l 592.0 592.1 0.005 628.0 627.9 - 0.009
tr-hexene-3 592.l 591.6 - 0.022 625.0 624.0 - 0.052
eis-hexene-3 592.6 593.0 0.019 627. 2 627.4 0.008
tr•hexene-2 596.9 596.7 - 0.007 630.4 629.8 - 0.063
2-me-pentene-2 597.8 597 .6 - 0.011 634.5 633.7 0.038
3.-me-ch-pentene-2 602.8 603.4 0.033 640.0 640.l 0.030
3-me-cyelopentene 603.2 606.l 0.143 646.3 648. 7 0.120
cis-hexene-2 603.6 604.l 0.025 640.1 640.2 0.001
4-4-di-me-pentene-l 604.6 606.5 0.094 634.8 636.4 0.076
3-me-tr-pentene-2 612.7 612.9 0.008 649.4 649.2 - 0.015
4-4-di-me-tr-pentene-2 614.7 614.6 - 0.008 662.8 664.8 0.100
1-1-2-2-tetra-me-eyelopropane 619.9 621.7 0.095
eth-cyelobutane 621.l 623.6 0.122 634. 7 637.2 0.125
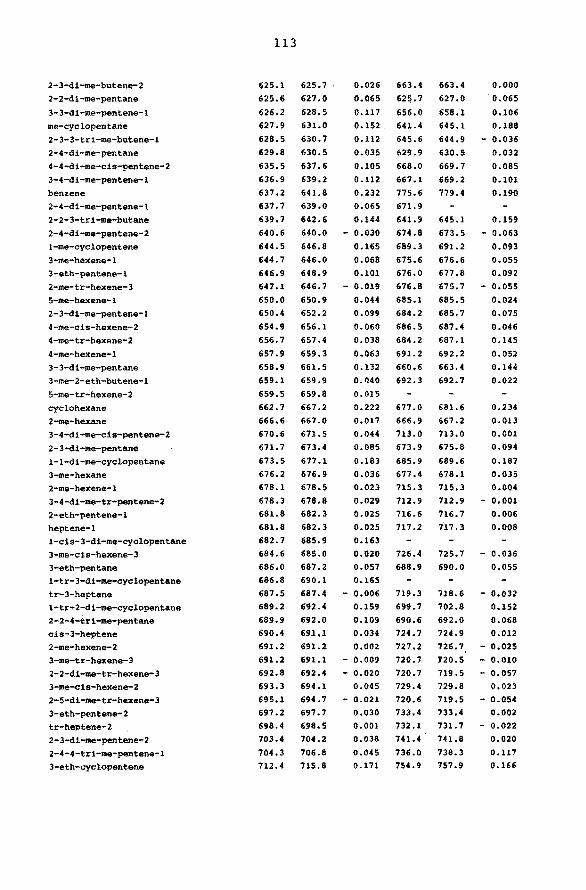
2-3-di-me-butene-2 2-2-di-me-pentane 3-3-di-me-pentene-l me-cyclopentane 2-3-3-tri-me-butene-l 2-4-di-me-pentane 4-4-di-me-cis-pentene-2 3-4-di-me-pentene-l benzene 2-4-di-me-pentene-l 2-2-3-tri-me-butane 2-4-di-me-pentene-2 1-me-cyclopentene 3-me-hexene-l 3-eth-pentene-l 2-me-tr-hexene-3 s-me-hexene-1 2-3-di-me-pentene-l 4-me-cis-hexene-2 4-me-tr-hexene-2 4-me-hexene-l 3-3-di-me-pentane 3-me-2-eth-butene-l 5-me-tr-hexene-2 cyclohexane 2-me-hexane 3-4-di-me-cis-pentene-2 2-3-di-me-pentane 1-1-di-me-cyclopentane 3-me-hexane 2-me-hexene-l 3-4-di-me-tr-pentene-2 2-eth-pentene-l heptene-1 l-cis-3-di-me-cyclopentane 3-me-cis-hexene-3 3-eth-pentane l-tr-3-di-me-cyclopentane tr-3-heptene l-tr-2-di-me-cyclopentane 2-2-4-tri-me-pentane cis-3-heptene 2-me-hexene-2 3-me-tr-hexene-3 2-2-di-me-tr-hexene-3 3-me-cis-hexene-2 2-5-di-me-tr-hexene-3 3-eth-pentene-2 tr-heptene-2 2-3-di-me-pentene-2 2-4-4-tri-me-pentene-l 3-eth-cyclopentene
113
625.l
625.6
626.2 627.9
628.5
629.8 635.5
636.9
637.2 637.7
639.7 640.6
644.5
644.7 646.9
647.1 650.0 650.4
654.9 656.7
657.9
658.9 659.l
659.5
662.7
666.6 670.6
671. 7
673.5
676.2 678.1 678.3 681.8 681.8
682.7 684.6
686.0 686.8
687.5 689.2
689.9 690.4
691.2 691.2
692.8 693.3 695.l
697.2 698.4
703.4
704.3 712.4
625.7 627.0 628.5 631.0 630.7
630.5
637.6 639.2
641.8 639.0 642.6 640.0
646.8 646.0 648.9
646.7 650.9 652.2
656.l
657.4
659.3
661.5 659.9
659.8
667.2
667.0
671.5
673.4
677 .l
676.9 678.5
678.8 682.3
682.3
685.9
685.0 687.2
690.l 687.4 692.4
692.0
691,l
691.2 691.l
692.4 694.l 694.7 697.7
698.5 704.2
706.8 715.8
0.026
0.065
0.117 0.152
0.112
0.035
0.105 0.112
0.232
0.065 0.144
- 0.030 0.165
0.068 0.101
- 0.019 0.044
0.099
0.060 0.038
0.063
0.132 0.040
0.015
0.222 0.017
0.044
0.085
0.183 0.036 0.023
0.029 0.025
0.025 0.163
0.020 0.051 0.165
- 0.006 0.159 0.109 0.034
0.002
- 0.009
- 0.020 0.045
- 0.021 0.030 0.001
0.038
0.045 0.171
663.4 625.7
656.0 641.4
645.6
629.9
668.0 667.l
775.6
671.9
641.9
674.8
689.3
675.6 676.0
676.8
685.1
684.2
686.5 684.2 691.2
660.6 692.3
677.0
666.9
713.0 673.9
685.9 677.4
715.3 712.9 716.6 717.2
726.4 688.9
719.3 699.7
690.6 724. 7
727 .2 720.7
720.7 729.4 720.6 733.4 732.l 741.4
736.0 754.9
663.4 627.0
658.l 645.1
644.9
630.5
669.7
669.2
779.4
645.1-
673. 5
691.2
676.6 677.8 675.7
685.5 685.7
687.4 687.l
692.2 663.4
692.7
681.6
667.2
713.0 675.8
689.6 678. l 715.3
712.9 716.7 717.3
725. 7
690.0
718.6 702.8 692.0 724.9 726.7 120.5
719.5 729.8 719.5 733.4 731.7 741.8
738.3 757.9
o.ooo 0.065
0.106 0.188
- 0.036 0.032
0.085 0.101 0.190
0.159
- 0.063
0.093 0.055 0.092
- 0.055 0.024 0.075
0.046 0.145
0.052 0.144
0.022
0.234
0.013 0.001
0.094
0.187 0.035 0.004
- 0.001 0.006
0.008
- 0.036 0.055
- 0.032 0.152 0.068 0.012
- 0.025
- 0.010 - 0.057
0.023 - 0.054
0.002 - 0.022
0.020 0.117 0.166
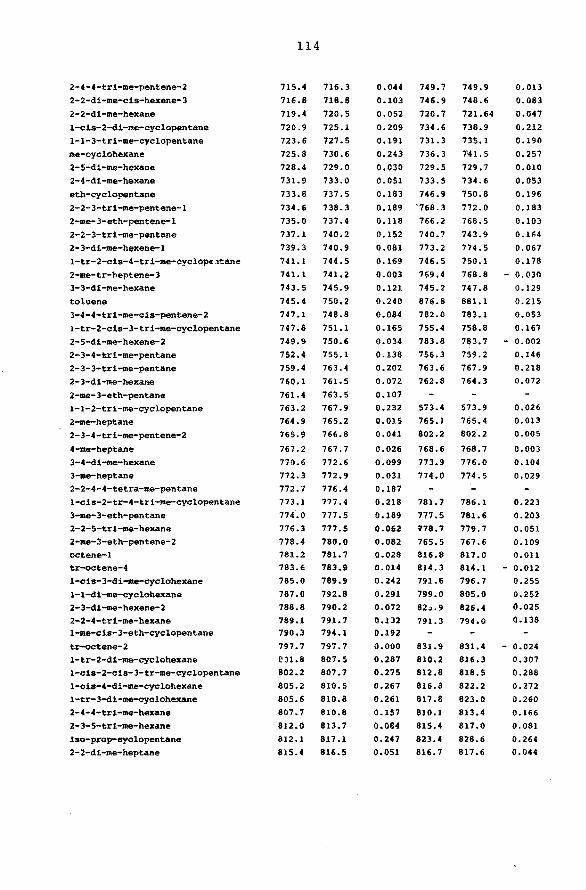
2-4-4-tri-me-pentene-2 2-2-di-me-cis-hexene-3 2-2-di-me-hexane 1-cis-2-di-me-cyclopentane 1-1-3-tri-me-cyclopentane me-cyclohexane 2-5-di-me-hexane 2-4-di-me-hexane eth-cyclopentane 2-2-3-tri-me-pentene-l 2-me-3-eth-pentene-1 2-2-3-tri-me-pentane 2-3-di-me-hexene-l l-tr-2-cis-4-tri-me-cyclope~tane
2-me-tr-heptene-3 3-3-di""l'le-hexane toluene 3-4-4-tri-me-cis-pentene-2 l-tr-2-cis-3-tri-me-cyclopentane 2-5-di-me-hexene-2 2-3-4-~ri-me-pentane
2-3-3-tri-me-pentane 2-3-di-me-hexane 2-me-3-eth-pentane 1-1-2-tri-me-cyclopentane 2-me-heptane 2-3-4-tri-me-pentene-2 4-me-heptane 3-4-di-me-hexane 3-me-heptane 2-2-4-4-tetra-me-pentane l-cis-2-tr-4-tri-me-cyclopentane 3-me-3-eth-pentane 2-2-5-tri-me-hexane 2-me-3-eth-pentene-2 octene-1 tr-octene-4 l-cis-3-di-me-cyclohexane 1-1-di-me-cyclohexane 2-3-di-me-hexene-2 2-2-4-tri-me-hexane l-me-cis-3-eth-cyclopentane tr-octene-2 l-tr-2-di-me-cyclohexane 1-cis-2-cis-3-tr-me-cyclopentane l-cis-4-di-me-cyclohexane 1-tr-3-di-me-cyclohexane 2-4-4-tri-me-hexane 2-3-5-tri-me-hexane iso-prop-eyclopentane 2-2-di-me-heptane
114
715.4 716.8
719.4 720.9
723.6
725.8 728.4
731.9
733.8
734.6
735.0
737.1 739.3
741.l 741.1 743.5 745.4
747.l 747.8
749.9
752.4 759.4
760.l
761.4 763.2 764.9
765.9
767.2
770.6 772.3 772. 7 773.1 774.0 776.3
778.4 781.2 783.6
785.0 787.0
788.8 789.l 790.3
797.7 Ml.8 802.2
805.2 805.6
807.7
812.0
812.1 815.4
716.3
718.8 720.5
725.l 727.5
730.6
729.0 733.0
737.5 738.3 737.4
740.2 740.9
744.5
741.2
745.9
750.2 748.8
751.l
750.6 755.1 763.4
761.5
763.5 767.9 765.2
766.8
767.7
772.6
772.9 776.4
777.4 777 .5 777.5
780.0
781.7 783.9
789.9 792.8
790.2 791.7 794.1
797.7 807.S 807.7
810.5 810.8
810.8 813. 7
817.1
816.5
0.044
0.103
0.052
0.209
0.191 0.243
0.030
0.051
0.183
0.189
0.118 0.152
0.081
0.169 0.003
0.121
0.240 0.084
0.165
0.034
0.138 0.202 0.072
0.107 0.232 0.015
0.041
0.026
0.099
0.031 0.187 0.218
0.189 0.062
0.082 0.028 0.014 0.242
0.291
0.072 0.132 0.192
o.ooo 0.287 0.275 0.267 0.261
0.157
0.084 0.247 0.051
749.7
746.9
720. 7
734.6 731.3
736.3 729.5
733.5
746.9 ·168.3
766.2
740.7 773.2
746.5
769.4
745.2
876.8 782.0
755.4
783.8 756.3
763.6 762.8
573.4
765.l 802.2
768.6
773.9 774.0
781.7
777.5 178.7 765.5 816.8
814.3 791.6
799.0
82~.9
791.3
831.9 810.2 812.8
816.8
817.8 810.l 815.4
823.4 816. 7
7:49.9 748.6
721. 64
738.9 735.1
741.5
729.7 734.6
750.8
772.0
768.5
743.9
774.5
750.l
768.8
747.8 881. l 783.l
758.8
783. 7 759.2 767.9
764.3
573.9
765.4 802.2
768.7 776.0
774.5
786.1
781.6 779.7
767.6 817.0 814.1 796.7
805.0
826.4
794.0
831.4 816.3 818.5
822.2 823.o
813.4
817.0 828.6 817.6
0.013
0.083 0.047
0.212 0.190
0.257 0.010
0.053
0.196 0.183
0.103
0.164
0.067 0.178
- 0.030
0.129
0.215 0.053
0.161
- 0.002
0.146
0.218 0.072
0.026 0.013 o.oos 0.003
0.104
0.029
0.223
0.203
0.051 0.109 O.Oll
- 0.012 0.255 0.252 0.025
0.138
- 0.024
0.307
0.288
0.272 0.260
0.166
0.081 0.264 0.044
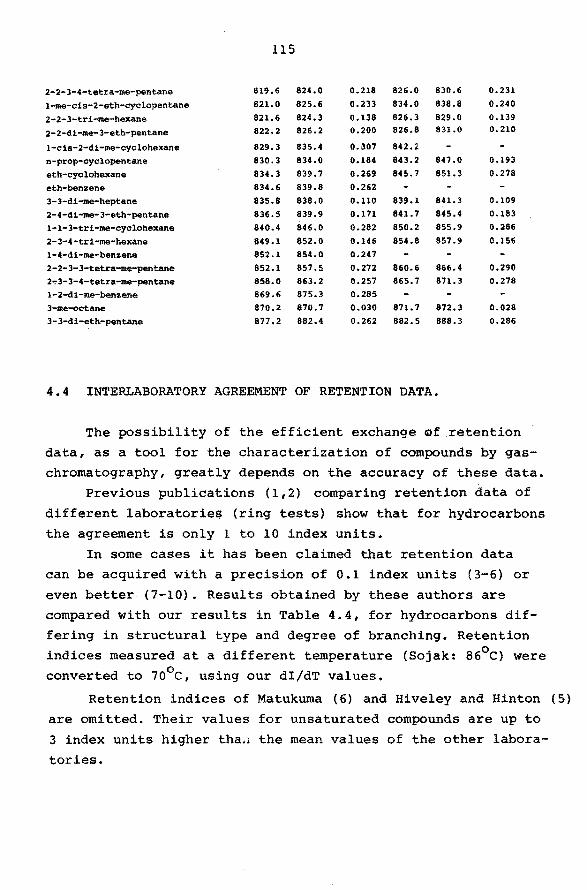
115
2-2-3-4-tetra-me-pentane 819.6 824.0 0.218 826.0 830.6 0.231
l-me-cis-2-eth-cyclopentane 821.0 825.6 0.233 834.0 838.8 0.240
2-2-3-tri-me-hexane 821.6 824.3 0.138 826.3 829.0 0.139
2-2-di-me-3-eth-pentane 822.2 826.2 0.200 826.8 831.0 0.210
1-cis-2-di-me-cyclohexane 829.3 835.4 o. \!07 842.2 n-prop-cyclopentane 830.3 834.0 0.184 843.2 847.0 0.193
eth-cyclohexane 834.3 839.7 0.269 845. 7 851.3 0.278
eth-benzene 834.6 839.8 0.262
3-3-di-me-heptane 835.8 838.0 0.110 839.l 841.3 0.109
2-4-di-me-3-eth-pentane 836.S 839.9 0.171 841.7 845.4 0.183
l-1-3-tri-me-cyclohexane 840.4 846.0 0.282 850.2 855.9 0.286
2-3-4-tri-me-hexane 849.l 852.0 o.146 854.8 857.9 0.156 l-4-di-me-benzene 852.l 854.0 0.247 2-2-3-3-tetra-me-pentane 852.l 857.S 0.272 860.6 866.4 0.290 2~3-3-4-tetra-me-pentane 858.0 863.2 0.257 865.7 871.3 0.278 1-2-di-me-benzene 869.6 875.3 0.285 3-me-octane 870.2 870.7 0.030 871. 7 872.3 0.028 3-3-di-eth-pentane 877,2 882.4 0.262 882.5 888.3 0,286
4.4 INTERLABORATORY AGREEMENT OF RETENTION DATA.
The possibility of the efficient exchange Qf retention
data, as a tool for the characterization of compounds by gas
chromatography, greatly depends on the accuracy of these data.
Previous publications (1,2) comparing retention data of
different laboratories (ring tests) show that for hydrocarbons
the agreement is only 1 to 10 index units.
In some cases it has been claimed that retention data
can be acquired with a precision of 0.1 index units {3-6) or
even better (7-10). Results obtained by these authors are
compared with our results in Table 4.4, for hydrocarbons dif
fering in structural type and degree of branching. Retention
indices measured at a different temperature (Sojak: 86°c) were
converted to 7o0 c, using our dI/dT values.
Retention indices of Matukuma (6) and Hiveley and Hinten (5)
are omitted. Their values for unsaturated compounds are up to
3 index units higher tha;1 the mean values of the other labora
tories.
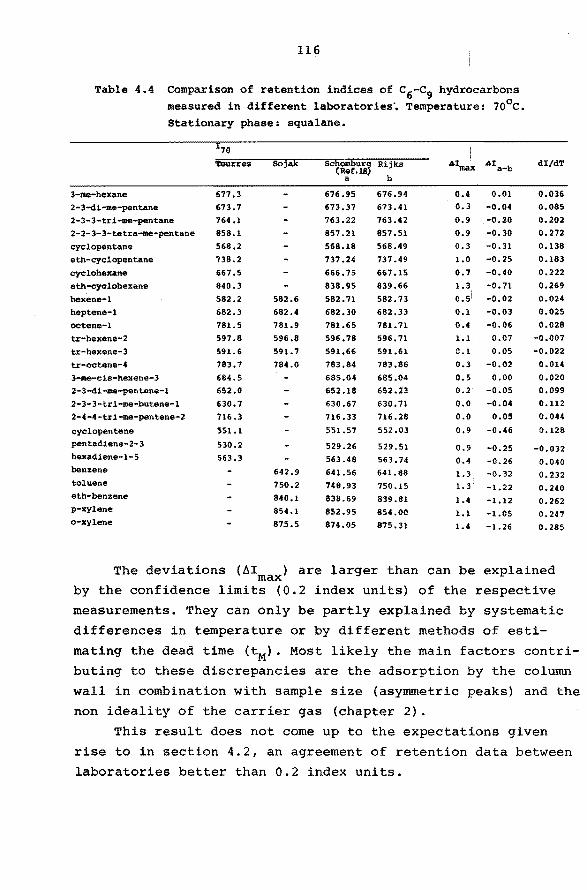
116
Table 4.4 Comparison of retention indices of c6-c9 hydrocarbons measured in different laboratories·. Temperatu~e: 10°c. Stationary phase: squalane.
'?ourres So3ak Schombur3 Rijks .d.Imax .d.I a-b dI/dT (Ref.18
a b
3-me-hexane 677.3 676.95 676.94 0.4 0.01 0.036
2-3-di-me-pentane 673.7 673.37 673.41 0.3 -0.04 0.085 2-3-3-tri-me-pentane 764.l 763.22 763.42 0.9 -0.20 0.202 2-2-3-3-tetra-me-pentane 858.l 857.21 857.51 0.9 -0.30 0.272
cyclopentane 568.2 568.18 568.49 0.3 -0.31 0.138 eth-cyclopentane 738.2 737.24 737.49 1.0 -0.25 0.183
cyclohexane 667.5 666.75 667.15 0.7 -0.40 0.222
eth-cyclohexane 840.3 838.95 839.66 1.3 -0.71 0.269 hexene-1 582.2 582.6 582. 71 582.73 0.5: -0.02 0.024 heptene-1 682.3 682.4 682.30 682.33 0.1 -0.03 0.025
octene-1 781.5 781.9 781.65 781. 71 0.4 -0.06 0.028
tr-hexene-2 597.8 596.8 596.78 596.71 l.l 0.07 -0.007
tr-hexene-3 591.6 591.7 591.66 591.61 C.l o.os -0.022
tr-octene-4 783.7 784.0 783.84 783.86 0.3 -0.02 0.014
3-me-cis-hexene-3 684.5 685.04 685.04 0.5 o.oo 0.020 2-3-di-me-pentene-l 652.0 652.18 652.23 0.2 -0.05 0,099
2-3-3-tri-me-butene-l 630.7 630.67 630. 7l o.o -0.04 0.112
2-4-4-tri-me-pentene-2 716.3 716.33 716.28 o.o 0.05 0.044
cyclopentene 551.l 551.57 552.03 0,9 -0.46 0.128 pentadiene-2-3 530.2 529.26 529.51 0.9 -0.25 -0.032 hexadiene-1-5 563.3 563.48 563.74 0.4 -0.26 0.040 benzene 642.9 641.56 641.88 l.3 -0.32 0.232 toluene 750.2 748.93 750.15 l.3 -l.22 0.240 eth-benzene 840.l 838.69 839.81 l.4 -l.12 0.262 p-xylene 854.l 852.95 854.00 1.1 -1.05 0.247 o-xylene 87.5.5 874.05 875.31 1.4 -1.26 0.285
The deviations (àI ) are larger than can be explained max by the confidence limits (0.2 index units) of the respective
measurements. They can only be partly explained by systematic
differences in temperature or by different methods of esti
mating the dead time (tM). Most likely the main factors contri
buting to these discrepancies are the adsorption by the column
wall in combination with sample size (asymmetrie peaks) and the
non ideality of the carrier gas (chapter 2).
This result does not come up to the expectations given
rise to in section 4.2, an agreement of retention data between
laboratories better than 0.2 index units.
117
However, with exception of benzene the retention indices
given by Sojak at 86°c, after conversion to 70°c with our
dI/dT, agree with our data within 0.3 index units even for
aromatic compounds, which are most strongly influenced by ad
sorption and non ideality of the carrier gas.
To enable a discussion of systematic deviations between
laboratories, it was agreed with Schomburg to exchange some
mixtures of hydrocarbons for measurement of retention indices
on open-hole tubular squalane columns, at 10°c. The choice of
all other experimental conditions was free. The repeatability
in both laboratories corresponds with a standard deviation of
< 0.05 index units. The column material was glass in Schomburgs
laboratory and stainless steel in our laboratory.
Considering the results of this exchange, given in Table
4.4, it can be concluded that the difference in retention in
deK (~ I b), which is considerable for aromatic compounds, a-is systematic. This difference can be explained for the
main part in the following way.
There is no reason to doubt that the stationary phase,
which is a pure compound, will cause systematicdeviations.
In bath laboratories special attention has been paid to the
effect of adsorption (retention index and symmetry of the ben
zene peak), as discussed in section 2.6.5 and the quantity of
sample (section 2.4.5). In first instance the influence of these
parameters can be neglected. The composition of the mixtures
was chosen in such a way that all components are completely
separated. The influence of the peak shift can also be
neglected.
Considering compounds which are not (alkanes) or hardly
(alkenes) influenced by the non ideality of the carrier gas
it can be concluded that the column temperature in Schomburgs
laboratory was about i0 c lower than our column temperature.
In this way 0.1 to 0.3 index units of difference can be ex
plained for alkanes, cycloalkanes and aromatics, dependent on
the dI/dT of the solutes.
118
The influence of the non ideality of the carrier gas was
discussed in section 2.6.4. For different carrier gases and
different inlet pressures correction factors can be derived
from Table 2.8, dependent on the structural type. In Schom
burgs laboratory helium was used as the carrier gas, so that
their retention indices are independent of inlet pressure. In
our laboratory nitrogen was used. The pressure drop over the
column was 3 atm. However in Table 2.8 only representatives of
different structural types have been measured, most likely the
corrections for the non ideality of the carrier gas will
also be valid for their homologs. In this way for cyclo
pentanes a difference of about 0.3 index units can be ex
plained. For cyclohexanes the correction is 0.4 index u-
nits. For aromatics the correction is about 0.6 index u-
nits.
It can be concluded that the retention indices obtain
ed in both laboratories would agree within 0.2 index units
if the carrier gas and the column temperature were equal.
From the foregoing it can be concluded that to obtain
an interlaboratory agreement of retention data for hydro
carbons better than 0.2 index units, the following points
have to be considered very carefully:
l Column temperature. 2 Definition and stability of the stationary phase.
3 Carrier gas and mean column pressure.
4 Retention index of benzene and the symmetry of
the benzene peak. 5 uuantity of sample. 6 Peak shift caused by incomplete separation.
7 Method of estimating "dead time". Only in this way data are interconvertible.
119
4.5 CHARACTERIZATION OF TYPES OF HYDROCARBONS BY MEANS
OF ACCURATE RETENTION DATA.
One of the reasons favouring the use of the reten-
tion index in the collection of retention data is its
weak temperature dependence. However, if extreme care
is taken in the measurement of retention indices at two
not too distant temperatures, the value of dI/dT appears to give some additional analytical information. This of-
fers promising possibilities (3,12), particularly in the
analysis of complex mixtures, e.g. petroleum fractions.
It was experimentally proved that the temperature depen
dence of retention indices, for hydrocarbons, in the range
considered (S0°C to 70°C), is linear for squalane columns,
within experimental error. Peak inversion in this temperature
range is unlikely to occur. dI/dT values are relatively
easy to collect.
By definition dI/dT for n-alkanes is zero. The numer
ical value of dI/dT increases with the degree of branching.
The largest values are found for cyclic compounds. The
effects of branching and cyclisation, on dI/dT, are much
strenger than the effect of unsaturation.
From dI/dT values alone it does not appear to be pos
sible to distinguish between cyclopentanes and highly
branched alkanes (more than 2 tertiairy or more than one
quarternary carbon atoms) or between alkanes and alkenes.
The use of 8I (the difference in retention index
on polar and apolar phases) has already been introduced by
Kovats (11) as an aid to recognizing types of compounds. 8I
depends on bath the polarity of the compound and the polarity
of the stationary phase.
Classes of hydrocarbons having similar 8I values cannot
be distinguished in this way. If, however, dI/dT is plotted
against ÁI values, for the same components, a distinction can
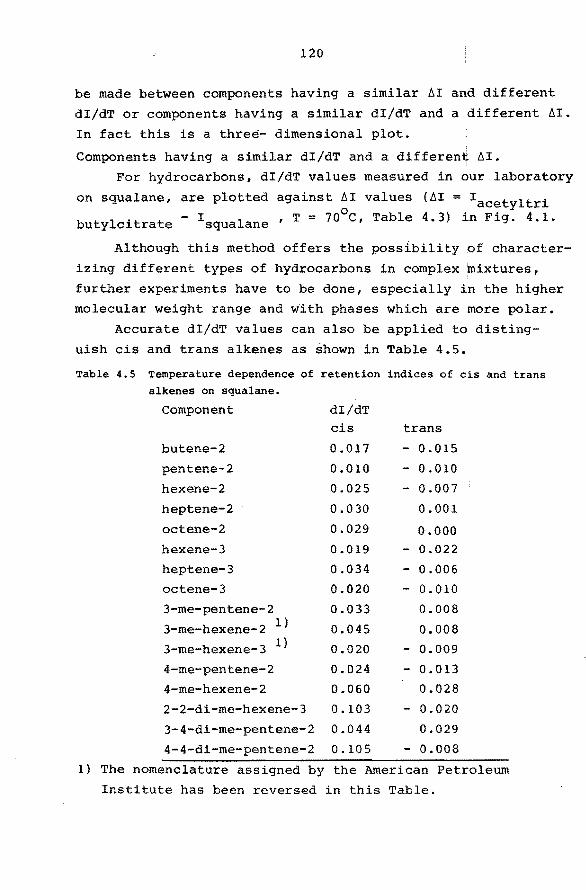
120
be made between components having a similar AI and different
dI/dT or components having a similar dI/dT and a different AI.
In fact this is a three- dimensional plot.
Components having a similar dI/dT and a different AI.
For hydrocarbons, dI/dT values measured in our laboratory
on squalane, are plotted against AI values (AI = Iacetyltri
butylcitrate - Isqualane , T = 70oC, Table 4.3) in Fig. 4.1.
Although this method offers the possibility of character
izing different types of hydrocarbons in complex mixtures,
further experünents have to be done, especially in the higher
molecular weight range and with phases which are more polar.
Accurate dI/dT values can also be applied to disting
uish cis and trans alkenes as shown in Table 4.5.
Table 4.5 Temperature dependence of retention indices of cis and trans alkenes on squalane.
Component dI/dT
cis trans
butene-2 0.017 - 0.015
pentene-2 0.010 - 0.010
hexene-2 0.025 - 0.007
heptene-2 0.030 0.001
octene-2 0.029 0.000
hexene-3 0.019 - 0.022
heptene-3 0.034 - 0.006
octene-3 0.020 - 0.010
3-me-pentene-2 0.033 0.008
3-me-hexene-2 1) 0.045 0.008
3-me-hexene-3 l) 0.020 - 0.009
4-me-pentene-2 0.024 - 0 .013
4-me-hexene-2 0.060 0.028
2-2-di-me-hexene-3 0.103 - 0.020
3-4-di-me-pentene-2 0.044 0.029
4-4-di-me-pentene-2 0.105 - 0.008
l) The nomenclature assigned by the American Petroleum
Institute has been reversed in this Table.
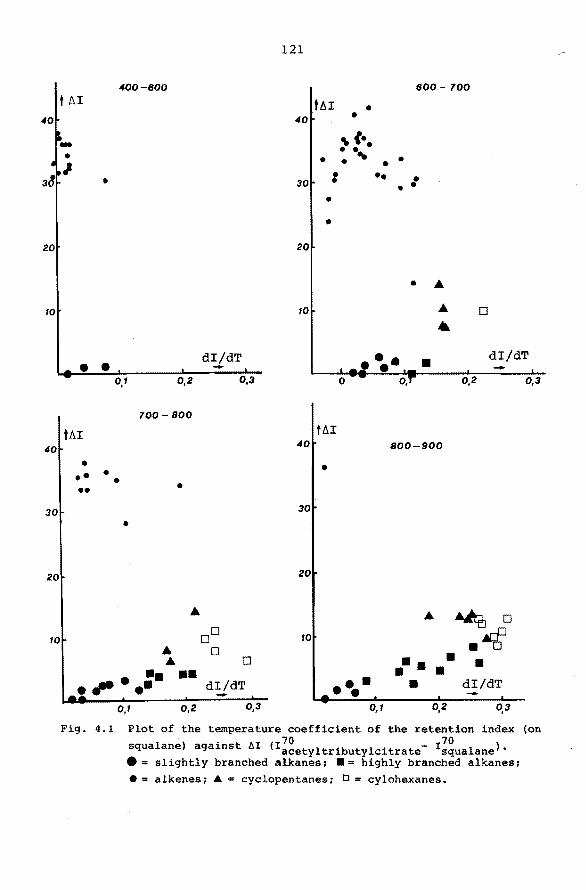
121
400-600 600 100
t AI fl\I • 40 40 •
- '(•. • • .. " •
' • •
38 • •• • • • 30 • • • •
20 20
• ....
10 10 .... D
• dI/dT • dI/dT
• • -0,1 0,2 0,3 0,2 0,3
100-800
tAI tAI 40 40 800-900
• • •• • • •• • 30 30
•
20 20
.... 10 10
~ D
• :.it1 .... .... • •• •• . " ..
0,1 0,2
D
dI/dT - 0,3 • •••
0,1
•• • • • •
0,2
• dI/dT
Fig. 4.1 Plot of the temperature coefficient of the retention index {on . 70 70
squalane) against AI {Iacetyltributylcitrate- 1squalane>· •= slightly branched alkanes1 •= highly branched alkanes; • = alkenes; .& = cyclopentanes; a = cylohexanes.
122
It can be concluded from these results that dI/dT of
cis alkenes is higher than of the corresponding trans
isomers, independent of the elution order. For 2 and 3 alke
nes the trans configuration is eluted first, for mono and
dimethyl alkenes the elution order is reversed. In this way
it was found that the nomenclature assigned by the American
Petroleum Institute should be reversed for 3-me-hexene-2
and 3-me-hexene-3. This conclusion is confirmed by several
authors in a different way (5,6,12-14).
123
4.6 POTENTIALITIES OF PRECISION GAS CHROMATOGRAPHY FOR THE
QUALITATIVE ANALYSIS OF COMPLEX MIXTURES OF HYDROCARBONS.
4.6.1 Introduction.
The use of different temperatures and of different columns
adds considerably to the final characterization. The possibility
of coincidence of various retention data can be greatly reduced in this way.
A difficulty in the application of columns of different
polarity, for the analysis of complex mixtures, is the recogni
tion of corresponding peaks, which is cómplicated because of
peak inversion.
To solve this problem a system was developed, consisting
of two open-hole tubular columns (length > 75 m, i.d. 0.25 nun)
of different polarity, placed in series. The components eluted
from the first column may be selectively transferred to the sec
ond column of different polarity. The system has no valves in
the sample path, so that the dead volume associated with the use
of valves in the sample path is eliminated. The possibility of
absorption of sample components in lubricants of low friction
plastics is also eliminated.
The system is based on the principle of counter pressuJ:ëe
and on venting between the columns (15-17). The magnitude of the
counter pressure and the resistance of the vent have to be care
fully adjusted to the resistance of both columns and the resis
tance of the connections. In the case of complex mixtures, compounds which show a poor resolution or which are not resolvéd at all on the first column, can be separated and characterized
on the second column. The precision of the retention data obtained with the sys
tem is of the same order .as the precision obtained with single
columns (s.d. < 0.05 index units), as will be demonstrated on
some examples in the following. The system can also be applied
for qualitative analysis of trace components.
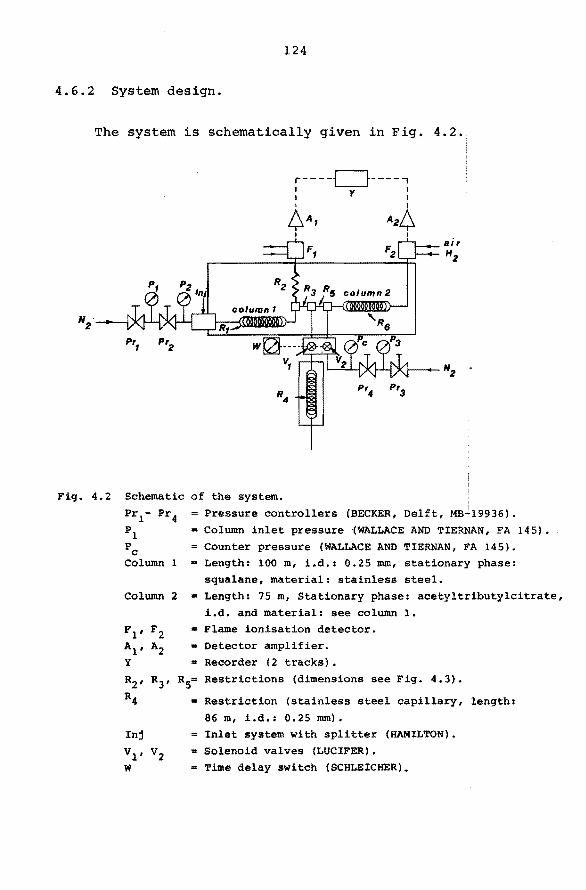
124
4.6.2 System design.
N· a
The system is schematically given in Fig. 4.2.
r----c=J-----, : y : 1 1
~A1 Aa~ 1 1
BIT
c___1-- Ha .--~~~~~-+~~~~~~~--!-.
Fig. 4.2 Schematic of the system.
Pr1- Pr4 = Pressure controllers (BECKER, Delft, MBJ19936). P1 = Column inlet pressure -(WALLACE AND TIERNAN, FA 145). Pc Counter pressure (WALLACE AND TIERNAN, FA 145). Column 1 • Length: 100 m, i.d.: 0.25 mm, stationary phase:
Column
Fl' F2
Al' A2 y
R2' R3' R4
Inj
vl, v2 w
2
squalane, material: stainless steel. = Length: 75 m, Stationary phase: acetyltributylcitrate,
i.d. and material: see column 1.
= Flame ionisation detector. Detector amplifier.
=Recorder (2 tracks). Rs= Restrictions (dimensions see Fig. 4.3).
Restriction (stainless steel capillary, length: 86 m, i.d.: 0.25 mm). Inlet system with splitter (HAMILTON).
Solenoid valves (LUCIFER). = Time delay switch (SCHLEICHER).
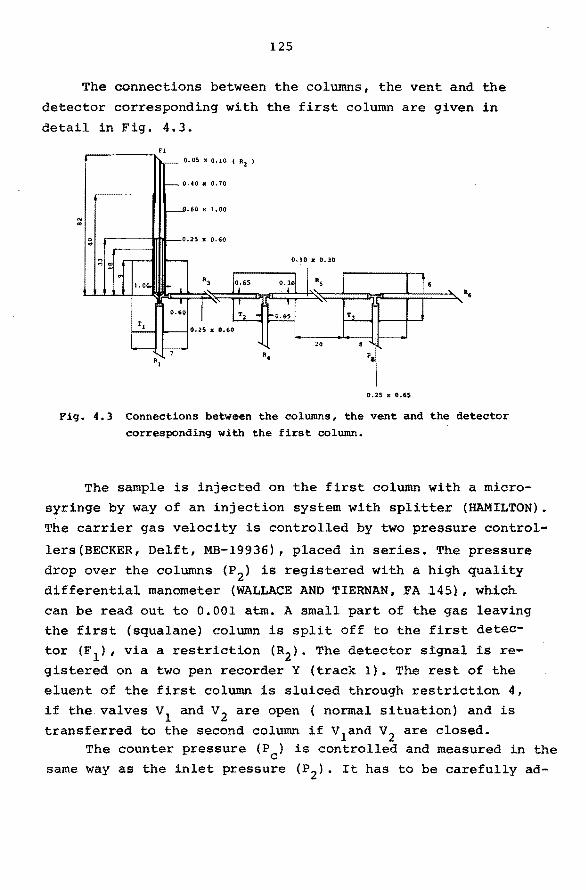
125
The connections between the columns, the vent and the
detector corresponding with the first column are given in
detail in Fig. 4.3.
N
"
----~Fl 0.05 x 0.10 ( a
2 )
0"40 x 0.70
"&o x 1~00
0.2S x 0~65
Fig. 4.3 Connections between the columns, the vent and the detector corresponding with the first column.
The sample is injected on the first column with a micro
syringe by way of an injection system with splitter (HAMILTON).
The carrier gas velocity is controlled by two pressure control
lers (BECKER, Delft, MB-19936), placed in series. The pressure
drop over the columns (P2) is registered with a high quality
differential manometer (WALLACE AND TIERNAN, FA J.45}, which
can be read out to 0.001 atm. A small part of the gas leaving the first (squalane) column is split off to the first detector (F1), via a restriction (R2). The detector signal is re
gistered on a two pen recorder Y (track 1). The rest of the
eluent of the first column is sluiced through restriction 4, if the valves v1 and v2 are open ( normal situation) and is
transferred to the second column if v1and v2 are closed. The counter pressure (Pc) is controlled and measured in the
same way as the inlet pressure (P2). It has to be carefully ad-
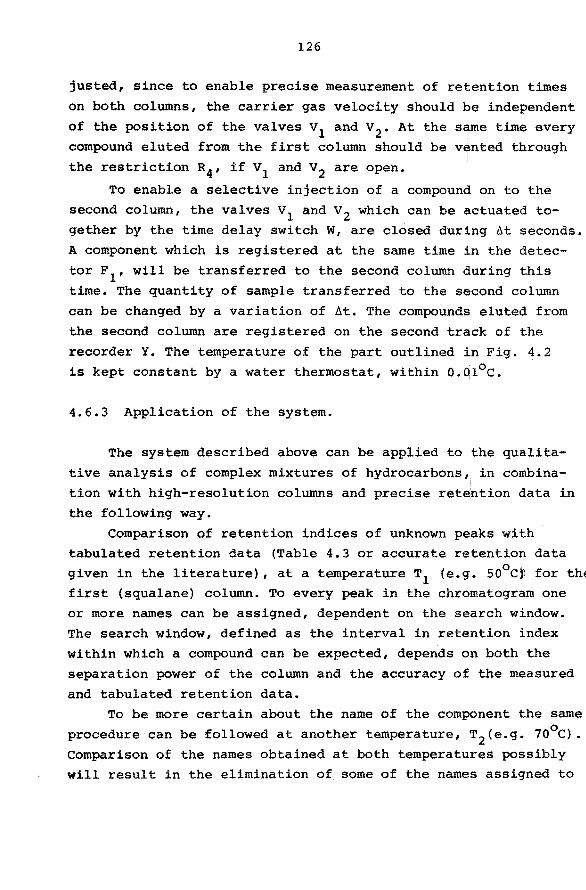
126
justed, since to enable precise measurement of retention times
on both columns, the carrier gas velocity should be independent
of the position of the valves v1 and v2 • At the same time every
compound eluted from the first column should be vented through
the restriction R4 , if v1 and v2 are open.
To enable a selective injection of a compound on to the
second column, the valves v1 and v 2 which can be actuated to
gether by the time delay switch W, are closed during ót seconds.
A component which is registered at the same time in the detec
tor F1 , will be transferred to the second column during this
time. The quantity of sample transferred to the second column
can be changed by a variation of 8t. The compounds eluted from
the second column are registered on the second track of the
recorder Y. The temperature of the part outlined in Fig. 4.2 is kept constant by a water therrnostat, within o.01°c.
4.6.3 Application of the system.
The system described above can be applied to the qualita
tive analysis of complex mixtures of hydrocarbons, in combina
tion with high-resolution columns and precise retention data in
the following way.
Comparison of retention indices of unknown peaks with tabulated retention data (Table 4.3 or accurate retention data
given in the literature), at a temperature Tl (e.g. 50°C~ for thE first (squalane) column. To every peak in the chromatogram one
or more narnes can be assigned, dependent on the search window. The search window, defined as the interval in retention index
within which a compound can be expected, depends on both the
separation power of the column and the accuracy of the measured
and tabulated retention data. To be more certain about the name of the component the same
0 procedure can be followed at another ternperature, T2 (e.g. 70 C).
Comparison of the names obtained at both temperatures possibly will result in the elimination of some of the names assigned to
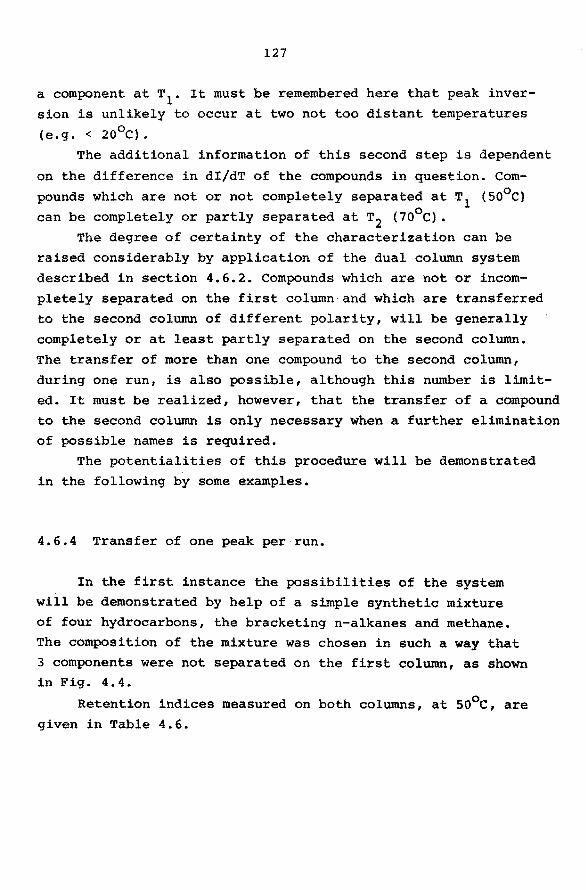
127
a component at T1 • It must be remernbered here that peak inver
sion is unlikely to occur at two not too distant temperatures 0 (e.g. < 20 C).
The additional information of this second step is dependent
on the difference in dI/dT of the compounds in question. Com
pounds which are not or not completely separated at T1 (S0°c)
can be completely or partly separated at T2 (7o0 c) • The degree of certainty of the characterization can be
raised considerably by application of the dual column system
described in section 4.6.2. Compounds which are not or incom
pletely separated on the first column and which are transferred
to the second column of different polarity, will be generally
completely or at least partly separated on the second column.
The transfer of more than one compound to the second column,
during one run, is also possible, although this nurnber is limit
ed. It must be realized, however, that the transfer of a compound
to the second column is only necessary when a further elimination
of possible names is required.
The potentialities of this procedure will be demonstrated
in the following by some examples.
4.6.4 Transfer of one peak per run.
In the first instance the possibilities of the system
will be demonstrated by help of a simple synthetic mixture
of four hydrocarbons, the bracketing n-alkanes and methane.
The composition of the mixture was chosen in such a way that
3 components were not separated on the first column, as shown in Fig. 4. 4.
Retention indices measured on both columns, at so0 c, are
given in Table 4.6.
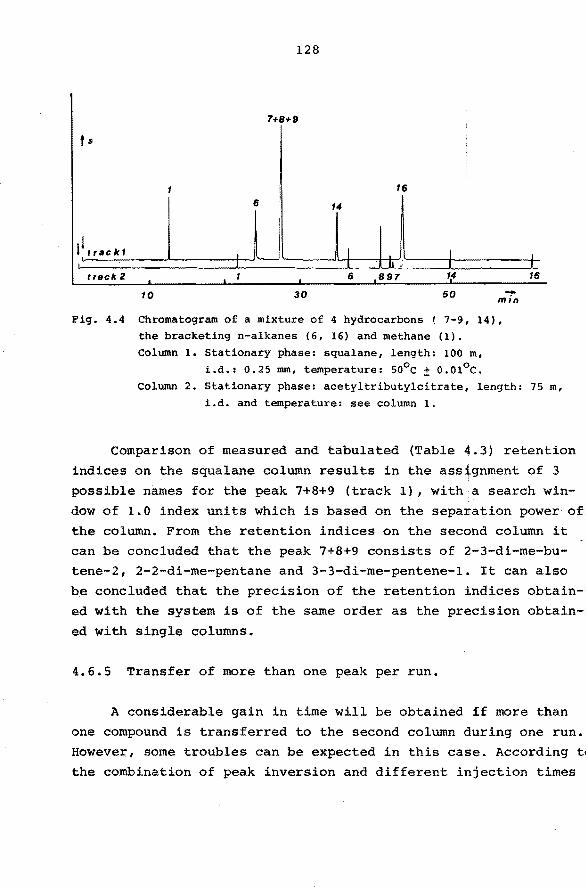
128
7+8+9
f s
1 16
6 14
l 1 rrack1 1 1 1 1 1 Il ; 1
track2 6 897 14
-10 30 50 min
Fig. 4.4 Chromatogram of a mixture of 4 hydrocarbons ( 7-9, 14), the bracketin9 n-alkanes (6, 16) and methane (1). Column 1. Stationary phase: squalane, length: 100 m,
i.d.: 0.25 mm, temperature: so0 c ± o.01°c.
1 1
16
Column 2. Stationary phase: acetyltributylcitrate, length: 75 m, i.d. and temperature: see column 1.
Comparison of measured and tabulated (Table 4.3) retention
indices on the squalane column results in the assignment of 3
possible names for the peak 7+8+9 (track 1), with a search win
dow of 1.0 index units which is based on the separation power of
the column. From the retention indices on the second column it
can be concluded that the peak 7+8+9 consists of 2-3-di-me-bu
tene-2, 2-2-di-me-pentane and 3-3-di-me-pentene-l. It can also
be concluded that the precision of the retention indices obtain
ed with the system is of the same order as the precision obtain
ed with single columns.
4.6.5 Transfer of more than one peak per run.
A considerable gain in time will be obtained if more than
one compound is transferred to the second column during one run.
However, some troubles can be expected in this case. According b
the combination of peak inversion and different injection times
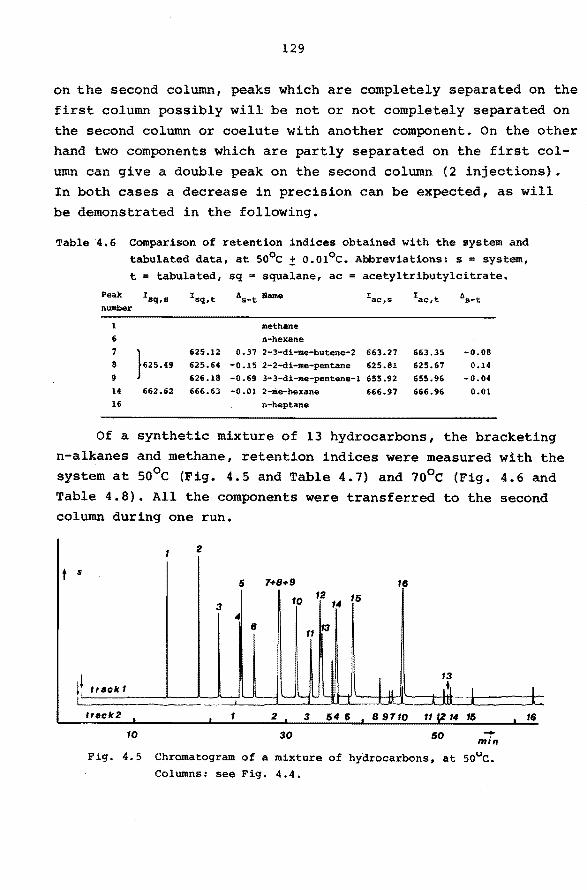
129
on the second column, peaks which are completely separated on the first column possibly will be not or not completely separated on the second column or coelute with another component. On the other hand two components which are partly separated on the first column can give a double peak on the second column (2 injections). In both cases a decrease in precision can be expected, as will be demonstrated in the following.
Table 4.6 comparison of retention indices obtained with the system and tabulated data, at SOOC ± 0.01°c. Abbreviations: s = system, t = tabulated, sq • squalane, ac = acetyltr!butylcitrate.
Peak 1sq,s 1sq,t As-t Name 1ac,s 1ac,t 6s-t numl:>er
l methane 6 n-hexane 7
}625.0
625.12 0.37 2-3-di-me-butene-2 663.27 663.35 -0.08 8 625.64 -0.15 2-2-di-me-pentane 625.81 625.67 0.14 9 626.18 -0.69 3-3-di-me-pentene-l 655.92 655.96 -0.04 14 662.112 666.63 -0.01 2-me-hexane 666.97 666.96 0.01
16 n-heptane
Of a synthetic mixture of 13 hydrocarbons, the bracketing n-alkanes and methane, retention indices were measured with the system at so0 c (Fig. 4.5 and Table 4.7) and 10°c (Fig. 4.6 and Table 4.8). All the components were transferred to the second column during one run.
2
t s 5 7+8•9 16
fO 12 15
3 '" 4 6 11 13
11 l u
13 lrack1 1•1 1 1 I' -~ '-- '- ~ -. n " l '" 1 l
frackZ f 2 3 54 6 8 9710 11 14 15 16
10 30 50 -mif'I
Fig. 4.5 Chromatogram of a mixture of hydrocarbons, at 50uC. Columns: see Fig. 4.4.
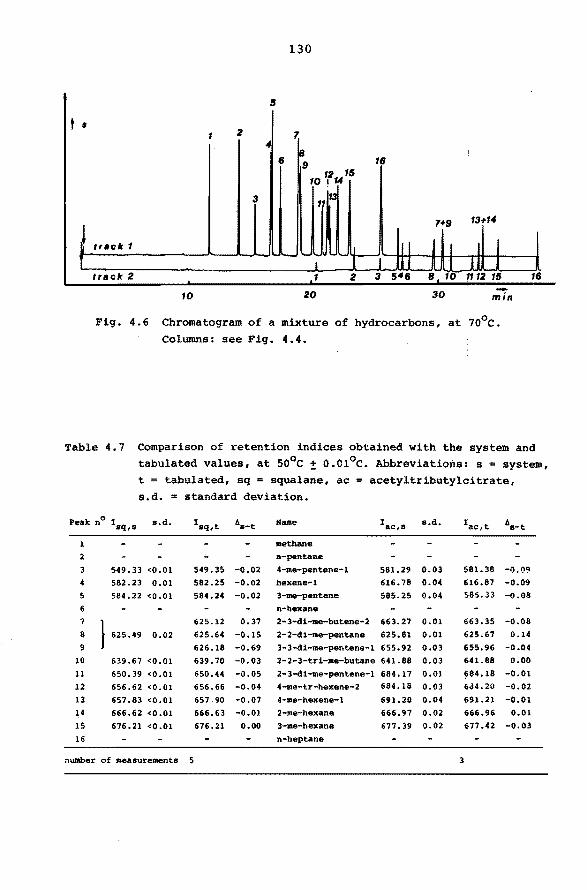
130
5
t s 2 f 7.
-4 8
6 9 16 12 16
10 ! 14
3 111J
7+9 13+14
l track 1 11 J 1 1 1 1 - ._ ...
1 l 11 n 1 Il 1 traelc 2 1 2 3 546 8 10 1112 15 16
10 20 30
Fig. 4.6 Chromatogram of a mixture of hydrocarbons, at 7o0 c. Columns: see Fig. 4.4.
Table 4.7 Comparison of retention indices obtained with the system and tabulated values, at so0 c t o.c1°c. Abbreviations: s = system, t = tabulated, sq = squalane, ac = acetyltributylcitrate, s.d. = standard deviation.
0 Peak n Isq,s s.d.
l
2
3
4
5 6
7
8
9
10
ll
12
13 14
15
16
549.33 <0.01
582.23 0.01
584.22 <0.01
} 625.49 0.02
639.67 <0.01
650.39 <0.01
656.62 <0.01
657.83 <0.01
666.62 <0.01
676.21 <0.01
number of measurements 5
Name
methane
n-pentane
549.35 -0.02 4-me-pentene-l
582.25 -0.02 hexene-1
584.24 -0.02 3-me-pentane
581.29 0.03
616.78 0.04
585.25 0.04
625.12 0.37
625.64 -0.15
626.18 -0.69
639.70 -0.03
650.44 -0.05
656.66 -0.04
657.90 -0.07
666.63 -0.01
676.21 o.oo
n-hexane
2-3-di-me-butene-2 663.27 0.01
2-2-di-me-pentane 625.81 0.01
3-3-di-me-pentene-l 655.92 0.03
2-2-3-tri-me-butane 641.88 0.03
2-3-di-me-pentene-l 684.17 0.01
4-me-tr-hexene-2 684.18 0.03
4-me-hexene-l
2-me-hexane
3-me-hexane
n-heptane
691.20 0.04
666.97 0.02
677.39 0.02
581.38 -0.09
616.87 -0.09 585.33 -0.08
663.35 -0.08
625.67 0.14
655.96 -0.04
641.88 0.00
~84.18 -0.01 6d4.20 -0.02
691.21 -0.01
666.96 0.01
677.42 -0.03
3
131
It must be realized that the elution order of the components
on the second column (track 2) and the order of size of the reten
tion indices can be reversed, because of interaction of peak in
version and different injection times on the second column. This
is clearly demonstrated in Table 4.7 and 4.8.
Table 4.8 Comparison of retention indices obtained with the system and
tabulated data, at 7o0 c ± o.01°c. Abbreviations: see Table 4.7
Peak n° I s.d. sq,s
2
4
5
6
7
8
9
10
11
12
13
14
15
16
550.37 0.02
582.75 0.02
585.14 0.01
625.67 0.01
628.40 0.01
642.64 0.01
652.19 0.01
657.36 0.01
659.19 0.01
666.93 0.01
676.93 0.01
Name
methane
n-pentane
550.36 0.01 4-me-pentene-l
582.73 0.02 hexene-1 585.14 0.00 3-me-pentane
n-hexane 625.65 0.02 2-3-di-me-butene-2
626.95 2-2-di-me-pentane
Iac,s s.d.
582.09 0.05
616.95 0.04
586.18 0.05
663.25 0.16
626.57 0.27
628.52 -0.12 3-3-di-me-pentene-l 656.62 0.35 642.59 0.05 2-2-3-tri-me-butane 644.98 0.07
652.23 -0.04 2-3-di-me-pentene-l 685.53 0.05
657.40 -0.04 4-me-tr-hexene-2 687.07 0.04
659.25 -0.06 4-me-hexene-l
666.96 -0.03 2-me-hexane 676.94 -0.01 3-me-hexane
n-heptane
692.09 0.31 667.22 0.10
677.96 0.04
number of measurements 4 4
582.03 0.06 617.05 -0.10
586.29 -0.11
663.35 -0.10 626.96 -0.39 658.07 1.45
645.06 -0.08
685.68 -0.13
687.10 -0.03
692.24 -0.15 667.20 0.02
678.11 -0.15
In spite if the incomplete separation of the components
4,5 and 12,13 on the first column, the influence of peak shift
is only slightly noticeáble for the last two components, at so0 c. The effect of peak inversion of the components 4 and 5 is so
large that they are completely separated on the second column,
at both temperatures. The components 13 and 14, however, are co
eluted at 7o0 c, resulting in a decreased precision, especially
for component 13.
For the components 7,8 and 9 these problems are much more
complicated. At so0 c, only one peak can be observed for these
components. The retention index on the squalane column is strongly influenced by the peak shift (section 2.6.3.). Nevertheless
132
these components can be characterized,since they a~e completely
separated on the second column (track 2).
Because of a different dI/dT these components are partly
separated on the squalane column, at 70°c. Notwithstanding that
they are hardly separated, the influence of peak shift, on this
column, is very small for the components 7 and 9. Interaction of
peak inversion and different injection times on the second column, at 7o0 c, result in co- elution of component 7 and 9. For
component 8 a double peak is found. In bo~h cases the precision
is considerably decreased. This can be explained a~ fellows.
The transfer of a peak to the second column is started at
the moment a peak maximum is observed from the first cmlumn.
Because the peaks 7, 8 and 9 are transferred to the second col
umn during one run, component 8 is injected 2 or 3 times, depen
dent on the difference in retention time of these components
and the width of the injection (At, the time during which the
valves v1 and v2 are closed).
From the foregoing it may be concluded, that a lirnited
number of cornponents can be transferred during one run,
if they are completely separated on the first coluinn.
4.7 REFERENCES.
1. Data Sub-committee of the G.C. Discussion Group
of the institute of Petroleum. J.of Gaschrornatog.,
No. 1, (1966), 1. 2. Loewenguth J.C. 5th International Symposium on
Separation Methods, Ed, Koväts E., Swiss Chemist Association, 1969, p. 182.
3. Tourres O.A., J. Chromatog. 30, (1967), 357. 4. Loeuwenguth J.C. and Tourres D.A., Zeitschr. f.
Anal. Chemie, 236, (1968), 170.
5. Hiveley R.A. and Hinton R.E., J. of Gaschromatog.
6, (1968), 203.
133
6. Matukuma A., 7th International Symposium on Gas
Chromatography and its Exploitation, Institute of
Petroleum, 1968, paper 4, p. 17.
7. Sojäk L. and Bucinska A., J. Chromatog., 51, (1970),
75.
8. Schomburg. G. and Henneberg D., Chromatographia 1,
(1968), 23.
9. Cramers C.A., Thesis, University of Technology,
Eindhoven, 1967.
10. Cramers C.A., Rijks J.A., Pacäková V. and de
Andrade I., J. Chromatog. 51, (1970), 13.
ll. Kovä.ts E., Helv. Chim. Acta, 41, (1958), 1915.
12. Walraven J.J., Thesis, University of Technology,
Eindhoven, 1968.
13. de Haan J.W. and van de Ven L.J.M. Org. Magn.
Res. in Press.
14. Walraven J.J. and Ladon A.W. 11Gaschromatography
1970", ed. R. Stock, p. 358.
15. Deans D.R. Chromatographia 1, (1968}, 18.
16. van den Berg J.H.M., Internal Report, University
of Technology, Eindhoven, 1973.
17. Diependaal J.P., Ibid, 1971.
18. Schomburg G. to be published.
134
APPENDIX
Since the beginning of gas chromatography many sug
gestions for expressing retention data have been proposed
by several authors and committees, in order to enable the
general use of published retention data. Every method has
advantages and disadvantages and wil! be discussed brief
ly in the following.
The most direct way to determine the location of a
peak in a chromatogram is the retention time (tR). This
is the tilne elapsed between the injection of a sample
and the appearence of the maximum of each peak. The reten
tion time is dependent on most of the experimental parame
ters (e.g. temperature, carrier gas velo<:::ity, column
length etc.). It is not suitable for comparison of reten
tion data between laboratories and is even difficult to
reproduce in the same laboratory on another instrument • •
Adjusted retention time, tR is the time elapsed be-
tween the appearence of a not retarded peak and the peak
in question. It can be obtained subtracting the gas hold
up time (tm) from the retention time. It suffers from the
most disadvantages of the retention time, but is suitable
to calculate relative retention time, the capacity ratio
and other retention data. • The capacity ratio, defined as k = tR/tm, has the ad-
vantage of being directly related to the partition coeffi
cient, K, by the relation k = K.V5/vm, where Vs and Vm re
present the volumes of the stationary and the mobile pha
ses, respectively. On account of its direct relation to the
partition coefficient, this should be a useful method of
presentation in all cases. Since the phase-volume ratio is
difficult te control it cannot be expected to be very repro
ducible.
135
The specific retention volume, v0, introduced by g
Littlewood (1) in order to make retention data independent
on temperature, amount of stationary phase in the column,
carrier gas f low-rate and pressure drop over the column, is given by the equation:
tR-tm 3 P 2-1 273 vo = --- • F .-
• :P3-1 (1) g c
ws 2 TK
where ws = the weight of the stationary phase. F c = the volumetrie velocity at the column outlet. p = the ratio of column in- and outlet pressure.
TK the column temperature, in ° Kelvin.
Since the temperature dependance of a compound cannot be
described by this method (reduction to o0 c) and the quan
tity of stationary phase is difficult to determine and may
change during use, it is not widely applicated.
Therefore the most widespread method used to day is
the relative retention, which can be directly calculated
from the chromatogram. The use of relative retention data has the advantage that a number of variables are eliminated
( column length, carrier gas velocity, quantity of stationa
ry phase and volume of the mobile phase) • I.t is also direct
ly related to the partition coefficient. The precision is
dependent on the distance between the peak i and the stan
dard compound s. The relative retention t'ime is defined as
the ratio of the adjusted retention time of a compound i and
an arbitrarely chosen standard substance s:
(2)
Its wide application is limited since there is no agreement
between laboratories about the choice of the standard com
pound.
136
In order to overcome this difficulty Evans and Smith(2)
introduced the theoretica! nonane value (r. 9), where 9 J.,
stands for n-nonane. The retention is first determined to
the closest n-alkane and transferred toa system iniwhich n-nonane is the standard. Although this system has one stan-
dard, the precision of the relativa retention time depends
upon the distance of the primary standard and n-nonane.
Another problem in using relativa retention times is the
temperature dependence of the compounds, which is not line
ar and relatively large.
To overcome the difficulties previously mentioned, Ko
vats (3) proposed the retention index, in 1958, defined as
following:
0.01
• By definition t z
where ti 1
t z
1
<
= =
• 1
log ti - log tz + z ( 3) • 1
log tz+l - log tz
1 ' ti < tz+l
the adjusted retention time of a component
the adjusted retention time of a n-alkane
with z carbon atoms.
tz+l = the adjusted retention time of a n-alkane with z+l carbon atoms.
The relation between the retention index and relativa reten
tion time can be obtained, rewriting equation 3:
log r i,z
log rz+l,z + z (4)
i.
Since that time the Kovats retention index has been advocated by many authors (e.g. 4-7), as a means for standardisation
of retention data. It appears to be widely accepted nowadays.
137
SUMMARY
Potentially, high resolution gas chromatography, which
combines an unsurpassed separation power to minute sample
requirements, is extremely suited for the identification of
volatile organic compounds in complex mixtures. The quantity -7 of sample (< 10 gl, although an advantage in many applic.a""'
tions, almost excludes the use of ancillary techniques, ex
cept rnass spectrometry, for the identification of separated
compounds.
Therefore it is highly desirable to have means availa
ble for the characterization of GC peaks by retention data
only. Sets of collected accurate retention data are essen
tial for this purpose.
A glance at selected recent literature data, however,
reveals a lack of agreement between laboratories amounting
to one to five Kovats retention index units.
Retention values will become more characteristic with
increasing accuracy and separation power of the column.
In this work we have firstly investigated the role of
all of the relevant factors which contribute to the random
error. The most important factors proved to be, fluctuations
of temperature, carrier gas velocity, time measurernent and
quantity of sample.
It is shown that a precision corresponding to a stan
dard deviation of 0.05 index units is attained.
We also set out to reduce the systernatic errors by
studying the role of: the nature of the stationary phase,
p~ak shift through incomplete separation, the non ideality
of the carrier gas, interfacial adsorption, the gas hold
up time. It is dernonstrated that it is possible to reproduce
retention indices to within about 0.2 index units, in other
laboratories.
138
It is also shown that the temperature coeff icient of
the retention index, which is now also available with a
higher accuracy, yields important information both for cha
racterization and stuctural information (e.g. cis~alkenes !
have a consistently higher dI/dT than the trans-alkenes).
A method is found to prepare hi.gh_ resolution capil-
lary columns in a reproducible way and with a homogeneous
film. The effect of adsorption by the column wall is negli
gible.
A list of retention indices of some 170 hydrocarbons
(c4-c9 ) on squalane (non polar) and acetyltributylcitrate
(polar) at 50 and 70°c is presented.
To make the utmost use (for the characterization of
hydrocarbons in complex mixtures) of the combination of
high resolution columns and accurate retention data, a sys
tem is described in which two open-hole tubular columns are
coupled. This system enables the transfer of one or more
selected peaks eluting from (and measured on) the first col
umn to a second column of different polarity. The sample
transfer does not affect the accuracy of the retention data.
139
SAMENVATTING.
Gas chromatografie met kapillaire kolommen is een bij
uitstek geschikte methode voor het identificeren vap vluch
tige organische componenten in complexe mengsels. Het toe
passen van andere analyse technieken, met uitzondering van
massa spectrometrie, voor het identificeren van gescheiden
componenten is practisch uitgesloten door de zeer keine mon
ster grootte (< l0-7g), die overigens in de meeste gevallen
als een voordeel moet worden beschouwd.
Hèt karakteriseren van componenten met alleen gas chro
matografie is daarom van groot belang.
De beschikbaarheid van tabellen met nauwkeurige reten
tie grootheden is hierbij essentieel.
Uit recente literatuur gegevens blijkt echter dat de
overeenstemming van retentie grootheden, gemeten op ver~
schillende laboratoria, veel te wensen overlaat. Zelfs voor
verzadigde koolwaterstof fen liggen de verschillen tussen l
en 5 Kovats retentie index eenheden.
De retentie grootheden zijn meer karakteristiek naar
mate de meetnauwkeurigheid toeneemt en het scheidend vermo
gen van de kolommen groter is.
Door een betere beheersing van de belangrijkste oorza
ken van toevallige fouten (fluctuaties in de kolomtempera
tuur, de draaggas snelheid, de tijdmeting en de monster groot
te) werd, met één kolom en één instrument, een reproduceer
baarheid bereikt overeenkomend met een standaard afwijking
van 0,05 index eenheden.
Dat het mogelijk is de verschillen in retentie index
tussen laboratoria terug te brengen tot ongeveer 0,2 index
eenheden, kon worden aangetoond na het minimaliseren van de
relevante systematische fouten (aard en zuiverheid van de
stationaire fase, onvolledige scheiding, niet idealiteit van
het draaggas, adsorptie aan de fase grensvlakken en de "dode
tijd").
140
Bij de bereikte meetnauwkeurigheid lkan uit de temperatuur
coefficient van de retentie index waardevolle infÓrmatie wor
den verkregen voor het vaststellen van de identiteit en de
structuur van gescheiden componenten ( bijv. de dl/dT van cis
alkenen blijkt systematisch hoger dan de dI/dT van trans-alkenen) •
Een reproduceerbare kolom kwaliteit voor stalen kapillaire
kolommen werd bereikt door het modificeren van bestaande "coat"
methoden. De kolommen hebben een homogeen verdeelde vloeistof
film en de invloed van adsorptie aan de kolomwand is verwaarloosbaar.
Om alle mogelijkheden van de combinatie kapillaire kolom
men en hoge meetnauwkeurigheid ten volle te benutten werd een
systeem ontwikkeld, bestaande uit twee gekoppelde kapillaire
kolommen. Met dit systeem kunnen een of meer geselecteerde
componenten, na het doorlopen van de eerste kolom (waarop ze
ook worden gemeten) worden doorgestuurd naa~ .. de tweede kolom,
met een andere polariteit. De meetnauwkeurigheid van de reten
tie indices op beide kolommen wordt hierdoor niet beinvloed.
141
ACKNOWLEDGMENT.
I want to express my gratitude to many members and
students of the group of Instrumental Analysis for their
helpfulness, enthousiasm and stimulating interest.
Especially I am very grateful to Dr. C.A. Cramers for his stimulating discussions and suggestions and to
E.A.A. Vermeer and F.J.M. Kees for their exactness and
staying-power in the execution of the experiments. I
greatly appreciate the time and effort Miss J.M.J. Sassen
spent typing and preparing the text of this thesis.
Furthermore I would like to thank Dr. J.J. Walraven for
the time he voted correcting the English language and
J.C.G.M. van Rijsewijk for the preparation of the figures.
It is a pleasure to remind the close cooperation
with Dr. P. Bocek, Dr. v. Pacáková and Dr. I Rioeiro de Andrade during their stay in our laboratory. I am very
grateful to their contribution and valuable discussions. To my wife and children I am deeply obliged for
their moral support during my study and the preparation
of this thesis.
142
LEVENSBERICHT.
Op aanbeveling van het college van Dekanen volgt
hier een kort levens:Oericht van de schrijver.
Hij werd geboren te Brunssum 11 februari 1934.
Na het behalen van het diploma H.B.S.-B aan het Bis
schoppelijk College te Sittard fn 19.51, trad hij in
dienst van het Stikstofbindingsbedrijf van de staats
mijnen in Limburg.
Hij was hier werkzaam als analist en begon in
september 1962 als werkstudent met de ingenieursstudie
aan de Technische Hogeschool te Eindhoven, afdeling
Scheikundige Technologie.
Op 22 december 1965 trad hij als laboratorium
assistent in dienst bij de Technische Hogeschool te
Eindhoven. In januari 1970 werd het ingenieursexamen
afgelegd in de afdeling Technologie.
Hierna volgde de benoeming tot wetenschappelijk
medewerker bij de groep Instrumentele Analyse en werd
het afstudeerwerk voortgezet met een onderzoek dat
leidde tot dit proefschrift.
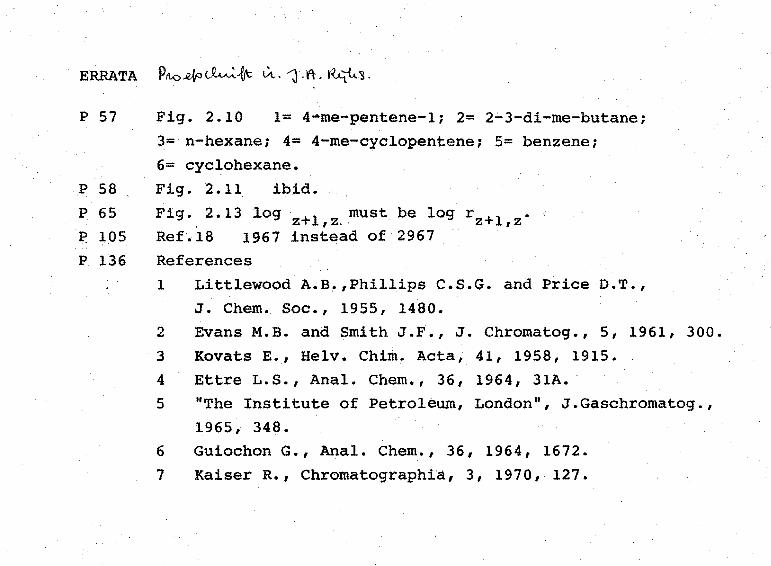
p 57
p 58
p 65
:E> 105
p 136
Fig. 2.10 l= 4"me-pentene-1; 2= 2.;..3-di-me-butane;
3= n-hexane; 4= 4-me-cyclopentene; 5= benzene;
6= cyclohexane.
Fig. 2.11 ibid.
Fig. 2.13 log 1 must be log r 1 • z+ , z.. · z+ ,z Ref.18 1967 instead of 2967
Ref erences
1 Littlewood A.B .• ,Phillips c.s.G. and Price D.T.,
J. Chem. Soc., 1955, 1480.
2 Evans M.B. and Smith J.F., J. Chromatog., 5, 1961, 300.
3 Kovats E., Helv. Chiro. Acta, 41, 1958, 1915.
4 Ettre L.S., Anal. Chem., 36, 1964, 31A.
5 "The Institute of Petroleum, London", J.Gaschromatog.,
1965, 348.
6 Guiochon G., Anal. Chem., 36, 1964, 1672.
7 Kaiser R., Chromatographia, 3, 1970, 127.
STELLINGEN
1 Bij de uitwisseling van retentie gegevens tussen
laboratoria dient rekening te worden gehouden
met het niet ideale gedrag van het draaggas.
2 De door de. ''Commission of Analytical Chemistry''
van de IUPAC voorgestelde definitie van de reten
tie index moet, op grond van de niet lineair1teit
van de log plot voor n-alkanen, worden afgewezen.
International Union of Pure and Applied
Chemistry, Information Bulletin 15, 1973.
3 De door Czeglédy-Janko and Cieleszky gevolgde
methode om het opwerkings rendement van gechloreer
de pesticiden in bloed te bepalen is onjuist.
G. Czeglédy-Janko and v. Cieleszky, Analyst
93, (1968 l, 445.
4 De door Weiss en zijn medewerkers gevonden corre
latie tussen de roost"erconstanten en de biologische
werking van kwarts is aanvechtbaar.
z. Weiss et al., Staub-Reinhalt. Luft, 33,
(19731, 10.
5 De bewering dat de belasting van het milieu in
Nederland door zwaveldioxide en stof daalt is twijfelachtig, omdat ze gebaseerd is op gebrekkige
meetmethoden.
Air Quali ty Criteria for Particulate Matter,
u.s. Dep. of H.E.W. Natl. Air pollut. Contr.
Adm., publication no. AP-49, 111.
D.N.F. Atkins, R.A. Cox and A.E.J. Eggleton,
Nature 235i ( 1972), 372.
6 Bij konformatie berekeningen, zelfs aan eenvoudige 1
moleculen, met behulp van rekenprogramma's, is het
gebruik van moleculaire mechanica te prefereren, boven berekeningen gebaseerd op het MO concept. ·
o. Ermer and s. Lefson,J. Amer. Chem. Soc.,
95, (1973), 4120.
J.R. Hoyland, "Molecular Orbital Studies in Chemical Pharmacology", ed. L.B. Kier, Springer Verlag, 1970.
7 Bij ziektebeelden, die mogelijk veroorzaakt worden
door afwijkingen in de steroid huishouding, verdient
het bepalen van de onderlinge verhouding van de individuele steroiden de voorkeur boven het bepalen
van absolute hoeveelheden of groepen steroiden.
$ Bij het onderwijs en de examinering in de moderne
talen bij het voo~gezet onderwijs, is het gebruik van woorden buiten bestaande referentiekaders voor
taalkundig onderzoek - voor Frans bijvobrbeeld "Francais Fondamental" en "Dictionaire de Juilland"alleen als uitzondering aanvaardbaar.
A.G. Sciarone and L.L. van Maris, Congrès Internationale de Linguistique, Copenhague,
1972.
Eindhoven, ll september 1973. J.A. Rijks.