Embed Size (px)
Citation preview
Characterization of Humic Acid from No-Tilled and Tilled SoilsUsing Carbon-13 Nuclear Magnetic Resonance
G. K. Stearman,* R. J. Lewis, L. J. Tortorelli, and D. D. Tyler
ABSTRACTChemical composition of humic acids is important due to their
reactivity with soil-applied pesticides and fertilizer amendments.Humic acids from continuously (7 yr) no-tilled and tilled cotton,corn, and soybean plots in West Tennessee were characterized by"C-NMR from soils sampled at various depths. Humic acids wereextracted with dilute NaOH solution and purified with KOH-KCLand HCL-HF solution, respectively. NMR solution spectra gener-ated on a Jeol FX 90Q spectrometer (Jeol Co., Tokyo, Japan) weredivided into six regions (0-40, 40-62, 62-105, 105-150, 150-170,and 170-190 ppm) and peak areas compared. Humic acid compo-sition differed by soil depth and crop. Small differences were ob-served between tillage systems. Aliphatic and aromatic carbonsranged from 48 to 65% and 25 to 40% of total peak area, respec-tively. Carboxyl groups of humic acids as determined by "C-NMRranged from 9 to 13%. Humic acids extracted from those soils con-taining larger amounts of C (surface no-tilled treatments) had greateraliphatic to aromatic ratios, perhaps due to earlier stages of decom-position.
SOIL ORGANIC MATTER is a reactive, dynamic com-ponent of soils. The chemical composition of soil
organic matter components could affect pesticide andfertilizer needs. It is important to characterize soil or-ganic matter fractions from long-term soil tillage treat-ments because organic matter is concentrated in a sur-face band in no-tilled soil compared to its evendistribution in the plow layer of conventionally tilledsoils.
Five and ten year tillage studies with corn indicatedthat soil organic matter increased significantly in no-tilled soil compared to conventionally tilled soils(Blevins et al., 1977, 1983). After 2 yr Tyler et al. (1983)found no-till organic matter levels in soybean plotsO.K. Stearman, R.J. Lewis, and D.D. Tyler, Plant and Soil Science,and L.J. Tortorelli, Chemistry Dep., Univ. of Tennessee, Knoxville,TN 37901. Received 27 June 1988. 'Corresponding author.Published in Soil Sci. Soc. Am. J. 53:744-749 (1989).
were significantly higher in the top 5 cm than in con-ventional tillage treatments. Organic matter in the sur-face layer of no-tilled soils is approximately twice thatof tilled soils receiving the same inputs after 5 yr (Phil-lips and Phillips, 1984). It has been clearly establishedthat plowing increases rates of organic matter decom-position in soils (Giddens, 1957).
Soil organic matter is usually extracted and frac-tionated based on solubilities of fulvic acid (FA), sol-uble in both alkali and acid, humic acid (HA), solublein alkali and insoluble in acid, and humin, insolublein both alkali and acid. Recently, there has been aneffort to standardize extraction procedures for humicsubstances by the International Humic Substances So-ciety, (R.L. Malcolm, 1985, personal communication).Much of the research effort has been devoted to frac-tionation schemes, rather than enumerating differ-ences between soil organic matter fractions.
Humic acid elemental composition is usually in therange: C, 53.8 to 58.7%; H, 3.2 to 6.2%; O, 32.8 to38.3%; N, 0.8 to 4.3; and S, 0.1 to 1.5% (Schnitzer andKhan, 1978). The O/C mole ratio for soil HAs is usu-ally about 0.5, while the H/C mole ratio is approxi-mately 1.0 (Steelink, 1985).
Humic and fulvic acids have been characterized bynumerous methods, including elemental analysis, ti-tration of functional groups, and NMR spectrqscopy.Perdue (1985, 1984) stated that because humic sub-stances represent a complex mixture of organic com-pounds, their acidity can only be attributed to a com-plex mixture of nonidentical functional groups.Therefore, only operationally defined estimates of theconcentration of a particular class of acidic functionalgroups can be determined. Schnitzer and Gupta (1965)evaluated the total acidity and carboxyl group titra-tions by discontinuous titrations and decarbdxylation,respectively, and found the titrations to agree.Schnitzer and Preston (1986) compared titrations oftotal acidity and carboxyl groups of HA with both
STEARMAN ET AL.: HUMIC ACID FROM NO-TILLED AND TILLED SOILS 745
solid and liquid state 13C-NMR spectra. They reportedNMR determinations of carboxyl groups agreed moreclosely with total acidity titrations than with carboxylgroup titrations. Solid state NMR carboxyl values weregreater than those of liquid state NMR. Therefore,NMR spectra of HA in liquid or solid form need tobe interpreted cautiously as a quantitative tool (New-man et al, 1980; Wilson, 1981; Newman and Tate,1984). If NMR instrumental parameters are constantfor all samples, NMR can offer structural informationthat is useful when comparing HAs.
Calderoni and Schnitzer (1984) reported yields ofpurified HA-C from 8.9 to 32.9% of total C of sixpaleosols in Southern Italy, while FA yields were lessthan 1%. The aromaticity of the paleospl HAs waslarge (68-88%) when compared to aromaticities of soilHAs determined by Hatcher et al. (1981), who re-ported aromaticities between 43 and 92% for nine HAsfrom soils in Japan, Argentina, and Italy. In both casescomposition of soil HA was determined by liquid state13C-NMR spectroscopy.
Preston et al. (1987) reported differences in com-position of organic matter of virgin and cultivated or-ganic soils using solid-state 13C CPMAS (Cross Polar-ization Magic Angle Spinning) NMR. Cultivated siteshad less carbohydrate and more lipid and methoxyl Cthan did the virgin sites. Wilson et al. (1986) dem-onstrated that lignin was not a prerequisite for aro-matic components in soil and that due to slow ratesof decomposition in Antarctic soil, the FA fractionwas almost entirely carbohydrate. They attempted toexplain variations in soil aromaticity and carbohy-drate concentrations and found climate and vegeta-tion to be important factors. Schnitzer and Preston(1987) divided solution state 13C-NMR spectra intosix regions and compared aliphatic C (0-105 ppm) toaromatic C (105-170 ppm) using various HA extrac-tants. The carboxyl region was reported as the areabetween 170 and 190 ppm.
The objectives of this study were to compare soilorganic matter fractions and characterize HA of no-tilled and tilled cotton (Gossypium hirsutum L.), corn(Zea mays L.), and soybean (Glycine max (L.) Merr.)cropped surface soils that had the same 7-yr manage-ment scheme.
MATERIALS AND METHODSOrigin and Extraction of Soil Organic Matter
Soil samples were collected from surface horizons of no-tilled and tilled continuous 7-yr soybean and cotton plots atthe West Tenn. Agric. Exp. Stn. in Jackson, Term, and fromcorn plots at the Ames Plantation near Bolivar, Tenn. Thesoil at Jackson was a Lexington silt loam (fine, silty, mixed,thermic, Typic Paleudalfs) and at Ames, Loring silt loam(fine, silty, mixed, thermic, Typic Fragiudalfs). Soil C rangedfrom 5.7 to 47.2 g kg"1 C and pH 4.8 to 7.2. Soil was sampledfrom 0- to 1-, 1- to 2-, and 7.5- to 15.0-cm depths afterremoval of stubble mulch. Humic and fulvic acids were ex-tracted from air-dried soil ground to pass a 0.25-mm sieve,based on the procedure recommended by the InternationalHumic Substances Society (R.L. Malcolm, 1985, personalcommunication). Humic acid was purified as proposed byMalcolm (1976).
Extraction and purification procedures were as follows: 90g of air-dry soil was shaken for 30 min with 50 mL of 1.0
mol L-' HC1 and 850 mL of 0.1 mol L-' HC1, allowed tosettle for 2 h and centrifuged (1800 X g) for 10 min. Analiquot of the supernatant was saved for analysis of solublefulvic acid C. The supernatant was decanted, and 70 mL of1.0 mol L-' NaOH was added to the soil followed by theaddition of 830 mL of 0.1 mol L;1 NaOH. Nitrogen gas wasbubbled into the bottles for 2 min and the soil shaken for 8h and allowed to settle overnight. The soil was centrifugedfor 10 min at 1800 X g, and the supernatant decanted intoanother 1 L centrifuge bottle and acidified to pH 1 with 6.0mol L"1 HC1 to precipitate HA. A sample of extracted soilwas saved and acidified with 0.1 mol L~' HC1, then dried inan oven at 105 °C and analyzed for nonextracted C. Theextracted HA and FA was centrifuged and an aliquot of thesupernatant saved for FA analysis. Suspended clays wereremoved by dissolving HA in a minimum volume of 0.1mol L'1 KOH under N2 and adding KC1 to make the system0.3 mol L-' in K. Nitrogen gas was bubbled into the con-tainers and they were allowed to stand for 4 h. Suspendedsolids were removed by centrifugation. The clear HA solu-tion was acidified to pH 1 and the HA allowed to coagulate.Coagulated HA was separated by centrifugation and shakenrepeatedly for 24 h at room temperature with a solution of0.1 mol L-' HC1 and 0.3 mol L-' HF. The HA was washedwith small aliquots of deionized water to remove chlorideions, freeze-dried, and stored in a desiccator over P2O5 atroom temperature.
Analytical MethodsSoil pH was determined with a glass electrode pH meter
and 1:1 soil to water ratio by volume, (McLean, 1982). Cat-ion exchange capacity was calculated by summation of ex-changeable cations measured by the ammonium acetatemethod (Thomas, 1982; and Yuan, 1959). Calcium, Mg, andK were determined by atomic absorption. Carbon in the soiland HA was determined with a Leco Carbon DeterminatorCR12 (Leco Corp., St. Joseph, MI) by dry combustion (Nel-son and Sommers, 1982). The amount of C in FA extractswas measured using a Beckman Total Organic Carbon Ana-lyzer, Model 915-B (Beckman Instruments, Fullerton, CA).Nitrogen and H were determined on HA by dry combustionusing a Perkin-Elmer 240 elemental analyzer (GalbraithLaboratories, Inc., Knoxville, Tenn.). Oxygen was calculatedby difference. Moisture content of HA was determined byheating at 105 °C for 24 h and ash by ignition at 750 °C for4 h. Total acidity and carboxyl groups were determined bymethods described by Schnitzer and Gupta (1965). Totalacidity was determined by titration with 0.5 mol L"1 HC1after treatment with 0.1 mol L~' Ba(OH)2 solution. Carboxylgroups were determined by titration with 0.1 mol L~' NaOHafter reaction with 0.5 mol L'1 calcium acetate. All titrationswere replicated two to four times.
The 13C-NMR solution spectra for HA's were determinedon a JEOL FX 90Q spectrometer. The HA sample (100 mg)was dissolved in 2 mL 0.5 mol L-' NaOD. The HA solutionwas mixed on a vortex mixer for 3 min and filtered througha coarse sintered filter. Chemical shifts were measured rel-ative to sodium 3-(trimethylsilyl)propionic acid (TSP). So-lution 13C-NMR spectra were obtained at 22.5 MHz usingdouble precision 16k (k = 1000) data points with a 15015-Hz spectral width. A 45° pulse width with a 0.9-s pulse delaywas used to give an acquisition time of 0.534 s. Optimumconditions were chosen to maximize signal to noise ratio.Between 95 000 and 110 000 scans were collected in theFourier Transform mode requiring 36 to 45 h total acqui-sition time. The spectra were divided into six areas 0 to 40,40 to 62, 62 to 105, 105 to 150, 150 to 170, and 170 to 190ppm, and broadly divided from 0 to 105 ppm, aliphaticcarbons; 105 to 170 ppm, aromatic carbons; and 170 to 190ppm carboxyl carbons. Areas were computed by razor cut-
746 SOIL SCI. SOC. AM. J., VOL. 53, MAY-JUNE 1989
ting the spectra and weighing on a balance to determine totalof each group. Areas were also measured with an area meterusing a video screen. Each complete spectrum area was nor-malized at 100%. Area measurements agreed ± 5% betweenthe two methods employed and results averaged.
RESULTS AND DISCUSSIONChemical characteristics and amounts of extractable
C of 13 soil samples are presented in Table 1. Soilscropped to soybean had a more neutral pH than didthose cropped to cotton and corn. The no-tilled cotton
Table 1. Soil chemical characteristics and extractable C fractions.
Treatment pH CEC Total C% of total
C extracted
% of soil C
FA HA HA-clay
cmolc
Corn, NTfCorn, TfSoybean, NTSoybean, TCotton, NTCotton, T
6.16.37.27.25.35.1
kg-'
11.5nd
13.89.4
10.7nd
gkg-'Depth 0-2
21.76.1
19.47.3
15.710.8
cm392933283131
141415111214
155
161088
91028
119
Depth 7.5-15 cmSoybean, NTCorn, TCotton, NT
Vetch cover
Cotton, NTVetch cover
Cotton, NTWheat cover
Cotton, NTVetch cover
Cotton, NTWheat cover
7.17.2
6.1
5.6
6.2
5.1
4.8
10.5nd
8.7
14.6
15.4
8.3
10.5
5.85.7
7.0Depth 0-1
47.2
29.7Depth 1-2
22.1
14.1
4128
37cm
26
25cm
32
28
2115
14
9
11
12
13
205
8
12
11
9
9
08
15
5
3
11
7f NT = No-Tilled; T = Tilled; nd = not determined.
Table 2. Elemental analyses and atomic ratios of purified humicacids on a moisture and ash-free basis.
Atomic ratios
Treatment C H N O H/C 0/C N/C
Depth 0-2Corn, NTCorn, TSoybeans, NTSoybeans, TCotton, NTCotton, T
Soybeans, NTCorn, T
Cotton, NTVetch cover
Cotton, NTWheat cover
Cotton, NTVetch cover
Cotton, NTWheat cover
Means
50.153.351.952.353.156.9
58.850.5
54.9
45.3
53.7
51.852.7±3.4
5.75.65.65.25.65.5
5.45.1
6.1
6.0
5.8
5.45.6
±0.3
cm4.6 39.6 1.374.5 36.6 1.254.9 37.6 1.295.1 37.4 1.195.2 36.1 1.265.2 32.4 1.16Depth 7.5-1 5.0 cm4.4 31.43.1 41.4
Depth 0-1
5.5 33.5
4.9 43.8Depth 1-2
5.7 34.8
4.8 38.04.8 36.7
±0.7 ±3.6
1.101.21
cm
1.33
1.59cm
1.29
1.251.27
±0.12
0.590.520.720.540.510.43
0.400.62
0.61
0.73
0.49
0.550.56
±0.10
0.080.070.080.080.080.08
0.060.05
0.09
0.09
0.09
0.080.08
±0.01
treatments with vetch and wheat covers had the larg-est amounts of total C. The type of soil organic matterin surface no-tilled soils was not as decomposed as themixed tilled soils or the deeper soil samples. The 0-to 1- cm samples had the largest values for both soilorganic matter and cation exchange capacity. The cat-ion exchange capacity and the soil organic matter con-tent of the soil samples decreased with depth. Thepercentage of C extractable ranged from 25 to 41% andincreased with depth in the no-tilled treatments. In allsamples, extracted FA (9 to 21% of total soil C) in-creased in the 7.5- to 15.0-cm depth compared to the0- to 2-cm depth, and some differences were observedin quantities between tillage treatments. Humic acidextracted ranged from 5 to 20% of total C with a smallerfraction of HA extracted from the tilled corn and soy-bean treatments than from the no-tilled treatments,although there was no difference between tillage treat-ments for cotton. The soybean, 7.5 to 15.0 cm sample,had all extractable C associated with FA and purifiedHA; whereas, in corn and cotton samples from com-parable depth, 8 to 15% of total C (29 and 41% ofextractable C) respectively, were HA-clay mixtures.
Hydrogen and N of the purified humic acids (Table2) were higher than those reported by Schnitzer andPreston (1986). The larger ratios of H/C and N/C also
(a)
(b)
(c)
(0)
(e)
(0
200 150 100 50 0Chemical Shift (ppm)
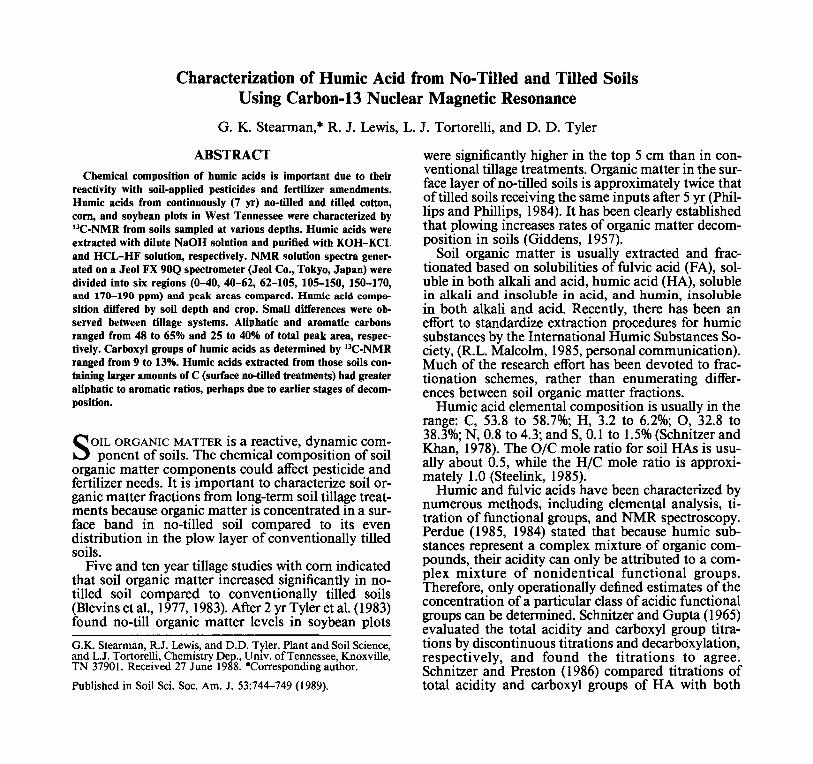
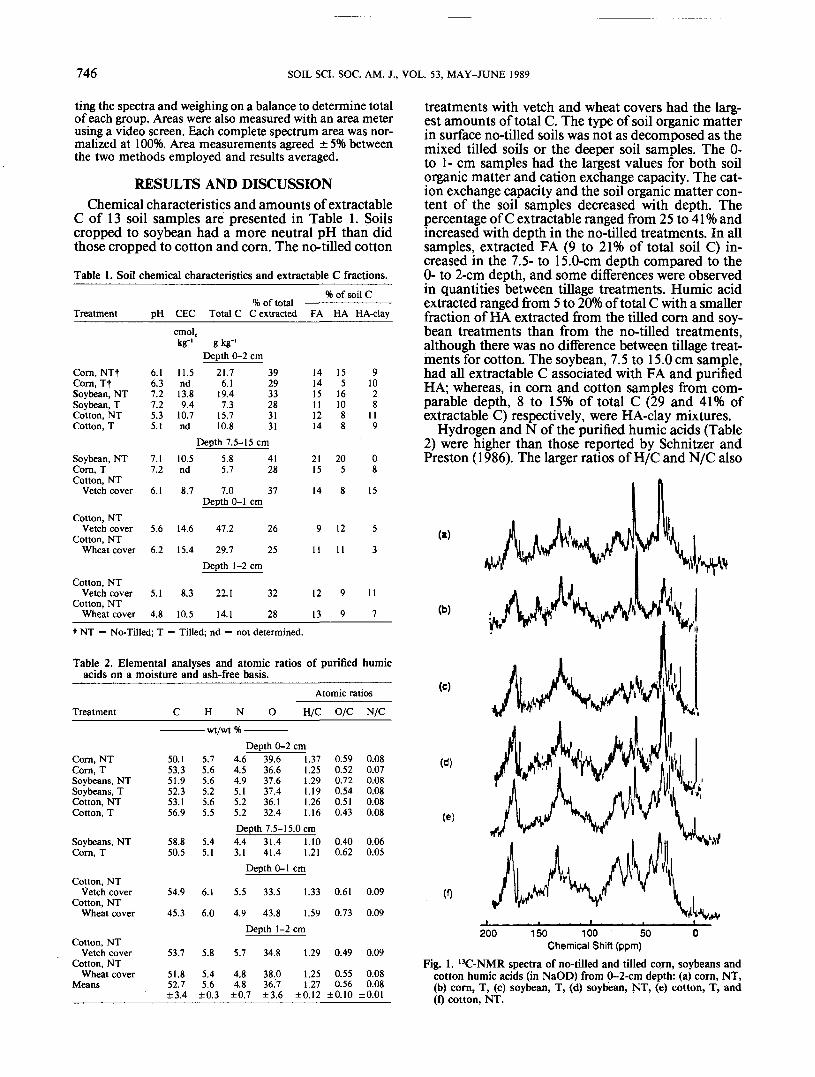
Fig. 1. 13C-NMR spectra of no-tilled and tilled corn, soybeans andcotton humic acids (in NaOD) from 0-2-cm depth: (a) corn, NT,(b) corn, T, (c) soybean, T, (d) soybean, NT, (e) cotton, T, and(f) cotton, NT.
STEARMAN ET AL.: HUMIC ACID FROM NO-TILLED AND TILLED SOILS 747
indicated that these HAs were more aliphatic thanthose characterized by Schnitzer and Preston (1986).These humic acids averaged 56% aliphatic, while thoseof Schnitzer and Preston averaged 46%.
Carboxyl groups in HA, as determined by 13C-NMR,were closer in value to total acidity as measured bytitration than carboxyl group as measured by titration(Table 3). Even though carboxyl groups determinedby 13C-NMR and total acidity by titration were closein value, they were not closely correlated with eachother across different samples. Schnitzer and Preston(1986) reported similar findings on 18 HAs. The totalacidity determinations were larger in tilled comparedto no-tilled treatments and all increased with depth.There was no apparent pattern of carboxyl group con-tent as determined by titration based on tillage or cropvariables.
The I3C-NMR spectra of HA from soils cropped tono-tilled and tilled corn, cotton, and soybean are dis-played in Fig. 1. Due to the lengthy time necessary toobtain interpretable spectra it was not possible to du-plicate 13C-NMR spectra of HA. Therefore spectramust be interpreted cautiously. Quantitative differ-ences between HAs are based on measured differencesin peak area as related to the complete spectrum. Dif-
Table 3. Concentration of humic acid COOH groups by solution-state "C-NMR and titration, and measurements of total acidity.
COOH groups
Treatment
Corn, NTCorn, TSoybeans, NTSoybeans, TCotton, NTCotton, T
Corn, TSoybeans, NTCotton, NT, Vetch cover
Cotton, NT, Vetch coverCotton, NT, Wheat cover
Cotton, NT, Vetch coverCotton, NT, Wheat cover
13C-NMRSolution-state Titration
5.56.07.36.66.76.6
5.38.97.9
6.65.7
7.37.6
Depth 0-2 cm3.63.34.04.13.93.5
Depth 7.5-15.0 cm3.95.03.7
Depth 0-1 cm3.12.9
Depth 1-2 cm3.43.3
Totalacidity
6.68.06.37.56.06.4
8.89.49.1
6.07.6
6.59.8
Table 4. Interpretation of 13C-NMR spectra of humic acid fromcotton, corn, and soybean plots, 0-2-cm depth.
Chemicalshift
ppm
0-4040-6262-105
105-150150-170170-190AliphaticAromaticRatio Al/ArAromaticity
Corn
NT T
Soybean
NT T
Cotton
NT T
————————————— wt/wt % —————————————
27161626
69
60321.9
35
19151731
711
52381.4
42
19132227
71254341.6
39
251417304
1156341.6
38
22172124
51160302.034
241620274
1059311.9
34
ferences are not reported as significant due to lack ofduplications. The gross similarity between no-tilled andtilled treatments was apparent between spectra. Dif-ferences were more pronounced between crops thantillage. However, the sample from corn tilled was morearomatic (105-170-ppm band) than the sample fromcorn no-tilled, which was more aliphatic (0-105-ppm-band). The large peak at 58.1 ppm in corn and cottonTable 5. Interpretation of 13C-NMR spectra of humic acid from
cotton plots.
Cotton, NT,vetch cover
Depth increment.
shift
ppm
0-4040-6262-105
105-150150-170170-190AliphaticAromaticRatio Al/ArAromaticity
0-1
28151922
51063282.331
1-2
291718224
11
64252.529
7.5-15.0
—— wt/wt % —
181417328
1248401.2
46
Cotton, NT,wheat cover
cm
0-1
301718223
1065252.628
1-2
21151927
71255331.7
38
(a)
(b)
(c)
(d)
200 150 100Chemical Shift (ppm)
50
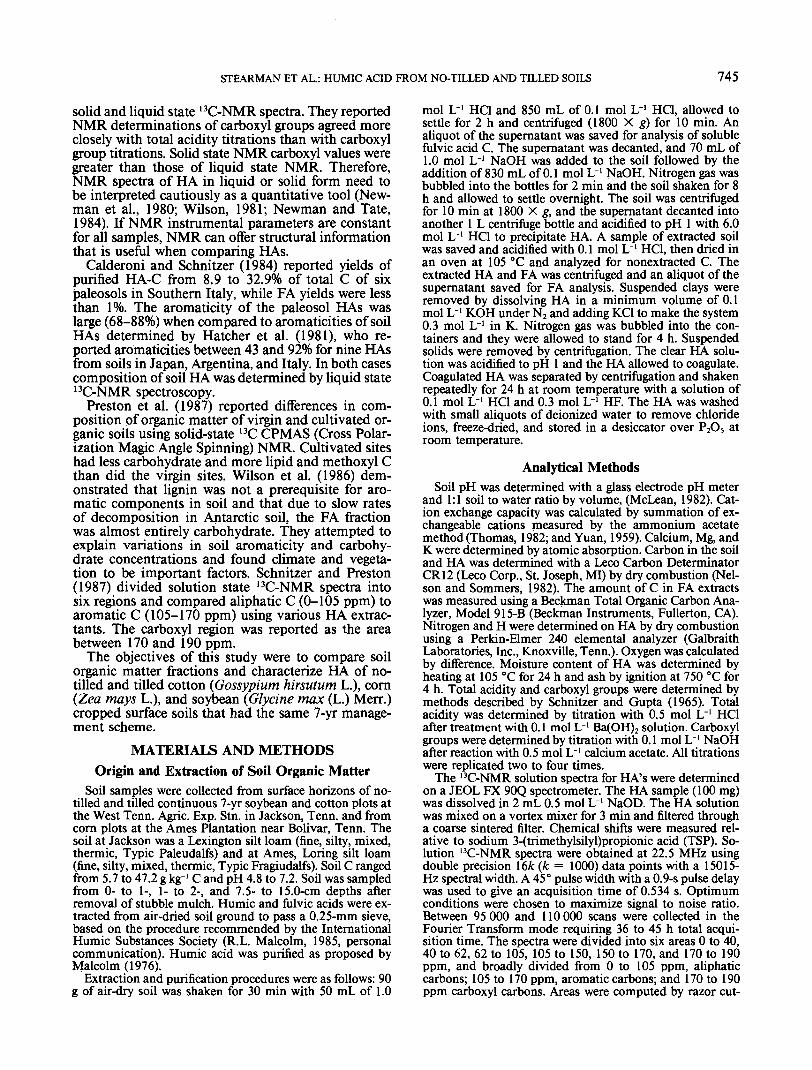
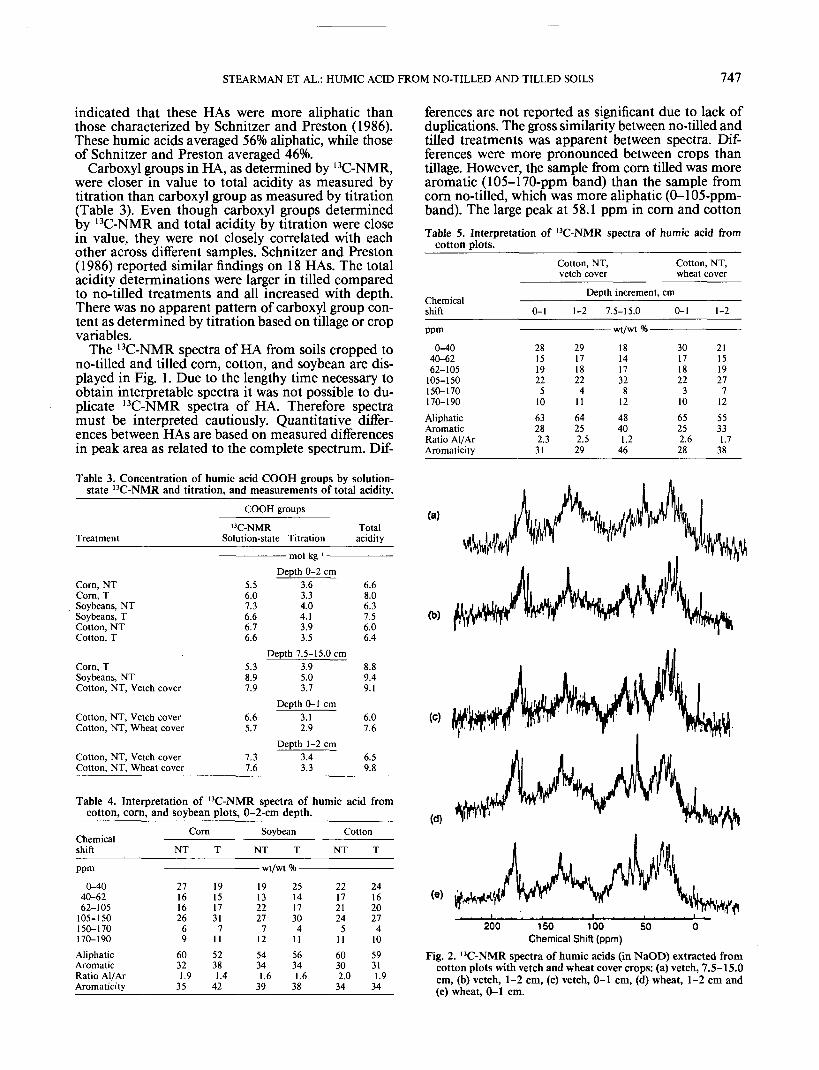
Fig. 2. 13C-NMR spectra of humic acids (in NaOD) extracted fromcotton plots with vetch and wheat cover crops: (a) vetch, 7.5-15.0cm, (b) vetch, 1-2 cm, (c) vetch, 0-1 cm, (d) wheat, 1-2 cm and(e) wheat, 0-1 cm.
748 SOIL SCI. SOC. AM: J., VOL. 53, MAY-JUNE 1989
3.0
2.5
|2.0-
1.5-
1.0
y = 1.3069 + 0.0294x R-0.75
10 4020 30Carbon g kg-1
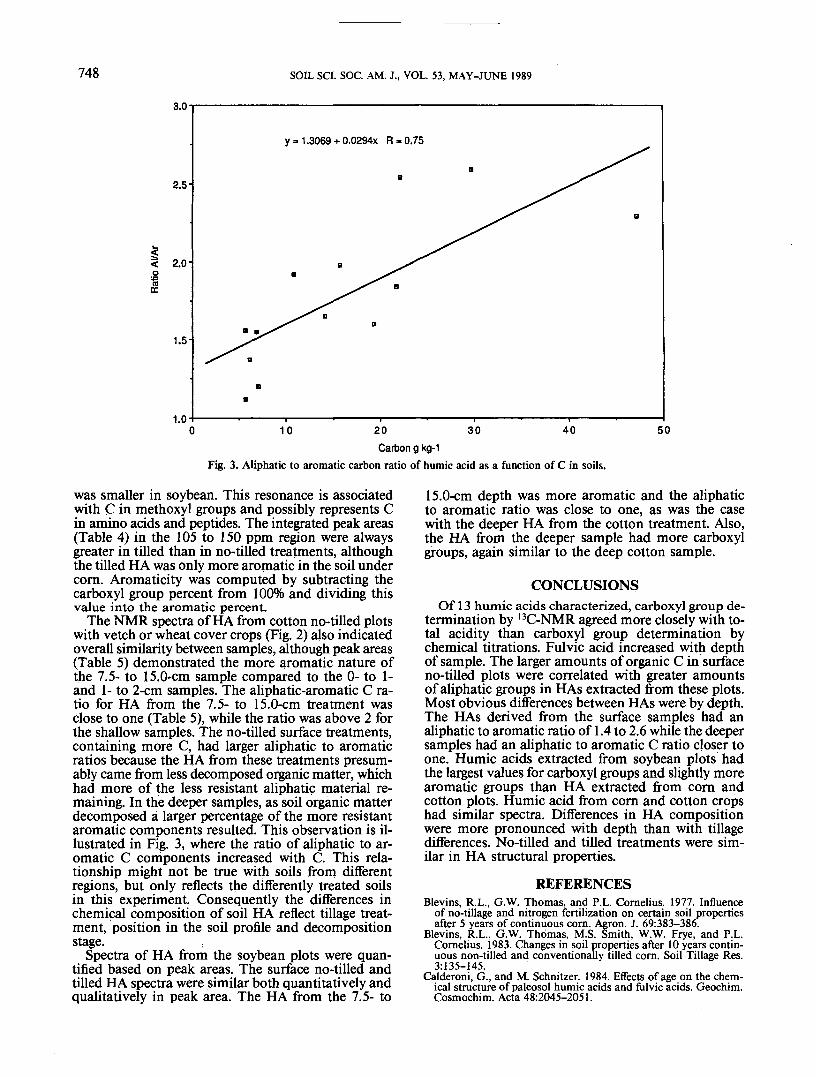
Fig. 3. Aliphatic to aromatic carbon ratio of humic acid as a function of C in soils.
50
was smaller in soybean. This resonance is associatedwith C in methoxyl groups and possibly represents Cin amino acids and peptides. The integrated peak areas(Table 4) in the 105 to 150 ppm region were alwaysgreater in tilled than in no-tilled treatments, althoughthe tilled HA was only more aromatic in the soil undercorn. Aromaticity was computed by subtracting thecarboxyl group percent from 100% and dividing thisvalue into the aromatic percent.
The NMR spectra of HA from cotton no-tilled plotswith vetch or wheat cover crops (Fig. 2) also indicatedoverall similarity between samples, although peak areas(Table 5) demonstrated the more aromatic nature ofthe 7.5- to 15.0-cm sample compared to the 0- to 1-and 1- to 2-cm samples. The aliphatic-aromatic C ra-tio for HA from the 7.5- to 15.0-cm treatment wasclose to one (Table 5), while the ratio was above 2 forthe shallow samples. The no-tilled surface treatments,containing more C, had larger aliphatic to aromaticratios because the HA from these treatments presum-ably came from less decomposed organic matter, whichhad more of the less resistant aliphatic material re-maining. In the deeper samples, as soil organic matterdecomposed a larger percentage of the more resistantaromatic components resulted. This observation is il-lustrated in Fig. 3, where the ratio of aliphatic to ar-omatic C components increased with C. This rela-tionship might not be true with soils from differentregions, but only reflects the differently treated soilsin this experiment. Consequently the differences inchemical composition of soil HA reflect tillage treat-ment, position in the soil profile and decompositionstage.
Spectra of HA from the soybean plots were quan-tified based on peak areas. The surface no-tilled andtilled HA spectra were similar both quantitatively andqualitatively in peak area. The HA from the 7.5- to
15.0-cm depth was more aromatic and the aliphaticto aromatic ratio was close to one, as was the casewith the deeper HA from the cotton treatment. Also,the HA from the deeper sample had more carboxylgroups, again similar to the deep cotton sample.
CONCLUSIONSOf 13 humic acids characterized, carboxyl group de-
termination by 13C-NMR agreed more closely with to-tal acidity than carboxyl group determination bychemical titrations. Fulvic acid increased with depthof sample. The larger amounts of organic C in surfaceno-tilled plots were correlated with greater amountsof aliphatic groups in HAs extracted from these plots.Most obvious differences between HAs were by depth.The HAs derived from the surface samples had analiphatic to aromatic ratio of 1.4 to 2.6 while the deepersamples had an aliphatic to aromatic C ratio closer toone. Humic acids extracted from soybean plots hadthe largest values for carboxyl groups and slightly morearomatic groups than HA extracted from corn andcotton plots. Humic acid from corn and cotton cropshad similar spectra. Differences in HA compositionwere more pronounced with depth than with tillagedifferences. No-tilled and tilled treatments were sim-ilar in HA structural properties.
KARLSON & FRANKENBERGER, JR.: ACCELERATED RATES OF SELENIUM VOLATILIZATION 749