Embed Size (px)
Citation preview

© 2017 Martin T. Mpinda, Sissou Zakari, Olusegun K. Abass, Eric Misilu M. Nsokimieno, Guy David Sebagenzi, Lydie
Linda Basheke, Maurice Kesonga, Henri de Paul I. Nkomerwa, Rodrigue Khonde and Patrick Kasangij wa Kasangij. This open access article is distributed under a Creative Commons Attribution (CC-BY) 3.0 license.
American Journal of Environmental Sciences
Original Research Paper
Characterization of Household Wastes in D.R. Congo, a Case
Study of Lubumbashi
1,2*Martin T. Mpinda,
2Sissou Zakari,
3*Olusegun K. Abass,
2Eric Misilu M. Nsokimieno,
1Guy David Sebagenzi,
1Lydie Linda Basheke,
1Maurice Kesonga,
4Henri de Paul I. Nkomerwa,
5Rodrigue Khonde and
1Patrick Kasangij wa Kasangij
1Department of Natural and Renewables Resources Management,
Faculty of Agricultural Sciences, University of Lubumbashi, Lubumbashi B.P: 1825, DR. Congo 2School of Environmental Studies, China University of Geosciences, Wuhan, Hubei 340074, P.R. China 3Institute of Urban Environment, Chinese Academy of Sciences, Xiamen 361021, P.R. China 4Department economy, Faculty of sciences, University of Bukavu, B.P: 285 Bukavu, DR. Congo
5Department of Occupational and Environmental Health of the School of Public Health,
Huazhong University of Science and Technology, Wuhan, Hubei, 430030, P.R. China
Article history
Received: 05-07-2016 Revised: 05-05-2017 Accepted: 07-06-2017 Corresponding Authors: Martin T. Mpinda Department of Natural and Renewables Resources Management, Faculty of Agricultural Sciences, University of Lubumbashi, Lubumbashi B.P: 1825, DR. Congo Tel: +243852587802 +243978209494 Email: [email protected]
Olusegun K. Abass Institute of Urban Environment, Chinese Academy of Sciences, Xiamen, 361021, P.R. China Email: [email protected]
Abstract: The insufficient supervision of household solid waste is a notorious problem in DR. Congo cities. Besides, solid waste management in Lubumbashi has been very rudimentary and unsystematic. This study aims to quantify and characterize the household solid waste in two Lubumbashi municipalities. For more than 50 years after independence from colonialism, the city trailed direct discharge of waste on exposed site and waterside and sometimes in watercourse with no soil cover or leachate treatment in place. Almost sixty households from two Lubumbashi city municipalities were investigated by means of group sampling techniques and the obtained data was used to quantify and characterize the municipalities’ household solid waste. The composition of the household waste revealed that 30% of the wastes were recovered by Lubumbashi’s state administration and 70% by local residential services termed individuals. However, in Kamalondo municipality, the household waste recovered by the state, individuals and private sectors were 25.9%, 67.5 and 6.7%, respectively. About 90% of the residence did not subscribe for the household system of collection. While each household generated varying amount and type of wastes, the average value of biodegradable waste produced in Kamalondo (1.79 kg) was three times higher than that in Lubumbashi (0.65 kg). Finally, this study highlighted that about USD 2.00 per household was enough to improve the household waste collection system of 2,000,000 residents in seven municipalities. Keywords: Waste Characterization, Household Solid Waste, Waste Generation, Solid Waste Management, Separation of Household Waste
Introduction
People migration from villages to cities owing to rapid industrialization and population growth in D.R. Congo has resulted in considerable increase in Municipal Solid Waste (MSW) generation. MSW is sourced from the collection and aggregation of individual Household Domestic Wastes (HDW), which contains various constituents including food waste (which is biodegradable or compostable), sand, paper, plastics and metals such as aluminum, glass and so on. Therefore, HDW represents one of the major environment challenges in D.R. Congo
due to lack of efficient management system. Mpinda et al. (2016; Guerrero et al., 2013), identified that waste plastics, glass and metals in the HDW are major nuisances, as they pollute environment, compromise amenities, clog drains and cause flooding during rainy season. Within the HDW constituents, some are recoverable, reusable and recyclable; thus they can help for a better HDW management.
Among the major issues confronting HDW management are inadequate supply of waste containers, longer distance to these containers (which increase the probabilities of waste dumping in open areas) and
Martin T. Mpinda et al. / American Journal of Environmental Sciences 2017, 13 (3): 277.288
DOI: 10.3844/ajessp.2017.277.288
278
unavailability of roadsides waste bins for communal use. Furthermore, the household’s attitudes towards waste separation is affected by lack of active support for investment in real estate company, community residential committee involvement for public participation (Zhuang et al., 2008) and fees collection service based on the waste volume or weight (Schenberg, 2011).
In another report, Tadesse et al. (2008) analyzed the factors that influence household waste disposal decision making and conclude that the supply of waste facilities considerably affects waste disposal choice. Consequently, household waste characterization is important to suggesting a better and efficient HDW management system. Furthermore, Pokhrel and Viraraghavan (2005) observed that insufficient financial resources often limit the safe disposal of waste in well-equipped and engineered landfills and absence of legislation.
Household waste characterization involves the determination of waste properties, which are the very first step of the whole planning and implementation cycle of HDW management facility (Zurbrügg et al., 2007). The generated waste characteristics and quantity affect the technical and management practices. According to Afon (2003), the composition of generated waste in an area determines the type of disposal pattern, which is suitable for a specific form of waste. Meanwhile, many failures of waste management practices, especially disposal techniques, could be attributed to an improper waste characterization and lack of understanding of its implication. Thus, the principles of solid waste management for a particular city or an urban area need to be decided based on parameters that are locally specific, as long as the waste characteristics and volume can vary not only from a city to another, but also within the same city (Ogunbiyi, 2001).
The quantification of waste is usually studied
separately; but it is closely associated with waste
characteristics that depend mainly on the source where it
is generated. Moreover, the proportion of the waste
components depends on various factors (Darmastuti,
2000), which are linked to socio-cultural factors and land
use pattern, such as housing density and eating habits
(Abumere, 1983). On one hand, Abumere (1983) states
that solid waste accumulation is a product of chaotic use
pattern, which he determines according to number of
households; however, on the other hand he finds that the
eating habit in a house significantly determines the
composition of produced waste. In poorly-managed situations, unpredictable and
harmful consequences of household wastes can occur at the source (i.e., residential households), waste collection points, during transportation and after deposit in landfills and/or burning sites. These concerns have potential to cause perpetual threats to environment and public health and thus, solid wastes
management and characterization are increasingly necessary (Gu et al., 2014).
Surprisingly, until recent, less quantitative data is available for waste management on the household schemes (Guerrero et al., 2013) and specifically from many households in D.R.C municipalities. Therefore, the knowledge of the qualitative and quantitative composition of HDW is of importance to implement the most appropriate waste reduction policies and could prove helpful in the choice of an adequate waste management and disposal scenario. This study reflects the actual state of household waste management in Lubumbashi. It aims to characterize HDW in ten (10) districts of two municipalities in Lubumbashi. The daily total generated HDW was first categorized and quantified. Then the quantitative analysis of each waste type was computed within and between districts. Finally, the influences of social factors on the HDW production were studied.
Materials and Methods
Study Area
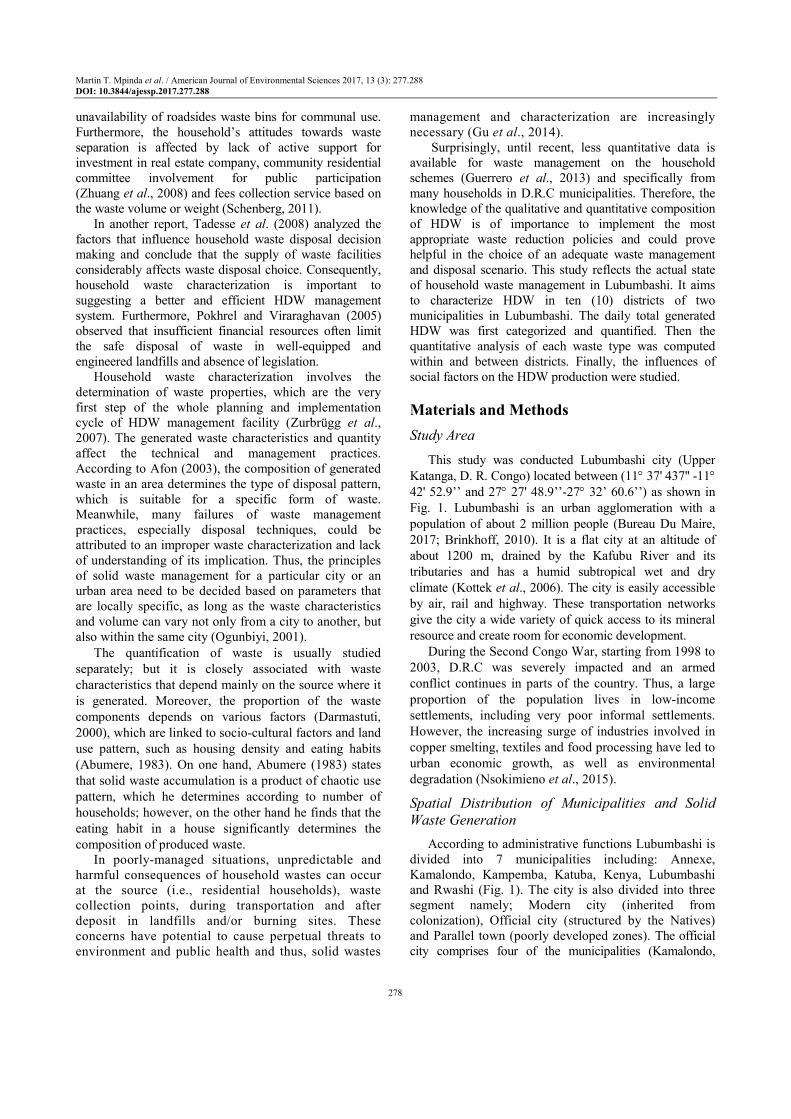
This study was conducted Lubumbashi city (Upper
Katanga, D. R. Congo) located between (11° 37' 437'' -11°
42' 52.9’’ and 27° 27' 48.9’’-27° 32’ 60.6’’) as shown in
Fig. 1. Lubumbashi is an urban agglomeration with a
population of about 2 million people (Bureau Du Maire,
2017; Brinkhoff, 2010). It is a flat city at an altitude of
about 1200 m, drained by the Kafubu River and its
tributaries and has a humid subtropical wet and dry
climate (Kottek et al., 2006). The city is easily accessible
by air, rail and highway. These transportation networks
give the city a wide variety of quick access to its mineral
resource and create room for economic development.
During the Second Congo War, starting from 1998 to
2003, D.R.C was severely impacted and an armed
conflict continues in parts of the country. Thus, a large
proportion of the population lives in low-income
settlements, including very poor informal settlements.
However, the increasing surge of industries involved in
copper smelting, textiles and food processing have led to
urban economic growth, as well as environmental
degradation (Nsokimieno et al., 2015).
Spatial Distribution of Municipalities and Solid
Waste Generation
According to administrative functions Lubumbashi is divided into 7 municipalities including: Annexe, Kamalondo, Kampemba, Katuba, Kenya, Lubumbashi and Rwashi (Fig. 1). The city is also divided into three segment namely; Modern city (inherited from colonization), Official city (structured by the Natives) and Parallel town (poorly developed zones). The official city comprises four of the municipalities (Kamalondo,
Martin T. Mpinda et al. / American Journal of Environmental Sciences 2017, 13 (3): 277.288
DOI: 10.3844/ajessp.2017.277.288
279
Katuba, Kenya and Rwashi) with excessive population growth compared to available infrastructure and facilities. Parallel town is the part of the neighborhood lacking amenities for waste management. This inevitably transforms into zones with the highest municipal solid wastes generation. Currently this heterogeneities are found almost in every plots of the country (Kubanza and Simatele, 2015; Mpinda et al., 2016).
A planned expansion of the city of Lubumbashi from its current 43 to 95 districts for effective waste management planning is underway. To achieve this purpose, the Urban Renovation Office focuses on strategies including income redistribution system especially as regards the achievement of the Sustainable Development Goals. However, on a more realistic front, efficient waste management are generally in their infancy in sub-Saharan Africa and only few agencies and urban managers have a clear understanding of how to transform global principles of sustainable development into achievable outcomes (Patel, 2009).
Description of Household
Before analyzing the problems related to waste management, it is important to know the number of
households in Lubumbashi and view its importance for waste management. Virtually all households in luxury neighborhoods occupy housing with singly-defined plots. During our investigations, we found that these households comprise only 10% of the whole sample. These, for most cases, are employees of mining companies.
In district from side to side neighborhoods with low
socioeconomic level, many households occupy the same
plot, with at least 85% of the plot spread over six
households. On one hand is the high cohabitation
neighborhoods, which are planned neighborhoods of
modest socioeconomic level, while on the other hand are
the self-build neighborhoods with intermediate
socioeconomic level. In Lubumbashi, rent
neighborhoods are the most numerous and represented
about 90% of our sample. Each household in
Lubumbashi has an average of 7 people. In high-
standing districts, this average is even lower, or 7,
generally, five persons per household. Unfortunately,
their homes will offer them little rooms, 2-3 rooms on
average. As for hygiene and sanitation, the conditions
differ from one level to another.
Fig. 1. Administrative map of Lubumbashi showing Bin Bag and Dumpster Locations (Source: Mpinda et al., 2016)
Martin T. Mpinda et al. / American Journal of Environmental Sciences 2017, 13 (3): 277.288
DOI: 10.3844/ajessp.2017.277.288
280
In this study, a household consists of people who share the same meals and regularly live together in the same house and sharing the same resource. It is therefore not a home in the biological sense, as the household often extends to other people than the nuclear family. Temporal residents were not considered as part of the household, unless they stay for at least six months. Similarly, children who live regularly outside the parental home, husbands that abandoned their wives and so on, are not included.
GPS coordinates of all Municipal Solid Wastes (MSW) were recorded in the field within each predetermined plot (Garmin 60CSx, accuracy ~5 m) and compared with those of previously identified municipalities on the satellite images. A total of 60 households, which account for 450 people in total were investigated. The survey was accomplished using a questionnaire with two polls which are: Households and town hall. The used materials include precision weighing balance, computer, a questionnaire and a camera. Quantitative and qualitative data were retrieved to achieve the objectives.
Assessment Approach
A desk study was conducted to assess background information on characterization of households in Lubumbashi, Kamalondo and Kenya Municipalities. Data obtained was used for the construction of a conceptual model on household in the Districts. Both primary and secondary data were collected from (the ten Districts of Lubumbashi City) respondents using questionnaires, interview and direct field sampling to obtain different opinions, reactions and ground evidence of factors contributing to the poor Household Waste Characterization (HWC) in urban areas of Lubumbashi City. These were used to update the data collected during the desk study.
The method adopted in this study provided interviewee with the opportunity of receiving clearer details on efficient household waste characterization and get clarification from the interviewer on issues affecting the disposal conditions and environmental fate of none retrieved household wastes. Household wastes were accessed in kilograms and according to their type and category. Documentary reviews were also conducted by reviewing regional environmental management reports. The collected raw data from the field were processed and analyzed using SPSS software program version 20.0 (Mpinda et al., 2016). Some limitation of these study are the lack of complete information, the deficiency of infrastructures, the lack of interest in environmental issues, the lack of space in the household, the lack of time to separate waste and social pressure. Another aspect on which there is not enough agreement in the literature concerns the socioeconomic characteristics
of the people who participate in household wastes collection systems. Research studies which assess these characteristics are, among others, those performed by Zhuang et al. (2008). The socioeconomic characteristics that are most commonly considered in these studies are level of studies, age, level of income, user of household, subscribers and participation in other waste collection systems. Aspects such as trust in the waste management system or the ethnicity of the user are scarcely available.
Results and Discussion
Social Characterization of Households
In this study, two districts (Kitumaini and Njanja) were used as samples in Kamalondo municipality and seven were investigated in Lubumbashi (Gambela, Kalubwe, Kiwele, Lumumba, Makomeno, Golf and Salama). Table 1 lists the results of the social characterization of the households in the municipalities and districts. As shown in Table 1, three variables such as instruction level, age and revenue were used to characterize the households. The instruction level includes five parameters relating to academic, professional, primary levels; and the occupational and illiterate state levels. For age characterization, the average values were considered in the computation and are presented in the Table 1. Finally, we used five levels of revenue (50-150, 150-250, 250-300, 300-450 and 450-1000) to classify the households.
As shown in Table 1, the instruction level of the
investigated households in Lubumbashi municipality and
districts was academic (60.7%), while those in
Kamalondo were the primary level (57.6%). A
subdivision of the instruction level reveals that in
Kamalondo, the households of Njanja district were
composed of more primary education (71.4%). However,
in its second district (Kitumaini), the number reduced to
43.8%. Interestingly, the academic, professional and
illiterate levels were found to have similar percentages
(18.8%), respectively. This implies that Njanja and Golf
district households had primary school degree as their
highest education level. In relation to the age
distribution, almost similar average ages (p = 0.400)
were found in both municipalities, with Kamalondo and
Lubumbashi having household age ranges between 34
and 38 years, respectively. In the literature, correlation of MSW generation rates
has been associated with some social characteristics including economic (such as gross domestic product) and demographic indicators (Pirani et al., 2014). Whereas, some classify household wastes based on income and quantities of solid waste generated others have used indicators that are cultural and region dependent (Bandara et al., 2007). Thus, in this study we
Martin T. Mpinda et al. / American Journal of Environmental Sciences 2017, 13 (3): 277.288
DOI: 10.3844/ajessp.2017.277.288
281
attempt to classify the asset inflow (Revenues) of the households into five (5) groups between 50 to USD1000. Here, the Kamalondo municipality household’s revenues were between 50 and USD300 while up to 94% of Lubumbashi households has revenues ranging between 300 to USD1000 per month. In the municipalities, the districts have different groupings according to State planned program and projects. Some districts such as Kalubwe, Kiwele, Lumumba and Salama households have higher incomes (Table 1) than the other districts. Therefore, it can be concluded that the households in Lubumbashi are more economically buoyant than those in Kamalondo as confirm by the significant Chi-2 results (p = 0.001 <0.005). Finally, there seems to be a correlation between the instruction level and the amount of revenue classification. The higher the instruction level, the higher the income earnings (Table 1) and thus, judging from the results, the social status of households may contribute to the waste generation amount (Table 5 and 6), as was similarly observed by Bandara et al. (2007). However, at a global scale, this may not hold true, as studies conducted in different parts of the world may sometimes result in dissimilar conclusions (Pirani et al., 2014).
Household Waste Collection System
Waste Collection System Approach
The household waste collection system in Lubumbashi municipality is primarily managed and organized by seven districts (Gambela, Kalubwe, Kiwele, Lumumba, Makomeno, Golf and Salama) safety services. The garbage management in Lubumbashi has a legal basis under the “urban Decree No 91/bur-city/town/Lushi/2001” of 23/11/2001 (Bureau Du Maire, 2001). In 2007, another decree was ratified under the “urban Decree No 62/bur-city/town/Lushi/2007” of December 12, 2007. This provided guiding rules on disposal requirements of containers, cans and other waste in public places (Bureau Du Maire, 2007). The
decree further states that the collected garbage should be transported with trucks to the city landfill where they are dumped in an area managed by CRA landfill operations. However, the disposed wastes are indiscriminately discharge and thus, create critical conditions leading to wastes decay and increased leachate generation that often seep through the permeable aquifer to groundwater and become harmful to human and the environment (Aboyeji and Eigbokhan, 2016; Maiti et al., 2016).
Lubumbashi main dumping site is less than 1 km away from the municipalities (field observation). Therefore, the city did not follow the international standard that suggests landfill dump sites should be located at least at 20 km from the city and/or homes ((Josimovi and Mari, 2012; Yazdani et al., 2015). Unfortunately, until now there is no action to relocate the dumping site to a safe place.
In this study, we found that a second household waste collection system was managed by private companies. This system is characterized by diverse approaches and the waste collection involved the use of large carts and trucks. It is a well-organized and structured system utilized by companies such as the Beach (La Plage), Kabu (ETS), Usafi and so on. They provide services such as trucks, engines and many other functional tools for household waste collection and their approaches are more useful for sanitary collection system. However, most of the companies commonly dispose the collected household wastes at inappropriate open dump sites (Paxéus, 2000; Gu et al., 2014).
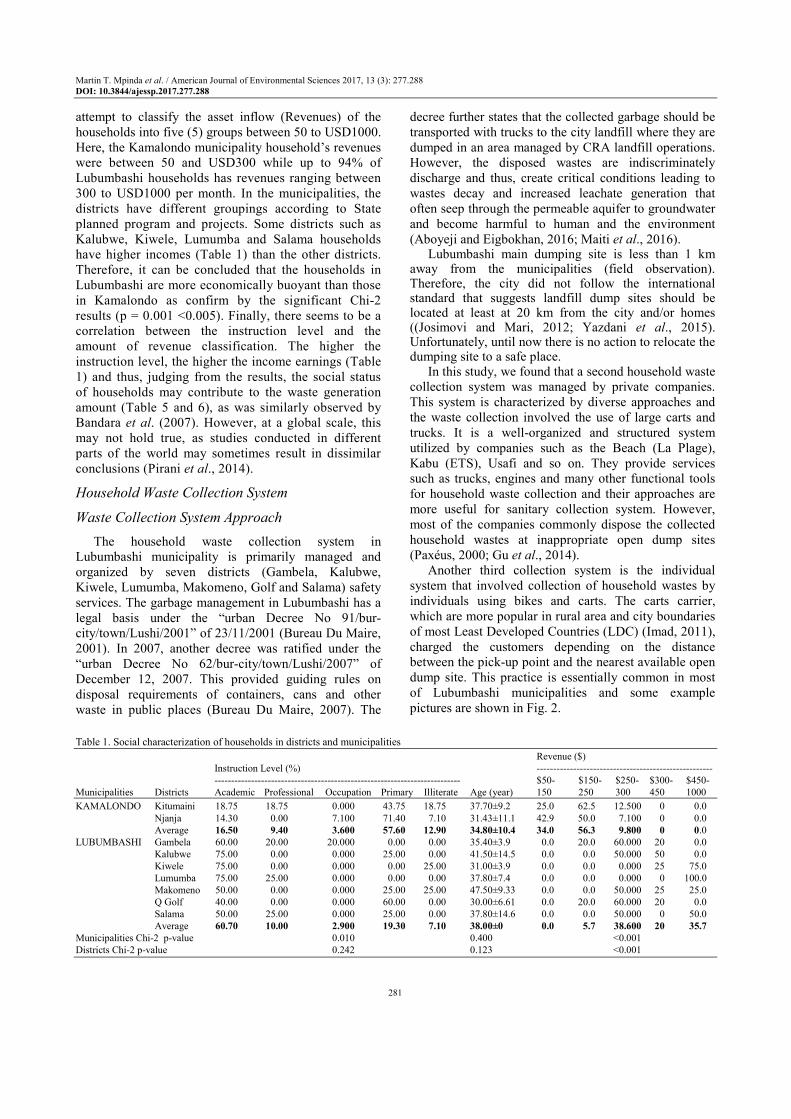
Another third collection system is the individual system that involved collection of household wastes by individuals using bikes and carts. The carts carrier, which are more popular in rural area and city boundaries of most Least Developed Countries (LDC) (Imad, 2011), charged the customers depending on the distance between the pick-up point and the nearest available open dump site. This practice is essentially common in most of Lubumbashi municipalities and some example pictures are shown in Fig. 2.
Table 1. Social characterization of households in districts and municipalities
Revenue ($)
Instruction Level (%) -----------------------------------------------------
-------------------------------------------------------------------------- $50- $150- $250- $300- $450-
Municipalities Districts Academic Professional Occupation Primary Illiterate Age (year) 150 250 300 450 1000
KAMALONDO Kitumaini 18.75 18.75 0.000 43.75 18.75 37.70±9.2 25.0 62.5 12.500 0 0.0
Njanja 14.30 0.00 7.100 71.40 7.10 31.43±11.1 42.9 50.0 7.100 0 0.0
Average 16.50 9.40 3.600 57.60 12.90 34.80±10.4 34.0 56.3 9.800 0 0.0
LUBUMBASHI Gambela 60.00 20.00 20.000 0.00 0.00 35.40±3.9 0.0 20.0 60.000 20 0.0
Kalubwe 75.00 0.00 0.000 25.00 0.00 41.50±14.5 0.0 0.0 50.000 50 0.0
Kiwele 75.00 0.00 0.000 0.00 25.00 31.00±3.9 0.0 0.0 0.000 25 75.0
Lumumba 75.00 25.00 0.000 0.00 0.00 37.80±7.4 0.0 0.0 0.000 0 100.0
Makomeno 50.00 0.00 0.000 25.00 25.00 47.50±9.33 0.0 0.0 50.000 25 25.0
Q Golf 40.00 0.00 0.000 60.00 0.00 30.00±6.61 0.0 20.0 60.000 20 0.0
Salama 50.00 25.00 0.000 25.00 0.00 37.80±14.6 0.0 0.0 50.000 0 50.0
Average 60.70 10.00 2.900 19.30 7.10 38.00±0 0.0 5.7 38.600 20 35.7
Municipalities Chi-2 p-value 0.010 0.400 <0.001
Districts Chi-2 p-value 0.242 0.123 <0.001
Martin T. Mpinda et al. / American Journal of Environmental Sciences 2017, 13 (3): 277.288
DOI: 10.3844/ajessp.2017.277.288
282
Fig. 2. Household trash bin and collection system in (1) local trash bin; (2) Kamalondo local motorbike/cart collection system; (3)
Lubumbashi Local Public Disposal (Lumumba Street); (4) Lubumbashi local system of waste dumps
Previous studies revealed that the Public-Private
Partnerships (PPP) are constituted as an alternative to improve household wastes service performance at lower costs (Cointreau et al., 2000; Zhu et al., 2007; Abdrabo, 2008). Furthermore, some authors pointed out the lack of specific financial monitoring and data analysis as one of the major barriers to sustain any foreseen improvement of household wastes collection system (Hanrahan et al., 2006; Zurbrügg et al., 2007; Parthan et al., 2012).
Waste Collection System
Table 2 shows the results of Waste Collection System (WCS) in Lubumbashi and Kamalondo cities. Three different WCS were found in both cities, including individual, private and state service collections. Results reveal that the individual system was the most WCS employed in Lubumbashi and Kamalondo with 70% of households and 67.5%, respectively. The use of individual system was followed by state and private systems in that order. However, the state systems in both cities was half the frequency of the individual system (31% in Lubumbashi and 26% in Kamalondo) while the private system, which seems to suffer a temporal or permanent suspension of activities, was not used in Lubumbashi and is ten times lower in Kamalondo. However, the result of Chi-2 test between the municipalities shows no significant difference of waste collection system in the municipalities (p = 0.352).
In Lubumbashi, apart from Lumumba district where only 75% of households applied for the state
collection system, most of the household employed the individual system. Furthermore in Kamalondo, the individual collection system was mostly employed in Njanja (78.6%) than in Kitumaini district (56.3%). This difference could be attributed to the presence of a state managed public market in Njanja district compared to Kitumaini, which is a residential district. The market place activities are carried out under the supervision of the Market Safety Service (MSS) and as such, ease individuals’ access to the MSS, which manages waste disposal issues including the collection and transport management fees. Finally, as for the municipalities no statistical difference was observed between the districts WCS (p = 0.595).
Concerning the attitude of a residence regarding subscription to HCS, the results also reveals that the majority of households utilize illegal collection services (≥96%) as shown in Table 2. This could be due to several reasons such as income earnings, instruction level, the state approach in the management of household, the private sector charges, the technical level and the technological level of the city. Therefore, in order to accomplish specific HCS goals, it is crucial to take into account the attitude of the system users during the decision-making process. As reported by Yuan (2012), social aspects have been considered to being of less importance in comparison to environmental or economic aspects in the waste management field. Similar conclusions are reached in this study as well as in our previous work (Mpinda et al., 2016).
Martin T. Mpinda et al. / American Journal of Environmental Sciences 2017, 13 (3): 277.288
DOI: 10.3844/ajessp.2017.277.288
283
Table 2. Households waste collection system and type in districts and municipalities
Municipalities Districts Households waste collection system (%) Waste collection type ------------------------------------------------------------- ---------------------------- Private State Individuals Legal Illegal
Kamalondo Kitumaini 6.30 37.50 56.30 6.25 93.75 Njanja 7.10 14.30 78.60 0.00 100.00
Average 6.70 25.90 67.50 3.10 96.90
Lubumbashi Gambela 0.00 0.00 100.00 0.00 100.00 Kalubwe 0.00 0.00 100.00 0.00 100.00 Kiwele 0.00 50.00 50.00 0.00 100.00 Lumumba 0.00 75.00 25.00 0.00 100.00 Makomeno 0.00 25.00 75.00 0.00 100.00 Q Golf 0.00 20.00 80.00 0.00 100.00 Salama 0.00 50.00 50.00 0.00 100.00
Average 0.00 31.40 68.60 0.00 100.00
Municipalities P -value 0.353 Districts P-value 0.595
Table 3. Households waste collection frequencies and fees in districts and municipalities
Waste collection frequency (%)
--------------------------------------------------------------------- Waste collection charges ($)
4 times/ 2 times/ 1time/ More/ -------------------------------------------------
Municipalities Districts Each day month Month Month Month 1$/M 2$/M 4$/M 8$/M
Kamalondo Kitumaini 0.0000 68.8000 18.8 6.3 6.3000000 87.5 12.50000 0.0 0.0 Njanja 0.0000 54.9000 21.4 0.0 28.6000000 92.9 7.10000 0.0 0.0 Average 0.0000 60.0000 20.1 3.2 17.5000000 90.2 9.80000 0.0 0.0 Lubumbashi Gambela 0.0000 60.0000 20.0 20.0 0.0000000 100.0 0.00000 0.0 0.0 Kalubwe 0.0000 50.0000 50.0 0.0 0.0000000 75.0 0.00000 0.0 25.0 Kiwele 0.0000 50.0000 0.0 0.0 50.0000000 50.0 25.00000 25.0 0.0 Lumumba 0.0000 75.0000 0.0 0.0 25.0000000 25.0 0.00000 25.0 50.0 Makomeno 0.0000 75.0000 0.0 0.0 25.0000000 50.0 0.00000 50.0 0.0 Q Golf 20.0000 20.0000 0.0 0.0 60.0000000 80.0 0.00000 0.0 20.0 Salama 0.0000 100.0000 0.0 0.0 0.0000000 25.0 0.00000 75.0 0.0 Average 2.9000 61.4000 10.0 2.9 22.9000000 57.9 3.60000 25.0 13.6 Municipality P- value 0.6747 0.00319 District P- value 0.2244 0.0007458
Table 3 illustrates the waste discharge fee collection
system and charges. Though, only 6.5% of household subscribed for the legal discharge service, the non-legal one also require some form of payment. In each district of Kamalondo, more than 50% of the households prefer the 4 times per month waste collection service and the corresponding fee was between 1000 to 1800 FC (USD 1.72-3.09). In the municipality, the households mostly use this service for their waste disposal. Overall, people in Kamalondo spend an average of USD 2 per month for their household waste management. Similar to Kamalondo, most households in Lubumbashi are also attracted by the four times per month waste collection service (61%). However, we found that in Q Golf district, they subscribed to more than four times per month WCS and in Kalubwe they use both the twice a month service and four times per month service.
The majority of Kamalondo households (90%) accessed the USD 1 per month system of waste collection charges and 10% afforded the USD 2 fees charge. Nevertheless, in Lubumbashi, more than 38.5% of households were able to access a service with cost higher than USD 4, compared to Kamalondo where no
household contracted for this service. This result was confirm by the Chi-2 test that show significant differences of subscribed services between municipalities (p = 0.003) and between districts (p = 0.001). The disparity between the two municipalities could be due to the difference in households’ monthly income in the district and municipalities as showed by Mpinda et al. (2016), who reported that the households’ income in Lubumbashi municipalities was higher than those in Kamalondo.
Household Waste Production, Management and
Typology
There has been no previous study that thoroughly elucidates waste composition analysis for Lubumbashi (Dangi et al., 2008). Here, we present the household waste types, the frequency of use of various waste management categories such as trash bin type, use of trash bin, separation, bin site and pick-up services for the districts and the municipalities; and further, we showed the computed differences between the districts and municipalities (Table 4). The results show that all the investigated households used trash bins and none of them
Martin T. Mpinda et al. / American Journal of Environmental Sciences 2017, 13 (3): 277.288
DOI: 10.3844/ajessp.2017.277.288
284
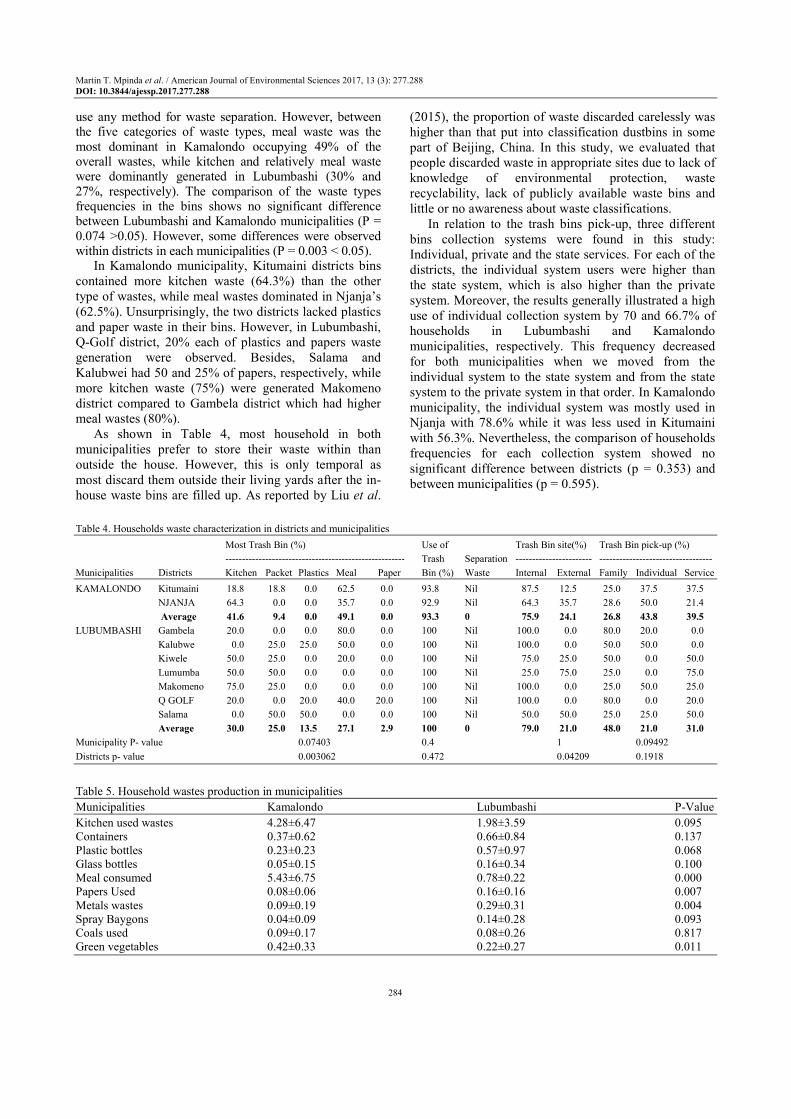
use any method for waste separation. However, between the five categories of waste types, meal waste was the most dominant in Kamalondo occupying 49% of the overall wastes, while kitchen and relatively meal waste were dominantly generated in Lubumbashi (30% and 27%, respectively). The comparison of the waste types frequencies in the bins shows no significant difference between Lubumbashi and Kamalondo municipalities (P = 0.074 >0.05). However, some differences were observed within districts in each municipalities (P = 0.003 < 0.05).
In Kamalondo municipality, Kitumaini districts bins contained more kitchen waste (64.3%) than the other type of wastes, while meal wastes dominated in Njanja’s (62.5%). Unsurprisingly, the two districts lacked plastics and paper waste in their bins. However, in Lubumbashi, Q-Golf district, 20% each of plastics and papers waste generation were observed. Besides, Salama and Kalubwei had 50 and 25% of papers, respectively, while more kitchen waste (75%) were generated Makomeno district compared to Gambela district which had higher meal wastes (80%).
As shown in Table 4, most household in both municipalities prefer to store their waste within than outside the house. However, this is only temporal as most discard them outside their living yards after the in-house waste bins are filled up. As reported by Liu et al.
(2015), the proportion of waste discarded carelessly was higher than that put into classification dustbins in some part of Beijing, China. In this study, we evaluated that people discarded waste in appropriate sites due to lack of knowledge of environmental protection, waste recyclability, lack of publicly available waste bins and little or no awareness about waste classifications.
In relation to the trash bins pick-up, three different bins collection systems were found in this study: Individual, private and the state services. For each of the districts, the individual system users were higher than the state system, which is also higher than the private system. Moreover, the results generally illustrated a high use of individual collection system by 70 and 66.7% of households in Lubumbashi and Kamalondo municipalities, respectively. This frequency decreased for both municipalities when we moved from the individual system to the state system and from the state system to the private system in that order. In Kamalondo municipality, the individual system was mostly used in Njanja with 78.6% while it was less used in Kitumaini with 56.3%. Nevertheless, the comparison of households frequencies for each collection system showed no significant difference between districts (p = 0.353) and between municipalities (p = 0.595).
Table 4. Households waste characterization in districts and municipalities
Most Trash Bin (%) Use of Trash Bin site(%) Trash Bin pick-up (%)
------------------------------------------------------ Trash Separation ----------------------- ----------------------------------
Municipalities Districts Kitchen Packet Plastics Meal Paper Bin (%) Waste Internal External Family Individual Service
KAMALONDO Kitumaini 18.8 18.8 0.0 62.5 0.0 93.8 Nil 87.5 12.5 25.0 37.5 37.5
NJANJA 64.3 0.0 0.0 35.7 0.0 92.9 Nil 64.3 35.7 28.6 50.0 21.4
Average 41.6 9.4 0.0 49.1 0.0 93.3 0 75.9 24.1 26.8 43.8 39.5
LUBUMBASHI Gambela 20.0 0.0 0.0 80.0 0.0 100 Nil 100.0 0.0 80.0 20.0 0.0
Kalubwe 0.0 25.0 25.0 50.0 0.0 100 Nil 100.0 0.0 50.0 50.0 0.0
Kiwele 50.0 25.0 0.0 20.0 0.0 100 Nil 75.0 25.0 50.0 0.0 50.0
Lumumba 50.0 50.0 0.0 0.0 0.0 100 Nil 25.0 75.0 25.0 0.0 75.0
Makomeno 75.0 25.0 0.0 0.0 0.0 100 Nil 100.0 0.0 25.0 50.0 25.0
Q GOLF 20.0 0.0 20.0 40.0 20.0 100 Nil 100.0 0.0 80.0 0.0 20.0
Salama 0.0 50.0 50.0 0.0 0.0 100 Nil 50.0 50.0 25.0 25.0 50.0
Average 30.0 25.0 13.5 27.1 2.9 100 0 79.0 21.0 48.0 21.0 31.0
Municipality P- value 0.07403 0.4 1 0.09492
Districts p- value 0.003062 0.472 0.04209 0.1918
Table 5. Household wastes production in municipalities
Municipalities Kamalondo Lubumbashi P-Value
Kitchen used wastes 4.28±6.47 1.98±3.59 0.095 Containers 0.37±0.62 0.66±0.84 0.137 Plastic bottles 0.23±0.23 0.57±0.97 0.068 Glass bottles 0.05±0.15 0.16±0.34 0.100 Meal consumed 5.43±6.75 0.78±0.22 0.000 Papers Used 0.08±0.06 0.16±0.16 0.007 Metals wastes 0.09±0.19 0.29±0.31 0.004 Spray Baygons 0.04±0.09 0.14±0.28 0.093 Coals used 0.09±0.17 0.08±0.26 0.817 Green vegetables 0.42±0.33 0.22±0.27 0.011
Martin T. Mpinda et al. / American Journal of Environmental Sciences 2017, 13 (3): 277.288
DOI: 10.3844/ajessp.2017.277.288
285
Table 6. Household wastes production in districts
Kitchen Container Plastic Glass Meal Papers Metals Spray Coals Green Wastes Used bottles bottles Used Used Wastes Baygons Used Vegetables Districts (Kg) (Kg) (Kg) (Kg) (Kg) (Kg) (Kg) Used (Kg) (Kg) (Kg)
GAMBELA 0.30±0.33 0.37±0.38 0.19±0.19 0.10±0.22 1.64±1.20 0.10±0.71 0.23±0.25 0.06±0.14 0.00±0.00 0.23±0.14 GOLF 1.08±1.83 0.35±0.11 1.50±2.11 0.30±0.28 0.82±1.12 0.35±0.32 0.41±0.24 0.27±0.23 0.00±0.00 0.19±0.19 KALUBWE 0.75±0.86 0.28±0.37 0.31±0.35 0.00±0.00 1.08±1.04 0.17±0.11 0.38±0.44 0.09±0.11 0.10±0.08 0.16±0.12 KITUMAINI 3.02±4.89 0.45±0.83 0.19±0.22 0.05±0.18 8.12±8.05 0.10±0.06 0.11±0.20 0.04±0.11 0.12±0.15 0.32±0.028 KIWELE 2.29±1.67 0.74±0.70 0.27±0.29 0.00±0.00 1.19±0.23 0.14±0.05 0.42±0.57 0.47±0.63 0.44±0.65 0.43±0.41 LUMUMBA 6.85±7.98 1.25±1.68 0.55±0.80 0.53±0.77 0.20±0.40 0.13±0.10 0.18±0.25 0.08±0.10 0.00±0.00 0.21±0.29 MAKOMENO 3.16±2.56 0.63±0.79 0.41±0.41 0.11±0.22 0.13±0.15 0.10±0.01 0.29±0.25 0.00±0.00 0.00±0.00 0.16±0.11 NJANJA 5.73±7.88 0.27±0.23 0.28±0.24 0.04±0.11 2.36±2.81 0.05±0.05 0.06±0.19 0.05±0.09 0.07±0.20 0.53±0.35 SALAMA 0.11±0.22 1.13±1.20 0.63±0.48 0.09±0.18 0.20±0.41 0.13±0.04 0.11±0.13 0.00±0.00 0.08±0.14 0.20±0.27 p-value 0.294 0.317 0.055 0.04 0.003 0.002 0.093 0.008 0.08 0.122
Table 6 lists the average values of household’s
waste production during the investigated period. The
results were organized according to the waste
categories (biodegradable and recyclable) and types in
districts and municipalities. It is obvious from Table
6, that the highest average waste produced by a
household in the investigated area was biodegradable
waste. The biodegradable waste average value was 18
times higher than that of recyclable waste in
Kamalondo and this value was twice higher in
Lubumbashi. However, when we considered the
municipalities, biodegradable and recyclable wastes
were increasingly produced respectively, in
Lubumbashi and Kamalondo. The average value of
biodegradable waste produced in Kamalondo (1.79
kg) was three times higher than that in Lubumbashi
(0.65 kg). On the contrary, the average recyclable
waste production value in Kamalondo (0.1 Kg) was
three times lower than that in Lubumbashi (0.3 Kg).
Therefore, the produced waste in the municipalities
should be managed differently according to the waste
type. Nevertheless, both municipalities should
practically improve on waste selection for a
sustainable waste management in DR Congo.
In relation to the type of waste, the Anova results
reflect no significant difference in the average waste
produced between the municipalities for the kitchen
(0.095), used coal (0.817), plastic bottles (0.068),
water sachet (0.137), glass bottles (0.100) and spray
baygons (0.093). Therefore, the municipality waste
management plan should also take into account the
waste type variation for a good selection and
management practice. In this study, for both
municipalities the order of the first three produced
waste type was kitchen waste > meal > green
vegetable, for the biodegradable wastes; and water
sachet > plastic bottles > metal wastes, for the
recyclable wastes. The challenge posed by plastic
sachet waste has been identified as a crucial issue in
several African countries which recently banned them
(Ayalon et al., 2009; Chitotombe, 2014).
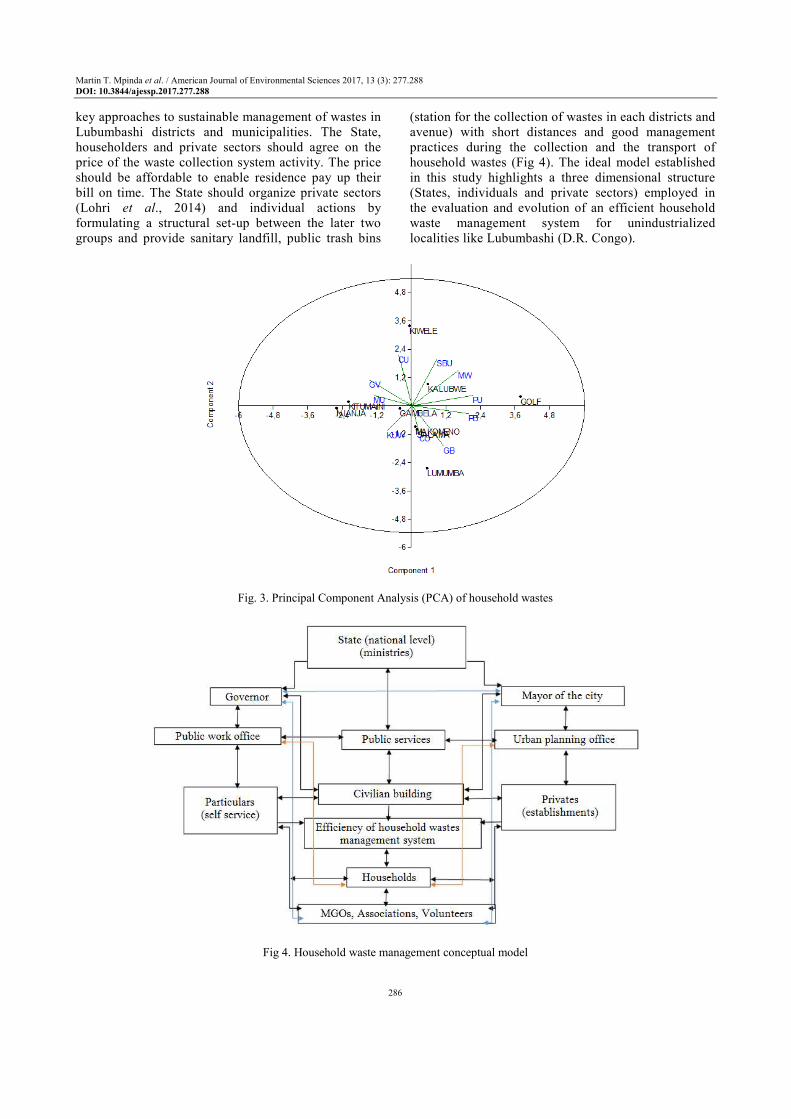
Principal Component Analysis (PCA) of Household
Wastes
The Fig. 3 illustrates the Principal Component Analysis (PCA) of household wastes in the districts. It reveals that Kiwele, Kalubwe and Golf communities was characterized by Spray Baygon wastes (SBU), Metal Wastes (MW) and Paper wastes (PU). These wastes originated from households and construction activities. The Glass Bottles (GB), Plastic Bottles (PB) and Container wastes (CU) were specifically found in the neighborhoods surrounding the commercial downtown (Makomeno, Salama and Lumumba). Furthermore, organic waste (plants (GV), food waste (MU), Coal wastes (CU) and Kitchen Wastes (KUW) was found in Gambela district as well as in two others districts (Njanja and Kitumaini) of Kamalondo municipality, which is well-known for its restaurants and bars.
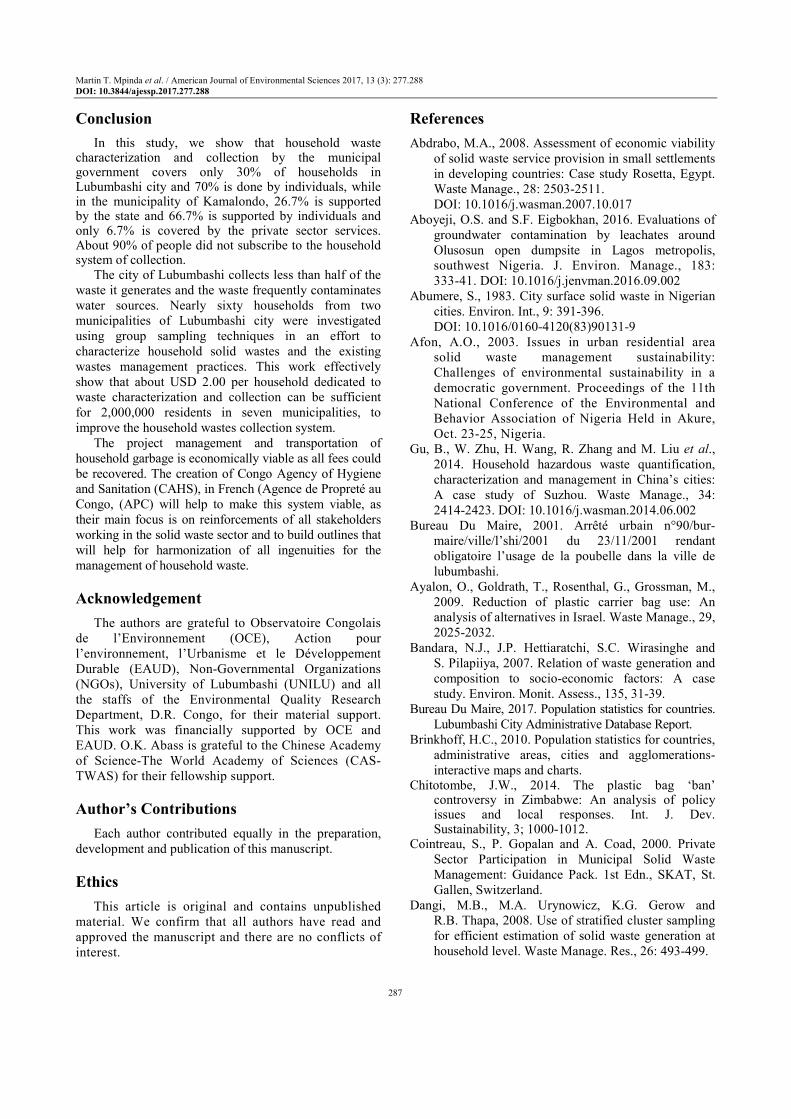
Conceptual Model
A household waste management (HWM) model is one that mixes multidimensional procedures of household wastes management to fundamentally enable the efficacy of HWM in unindustrialized country (Mpinda et al., 2016). States, privates and individuals actions will help to improve the household system of waste collection and management. The State should have as a priority to build an efficient system from the point collection to the landfill. In addition, primarily, focus should be paid on household waste management behavior, household wastes education and separation of wastes. Secondarily, the State can encourage the system of reduce, reuse and recycle at local manufacturing scale to aid the transformation of waste into usable products and hence, effectively manage household wastes before eventual discharged in landfills. Other means for efficient management of household waste in D.R. Congo will involve training of environmental engineers, environmental scientists and agricultural scientists. To reach this goal, training and re-training on collection system, transport, reuse and recycle are
Martin T. Mpinda et al. / American Journal of Environmental Sciences 2017, 13 (3): 277.288
DOI: 10.3844/ajessp.2017.277.288
286
key approaches to sustainable management of wastes in Lubumbashi districts and municipalities. The State, householders and private sectors should agree on the price of the waste collection system activity. The price should be affordable to enable residence pay up their bill on time. The State should organize private sectors (Lohri et al., 2014) and individual actions by formulating a structural set-up between the later two groups and provide sanitary landfill, public trash bins
(station for the collection of wastes in each districts and avenue) with short distances and good management practices during the collection and the transport of household wastes (Fig 4). The ideal model established in this study highlights a three dimensional structure (States, individuals and private sectors) employed in the evaluation and evolution of an efficient household waste management system for unindustrialized localities like Lubumbashi (D.R. Congo).
Fig. 3. Principal Component Analysis (PCA) of household wastes
Fig 4. Household waste management conceptual model
Martin T. Mpinda et al. / American Journal of Environmental Sciences 2017, 13 (3): 277.288
DOI: 10.3844/ajessp.2017.277.288
287
Conclusion
In this study, we show that household waste characterization and collection by the municipal government covers only 30% of households in Lubumbashi city and 70% is done by individuals, while in the municipality of Kamalondo, 26.7% is supported by the state and 66.7% is supported by individuals and only 6.7% is covered by the private sector services. About 90% of people did not subscribe to the household system of collection.
The city of Lubumbashi collects less than half of the waste it generates and the waste frequently contaminates water sources. Nearly sixty households from two municipalities of Lubumbashi city were investigated using group sampling techniques in an effort to characterize household solid wastes and the existing wastes management practices. This work effectively show that about USD 2.00 per household dedicated to waste characterization and collection can be sufficient for 2,000,000 residents in seven municipalities, to improve the household wastes collection system.
The project management and transportation of household garbage is economically viable as all fees could be recovered. The creation of Congo Agency of Hygiene and Sanitation (CAHS), in French (Agence de Propreté au Congo, (APC) will help to make this system viable, as their main focus is on reinforcements of all stakeholders working in the solid waste sector and to build outlines that will help for harmonization of all ingenuities for the management of household waste.
Acknowledgement
The authors are grateful to Observatoire Congolais de l’Environnement (OCE), Action pour l’environnement, l’Urbanisme et le Développement Durable (EAUD), Non-Governmental Organizations (NGOs), University of Lubumbashi (UNILU) and all the staffs of the Environmental Quality Research Department, D.R. Congo, for their material support. This work was financially supported by OCE and EAUD. O.K. Abass is grateful to the Chinese Academy of Science-The World Academy of Sciences (CAS-TWAS) for their fellowship support.
Author’s Contributions
Each author contributed equally in the preparation, development and publication of this manuscript.
Ethics
This article is original and contains unpublished material. We confirm that all authors have read and approved the manuscript and there are no conflicts of interest.
References
Abdrabo, M.A., 2008. Assessment of economic viability of solid waste service provision in small settlements in developing countries: Case study Rosetta, Egypt. Waste Manage., 28: 2503-2511.
DOI: 10.1016/j.wasman.2007.10.017 Aboyeji, O.S. and S.F. Eigbokhan, 2016. Evaluations of
groundwater contamination by leachates around Olusosun open dumpsite in Lagos metropolis, southwest Nigeria. J. Environ. Manage., 183: 333-41. DOI: 10.1016/j.jenvman.2016.09.002
Abumere, S., 1983. City surface solid waste in Nigerian cities. Environ. Int., 9: 391-396.
DOI: 10.1016/0160-4120(83)90131-9 Afon, A.O., 2003. Issues in urban residential area
solid waste management sustainability: Challenges of environmental sustainability in a democratic government. Proceedings of the 11th National Conference of the Environmental and Behavior Association of Nigeria Held in Akure, Oct. 23-25, Nigeria.
Gu, B., W. Zhu, H. Wang, R. Zhang and M. Liu et al., 2014. Household hazardous waste quantification, characterization and management in China’s cities: A case study of Suzhou. Waste Manage., 34: 2414-2423. DOI: 10.1016/j.wasman.2014.06.002
Bureau Du Maire, 2001. Arrêté urbain n°90/bur-maire/ville/l’shi/2001 du 23/11/2001 rendant obligatoire l’usage de la poubelle dans la ville de lubumbashi.
Ayalon, O., Goldrath, T., Rosenthal, G., Grossman, M., 2009. Reduction of plastic carrier bag use: An analysis of alternatives in Israel. Waste Manage., 29, 2025-2032.
Bandara, N.J., J.P. Hettiaratchi, S.C. Wirasinghe and S. Pilapiiya, 2007. Relation of waste generation and composition to socio-economic factors: A case study. Environ. Monit. Assess., 135, 31-39.
Bureau Du Maire, 2017. Population statistics for countries. Lubumbashi City Administrative Database Report.
Brinkhoff, H.C., 2010. Population statistics for countries, administrative areas, cities and agglomerations-interactive maps and charts.
Chitotombe, J.W., 2014. The plastic bag ‘ban’ controversy in Zimbabwe: An analysis of policy issues and local responses. Int. J. Dev. Sustainability, 3; 1000-1012.
Cointreau, S., P. Gopalan and A. Coad, 2000. Private Sector Participation in Municipal Solid Waste Management: Guidance Pack. 1st Edn., SKAT, St. Gallen, Switzerland.
Dangi, M.B., M.A. Urynowicz, K.G. Gerow and R.B. Thapa, 2008. Use of stratified cluster sampling for efficient estimation of solid waste generation at household level. Waste Manage. Res., 26: 493-499.
Martin T. Mpinda et al. / American Journal of Environmental Sciences 2017, 13 (3): 277.288
DOI: 10.3844/ajessp.2017.277.288
288
Darmastuti, 2000. www.faculty.ait.asia/.../Full_Doc%20MSW%20Mgt%20Africa%20and%
Hanrahan, D., S. Srivastava and A. Ramakrishna, 2006. Improving management of municipal solid waste in India: Overview and challenges. Environment and social Development Unit, South Asia Region, World Bank, New Delhi, India.
Kottek, M., J. Grieser, C. Beck, B. Rudolf and F. Rubel, 2006. World Map of the Köppen-Geiger climate classification updated. Meteorologische Zeitschrift, 15: 259-263. DOI: 10.1127/0941-2948/2006/0130
Gu, B., W. Zhu, H. Wang, R. Zhang and M. Liu et al., 2014. Household hazardous waste quantification, characterization and management in China's cities: A case study of Suzhou. Waste Manage., 34: 2414-2423.
Guerrero, L.A., G. Maas and W. Hogland, 2013. Solid waste management challenges for cities in developing countries. Waste Manage., 33: 220-232. DOI: 10.1016/j.wasman.2012.09.008
Imad, A., 2011. Municipal solid waste management in developing countries: Future challenges and possible opportunities. "Integrated Waste Management.
Josimovi, B. and I. Mari, 2012. Methodology for the regional landfill site selection. "Sustainable Development - Authoritative and Leading Edge Content for Environmental Management".
Kubanza, N.S. and D. Simatele, 2015. Social and environmental injustices in solid waste management in sub-Saharan Africa: A study of Kinshasa, the Democratic Republic of Congo. Local Environ., 21: 866-882.
DOI: 10.1080/13549839.2015.1038985 Liu, T., Y. Wu, X. Tian and Y. Gong, 2015. Urban
household solid waste generation and collection in Beijing, China. Resources, Conserv. Recycl., 104: 31-37.
Lohri, C.R., E.J. Camenzind and C. Zurbrugg, 2014. Financial sustainability in municipal solid waste management--costs and revenues in Bahir Dar, Ethiopia. Waste Manage., 34: 542-552.
DOI: 10.1016/j.wasman.2013.10.014 Maiti, S.K., S. De, T. Hazra, A. Debsarkar and A. Dutta,
2016. Characterization of leachate and its impact on surface and groundwater quality of a closed dumpsite-a case study at Dhapa, Kolkata, India. Proc. Environ. Sci., 35: 391-399. DOI: 10.1016/j.proenv.2016.07.019
Mpinda, M.T., O.K. Abass, M.B. Bazirake, E.M.M. Nsokimieno and N.S. Mylor et al., 2016. Towards the efficiency of municipal solid waste management in the Democratic Republic of Congo (DRC): Case study of Lubumbashi. Am. J. Environ. Sci., 12: 193-205.
DOI: 10.3844/ajessp.2016.193.205
Nsokimieno, M.M.E., L. Jianfeng, M.N. Shutcha,
K.W.K. Matthieu and E. Bailey et al., 2015.
Creative reconstruction: A systematic approach to
reinventing large cities in democratic republic of
Congo. J. Soc. Sci. Res.
Ogunbiyi, A., 2001. Local technology in Solid Waste
Management in Nigeria. Proceedings of the National
Engineering Conference and General Meeting of the
Society of Engineers. (MSE’ 01), pp: 79-9
Patel, Z., 2009. Environmental justice in South Africa:
Tools and trade‐offs. Soc. Dynam., 35: 94-110.
DOI: 10.1080/02533950802666956
Parthan, S.R., M.W. Milke, D.C. Wilson and J.H. Cocks,
2012. Cost estimation for solid waste management
in industrialising regions-Precedents, problems and
prospects. Waste Manage., 32: 584-594.
DOI: 10.1016/j.wasman.2011.11.004
Paxéus, N., 2000. Organic compounds in municipal
landfill leachates. Water Sci. Technol., 42: 323-333.
Pirani, S.I., I.A. Al-Khatib, R. Halaweh, M.A. Arafat
and H.A. Arafat, 2014. Household-level
determinants of residential solid waste generation
rates: A study from Nablus-Palestine. J. Mater.
Cycles Waste Manage., 17: 725-735.
Pokhrel, D. and T. Viraraghavan, 2005. Municipal solid
waste management in Nepal: Practices and
challenges. J. Waste Manage., 25: 555-562.
Schenberg, A., 2011. Value added modes of sustainable
recycling in the modernization of waste
management systems. PhD. THESIS, Wageningen
University, Netherlands.
Tadesse, T., A. Ruijs and F. Hagos, 2008. Household
waste disposal in Mekelle city. Northern Ethiopia J.
Waste Manage., 28: 2003-2012.
Yazdani, M., Monavari, S.M., Omrani, G.A., Shariat,
M., Hosseini, S.M., 2015. Landfill site suitability
assessment by means of geographic information
system analysis. Solid Earth 6, 945-956. Yuan, H., 2012. A model for evaluating the social
performance of construction waste management. Waste Manage., 32: 1218-1228.
DOI: 10.1016/j.wasman.2012.01.028 Zhuang, Y., S.W. Wu, Y.L. Wang, W.Z. Wu and
Y.X. Chen, 2008. Source separation of household waste: a case study in china. J. Waste Manage., 28: 2022-2030.
Zhu, D., P.U. Asnani, C. Zurbrügg, S. Anapolsky and S. Mani, 2007. Improving municipal solid waste management in India: A sourcebook for policymakers and practitioners. The World Bank, Washington, DC.


![A Model for Bioaccumulation of Metals in Crassostrea ...thescipub.com/PDF/ajessp.2005.239.248.pdf · valve with parallel filamen ts (f) (adapted from Medler an d Silverman[41] p m](https://img.pdfslide.us/doc/110x75/5a7875da7f8b9a77438d4d81/a-model-for-bioaccumulation-of-metals-in-crassostrea-valve-with-parallel.jpg)