Embed Size (px)
Citation preview
Vol.:(0123456789)1 3
Metabolomics (2018) 14:36 https://doi.org/10.1007/s11306-018-1329-9
ORIGINAL ARTICLE
Characterization of GMO or glyphosate effects on the composition of maize grain and maize-based diet for rat feeding
Stéphane Bernillon1,2 · Mickaël Maucourt1,2 · Catherine Deborde1,2 · Sylvain Chéreau3 · Daniel Jacob1,2 · Nathalie Priymenko4 · Bérengère Laporte4 · Xavier Coumoul5 · Bernard Salles4 · Peter M. Rogowsky6 · Florence Richard‑Forget3 · Annick Moing1,2
Received: 8 December 2017 / Accepted: 25 January 2018 / Published online: 17 February 2018 © Springer Science+Business Media, LLC, part of Springer Nature 2018
AbstractIntroduction In addition to classical targeted biochemical analyses, metabolomic analyses seem pertinent to reveal expected as well as unexpected compositional differences between plant genetically modified organisms (GMO) and non-GMO samples. Data previously published in the existing literature led to divergent conclusions on the effect of maize transgenes on grain compositional changes and feeding effects. Therefore, a new study examining field-grown harvested products and feeds derived from them remains useful.Objectives Our aim was to use a metabolomics approach to characterize grain and grain-based diet compositional changes for two GMO events, one involving Bacillus thuringiensis toxin to provide insect resistance and the other one conferring herbicide tolerance by detoxification of glyphosate. We also investigated the potential compositional modifications induced by the use of a glyphosate-based herbicide on the transgenic line conferring glyphosate tolerance.Results The majority of statistically significant differences in grain composition, evidenced by the use of 1H-NMR profiling of polar extracts and LC-ESI-QTOF-MS profiling of semi-polar extracts, could be attributed to the combined effect of geno-type and environment. In comparison, transgene and glyphosate effects remained limited in grain for the compound families studied. Some but not all compositional changes observed in grain were also detected in grain-based diets formulated for rats.Conclusion Only part of the data previously published in the existing literature on maize grains of plants with the same GMO events could be reproduced in our experiment. All spectra have been deposited in a repository freely accessible to the public. Our grain and diet characterization opened the way for an in depth study of the effects of these diets on rat health.
Keywords Maize · Metabolomics · GMO · Grain · Rat diet
AbbreviationsCPMG Carr–Purcell–Meiboom–GillDW Dry weightLC-ESI-QTOF-MS Liquid chromatography electro-
spray-ionization time-of-flight mass spectrometry
NMR Nuclear magnetic resonancePCA Principal component analysis
1 Introduction
Maize (Zea mays L.), a major cereal crop, is largely used for animal feed and human nutrition. Maize breeders have improved yield (for silage and grain), stress tolerance and quality traits, using classical breeding methods as well as genomics tools (Wusirika et al. 2014). Additional traits of agronomic interest were created by the insertion of foreign genes leading to genetically modified organisms (GMOs), the culture and use of which is regulated. Con-troversial studies about the potential impact of maize and other crop GMOs on human health and the environment have been published (Domingo 2016; Domingo and Giné Bordonaba 2011; Hilbeck et al. 2015). Studies considering the effect of different transgenes on the composition of a given crop show effects or not, depending on the organ or the transgene. Studies about the effect of a given transgene on
Electronic supplementary material The online version of this article (https ://doi.org/10.1007/s1130 6-018-1329-9) contains supplementary material, which is available to authorized users.
* Annick Moing [email protected]
Extended author information available on the last page of the article
S. Bernillon et al.
1 3
36 Page 2 of 12
maize grain or leaf biochemical composition are not always confirmed and frequently result in contradictory conclu-sions: for instance see (Harrigan et al. 2016; Mesnage et al. 2016; Ridley et al. 2002) for herbicide tolerant maize. To overcome these conflicting results, it appeared relevant to implement a metabolomics strategy combining 1H-NMR and LC-MS with the aim of providing a detailed charac-terization of grain compositional changes for two bacterial gene-insertion events: a Bacillus toxin gene providing insect resistance, and a glyphosate-insensitive enzyme providing herbicide tolerance.
The three major components of mature maize grain (Wat-son 2003) are starch (on average 72%, dry weight basis), proteins (10%) and lipids (4%). Small molecule metabolites, that are precursors of these major components, represent all together 5% (Skogerson et al. 2010). They include several families of primary, and specialized metabolites such as xantophylls, flavonoids, hydroxycinnamates and phenola-mides (Martin-Tanguy 1985; Wen et al. 2014). The charac-terisation of these metabolites requires the combination of at least two analytical strategies (Hall 2011): (i) gas chro-matography (GC) coupled with mass spectrometry (MS) or proton nuclear magnetic resonance spectroscopy (1H-NMR) of polar extracts to give access to primary metabolites and (ii) liquid chromatography coupled with mass spectrometry (LC-MS) of semi-polar extracts to characterize specialized metabolites. These approaches have been used recently for cereals including maize kernels (Balmer et al. 2013; Khaki-mov et al. 2014), to study genotype effects (Skogerson et al. 2010), environmental effects (Chen et al. 2016), and genetic resources (Venkatesh et al. 2016). In several publications including the recent one by Tang and colleagues (Tang et al. 2017) combining GC-MS and LC-MS, the environmental effect was stronger than the genotype one. Metabolomic approaches have also been used to understand the effect of specific transgenes on plant composition with pioneering works in tomato (Le Gall et al. 2003), potato (Catchpole et al. 2005) or wheat (Baker et al. 2006) and more recently in maize (Leon et al. 2009; Mesnage et al. 2016). In addition to the usual targeted analyses performed (proximate analy-sis, analyses of micronutrients, allergens and anti-nutrients), untargeted metabolomic profiling on the grain and feed side may be of high interest before or in parallel to an experi-mental study concerning dietary administration to animals (Schmidt et al. 2016) that may also involve omics on the animal side.
Our objective was to combine NMR- and MS-based untargeted metabolomics analyses to assess possible com-positional changes in the grains of two maize GMO varieties and their closest non-GMO counterpart, each genotype pair in a given environmental condition, as well as in the result-ing pellets formulated for rats. Untargeted metabolomic approaches were used to identify metabolite signatures and/
or metabolites associated with the GMO event or the glypho-sate application in the case of the herbicide-tolerance event. We also checked if the changes observed in the grains were still visible in the feed containing 11 or 33% grain ingredient of GMO maize. This work on grain and pellet composition contributed to characterize the material used in a rat feeding experiment (6 month trial, GMO90+ project) aiming at the detection of biomarkers able to differentiate GMO and non-GMO or glyphosate-treated and control diets.
2 Materials and methods
2.1 Plant growth conditions and grain sampling
We used four maize (Zea mays L.) varieties. The NK603 event (Pioneer 8906R, hereafter NK) harboring a bacterial 5-enolpyruvylshikimate-3-phosphate synthase (EPSPS) gene conferring glyphosate tolerance, and its closest near-isogenic non-GMO counterpart (Pioneer 8906, hereafter ISONK) were cultivated in Canada in 2014, as NK603 is only authorized for import, processing and food and feed uses, but not for culture in EU. NK603 was cultivated with (NK-G, one treatment 37 days-after-sowing) and with-out glyphosate application (NK) at post-emergence. The MON810 event producing Bacillus thuringienis toxin (Bt protein, initially used to control insect pests of maize, pri-marily the European corn borer) and authorized for culture in EU (DKC6667YG, hereafter MON), and its closest near-isogenic non-GMO counterpart (DKC6666, hereafter ISO-MON) were grown in Spain (Cataluna) in 2014. Therefore, the genotype effect and culture site effect cannot be differ-entiated. NK, ISONK, NK-G, MON and ISOMON will be considered as five different “harvests”. Transgenic and near-isogenic control varieties were grown in close by-blocks to minimize the environmental impact on kernel composition. Buffer zones were used to prevent pollen flow. Only herbi-cides were used (at pre- and post-emergence stages). Culture conditions are summarized in Online Resource 1. Harvests were stored in bags of 1000 kg (Canada harvests) or 500 kg (Spain harvests) at approximately 7 °C and 65% humidity before shipment for pellet preparation. Grain sampling for analyses was done in the bag further used for pellet prepara-tion. For grain metabolomic analyses, four biological repli-cates were used.
2.2 Verification of the “GMO identity” of the GMO crops and the lack of significant GMO contamination in near‑isogenic crops
The presence of expected and unexpected GMO events in grains was verified in three consecutive steps as detailed in Online Resource 2: search for frequently used elements of

Characterization of GMO or glyphosate effects on the composition of maize grain and maize-based…
1 3
Page 3 of 12 36
transgenes, detection of specific events and quantification of the events with positive results.
2.3 Pellet preparation, storage and sampling
Eight diets (d-) containing 33% of maize grains were for-mulated for further feeding experiments on rats. Three diets contained MON810 and its closest near-isogenic variety in varying amounts: 33% near isogenic non-GM MON called d-ISOMON, 11% MON + 22% ISOMON called d-MON11, 33% MON called d-MON33. Five diets contained NK603 and its closest near-isogenic variety: 33% ISONK called d-ISONK, 11% NK without glyphosate + 22% ISONK called d-NK11, 33% NK without glyphosate called d-NK33, 11% NK-G with glyphosate + 22% ISONK called d-NKG11, 33% NK-G with glyphosate called d-NKG33.
Besides maize, the formulation mainly consisted in plant-derived ingredients (Online Resource 3). The maize ker-nels were milled (mesh size: 1 mm) and used to prepare the feed using extrusion at 50 °C. One bag of maize grain of a given harvest was used to produce the unique batch of cor-responding pellets. Diet formulation was adjusted to the die-tary requirements of the rat strain Wistar Han RCC (Online Resource 3). The resulting pellets prepared by SAFE (Augy, France) were dried at a temperature below 50 °C, irradiated (25 kGy), stored in opaque and vacuum-sealed packages, coded in a blinded fashion and aliquots sent to the analytical laboratories. The diet composition was verified using clas-sical targeted analyses (Online Resource 4) performed by Eurofins (Nantes, France). For diet metabolomic profiling, two technological replicates for 1H-NMR analyses and four technological replicates for LC-ESI-QTOF-MS were used.
2.4 1H‑NMR metabolomic profiling of polar metabolites in grains and diets
Polar metabolites were extracted from 75 mg DW for grain and 50 mg DW for diet using hot ethanol/water and ana-lyzed by 1H-NMR as previously described (Biais et al. 2009) with limited modifications described in Online Resource 2. 1H-NMR spectra have been deposited into Zenodo reposi-tory (https ://doi.org/10.5281/zenod o.10974 09, https ://zenod o.org/commu nitie s/?p=INRA). The assignments of metabolites (Online Resource 5) were made by comparing the proton chemical shifts with literature (Fan 1996; Mounet et al. 2007) or database values (MeRy-B, http://bit.ly/meryb ; HMDB, http://www.hmdb.ca/), by comparison with 1D and 2D spectra of authentic compounds (in-house library) and by spiking the samples. 2D NMR experiments (COSY, HSQC) were acquired for selected samples for assignment verifica-tion. For quantification of metabolites, glucose, fructose, glutamic acid and proline calibration curves were prepared and the metabolite concentrations were calculated using
NMRProcFlow application v1.1 ((Jacob et al. 2017), http://nmrpr ocflo w.org/).
2.5 LC‑ESI‑QTOF‑MS metabolomic profiling of semi‑polar metabolites in grains and diets
Lyophilized grains or diet samples (100 ± 0.5 mg DW) were extracted with 1 mL of methanol/water with 0.1% formic acid (70/30, v/v). The supernatants were analyzed by LC-QTOF-MS in positive-ion mode as described in Online Resource 2. Metabolite identification was performed using the accurate mass data. The final annotation and putative name assignments (Online Resource 6) were also achieved by comparing with MS-related information reported in the literature (Martin-Tanguy 1985; Wen et al. 2014) or web open-data (http://www.metab olomi cswor kbenc h.org/). Spec-tra have been deposited into Zenodo repository (https ://doi.org/10.5281/zenod o.10974 09, https ://zenod o.org/commu nitie s/?p=INRA). The MS data were processed using XCMS (Smith et al. 2006). A total of 500 and 1779 features were detected for grains and diets, respectively. Data were fil-tered using: removal of features found in blank extraction, removal of features with coefficient of variation (CV) ratio calculated using QC samples above the 3rd quartile, and removal of features characterized with m/z or retention time (RT) highly variable (RTmax − RTmin > 60 s, m/zmax − m/zmin > 0.025). Data were normalized using MetNormalizer (Shen et al. 2016) with QCs, and the sample weights. This resulted in 148 ions for grain and 970 ions for diets.
2.6 Data analyses
Metabolite contents expressed on a DW basis were used for statistical analyses. Principal component analysis (PCA, correlation matrix), variance analysis (ANOVA, log2-transformed data, P < 0.05 with FDR correction) and vol-cano-plot analyses (log2-transformed data, Student’s t-test P < 0.05 with FDR correction, and 1.2 ratio) were performed using R scripts in BioStatFlow web application (biostatflow.org, v2.7.7).
3 Results
3.1 The search of GMO elements and quantification of GMO events in grain reveal only few unexpected GMO events
To ascertain the identity of the GMO events chosen for our GMO90+ research project and the absence of unwanted GMO contamination in the non-GMO harvests, we searched all harvests for commonly used elements of transgenes, for GMO events authorized for culture in each culture area and
S. Bernillon et al.
1 3
36 Page 4 of 12
quantified all detected events in grain (Online Resource 7). The analysis of the Spain harvests did not reveal any abnor-malities for MON and ISOMON. In the Canada harvests, the 35S promoter element was detected in the non-GMO harvest ISONK. This unexpected result could be attributed to trace amounts (0.6%) of the event DAS59122 authorized for culture in Canada in 2014. As expected, NK and NK-G fully contained event NK603.
3.2 The genotype/environment has clear effects on grain metabolomic profiles
After signal annotations (Online Resource 5), eight soluble sugars and sugar-alcohols, 15 amino acids and amino-based
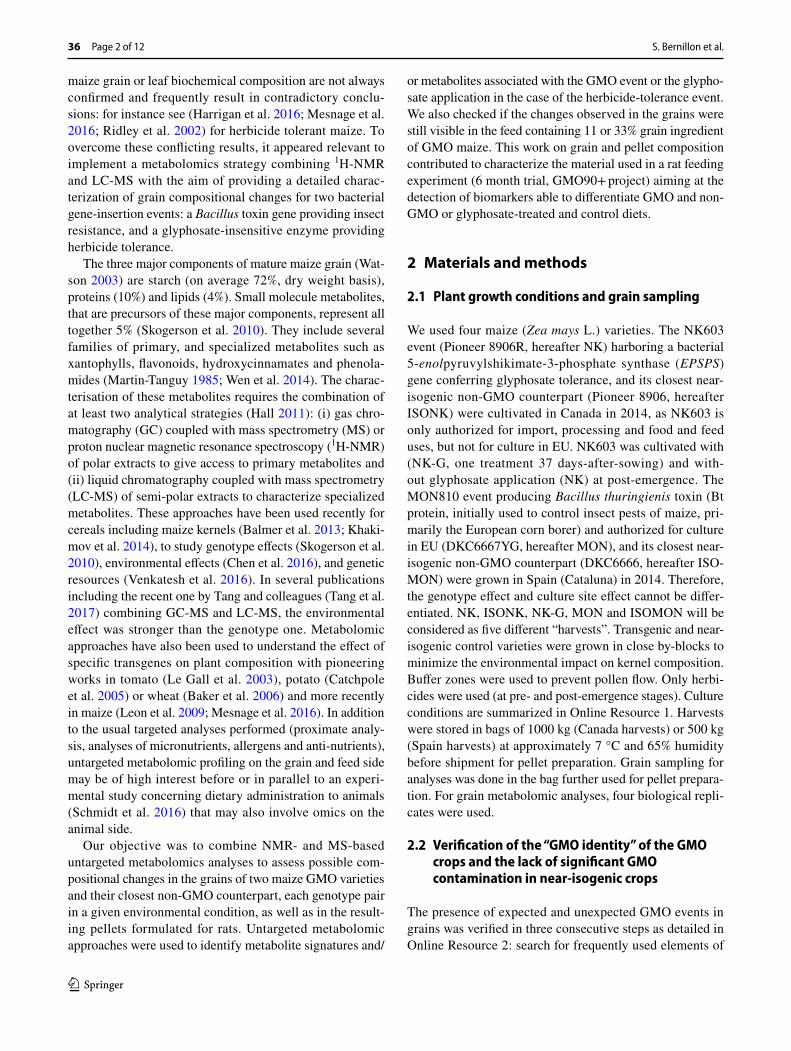
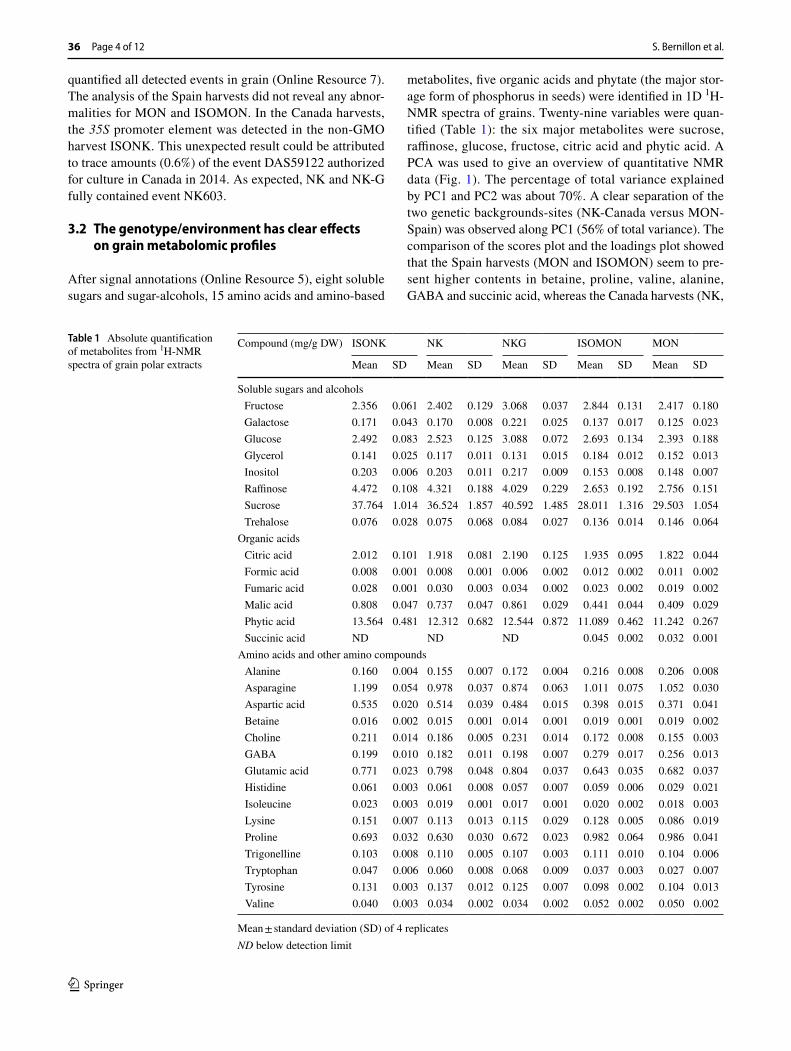
metabolites, five organic acids and phytate (the major stor-age form of phosphorus in seeds) were identified in 1D 1H-NMR spectra of grains. Twenty-nine variables were quan-tified (Table 1): the six major metabolites were sucrose, raffinose, glucose, fructose, citric acid and phytic acid. A PCA was used to give an overview of quantitative NMR data (Fig. 1). The percentage of total variance explained by PC1 and PC2 was about 70%. A clear separation of the two genetic backgrounds-sites (NK-Canada versus MON-Spain) was observed along PC1 (56% of total variance). The comparison of the scores plot and the loadings plot showed that the Spain harvests (MON and ISOMON) seem to pre-sent higher contents in betaine, proline, valine, alanine, GABA and succinic acid, whereas the Canada harvests (NK,
Table 1 Absolute quantification of metabolites from 1H-NMR spectra of grain polar extracts
Mean ± standard deviation (SD) of 4 replicatesND below detection limit
Compound (mg/g DW) ISONK NK NKG ISOMON MON
Mean SD Mean SD Mean SD Mean SD Mean SD
Soluble sugars and alcohols Fructose 2.356 0.061 2.402 0.129 3.068 0.037 2.844 0.131 2.417 0.180 Galactose 0.171 0.043 0.170 0.008 0.221 0.025 0.137 0.017 0.125 0.023 Glucose 2.492 0.083 2.523 0.125 3.088 0.072 2.693 0.134 2.393 0.188 Glycerol 0.141 0.025 0.117 0.011 0.131 0.015 0.184 0.012 0.152 0.013 Inositol 0.203 0.006 0.203 0.011 0.217 0.009 0.153 0.008 0.148 0.007 Raffinose 4.472 0.108 4.321 0.188 4.029 0.229 2.653 0.192 2.756 0.151 Sucrose 37.764 1.014 36.524 1.857 40.592 1.485 28.011 1.316 29.503 1.054 Trehalose 0.076 0.028 0.075 0.068 0.084 0.027 0.136 0.014 0.146 0.064
Organic acids Citric acid 2.012 0.101 1.918 0.081 2.190 0.125 1.935 0.095 1.822 0.044 Formic acid 0.008 0.001 0.008 0.001 0.006 0.002 0.012 0.002 0.011 0.002 Fumaric acid 0.028 0.001 0.030 0.003 0.034 0.002 0.023 0.002 0.019 0.002 Malic acid 0.808 0.047 0.737 0.047 0.861 0.029 0.441 0.044 0.409 0.029 Phytic acid 13.564 0.481 12.312 0.682 12.544 0.872 11.089 0.462 11.242 0.267 Succinic acid ND ND ND 0.045 0.002 0.032 0.001
Amino acids and other amino compounds Alanine 0.160 0.004 0.155 0.007 0.172 0.004 0.216 0.008 0.206 0.008 Asparagine 1.199 0.054 0.978 0.037 0.874 0.063 1.011 0.075 1.052 0.030 Aspartic acid 0.535 0.020 0.514 0.039 0.484 0.015 0.398 0.015 0.371 0.041 Betaine 0.016 0.002 0.015 0.001 0.014 0.001 0.019 0.001 0.019 0.002 Choline 0.211 0.014 0.186 0.005 0.231 0.014 0.172 0.008 0.155 0.003 GABA 0.199 0.010 0.182 0.011 0.198 0.007 0.279 0.017 0.256 0.013 Glutamic acid 0.771 0.023 0.798 0.048 0.804 0.037 0.643 0.035 0.682 0.037 Histidine 0.061 0.003 0.061 0.008 0.057 0.007 0.059 0.006 0.029 0.021 Isoleucine 0.023 0.003 0.019 0.001 0.017 0.001 0.020 0.002 0.018 0.003 Lysine 0.151 0.007 0.113 0.013 0.115 0.029 0.128 0.005 0.086 0.019 Proline 0.693 0.032 0.630 0.030 0.672 0.023 0.982 0.064 0.986 0.041 Trigonelline 0.103 0.008 0.110 0.005 0.107 0.003 0.111 0.010 0.104 0.006 Tryptophan 0.047 0.006 0.060 0.008 0.068 0.009 0.037 0.003 0.027 0.007 Tyrosine 0.131 0.003 0.137 0.012 0.125 0.007 0.098 0.002 0.104 0.013 Valine 0.040 0.003 0.034 0.002 0.034 0.002 0.052 0.002 0.050 0.002
Characterization of GMO or glyphosate effects on the composition of maize grain and maize-based…
1 3
Page 5 of 12 36
ISONK and NK-G) presented higher contents in several sugars or sugar alcohols (sucrose, raffinose, inositol), malic acid, fumaric acid, aspartic acid, glutamic acid, choline, tyrosine and tryptophan. A tendency to separate transgenic MON from isogenic samples appeared on PC2 (13% of total variance). MON samples tended to have lower contents in glycerol, glucose, fructose and citrate compared to ISOMON samples.
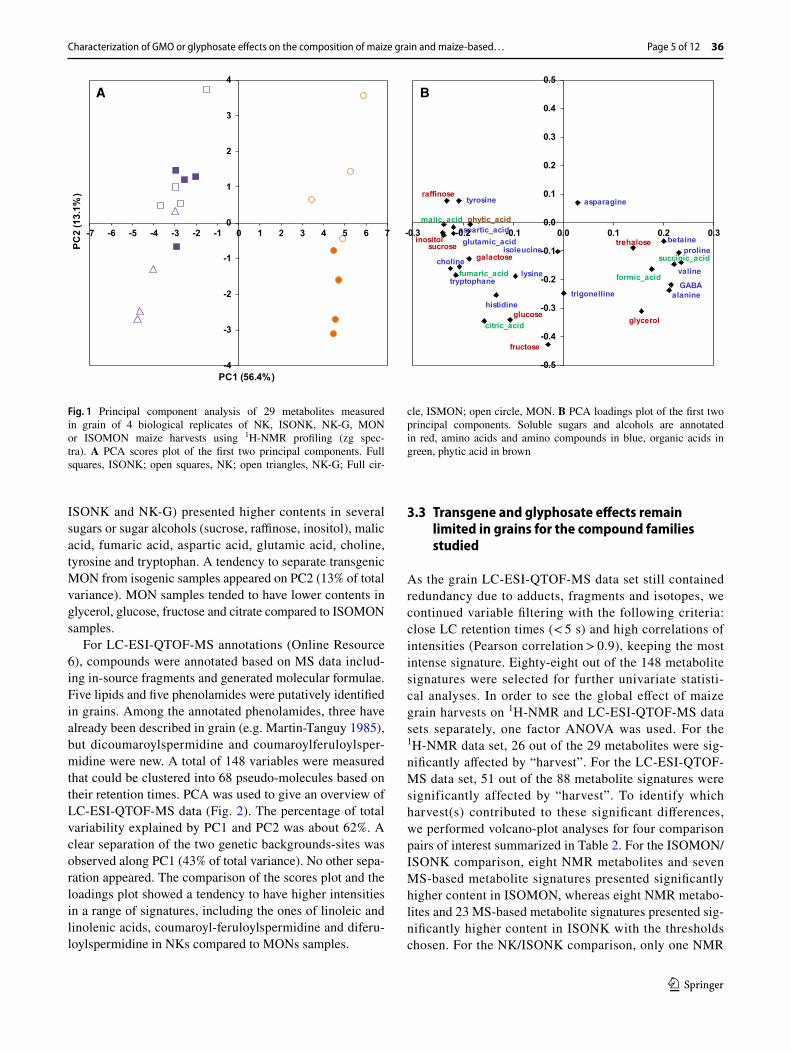
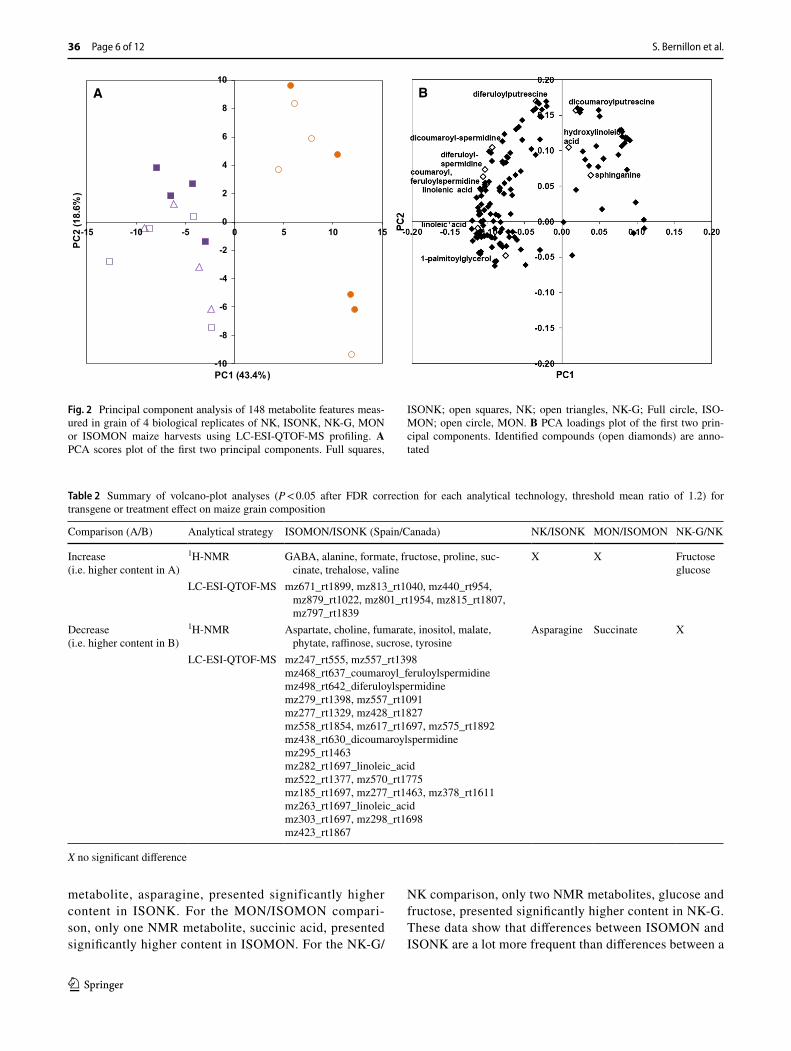
For LC-ESI-QTOF-MS annotations (Online Resource 6), compounds were annotated based on MS data includ-ing in-source fragments and generated molecular formulae. Five lipids and five phenolamides were putatively identified in grains. Among the annotated phenolamides, three have already been described in grain (e.g. Martin-Tanguy 1985), but dicoumaroylspermidine and coumaroylferuloylsper-midine were new. A total of 148 variables were measured that could be clustered into 68 pseudo-molecules based on their retention times. PCA was used to give an overview of LC-ESI-QTOF-MS data (Fig. 2). The percentage of total variability explained by PC1 and PC2 was about 62%. A clear separation of the two genetic backgrounds-sites was observed along PC1 (43% of total variance). No other sepa-ration appeared. The comparison of the scores plot and the loadings plot showed a tendency to have higher intensities in a range of signatures, including the ones of linoleic and linolenic acids, coumaroyl-feruloylspermidine and diferu-loylspermidine in NKs compared to MONs samples.
3.3 Transgene and glyphosate effects remain limited in grains for the compound families studied
As the grain LC-ESI-QTOF-MS data set still contained redundancy due to adducts, fragments and isotopes, we continued variable filtering with the following criteria: close LC retention times (< 5 s) and high correlations of intensities (Pearson correlation > 0.9), keeping the most intense signature. Eighty-eight out of the 148 metabolite signatures were selected for further univariate statisti-cal analyses. In order to see the global effect of maize grain harvests on 1H-NMR and LC-ESI-QTOF-MS data sets separately, one factor ANOVA was used. For the 1H-NMR data set, 26 out of the 29 metabolites were sig-nificantly affected by “harvest”. For the LC-ESI-QTOF-MS data set, 51 out of the 88 metabolite signatures were significantly affected by “harvest”. To identify which harvest(s) contributed to these significant differences, we performed volcano-plot analyses for four comparison pairs of interest summarized in Table 2. For the ISOMON/ISONK comparison, eight NMR metabolites and seven MS-based metabolite signatures presented significantly higher content in ISOMON, whereas eight NMR metabo-lites and 23 MS-based metabolite signatures presented sig-nificantly higher content in ISONK with the thresholds chosen. For the NK/ISONK comparison, only one NMR
-4
-3
-2
-1
0
1
2
3
4
-7 -6 -5 -4 -3 -2 -1 0 1 2 3 4 5 6 7
PC1 (56.4%)
PC2
(13.
1%)
A
trigonelline
formic_acid
histidine
tryptophane
tyrosine
fumaric_acid
sucrose
glucose
trehalose
raffinose
galactose
malic_acid
fructose
glycerol
inositol betaine
choline
asparagine
aspartic_acid
citric_acid
succinic_acid
GABA
proline
lysine
alanine
valine
isoleucineglutamic_acid
phytic_acid
-0.5
-0.4
-0.3
-0.2
-0.1
0.0
0.1
0.2
0.3
0.4
0.5
-0.3 -0.2 -0.1 0.0 0.1 0.2 0.3
B
Fig. 1 Principal component analysis of 29 metabolites measured in grain of 4 biological replicates of NK, ISONK, NK-G, MON or ISOMON maize harvests using 1H-NMR profiling (zg spec-tra). A PCA scores plot of the first two principal components. Full squares, ISONK; open squares, NK; open triangles, NK-G; Full cir-
cle, ISMON; open circle, MON. B PCA loadings plot of the first two principal components. Soluble sugars and alcohols are annotated in red, amino acids and amino compounds in blue, organic acids in green, phytic acid in brown
S. Bernillon et al.
1 3
36 Page 6 of 12
metabolite, asparagine, presented significantly higher content in ISONK. For the MON/ISOMON compari-son, only one NMR metabolite, succinic acid, presented significantly higher content in ISOMON. For the NK-G/
NK comparison, only two NMR metabolites, glucose and fructose, presented significantly higher content in NK-G. These data show that differences between ISOMON and ISONK are a lot more frequent than differences between a
-10
-8
-6
-4
-2
0
2
4
6
8
10
-15 -10 -5 0 5 10 15
PC1 (43.4%)
PC2
(18.
6%)
A B
Fig. 2 Principal component analysis of 148 metabolite features meas-ured in grain of 4 biological replicates of NK, ISONK, NK-G, MON or ISOMON maize harvests using LC-ESI-QTOF-MS profiling. A PCA scores plot of the first two principal components. Full squares,
ISONK; open squares, NK; open triangles, NK-G; Full circle, ISO-MON; open circle, MON. B PCA loadings plot of the first two prin-cipal components. Identified compounds (open diamonds) are anno-tated
Table 2 Summary of volcano-plot analyses (P < 0.05 after FDR correction for each analytical technology, threshold mean ratio of 1.2) for transgene or treatment effect on maize grain composition
X no significant difference
Comparison (A/B) Analytical strategy ISOMON/ISONK (Spain/Canada) NK/ISONK MON/ISOMON NK-G/NK
Increase(i.e. higher content in A)
1H-NMR GABA, alanine, formate, fructose, proline, suc-cinate, trehalose, valine
X X Fructoseglucose
LC-ESI-QTOF-MS mz671_rt1899, mz813_rt1040, mz440_rt954, mz879_rt1022, mz801_rt1954, mz815_rt1807, mz797_rt1839
Decrease(i.e. higher content in B)
1H-NMR Aspartate, choline, fumarate, inositol, malate, phytate, raffinose, sucrose, tyrosine
Asparagine Succinate X
LC-ESI-QTOF-MS mz247_rt555, mz557_rt1398mz468_rt637_coumaroyl_feruloylspermidinemz498_rt642_diferuloylspermidinemz279_rt1398, mz557_rt1091mz277_rt1329, mz428_rt1827mz558_rt1854, mz617_rt1697, mz575_rt1892mz438_rt630_dicoumaroylspermidinemz295_rt1463mz282_rt1697_linoleic_acidmz522_rt1377, mz570_rt1775mz185_rt1697, mz277_rt1463, mz378_rt1611mz263_rt1697_linoleic_acidmz303_rt1697, mz298_rt1698mz423_rt1867
Characterization of GMO or glyphosate effects on the composition of maize grain and maize-based…
1 3
Page 7 of 12 36
GMO and its control, and that the number of metabolites differing between each GMO studied and its control is very low.
3.4 Some changes observed in grain are detected in diets
The composition of the diets produced with the harvests was expected to be different from the maize grain material. The 1H-NMR analyses of the diets allowed quantifying 37 metab-olites: seven soluble sugars or (sugar) alcohols, 19 amino acids or compounds, six organic acids, four nucleotide-like compounds, and 2 unknown compounds (Online Resource 5). The five major metabolites in diets were sucrose, raf-finose plus stachyose, citrate and glycerol. Twenty-four quantifiable metabolites out of 37 were common with those in grains. Five metabolites quantified in grains were not detectable or quantifiable in the diets including fructose and phytic acid. Fifteen more metabolites were only detectable or quantifiable in the diets, including acetic acid, methionine (supplemented in diets), dimethyl amine, trimethyl amine, and several nucleotide-like compounds. The LC-ESI-QTOF-MS analyses of the diets allowed quantifying 970 metabolite signatures. Eight metabolites out of the 11 metabolites puta-tively identified in grains were also found in the diets: five
lipids and three phenolamides (Online Resource 6). Three grain metabolites were not detected in the diets.
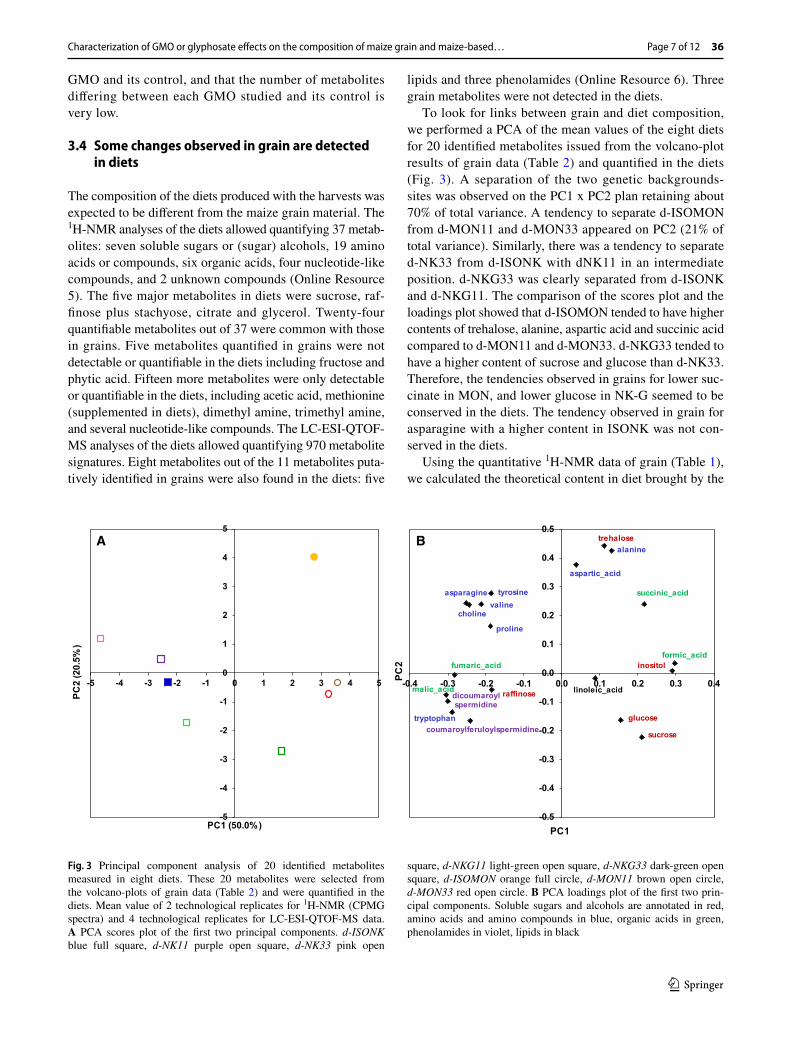
To look for links between grain and diet composition, we performed a PCA of the mean values of the eight diets for 20 identified metabolites issued from the volcano-plot results of grain data (Table 2) and quantified in the diets (Fig. 3). A separation of the two genetic backgrounds-sites was observed on the PC1 x PC2 plan retaining about 70% of total variance. A tendency to separate d-ISOMON from d-MON11 and d-MON33 appeared on PC2 (21% of total variance). Similarly, there was a tendency to separate d-NK33 from d-ISONK with dNK11 in an intermediate position. d-NKG33 was clearly separated from d-ISONK and d-NKG11. The comparison of the scores plot and the loadings plot showed that d-ISOMON tended to have higher contents of trehalose, alanine, aspartic acid and succinic acid compared to d-MON11 and d-MON33. d-NKG33 tended to have a higher content of sucrose and glucose than d-NK33. Therefore, the tendencies observed in grains for lower suc-cinate in MON, and lower glucose in NK-G seemed to be conserved in the diets. The tendency observed in grain for asparagine with a higher content in ISONK was not con-served in the diets.
Using the quantitative 1H-NMR data of grain (Table 1), we calculated the theoretical content in diet brought by the
linoleic_aciddicoumaroylspermidine
coumaroylferuloylspermidine
formic_acid
tryptophan
tyrosine
fumaric_acid
sucrose
trehalose
raffinose
glucose
inositol
choline
asparagine
aspartic_acid
succinic_acid
proline
alanine
valine
malic_acid
-0.5
-0.4
-0.3
-0.2
-0.1
0.0
0.1
0.2
0.3
0.4
0.5
-0.4 -0.3 -0.2 -0.1 0.0 0.1 0.2 0.3 0.4
PC1
PC2
-5
-4
-3
-2
-1
0
1
2
3
4
5
-5 -4 -3 -2 -1 0 1 2 3 4 5
PC1 (50.0%)
PC2
(20.
5%)
A B
Fig. 3 Principal component analysis of 20 identified metabolites measured in eight diets. These 20 metabolites were selected from the volcano-plots of grain data (Table 2) and were quantified in the diets. Mean value of 2 technological replicates for 1H-NMR (CPMG spectra) and 4 technological replicates for LC-ESI-QTOF-MS data. A PCA scores plot of the first two principal components. d-ISONK blue full square, d-NK11 purple open square, d-NK33 pink open
square, d-NKG11 light-green open square, d-NKG33 dark-green open square, d-ISOMON orange full circle, d-MON11 brown open circle, d-MON33 red open circle. B PCA loadings plot of the first two prin-cipal components. Soluble sugars and alcohols are annotated in red, amino acids and amino compounds in blue, organic acids in green, phenolamides in violet, lipids in black
S. Bernillon et al.
1 3
36 Page 8 of 12
maize grain, taking into account the percentage of GMO/non-GMO grain quantity and hypothesizing no modification during pellet processing. We compared this theoretical con-tent with the measured one, for each of the major metabolites in diet quantified in both grains and diets (Online Resource 8). The three major polar metabolites in diets were sucrose, raffinose plus stachyose, and citric acid. Clearly diets had higher contents in sucrose, trehalose, glycerol, citric acid, choline, betaine and free lysine.
4 Discussion
The present grain compositional data are in global agree-ment with data from the literature addressing small mol-ecules in maize grains (Chen et al. 2016; Martin-Tanguy 1985; Skogerson et al. 2010). The effect of genetic back-ground and environment (Spain-MONs vs. Canada-NKs har-vests) on grain composition was considerably larger than the effect of a given genetic modification in one environment, supporting previously reports (Baniasadi et al. 2014; Chen et al. 2016; Frank et al. 2012; Harrigan et al. 2016; Tang et al. 2017). The differences between the Spain-MONs and Canada-NKs harvests concerned a range of primary metabo-lites, including sucrose presenting the highest content, but also lipids and phenolamides. The latter metabolites are involved in plant development and defense against stresses (Bassard et al. 2010; Onkokesung et al. 2012). Our purpose was not to look for ‘substantial equivalence’ (i.e. substan-tial compositional similarity) of each given GMO compared to a range of other non-GMO maize genotypes on several sites or years, as done by Catchpole et al. (2005) and Baker et al. (2006) for other crop species, since our genotypes and harvests were not diverse enough. Our objective was to study the modifications induced by one GMO event in a given culture site. We noticed few significant modifications in grain between the transgenic and the closest available near-isogenic genotype of a given event. For transparency, the spectra have been deposited into Zenodo repository for public access.
4.1 Effect of Bt toxin transgene
For mature ears, NMR profiling of polar extracts on a Bt genotype (MON810 event) cultivated in a growth chamber, showed increases in ethanol, citric acid and glycine betaine (Piccioni et al. 2009). Another NMR profiling study for a similar genotype pair cultivated in a greenhouse (Man-etti et al. 2006), showed increases in asparagine, choline, GABA, glutamine and succinate. However, the ANOVA significance level for the latter studies was not corrected for FDR. In our experiment, succinate content was signifi-cantly lower (ratio of 0.72), after FDR correction, in the
transgenic variety. It has to be kept in mind that succinate had a much lower content than the major-two organic acids in maize grain, citrate and malate, and that measurements of compounds close to the detection limit may have stronger tendencies to vary between studies. A study of grain flour using capillary electrophoresis coupled with MS revealed increases in carnitine and proline-betaine in several Bt GMO samples cultivated in a field (Levandi et al. 2008). A study of grain using 1H-NMR revealed increases in glycine-betaine in a Bt GMO hybrid cultivated in a growth chamber (Pic-cioni et al. 2009). In our experiment, proline-betaine was not detected in the grain NMR spectra probably because it was below detection limit, and gycine-betaine was quantified in grain but not affected. As betaines are involved in responses to several stresses, genotype x environment interactions may contribute to explain the different results listed above. An untargeted analysis combining FT-ICR-MS and CE-TOF-MS on the same maize genotypes (Leon et al. 2009) pro-posed three identified metabolites as biomarkers as they fol-lowed the same pattern in several transgenic/non-transgenic pairs: carnitine (possibly linked with fatty acid metabolism), apigeninidin (a deoxyanthocyanidin) and 5,6-dihydroxyin-dole (implicated in tyrosine metabolism). We did not find signatures that might correspond to these compounds among our LC-ESI-QTOF-MS data. A GC-MS analysis of mature maize kernels showed compositional changes in Bt GMO samples grown at two locations: a decrease in free palmi-toleic acid, phenylalanine and tryptophan, and an increase in citric acid (Frank et al. 2012). This seems to confirm the slight modifications in fatty acid and aromatic amino acid metabolisms cited above and observed by Leon et al. (2009).
NMR or MS-based untargeted analyses of grain should be complemented with targeted analyses of mycotoxins as an indirect effect of Bacillus endotoxin synthesis on Fusarium mycotoxin contamination in grain has been shown, including for fumonisin (Bakan et al. 2002; Bowers et al. 2014). This has been done in a parallel study of the present work, for known and emergent mycotoxins. Data about EU regulated mycotoxins showed that the mycotoxins deoxynivalenol and zearalenone were detected in all harvests, and fumonisins in all harvests from Spain (Chereau et al., personal com-munication). Although all values remained lower than the EU recommendations for animal feed, they were slightly higher for ISOMON than MON in agreement with the two references cited above.
4.2 Effect of bacterial EPSPS transgene
The effects of bacterial EPSPS (NK603 event or other) transgenes have been studied on maize leaf (Benevenuto et al. 2017; Liu et al. 2015) or grain. A study comparing mature grain composition of NK603 with that of its iso-genic counterpart mentioned several significant changes,
Characterization of GMO or glyphosate effects on the composition of maize grain and maize-based…
1 3
Page 9 of 12 36
including an increase in several polyamines, salicylate, nicotinamide, and sinapate, and a decrease in asparagine and glutamine (Mesnage et al. 2016). In our experiment, a significant decrease in asparagine, one of the major free amino acids in mature grain, was also evidenced, but glu-tamine and polyamines were not determined. Glutamine was not detected, putrescine, tryptamine, tyramine, sper-mine, spermidine or sarcosine were below detection limit, and cadaverine could not be quantified due to signal over-lap with lysine. Compared to plant EPSPS alone, the addi-tion of bacterial EPSPS activity may increase the com-petition between the synthesis of aromatic amino acids from phosphoenolpyruvate and that of carboxylic amino acids including aspartate, asparagine, glutamate and then glutamine, through a modification of oxaloacetate and α-ketoglutarate availabilities.
4.3 Effect of glyphosate treatment
Glyphosate (N-(phosphonomethyl)glycine) disrupts the shikimate pathway and aromatic amino acid synthesis through its interaction with the native plant EPSPS. This disruption is restored by the addition of a glyphosate-tolerant bacterial EPSPS gene from Agrobacterium sp. strain CP4 (Funke et al. 2006) in the transgenic plants in the present experiment. In agricultural practices, the transgenic plants usually receive glyphosate treatments during the emergence phase. The herbicide is absorbed and translocated (Hetherington et al. 1999), and some residues of glyphosate and its degradation product ami-nomethyl-phosphonic acid may remain in the transgenic plants as shown for soybean beans (Cuhra et al. 2015; Duke et al. 2017). In relation with these agricultural practices, several studies have compared the transgenic plant receiving glyphosate, to the non-transgenic control without glyphosate, e.g. in (Ridley et al. 2002), but stud-ies of the effect of glyphosate on the transgenic plant are rare. Combined proteomic and metabolomic stud-ies of maize leaf after glyphosate application on plants grown in suboptimal condition (Benevenuto et al. 2017) showed modifications in energy metabolism and several phytohormones. In another study, glyphosate treatment of transgenic glyphosate-tolerant maize was shown to affect 14 metabolites in leaf (Liu et al. 2015), includ-ing an up-regulation of several amino acids. Therefore, glyphosate effect on grain composition may result from a discrete effect at the plant level that does not lead to a visual phenotype. In our experiment, glyphosate applica-tion on transgenic seedlings (NK-G) led to an increase in glucose and fructose in grain. However, it has to be noted that the content of each of these hexoses is about one-tenth that of sucrose in mature grain.
4.4 Variability of results about a given GMO event
The only partially overlapping and often contradictory results obtained with metabolomics analyses of a given organ in plants carrying the same GMO event may result from genetic, environmental and/or technical factors. Whereas the copy number and genome environment of a given event is not subject to change, the introduction in diverse genetic backgrounds is intrinsically linked to ran-dom, small differences other than the transgene between the GMO event and its “closest available near-isogenic” line. In addition, background-related changes such as adaptation to different latitudes or the change from flint to dent ker-nel-type, which concern both GMO and non-GMO maize, may explain that certain compounds are detected in certain genetic backgrounds and not in others. Similarly, the disease pressure may in particular cases be different between GMO and non-GMO. Compositional changes can also be exacer-bated or modified after application of a stress (Benevenuto et al. 2017). Finally, differences in technological reproduc-ibility between analytical strategies, and in statistical proto-cols may also contribute to divergent results in the literature. For instance, untargeted LC-QTOF-MS analyses seem to lead to technological coefficients of variation about 5 times larger than those of quantitative 1H-NMR profiling (Moing et al. 2004; t’Kindt et al. 2009). Therefore, 1H-NMR should allow detecting lower differences between control and GMO samples than LC-QTOF-MS. In addition, compared to tar-geted analyses of dozen of metabolites, untargeted analyses of hundreds of metabolite-signatures are usually followed with univariate analyses that use false discovery rate, or other multiple testing corrections, to limit false positive results (Vinaixa et al. 2012).
4.5 Diets characterization before feeding experiments
The preparation of the diets containing maize grains involved extrusion with heating leading to several modi-fications (Singh et al. 2007), potentially ionizing irradia-tion, storage conditions, dilution, and complementation with ingredients bringing in numerous compounds. It has to be kept in mind that the sum of soluble compounds represents about 5% of maize grain DW and that maize grain content is 33% of the diet in our experiment. Based on the quantifications performed using grain 1H-NMR profiling, we compared the theoretical maize contribu-tion to diet contents with the measured diet contents. This showed higher contents in sucrose, trehalose, citric acid, choline, betaine, lysine and glycerol in diets. The content of free lysine recovered in the diets was close to the con-tent of free lysine added during the formulation. Sucrose may originate from soybean (Kumar et al. 2010), choline
S. Bernillon et al.
1 3
36 Page 10 of 12
and betaine from wheat bran (Graham et al. 2009), free glycerol from soybean oil. The compositional differences observed here between the grains and the diets for the major polar compounds, and the parallel targeted analyses of contaminants and pollutants (Chereau et al., personal communication) point towards the need to characterize both grains and diets before animal feeding experiments. We checked whether the tendencies observed in grains remained in diets. Although it concerned minor polar metabolites quantified in diets, the tendency observed for succinate in MON, and that observed for glucose in NK-G remained in the diets. The combination of targeted and untargeted approaches provided a detailed description of the diets that can later be mined with physiological, cyto-logical and metabolomic data collected during a feeding experiment on rat using these diets.
5 Conclusions
The quality of the biological material used for diet produc-tion in a chronic rat-feeding experiment (Coumoul et al., personal communication) was verified through careful analy-sis of a variety of genetic and biochemical parameters. The metabolomic analyses of grains, revealed consistent global differences between NK/Canada and MON/Spain harvests, and subtle differences between ISONK and NK, ISO-MON and MON, or NK and NK-G. Several of the changes observed in grains were retained in the corresponding diets. This detailed characterization opened the way to a feeding study on rats.
Acknowledgements We thank Drs Pablo Steinberg, Ralf Wilhelm and Joachim Schiemann (G-TwYST, EC project) for having shared the maize production and preliminary targeted analyses of the grains, and Dr Maria Pla (IRTA Mas Badia Field Station) and the farmers involved in maize culture, harvest and drying for providing the grain samples cultivated in Spain. We are grateful to the members of the scientific council of RiskOGM program for their follow-up and advice.
Funding We thank the French Ministry of Ecological and Solidar-ity Transition (RiskOGM program) for the financial support of the GMO90+ research project, and MetaboHUB (ANR-11-INBS-0010) and PHENOME (ANR-11-INBS-0012) projects for financing.
Compliance with ethical standards
Conflict of interest Conflicts of interest of the principal investigators are declared on the public RiskOGM programme website (http://reche rche-risko gm.fr/en/page/partn ers-pdis).
Ethical approval The GMO plant samples followed dedicated labo-ratory procedures concerning their identification and destruction. Although this article is related to a project involving animals (Study approved by French Ethical Committee CETEA), it does not contain any study with animals performed by any of the authors.
References
Bakan, B., Melcion, D., Richard-Molard, D., & Cahagnier, B. (2002). Fungal growth and Fusarium mycotoxin content in isogenic tra-ditional maize and genetically modified maize grown in France and Spain. Journal of Agricultural and Food Chemistry, 50(4), 728–731. https ://doi.org/10.1021/jf010 8258.
Baker, J. M., Hawkins, N. D., Ward, J. L., Lovegrove, A., Napier, J. A., Shewry, P. R., et al. (2006). A metabolomic study of sub-stantial equivalence of field-grown genetically modified wheat. Plant Biotechnology Journal, 4(4), 381–392. https ://doi.org/10.1111/j.1467-7652.2006.00197 .x.
Balmer, D., Papajewski, D. V., Planchamp, C., Glauser, G., & Mauch-Mani, B. (2013). Induced resistance in maize is based on organ-specific defence responses. The Plant Journal, 74(2), 213–225. https ://doi.org/10.1111/tpj.12114 .
Baniasadi, H., Vlahakis, C., Hazebroek, J., Zhong, C., & Asiago, V. (2014). Effect of environment and genotype on commercial maize hybrids using LC/MS-based metabolomics. Journal of Agricultural and Food Chemistry, 62(6), 1412–1422. https ://doi.org/10.1021/jf404 702g.
Bassard, J.-E., Ullmann, P., Bernier, F., & Werck-Reichhart, D. (2010). Phenolamides: Bridging polyamines to the phenolic metabolism. Phytochemistry, 71(16), 1808–1824. https ://doi.org/10.1016/j.phyto chem.2010.08.003.
Benevenuto, R. F., Agapito-Tenfen, S. Z., Vilperte, V., Wikmark, O.-G., van Rensburg, P. J., & Nodari, R. O. (2017). Molecular responses of genetically modified maize to abiotic stresses as determined through proteomic and metabolomic analyses. PLoS ONE, 12(2), e0173069. https ://doi.org/10.1371/journ al.pone.01730 69.
Biais, B., Allwood, J. W., Deborde, C., Xu, Y., Maucourt, M., Beauvoit, B., et al. (2009). 1H NMR, GC-EI-TOFMS, and data set corre-lation for fruit metabolomics: Application to spatial metabolite analysis in melon. Analytical Chemistry, 81(8), 2884–2894. https ://doi.org/10.1021/ac900 1996.
Bowers, E., Hellmich, R., & Munkvold, G. (2014). Comparison of fumonisin contamination using HPLC and ELISA methods in Bt and near-isogenic maize hybrids infested with european corn borer or western bean cutworm. Journal of Agricultural and Food Chemistry, 62(27), 6463–6472. https ://doi.org/10.1021/jf501 1897.
Catchpole, G. S., Beckmann, M., Enot, D. P., Mondhe, M., Zywicki, B., Taylor, J., et al. (2005). Hierarchical metabolomics demonstrates substantial compositional similarity between genetically modi-fied and conventional potato crops. Proceedings of the National Academy of Sciences of the United States of America, 102(40), 14458–14462. https ://doi.org/10.1073/pnas.05039 55102 .
Chen, M., Rao, R. S. P., Zhang, Y., Zhong, C., & Thelen, J. J. (2016). Metabolite variation in hybrid corn grain from a large-scale multisite study. The Crop Journal, 4(3), 177–187. https ://doi.org/10.1016/j.cj.2016.03.004.
Cuhra, M., Traavik, T., Dando, M., Primicerio, R., Holderbaum, D. F., & Bøhn, T. (2015). Glyphosate-residues in roundup-ready soybean impair Daphnia magna life-cycle. Journal of Agricul-tural Chemistry and Environment, 4(01), 24–36. https ://doi.org/10.4236/jacen .2015.41003 .
Domingo, J. L. (2016). Safety assessment of GM plants: An updated review of the scientific literature. Food and Chemical Toxicology, 95, 12–18. https ://doi.org/10.1016/j.fct.2016.06.013.
Domingo, J. L., & Giné Bordonaba, J. (2011). A literature review on the safety assessment of genetically modified plants. Environment International, 37(4), 734–742. https ://doi.org/10.1016/j.envin t.2011.01.003.
Duke, S. O., Rimando, A. M., Reddy, K. N., Cizdziel, J. V., Bellaloui, N., Shaw, D. R., et al. (2017). Lack of transgene and glyphosate
Characterization of GMO or glyphosate effects on the composition of maize grain and maize-based…
1 3
Page 11 of 12 36
effects on yield, and mineral and amino acid content of glypho-sate-resistant soybean. Pest Management Science. https ://doi.org/10.1002/ps.4625.
Fan, T. W. M. (1996). Metabolite profiling by one- and two-dimen-sional NMR analysis of complex mixtures. Progress in Nuclear Magnetic Resonance Spectroscopy, 28(2), 161–219. https ://doi.org/10.1016/0079-6565(95)01017 -3.
Frank, T., Röhlig, R. M., Davies, H. V., Barros, E., & Engel, K.-H. (2012). Metabolite profiling of maize kernel—genetic modifica-tion versus environmental influence. Journal of Agricultural and Food Chemistry, 60(12), 3005–3012. https ://doi.org/10.1021/jf204 167t.
Funke, T., Han, H., Healy-Fried, M. L., Fischer, M., & Schönbrunn, E. (2006). Molecular basis for the herbicide resistance of Roundup Ready crops. Proceedings of the National Academy of Sciences USA, 103(35), 13010–13015, https ://doi.org/10.1073/pnas.06036 38103 .
Graham, S. F., Hollis, J. H., Migaud, M., & Browne, R. A. (2009). Analysis of betaine and choline contents of aleurone, bran, and flour fractions of wheat (Triticum aestivum L.) using 1H nuclear magnetic resonance (NMR) spectroscopy. Journal of Agricultural and Food Chemistry, 57(5), 1948–1951. https ://doi.org/10.1021/jf802 885m.
Hall, R. D. (2011). Plant metabolomics in a nutshell: Potential and future challenges. In R. D. Hall (Ed.), Biology of plant metabo-lomics (Vol. 43, pp. 1–24). Oxford: Wiley-Blackwell.
Harrigan, G. G., Venkatesh, T. V., Leibman, M., Blankenship, J., Perez, T., Halls, S., et al. (2016). Evaluation of metabolomics profiles of grain from maize hybrids derived from near-isogenic GM positive and negative segregant inbreds demonstrates that observed differ-ences cannot be attributed unequivocally to the GM trait. Metabo-lomics, 12(5), 82. https ://doi.org/10.1007/s1130 6-016-1017-6.
Hetherington, P. R., Reynolds, T. L., Marshall, G., & Kirkwood, R. C. (1999). The absorption, translocation and distribution of the herbicide glyphosate in maize expressing the CP-4 transgene. Journal of Experimental Botany, 50(339), 1567–1576. https ://doi.org/10.1093/jxb/50.339.1567.
Hilbeck, A., Binimelis, R., Defarge, N., Steinbrecher, R., Székács, A., Wickson, F., et al. (2015). No scientific consensus on GMO safety. Environmental Sciences Europe, 27(1), 4. https ://doi.org/10.1186/s1230 2-014-0034-1.
Jacob, D., Deborde, C., Lefebvre, M., Maucourt, M., & Moing, A. (2017). NMRProcFlow: A graphical and interactive tool dedicated to 1D spectra processing for NMR-based metabolomics. Metabo-lomics, 13(4), 36. https ://doi.org/10.1007/s1130 6-017-1178-y.
Khakimov, B., Bak, S., & Engelsen, S. B. (2014). High-throughput cereal metabolomics: Current analytical technologies, challenges and perspectives. Journal of Cereal Science, 59(3), 393–418. https ://doi.org/10.1016/j.jcs.2013.10.002.
Kumar, V., Rani, A., Goyal, L., Dixit, A. K., Manjaya, J., Dev, J., et al. (2010). Sucrose and raffinose family oligosaccharides (RFOs) in soybean seeds as influenced by genotype and growing location. Journal of Agricultural and Food Chemistry, 58(8), 5081–5085. https ://doi.org/10.1021/jf903 141s.
Le Gall, G., Colquhoun, I. J., Davis, A. L., Collins, G. J., & Verhoeyen, M. E. (2003). Metabolite profiling of tomato (Lycopersicon escu-lentum) using 1H NMR spectroscopy as a tool to detect potential unintended effects following a genetic modification. Journal of Agricultural and Food Chemistry, 51(9), 2447–2456. https ://doi.org/10.1021/jf025 9967.
Leon, C., Rodriguez-Meizoso, I., Lucio, M., Garcia-Cañas, V., Ibañez, E., Schmitt-Kopplin, P., et al. (2009). Metabolomics of transgenic maize combining Fourier transform-ion cyclo-tron resonance-mass spectrometry, capillary electropho-resis-mass spectrometry and pressurized liquid extraction.
Journal of Chromatography A, 1216(43), 7314–7323. https ://doi.org/10.1016/j.chrom a.2009.04.092.
Levandi, T., Leon, C., Kaljurand, M., Garcia-Cañas, V., & Cifuentes, A. (2008). Capillary electrophoresis time-of-flight mass spectrom-etry for comparative metabolomics of transgenic versus conven-tional maize. Analytical Chemistry, 80(16), 6329–6335. https ://doi.org/10.1021/ac800 6329.
Liu, Y., Zhang, Y., Liu, Y., Lu, W., & Wang, G. (2015). Metabolic effects of glyphosate on transgenic maize expressing a G2-EPSPS gene from Pseudomonas fluorescens. Journal of Plant Biochem-istry and Biotechnology, 24(2), 233–241. https ://doi.org/10.1007/s1356 2-014-0263-9.
Manetti, C., Bianchetti, C., Casciani, L., Castro, C., Di Cocco, M. E., Miccheli, A., et al. (2006). A metabonomic study of transgenic maize (Zea mays) seeds revealed variations in osmolytes and branched amino acids. Journal of Experimental Botany, 57(11), 2613–2625. https ://doi.org/10.1093/jxb/erl02 5.
Martin-Tanguy, J. (1985). The occurrence and possible function of hydroxycinnamoyl acid amides in plants. Plant Growth Regula-tion, 3(3), 381–399. https ://doi.org/10.1007/bf001 17595 .
Mesnage, R., Agapito-Tenfen, S. Z., Vilperte, V., Renney, G., Ward, M., Séralini, G.-E., et al. (2016). An integrated multi-omics analy-sis of the NK603 Roundup-tolerant GM maize reveals metabo-lism disturbances caused by the transformation process. Scientific Reports, 6, 37855. https ://doi.org/10.1038/srep3 7855.
Moing, A., Maucourt, M., Renaud, C., Gaudillere, M., Brouquisse, R., Lebouteiller, B., et al. (2004). Quantitative metabolic profiling by 1-dimensional 1H-NMR analyses: Application to plant genet-ics and functional genomics. Functional Plant Biology, 31(9), 889–902. https ://doi.org/10.1071/FP040 66.
Mounet, F., Lemaire-Chamley, M., Maucourt, M., Cabasson, C., Girau-del, J.-L., Deborde, C., et al. (2007). Quantitative metabolic pro-files of tomato flesh and seeds during fruit development: Com-plementary analysis with ANN and PCA. Metabolomics, 3(3), 273–288. https ://doi.org/10.1007/s1130 6-007-0059-1.
Onkokesung, N., Gaquerel, E., Kotkar, H., Kaur, H., Baldwin, I. T., & Galis, I. (2012). MYB8 Controls inducible phenolamide levels by activating three novel hydroxycinnamoyl-coenzyme A:polyamine transferases in Nicotiana attenuata. Plant Physiology, 158(1), 389–407. https ://doi.org/10.1104/pp.111.18722 9.
Piccioni, F., Capitani, D., Zolla, L., & Mannina, L. (2009). NMR metabolic profiling of transgenic maize with the Cry1A (b) gene. Journal of Agricultural and Food Chemistry, 57(14), 6041–6049.
Ridley, W. P., Sidhu, R. S., Pyla, P. D., Nemeth, M. A., Breeze, M. L., & Astwood, J. D. (2002). Comparison of the nutritional profile of glyphosate-tolerant corn event NK603 with that of conventional corn (Zea mays L.). Journal of Agricultural and Food Chemistry, 50(25), 7235–7243. https ://doi.org/10.1021/jf020 5662.
Schmidt, K., Döhring, J., Kohl, C., Pla, M., Kok, E. J., Glandorf, D. C. M., et al. (2016). Proposed criteria for the evaluation of the scientific quality of mandatory rat and mouse feeding trials with whole food/feed derived from genetically modified plants. Archives of toxicology, 90(9), 2287–2291. https ://doi.org/10.1007/s0020 4-016-1762-3.
Shen, X., Gong, X., Cai, Y., Guo, Y., Tu, J., Li, H., et al. (2016). Nor-malization and integration of large-scale metabolomics data using support vector regression. Metabolomics, 12(5), 89. https ://doi.org/10.1007/s1130 6-016-1026-5.
Singh, S., Gamlath, S., & Wakeling, L. (2007). Nutritional aspects of food extrusion: A review. International Journal of Food Sci-ence & Technology, 42(8), 916–929. https ://doi.org/10.1111/j.1365-2621.2006.01309 .x.
Skogerson, K., Harrigan, G. G., Reynolds, T. L., Halls, S. C., Ruebelt, M., Iandolino, A., et al. (2010). Impact of genetics and environ-ment on the metabolite composition of maize grain. Journal of
S. Bernillon et al.
1 3
36 Page 12 of 12
Agricultural and Food Chemistry, 58(6), 3600–3610. https ://doi.org/10.1021/jf903 705y.
Smith, C. A., Want, E. J., O’Maille, G., Abagyan, R., & Siuzdak, G. (2006). XCMS: Processing mass spectrometry data for metabo-lite profiling using nonlinear peak alignment, matching, and identification. Analytical Chemistry, 78(3), 779–787. https ://doi.org/10.1021/ac051 437y.
t’Kindt, R., Morreel, K., Deforce, D., Boerjan, W., & Van Bocxlaer, J. (2009). Joint GC–MS and LC–MS platforms for comprehen-sive plant metabolomics: Repeatability and sample pre-treatment. Journal of Chromatography B, 877(29), 3572–3580. https ://doi.org/10.1016/j.jchro mb.2009.08.041.
Tang, W., Hazebroek, J., Zhong, C., Harp, T., Vlahakis, C., Baumhover, B., et al. (2017). Effect of genetics, environment, and phenotype on the metabolome of maize hybrids using GC/MS and LC/MS. Journal of Agricultural and Food Chemistry, 65(25), 5215–5225. https ://doi.org/10.1021/acs.jafc.7b004 56.
Venkatesh, T. V., Chassy, A. W., Fiehn, O., Flint-Garcia, S., Zeng, Q., Skogerson, K., et al. (2016). Metabolomic assessment of key
maize resources: GC-MS and NMR Profiling of grain from B73 hybrids of the Nested Association Mapping (NAM) Founders and of geographically diverse landraces. Journal of Agricultural and Food Chemistry, 64(10), 2162–2172. https ://doi.org/10.1021/acs.jafc.5b049 01.
Vinaixa, M., Samino, S., Saez, I., Duran, J., Guinovart, J. J., & Yanes, O. (2012). A Guideline to Univariate Statistical Analysis for LC/MS-Based Untargeted Metabolomics-Derived Data. Metabolites, 2(4), 775–795. https ://doi.org/10.3390/metab o2040 775.
Watson, S. A. (2003). Description, development, structure and com-position of the corn kernel. In P. J. White & L. A. Johnson (Eds.), Corn: Chemistry and technology, Second Edition (pp. 69–106). St Paul, MN: AACC.
Wen, W., Li, D., Li, X., Gao, Y., Li, W., Li, H., et al. (2014). Metabo-lome-based genome-wide association study of maize kernel leads to novel biochemical insights. Nature Communications, 5, 3438. https ://doi.org/10.1038/ncomm s4438 .
Wusirika, R., Bohn, M., Lai, J., & Kole, C. (Eds.). (2014). Genetics, genomics and breeding of maize. Boca Raton, FL: CRC Press.
Affiliations
Stéphane Bernillon1,2 · Mickaël Maucourt1,2 · Catherine Deborde1,2 · Sylvain Chéreau3 · Daniel Jacob1,2 · Nathalie Priymenko4 · Bérengère Laporte4 · Xavier Coumoul5 · Bernard Salles4 · Peter M. Rogowsky6 · Florence Richard‑Forget3 · Annick Moing1,2
Stéphane Bernillon [email protected]
Mickaël Maucourt [email protected]
Catherine Deborde [email protected]
Sylvain Chéreau [email protected]
Daniel Jacob [email protected]
Nathalie Priymenko [email protected]
Bérengère Laporte [email protected]
Xavier Coumoul [email protected]
Bernard Salles [email protected]
Peter M. Rogowsky [email protected]
Florence Richard-Forget [email protected]
1 UMR1332 Biologie du Fruit et Pathologie, INRA, Univ. Bordeaux, Centre INRA de Nouvelle Aquitaine - Bordeaux, 71 av Edouard Bourlaux, 33140 Villenave d’Ornon, France
2 Plateforme Métabolome du Centre de Génomique Fonctionnelle Bordeaux, MetaboHUB, PHENOME, IBVM, Centre INRA de Nouvelle Aquitaine - Bordeaux, 71 av Edouard Bourlaux, 33140 Villenave d’Ornon, France
3 UR MycSA, INRA, Centre INRA de Nouvelle Aquitaine - Bordeaux, 71 av Edouard Bourlaux, 33140 Villenave d’Ornon, France
4 Toxalim (Research Centre in Food Toxicology), Université de Toulouse, INRA, ENVT, INP-Purpan, UPS, 31027 Toulouse, France
5 UMRS1124, Toxicologie, Pharmacologie et Signalisation Cellulaire, INSERM, Univ. Paris Descartes, 75000 Paris, France
6 Laboratoire Reproduction et Développement des Plantes, Univ. Lyon, ENS de Lyon, UCB Lyon 1 CNRS, INRA, 69000 Lyon, France