Embed Size (px)
Citation preview
Characterization of genome
partitioning system of Deinococcus
radiodurans
By
Vijaya Kumar Charaka
LIFE01200704005
Bhabha Atomic Research Centre
A thesis submitted to the
Board of Studies in Life Sciences
In partial fulfillment of requirements
For the Degree of
DOCTOR OF PHILOSOPHY
of
HOMI BHABHA NATIONAL INSTITUTE
December 2012

HOMI BHABHA NATIONAL INSTITUTE
RECOMMENDATIONS OF THE VIVA VOCE BOARD
As members of the Viva Voce Board, we certify that we have read the dissertation
prepared by Vijaya Kumar Charaka entitled „Characterization of genome
partitioning system of Deinococcus radiodurans’ and recommend that it may be
accepted as fulfilling the dissertation requirement for the Degree of Doctor of
Philosophy.
Chairman – Prof. A. K. Sharma
________________________________________________________ Date:
External examiner: Dr. J. Gowrishankar
_________________________________________________________ Date:
Member - Prof. J. R. Bandekar
_______________________________________________________ Date:
Member - Prof. (Mrs) J. K. Sainis
_________________________________________________________ Date:
Member - Prof. Dulal Panda
______________________________________________________ Date:
Guide – Prof. H. S. Misra
_________________________________________________________ Date:
Final approval and acceptance of this dissertation is contingent upon the candidate‟s
submissionof the final copies of the dissertation to HBNI.
I hereby certify that I have read this dissertation prepared under my direction and
recommend that it may be accepted as fulfilling the dissertation requirement.
Date:
Place: (H. S. Misra)
(Guide)
STATEMENT BY AUTHOR
This dissertation has been submitted in partial fulfillment of requirements for an
advanced degree at Homi Bhabha National Institute (HBNI) and is deposited in the
library to be made available to borrowers under rules of the HBNI.
Brief quotations from this dissertation are allowable without special permission, provided
that accurate acknowledgement of source is made. Requests for permission for extended
quotation from or reproduction of this manuscript in whole or in part may be granted by
the Competent Authority of HBNI when in his or her judgment the proposed use of the
material is in the interests of scholarship. In all other instances, however, permission must
be obtained from the author.
Vijaya Kumar Charaka

DECLARATION
I, hereby declare that the investigation presented in the thesis has been carried out by
me. The work is original and has not been submitted earlier as a whole or in part for a
degree / diploma at this or any other Institution / University.
Vijaya Kumar Charaka
ACKNOWLEDGEMENTS
I express my deep and heartfelt sincere gratitude to my guide, Prof. H. S. Misra,
Head, Molecular Genetics Section, Molecular Biology Division, for suggesting this
research problem and for sustained guidance and encouragement throughout the period of
research. I also express my utmost gratitude to him for his constructive criticism,
valuable suggestions and good wishes.
I express my sincere thanks to Prof. A. K. Sharma, Head, and FTD for his
encouragement, moral support and valuable guidance, which inspired me to do my best. I
am also grateful to Prof. (Mrs) J. K. Sainis, Raja Ramanna Fellow, Prof. J. R. Bandekar,
Head, RBHSD and Prof. Dulal Panda, School of Bioscience and Bioengineering, IIT
Bombay, members of my doctoral committee for providing valuable suggestions during
the completion of this work.
It is my great privilege to acknowledge Dr. S. K. Apte, Associate Director (B), BMG
and Head, MBD for his encouragement, moral support and valuable guidance, inspired
me to do my best. I thank Prof. Marc Bramkamp, Ludwig - Maximilians University for
his invaluable support both on academic and personal fronts, I am extremely grateful to
him. I am always very influenced by his vast knowledge, perfect scientific concepts, hard
working nature, and sincerity in this area of science.
I take this opportunity to thank all my lab mates and friends Dr. Swati Kota, A. D. Das, Dr.
Y.S.Rajpurohit, Dr. Nivedita P. Khairnar, Dr. Shruti Desai, Dr. Vidya Kamble, Ms. Kruti Mehta, Ms.
Alka Gupta, Dr. Rajinikanth, Maralihalli, Catriona Donovan, Boris. S, Juri. B and Sunil D. Dhotre
and all other friends for their constant support.
I acknowledge Department of Atomic Energy, Bhabha Atomic Research Centre financial
assistance for my Ph.D. At the end, my heartfelt gratitude to all my family members who
have always encouraged and supported me.
December, 2012
MBD, BARC Vijaya Kumar Charaka
TABLE OF CONTENTS
Synopsis 1-16
List of figures 17-18
List of Tables 19
List of abbreviations 20-52
Chapter 1 General introduction and review of literature 20-51
1.1 Mechanisms of bacterial genome segregation 22-24
1.2 Mechanisms of Plasmid segregation 24-37
1.2.1 Type I partition system 25-33
1.2.2 Type II partition system 33-34
1.2.3 Type III partition system 35
1.2.4 Type IV partition system 35-36
1.2.5 Transcriptional regulation of parAB genes 36-37
1.3 Mechanisms of chromosome segregation in bacteria 37-44
1.4 Deinococcus radiodurans as a model organism 44-51
Chapter 2 Materials and methods 52- 83
2.1. Materials 53-54
2.2 Composition of commonly used analytical reagents 54-63
2.3 Methods 63- 83
2.3.1 Microbiological methods
2.3.2 Methods used in molecular studies
2.3.2.1 Isolation of plasmid DNA (mini prep)
2.3.2.2 Large scale preparation of plasmid DNA
2.3.2.3 Genomic DNA isolation
2.3.2.4 Agarose gel electrophoresis
2.3.2.5 PCR amplification
2.3.2.6 DNA manipulation.
2.3.2.7 Bacterial transformation
2.3.2.8 Methods used in proteins purification
2.3.2.9 Microscopy
2.3.2.10 Statistical Analyses
Chapter 3 Results 84 -186
Chapter 3.1 Identification of genome partitioning elements 86-102
3.1.1 Methods 86-87
3.1.2 Results 87 -102
3.1.2.1 Identification of centromere like sequences in D. radiodurans 87 – 90
3.1.2.2 Bioinformatic analysis of trans factors in D. radiodurans 90 -102
3.1.2.2.1 Genetic organization of ‘par’ operon 90
3.1.3.2.2 Comparison of ParB family proteins with ParB’s of this bacterium 91 – 94
3.1.3.2.3 Comparative analysis of ParA family proteins with ParA’s of this bacterium 95- 98
3.1.3.2.4 Phylogenetic analysis of ‘Par’ proteins 98 -102
Chapter 3.2 Functional characterization of chromosome I partition system 103-144
3.2.1 . Materials and methods 105-111
3.2.1.1. Expression of recombinant ParB1 and ParA1
3.2.1.2 Purification of recombinant ParA1 /ParB1proteins
3.2.1.3 DNA protein interaction studies
3.2.1.4 Measurements of ATPase activity
3.2.1.5 Cloning of segS elements on mini-F plasmid and plasmid stability studies
3.2.1.6 Determination of plasmid to chromosome ratio
3.2.1.7 Construction of parB1 deletion mutant in D. radiodurans
3.2.1.8 Generation of GFP - ParB1 / GFP- ParA1 translation fusion protein
3.2.1.9 Microscopic studies
3.2.1.10 Oligomerization studies using sedimentation assay and light scattering
3.2.2.0 Results 111 - 144
3.2.2.1 ParA1 and ParB1 were expressed in E. coli and purified to homogeneity
3.2.2.2 ParB1 showed specific interaction with predicted centromere
3.2.2.3 ParA1 is a DNA binding ATPase in vitro
3.2.2.4 Interaction of ParA1 with DNA
3.2.2.5 ParA1 interaction with ParB1 bound with DNA
3.2.2.6 In vivo characterization of chromosome I of partition proteins
Chapter 3.3 Molecular studies on chromosome II partitioning proteins 145 -174
3.3. 1 Materials and Methods 147-152
3.3. 1.1 Cloning of recombinant ParA2 protein
3.3.1.2 Expression and purification of recombinant proteins
3.3.1.3 DNA protein interaction studies
3.3.1.4 Measurements of ATPase and GTPase activities
3.3.1.5 Sedimentation Analysis
3.3.1.6 Construction of parB2 deletion mutant in D. radiodurans
3.3.1.7 Microscopic studies 3.3.1.8 Co-localization of ParA2-CFP and FtsZ-YFP and Fluorescence microscopic
Studies
3.3.2.0 Results 153-174
3.3.2.1 The parB2 mutant of D. radiodurans showed pleiotropic phenotypes
3.3.2.2 Mechanism(s) of ParA2 inhibition of cell division
3.3.2.3 ParA2 effect on characteristics features of recombinant FtsZEc
3.3.2.4 Cell division inhibition through Nucleoid occlusion mechanism in ParA2
expressing cells
Chapter 4 Discussion 175-182
Chapter 5 Summary and future perspectives 183- 188
Reference 189 -198

1
SYNOPSIS
Introduction:
An accurate duplication and transmission of genetic information is a fundamental
attribute of the life and that determines the successful inheritance of different phenotypes
in daughter cells. Chromosome segregation in eukaryotic system are relatively better
understood, whereas the understanding of segregation mechanism in prokaryotes remains
obscure (Leonard et al., 2005). In 1963 a passive model was first proposed, which
suggested that the separation of duplicated chromosomes occurs by formation of the septa
at the mid of the cell. Information obtained by employing the recent advances in
microscopy and electrophoresis etc. suggested that DNA segregation in bacteria is an
active process (Draper and Gober, 2002;Ebersbach and Gerdes, 2005;Fogel and Waldor,
2005;Gerdes et al., 2010;Gordon and Wright, 2000;Moller-Jensen and Gerdes, 2007). In
bacteria, the genome partitioning occurs mainly by pushing or pulling of duplicated
genome toward the cell poles. This involves three core components (i) centromere like
sequence or cis-element (Lin and Grossman, 1998;Martin et al., 1991) (ii) a centromere
binding protein (Schumacher et al., 2010;Vecchiarelli et al., 2010) and (iii) an actin
homologue of bacterial ATPase, which through the dynamics created during
polymerization/depolymerization of this protein provide force leading to the separation of
daughter chromosomes in opposite direction (Ebersbach and Gerdes, 2001;Fogel and
Waldor, 2006;Salje et al., 2010;Shebelut et al., 2010). There are different types of cis
elements like parS in P1 plasmid, parC in R1 plasmid (Gerdes et al., 2010) and
chromosomal centromeres (similar to Bacillus subtilis) have been reported from the
2
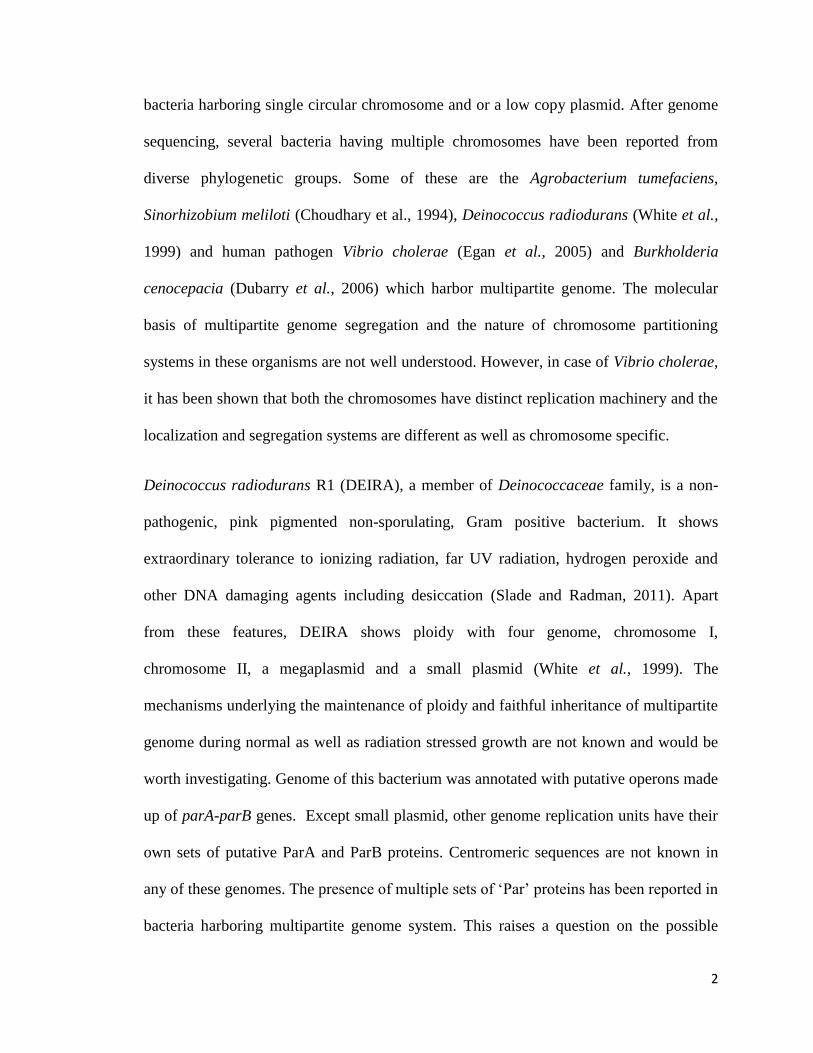
bacteria harboring single circular chromosome and or a low copy plasmid. After genome
sequencing, several bacteria having multiple chromosomes have been reported from
diverse phylogenetic groups. Some of these are the Agrobacterium tumefaciens,
Sinorhizobium meliloti (Choudhary et al., 1994), Deinococcus radiodurans (White et al.,
1999) and human pathogen Vibrio cholerae (Egan et al., 2005) and Burkholderia
cenocepacia (Dubarry et al., 2006) which harbor multipartite genome. The molecular
basis of multipartite genome segregation and the nature of chromosome partitioning
systems in these organisms are not well understood. However, in case of Vibrio cholerae,
it has been shown that both the chromosomes have distinct replication machinery and the
localization and segregation systems are different as well as chromosome specific.
Deinococcus radiodurans R1 (DEIRA), a member of Deinococcaceae family, is a non-
pathogenic, pink pigmented non-sporulating, Gram positive bacterium. It shows
extraordinary tolerance to ionizing radiation, far UV radiation, hydrogen peroxide and
other DNA damaging agents including desiccation (Slade and Radman, 2011). Apart
from these features, DEIRA shows ploidy with four genome, chromosome I,
chromosome II, a megaplasmid and a small plasmid (White et al., 1999). The
mechanisms underlying the maintenance of ploidy and faithful inheritance of multipartite
genome during normal as well as radiation stressed growth are not known and would be
worth investigating. Genome of this bacterium was annotated with putative operons made
up of parA-parB genes. Except small plasmid, other genome replication units have their
own sets of putative ParA and ParB proteins. Centromeric sequences are not known in
any of these genomes. The presence of multiple sets of „Par‟ proteins has been reported in
bacteria harboring multipartite genome system. This raises a question on the possible

3
functional redundancy amongst these proteins. Understanding the functionality of „Par‟
proteins encoded on different replication units in
D. radiodurans would be a step forward in understanding the mechanism(s) of
chromosome segregation in bacteria harboring complex genome system. Therefore, we
have planned to study the mechanisms of genome segregation in Deinococcus
radiodurans.
Here we propose to undertake the above study in following objectives
Objective1. Cloning and purification of recombinant ParA and ParB proteins
of Deinococcus radiodurans.
Objective2. Generation of ParA and ParB translational fusion with different
fluorescent proteins.
Objective3. Monitoring the in vivo interaction of fluorescent tagged recombinant
proteins, among each other, and with bacterial genomes by
fluorescence microscopy.
Objective4. Generation of parB deletion mutant (s) and studying the redundancy
of different parB(s) in genome segregation and individual genomes
in cell survival.
The work carried out to address the above objectives will be presented in this thesis in
following chapters
Chapter 1: General Introduction and Review of Literature
Chapter 2: Materials and Experimental Procedures
Chapter 3: Results
4
3.1 Identification of genome partitioning elements using bioinformatic
approaches.
3.2 Functional characterization of chromosome I partitioning system
3.3 Molecular studies on chromosome II partitioning proteins
Chapter 4: General Discussion
Chapter 5: Summary, Conclusion and Future prospective
Chapter 1. General introduction and review of literature:
This chapter describes general information on both plasmid and chromosome partitioning
systems, various hypotheses proposed to explain the mechanism of genome segregation
and important features about model organism Deinococcus radiodurans.
Chapter 2. Materials and Methods:
This chapter describes the details of materials used along with their sources, and general
methods used in this study. Different techniques and approaches used in this study will be
described under the categerory of (1) Bioinformatic analysis – use of readily available
online tools like Blast (2) Biochemical techniques including protein purification, EMSA,
ATPase assay and Light scattering etc. (3) Recombinant DNA technology and molecular
biology techniques including cloning, generation of deletion mutants and their
conformation and (4) microscopic studies.
Chapter 3: Results:
This chapter starts with a preamble describing the hypotheses and the logical anticipation
from this study. The results obtained to test the hypotheses along with other new findings
5
during the course of this investigation are presented. The results obtained from this study
have been presented in three sub-chapters. Each starts with a brief introduction,
experimental procedures and results obtained from that specific study, followed by a brief
discussion on the findings specific to the results are included in this section.
Chapter 3.1: Identification of genome partition elements using bioinformatic
approaches:
The consensus centromeric sequences of both P1 plasmid type (parS) and chromosomal
type (BS) elements as reported initially from Bacillus subtilis were searched in the
genome of this bacterium. The results showed the presence of heptameric and hexameric
boxes similar to plasmid type parS element on chromosome I, chromosome II and the
megaplasmid. However, the organization of these boxes in all the three genetic elements
was different from typical parS element characterized from P1 plasmid. In addition, the
IHF (Integrative Host Factor) binding site present at the central region of P1 parS was
absent in the hypothetical parS element of D. radiodurans. Further, the Blast-N analysis
showed that chromosome I also had three more putative centromeric sequences nearly
identical to parS of B. subtilis, which has been reported in nearly 69% of bacterial
chromosome sequences so far. These differ marginally from each other and are located in
different regions of chromosome I and therefore, named as segS1, segS2, and segS3
elements. Chromosome II and megaplasmid do not contain typical segS type centromeric
sequences. Thus, the possibility of the aberrant P1 type parS elements found in this study
may have a role in segregation of these secondary genome elements cannot be ruled out.
In spite of the facts that single nucleotide change in boxes and absence of IHF binding

6
site abolish the productive interaction of ParB with parS element, the possibility of these
aberrant parS sequences working in this organism may be worth investigating.
The Genome of this bacterium has been annotated with putative „Par‟ proteins like ParA
and ParB, mainly on the basis of the amino acid sequence similarities with known „Par‟
proteins and the position of parAB operon on respective chromosome. Amino acid
sequences of these proteins were searched for functional motifs through Clustal-X
analysis. ParB proteins showed higher similarities with the known chromosomal type
ParB proteins. Multiple sequence alignment of ParB proteins with similar proteins in
database showed the presence of all functional motifs of typical ParB‟s characterized in
other systems with some minor variations in HTH region. ParA proteins however, are
much diverged than the ParB proteins from other bacteria. Multiple sequence alignment
of ParA type proteins shows some variation in the N- terminal region as compared to the
other well characterized ParA proteins. Based on phylogenetic analysis we sub-
categorized ParA1, ParB1 (DR0013, DR0012) (ParA and ParB of chromosome I) into
chromosomal type „Par‟ proteins where as the ParA‟s and ParB‟s of accessory
chromosome i.e. of chromosomal II (DRA0001, DRA0002) and megaplasmid
(DRB0001, DRB0002 and DRB0031, DRB0030) were found along with another sub-
family, which are distinct from the chromosomal ParA and assumed to behave differently
than the normal ParA and ParB known in bacterial genome segregation.
Chapter 3.2: Functional characterization of chromosome I partition system.
This chapter contains the results obtained from both in vivo and in vitro functional
characterization of ParA and ParB proteins and three putative centromeric sequences
(segS1, segS2 and segS3) of chromosome I. Coding sequences of both the proteins ParA

7
and ParB of chromosome I (hereafter referred as ParA1 and ParB1) were cloned,
recombinant proteins purified and identities ascertained using a mass spectrometer.
ParA1 was found to be a dsDNA binding ATPase while ParB1 showed sequence specific
centromere binding protein having nearly similar affinity with all the three chromosomal
centromeric sequences (segS1/segS2/segS3). ParA type proteins undergo polymerization
on dsDNA in the presence of ATP, which upon interaction with ParB bound with
centromeres results into depolymerization. The polymerization/depolymerization
dynamics of ParA type proteins provided a motor function for the segregation of
duplicated genome. Polymerization characteristics of ParA1 was therefore, studied in the
presence of ParB1 and segS elements in different combinations. By using sedimentation
analysis and light scattering experiments, it was demonstrated that along with the
activation of ATPase activity there is a change in the amount of oligomeric structure
formation, which was in agreement with the in vivo result. It was shown that ParA1
undergoes polymerization in presence of ParB1 bound to centromeric sequences in
presence of ATP. After certain period of incubation, the depolymerization is triggered
resulting in decrease of light scattering as well as amount of ParA1 in pellet.
In vivo functional characterization was carried out by (i) deleting the parB1 gene from
genome of D. radiodurans and monitoring the effect of deletion on growth and
anucleation, and (ii) cloning the segS elements on an unstable mini-F plasmid pDAG203,
and monitoring its stable inheritance in E. coli. The N-terminal translation fusion was
generated with GFP and the ParB localization on the genome of D. radiodurans was
demonstrated. Wild type E. coli expressed with GFP-ParB showed GFP fluorescence
throughout the cell. While E. coli harboring pDAGS3 an unstable mini-F plasmid bearing

8
segS3 centromere, and expressing GFP-ParB showed discrete foci formation on nucleoid.
This suggested that ParB1 could interact with nucleoid only when found segS type
centromere sequences. Further, E. coli cells harboring mini-F plasmid (pDAG203) and its
segS bearing derivatives like pDAGS1, pDAGS2 and pDAGS3, were checked for stable
inheritance of respective plasmids. Stable inheritance of recombinant plasmid and not
pDAG203 vector, was observed in E. coli, which supported the role of segS elements as
bacterial centromeres. Requirement of cognate ParA1/ParB1 proteins for 100%
inheritance of pDAGS3 phenotype in daughter cells of E. coli harboring this plasmid
along with other findings suggested that segS3 and ParA1 / ParB1 constitute the
functional partitioning system for the segregation of chromosome I of D. radiodurans.
The parB1 deletion mutant (∆ parB1) affected the growth of the bacterium under normal
conditions and produced a higher frequency of anucleation as compared to the wild type
further suggesting that ParB1 has a role in chromosome segregation. N-terminal
translation fusion were generated with GFP and the ParA localization on the genome of
D. radiodurans was demonstrated in different combination of centromere sequences and
ParB1 protein, ParA1 alone or in presence of ParB1 has shown co-localization along with
the DNA, by using time lapse experiments we were able to demonstrate differential
dynamics of GFP-ParA1 protein in the presence of ParB1 and different centromere
sequences. These results together suggested that chromosome I partitioning system
function by pulling mechanism during genome segregation.
Chapter 3.3: Molecular studies on chromosome II partitioning proteins

9
This chapter describes the findings on the characterization of (i) ParA2 and its role in
genome segregation and cell division and (ii) ParB2 role in genome maintenance.
Recombinant proteins were made in E. coli, purified and confirmed by mass
spectrometry. The parB2 deletion mutant of D. radiodurans showed anucleation and
unusually increased the cell size compared to the wild type. Membrane staining of parB2
mutant showed nearly 60% of the cells had disruption of septal growth. Similar
phenotype was seen when ParA2 was over expressed in wild type background. Since,
both deletion mutant of parB2 and over expression of ParA2 in D. radiodurans would
have higher amount of ParA2 with respect to ParB2 than wild type, the possibility of this
ratio change or absence of ParB2 in cell expressing ParA2, could have affected cell
division has been hypothesized. ParA2 was over expressed in E. coli and observed under
microscope. ParA2 over expression in E. coli in the absence of ParB2 caused cell
elongation and lethality due to arrest in the cell division. Here in this chapter, we also
investigated the mechanism underlying the inhibition of cell division by ParA2. The co-
expression of FtsZ-YFP (pLAU85 plasmid) and ParA2 in E. coli showed the inhibition of
FtsZ ring formation. We also generated C-terminal CFP fusion of ParA2 and these cells
were examined under fluorescence microscope. The results showed ParA2 binding
throughout the genome and FtsZ-YFP foci growth was interrupted at the vicinity of
nucleoid. The functional complementation of ParA2 to slmA mutant (nucleoid binding
protein) of E. coli confirmed that ParA2 inhibits cell division by bringing about
nucleoid occlusion at the vicinity of FtsZ ring progression. These results suggested that
ParA2B2 proteins in their native stoichiometry possibly regulate genome maintenance
10
while any change in the ratio of these proteins in a cell, resulted in cell division arrest,
until possibly duplicated genome is not fully segregated.
Chapter 4: General discussion
Mechanisms underlying bacterial genome segregation have been studied in bacteria either
harboring a single circular chromosome and or a low copy number plasmid. D.
radiodurans is amongst the several bacteria which harbor multipartite genome system.
Some of these also confer ploidy. Coincidently, most of the multipartite genome
harboring bacteria are stress tolerant to biotic and abiotic stress. Genome ploidy was
considered as the probable factors that were implicated to efficient DSB repair and
eventually the gamma radiation tolerance in D. radiodurans. Furthermore, the
prokaryotes are mostly found with a single circular chromosome and therefore, the
maintenance of multipartite genome and ploidy in bacterial system has been of great
curiosity. These features make this bacterium an attractive model system to study the
mechanisms of genome segregation and maintenance. In this chapter we will discuss on
the identification of P1 type as well as chromosomal type centromeric sequences, the
experimental validation of the predicted functions for both centromeric sequences and
ParA and ParB proteins in chromosome I segregation. Using BLAST short sequence
homology search analysis the consensus sequences of P1parS and B. subtilis type
chromosomal centromeres were found. Further analysis revealed that although
chromosome I had all the boxes as found in parS of P1 plasmid, the spacing between
these boxes were different from the typical parS structure and the IHF binding site was
absent. Since, the consensus structure of inverted boxes, spacing between these boxes and
IHF binding have been shown to be important features in parS required for productive

11
interaction with ParB therefore, the possibility of P1 type centromere functioning in
chromosome I segregation was nearly ruled out. Experimental evidence was obtained
corroborating these facts that ParB interaction with parS element was non-specific. BS
type element (named as segS) found in chromosome I was eventually characterized as the
true centromere for chromosome I partitioning and demonstrated its functionality both in
vivo and in vitro. The presence of multiple centromere‟s on both the primary and
secondary chromosomes of bacteria containing multipartite genome system has been
reported earlier (Dubarry et al., 2006;Fogel and Waldor, 2005;White et al., 1999).
Characterization of ParA1 and ParB1 showed a few interesting observations. ParB1
interacted almost with equal affinity with all three cis elements (segS1/S2/S3). Incubation
of ParB1 and segS elements with ParA1 showed different levels of stimulation in ATPase
activity of ParA1. Similarly, ParA1 incubated with ParB1 and segS elements showed an
increase in the size of macromolecules as measured by change in light scattering.
Interestingly, the effect of ATP on these characteristics increase was different with
different segS elements. These observations are intriguing, given the facts that ParA
polymerization on dsDNA and depolymerization after interacting with ParB1-centromere
complex. Various possibilities explaining this result are discussed. Another observation
was that the recombinant plasmid pDAGS1/ pDAGS2 and pDAGS3 having segS1 segS2
and segS3 cloned on unstable mini-F plasmid pDAG203 respectively, showed the
differential requirement of ParA1 and ParB1 for their stable inheritance in E. coli. The
differential stabilization of pDAGS1, pDAGS2 and pDAGS3 is also discussed.
Deletion of parB1 increased the frequency of the chromosome loss in D. radiodurans,
however, that doesn‟t show any change in the cell morphology while parB2 deletion

12
showed both anucleation and cell morphology change. These results on this one hand
nearly ruled out the functional redundancy amongst various ParB‟s that exist in this
bacterium. On the other hand it brought more specific questions on how parB2 deletion
affected cell morphology. Similar results were obtained when ParA2 was over expressed
in both in D. radiodurans and in E. coli. In these cells the anucleation was not observed.
Here we will be discussing about the information on coordination of cell division with
genome segregation as existed in different bacterial systems with respect to the „Par‟
proteins. Likewise, all the results obtained under this study are discussed within the
existing information on the subject, hypothesized, speculated and interpreted to a logical
conclusion.
Chapter 5: Summary, conclusion and future prospective
This chapter briefly summarizes the work presented in this thesis by highlighting the
potential observations and results obtained that supported the hypotheses and also the
unanswered questions / new hypotheses generated during this course of the study. Along
with several interesting findings reported in this thesis, we have been characterized both
the centromeres and partitioning proteins encoded on chromosome I of D. radiodurans. It
has also been demonstrated that chromosome I has multiple chromosomal type
centromeric sequences and „Par‟ proteins that are functionally similar to the „Par‟
proteins known in single chromosome harboring bacteria. Molecular interaction studies
of ParA1, ParB1 and centromeric sequences as a function of ATP, indicated that
chromosome I partitioning seems to follow Type I genome segregation mechanism i.e.
pulling mechanism. Interestingly, we observed that in spite of having common motifs
„Par‟ proteins of accessory chromosomes are grouped with different class of proteins in

13
phylogenetic tree and apparently they express different functions. However, ParB1 and
ParB2 both are involved in genome maintenance but ParB2 also regulates cell division
perhaps by titrating ParA2 from inhibiting FtsZ ring formation and cytokinesis.
Molecular studies on ParA2 inhibition of cell division suggest that ParA2 brings about
nucleoid occlusion and blocks the growth of FtsZ ring in E. coli and septal growth in D.
radiodurans. Also the conclusion drawn from this study will be deciphered.
This study has answered some of the questions and tested the hypotheses proposed by
both experimentally and through bioinformatic analysis, it has left several unanswered
questions. The immediate ones may that require attention include (i) The real-time
monitoring of ParB1 protein interaction with centromere‟s and demonstration of ParA1
dynamic movement on genome leading to duplicated genome segregation, (ii) how do
three segS function in chromosome I partitioning in vivo, (iii) functional redundancy of
various ParA and ParB proteins during genome segregation, (iv) ParA2 characterization
has provided strong clues that this protein is linked between cell division and genome
segregation, the factors determining for ParA2 performing one of the two functions at
molecular levels would be worth studying, and (v) there are putative centromeric
sequences marginally different from typical parS, it would be interesting to see if
aberrant parS present on chromosome II and megaplasmid may function as centromeric
region on these replication units and that would be a novel finding indicating a logical
shift in paradigm.

14
Publications:
Published :
Charaka, V. K. and Misra, H. S. (2012) Functional characterization of
chromosome I partitioning system in Deinococcus radiodurans for its role in
genome segregation. J. Bacteriol. 194:5739-5748.
Charaka, V.K.umar and Misra, H.S. (2013) ParA2, A hypothetical walker
type DNA binding ATPase of Deinococcus radiodurans, arrests septal growth
by Nucleoid occlusion mechanism. J. Bioscience. 38:487-497.
Kota, S., Charaka, V.K.,and Misra, H.S. (2010) Characterization of an ATP-
regulated DNA-processing enzyme and thermo tolerant phosphoesterase in
the radioresistant bacterium Deinococcus radiodurans. Biochem J. 431:149-
157.
Communicated:
Kota,S., Charaka,V.K.,Ringgaard,S., Waldor,M.K. and Misra,H.S
(2013)PprA has a role in maintenance of damaged genome in Deinococcus
radiodurans, pLOS one (Under revision)
Signature of Student:
Date:

15
Doctoral Committee:
S. No. Name Designation Signature Date
1. Prof. A. K. Sharma Chairman
2. Prof. H. S. Misra Guide
3. Prof. J. R. Bandekar Member
4. Prof. (Mrs) J. K. Sainis Member
5. Prof. Dulal Panda Member
Reference List
Choudhary,M., Mackenzie,C., Nereng,K.S., Sodergren,E., Weinstock,G.M., and
Kaplan,S. (1994) Multiple chromosomes in bacteria: structure and function of
chromosome II of Rhodobacter sphaeroides 2.4.1T. J Bacteriol 176: 7694-7702.
Draper,G.C., and Gober,J.W. (2002) Bacterial chromosome segregation. Annu Rev
Microbiol 56: 567-597.
Dubarry,N., Pasta,F., and Lane,D. (2006) ParABS systems of the four replicons of
Burkholderia cenocepacia: new chromosome centromeres confer partition specificity. J
Bacteriol 188: 1489-1496.
Ebersbach,G., and Gerdes,K. (2001) The double par locus of virulence factor pB171:
DNA segregation is correlated with oscillation of ParA. Proc Natl Acad Sci U S A 98:
15078-15083.
Ebersbach,G., and Gerdes,K. (2005) Plasmid segregation mechanisms. Annu Rev Genet
39: 453-479.
Egan,E.S., Fogel,M.A., and Waldor,M.K. (2005) Divided genomes: negotiating the cell
cycle in prokaryotes with multiple chromosomes. Mol Microbiol 56: 1129-1138.
Fogel,M.A., and Waldor,M.K. (2005) Distinct segregation dynamics of the two Vibrio
cholerae chromosomes. Mol Microbiol 55: 125-136.
Fogel,M.A., and Waldor,M.K. (2006) A dynamic, mitotic-like mechanism for bacterial
chromosome segregation. Genes Dev 20: 3269-3282.

16
Gerdes,K., Howard,M., and Szardenings,F. (2010) Pushing and pulling in prokaryotic
DNA segregation. Cell 141: 927-942.
Gordon,G.S., and Wright,A. (2000) DNA segregation in bacteria. Annu Rev Microbiol
54: 681-708.
Leonard,T.A., Moller-Jensen,J., and Lowe,J. (2005) Towards understanding the
molecular basis of bacterial DNA segregation. Philos Trans R Soc Lond B Biol Sci 360:
523-535.
Lin,D.C., and Grossman,A.D. (1998) Identification and characterization of a bacterial
chromosome partitioning site. Cell 92: 675-685.
Martin,K.A., Davis,M.A., and Austin,S. (1991) Fine-structure analysis of the P1 plasmid
partition site. J Bacteriol 173: 3630-3634.
Moller-Jensen,J., and Gerdes,K. (2007) Plasmid segregation: spatial awareness at the
molecular level. J Cell Biol 179: 813-815.
Salje,J., Gayathri,P., and Lowe,J. (2010) The ParMRC system: molecular mechanisms of
plasmid segregation by actin-like filaments. Nat Rev Microbiol 8: 683-692.
Schumacher,M.A., Piro,K.M., and Xu,W. (2010) Insight into F plasmid DNA segregation
revealed by structures of SopB and SopB-DNA complexes. Nucleic Acids Res 38: 4514-
4526.
Shebelut,C.W., Guberman,J.M., van,T.S., Yakhnina,A.A., and Gitai,Z. (2010)
Caulobacter chromosome segregation is an ordered multistep process. Proc Natl Acad
Sci U S A 107: 14194-14198.
Slade,D., and Radman,M. (2011) Oxidative stress resistance in Deinococcus
radiodurans. Microbiol Mol Biol Rev 75: 133-191.
Vecchiarelli,A.G., Han,Y.W., Tan,X., Mizuuchi,M., Ghirlando,R., Biertumpfel,C. et al.
(2010) ATP control of dynamic P1 ParA-DNA interactions: a key role for the nucleoid in
plasmid partition. Mol Microbiol 78: 78-91.
White,O., Eisen,J.A., Heidelberg,J.F., Hickey,E.K., Peterson,J.D., Dodson,R.J. et al.
(1999) Genome sequence of the radioresistant bacterium Deinococcus radiodurans R1.
Science 286: 1571-1577.

17
LIST OF FIGURES
Fig 1.1: P1 parS structure
Fig 1.2: Diffusion ratchet Model
Fig1.3: F plasmid segregation models
Fig 1.4: Pulling model
Fig 1.5: Pushing mechanism
Fig1.6: Role of ‘Par’ proteins in B. subtilis
Fig 1.7: Segregation mechanism in C. crescentus
Fig 1.8: ESDSA mechanism in D. radiodurans
Fig 3.1.1: Centromere sequences on chromosome I of D. radiodurans
Fig 3.1.2: Analysis of P1 type of centromere like sequence in D. radiodurans
Fig 3.1.3: Multiple alignment of ParB protein with chromosomal ParB
Fig3.1.4: 3-D model of ParB1of D. radiodurans
Fig 3.1.5: Graphic representation of deviant walker type motifs in Deinococcal ParA proteins
Fig 3.1.6: Multiple Alignment of ParA proteins
Fig 3.1.7: 3-D model of ParA1 of D. radiodurans
Fig 3.1.8 a: Phylogenetic tree of ParB proteins
Fig 3.1.8b: Phylogenetic tree of ‘ParA’ proteins
Fig 3.2.1a: Cloning, expression and purification of ‘ParB1’ protein
Fig 3.2.1b: Cloning, expression and purification of ‘ParA1’ protein
Fig. 3.2.2: ParB1 interaction with segS type centromere’s of chromosome I
Fig 3.2.3: DNA binding activity of ParA1
Fig 3.2.4: ATPase activity of ParA1
Fig 3.2.5: Interaction of ParA1 with DNA by using sedimentation analysis
Fig 3.2.6: Light scattering analysis
Fig 3.2.7: Stimulation of ParA1 ATPase activity
Fig 3.2.8: Interaction of ParA1 with ParB1 nucleoprotein complex
Fig 3.2.9: Interaction of ParA1 with ParB1 nucleoprotein complex studied using Light scattering analysis
Fig 3.2.10: Centromere activity assay of segS elements using plasmid stability test in E. coli
Fig 3.2.11: Construction and expression of pDSW parA1parB1 plasmid:
Fig 3.2.12: Generation of ΔparB1 mutant
Fig 3.2.13: Effect of ParB1 deletion on genome maintenance in Deinococcus radiodurans
Fig 3.2.14: Effect of ParB1 deletion on D. radiodurans cell morphology
Fig 3.2.15: Generation of GFP-ParB1 translational fusion protein
Fig 3.2.16: Interaction of ParB1 with nucleoid.
Fig 3.2.17: Localization of GFP-ParA1 in E. coli cells
Fig 3.2.18: Dynamics of GFP – ParA1 in E. coli cells
Fig 3.2.19: GFP –ParA1 florescence distribution in E .coli cells
Fig3.3.1: Generation of pNOK A0002 plasmid
18
Fig 3.3.2: Growth curve analysis
Fig 3.3.3: Effect on chromosome segregation
Fig3.3.4: Effect of ParB2 on cell morphology
Fig3.3.5: ParB2 effect on cell division process
Fig 3.3.6: Effect of ParA2 expression on growth characteristics of E. coli
Fig 3.3.7: Effect of ParA2 expression on increase in cell size of E. coli
Fig3.3.8: Analysis of ParA2 expression on increase in cell size of E. coli
Fig3.3.9: Effect of ParA2 expression on FtsZ ring formation in E. coli
Fig 3.3.10: Expression and purification of ParA2 protein
Fig 3.3.11: Interaction of ParA2 with FtsZ by using GTPase assay
Fig3.3.12: Interaction of ParA2 with FtsZ by using sedimentation analysis
Fig3.3.13: In vitro activity characterization of recombinant ParA2
Fig 3.3.14: Localization of ParA2 in E. coli cells
Fig 3.3.15: Functional complementation studies
LIST OF TABLES
Table 2.1 Composition of stock solutions
Table 2.2 Antibiotic stock solutions
Table 2.3 List of bacterial strains used in this study
Table 2.4 List of primers used in this study
Table 2.5 List of plasmids used in this study
Table 2.6 Composition of 10 % separating polyacrylamide gel
Table 2.7 Gradient gel composition
Table 3.1: Organization of ‘par’ genes in D .radiodurans
Table3.2: Effect of ParB1 Deletion on anucleation of D. radiodurans

19
LIST OF ABERIVATIONS:
D. radiodurans Deinococcus radiodurans LB Luria Broth
E. coli Escherichia coli TYG Tryptone yeast extract Glucose media
B. subtilis Bacillus subtilis FISH Florescence in-situ hybridization
C. crescentus Caulobacter cresentus PCR Polymerase chain reaction
S. enterica Salmonella enteric PFGE Pulsed field gel electrophoresis
V. cholerae Vibrio cholera RT Room Temperature
T. thermophilus Thermus thermophilus W/V weight/volume
P. aeruginosa Pseudomonas aeruginosa Ni-NTA nickel-nitrilo acetic acid
B. coencephacia Burkholderia coencephacia EDTA Ethylene diamine tetra acetic acid
S. colicolor Streptomyces coelicolor dsDNA Double stranded DNA
HTH Helix Turn Helix
RMSD Root-mean-square deviation
MSA Multiple sequence alignment

20
General Introduction and
Review of Literature
21
Segregation is defined as a process that assures stable genome transmission from one
generation to another. Precise duplication and transmission of genetic information is a
fundamental attribute of the life and determines the successful inheritance of different
phenotypes in daughter cells. The failure of chromosome segregation causes genetic
defects leading to either the suppression or activation of gene functions and thereby
changes in phenotype. The basic mechanism of chromosome segregation is relatively
better understood in eukaryotes (Yanagida, 2005). In these systems, the chromosome
replication, segregation and cell division are temporally separated. Chromosomes are
duplicated in S-phase and remain together during G2 phase. Partitioning occurs in M-
phase and then the cell divides after the chromosomes have segregated to opposite halves
of the cell. The chromosomal duplication and segregation are mainly driven by the cyclin
dependent kinases. During the early metaphase stage the sister chromatid pairs are
captured by the microtubules that move the two sister chromatids to the opposite poles by
an GTP dependent process (Tessema et al., 2004). A large number of proteins involved in
replication and segregation were characterized and their roles in eukaryotic genome
segregation have been documented.
In prokaryotes, genome segregation mechanisms have been studied mostly in bacteria
harboring single circular chromosome and low copy number plasmids like F plasmid, P1
plasmid and R1 plasmid of E. coli (Ebersbach et al., 2005;Ghosh et al., 2006;Gitai,
2006;Gordon and Wright, 2000;Leonard et al., 2005). Any missegregation results in
decrease in copy number or generation of plasmid free cells. These cells are subsequently
cleared off due to post segregation killing mechanisms (Gerdes and Molin, 1986). Unlike
the well-characterized biology of the eukaryotic mitotic apparatus, much is still unknown
22
about the genome partitioning mechanisms and proteome in prokaryotes. The major
factors that limit the studies on genome segregation in bacteria include (i) the size of the
organism, (ii) inseparable cell division phases and duplication phase (iii) most mutations
of partitioning genes show pleiotropic effects (Leonard et al., 2005). In addition, the
cytogenetic features in bacteria like organization of chromosome within the cell (Bloom
and Joglekar, 2010), chromosome number variation within bacterial genera and lack of
high resolution microscopic techniques that can image less than 2 micron size bacterial
cell are some of the other features that makes study on genome segregation in bacteria
much more challenging than eukaryotes.
1.1 Mechanisms of bacterial genome segregation
For maintenance of plasmids or chromosomes various mechanisms are involved few of
them are described in this chapter. Several hypotheses or models have been proposed for
explaining the mechanism of genome segregation in bacteria. First model was proposed
by Jacob and co workers in 1963, which state that chromosome segregation is a passive
mechanism i.e. duplicated chromosomes are separated due to insertion of the septa in the
mid of the cell. Passive model of genome segregation could not accommodate the
findings showing that duplicated DNA is separated due to insertion of the membrane at a
single point that was the basis of passive model, further studies had shown insertion of
the new membrane material occurs throughout the cell (Hiemstra et al., 1987;Wientjes
and Nanninga, 1989). Distribution of newly synthesized membrane into cell membrane,
visualization of DNA movements in B. subtilis and C. crescentus (movement of DNA is
much faster than the cell elongation rate) has weakened Jacob and co-workers hypothesis.
This indicated the involvement of other factors in separation of two sister chromosomes.

23
The driving force or tension responsible for bringing bacterial chromosomes steadily
apart was questioned and initially conditional mutants were isolated which were
associated with DNA topological problems e.g. change in resolution, which perturbed the
chromosome segregation (Lemon and Grossman, 2001;Sawitzke and Austin, 2000).
Studies on these observations indicated many factors or proteins are involved in active
partition mechanism.
In 1996, Grossman proposed extrusion capture model for active chromosome
segregation, according to this model the force for separation is provided by some
powerful threading machines like DNA polymerase or RNA polymerase (Lemon and
Grossman, 2001). Replisosme is localized at mid position of the cell where DNA
polymerase initiates replication and duplicated DNA is pushed outwards to replisosme.
Separated sister chromosomes are captured by the membrane anchoring regions and
DNA is spooled outward from mid of the cell towards opposite side of the cell.
Subsequently, Dworkin and Losick also suggested that the force required for
chromosome segregation is provided by the RNA polymerase. They showed that
inhibition of RNA polymerase activity by streptolydigin restricted DNA movement as
compared to untreated cells. It was hypothesized that transcription of the oppositely
oriented genes near the origin of replication generates force, which could result in bulk
movement of DNA. However it‟s unlikely that these polymerases are molecules that are
involved in separation of duplicated DNA due to following reasons: DNA is long flexible
polymer, DNA polymerase or RNA polymerases are unable to push the low rigid and
high flexible polymer to opposite side of the cell (Dworkin and Losick, 2002). The
variation in spatiotemporal organization of replisosme from organism to organism, which
24
is at mid cell position in B. subtilis while it is at the ¾ position of the cell in C.
crescentus (Jensen et al., 2001) and lack of defined start site of partition ruled out the
involvement of either RNA or DNA polymerase in the chromosome segregation. Recent
well accepted model involves existence of mitotic like machinery (Actin or Tubulin like
proteins), which actively segregate DNA (plasmid or chromosome) into daughter cells.
1.2 Mechanisms of plasmid segregation
In general, plasmids or chromosome encode two trans acting factors (ParA and ParB) and
one cis factor (centromere like sequence). One of the trans acting factors is an NTPase
protein (Motor protein) named as ParA (P1, pB171plasmid, etc), ParM (R1 plasmid),
SopA (F plasmid), Soj (B. subtilis) and another is a site specific DNA binding protein
(adapter protein) named as ParB (P1 plasmid, pB171 plasmid, etc), ParR (R1 plasmid),
SopB ( F plasmid) and Spo0J (B. subtilis) which binds to specific centromere sequence
these were named as parS, parC, sopC etc. These centromere like sequence are diverged
from one partition system to another either in organization or localization of centromere
like sequence differs in different segregation systems. In brief the organization of
centromere sequence in plasmids comprises either direct repeats (sopC, P1 parS) or
indirect repeats (parS of B. subtilis) (Table 1.1).
General mechanism of segregation is described as an adapter protein (ParB) specifically
interacts to the centromere like sequence (parS) to form a high nucleoprotein complex,
when NTPase protein (ParA) interacts with this nucleoprotein complex (adaptor-
centromere complex) which specifically stimulate the NTPase activity, ultimately
separating duplicated genome to opposite poles (Ebersbach and Gerdes, 2005;Gitai,
2006;Gordon and Wright, 2000;Leonard et al., 2005). In spite of having nearly similar

25
functions of partitioning proteins and centromere‟s reported from different bacteria the
molecular mechanisms of segregation are found to be different for chromosome and
plasmid.
Based on type of NTPase proteins in plasmids, the „par‟ systems are classified into four
types. (1) Type I „par‟ system encode Walker box containing P- loop ATPase proteins
and reported in P1, F, pB171, pTAR, pTP228 plasmid. (2) Type II „par’ system
comprised of NTPase protein having structurally actin like fold of mammalian system
and reported from R1 plasmid of E. coli. (3) Type III „par’ system involves NTPase
protein showing structural homology with tubulin like GTPase domain and reported from
pBtoxsis plasmid and (4) Type IV „par‟ system is best studied in case of pSK+ plasmid.
1.2.1Type I partition system:
Type I NTPase class proteins are most widely distributed from plasmid to chromosome
e.g. P1 ParA (P1 plasmid), SopA (F plasmid), Soj (B. subtilis), MinD (cell division
inhibitor protein). Typically type I „par‟ family proteins encode Walker type motif or
deviant Walker type motif. Based on size of NTPase protein Type I partition system is
divided into two sub-classes Type Ia and Type Ib (Gerdes et al., 2010). Type Ia NTPase
family includes parABS of P1 plasmid and sopABC of F plasmid. NTPase size ranges
from 200 to 400 amino acids, whose N- terminal region contain extra helix turn helix
region which aids in auto regulation process (Austin and Abeles, 1983;Ogura and Hiraga,
1983). Type Ib NTPase family includes parFGH from pTP228 plasmid of S. enterica,
parABC from pB171 plasmid and δ/ω from pSM19035. NTPase protein in this family
are smaller in size lacking N-terminal region, doesn‟t auto regulate gene expression,
however in presence of ParB, ParA autoregulate its gene expression.
26
P1 plasmid
P1 „par‟ family consists of six members which are broadly distributed throughout
bacterial genera for e.g. P1 prophage and P7 prophage in E. coli, pMT1 in Yersinia
pestis, pWR100 in Shigella flexneri etc (Dabrazhynetskaya et al., 2009). Active
segregation mechanism was first seen in P1 prophage plasmid. Localization studies of P1
plasmid indicated that plasmid is either positioned at mid or at ¼ position within the cell
(Erdmann et al., 1999;Mascarenhas et al., 2005;Ringgaard et al., 2009). Faithful
inheritance of plasmid depend upon the function of partitioning genes (parABS)
(Erdmann et al., 1999). Motor protein in P1 Plasmid named as ParA. P1 ParA is a 44 kDa
P-loop type ATPase encoded in „par‟ operon and plays important role in partition of
plasmid as well as in auto regulation of partition genes. ParA has an intrinsic weak
ATPase activity, which gets specifically stimulated by its cognate ParB-parS
nucleoprotein complex. ParA protein can be broken down into N-terminal region, HTH
region, and C-terminal region (Dunham et al., 2009). N-terminal region is an extended α
helix region (1-43 residues) which is known to play important role in dimerization,
winged helix turn helix region (44-104) contain DNA binding region that will help in
regulation of protein (Bouet and Funnell, 1999), C-terminal region contains walker type
motif region as well as ParB interacting domain. Nucleotide (ATP) binds to C-terminal
region and hydrolyzes the ATP into ADP in presence of DNA or cognate ParB protein.
ParB encoded on P1 plasmid is a 38 kDa adaptor protein which binds to centromere like
sequence to form nucleoprotein complex. ParB protein consists of N-terminal domain and
C-terminal domain. N-terminal region (1-144 residues) contain ParA interacting domain
(Surtees and Funnell, 1999). Where as, C- terminal region (144 – 233) contains the
27
necessary information for binding to centromere sequences. Crystal structure of P1 ParB
shown that amino acid residues form seven α helical region (Helix turn helix region)
connected by 4 flexible amino acids to an independent domain consisting of three anti
parallel β strands. Packing of these β strands dimerizes Par B. Dimeric ParB protein
interacts with P1 parS in two fold (Surtees and Funnell, 1999). Initially HTH domains of
ParB monomer bind to the heptameric sequence of P1 parS. Beta dimer domains
independently bind to hexameric repeats of P1 parS. Two arms of ParB assists in DNA
binding where as IHF (Integrative Host Factor) bind to specific DNA sequence (IHF
binding site) that makes DNA to bend (Funnell, 1988). Due to bending of parS ParB
spans both arms of P1 parS simultaneously (Schumacher and Funnell, 2005) and aid in
formation of nucleoprotein complex. Its intrinsic weak ATPase activity is specifically
stimulated by ParB-parS specific nucleoprotein complex. It is hypothesized that force
required for partition is provided by ATPase protein.
Plasmid type „parS‟ is a 34 bp DNA fragment which is located downstream to the parAB
gene. ParB protein known to interact specifically to P1 parS centromere sequence. The
P1 parS is a complex structure having four copies of heptameric sequences (A box with
consensus G/TTGAAAT) and two copies of hexameric sequence (B box with consensus
TCGCCA). Broadly P1 parS can be divided into three regions left and right and central
region, central region contains consensus WATCAANNNNTTR (W is dA or dT, R is dA
or dG, and N is any nucleotide) sequence (Hales et al., 1994) to which Integration Host
Factor (IHF) binds and causes DNA looping, bending of DNA helps in bringing left and
right boxes in close proximity through which ParB interacts with right and left hand side
of parS.

28
ParB initially binds to parS sequence with high affinity and is followed by the loading of
the additional ParB molecules onto the looped site through specific and nonspecific
interaction with the DNA (Schumacher, 2007). Mutational analysis defined boundaries
of the parS sequence, deletion of left handed sequence i.e. box A1B1 doesn‟t changed
stability of plasmid but deletion or substitution of base pair in right hand region i.e. A2,
A3, B2 and A4 boxes had completely depleted partition activity (Martin et al., 1991).
TtTCGCCA ttcaa ATTTCAC tattaactgactgtttaaagtaaattact ctaaa ATTTCAAgGTGAAATCGCCA cg ATTTCACcttgg
AaAGCGGT aagtt TAAAGTG ataattgactgacaaatttcatttaatgagattt TAAAGTTcCACT TTAGCGGTgc TAAAGTGgaacc
Box B1 Box A1 Box A2 Box A3 Box B2 Box A4IHF binding site
Fig 1.1: P1 parS structure: The P1 parS is 32 bp DNA sequence consisting of
heptameric sequences (Box A)and hexameric sequence (Box B).
?
ParB bound P1 plasmidParB protein
ParA-ADP(Inactive) ParA2-ATP2(active)
ParA-ATP ( Inactive) Nucleoid
B
A C
D
Fig 1.2: Diffusion ratchet Model: A) ParA interacts with ATP and undergo
conformation change ParA2-ATP2 B) ParA2 dimer interacts with nucleoid and extend
towards the ParB bound plasmid C) ParA2-ATP2 interacts with ParB: parS nucleoprotein
complex ParA2-ATP2 is converted into ParA-ADP at the junction of the ParB-parS
complex, ParA-ADP form diffuses from junction of ParB nucleoprotein complex and by

29
unknown mechanism Par-ADP form is converted back to ParA-ATP form and cycle
repeated.
Localization studies of P1 plasmid with in cell by FISH or by using translation fusion of
ParA or ParB indicated that plasmids are localized at mid cell position or ¼ positions.
Further deletion of parA or parB locus disrupted localization of the plasmid within the
cell (Erdmann et al., 1999;Gordon et al., 2004;Hatano and Niki, 2010;Li and Austin,
2002;Sengupta et al., 2010). Vecchiarelli in 2010 proposed diffusion ratchet model for
explaining the localization of P1 plasmid with in cell. Using different biochemical
techniques they showed that ParA binds to the ATP and undergo conformational change
to ParA2-ATP2 dimer form, this form nonspecifically binds to nucleoid (Roberts et al.,
2012;Vecchiarelli et al., 2010). When ParA2-ATP2 interacts with ParB bound with parS
its ATPase activity is stimulated. During this process, the ParA ATP gets converted into
ParA-ADP and dissociates from nucleoid. Hydrolysis of ATP allows ParA to move ParB-
parS in the direction of high concentration of ParA2-ATP2 form and dragging P1 plasmid
in the same direction. According to this model nucleotide bound state is important for
ParA function, ParA-ADP bound form acts as a repressor where ParA-ATP form
functions in the plasmid stability. ParA-ATP form associates with DNA nonspecifically
(Vecchiarelli et al., 2010).
F plasmid segregation
Another best studied example of Type Ia partition system is F plasmid. It is a 100 kb
prototypical conjugative plasmid which can integrate itself into chromosome (E. coli).
This F plasmid also had shown similar partitioning apparatus as P1 prophage plasmid.
Partition apparatus in F plasmid are known as Sop (system of partition) i.e. sopABC.
ParB protein in F Plasmid is known as SopB, motor protein called as SopA and

30
centromere sequence as sopC. Centromere sequence of F plasmid consists of 12 direct
repeats of 43 base pair (Helsberg and Eichenlaub, 1986) which is different from the
hexameric and heptameric sequence of P1 plasmid. SopB protein consists of N-terminal,
C-terminal and middle regions, the C-terminal region of protein binds to the centromeric
region (sopC) region (Ravin et al., 2003). Similar to the P1 ParA, SopA binds to nucleoid
in ATP dependent manner, intrinsic ATPase activity is stimulated by DNA or (SopB-
sopC) nucleoprotein complex. FISH and different microscopic analysis indicated,
segregation of F plasmid is asymmetric i.e. one plasmid remain at ¼ position, duplicated
DNA is segregated to new ¼ (quarter) position in a time dependent manner (Onogi et al.,
2002). Directionality of the movement is dependent upon the concentration of nucleoid
bound SopA protein. Still exact mechanism of F plasmid is not obscure. However,
different models have been proposed for accommodating both in vitro and in vivo results
on segregation of F plasmid.
A B
Hatano.T (Mol Microbiol 64,2007) Gitai.Z (Curr Biol 16, 2006)
Helical structure of SopA
Localization of F plasmid / SopA SopBsopC

31
Fig1.3: F plasmid segregation models: A) Duplicated plasmid are separated at one end
of the pole and traversed towards opposite pole (magnate star) this complete process is
associated with SopA helical movement (Green structure). B) SopA polymers (indicated
in pink) are assembled on SopB- sopC nucleoprotein complex (indicated in purple) to
form a radial arrays structures. After replication, daughter plasmids are separated by the
polymerization SopA proteins.
First model was proposed depending on microscopic results. According to this model
SopA forms an oscillating polymer, interaction of SopB-sopC with SopA move the
plasmid towards higher concentration of SopA (Hatano et al., 2007). This model also
hypothesized the involvement of some unknown host factors in positioning of F plasmid.
Drawback of this model is that it couldn‟t explain why SopA nucleates at ¼ positions or
why F plasmid is positioned at ¼ positions (Hatano et al., 2007). The other model is
based on in vitro results of SopA. SopA forms long axial filament in presence of SopB
nucleoprotein, so it is hypothesized that formation of asters around the SopB
nucleoprotein complex, resulted in placement of plasmid to ¼ or ¾ positions within the
cell (Gitai, 2006). Aster model for F plasmid is homologous to the pushing model of R1
plasmid. Present model (astral model) failed to explain the oscillatory phenomenon of
SopA within the cell (Gitai, 2006;Hatano et al., 2007). Summary of steps explaining the
most acceptable mechanism of F plasmid segregation is given in Figure 1.3.
pB171 plasmid partition system:
Type Ib partitioning system is encoded in few plasmids like pB171 virulence plasmid of
E. coli. Unlike other low copy number plasmids, the pB171 plasmid encodes two
partition systems namely Par1 & Par2. Both of these „par‟ systems are functional and
synergistically aid in the stabilization of plasmid. Two centromere like sequences (parC1
and parC2) are identified in the upstream region of the respective „par‟ operons. Par1

32
type system encodes ParR, ParM homologous protein where as Par2 encodes ParB and
ParA type homologous proteins (Ebersbach and Gerdes, 2001;Ebersbach and Gerdes,
2005). However these proteins lack N-terminal region which is normally observed in
Type Ia system. Hence walker type ParA of pB171 plasmid doesn‟t show any repressor
activity and ParB protein acts as co-repressor for regulating (Ebersbach and Gerdes,
2005) gene expression.
Gerdes. K (Cell 141,2010)
Fig 1.4: Pulling model: 1) ParA interacts with ATP and undergoes confirmation change. 2)
ParA2–ATP2 binds to nucleoid and extends bidirectionally and extended polymer interacts with
the ParB bound plasmid. 3) ParA-ATP is converted to ParA-ADP form due to interaction of ParB
nucleoprotein complex. 4) Continued interaction of ParB nucleoprotein complex with the next
ParA-ATP results in pulling of plasmid towards higher concentration of ParA. 5&6) Plasmid is
released at the pole, ParA-ADP form is converted back to the ParA-ATP form and cycle repeats.

33
The model for Type Ib plasmid pB171 partitioning has emerged from a microscopy
studies by Ringgaard and colleagues. The studies indicated that Type Ib plasmids are
localized at mid of the cell or ¼ position i.e. localization of plasmid is similar to the Type
Ia plasmid. Co-visualization of ParA and ParB of pB171 deduced pulling type
segregation mechanism (Ringgaard et al., 2009). According to this model, ParA interacts
with the nucleoid and starts oligomerization in bidirectional fashion. ParA polymers
when encounters ParB bound to centromere, results in ATP hydrolysis at the junction of
ParB-parC causing depolymerization of ParA filament. Continued interaction of ParB
nucleoprotein complex with the next ParA-ATP complex in the filament ultimately
results in the retraction of ParA and eventually the pulling of plasmid DNA towards
higher ParA-ATP concentration.
1.2.2 Type II partition system:
Type II segregation system contains actin like fold NTPase family proteins, best studied
example is R1 plasmid (par RMC system). The par RMC locus contains actin like
homologue ParM, centromere binding protein ParR and centromere region (parC).
Homologues of parRMC are identified in plasmid of both Gram positive and Gram
negative bacteria (Ebersbach and Gerdes, 2001;Schumacher, 2007) but not reported in
any bacterial chromosomes till now. The parC centromere region consists of five 11 bp
tandem repeats and each repeat is separated by 39 bp. The electron microscopy studies
revealed, ParR protein forms ring shaped complexes of 15 -20 nm diameter, due to
arrangement of six ParR molecules with N-terminal region facing the outward ring and
C-terminal region facing towards centre of the ring. N-terminal basic structures are
spaced regularly 3.5nm apart which is almost equal to the one turn of the B-DNA

34
structure. The studies on pSK41 plasmid of Staphylococcus aureus supported the above
explained structure of type II partitioning system. Here the dimeric ParR of pSK41
contribute to the formation of ring like structure (Gerdes et al., 2010). ParM has
characteristic actin like fold, and nucleotide binding pocket formed in the inter domain
region. By several methods it is demonstrated that ParM forms double right handed
helical filament with crossover distance of 300Ao and distance between monomers is
49Ao whereas actin filament show 360A
o (cross over distance) and 55A
o (inter monomer
distance) (Galkin et al., 2009).
R plasmid Par R protein
Par M protein
Lutkenhaus. J (Curr Opin Microbiol 5, 2002)
Fig 1.5: Pushing mechanism:1) Monomeric ParM interacts with each other to form
unstable filaments.2) ParM filament get stabilised when it interacts with the ParR bound
plasmid, plasmid are pushed towards opposite ends due to insertion of monomeric ParM
molecules at the junction of ParR and ParM. 3) As division proceeds ParM filament is
destabilised which results in separation of plasmids.
35
Segregation follows pushing mechanism, the ParM monomeric form interacts with each
other to form transient unstable polymers, these polymer get disassembles
unidirectionally much faster than the polymerization. Transiently formed ParM filament
gets stabilized by attaching to ParR- parC complex (Galkin et al., 2009). Monomeric
ParM is inserted at the junction of ParR-parC complex, due to insertion of ParM
monomers bidirectionally these plasmids are separated towards opposite direction of the
cell. ParM within filament exists in two forms, closed form (ParM-ATP or ParM-GTP)
and open form (ParM-ADP or ParM-GDP). Hydrolysis of ATP to ADP +Pi makes inter
domain region very rigid hence closed form is converted into open form.
1.2.3 Type III partition system:
Type III partition system is recently characterized in B. subtilis plasmids. The best
studied examples of type III system are pX101 plasmid, pBtoxis plasmid from Bacillus
anthracis and Bacillus thurgensis. Type III partition system consists of TubZ (GTPase)
protein which contain characteristic T4 loop motif, TubR (adaptor protein) and tubC
(centromere) (Larsen et al., 2007;Ni et al., 2010). Initially the essentiality of these
proteins was identified in replication process (Tinsley and Khan, 2006). However,
recently the role of these proteins is shown in plasmid stabilization. In vitro studies
showed that TubZ proto filaments (2-10) are tangled together to form unidirectional
filament which is extending from one end to another end of the cell (Larsen et al., 2007).
In these type of plasmids TubR binds to the centromere like sequences (tubC) and serves
as a high local concentration for binding sites for tread milling TubZ protein. Once
plasmids are bound these plasmid are transported to opposite side of the pole. Upon
reaching the membrane due to impact of plasmid to membrane layers plasmids are

36
released from TubZ filament. Critical element in Type III segregation system is TubZ
filament. The TubZ dynamics depends on two factors, concentration of TubZ protein and
GTP hydrolysis which are interlinked with each other i.e. once concentration exceeds the
critical concentration, it activates GTPase activity like FtsZ protein and starts
polymerizing. Over all, the model in pX101 plasmid look like Tram (train) hence
mechanism in this plasmid is named as Tram model for Type III partition system
(Schumacher, 2012).
1.2.4 Type IV partition system:
Partition mechanism used by majority of well studied plasmid involves „par‟ as
mentioned above. However few plasmids like pSK1 of Staphylococcus don‟t encode
typical classical partition proteins, the way by which it ensures stable inheritance is not
understood properly (Guynet and de la, 2011). Plasmid R388 of E. coli are known
example of Type IV partition system. R388 plasmid is an representative of a minimal
conjugative plasmid genome which is maintained as four copies per E. coli and R388
plasmid encodes similar homologues of partition and they are named as StbA , StbB ,
stbC (Guynet et al., 2011). Deletion of the stbA gene increase frequency of plasmid
missegregation and indicating StbA is important for partition. Overall conclusion of these
studies indicates R388 plasmid segregates by passive mechanism or by taking advantage
of the host chromosome segregation.
1.2.5 Transcriptional regulation of parAB expression:
Regulation of partitioning genes expression is essential and any change in the levels of
expression of these genes causes change in phenotype. Transcriptional regulation of „par’
37
genes has been studied mostly in plasmid type partitioning system, the regulation of „par’
gene in chromosomal type partitioning systems still remains obscure. In plasmid type Ia
partitioning system, the ParA functions both in DNA partitioning as well as in the
regulation of parAB operon expression. The role of ParA as a transcriptional regulator is
essential for maintaining relative levels of ParA and ParB within the cell. Change in the
ratio of ParA to ParB causes the defect in the partitioning as well as regulation of parAB
genes expression. ParA can exist in two forms like ParA-ATP and ParA-ADP. The
ParA-ADP form act as transcription repressor by binding to the promoter region of the
parA and down regulate parAB operon (Bouet and Funnell, 1999;Dunham et al., 2009).
In vivo and in vitro studies have indicated that ParB can stimulate the repressor activity of
ParA, acting as a co-repressor by altering ATP recycling process. This occurs mainly by
increase in net levels of ParA-ADP. In pB171 plasmid or pTAR plasmid , which mainly
confer type Ib partitioning system and also in case of type II plasmid partition system, the
ParB or its homologue is shown to regulate „par’ genes (Jensen et.al 1994). In pB171
plasmid the ParR (ParB homologue) regulates parMR operon by binding to parC a 10bp
repetitive sequence located upstream to parMR operon. It is hypothesized that the
regulation of both operons‟ (parMR, parAB) in type Ib partitioning system occurs by
binding of ParB protein to the parS site located upstream of these genes. Binding of ParB
or ParR to parS or parC sites, respectively form high order nucleoprotein complex, which
prevent access to RNA polymerase and there by regulate dual operons.
1.3 Mechanisms of chromosome segregation in bacteria:
In chromosomes, „par‟ homologues i.e. (ParA and ParB) are identified from different
Gram -positive, Gram - negative and archea bacteria ( Dubarry et al., 2006; Yamaichi

38
and Niki, 2000). Most of these bacteria contain single circular chromosome with single
independent partition system like B.subtilis, Mycobacterium, and Streptomyces. Some
interesting exceptions are like Vibrio cholerae (2 Chromosomes), Deinococcus
radiodurans (2 chromosomes and 2 plasmids), Brukholderia (4 chromosomes) (Dubarry
et al., 2006), which have multipartite genome system. Homologues „par‟ systems are
identified in bacteria harboring single circular chromosome or multiple chromosomes
differs from plasmid „par‟ system in few aspects. (1) plasmids encode single centromere
sequence where as chromosomes has shown multiple parS sites and location of these
centromere sequence in few bacteria is near to the origin of replication or some time
scattered throughout the genome, 2) Deletion or point mutation of parAB genes doesn‟t
always cause chromosome loss where as in plasmid it perturbed the segregation process.
Some of the well studied bacterial chromosome segregation systems are Bacillus subtilis,
Caulobacter crescentus and Vibrio cholerae.
Bacillus Subtilis
B. subtilis has ability to form spores which under favorable conditions germinate and
grow vegetativley. Vegetative growth cycle involves symmetrical cell division and
genome partitioning. Under unfavorable conditions the growth cycle involves
asymmetrical division (Errington, 2003). Genome partitioning has been extensively
studied in both the conditions i.e. vegetative as well as in sporulation condition.
Partitioning proteins in B. subtilis are named as Soj (ParA) and Spo0J (ParB).
Inactivation or deletion of spo0J in vegetative cells showed increased frequency of
chromosome loss by nearly 100 fold comes about 1-2% of anucleation (Lee et al., 2006).
The spo0J deletion also perturbed cell size, distorted nucleoid and showed guillotined

39
cell as compared to wild type. The Spo0J specifically interacts with 16bp region
(tGTTtCAcGTGAAAAa/g) (Lin and Grossman, 1998) sites located within 20% of origin
proximal region known as parS sequence to form higher oligomeric structures (Draper
and Gober, 2002;Lee et al., 2003;Lin and Grossman, 1998) and it is observed that parS
sequence is highly conserved across the bacterial species (Livny et al., 2007). Even
though parS are distributed over nearly 20% from origin proximal region, the Spo0J-GFP
formed single bright foci indicating formation of the highly organized structure (Lee et
al., 2003;Lin and Grossman, 1998). In the absence of Soj protein, Spo0J formed multiple
small foci indicating binding of Spo0J to the parS sequence is independent of Soj, but
formation of complex structure depends on the Soj protein. Soj belongs to Type Ia
Walker ATPase family proteins containing deviant Walker motif. Initially Soj was
identified as genetic suppressor of the Spo0J mutant i.e. deletion of Soj restored normal
expression of sporulating specific genes as well as anucleation effect. Unlike of Spo0J
mutant Soj mutant doesn‟t shown any anucleation phenotype or change in cell length.
However, functional role of Soj in stabilization of the unstable plasmid has been
demonstrated, indicating its role in genome segregation.
Further the role of Soj in genome segregation has been studied by isolating smc/soj
deletion mutant different point mutations like Soj K16A, Soj K16Q, Soj D125A, and Soj
G12V in walker motifs. It is shown that all these mutants exhibit the loss of sporulation
activity or intensity of foci formation or association with DNA. However, it still remains
to be seen does Soj-Spo0J mediates partitioning in the classical cytomotive filament
manner or not (Pulling mechanism).

40
Overall results despite of some conflicting reports indicate that there is a minor role of
the Spo0J and Soj proteins in chromosome segregation during sporulation, but it is
relatively consistent during normal growth. In addition, it seems likely that Spo0J/Soj act
Soj - ATP
Soj - ADP
Spo0J
ATP
ADP
Nucleotideexchange ATP hydrolysis
? ?
Partition / Condensation of Spo0J foci
Partition / Condensation of Spo0J foci
Fig1.6: Role of ‘Par’ proteins in B. subtilis: Role of the Soj is dependent on the
nucleotide binding state. Soj exists in ADP and ATP bound form. Soj- ATP interacts
with the Spo0J. This interaction mediates in chromosome segregation. In the cytomotive
filament Soj-ATP is converted to Soj- ADP. ADP bound Soj filament bind in the
upstream region of the sporulating genes and regulate gene expression.
as a check point to regulate entry of cells into sporulation, but the exact stimulus for such
a checkpoint still undefined.
Escherichia coli
E. coli posses 4.6.Mb single circular chromosome. From studies on sub cellular
localization of the E. coli replisome proteins, revealed chromosome duplication occurs at
the mid cell position. Unlike other bacteria E. coli genome is devoid of well characterized
„Par‟ proteins. Recent studies on chromosome segregation showed apart from „Par‟
41
proteins other factors like Topoisomerase, FtsK, MukBEF proteins are also involved in
chromosome segregation. Among these factors, the mutation in muk BEF genes of E. coli
had shown formation of anucleated cells, change in the DNA content of the cells as well
as abnormal chromosome positioning. MukB in E. coli and SMC in B. subtils and
Streptococcus pneumonia localize on the chromosome near to the origin of replication
(Sullivan et al 2009; Minnen et al 2011), binding of SMC proteins is enhanced through
the ParB – parS complex, suggesting that both the systems seem to be taking during
chromosome segregation. However role of the MukBEF in chromosome segregation is
unknown. Recently interaction between MukB and Topoisomerase IV domain has been
demonstrated in E. coli (Li et al 2010) indicating that the MukB could support
chromosome partitioning by promoting resolution of intertwined circular duplicated
chromosomes.
Caulobacter crescentus:
Caulobacter crescentus is a Gram negative oligotrophic bacteria containing single
chromosome which encodes single ‘par’ operon. Partitioning genes in this organism are
named as parA and parB which are essential for growth and division (Mohl et al.,
2001;Mohl and Gober, 1997). Unlike other organisms Caulobacter crescentus divides
asymmetrically to produce swammer and stalked cells. The swammer cells have single
cell with polar flagellum and doesn‟t initiate DNA replication. In the developmental
process swammer cells will be converted into stalked cell by shading flagellum and
chemotaxis receptors. Deletion or over expression of „Par‟ proteins resulted in
chromosome loss as well as cell filamentation, this suggesting „Par‟ mediated segregation
is linked to cell cycle process (Thanbichler and Shapiro, 2006). Chromosome in C.

42
crescentus is localized at polar region i.e. oriC is anchored at one of pole and terminus to
opposite pole. Upon duplication of oriC one of the copy traversed to opposite pole before
septum formation, indicating C. crescentus follows polar asymmetric segregation.
Time lapse microscopy studies revealed chromosome segregation is a multistep process.
1) First step is slow process where one copy is retracted towards old pole and second
copy is translocated to opposite pole (new pole).
2) Final step is rapid, where ori is translocated to opposite pole, rapid movement
occurred due to retraction of Par A filament.
Fig 1.7 Segregation mechanism in C. crescentus : 1) ParA nucleates on the opposite
side of the cell and extends bi directionally. 2-3) The interaction of ParB nucleoprotein
complex stimulates depolymerization of ParA oligomers on the DNA.4) After DNA

43
segregation, cell septum formation occurs on the mid of the cell.5) Results in formation
of new daughter cells.
Using super resolution microscopy it was shown that nucleation of ParA occurs at
opposite side of ori and is determined by TipN protein. ParA form filamentous structures
due to interaction of ParA-ATP with the DNA. Filament grows towards origin of
replication from the ParA nucleation point. Before DNA replication is completed, the
length of the ParA nucleoprotein structure is maintained due to its weak intrinsic ATPase
activity (Easter, Jr. and Gober, 2002). Once DNA is duplicated, the sister chromosomes
are separated due to force generated by replication process or due to entropy in DNA
resulting the pulling of duplicated ParB-parS nucleoprotein complex apart (Dworkin and
Losick, 2002;Lemon and Grossman, 2001). Interaction of ParA with ParB nucleoprotein
complex results in pulling of newly duplicated DNA towards opposite pole along with
the retracted ParA filament (Shebelut et al., 2010). Above proposed mechanism shares
maximum similarities with the segregation of V. cholerae chromosome I (Fogel and
Waldor, 2006) as well as with pB171 plasmid (Ringgaard et al., 2009).
Vibrio cholerae
V. cholerae is canonical model of bacteria containing multiple chromosomes (Egan et
al., 2005). Genomic DNA is divided into chromosome I (2,961,149 bp) and chromosome
II (1,072,315 bp). Individual chromosome encodes independent partition system.
Mechanism of chromosome I and chromosome II „par‟ system is non redundant as the
segregation of chromosomes is independent (Fogel and Waldor, 2005). By using plasmid
stability assay it was demonstrated that „par‟ system of individual chromosome stabilizes
unstable plasmid. Hence it is considered to be actively involved in chromosome

44
segregation. Genetic and microscopic studies also showed chromosome I and
chromosome II distinctly localized within cell i.e. chromosome I origin localized at the ¾
position (cell poles), similar to other known asymmetric chromosome segregating
bacteria. Whereas chromosome II localized at the mid of the cell and follow bidirectional
pattern of chromosome segregation. The ori C region of chromosome I duplicates at ¾
position of the cell and segregate towards opposite pole. Movement of origin is correlated
to the ParB-GFP movement in actively growing cells with respect to time. During initial
phases of cell cycle, the ParB1 binds at parS site and ParA1 is required for the polar
localization of the ParB1-parS complex. Pulling type mechanism is proposed for
chromosome I segregation. Before cell division, the replicated chromosome anchored to
the pole by interaction of ParA1 to unknown protein, then ParA1 nucleates at the septum
forming location and polymerizes or bands or networks in the direction of opposite pole.
In segregation process, firstly the ParB interacts with parS to form ParB-parS complex
and then this complex is captured by ParA retracting it to the new pole and as a result the
ParB bound parS gets segregated to new pole. It is like other „par‟ directed pulling
mechanism which is already described in other organisms (Fogel and Waldor, 2006).
Unlike chromosome I which has one parS site, chromosome II has nine parS2 sites
(Yamaichi et al., 2007). Native ParA2 hydrolyse ATP similar to Type I ParA. It forms
ordered filamentous structure on non specific DNA in presence of ATP. It is
hypothesized that there may be some cross talk between chromosome I and chromosome
II „par‟ systems as they share nearly 45% similarities at the amino acid level (Jha et al.,
2012;Yamaichi et al., 2007). By genetic analysis, the deletion of chromosome I „Par‟
proteins resulted to mislocalization of origin of replication of chromosome I, where as

45
segregation of chromosome II is not affected. The parAB2 deletion resulted in gross
change in localization of origin and segregation, which lead to the loss of chromosome II
but no effect on chromosome I segregation or localization (Fogel and Waldor, 2005).
This solo study as the example of genome segregation in multipartite genome containing
bacteria provided the strong evidence that both the chromosomes are being maintained
independently using their cognate partitioning system. The other good model system for
such study is Deinococcus radiodurans, has been investigated under this study.
1.4 Deinococcus radiodurans as a model organism:
Deinococcus radiodurans belongs to the Deinococcaceae family, is well known for
exceptional ability to withstand the lethal effects of different DNA damaging agents, such
as ionizing radiation, ultraviolet (UV) light, and desiccation etc. (Cox et al., 2010;Rainey
et al., 2005;Slade and Radman, 2011). Till now, more than 45 species were isolated from
diverse environments among these D. radiodurans is best characterized. It was first
isolated in canned meat that had been irradiated at 4,000 Gray (Gy) in order to achieve
sterility (Duggan et al., 1963). Phylogenetic analysis suggested Deinococcus is closely
related to the genus Thermus (heat-resistant bacteria). D. radiodurans is a Gram positive,
non pathogenic, non motile, non spore forming and pinkish orange pigmented bacterium.
In spite of staining as Gram-positive, the cell wall composition differs from other Gram-
positive bacteria in respect to its lipid composition. Anderson in 1985 characterized in
detail the lipid composition of D. radiodurans. Their study showed that of the total
membrane lipid, 43% is composed of phosphor glycolipids containing a series of alkyl
amines as structural components, and some unknown lipid constituents which appear to
be derived from a novel precursor phosphatidylglycerolalkylamine. D. radiodurans

46
grows optimally at 32oC in rich medium and is an obligate aerobe. Cells are naturally
competent and genetic tools are available for conditional expression or complete
inactivation of genes as shown by different groups (Funayama et al., 1999;Lecointe et al.,
2004;Meima and Lidstrom, 2000).
Deinococcus radiodurans R1 has the ability to survive high doses of gamma
radiation as well as UV radiation without any mutation (Moseley and Evans, 1983). In
the exponential growing D. radiodurans showed 10% survival at 8kGy, where as
exponentially growing E. coli, showed 10% survival at 150 Gy only i.e. D.
radiodurans showed over 100 fold greater resistance than E. coli (Minton, 1994).
Compared to other organisms, the D. radiodurans can sustains 150 to 200
double stranded DNA breaks (DSBs) under aerobic irradiation conditions, all of which
are mended within four hours following irradiation (Daly and Minton, 1995;Slade et al.,
2009). It has been demonstrated that DSB repair in this bacterium is contributed by RecF
pathway (Misra et al., 2006) and incidentally, over expression of RecBC from E. coli
made this bacterium sensitive top gamma radiation (Khairnar et al., 2008). In exponential
phase, D. radiodurans is 33 fold more resistant to UV than E. coli. In addition to gamma
and UV, D. radiodurans can survive the lethal effects of alkylating agents which add
bulky groups without showing any mutagenesis (Sweet and Moseley, 1976). D.
radiodurans is mutable by N-methyl-N9-nitro-N-nitrosoguanidine and other agents that
can cause mispairing of bases during DNA replication. Unusual tolerance of D.
radiodurans to different DNA damaging agents is due to different mechanism involved in
prevention or tolerance against DNA damaging agents or presence of extra ordinary
repair mechanism and few other factors like polyploidy, organization of nucleoid.
47
Ionization radiation passes through matter and generating different free radicals like HO•,
H+ and e–aq
due to radiolysis of water molecules (Daly et al., 2010). This free radical
indiscriminately oxidizes or damage DNA, RNA, proteins and lipids. Compared to most
of the organism, proteins in D. radiodurans are highly protected from ROS with in cells,
but as such proteins do not have an inherent property of protection. Daly in 2010 reported
chemical mechanisms are involved in protection against radiation i.e. multiple factors are
observed in the D. radiodurans filtrate like orthophosphate (13 mM), Mn+2
(200µM) and
peptides (3mM) which are known to protect proteins against the radiation. Other than
preventing protein oxidation Mn+2
mimics the SOD and can scavenge different ROS
(Reactive Oxygen Species). Daly and colleagues hypothesized that this phenomena is
contributing to the large shoulders in ionizing radiation dose response curves.
Alternatively Minsky and coworkers proposed that the increased concentration of Mn+2
with in cell could contribute to the condensation of D. radiodurans genome by
neutralizing the repulsion of phosphate groups in DNA backbone. Some more
antioxidants were also present in D. radiodurans other than Mn+2
complexes like
deinoxanthin (Deinococcal carotenoid) which is more effective in scavenging ROS than
other known carotenoids, pyrroloquinoline quinone (PQQ) coenzyme (Khairnar et al.,
2003;Misra et al., 2004), which detoxifies ROS more efficiently than other natural
antioxidants. Interestingly, it is found that D. radiodurans devoid of PQQ becomes
hypersensitive to gamma radiation and mechanistically this antioxidant molecules is
shown to be inducer of protein kinase and has a role in DSB repair per se (Rajpurohit et
al., 2008). Oxidative damage of DNA is repaired by excision repair pathways mainly by
base excision repair. DNA glycosylases (Moe et al., 2012;Sandigursky et al., 2004) and

48
DNA repair polymerase Pol X (Bentchikou et al., 2007) have been shown for their roles
in DNA metabolism associated with base excision repair. DNA polymerase X a
homologue of polymerase beta in eukaryotes is characterized as a short patch base
excision repair polymerase (Khairnar and Misra, 2009).
In 1995, Minton and Daly showed the DNA double strand break repair kinetics of
Deinococcus radiodurans, in wild type and recA mutant by pulse field gel
electrophoresis. Even though recA mutant is very sensitive to gamma radiation, initial
joining of the fragments was observed on the gel. Based on these results they proposed
that initial period of DNA repair may proceed either through Single Strand Annealing
(SSA) or by non-homologous end joining method which is RecA independent. Phase II
may progress through RecA dependent homologous recombination. Thus a biphasic
DNA repair model was proposed (Minton, 1995).
Blasius.M (Crit Rev Biochem Mol Biol 43,2008)
Fig 1.8: ESDSA mechanism in D. radiodurans: Two stages of genome reconstitution
in D. radiodurans. The first stage, extended synthesis dependent single strand annealing
(ESDSA) is dominated by nuclease and DNA polymerase functions. The second stage is

49
a more conventional RecA mediated double strand break repair process focused on the
final splicing of large chromosomal segments.
Recently, Zahradka and his group in 2006 analyzed the repair of the D. radiodurans
DNA shattered by ionizing radiation by an adaptation of the classical Meselson-Stahl
experiment. They found that in D. radiodurans DNA fragment assembly coincides with a
massive DNA synthesis that occurs at a much higher rate in irradiated cells than in
unirradiated growing cultures and the reassembled genome appears to be composed of a
patchwork of contiguous blocks of old and newly synthesized DNA (Zahradka et al.,
2006). Based on these findings they proposed a mechanism called Extended Synthesis
Dependent Strand Annealing (ESDSA).
According to the ESDSA model, the single-stranded tail of a recessed fragment invades a
partially overlapping fragment and primes DNA synthesis through a moving D-loop
producing long stretches of single strand DNA that anneal to complementary sequences.
Dissociation of the newly synthesized DNA from the template produces thereby
facilitating the precise reconstruction of long double strand DNA intermediates. These
intermediates subsequently recombine to reform a circular chromosome. Two enzymes
play a key role in the ESDSA model, PolA, which participates in the initial DNA
synthesis step, and RecA, that ensures the maturation of the linear intermediates into full
size circular chromosomes through a classical recombination process. Thus polA and
recA mutants are highly radiation sensitive (Zahradka et al., 2006). A number of
hypothetical ORF‟s have been characterized for their roles in radiation resistance. The
most notable ones include the DRA0282 as human Ku like proteins (Das and Misra,
2011), DR2417 as a novel beta CASP family nuclease (Das and Misra, 2012), DR2518 as

50
a DNA damage inducible Serine / threonine protein kinase (Rajpurohit and Misra, 2010),
DRB01000 as ATP type DNA ligase (Kota et al., 2010), DR0505 as a thermo stable
Mre11 type novel esterase (Kota et al., 2010) etc.
Genome structure of Deinococcus radiodurans
White & coworkers published the sequence of 3,284,156 base pairs genome of
D. radiodurans in 1999, which revealed that this bacterium harbors multipartite genome
structure consisting of two chromosomes (2,648,638 and 412,348 base pairs), a mega
plasmid (177,466 base pairs), and a small plasmid (45,704 base pairs) (White et al.,
1999). Out of 3187 total ORF‟s annotated 2185 ORF‟s matched with the known
homologues public database and 1002 ORF‟s showed no matches. Total 95 gene families
are identified after PSI-blast analysis, among these P-loop nucleotidase is the largest
family consisting of 120 genes, second largest in HTH family proteins (DNA binding
proteins) consisting of 72 genes. Majority of chromosome I components including
partitioning proteins shares similarities with the chromosome of T. thermophilus
indicating that chromosome I shares common ancestry with T. thermophilus where as
remaining genetic elements acquired separately due to horizontal gene transfer
mechanism. Chromosome I contain most of the essential genes required for replication,
division, growth. Whereas chromosome II and mega plasmid contain genes that play
important role in cell response to extreme conditions i.e. chromosome II and mega
plasmid encode nearly 30% regulatory response genes, two of three hemolysins, four of
the nine extracellular protease and ABC transporters which can import amino acids,
peptide fragments. Few genes are also present on chromosome II which are involved on
production of amino acids, urea. Mega plasmid contains genes that are required for

51
synthesis of dNTP‟s or dNTP precursor molecules like periplasmic alkaline phosphate
which are essential for restoration of damage site. Origin of replication is annotated
based on oligomer skew and presence of certain genes like (dnaA, dnaN) for chromosome
I and presence of parA for chromosome II, origin of replication is annotated for
megaplasmid based on the oligomer skew analysis or sequence similarities with predicted
origin of replication.
Genome of this bacterium is usually condensed to form toroidal structures (Levin-
Zaidman et al., 2003;Levin-Zaidman et al., 2003;Minsky et al., 2006). Minsky and
colleagues for the first time showed that in D. radiodurans genome exist as donut-like
DNA structures, as detected by transmission electron microscopy. They further showed
that this compact form of nucleoid remains unaltered after high doses of γ-irradiation.
Compact nucleoid organization gives close proximity to repair the damaged DNA.
Mechanisms underlying the maintenance of ploidy and faithful inheritance of multipartite
genome of D. radiodurans during normal growth are not known. As the understanding of
the mechanisms underlying bacterial genome segregation has come from bacteria
harboring single circular chromosome and low copy plasmids, the bacteria harboring
multipartite genome structure would be an interesting model system to understand the
maintenance and faithful inheritance of complex bacterial genome. Next to V. cholerae,
D. radiodurans also harbors multipartite genome structure. Genome of this bacterium is
also annotated with putative parA-parB genes. Except small plasmid, other genome
replicating units have their own sets of putative ParA and ParB proteins which are
encoded in an operon. Centromeric sequences however, are not known in any of these
genome replicating units. The presence of multiple sets of „Par‟ proteins has been
52
reported in bacteria including D. radiodurans that harbor multipartite genome system.
This raises the possibility of functional redundancy amongst these proteins in D.
radiodurans. Functional characterization of „Par‟ proteins encoded on different
replication units in D. radiodurans would be a first step forward in understanding the
mechanism(s) of chromosome segregation. Under this study, therefore, we proposed to
characterize the „Par‟ proteins of chromosome I and chromosome II and to understand the
mechanism underlying for the segregation of chromosome I in Deinococcus radiodurans.

53
Materials and Methods
54
2.1. Materials
Plastic ware and glassware
Disposable polypropylene microcentrifuge tubes (1.5ml and 2ml), micropipette tips,
Polypropylene SS34 tubes and GSA bottles were obtained from Tarsons, India or
Axygen, USA. PCR tubes were also obtained from Axygen, USA. All these plasticwares
and glasswares were sterilized by autoclaving. Glasswares were also sterilized by baking
at higher temperature for 3h. Cryovials (2 ml) and low temperature storage boxes were
procured from Laxbro, India and Axygen, USA.
Chemicals and media ingredients
Dehydrated components of culture media (Bacto-tryptone and Bacto-yeast extract) and
agar-agar (Bacto-agar) powder were obtained from Difco Laboratories, USA. Fine
chemicals were from Sigma Chemical Company, USA or Roche Biochemicals GmbH,
Germany or S.R.L. Ltd., India or Bangalore Genei (P) Ltd., India. Inorganic salts, urea
for sequencing, organic solvents and acids of Excel-R or Anal-R quality were from
Qualigens (Glaxo) India Ltd. or Sigma Chemical Company, USA. Molecular Biology
Grade phenol was purchased from SRL, India.
Enzymes and other molecular biology reagents
T4 DNA polymerase, restriction endonucleases, T4 Polynucleotide Kinase, T4 DNA
ligase, and DNA polymerase (Klenow fragment) were obtained from New England
Biolabs, USA or Bangalore Genei (P) Ltd., India or Roche Biochemicals GmbH,
Germany. Shrimp Alkaline Phosphatase was from USB-Amersham, UK. Lysozyme

55
(from chicken egg-white), DNAase I (from bovine pancreas) and RNAase (from bovine
pancreas) were procured from Sigma Chemical Company, USA. Pwo-DNA polymerase
and deoxynucleotidetriphosphates (dNTP‟s) were from Roche Biochemical Germany.
Taq DNA polymerase and DNA molecular weight standards were from Bangalore Genei
(P) Ltd., India. PCR extraction kit, Gel extraction kit and RNA extraction kit were from
QIAGEN, Germany. All the primers used in this study were from Metabion, India.
Radionucleotides and Photographic materials
[32p] -ATP was from Board of Radiation and Isotope Technology (BRIT), India. X-ray
films of medical type were from Garware Polyester Ltd., India.
Preparation of dialysis tubing
Dialysis tubing was cut in as per requirement and soaked in sterile 50mM Tris HCl,
100mM NaCl buffer, pH 7.5 for overnight at 4oC. The buffer was replaced with similar
buffer containing 2 % Glycerol and 10 mM EDTA and autoclaved and stored at 4oC.
Composition of stock solutions
Stock solutions mentioned in Table 2.1 were prepared in GDDW and sterilized without
adjusting the pH wherever necessary. Preparation of all the antibiotic stock solutions is
given in Table 2.2. were prepared with sterile diluents and stored as aliquots at -20 C.
Different antibiotic containing LB or TYG plates were made by addition of required
amount of antibiotic‟s to agar media just prior to pouring the plates (~50 C). Plates
containing antibiotics were usually used within 1 day of pouring or else stored at 4 C.

56
Table 2.1 Composition of stock solutions
Chemical Concentration Storage
Stock Final
Adenosine
triphosphate (ATP) 10mM 1mM -20°C
Ammonium
persulfate (APS) 100mg/ml 1 mg/ml -20°C
BSA 10.00% As required -20°C
CaCl2 1.0 M 100mM 4°C
dNTPs 100 mM As required -20°C
DTT 1.0 M 1mM -20°C
Ethidium bromide 5 mg/ml 0.5 mg/ml RT.
EDTA (Na salt) 0.5 M As required RT.
D-glucose 20.00% As required 4°C
Glycerol 98% As required RT.
KCl 2.0M As required RT.
IPTG 1.0M As required -20°C
MgCl2 1.0 M As required 4°C
MgSO4 1.0 M 10 mM 4°C
PMSF 100mM 1mM -20°C
SDS (Sodium salt) 10% As required RT.
Sodium acetate 3.0 M As required RT.
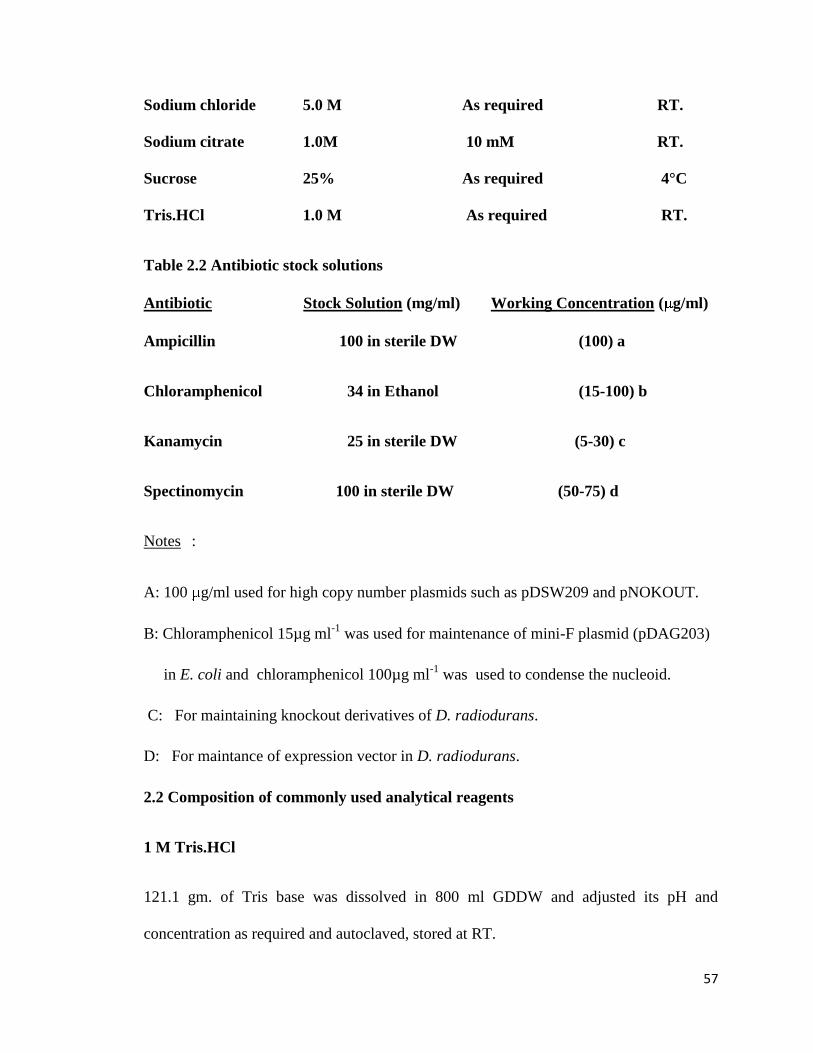
57
Sodium chloride 5.0 M As required RT.
Sodium citrate 1.0M 10 mM RT.
Sucrose 25% As required 4°C
Tris.HCl 1.0 M As required RT.
Table 2.2 Antibiotic stock solutions
Antibiotic Stock Solution (mg/ml) Working Concentration ( g/ml)
Ampicillin 100 in sterile DW (100) a
Chloramphenicol 34 in Ethanol (15-100) b
Kanamycin 25 in sterile DW (5-30) c
Spectinomycin 100 in sterile DW (50-75) d
Notes :
A: 100 g/ml used for high copy number plasmids such as pDSW209 and pNOKOUT.
B: Chloramphenicol 15µg ml-1
was used for maintenance of mini-F plasmid (pDAG203)
in E. coli and chloramphenicol 100µg ml-1
was used to condense the nucleoid.
C: For maintaining knockout derivatives of D. radiodurans.
D: For maintance of expression vector in D. radiodurans.
2.2 Composition of commonly used analytical reagents
1 M Tris.HCl
121.1 gm. of Tris base was dissolved in 800 ml GDDW and adjusted its pH and
concentration as required and autoclaved, stored at RT.

58
1M DTT
3.08 gm of dithiothreitol powder was dissolved in 20 ml of sterile MilliQ grade water.
Solution was filter sterilized using 0.22 m Whatman filter disc and stored at -20oC.
0.5 M EDTA (pH = 8.0)
186.1 gm. of disodium EDTA salt was dissolved in 800 ml GDDW and pH was adjusted
to 8.0 using 10 N NaOH. The final volume was made up to 1 litre and sterilized by
autoclaving, finally stored at RT.
Phenol
The molecular biology grade phenol was obtained from Sigma chemical company, USA
and frozen in –20oC. The frozen phenol thawed at 68 C and a pinch of stabilizer i.e. 8‟-
hydroxyquinoline was added to it. The phenol was then equilibrated by adding an equal
volume of 1 M Tris HCl (pH = 8.0) and finally stored in 100mM Tris HCl in dark at 4 C.
Phosphate Buffered Saline
Dissolve 8 gm NaCl, 0.2 gm KCl, 1.44 gm Na2HPO4 and 0.24 gm KH2PO4 in 800 ml
distilled water and adjusted pH to 7.4 using dilute HCl, volume was made up to 1000 ml
and sterilized by autoclaving. The buffer finally stored at RT.
GTE (for Alkaline miniprep)
GTE solution was prepared by diluting the respective stock solutions as mentioned in
Table 2.1 to 50 mM Glucose, 25 mM Tris.HCl (pH= 8.0); 10 mM EDTA (pH= 8.0).
Solution was autoclaved and stored at 4 C.

59
5 M Potassium acetate (for Alkaline miniprep)
59 gm. of potassium acetate dissolved in 100 ml Milli Q grade water to it 23 ml of glacial
acetic acid was added to obtain the final pH of 4.8. Then volume was made up to 300 ml
using sterile water stored at 4 C after autoclaving.
PMSF (100mM)
348 mg of the phenyl methyl sulfonyl fluoride (PMSF) powder was dissolved in 20 ml
isopropanol and vortexed vigorously until it get dissolved, small aliquots were stored by
wrapping vials with aluminum foil and stored at –20oC.
T10E1
10 mM Tris.HCl (pH= 8.0), 1 mM EDTA (pH = 8.0) were prepared by diluting
respective stock solution.
10 x TBE
108 gm. of Tris base, 55 gm. of boric acid (borate) and 40 ml of 0.5 M EDTA (pH = 8.0)
were resuspended in distilled water and the volume was made up to 1 litre.
50 x TAE
242 gm Tris base was dissolved in 800 ml of distilled water to it 57.1 ml of glacial acetic
acid and 100 ml of 0.5 M EDTA pH 8.0 was added. Solution was autoclaved and stored
at RT.
Metal affinity purification matrices

60
Immobilized metal affinity chromatography matrix was obtained from GE healthcare
(Sweden) as fast flow metal chelating materials and Ni-NTA agarose from QIAgen
(Germany).
Composition of media
All the media described here were sterilized by autoclaving at 15 P.S.I. for 20 min and
stored at RT., unless otherwise mentioned. To prepare solidified media 1.5% of Agar-
agar was added.
Luria Bertani Broth (LB)
NaCl, 10 gm.; Bacto-yeast extract, 5 gm.; Bacto-tryptone, 10 gm.; was resuspended in
distill water, final volume made up to 1 litre and the pH adjusted to 7.4 with NaOH.
TGY medium
Tryptone, 5g; Yeast Extract, 3g, Glucose, 1g were dissolved in 1000 ml of distilled water
and pH=7.4 was adjusted with NaOH.
2x TGY medium
Tryptone, 10g; Yeast Extract, 6g, Glucose, 1.0g were dissolved in 1000 ml of distilled
water and pH=7.4 was adjusted with NaOH.
Composition of other reagents used in molecular biology studies
6x DNA loading dye
DNA loading dye was made by adding 0.25 % bromophenol blue, 0.25 % xylene cyanol
and 50 % glycerol and this solution was autoclaved and stored at 4oC.

61
DNAase I
5 mg DNAase I, 2.6 ml sterile (98 %) glycerol and 150 l 5 M NaCl. were mixed to
dissolve in 2.25 ml sterile Milli Q grade water by repeatedly tapping or vortexing,
dispensed as 500 l aliquots and stored at -20 C.
RNAase A (10 mg/ml)
50 mg RNAase A was dissolved in 5 ml of 10mM sodium acetate (pH 5.2). The solution
was heated at 115oC for 15 min and allowed to decrease slowly to RT. To this, 500 l of
1MTris.HCl (pH = 7.5) was added and stored at –20oC.
Lysozyme
Lysozyme was freshly prepared at a concentration of 50 mg/ml in 10 mM Tris.HCl (pH =
8.0).
10 mM dNTPs (for PCR and blunting reactions)
40 l each of the four deoxynucleotide triphosphate solutions (25 mM stock) were mixed
and adjusted volume to 100 l with sterile distilled water and stored at -20 C.
Acrylamide Stock (30%)
29.2gm acrylamide and 0.8 gm of N, N-Methylene (bis) acrylamide was dissolved in 70
ml distilled water. The mixture was stirred for 30 min to assure complete dissolution and
then the volume was made up to 100 ml. Then solution was filtered through Whatman
540 filter disc and stored at 4oC.
Acrylamide Stock (40%)
62
38gm acrylamide and 2 gm of N, N-Methylene (bis) acrylamide was dissolved in 70 ml
double distilled water at 37oC. The mixture was stirred for 30 min to assure complete
dissolution and then the volume was made up to 100 ml. The solution was filtered
through Whatman 540 filter disc and stored at 4oC.
2x Laemmelli Cracking buffer
460 mg of SDS, 7.6 mg of EGTA, 20 mg of sodium azide, 2 ml of Glycerol, 150 l of
100mM PMSF, 1.0 ml -mercaptoethanol in 2.5 ml of 0.5M Tris-HCl, pH 6.8 and 40 l
of 0.5 % bromophenol blue was added and volume was made up to 10 ml with distilled
water.
10 x SDS PAGE electrophoresis buffer
30 gm Tris base, 144 gm Glycine and 10 gm SDS was dissolved in 800 ml distilled
water. The volume was made up to 1000ml with distilled water.
Destain solution I
500 ml of methanol was mixed with 100 ml of glacial acetic acid, volume made to 1 litre
with distilled water. The solution was kept in dark bottle and in air-tight container. This
can be used for two to three times.
Destain solution II
Destain II was prepared with 100 ml methanol, 100ml glacial acetic acid and 20 ml of
glycerol in 1000 ml solution. The contents were mixed thoroughly and stored in dark
bottle and air tight container.

63
Coomassie Brilliant Blue staining dye
0.5 gms of Coomassie Brilliant Blue R250 was dissolved in 42.5 ml GDDW. To this, 50
ml of methanol and 7.5 ml of glacial acetic acid was added. Solution was stirred and
filtered through Whatman 540 filter paper.
Malachite Green Reagent
Solution A: 0.4% Malachite green (w/v) in dH20 (30ml). Prepare by vigorously stirring
on magnetic stirrer for 30 min.
Solution B: 4.2% Ammonium molybdate (w/v) in 5M HCl. Prepare by vigorously
stirring with magnetic stirrer for 30 min.
Solution C: 1.5% Tween 20(w/v) in dH2O. Prepare by vigorously stirring with magnetic
stirrer for 30 min.
Solution D: Mix 1 volume of solution B+3 volumes of solution A. Prepare by vigorously
stirring with a magnetic stirrer for 30 min. Then filter through Whatmann filter paper to
obtain a yellow colored solution. This stock is stable for 2-3 weeks in dark.
Working solution:
Before use, mix 1ml of solution C with 32 ml of solution D. Prepare by vigorously
stirring with a magnetic stirrer for 30 min.
TBS (Tris- Buffered Saline)
20 ml of 1M Tris-HCl, pH 7.6 was mixed with 200 ml of 5M NaCl and volume was
made up to 1000 ml with sterile distilled water. The solution was stored at RT.

64
TTBS
0.05% Tween 20 in TBS.
Blocking solution
3 gm of skimmed milk powder was mixed with 100ml TBS was dissolved and stored at
4oC.
Antibody Buffer
3 gm of skimmed milk powder was mixed with 100ml TTBS solution and used fresh.
Transfer Buffer:
48 mM Tris base; 39mM Glycine; 20% methanol.(5.82 gm Tris base+2.92 gm
Glycine+200ml methanol and make up to 1 lit with DW).
2.3 Methods
2.3.1 Microbiological methods
Maintenance of the bacterial stocks
Bacterial stocks were maintained at RT and under frozen conditions. Room temperature
stocks were made in soft agar LB medium containing 0.2 % glycerol. The medium was
dissolved by heating at 100oC and cooled down to 48
oC before it was dispensed to
airtight screw capped tubes to 80% of the total capacity. The vials were loosely capped
and sterilized by autoclaving. They were allowed to cool down to RT before the caps

65
were tightened and incubated at 37oC overnight. The bacterial cells were stabbed with
needle wire and preserved at RT.
Alternatively, bacterial culture stocks were preserved at freezing temperature in presence
of cryoprotectants. The logarithmically growing culture was spun and resuspended in
minimal medium and /or LB medium to cells density of 109 cells per ml. The cell
suspension was mixed with 20% glycerol in polypropylene screw capped tubes and
stored in freezing temperature tolerant boxes, at –70oC. The stocks were numbered and
entered in the bacterial culture book with full details.
Growth of the bacterial strains
Different bacterial strains used in this study are summarized in Table 2.3. Bacterial
culture was taken from long-term storage stocks directly on LB / TGY agar plates and or
plates containing appropriate antibiotics if required. The plates were incubated at
appropriate temperature for overnight. Single isolated colonies were inoculated in liquid
broth with or without antibiotics and allowed to grow at 37oC for E. coli and 32
oC for D.
radiodurans at shaking speed of 150 rpm overnight. The overnight grown liquid culture
was diluted to 1:100 in fresh broth with selection pressure if required. The culture was
allowed to grow with shaking at 200 rpm at appropriate temperature. The aliquots were
drawn at different time intervals and optical density was measured at 600 nm. In parallel
an appropriate dilutions were plated on suitable agar plates and the numbers of colonies
were counted. The growth curve drawn under defined set of conditions was used in
determining the different growth phases of the culture for different experiments. Total
number of colonies appeared on agar plates after different treatments of D. radiodurans
cells were taken for calculating the survival efficiency.
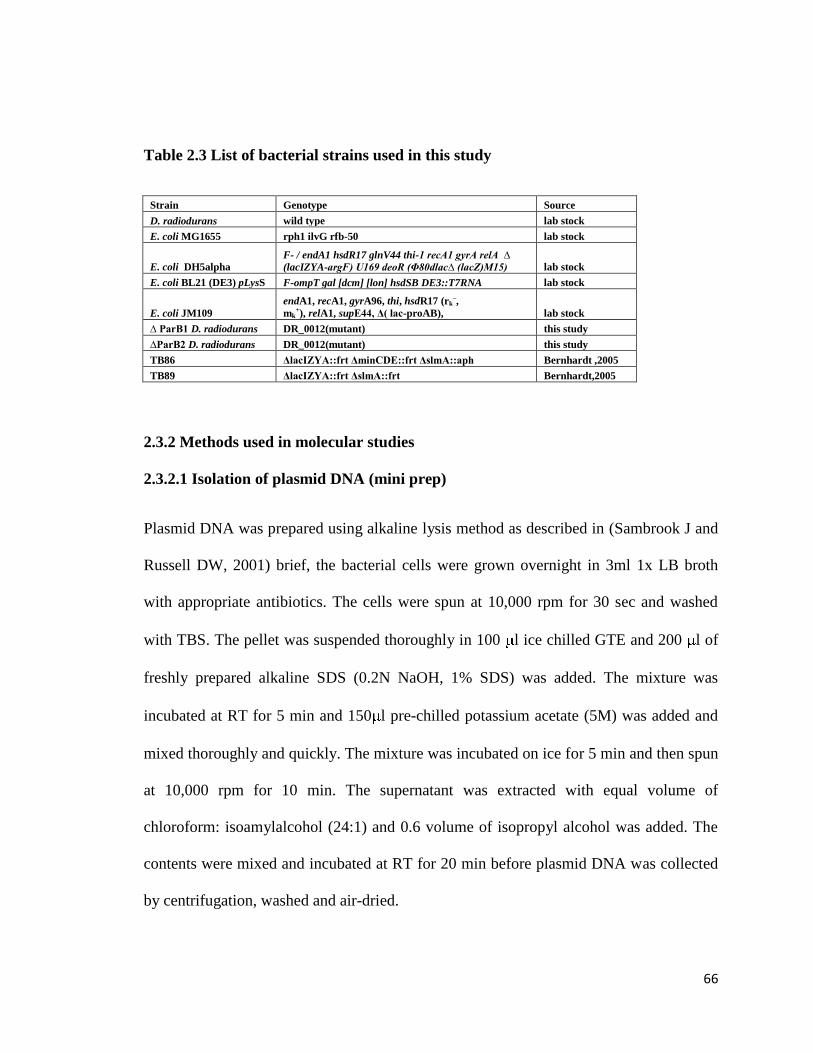
66
Table 2.3 List of bacterial strains used in this study
Strain Genotype Source
D. radiodurans wild type lab stock
E. coli MG1655 rph1 ilvG rfb-50 lab stock
E. coli DH5alpha
F- / endA1 hsdR17 glnV44 thi-1 recA1 gyrA relA ∆
(lacIZYA-argF) U169 deoR (Φ80dlac∆ (lacZ)M15) lab stock
E. coli BL21 (DE3) pLysS F-ompT gal [dcm] [lon] hsdSB DE3::T7RNA lab stock
E. coli JM109
endA1, recA1, gyrA96, thi, hsdR17 (rk–,
mk+), relA1, supE44, Δ( lac-proAB), lab stock
∆ ParB1 D. radiodurans DR_0012(mutant) this study
∆ParB2 D. radiodurans DR_0012(mutant) this study
TB86 ΔlacIZYA::frt ΔminCDE::frt ΔslmA::aph Bernhardt ,2005
TB89 ΔlacIZYA::frt ΔslmA::frt Bernhardt,2005
2.3.2 Methods used in molecular studies
2.3.2.1 Isolation of plasmid DNA (mini prep)
Plasmid DNA was prepared using alkaline lysis method as described in (Sambrook J and
Russell DW, 2001) brief, the bacterial cells were grown overnight in 3ml 1x LB broth
with appropriate antibiotics. The cells were spun at 10,000 rpm for 30 sec and washed
with TBS. The pellet was suspended thoroughly in 100 l ice chilled GTE and 200 l of
freshly prepared alkaline SDS (0.2N NaOH, 1% SDS) was added. The mixture was
incubated at RT for 5 min and 150 l pre-chilled potassium acetate (5M) was added and
mixed thoroughly and quickly. The mixture was incubated on ice for 5 min and then spun
at 10,000 rpm for 10 min. The supernatant was extracted with equal volume of
chloroform: isoamylalcohol (24:1) and 0.6 volume of isopropyl alcohol was added. The
contents were mixed and incubated at RT for 20 min before plasmid DNA was collected
by centrifugation, washed and air-dried.
67
2.3.2.2 Large scale preparation of plasmid DNA.
Large scale preparation of plasmid DNA was carried out as described in Sambrook 2001.
In brief, cells harboring high copy plasmid DNA were grown overnight with vigorous
aeration in 50 ml 1x LB broth medium. The low copy number plasmid harboring
bacterial culture was grown overnight in presence of antibiotics and then diluted 1:100 in
500 ml LB with antibiotic and allow to grow till OD 600 was 0.4. Appropriate antibiotic
was added in the mid exponential phase culture and allowed to grow for 12-16h at 37oC
with vigorous shaking. Cells were harvested and washed with TBS. The plasmid DNA
was prepared using alkaline lysis method. The cell pellet was completely suspended in 4
ml GTE buffer and to this 8 ml alkaline SDS solution was added. Contents were gently
mixed and incubated at RT for 5mins. The nucleoprotein-SDS complex was precipitated
with 6 ml of pre chilled 5M potassium acetate (pH 5.6) solution on ice for 5 min. The
supernatant was collected by centrifugation at 12K for 10 min at 4oC and RNase A
(50 g/ml) was added and extracted with equal volume of CHCl3: IAA (24:1). The upper
layer was taken and DNA was precipitated with 0.6 volume of isopropanol at RT for 20
min. The DNA was collected by centrifugation at 12 K for 10 min and washed with 70%
ethanol followed by absolute alcohol. The pellet was dried and DNA was dissolved in
sterile water. The plasmid DNA concentration and purity were determined by measuring
the OD260 and OD280, spectrophotometrically. The purity of DNA preparation was
assured by finding the ratio of A260/A280. (A260 of 1.0 corresponds to 50 g/ml DNA,
A260/A280 ratio indicates the purity of the DNA preparation, the ratio more than 1.65
showed the DNA free from proteins).

68
2.3.2.3 Genomic DNA isolation
Escherichia coli:
Bacterial chromosomal DNA was isolated using protocol as described earlier (Clark,
1971). In brief, the cell pellet was washed with TBS and preserved at –70oC if not
processed immediately. The pellet was thawed at 4oC and homogenized in 1/10th volume
of 25 % sucrose and lysozyme (200 g/ ml) was added and mixed properly. The mixture
was incubated for 10 min on ice and 10mM EDTA (pH 8.0) was added and incubated for
5 min on ice. The cells were lysed with 0.5% SDS and mixed gently to get clear lysate.
The RNAase A (50 g/ml) was added and incubated at RT for 20 min. The lysate was
extracted with equal volume of phenol (pH 8.0) till white precipitate stops coming. The
aqueous phase was extracted once with phenol: CHCl3: IAA (25:24:1) and once with
CHCl3: IAA. The aqueous phase was mixed with 0.3M Na acetate and 2.5 volume of
chilled ethanol was added from the side of the tube to layer on the top of the DNA
solution. The high molecular weight DNA was recovered by spooling on sterilized glass
rod. The spooled DNA was washed with 70% ethanol and air-dried. The total DNA was
recovered by centrifugation and washed with 70 % ethanol. The DNA pellet was
dissolved in sterile 10 mM Tris-HCl, pH 8.0.
D. radiodurans:
The 100 ml culture was overnight grown at 150 rpm at 30oC. The cells were collected,
pellet was washed with 70% ethanol and resuspended in 1ml TE Buffer, add 2mg/ml
lysozyme (stock 10mg/ml) and incubated at 37oC for 30 min. The 600µg /ml proteinase
K and 2% SDS was added and incubated at 37oC for 3 hours. Supernatant was extracted
69
and treated with equal volumes of phenol-chloroform, incubated on ice for 10 min.
Mixture was centrifuged at 10,000 rpm for 10 min. The aqueous layer was extracted with
equal volumes of 24:1 mixture of chloroform-isoamyl alcohol. The supernatant was
mixed with 1/10th
volume of 3M sodium acetate pH 4.5 & 2 volumes of ethanol and
incubated at -20oC for ½ hr. DNA was collected at 12,000 rpm for 15 min and dissolved
in sterile water. DNA concentration was ascertained with OD260 and on agarose gel (Das
and Misra, 2012;Earl et al., 2002;Kota and Misra, 2008).
2.3.2.4 Agarose gel electrophoresis
Agarose gel electrophoresis was used for the qualitative and quantitative analysis of
DNA. The agarose was dissolved in required buffer by heating in microwave oven and
the solution was cooled to around 50oC before ethidium bromide (EtBr) (0.5 g/ml) was
added and poured. It was allowed to solidify at RT for 30 min. The samples mixed with
gel loading dye solution were loaded and electrophoresed. The gel was run till tracking
dye has reached to 3/4th
of the gel length or depending on the experimental requirement.
Similar procedure was followed for preparation of the low melting point (LMP) agarose
gel but the ethidium bromide (0.5 g/ml) was added at 50oC and gel was polymerized at
low temperature.
After the electrophoresis has completed, the DNA bands were visualized on UV trans
illuminator (UVP Model 3UVTM Trans illuminator) at different wavelengths or with
hand UV lamp (Model UVGL-58) depending on the necessity of the experiment.
2.3.2.5 PCR amplification.
Primer design and synthesis

70
Primers were designed manually using the corresponding nucleotide sequences from
D. radiodurans genomes database and different primers used in this study are
summarized in Table 2.4. The sequence of the DNA to be amplified was taken and
restriction enzyme analysis was carried out using BIOEDIT software. The unique
restriction sites were noted and suitable restriction endonuclease sites were incorporated
into the forward and reverse primers sequence. Further some more sequences that are
required for efficient cutting by the corresponding restriction endonuclease were added at
the upstream to the 5‟end of both the primers. The composition of the primers was
adjusted to have at least 50 % G+C content (wherever possible). In any case the
minimum G+C content in the primer was not less than 40 %. The approximate Tm values
were determined as Tm= 2x (A+T) +4 x (G+C). Care was taken to avoid repetitive
sequences at the 3‟ end which might results in primer dimer formation and 3‟ base was
necessarily kept A or T while C or G was preferred as penultimate base. The complete
primer sequence was subjected for its match on the other sites of the chromosome. The
mismatch was adjusted in such a manner that 6-9 nucleotide of the 3‟ end should not have
perfect match on any other site on the chromosome. The primers were commercially
synthesized and purified to best purity by manufacturers.
Table 2.4: List of primers used in this study
dr0012F 5' GGAATTCCATATGGTGTCGAAAAAATCTAGCCT 3'
dr0012R 5' CCGCTCGAGTTATTCCTCGGCCTCGTA 3'
dr0013F 5' GGAATTCCATATGATGACGGACCACGCGGGC 3'
dr0013R 5' CCGCTCGAGCTAGATTTTTTCGACACGTTGCA 3'
drA0001F 5' GGAATTCCATATG ATGGTGAGCGCTGTGA 3'
drA0001R 5’ CCGCTCGAGTCATGCGTTTTCCCCCGGA 3'
segS1F 5’ CCACATGTCAACCGCTGTTCGCCGCT 3’
segS1R 5’ CGTACGACCTGGTTCCAACGAAGCGCGCGAA 3’
segS2F 5’ CCACATGTCTTATGCTCGCCCGCTGA 3’
segS2R 5’ CGTACGACCTGGTCCCCGTTTTCATTTGTCA 3’
segS3F 5‘ CCACATGTAGAACCAGCCCGACTGGA 3’
segS3R 5’ CGTACGACCTGGTACAGGATGCACTCGTAACT 3’
parB1 GF 5' CG GGATCCGTGTCGAAAAAATCTAGCCT 3'
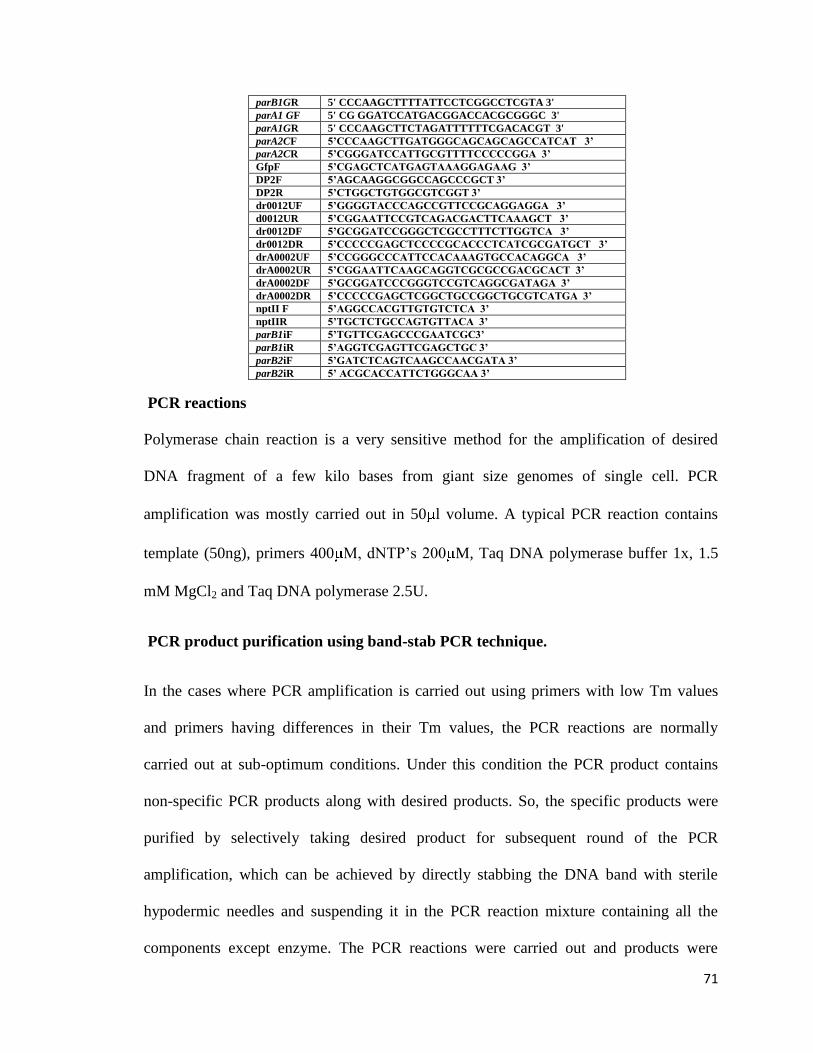
71
parB1GR 5' CCCAAGCTTTTATTCCTCGGCCTCGTA 3'
parA1 GF 5' CG GGATCCATGACGGACCACGCGGGC 3'
parA1GR 5' CCCAAGCTTCTAGATTTTTTCGACACGT 3'
parA2CF 5’CCCAAGCTTGATGGGCAGCAGCAGCCATCAT 3’
parA2CR 5’CGGGATCCATTGCGTTTTCCCCCGGA 3’
GfpF 5’CGAGCTCATGAGTAAAGGAGAAG 3’
DP2F 5’AGCAAGGCGGCCAGCCCGCT 3’
DP2R 5’CTGGCTGTGGCGTCGGT 3’
dr0012UF 5’GGGGTACCCAGCCGTTCCGCAGGAGGA 3’
d0012UR 5’CGGAATTCCGTCAGACGACTTCAAAGCT 3’
dr0012DF 5’GCGGATCCGGGCTCGCCTTTCTTGGTCA 3’
dr0012DR 5’CCCCCGAGCTCCCCGCACCCTCATCGCGATGCT 3’
drA0002UF 5’CCGGGCCCATTCCACAAAGTGCCACAGGCA 3’
drA0002UR 5’CGGAATTCAAGCAGGTCGCGCCGACGCACT 3’
drA0002DF 5’GCGGATCCCGGGTCCGTCAGGCGATAGA 3’
drA0002DR 5’CCCCCGAGCTCGGCTGCCGGCTGCGTCATGA 3’
nptII F 5’AGGCCACGTTGTGTCTCA 3’
nptIIR 5’TGCTCTGCCAGTGTTACA 3’
parB1iF 5’TGTTCGAGCCCGAATCGC3’
parB1iR 5’AGGTCGAGTTCGAGCTGC 3’
parB2iF 5’GATCTCAGTCAAGCCAACGATA 3’
parB2iR 5’ ACGCACCATTCTGGGCAA 3’
PCR reactions
Polymerase chain reaction is a very sensitive method for the amplification of desired
DNA fragment of a few kilo bases from giant size genomes of single cell. PCR
amplification was mostly carried out in 50 l volume. A typical PCR reaction contains
template (50ng), primers 400 M, dNTP‟s 200 M, Taq DNA polymerase buffer 1x, 1.5
mM MgCl2 and Taq DNA polymerase 2.5U.
PCR product purification using band-stab PCR technique.
In the cases where PCR amplification is carried out using primers with low Tm values
and primers having differences in their Tm values, the PCR reactions are normally
carried out at sub-optimum conditions. Under this condition the PCR product contains
non-specific PCR products along with desired products. So, the specific products were
purified by selectively taking desired product for subsequent round of the PCR
amplification, which can be achieved by directly stabbing the DNA band with sterile
hypodermic needles and suspending it in the PCR reaction mixture containing all the
components except enzyme. The PCR reactions were carried out and products were

72
analyzed on agarose gel. This technique gives reasonably pure product for sequencing
purpose. However, the presence of the PCR components makes this product non-suitable
for ligation and cloning purpose unless they are removed by purification techniques.
PCR product purification using agarose gel electrophoresis.
PCR products were separated on molecular biology grade high melting point (HMP)
agarose and also low melting point (LMP) agarose. After electrophoresis is complete, the
DNA was visualized with handset UV lamp in long wavelength and desired DNA band
was cut with sterile blade. DNA extraction from HMP agarose gel pieces was carried out
either by commercially available gel extraction kits using manufacturer‟s protocols. The
frozen gel pieces were spun at 12K for 10min and supernatant was transferred in a
separate 1.5 ml tubes. The DNA was extracted with equal volume of phenol: CHCl3: IAA
(25:24:1) till white precipitate stops coming and finally precipitated with salt and ethanol.
Gel extraction kits were also used from QIAGEN, Roche Biochemicals, Sigma
Chemicals Company and the respective kits protocols were used in this study.
2.3.2.6 DNA manipulation.
Restriction digestion.
The protocols followed for restriction digestion with a particular enzyme were largely as
described by manufacturers. The restriction digestion of DNA was carried out in presence
of the specific buffers and minimum amount of enzymes required for the digestion of that
DNA preparation. The ratio of enzyme to DNA was kept less than 10 and the
concentration of glycerol in reaction mixture was maintained less than 10% in overall
reaction. Restriction digestion of mini prep plasmid DNA has been normally carried out
73
by diluting plasmid DNA volume to ten fold in final reaction mixture. Restriction
digestion has been mostly carried in 50-100 l. After every digestion reaction, the
samples were analyzed on agarose gel to make sure of enzyme activity.
Preparation of plasmid vector for ligation
In cloning experiment, the phosphodiester bond formation could be either intermolecular
or intra molecular. Intra molecular ligation between plasmid vector molecules results in
increasing the background of the ligation reaction. The intermolecular ligation between
vector and inserts would lead to the cloning of the insert in the vector. The later could be
achieved if intra molecular ligation can be avoided and that can be done if vector is
dephosphorylated specifically for blunt end cloning.
Different vectors used in this study
Different plasmids used in this study are summarized in Table 2.5.The partial maps of
plasmid vectors used in this study are given in Table 2.5. The plasmids were prepared by
using plasmid minikit (Roche Biochemicals) and digested with respective enzymes. The
linearized plasmid DNA was gel purified and used for subsequent studies.
Dephosphorylation of DNA.
The vector plasmid DNA is digested with appropriate restriction enzyme and linearized
vector DNA was gel purified and used for dephosphorylation using standard protocols for
alkaline phosphatase activity. In brief 1 g vector DNA was incubated with 10U of Calf
Intestinal Phosphatase (CIP) in 20 l reaction volume in presence of CIP Buffer (Roche
Biochemicals) and incubated at 37oC for 30 min. The reaction was stopped by heating the

74
mixture at 65oC for 15min. The dephosphorylated vector was further purified with
phenol: CHCl3: IAA and followed by DNA precipitation by using ethanol, washed, air
dried and dissolved in 10 l sterile water. 1.0 l 0f DNA sample was analyzed on agarose
gel and 100 ng of it was used for one cohesive end ligation reaction.
Table 2.5 List of plasmids used in this study
Sr
No.
Name of the
plasmid
Characteristics Source
1 pET28+a Novagen
2 pET0012 pET28 with parB1 at NdeI and XhoI This study
3 pET0013 pET28 with parA1 at NdeI and XhoI This study
4 pETA2 pET28 with parA2 at NdeI and XhoI This study
5 pAMCYAN Apr; amCyan expression vector, ColE1 Clontech
6 pA2CFP pAM CYAN with parA2 at Hind III and BamH I This study
7 pLAU85 pBAD24 encoding LacI-ECFP and FtsZ-EYFP; Ampr Lau,2003
8 pDSW209 PDSW209-gfp-MCS (fusion vector) Weiss, 1999
9 pDSWparA1B1 pDSW209 with parA1parB1 at BamH I and Hind III This study
10 pHJ 0012 pDSW209 with parB1 at BamH I and Hind III This study
11 pHJ 0013 pDSW209 with parA1 at BamH I and Hind III This study
12 p11559
Expression vector; Pspac PtufA::lacI Spcr in E. coli and
in D. radiodurans Lecointe,et.al 2004
13 pVH11559 p11559 with 42 bp fragement at NdeI and XhoI This study
14 pD12GFP pVH11559 with gfp parB1 at sacI and XhoI This study
15 p11559A2 p11559 with parA2 at NdeI and XhoI This study
16
Mini-F plasmid
(pDAG203) Mini-F ∆(sopOPABC) cat+ (6.67 kb) Dubbary,et.al 2005
17 pDAGS1 pDAG203 with segS1 at SexAI This study
18 pDAGS2 pDAG203 with segS2 at SexAI This study
19 pDAGS3 pDAG203 with segS3 at SexAI This study
20 pNOKOUT pBluescript SK+ with 900 bp nptII cassate at smaI Khainair, et.al 2008
21 pNOK0012
pNOKOUT with 1Kb parB1 upstream and down stream
at ApaI/EcoRI and BamHI /SacI This study
22 pNOKA0002
pNOKOUT with 1Kb parB2 upstream and parB2 down
stream at ApaI/EcoRI and BamHI /SacI This study
End flushing of PCR amplified products

75
The PCR products used for blunt end ligation were end filled using T4 DNA polymerase.
To suppress exonuclease activity the relatively higher concentration of dNTP‟s were used
as suggested in supplier protocols. A typical reaction mixture contains DNA, 1 g; T4
DNA polymerase buffer, 1x (New England Biolabs, USA), T4 DNA polymerase enzyme
10U in a total reaction volume 20 l. The mixture was incubated at 370C for 30 min and
reaction was stopped by heating at 650C for 15 min. Products were purified by using PCR
purification kit (Roche).
Ligation
For sticky end ligation, normally the insert to vector molar ratios were set to 2:1 to 3:1.
The amount of the insert is fixed to around 100ng and then vector amount was adjusted to
a particular ratio, according to the size of the vector. For the blunt end ligation reaction,
the amount of the insert was increased to 500 ng and then amount of vector was adjusted
to meet the molar ratio of inserts to vector of 3:1 or 4:1. The required amount of the
vector and inserts were mixed in one tube and precipitated with salt and ethanol. The
precipitated DNA pellet was washed twice with 70% ethanol and once with 100 %
ethanol. The air dried DNA pellet was dissolved in minimum volume of sterile water.
The mixture was heated at 55oC for 5 min and chilled quickly on ice. The ligation
conditions for sticky end ligation and blunt end ligation are different. The blunt end
ligation is carried out at 20oC for overnight. On contrary, cohesive ends ligation requires
1mM ATP at 16oC for overnight. However, excess ATP inhibits ligation reaction. The
amount of ligase enzyme required for blunt end ligation is also 5-6 times more as
compared to cohesive end ligation.

76
2.3.2.7 Bacterial transformation
Escherichia coli
Competent cells were prepared using the standard protocol. In brief, the overnight grown
culture of desired E. coli strain was diluted to 100 fold in fresh LB medium. The culture
was allowed to grow at 37oC till O.D600 reaches to 0.3 to 0.4 and thereafter the cells were
chilled on ice for 30 min. The culture was transferred to pre-chilled SS34 tubes and
centrifuged at 6,000 rpm for 5 min at 4oC. The pellet was gently suspended and ½ culture
volume of 100mM CaCl2 was added and this cell suspension was incubated on ice for 45
min. Thereafter it was centrifuged at 4,000 rpm for 10 min and competent cells were
gently resuspended in 0.1 culture volume of 100mM CaCl2, they were used for
transformation. These competent cells can be stored on ice till 16 hr and at –70oC in 20 %
glycerol for one month without much loss of competence.
The 200 l of the competent cells were aliquoted in 1.5 ml pre-chilled tubes and to it
approximately 100ng of the plasmid DNA was added and gently mixed by tapping. The
mixture was incubated on ice for 30 to 45 min and heat shocked at 42oC for 2 min
followed by 2 min on ice incubation. The transformation mixture was diluted with 800 l
of 1x LB broth. For the expression of antibiotic resistance genes, the mixture was
incubated at 37oC for 30 min to 45 min. The transformation mixture was plated on LB
agar plates containing appropriate antibiotics. The plates were incubated at 37oC for
overnight and transformants were scored and characterized.
D. radiodurans

77
The competent of D. radiodurans cells were made by freshly inoculating overnight
grown culture into plain TYG media (1/50 dilutions) and allowed to grow at 32oC till
O.D reaches to 0.3 O.D, 1M CaCl2 was added (final concentration should be 30mM).
Culture was grown until O.D reaches 0.6 (i.e. approximately 90 minutes), then culture
was transferred on to ice and incubated for 30 minutes. To 200 µl of culture nearly 1µg of
DNA was added and allowed to incubate on ice for 10 minutes. Fresh media was added
and culture was incubated at 32°C for 1 h. From the incubated culture 500 µl of culture
was diluted to 5 ml fresh TYG media and remaining 500µl of culture was spinned down
and plated on respective antibiotic plates (Smith et al., 1989).
2.3.2.8 Methods used in proteins purification
Inducible expression of genes in E. coli
E. coli strain BL21 DE(3) pLysS harboring different pET 28a+ containing „par‟ genes
was grown overnight in the presence of kanamycin (25 g/ml). The cells were diluted in
fresh LB medium containing antibiotics and allowed to grow for 3-4 h to get density 0.3
O.D 600nm and then 2% ethanol was added to the culture allowed to it grow till O.D
reaches 0.6, to this culture 0.2 mM of IPTG was added and growth was continued for a
period of 5h. A small aliquot (200 l) was drawn for checking for the inducible synthesis
of „Par‟ proteins and remaining cells were harvested, washed and preserved at –70oC for
downstream processing. For protein analysis the cells were collected and suspended in
50 l TE buffer. To it 50 l of 2x laemmellie SDS gel buffer was added and mixture was
heated at 95oC for 10min and spun at 10,000 rpm for 10min. The supernatant was loaded
on SDS-PAGE and electrophoresis was carried out. Gel was stained for checking if
78
protein was induced. Having made sure that „Par‟ proteins was produced in good
quantity, the remaining cell pellet was processed for large scale purification (Desai et al.,
2011;Kamble and Misra, 2010).
SDS-PAGE analysis of proteins
On PAGE proteins migrate according to mass / charge ratio and structural topology of
that species. However, if charge is unified then these proteins will migrate on the basis of
their masses and that would help in determining their molecular weights. Sodium dodecyl
sulfate (SDS) is an ionic detergent which denatures proteins by „wrapping around‟ the
polypeptide backbone. SDS binds fairly specifically in a mass ratio of 1.4:1 and confers a
negative charge to the polypeptide. Individual polypeptide chains form a complex with
negatively charged molecules of sodium dodecyl sulfate and therefore migrate as a
negatively charged SDS-protein complex through the pores of polyacrylamide gel. In
denaturing SDS-PAGE therefore, migration is determined not by intrinsic electrical
charge of the polypeptide, but by molecular weight.
Preparation of SDS-PAGE gel
SDS-PAGE gel was prepared in two different ways. (i) Ordinary SDS-PAGE having the
single concentration of the gel (Table 2.5)and (ii) gradient SDS-PAGE from 14-18 %
acrylamide concentrations (Table 2.6). The ordinary gel with uniform 10 % Acrylamide
concentration was made as below.
Table 2.6 Composition of 10 % separating polyacrylamide gel
Acrylamide (30%) 5.3 ml
1.5M Tris-HCl, pH-8.8 5.0 ml

79
10 %SDS 200 l
10 % ammonium per sulfate 200 l
TEMED 20 l
Water 3.4 ml
Total volume 20 ml
Composition of 5% stacking gel
Acrylamide (30%) 0.83ml
1.0 M Tris-HCl, pH 6.8 0.63ml
10 % SDS 50 l
10 % ammonium per sulfate 50 l
TEMED 15 l
Water 3.4 ml
Total volume 5.0 ml
For making gradient PAGE gel, the components for 7 % and 18 % solution were mixed
separately as per following compositions.
Table 2.7 Gradient gel compositions
14% 18%
Distilled water 7.7 ml 5.4 ml
Acrylamide (40%) 7.0 ml 9.0 ml
Tris-HCl, pH 8.8 (1.5M) 5.6 ml 5.4 ml
SDS (10%) 0.2ml 0.2 ml
Ammonium per sulfate (10%) 0.08 ml 0.06 ml
TEMED (100%) 0.01 ml 0.01ml
Total volume 20ml 20 ml
Procedure of gel pouring
Glass plates were cleaned with liquid soap, rinsed with water and wiped with 70%
ethanol. The plate sandwich made with 1.0 or 1.5 mm spacers and assembled with gel
80
casting stand. Plates were tightened with clamps and make sure that the screws are
properly fitted. Gaps were sealed with agar and SDS-PAGE mixture for separating gel
was poured. It was over layered with water-saturated n-butanol. After 20-30 min when
gel is polymerized, the butanol was removed and washed with water. Stacking mixture
was poured and comb was fitted in the gel. Once the stacking gel is polymerized, the
comb is removed and wells were cleaned with water 3-4 times and then samples were
loaded. The samples were prepared by heating equal volume of sample and 2x SDS gel
loading dye at 950C. The denatured samples were spun at 12 k for 10 min and clear
supernatant was loaded in the gel. The electrophoresis tank was filled with
electrophoresis buffer (10% SDS-Tris-Glycine, pH 8.8) and gel was run for 1 h at 100
volts and then at 200 volts for 3h. Gel assembly was dismantled. The gel was taken out in
plastic container and stained with different dye depending upon requirement.
Coomassie Brilliant blue staining
Coomassie blue dye binds with the basic amino acids of the polypeptide. This is an
irreversible method for protein staining. The common procedure used for staining gel by
this method is as below. In brief, the gel was fixed for 10 min in destain solution I (DSI)
(50% methanol + 12.5 % Glacial acetic acid). DS I was discarded and Coomassie strain
solution was added. Staining was continued for 10 min or till bromophenol blue dye
changes color to yellow. The stain was poured back for repeated use and gel was
submerged in destain solution II (DSII) and changed couple of times until the background
become colorless.
Silver staining methods of protein gel
81
Silver staining is a highly sensitive method for the staining of the proteins and nucleic
acids. The staining relies of the affinity of the silver ions for nucleophilic and aromatic
groups. Silver ions are reduced to metallic silver, which under alkaline condition gives
brilliant brown precipitate. This procedure can be used for staining of biomolecules in
PAGE gels and agarose gels. This staining method is extremely sensitive and a protein
band of 1ng can be detected. For staining, wash the gel twice for 30 min each in 10%
acetic acid, 50% methanol and 0.05% formaldehyde solution or once over night with
gentle shaking. Replace the solution with the 50 % ethanol and wash it twice for 20 min
each. After discarding of ethanol, the gel was rinsed with deionized water for 10 sec.
Then add (0.2 gm/L) sodium thiosulphate solution and keep it on shaker for exactly 1
min. Further rinse the gel with deionized water for three times for 20 sec each. The gel
was incubated with silver nitrate (2gms/L) and 0.04 % HCHO for 45 min in dark.
Further, rinse the gel with deionized water three times for 5sec.-10sec each under dark
conditions to wash the extra stain from the gel. Add developer solution [(10 mg/L)
sodium thiosulphate, (0.25 ml/L) 30% HCHO in (60gms/L) of NaCO3] to the gel and
keep it on shaker until the spots develops. Further add [Tris (50 gms / L in acetic acid (25
ml / L)] for 5 min. gel was documented.
Preparation of cell free extract of E. coli
The cell pellet was thawed on ice and 1 gm pellet was suspended in 2 ml lysis buffer A
(20mM Tris-HCl, pH 7.5; 0.1mM EDTA and 1mM DTT). Lysozyme was added to a final
concentration 200 g/ml and incubated on ice for 20 min. To it, Triton X-100 was added
to make a final concentration of 0.1% and sonicated at 4 l and 50% duty cycle, for 3 min
with the 1 min intermittent cooling on ice. Suspension was diluted to two folds and

82
centrifuged at 12,000 rpm (SS34, Sorvall) for 15 min. The clear supernatant was used
native purification and pellet was used for denaturation purification.
Protein estimation
Using different spectrophotometric methods, the presence of proteins in a particular
solution was quantitatively estimated. One method is measuring the absorbance maxima
of proteins at 280 nm could be exploited for detecting the presence of proteins in eluted
fractions. Other method used for the estimation of proteins was dye binding method
(Bradford, 1976) using Bradford dye (BioRad) kit protocols. In brief, 200 l of the 5x dye
solution was mixed with 800 l of total solution containing proteins and buffer. The
content was mixed by vortexing and incubated at RT for 15 min before color
development was monitored spectrophotometrically at 595nm. The OD595 was
compared with a calibrated curve that was made using standard concentration of BSA.
Amount of protein present in the solution was estimated.
Metal affinity purification of recombinant proteins
Immobilized Metal ion affinity Chromatography exploits molecules affinity for chelated
metal ions. The amino acid histidine present in the protein forms complex with transition
metal ions such as Cu+2
, Zn+2
and Fe+3
. Chelating sepharose fast flow with a suitable
immobilized metal ion e.g.; Ni+2
selectively retained the protein with exposed histidine.
Exposed Cysteine and Tryptophan residues may also be involved in the binding to
immobilized metal ion but their contribution to the binding is much lower than the
contribution of exposed histidine residues. The strength of binding is affected by buffer

83
pH and the metal ion selected. The most important factor affecting proteins binding is the
pH; at more alkaline pH binding will most likely via deprotonated amino groups.
Native proteins purification
For affinity purification the proteins were extracted by different methods, such as
sonication of cells pretreated with non-ionic detergent, by using cell lytic express (Sigma
Chemicals Co). The clear supernatant was loaded onto the manually pre packed
columns, in brief Chelating sepharose fast flow charged with NiCl2, and washed,
equilibrated with buffer in which the proteins were suspended. Clear supernatant
solution was loaded on the column and proteins are allowed to bind to it at flow rate of 1
ml/ min. Columns were washed with Ni-NTA wash buffer for native proteins and eluted
as described in Ni-NTA agarose native protein purification protocols of quaigen.
Denaturing condition purification
High levels of expression of recombinant protein led to the formation of insoluble
aggregates in form of inclusion bodies. The recombinant protein was purified using a
standard kit protocol. In brief, the inclusion pellet was solubilized in buffer containing
100mM NaH2PO4, 10mM Tris-Cl and 8M urea, pH8.0. The lysate was centrifuged at
10,000 rpm for 30 min at room temperature to pellet the cellular debris. To the clear
supernatant, Ni-NTA was added and mixed gently by shaking at slow speed on a
magnetic stirrer for 60 min at room temperature. The lysate-resin mixture was carefully
loaded into an empty column. Flow through was collected and stored for SDS PAGE
analysis. Column was washed with 10 column volumes of Buffer C (100mM NaH2PO4,
10mM Tris-Cl, 8M urea, pH 6.3). The protein fractions each of 500μl were eluted with
buffer D (100 mM NaH2PO4, 10 mM Tris-Cl, 8 M Urea, pH-5.9) followed by buffer E

84
(100mM NaH2PO4, 10 mM Tris-Cl, 8 M urea, pH 4.5). The collected fractions as well as
flow through were analyzed by SDS PAGE. Nearly pure fractions were collected.
Refolding of the protein was carried out by serially dialyzing the protein in buffers with
decreasing concentration of urea. protein was resuspended in 20mM Tris , 50mM NaCl ,
0.5 mM EDTA and 1mM DTT, completely refolded protein is repurified using native
purification method as mentioned above, purified fractions were collected, dialysis was
done and stored in storage buffer containing 20mM Tris –HCl, 50mM NaCl, 1mMEDTA
, 30% glycerol.
2.3.2.9 Microscopy
To understand the properties of the bacterial sample which are generated by deletion or
over expression of the protein microscopy was done. In principle the specimen is
illuminated with light of specific wavelength which is absorbed by the flurophores or
proteins and emits higher wavelength light. Exponential growing culture was taken and
live cells were mounted onto a bed of 1 % agarose in water (w/v) for viewing under the
microscope. Images were acquired using a Carl Zeiss Axiovision MRC fluorescence
microscope, the data was analyzed using Axiovision rel 4.8 software, Acquired images
were overlapped using Image J software (Donovan et al., 2010).
2.3.2.10 Statistical Analyses
Statistical analyses were performed using the software Graph pad prism 5.0 software.

85
RESULTS

86
Identification of genome partitioning
elements using bioinformatic
approaches.
87
Recent methodological advances have resulted to a rapid progress in understanding the
mechanisms of the DNA segregation process in prokaryotes. It was suggested that
prokaryotic cells contain a mitotic-like apparatus that is responsible for the active
segregation of plasmids and chromosomes prior to cell division. The bacterial plasmids
encode partitioning gene cassettes (termed par) that are required for important events in
the replicon segregation process. After genomic DNA sequencing, homologues of „Par‟
proteins were identified in all „Gram-positive‟ as well as „Gram-negative‟ bacteria. To
certain extent the role of these partitioning genes were understood in organism like B.
subtilis (Hester and Lutkenhaus, 2007;Ireton et al., 1994), S. colicolor (Dedrick et al.,
2009;Jakimowicz et al., 2007), C. crescentus (Shebelut et al., 2010), which contain single
circular chromosome. The bacteria containing multiple genome replicating units were
also identified. The „Par‟ homologues have been found in bacteria like V. cholera (Fogel
and Waldor, 2005), D. radiodurans (White et al., 1999), Burkholderia
(Dubarry et al., 2006) etc. harboring multiple genome replicating units. Genome of D.
radiodurans (Dubarry et al., 2006) is also annotated with „Par‟ like proteins but
centromeric sequences were not identified. Since multiple ParA‟s and ParB‟s are
annotated in the genome, it would be interesting to analyze if these could have different
functional motifs leading to altered specificity and interaction. Therefore, these proteins
were checked for similarities and dissimilarities with their several know homologues in
database and the identification of centromeric sequences in genome of this bacterium
through homology search was carried out.
3.1.1 Methods:

88
Characterization of „Par‟ proteins in D. radiodurans was done by retrieving sequence
from database at NCBI. The sequences obtained were aligned in CLUSTAL-X, an
multiple sequence alignment graphical interface computer programme (Higgins and
Sharp, 1988). Also to improve the alignment, the alignments were superimposed with
theoretically calculated secondary structure data. This was done to ensure that gaps
would be forced in the alignment building process where only loops were present. A
phylogenetic distance tree was built from this alignment using NJ algorithm, a bottom
clustering method for generating phylogenetic trees. For statistical accuracy this
phylogenetic tree was bootstrap for 1000 times i.e. bootstrapping is a method to measure
variance of sample from desired population. Additionally, the FASTA formatted
sequence (protein sequence alignment programme) for each individual „Par‟ protein
sequence under study was submitted to an internet protein structure function prediction
server ( I-TASSER) website for obtaining the homology three dimensional model of the
individual protein (Roy et al., 2010). Since our aim was limited to studying conservation
at fold level, we did not energy minimize the structures. Similarly centromere like
sequence of plasmid and chromosome of D. radiodurans were annotated using a DNA
sequence alignment programme i.e. Blast- N (Basic Local Alignment Search Tool)
analysis by adjusting search parameter to small oligonucleotide for chromosomal type of
centromere sequences.
3.1.2 Results:
3.1.2.1 Identification of centromere like sequences in D. radiodurans:
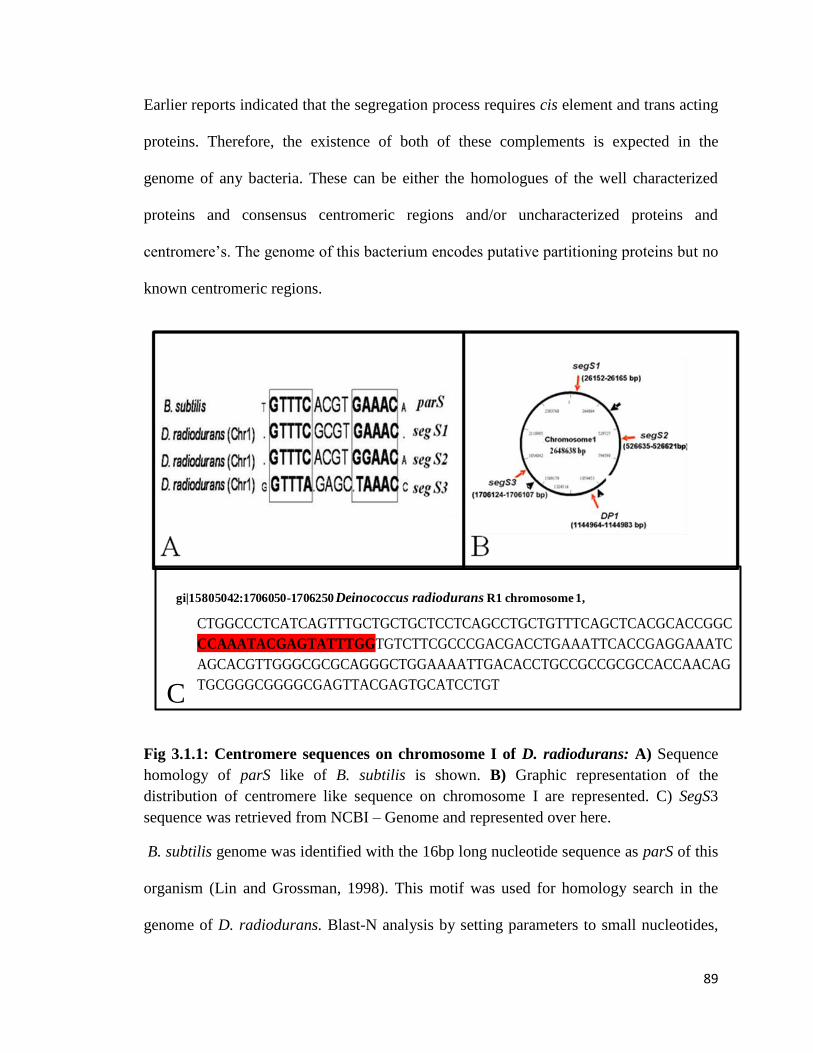
89
Earlier reports indicated that the segregation process requires cis element and trans acting
proteins. Therefore, the existence of both of these complements is expected in the
genome of any bacteria. These can be either the homologues of the well characterized
proteins and consensus centromeric regions and/or uncharacterized proteins and
centromere‟s. The genome of this bacterium encodes putative partitioning proteins but no
known centromeric regions.
CTGGCCCTCATCAGTTTGCTGCTGCTCCTCAGCCTGCTGTTTCAGCTCACGCACCGGC
CCAAATACGAGTATTTGGTGTCTTCGCCCGACGACCTGAAATTCACCGAGGAAATC
AGCACGTTGGGCGCGCAGGGCTGGAAAATTGACACCTGCCGCCGCGCCACCAACAG
TGCGGGCGGGGCGAGTTACGAGTGCATCCTGT
gi|15805042:1706050-1706250 Deinococcus radiodurans R1 chromosome 1,
C
Fig 3.1.1: Centromere sequences on chromosome I of D. radiodurans: A) Sequence
homology of parS like of B. subtilis is shown. B) Graphic representation of the
distribution of centromere like sequence on chromosome I are represented. C) SegS3
sequence was retrieved from NCBI – Genome and represented over here.
B. subtilis genome was identified with the 16bp long nucleotide sequence as parS of this
organism (Lin and Grossman, 1998). This motif was used for homology search in the
genome of D. radiodurans. Blast-N analysis by setting parameters to small nucleotides,

90
showed few identical centromere like sequences present on the chromosome I (Fig
3.1.1A) which are distributed at different locations in chromosome I of D. radiodurans
(Fig 3.1.1B). These sequences were termed as putative centromeres involved in
segregation and accordingly named as segS elements. Due the minor differences at
nucleotide levels, these were separately named as segS1, segS2 and segS3. Chromosome
II and megaplasmid doesn‟t show Bacillus type parS sequences.
Subsequently, the genome of D. radiodurans was searched for P1 plasmid type
centromeric sequence (P1 parS) (Martin et al., 1991). Our analysis identified few
aberrant homologues of P1 parS on chromosome(S) and megaplasmid in D. radiodurans
and these sequences were named as DP1 (P1 parS of chromosome I of D. radiodurans),
DP2 (P1 parS of chromosome II of D. radiodurans) and MP1 (P1 parS of mega plasmid
of D. radiodurans) (Fig 3.1.2). Typically, the hexameric and heptameric repeat boxes
were named as box A and box B (A1 B1 A2 A3 A4 B2) and are arranged in a specific
orientation in P1 parS. The IHF binding site is located between box A1 and boxA2.
Indispensability of the arrangements of boxes and IHF binding site in segregation of P1
type plasmid has been demonstrated. The sequences identified on chromosome I,
chromosome II and mega plasmid were lacking IHF binding site and these boxes were
not organized in order that is reported in P1 type parS element. DP1 showed A1 and B1
boxes with single point mutation in right hand side of P1 parS and left hand side only box
A2 is present and A3 and A4 boxes were absent, more over box B2 has also shown a
partial match. In DP2 showed high sequence homology in left hand side i.e. A2 and B2
boxes where as few mismatches in the right hand B1 and A1 boxes. MP1 showing
presence of few A1 and B2 boxes but the orientation is different as compared to P1 parS.

91
parS (P1)
AACTTTCGCCAATCAAAATTTCACTATTAACTGACTGTTTTTAAAGTAAAT
TACTCTAAAATTTCAAGGTGAAATCGCCACGATTTCACCTTTGG
DP1
GGTCCCCAGAGGATTTCCCCACAAAATTTCACTGTAGAGCCACGCCAG
DP2
xxxxxTCTCCCACCAGTGGAGAGGGTCAAAGACAGGCAATATTTTTCCTTGA
AATTTTCTAGAGTGCCCCAGCAATCGCCCGACCCGCTGCC
MP1
CATGCTGATCACGCCGAACCGGGCGAAATTGAGTTCGTCATGAAAATTGTTGGGCTTGGGTTT
CTTGGGCATCTCTTCTTCCTGAGGTGTTGTTGTTTTTAAATACTTAAAAGATATAAAAGAACAACAACAA
GGACGGCTTCTCTCGTCGTGCTGGACGAACATTTTCGACTTTTTC
BOX A1 BOX B1
BOX B2 BOX A2
IHF binding site
BOX B1 BOX A1 BOX A2 BOX B2
BOX B1 BOX A1
BOX A2 BOX B2
BOX B1
BOX B1 R BOX A1
Fig 3.1.2: Analysis of P1 type of centromere like sequence in D. radiodurans:
Representation of hexameric (BoxB1, BoxB2) and heptameric sequence (BoxA1,
BoxA2) and both left, right hand side of P1 parS element.
Overall our analyses indicated that DP1, DP2 and MP1 are showing partial similarity but
lacking typical IHF binding sites within the sequence. Earlier fine structural analysis of
P1 parS had shown that deletion or modification of hexameric or heptameric sequence
hampered the segregation of the plasmid or changed the species specificity in different
bacteria (Martin et al., 1991). Hence the functionality of these aberrant P1 type
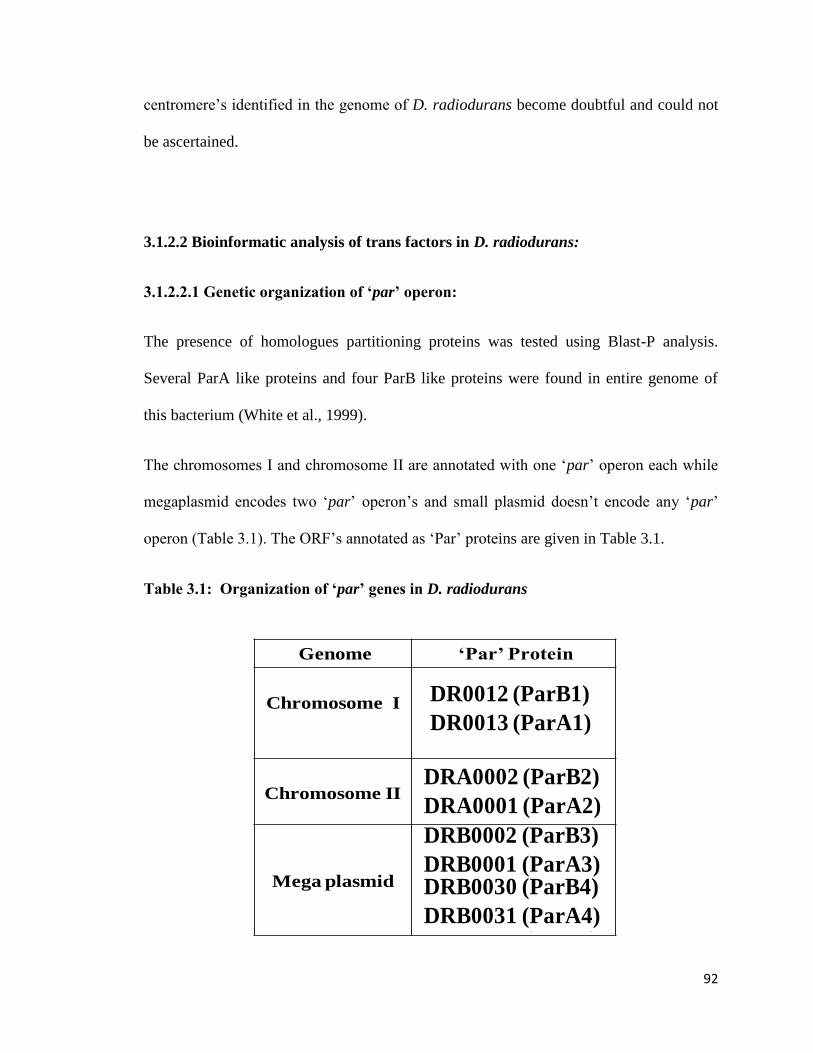
92
centromere‟s identified in the genome of D. radiodurans become doubtful and could not
be ascertained.
3.1.2.2 Bioinformatic analysis of trans factors in D. radiodurans:
3.1.2.2.1 Genetic organization of ‘par’ operon:
The presence of homologues partitioning proteins was tested using Blast-P analysis.
Several ParA like proteins and four ParB like proteins were found in entire genome of
this bacterium (White et al., 1999).
The chromosomes I and chromosome II are annotated with one „par‟ operon each while
megaplasmid encodes two „par‟ operon‟s and small plasmid doesn‟t encode any „par‟
operon (Table 3.1). The ORF‟s annotated as „Par‟ proteins are given in Table 3.1.
Table 3.1: Organization of ‘par’ genes in D. radiodurans
Genome ‘Par’ Protein
Chromosome I DR_0012(ParB1)
DR_0013(ParA1)
Chromosome II
DR_A0002(ParB2)
DR_A0001(ParA2)
Mega plasmid
DR_B0002(ParB3)
DR_B0001(ParA3)
DR_B0030(ParB4)
DR_B0031(ParA4)
DR0012 (ParB1)
DR0013 (ParA1)
DRA0002 (ParB2)
DRA0001 (ParA2)
DRB0002 (ParB3)
DRB0001 (ParA3)DRB0030 (ParB4)
DRB0031 (ParA4)
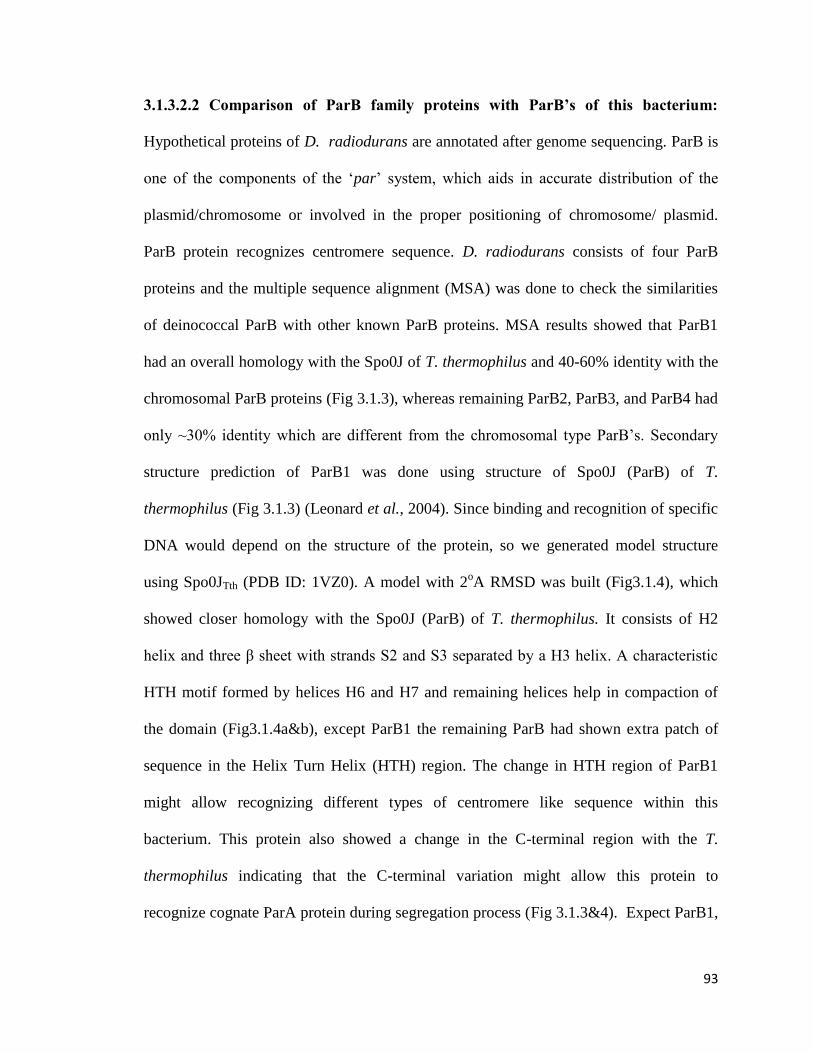
93
3.1.3.2.2 Comparison of ParB family proteins with ParB’s of this bacterium:
Hypothetical proteins of D. radiodurans are annotated after genome sequencing. ParB is
one of the components of the „par‟ system, which aids in accurate distribution of the
plasmid/chromosome or involved in the proper positioning of chromosome/ plasmid.
ParB protein recognizes centromere sequence. D. radiodurans consists of four ParB
proteins and the multiple sequence alignment (MSA) was done to check the similarities
of deinococcal ParB with other known ParB proteins. MSA results showed that ParB1
had an overall homology with the Spo0J of T. thermophilus and 40-60% identity with the
chromosomal ParB proteins (Fig 3.1.3), whereas remaining ParB2, ParB3, and ParB4 had
only ~30% identity which are different from the chromosomal type ParB‟s. Secondary
structure prediction of ParB1 was done using structure of Spo0J (ParB) of T.
thermophilus (Fig 3.1.3) (Leonard et al., 2004). Since binding and recognition of specific
DNA would depend on the structure of the protein, so we generated model structure
using Spo0JTth (PDB ID: 1VZ0). A model with 2oA RMSD was built (Fig3.1.4), which
showed closer homology with the Spo0J (ParB) of T. thermophilus. It consists of H2
helix and three β sheet with strands S2 and S3 separated by a H3 helix. A characteristic
HTH motif formed by helices H6 and H7 and remaining helices help in compaction of
the domain (Fig3.1.4a&b), except ParB1 the remaining ParB had shown extra patch of
sequence in the Helix Turn Helix (HTH) region. The change in HTH region of ParB1
might allow recognizing different types of centromere like sequence within this
bacterium. This protein also showed a change in the C-terminal region with the T.
thermophilus indicating that the C-terminal variation might allow this protein to
recognize cognate ParA protein during segregation process (Fig 3.1.3&4). Expect ParB1,
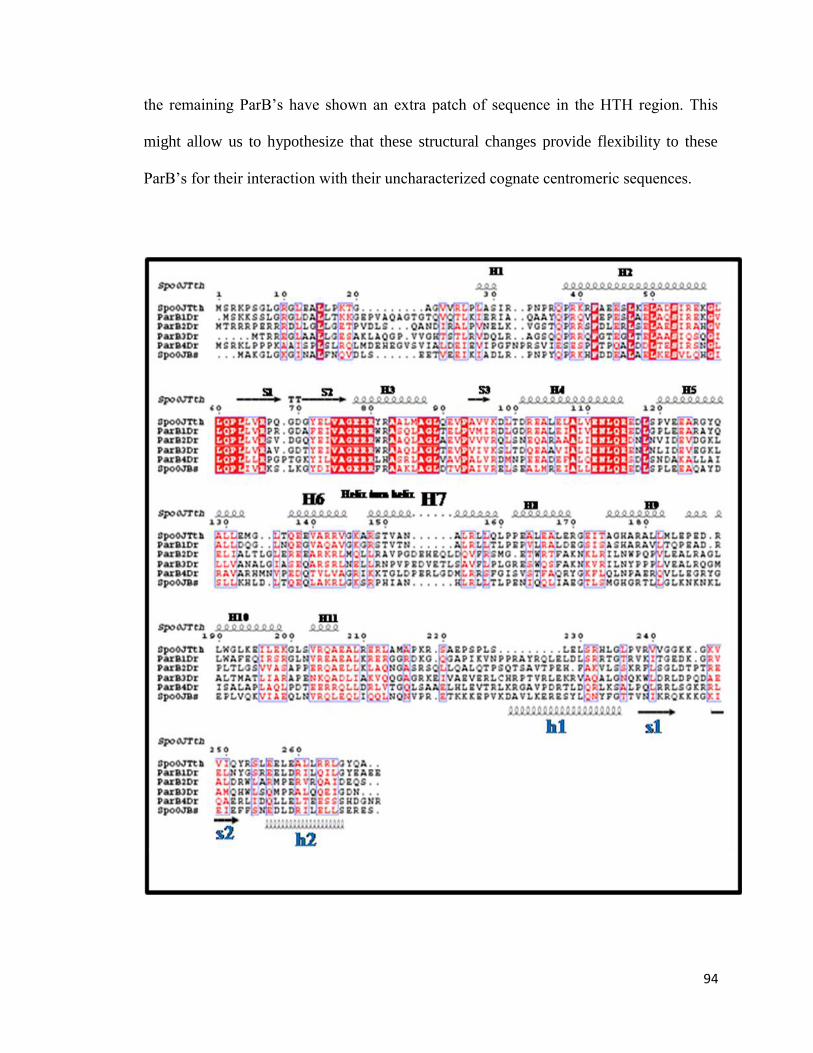
94
the remaining ParB‟s have shown an extra patch of sequence in the HTH region. This
might allow us to hypothesize that these structural changes provide flexibility to these
ParB‟s for their interaction with their uncharacterized cognate centromeric sequences.

95
Fig 3.1.3 Multiple alignment of ParB protein with chromosomal ParB: Sequence of
different ParB protein is retrieved from NCBI, homology between sequences is checked
by Clustal-X analysis. Boundaries of the secondary structure were defined by using
online Espript program. The secondary structure shown in this figure corresponds to
those of domain of Spo0J of T. thermophilus (PDB.ID: 1VZ0). Secondary structure of C-
terminal region was analyzed by using Psipred (Protein structure predication) online
software and represented in ESPript (Easy Sequencing in post script) online software
which renders sequence similarity and secondary structure information.
Fig3.1.4: 3-D model of ParB1 of D. radiodurans: A) the 3-D model of ParB1 with its
homologue Spo0JTth. i) The homology model of ParB1, the Helix turn Helix core domain

96
in green and extra N-terminal (light green) and C-terminal (light pink) with respect to the
1VZ0 model are highlighted. ii) The template Spo0JTth molecule (1VZO). B) Wire
diagram of overlapped Helix turn Helix region of ParB1 and Spo0J.
3.1.3.2.3 Comparative analysis of ParA family proteins with ParA’s of this
bacterium:
ParA belongs to the P-loop NTPase family proteins (Leipe et al., 2002). The 10 – 18% of
total gene products of bacteria belonging to this family (Aravind et al., 2000) are sub
grouped into seven subfamilies. Both structural and sequences similarities allowed
placing ParA / Soj in a group within nifH / MipZ family. After genomic DNA sequencing
of D. radiodurans nearly 120 genes were annotated as P-loop NTPase. Amongst these,
the four ParA proteins are located near origin of replication and co-transcribed with parB
gene. Different ParA proteins sequence is retrieved from NCBI database and similarities
between ParA proteins of D. radiodurans and other well characterized ParA proteins
were checked to find out the closeness of ParA‟s of D. radiodurans with other know
similar proteins. Clustal-W analysis revealed that ParA1 has close similarity with the T.
thermophilus Soj protein. Both ParA1 and ParA4 showed the extended N-terminal region
(Fig 3.1.6). ParA2/A3/A4 showed near about 30% similarity with the known
chromosomal ParA proteins at amino acid levels while only at motif level with plasmid
encoded ParA proteins (Fig 3.1.5).
14 KGGVGKT 2057 KGGVGKT 6313 AGGAGKT 1910 AGGAGKT 16
127 SGGEGKT 134
37 VLLVD 4479 VLLVD 8436 VLLVD 4133 VLL ID 38
150 VAVLD155
111 YDLVLLD 118158 YDLVLVD 165118 YDVALID 125 116 KDTVI ID 122239YDV I LLD 246
Soj Tth
ParA1Dr
ParA2Dr
ParA3Dr
ParA4Dr
Walker A motif Walker A’ motif Walker B motif
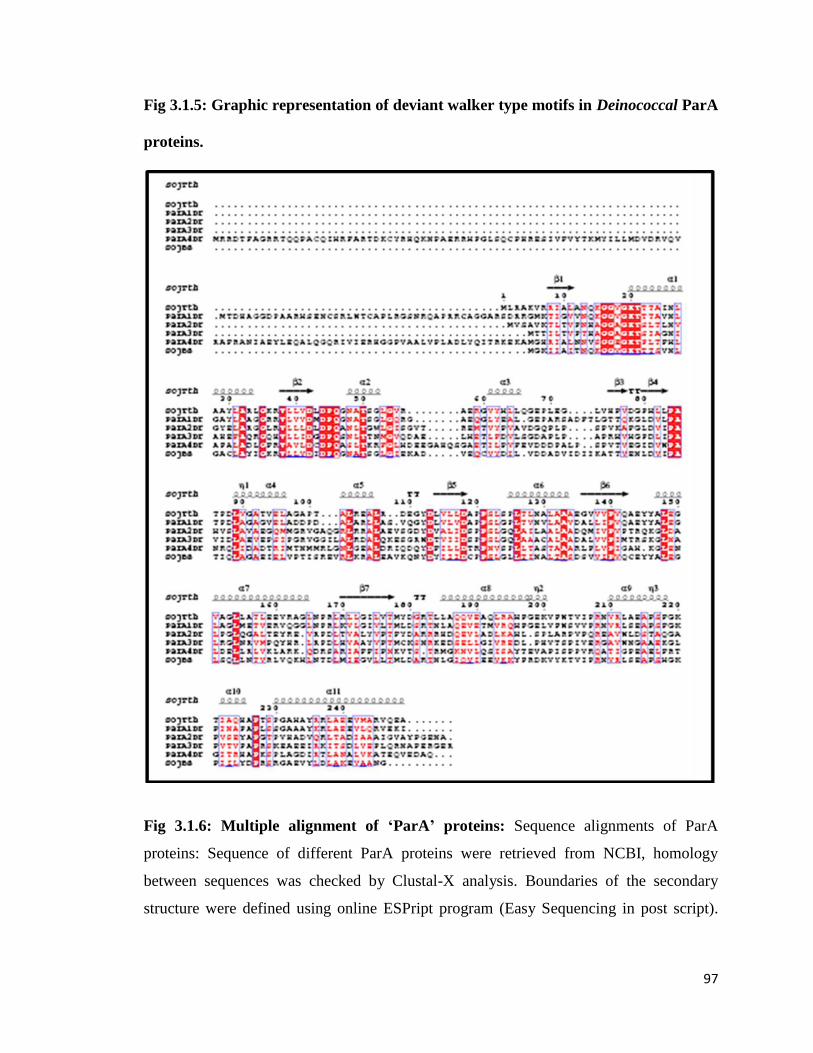
97
Fig 3.1.5: Graphic representation of deviant walker type motifs in Deinococcal ParA
proteins.
Fig 3.1.6: Multiple alignment of ‘ParA’ proteins: Sequence alignments of ParA
proteins: Sequence of different ParA proteins were retrieved from NCBI, homology
between sequences was checked by Clustal-X analysis. Boundaries of the secondary
structure were defined using online ESPript program (Easy Sequencing in post script).
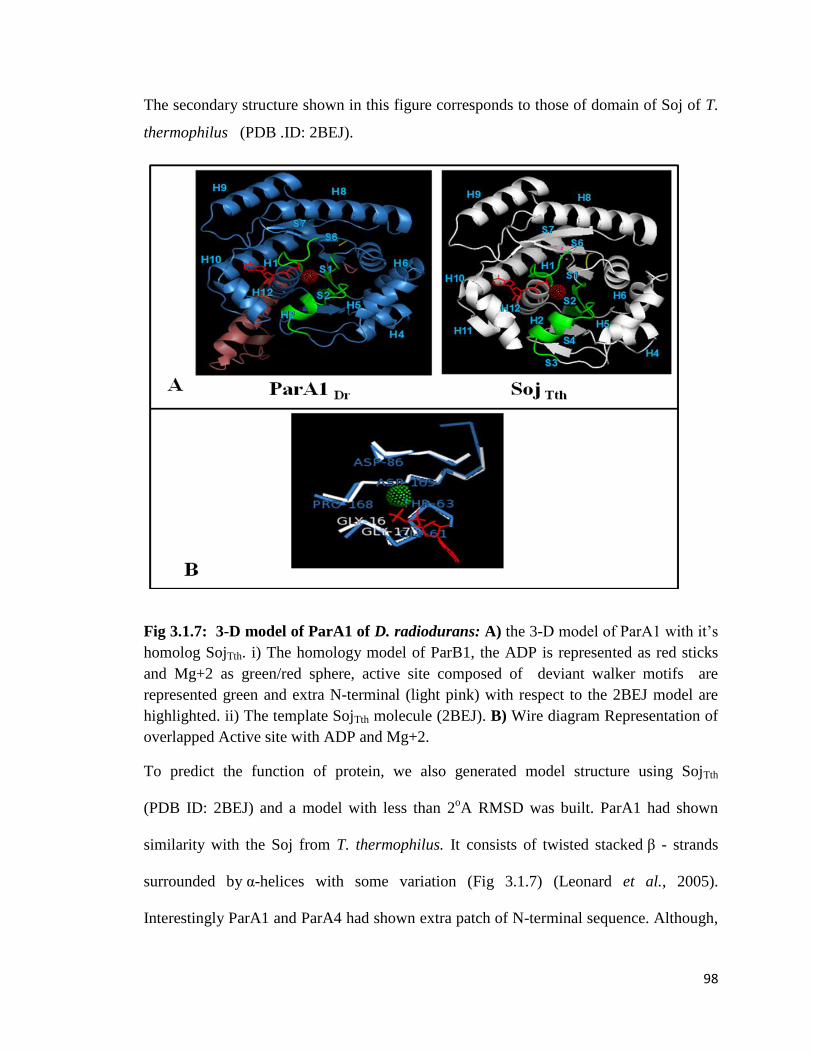
98
The secondary structure shown in this figure corresponds to those of domain of Soj of T.
thermophilus (PDB .ID: 2BEJ).
Fig 3.1.7: 3-D model of ParA1 of D. radiodurans: A) the 3-D model of ParA1 with it‟s
homolog SojTth. i) The homology model of ParB1, the ADP is represented as red sticks
and Mg+2 as green/red sphere, active site composed of deviant walker motifs are
represented green and extra N-terminal (light pink) with respect to the 2BEJ model are
highlighted. ii) The template SojTth molecule (2BEJ). B) Wire diagram Representation of
overlapped Active site with ADP and Mg+2.
To predict the function of protein, we also generated model structure using SojTth
(PDB ID: 2BEJ) and a model with less than 2oA RMSD was built. ParA1 had shown
similarity with the Soj from T. thermophilus. It consists of twisted stacked β - strands
surrounded by α-helices with some variation (Fig 3.1.7) (Leonard et al., 2005).
Interestingly ParA1 and ParA4 had shown extra patch of N-terminal sequence. Although,

99
the functional significance of this extension is not known, this might help in recognizing
its cognate protein (ParB) of this bacterium cannot be ruled out.
3.1.3.2.4 Phylogenetic analysis of ‘Par’ proteins:
Genome sequence analysis showed the presence of „par’ operon on each of the three
genome replicating units in D. radiodurans, except small plasmid. Therefore, the
possibility of these proteins performing identical or nearly identical functions and
offering functional redundancy would be worth investigating. One of the approaches was
to check the similarities and evolutionary relationships. For this, we retrieved the well-
characterized „Par‟ proteins using NCBI database. MSA of these was done with ParA‟s
of this bacterium, using Clustal X2.1 software and further Bootstrap tree was generated.
Results indicated „Par‟ proteins on the accessory chromosome (Chromosome II and
megaplasmid) are diverged from both chromosomal „Par‟ proteins as well from plasmid
„Par‟ proteins (Fig 3.1.8 a, Fig 3.1.8 b). Interestingly, they have evolved separately from
all other ‟Par‟ proteins, including „Par‟ proteins from other closely related species too.
Bacterial genome segregation requires at least three factor (i) a cis element (centromere
like sequence), (ii) ParB (adaptor protein) and (iii) ParA a motor protein. Bacteria
harboring single chromosome had typically shown centromere sequence near the origin
of replication, containing 16bp consensus sequence, which was initially identified in B.
subtilis. Later this consensus sequence was identified in almost all bacteria including that
harbor multiple genome replicating units at least on primary chromosome.

100
Fig 3.1.8 a: Phylogenetic tree of ParB proteins: Phylogenetic relationship of
Deinococcal „ParB‟ protein with other „ParB‟ homologues was generated by using
Clustal –X based on amino acid similarity sequence information was derived from NCBI.
Phylogenetic analysis showed ParB1 showed close homology to chromosomal type ParB
protein. Other Deinococcal ParB‟s are diverged from ParB1. Strains are abbreviations :
Dr, Deinococcus radiodurans; Bs, Bacillus subtilis; Cc, Caulobacter crescentus; Bm,

101
Brucella melitensis; Bc, Burkholderia cenocepacia; Th, Thermus thermophilus;
Ec,Escherichia coli; Pa, Pseudomonas aeruginosa; Pp, Pseudomonas putida; Vc, Vibrio
cholerae; La/Lb, Leptospira interrogans; Rs, Rhodobacter sphaeroides ; Sy,
Synechocystis.
D. radiodurans also showed three such kind of sequence which are observed only on
primary chromosome i.e. chromosome I, P1 type parS homology search showed some
conserved boxes on chromosome I, chromosome II and mega plasmid but these
sequences lack perfect and a conserved ordered organization of the boxes and IHF
binding sites between A1 and A2 boxes. These limitations left a little chance for these
elements acting as centromeres in this bacterium but left a greater uncertainties and an
open question on how secondary genomes are segregated in this bacterium. The
possibility of some other types of cis elements that are involved in segregation of these
genomes cannot be ruled out. Chromosome II and mega plasmid of D. radiodurans
showed a few repetitive sequences upstream to the parA2B2 and parA3B3 operon would
be worth investigating if these are having some roles in genome maintenance. Similarly,
the genome of D. radiodurans encodes putative ParA‟s and four ParB proteins. These
were looked for the functional motifs and structural similarities with known „Par‟
proteins. Interestingly, we observed that „Par‟ proteins are greatly diversified. ParA1 and
ParB1 are closer to chromosomal type „Par‟ proteins while „ParA‟ proteins encoded on
secondary genome like chromosome II and mega plasmid diverge from known P-loop
ATPases and form a separate group.

102
Fig 3.1.8b: Phylogenetic tree of ParA proteins: Phylogenitic relationship of
Deinococcal „ParA‟ protein with other „ParA‟ homologues was generated by using clustal
– X based on amino acid similarity sequence information was derived from NCBI.
Phylogenetic analysis showed ParA1 showed close homology to chromosomal type
ParA‟s. Other Deinococcal ParA‟s are diverged from ParA1. Dr, Deinococcus
radiodurans; Bs, Bacillus subtilis; Cc, Caulobacter crescentus; Bm, Brucella melitensis;
Bc, Burkholderia cenocepacia; Th, Thermus thermophilus; Ec,Escherichia coli; Pa,
Pseudomonas aeruginosa; Pp, Pseudomonas putida; Vc, Vibrio cholerae; La/Lb,
Leptospira interrogans; Rs, Rhodobacter sphaeroides ; Sy, Synechocystis
103
.
We observed that ParB proteins from all the genome replicating elements cluster in same
group and are nearly similar except HTH motifs. However, ParA‟s differ significantly
and ParA of chromosome I cluster with most of the chromosomal type ParAs. ParA‟s of
secondary genomes clustered with other ParA‟s and separately from chromosome I ParA
of this bacterium. These analyses allow us to predict that different „Par‟ proteins in D.
radiodurans might have specific roles in growth and maintenance of this bacterium and
needs to be validated further.
104
Functional characterization
of chromosome I
partitioning system.

105
Recent advances in optical techniques have helped in better understanding of
chromosome segregation in bacteria. Based on real time interaction studies of
centromere‟s and „Par‟ proteins, two major mechanisms of bacterial genome segregation
have been suggested. These are pushing or pulling mechanisms, which paradigmatically
involve three factors like cis element or centromere like sequence and two trans acting
factors like ParB and ParA. Due to polymerization/depolymerization of motor protein
force is generated to move duplicated DNA towards opposite poles within cell. For
example in R1 plasmid, first step is ParR (ParB of R1 plasmid) binds to parC
(centromeric region of R1 plasmid) to form nucleoprotein complex, second step ParM
(ParA of R1 plasmid) filament interacts with the ParR bound plasmid DNA get stabilized
followed by the insertion of ParM (motor protein). The force generated due to ParM
polymerization is utilized for pushing plasmid molecules towards opposite poles. In
addition, genome partitioning systems have been reported in majority of bacterial
chromosomes, partition system in bacteria with single chromosome or multiple
chromosomes comprised of parAB operon and its cognate centromeric sequence (Blasius
et al., 2008;Hazan and Ben-Yehuda, 2006;Surtees and Funnell, 2003). There are few
exceptions where partitioning proteins are not identified in bacteria like E. coli, etc. The
chromosomal segregation shares similarity with the type I plasmid segregation system. In
cases like chromosome I of V. cholerae and C. crescentus it is demonstrated that
chromosome segregation occurs by pulling mechanism (Fogel and Waldor,
2006;Shebelut et al., 2010). It is shown that the levels of its intrinsic ATPase activity
regulate the polymerization/ depolymerization dynamics of ParA. PFGE and genomic
DNA sequence analysis showed that the bacteria from the diverse phylogenetic groups

106
e.g. Agrobacterium tumefaciens, Sinorhizobium meliloti, D. radiodurans, V. cholerae.
etc. have multiple chromosomes.
Bioinformatic analyses of genome partitioning system in D. radiodurans have
predicted (i) the presence of putative centromeres in chromosome I and (ii) that ParB
proteins are different in DNA binding motifs while ParA‟s are greatly diversified. Thus it
appears that chromosome I contains complete set of „par’ elements i.e. ParA1B1 (trans
factors), segS elements (centromere like sequence) and „Par‟ proteins showing close
homology with „Par‟ proteins of T. thermophilus. Therefore, the prediction on presence
of centromeres and functional „Par‟ proteins require functional validation both in vitro
and in vivo and has been carried out in this chapter.
3.2.1 .Materials and methods:
3.2.1.1 Expression of recombinant ParB1 and ParA1 proteins:
The DR0012 (ParB1) and DR0013 (ParA1) ORF‟s were PCR amplified from genomic
DNA using dr0012F and dr0012R primers for dr0012 (parB1) gene and dr0013F and
dr0013R primers for dr0013 (parA1) gene as mentioned in Table 2.4. PCR products were
ligated at NdeI and XhoI sites in pET28a+ to yield pET0012 and pET0013, respectively.
Confirmed by restriction analysis and sequencing, recombinant plasmids were
transformed into E.coli BL21 DE3 pLysS for expression of recombinant ParA1/ParB1
proteins.
3.2.1.2 Purification of recombinant ParA1 /ParB1proteins:

107
His tagged recombinant ParA1 and ParB1 proteins were purified using nickel-affinity
chromatography as described earlier in the materials and methods chapter. In brief, „Par‟
protein expressing cells were lysed in cell lytic express (Sigma Chemical Company,
USA) and inclusion bodies were separated from cytosolic fraction by centrifugation.
Recombinant ParB1 protein was purified under native conditions as described in material
and methods section(Kota et al., 2010). However, majority of ParA1 is present in the
inclusion pellet, these inclusion bodies were dissolved in buffer B (100 mM NaH2P04,
10mM Tris-HCl, pH 8.0 and 8M urea) and purified using Ni-NTA sepharose as described
in manufacturers protocol (QIAgen, Germany). Purified protein to near homogeneity was
refolded by serial dilution of urea with concurrent increase in DTT concentration and
again repurified under native conditions using nickel affinity column buffer
supplemented with 10% glycerol. Finally the fractions showing more than 99% purity
were pooled and dialyzed in a buffer (20mM Tris-HCl, 50 mM NaCl, 1mM DTT, 1mM
EDTA, 1 mM PMSF and 50% glycerol) and stored in small aliquots at -20ºC till further
use. Recombinant proteins were confirmed by mass spectrometric analysis (The Centre
for Genomic Applications, New Delhi).
3.2.1.3 DNA protein interaction studies:
For DNA binding assay of ParB1 protein, the 300bp putative segS1, segS2 and segS3
sequences located on chromosome I, were PCR amplified from genomic DNA of
D. radiodurans using segS1F , segS1R for segS1, segS2F, segS2R for segS2 and segS3F,
segS3R for segS3 (Table 2.4). The amplified PCR products were gel purified and labeled
at 5‟ end using polynucleotide kinase. DNA binding activity was assayed taking different
concentration of purified recombinant ParB1 and ParA1 in 20µl reaction buffer
108
containing 50mM Tris-HCl pH 8.0, 5mM MnCl2, 75mM NaCl, 0.1mM DTT with labeled
substrate at 37oC for 10 min and products were analyzed. For competition assay, ParB1
was incubated with increasing concentration of competitor DNA (250 bp) up to 100 fold
(Das and Misra, 2011).
3.2.1.4 Measurements of ATPase activity:
ATPase activity of recombinant ParA1 was measured with increasing concentration of
purified ParA1 (0.18 µM to 0.92 μM) in a buffer containing 50mM HEPES pH7.6,
50mM KCl, 5mM MgCl2, 30mM Sodium acetate, 100µg/ml BSA & 2mM ATP at 37ºC
for 1h. Release of inorganic phosphate was measured using modified malachite green
protocol (Kota et al., 2010). Effect of DNA (segS elements) on ParA1 ATPase activity
was also measured by incubating 1µm concentration of ParA1 with different
nucleoprotein complexes formed due to pre-incubation of ParB1 (0.3µM) with DNA
(10nM). The reaction was carried in above mentioned buffer at 37oC for 1h. Reaction was
terminated by addition of 1/4th volume of malachite green reagent followed by a further
incubation for 20 min. The release of Pi was measured at 630nm and quantified using
standard procedure essentially described in (Yakunin et al., 2004). The ATPase activity
was calculated as nano moles Pi formed min -1
µg-1
protein.
3.2.1.5 Cloning of segS elements on mini-F plasmid and plasmid stability studies:
The 300 bp of three segS elements were PCR amplified from genomic DNA of
D. radiodurans using segS1F, segS1R for segS1, segS2F, segS2R for segS2 and segS3F,
segS3R for segS3 (Table 2.4). The mini-F plasmid pDAG203 was digested with SexAI
restriction enzyme, digested plasmid is blunted by end filling with Klenow fragment. The

109
segS1, segS2 and segS3 PCR products were ampilied by using pwo Polymerase, cloned in
pDAG203 plasmid and recombinants were confirmed by restriction analysis and
nucleotide sequencing (Lemonnier et al., 2000). The recombinant plasmids were
designated as pDAGS1, pDAGS2, pDAGS3 respectively. Both recombinant plasmids
and pDAG203 vector were separately transformed into E. coli MG1655. In parallel,
pDSWparA1B1 was generated by PCR amplification of the putative parA1-parB1 operon
using parA1GF and parB1GR primers, cloned at BamHI and HindIII sites in pDSW209
vector (Weiss et al., 1999). Clones were confirmed by restriction digestion as well as by
western blotting. Expression of proteins is monitored by measuring amount of proteins
expressed after IPTG induction using GFP specific antibodies. Recombinant proteins
were expressed into E. coli harboring pDAGS3 / pDAG203 plasmids. The stable
inheritance of pDAGS1, pDAGS2, pDAGS3 plasmids were compared with pDAG203 as
control by scoring chloramphenicol resistance in daughter cells as described in (Godfrin-
Estevenon et al., 2002). In brief, these cells were grown in absence of chloramphenicol
(Cm) an antibiotic marker on pDAG203 plasmid, and then cells were selected in presence
of CmR (15µg ml
-1).
3.2.1.6 Determination of plasmid to chromosome ratio:
E. coli cells harboring recombinant plasmids containing segS1/segS2/segS3 (pDAG
derivatives) and pDAG203 vector were grown in LB medium supplemented with
chloramphenicol (15µg ml-1
). Total DNA of 5 clones for each recombinant plasmid was
prepared using protocol as described in material and method section (Sambrook J and
Russell DW, 2001). Ratio of plasmid to total DNA was determined using PCR analysis,
for plasmid specific cat gene and chromosome specific xerC genes were PCR amplified

110
by taking 20ng and 150ng template respectively. Products were analyzed on agarose gel
and the band intensity was estimated densitometrically. Ratio of cat to xerC yield was
estimated and analyzed.
3.2.1.7 Construction of parB1 deletion mutant in D. radiodurans:
The pNOK0012 was constructed to generate parB1 deletion mutant in D. radiodurans.
In brief, the 1kb upstream to DR_0012 ORF was PCR amplified using dr_0012UF and
dr_0012UR primers, similarly 1kb downstream to DR_0012 was PCR amplified using
dr_0012DF and dr_0012DF primers (Table 2.4) and cloned at KpnI-EcoR I and BamHI-
SacI sites in pNOKOUT vector respectively. The recombinant plasmid pNOK0012 was
linearized with XmnI and transformed into D. radiodurans as mentioned in material
method section(Khairnar et al., 2008). Transformants were maintained through several
generations to obtain homozygous replacement of parB1 with nptII cassette, generation
of homozygous mutant was confirmed by PCR amplification of parB1 using internal
primers, parB1iF and parB1iR.
3.2.1.8 Generation of GFP - ParB1 / GFP- ParA1 translation fusion protein:
The parB1, parA1 gene was PCR amplified using parB1GF, parB1GR, parA1GF,
parA1GR primers (Table 2.4) and cloned at compatible sites in pDSW209 to generate N-
terminal translation fusion GFP protein (Weiss et al., 1999) to yield pHJ0012.
Subsequently gfp-parB1 chimera was PCR amplified from pHJ0012 using GfpF and
dr0012R primers (Table 2.4). In parallel the p11559 was modified by sub cloning a 42bp
linker (5‟ CATATGAGATCTAGTAC TGAGCTCGTCGACCTTAAGCTCGAG 3‟) at
its NdeI and XhoI sites generating NdeI, ScaI, SacI, SalI, AflII and XhoI cloning sites

111
downstream to existing promoter and the resultant plasmid was named as pVHS559. PCR
amplified gfp-parB1 chimera was sub-cloned at SacI and XhoI sites of pVHS559 to yield
pD12GFP.
D. radiodurans cells harboring vector and recombinant pD12GFP plasmids were grown
in TYG broth containing spectinomycin (75µg ml-1
) and culture was induced by using
IPTG, for E. coli (500 µM) and for D. radiodurans (10mM). Inducible expression of
GFP-ParB1 chimera on pHJ0012 and pD12GFP plasmids was confirmed in both E. coli
and D. radiodurans respectively, by immunoblotting using antibodies
against GFP (Clontech, Takara, Japan) using protocols as described earlier (Rajpurohit
and Misra, 2010).
3.2.1.9 Microscopic studies:
Culture harboring plasmids which were used for localization studies were induced with
different IPTG concentration as mentioned in the text. Induced culture was stained with
DAPI and fluorescence microscopy of D. radiodurans, its derivatives and E. coli cells
was carried out using Zeiss Axio Imager (Model- LSMS10 META, Carl Zeiss) equipped
with Zeiss AxioCam HRm camera. Both GFP and DAPI fluorescence‟s were imaged.
Micrographs were superimposed for localization of GFP-ParB1 spot on DAPI stained
nucleoid (Donovan et al., 2010;Fiebig et al., 2006;Gordon et al., 2004;Lau et al., 2003;Li
and Austin, 2002).
Similarly, Effect of parB1 deletion on anucleation of the cells was demonstrated by
florescence microscopy. Wild types as well as parB1 mutant cells were grown for
overnight, cells were stained with DAPI and subsequently imaged using fluorescence
112
microscope (Model- AXIOCAM, MRC5, and Carl Zeiss). A large number of cells were
examined from both wild type and parB1 mutant populations for the comparison of
anucleation frequency at different time intervals of growth.
3.2.1.10 Oligomerization studies using sedimentation assay and light scattering:
Sedimentation assay was carried by taking 750ng ParA1 (1µM), 100ng segS elements
(0.25nM), 200ng ParB1 (~0.25µM) in a buffer containing 50mM HEPES pH7.6, 50mM
KCl, 5mM MgCl2, 30mM sodium acetate, 100µg/ml BSA and 1mM ATP, the reaction
was done in different combination as mentioned in the text (Bouet et al., 2007). For
analysis different reaction mixtures incubated at 37oC for 30 mins were centrifuged at
22,000 x g for 30 min at 4oC and the proteins were analyzed on 16% -18% gradient SDS-
PAGE. Protein bands were visualized with silver nitrate and ParA1 band intensity was
quantified by densitometric scanning using Gene Genius Image Quant software
(SynGene, Inc.).
Light scattering was carried out using ~1 µM ParA1 incubated with ~25nM ParB1 and
~5nM of different segS centromeric sequences in 400 µl reaction buffer (50mM HEPES
pH 7.6, 50mM KCl, 5mM MgCl2 100µg/ml BSA and 30mM sodium acetate), in presence
and absence of 1mM ATP as described in text (Bouet et al., 2007). The scattered light
intensity was measured at 90o from 150nm pinhole at 37
oC for 10s with 10 shots at 10
minutes intervals using 25 mW He-Ne laser light source at 630 nm. The data obtained as
kilo counts per second were analyzed using inbuilt software with the machine and data
was represented as fold change in intensity of scattering of light (Hassan et al., 2004).

113
3.2.2.0 Results:
3.2.2.1 ParA1 and ParB1 were expressed in E. coli and purified to homogeneity
Genomic DNA of Deinococcus radiodurans was prepared using standard protocol
(Battista et al., 2001)and the DR0012 (parB1), DR0013(parA1) genes were PCR
amplified and cloned as mentioned in materials and methods section. The cloning of all
the genes was confirmed by restriction digestion analysis and respective recombinant
plasmids were named as pET0012, pET0013 (Fig 3.2.1). Recombinant plasmid was
prepared and digested with restriction enzymes used for cloning and the release of DNA
fragment by double digestion confirmed the cloning of these genes. These clones were
sequenced to confirm the correctness of the insert and the absence of any mutation that
could have incorporated during PCR amplification. Confirmed recombinant plasmids
were transformed into E. coli BL21 DE3 pLysS cells and induced with IPTG. The
expression of ParB1 of 34.0 kDa and ParA1 of 35.0 kDa was observed on SDS – PAGE.
Using Ni-NTA chelating sepharose, these proteins were purified to near homogeneity
(Fig 3.2.1). ParB1 protein was purified under native condition where as ParA1 was
purified under denaturation condition, further refolded by serial dilution of urea. Peptide
mass fingerprints of both these proteins confirmed their identity as ParA1 and ParB1 of
D. radiodurans.
3.2.2.2 ParB1 showed specific interaction with predicted centromere:
Different plasmid or chromosomal segregation mechanisms suggests ParB specifically
interact with the centromere sequences to form nucleoprotein complex and plays an
important role in DNA segregation. Purified recombinant ParB1 protein was checked for

114
known characteristics of other ParB type proteins. ParB1 interactions with different segS
elements (centromere like sequences) were checked as mentioned in methods section.
pET0012
(A) (B)
(C)
Fig 3.2.1.(a) Cloning, expression and purification of ‘ParB1’ protein. A) Partial
restriction map of the pET0012. B) Analysis of restriction digestion products of
recombinant pET0012, undigested plasmid (lane1), marker (lambda DNA HindIII

115
&EcoRI) (lane 2) and double digested pET0012 plasmid (NdeI /XhoI).C) Purified ParB1
protein (lane P) along with protein size markers (lane M).
pET0012
DR_0012
pET0012
DR_0012
pET0012
DR_0012
A
1
619
1237
1855
2473
3091
3709
4327
4945
5563
pet 0013
6187 bp
XhoI 159
NdeI 1057
T7 promoter
PBR 322 ORI
kananycin gene
F1 ori
lacI gene
0013
ApaI 2153
BclI 1956
HpaI 2448
HincII 2448
NcoI 1115PvuI 5245
SapI 3927
SmaI 5119
SphI 1417
XbaI 1154
XmaI 5117
1
619
1237
1855
2473
3091
3709
4327
4945
5563
pet 0013
6187 bp
XhoI 159
NdeI 1057
T7 promoter
PBR 322 ORI
kananycin gene
F1 ori
lacI gene
0013
ApaI 2153
BclI 1956
HpaI 2448
HincII 2448
NcoI 1115PvuI 5245
SapI 3927
SmaI 5119
SphI 1417
XbaI 1154
XmaI 5117
1
619
1237
1855
2473
3091
3709
4327
4945
5563
pet 0013
6187 bp
XhoI 159
NdeI 1057
T7 promoter
PBR 322 ORI
kananycin gene
F1 ori
lacI gene
0013
ApaI 2153
BclI 1956
HpaI 2448
HincII 2448
NcoI 1115PvuI 5245
SapI 3927
SmaI 5119
SphI 1417
XbaI 1154
XmaI 5117
1
619
1237
1855
2473
3091
3709
4327
4945
5563
pet 0013
6187 bp
XhoI 159
NdeI 1057
T7 promoter
PBR 322 ORI
kananycin gene
F1 ori
lacI gene
0013
ApaI 2153
BclI 1956
HpaI 2448
HincII 2448
NcoI 1115PvuI 5245
SapI 3927
SmaI 5119
SphI 1417
XbaI 1154
XmaI 5117
1
619
1237
1855
2473
3091
3709
4327
4945
5563
pet 0013
6187 bp
XhoI 159
NdeI 1057
T7 promoter
PBR 322 ORI
kananycin gene
F1 ori
lacI gene
0013
ApaI 2153
BclI 1956
HpaI 2448
HincII 2448
NcoI 1115PvuI 5245
SapI 3927
SmaI 5119
SphI 1417
XbaI 1154
XmaI 5117
DR_0013
T7 promoter
lacI
pBR322
Ori
Kanr
f1 Ori
pET0013
1
619
1237
1855
2473
3091
3709
4327
4945
5563
pet 0013
6187 bp
XhoI 159
NdeI 1057
T7 promoter
PBR 322 ORI
kananycin gene
F1 ori
lacI gene
0013
ApaI 2153
BclI 1956
HpaI 2448
HincII 2448
NcoI 1115PvuI 5245
SapI 3927
SmaI 5119
SphI 1417
XbaI 1154
XmaI 5117
1
619
1237
1855
2473
3091
3709
4327
4945
5563
pet 0013
6187 bp
XhoI 159
NdeI 1057
T7 promoter
PBR 322 ORI
kananycin gene
F1 ori
lacI gene
0013
ApaI 2153
BclI 1956
HpaI 2448
HincII 2448
NcoI 1115PvuI 5245
SapI 3927
SmaI 5119
SphI 1417
XbaI 1154
XmaI 5117
1
619
1237
1855
2473
3091
3709
4327
4945
5563
pet 0013
6187 bp
XhoI 159
NdeI 1057
T7 promoter
PBR 322 ORI
kananycin gene
F1 ori
lacI gene
0013
ApaI 2153
BclI 1956
HpaI 2448
HincII 2448
NcoI 1115PvuI 5245
SapI 3927
SmaI 5119
SphI 1417
XbaI 1154
XmaI 5117
1
619
1237
1855
2473
3091
3709
4327
4945
5563
pet 0013
6187 bp
XhoI 159
NdeI 1057
T7 promoter
PBR 322 ORI
kananycin gene
F1 ori
lacI gene
0013
ApaI 2153
BclI 1956
HpaI 2448
HincII 2448
NcoI 1115PvuI 5245
SapI 3927
SmaI 5119
SphI 1417
XbaI 1154
XmaI 5117
1
619
1237
1855
2473
3091
3709
4327
4945
5563
pet 0013
6187 bp
XhoI 159
NdeI 1057
T7 promoter
PBR 322 ORI
kananycin gene
F1 ori
lacI gene
0013
ApaI 2153
BclI 1956
HpaI 2448
HincII 2448
NcoI 1115PvuI 5245
SapI 3927
SmaI 5119
SphI 1417
XbaI 1154
XmaI 5117
DR_0013
T7 promoter
lacI
pBR322
Ori
Kanr
f1 Ori
pET0013
0.56
0.830.941.371.581.90
3.534.26
5.14
21.12
kbp 1 2 3
parA1
parB1
1 2 3
0.56
0.830.94
1.371.581.90
3.534.26
1.37
5.14
21.12
kbp
0.56
0.830.94
1.371.581.90
3.534.265.14
21.12
kbp 1 2 3
ParA1
M P
M P
ParB1
B C
pET0012
DR_0012
pET0012
DR_0012
pET0012
DR_0012
A
1
619
1237
1855
2473
3091
3709
4327
4945
5563
pet 0013
6187 bp
XhoI 159
NdeI 1057
T7 promoter
PBR 322 ORI
kananycin gene
F1 ori
lacI gene
0013
ApaI 2153
BclI 1956
HpaI 2448
HincII 2448
NcoI 1115PvuI 5245
SapI 3927
SmaI 5119
SphI 1417
XbaI 1154
XmaI 5117
1
619
1237
1855
2473
3091
3709
4327
4945
5563
pet 0013
6187 bp
XhoI 159
NdeI 1057
T7 promoter
PBR 322 ORI
kananycin gene
F1 ori
lacI gene
0013
ApaI 2153
BclI 1956
HpaI 2448
HincII 2448
NcoI 1115PvuI 5245
SapI 3927
SmaI 5119
SphI 1417
XbaI 1154
XmaI 5117
1
619
1237
1855
2473
3091
3709
4327
4945
5563
pet 0013
6187 bp
XhoI 159
NdeI 1057
T7 promoter
PBR 322 ORI
kananycin gene
F1 ori
lacI gene
0013
ApaI 2153
BclI 1956
HpaI 2448
HincII 2448
NcoI 1115PvuI 5245
SapI 3927
SmaI 5119
SphI 1417
XbaI 1154
XmaI 5117
1
619
1237
1855
2473
3091
3709
4327
4945
5563
pet 0013
6187 bp
XhoI 159
NdeI 1057
T7 promoter
PBR 322 ORI
kananycin gene
F1 ori
lacI gene
0013
ApaI 2153
BclI 1956
HpaI 2448
HincII 2448
NcoI 1115PvuI 5245
SapI 3927
SmaI 5119
SphI 1417
XbaI 1154
XmaI 5117
1
619
1237
1855
2473
3091
3709
4327
4945
5563
pet 0013
6187 bp
XhoI 159
NdeI 1057
T7 promoter
PBR 322 ORI
kananycin gene
F1 ori
lacI gene
0013
ApaI 2153
BclI 1956
HpaI 2448
HincII 2448
NcoI 1115PvuI 5245
SapI 3927
SmaI 5119
SphI 1417
XbaI 1154
XmaI 5117
DR_0013
T7 promoter
lacI
pBR322
Ori
Kanr
f1 Ori
pET0013
1
619
1237
1855
2473
3091
3709
4327
4945
5563
pet 0013
6187 bp
XhoI 159
NdeI 1057
T7 promoter
PBR 322 ORI
kananycin gene
F1 ori
lacI gene
0013
ApaI 2153
BclI 1956
HpaI 2448
HincII 2448
NcoI 1115PvuI 5245
SapI 3927
SmaI 5119
SphI 1417
XbaI 1154
XmaI 5117
1
619
1237
1855
2473
3091
3709
4327
4945
5563
pet 0013
6187 bp
XhoI 159
NdeI 1057
T7 promoter
PBR 322 ORI
kananycin gene
F1 ori
lacI gene
0013
ApaI 2153
BclI 1956
HpaI 2448
HincII 2448
NcoI 1115PvuI 5245
SapI 3927
SmaI 5119
SphI 1417
XbaI 1154
XmaI 5117
1
619
1237
1855
2473
3091
3709
4327
4945
5563
pet 0013
6187 bp
XhoI 159
NdeI 1057
T7 promoter
PBR 322 ORI
kananycin gene
F1 ori
lacI gene
0013
ApaI 2153
BclI 1956
HpaI 2448
HincII 2448
NcoI 1115PvuI 5245
SapI 3927
SmaI 5119
SphI 1417
XbaI 1154
XmaI 5117
1
619
1237
1855
2473
3091
3709
4327
4945
5563
pet 0013
6187 bp
XhoI 159
NdeI 1057
T7 promoter
PBR 322 ORI
kananycin gene
F1 ori
lacI gene
0013
ApaI 2153
BclI 1956
HpaI 2448
HincII 2448
NcoI 1115PvuI 5245
SapI 3927
SmaI 5119
SphI 1417
XbaI 1154
XmaI 5117
1
619
1237
1855
2473
3091
3709
4327
4945
5563
pet 0013
6187 bp
XhoI 159
NdeI 1057
T7 promoter
PBR 322 ORI
kananycin gene
F1 ori
lacI gene
0013
ApaI 2153
BclI 1956
HpaI 2448
HincII 2448
NcoI 1115PvuI 5245
SapI 3927
SmaI 5119
SphI 1417
XbaI 1154
XmaI 5117
DR_0013
T7 promoter
lacI
pBR322
Ori
Kanr
f1 Ori
pET0013
1
619
1237
1855
2473
3091
3709
4327
4945
5563
pet 0013
6187 bp
XhoI 159
NdeI 1057
T7 promoter
PBR 322 ORI
kananycin gene
F1 ori
lacI gene
0013
ApaI 2153
BclI 1956
HpaI 2448
HincII 2448
NcoI 1115PvuI 5245
SapI 3927
SmaI 5119
SphI 1417
XbaI 1154
XmaI 5117
1
619
1237
1855
2473
3091
3709
4327
4945
5563
pet 0013
6187 bp
XhoI 159
NdeI 1057
T7 promoter
PBR 322 ORI
kananycin gene
F1 ori
lacI gene
0013
ApaI 2153
BclI 1956
HpaI 2448
HincII 2448
NcoI 1115PvuI 5245
SapI 3927
SmaI 5119
SphI 1417
XbaI 1154
XmaI 5117
1
619
1237
1855
2473
3091
3709
4327
4945
5563
pet 0013
6187 bp
XhoI 159
NdeI 1057
T7 promoter
PBR 322 ORI
kananycin gene
F1 ori
lacI gene
0013
ApaI 2153
BclI 1956
HpaI 2448
HincII 2448
NcoI 1115PvuI 5245
SapI 3927
SmaI 5119
SphI 1417
XbaI 1154
XmaI 5117
1
619
1237
1855
2473
3091
3709
4327
4945
5563
pet 0013
6187 bp
XhoI 159
NdeI 1057
T7 promoter
PBR 322 ORI
kananycin gene
F1 ori
lacI gene
0013
ApaI 2153
BclI 1956
HpaI 2448
HincII 2448
NcoI 1115PvuI 5245
SapI 3927
SmaI 5119
SphI 1417
XbaI 1154
XmaI 5117
1
619
1237
1855
2473
3091
3709
4327
4945
5563
pet 0013
6187 bp
XhoI 159
NdeI 1057
T7 promoter
PBR 322 ORI
kananycin gene
F1 ori
lacI gene
0013
ApaI 2153
BclI 1956
HpaI 2448
HincII 2448
NcoI 1115PvuI 5245
SapI 3927
SmaI 5119
SphI 1417
XbaI 1154
XmaI 5117
DR_0013
T7 promoter
lacI
pBR322
Ori
Kanr
f1 Ori
pET0013
1
619
1237
1855
2473
3091
3709
4327
4945
5563
pet 0013
6187 bp
XhoI 159
NdeI 1057
T7 promoter
PBR 322 ORI
kananycin gene
F1 ori
lacI gene
0013
ApaI 2153
BclI 1956
HpaI 2448
HincII 2448
NcoI 1115PvuI 5245
SapI 3927
SmaI 5119
SphI 1417
XbaI 1154
XmaI 5117
1
619
1237
1855
2473
3091
3709
4327
4945
5563
pet 0013
6187 bp
XhoI 159
NdeI 1057
T7 promoter
PBR 322 ORI
kananycin gene
F1 ori
lacI gene
0013
ApaI 2153
BclI 1956
HpaI 2448
HincII 2448
NcoI 1115PvuI 5245
SapI 3927
SmaI 5119
SphI 1417
XbaI 1154
XmaI 5117
1
619
1237
1855
2473
3091
3709
4327
4945
5563
pet 0013
6187 bp
XhoI 159
NdeI 1057
T7 promoter
PBR 322 ORI
kananycin gene
F1 ori
lacI gene
0013
ApaI 2153
BclI 1956
HpaI 2448
HincII 2448
NcoI 1115PvuI 5245
SapI 3927
SmaI 5119
SphI 1417
XbaI 1154
XmaI 5117
1
619
1237
1855
2473
3091
3709
4327
4945
5563
pet 0013
6187 bp
XhoI 159
NdeI 1057
T7 promoter
PBR 322 ORI
kananycin gene
F1 ori
lacI gene
0013
ApaI 2153
BclI 1956
HpaI 2448
HincII 2448
NcoI 1115PvuI 5245
SapI 3927
SmaI 5119
SphI 1417
XbaI 1154
XmaI 5117
1
619
1237
1855
2473
3091
3709
4327
4945
5563
pet 0013
6187 bp
XhoI 159
NdeI 1057
T7 promoter
PBR 322 ORI
kananycin gene
F1 ori
lacI gene
0013
ApaI 2153
BclI 1956
HpaI 2448
HincII 2448
NcoI 1115PvuI 5245
SapI 3927
SmaI 5119
SphI 1417
XbaI 1154
XmaI 5117
DR_0013
T7 promoter
lacI
pBR322
Ori
Kanr
f1 Ori
pET0013
0.56
0.830.941.371.581.90
3.534.26
5.14
21.12
kbp 1 2 3
parA1
parB1
1 2 3
0.56
0.830.94
1.371.581.90
3.534.26
1.37
5.14
21.12
kbp
0.56
0.830.94
1.371.581.90
3.534.265.14
21.12
kbp 1 2 3
ParA1
M P
M P
ParB1
B C
DR0013
(35 kDa)
(D)
(E)(F)
Fig 3.2.1.(b) Cloning, expression and purification of ‘ParA1’ protein. D) Partial
restriction map of the pET0013 plasmid. E) Analysis of restriction digestion products of
recombinant pET0013 plasmid, undigested plasmid (lane1), marker (lambda DNA
HindIII &EcoRI) (lane 2) and double digested pET0012 plasmid (NdeI /XhoI).F) Purified
ParB1 and ParA1 protein (lane P) along with protein size markers (lane M).

116
ParB1 showed binding with all three segS (segS1, segS2 and segS3) elements with equal
affinity (Fig. 3.2.2). The ParB1 interaction with all three segS elements was specific,
which remained unaffected even in presence of 100 fold higher molar ratio of nonspecific
DNA (Fig. 3.2.2) suggesting that ParB1 interacts specifically with the segS elements
(centromere like sequences) like other known ParB proteins.
segS1
segS1
segS2
segS2
segS3
ParB1-
segS3
A
B
C
Fig. 3.2.2: ParB1 interaction with segS type centromere’s of chromosome I.
300bp PCR product of all three chromosomal type centromere segS1 (A), segS2 (B) and
segS3 (C) were PCR amplified and approximately products of each element was labeled
with [32
P] γ ATP and incubated with different concentrations of recombinant ParB1. For
competition with non-specific DNA, the segS elements were incubated with ParB1 and
chased with 1:1 (1), 1:5 (2), 1:10 (3), 1:20 (4), 1:50 (5) and 1:100 (6) higher molar ratio
of 250bp nonspecific dsDNA (Non-sp DNA). Products were separated on 5% native
PAGE, dried and auto radiograms were developed by using Typhoon phosphorimager.

117
3.2.2.3 ParA1 is a DNA binding ATPase in vitro:
Recent studies revealed ParA proteins interact nonspecifically with DNA and undergo
polymerization. Interaction of ParA polymer with the ParB helps in separation of newly
duplicated DNA to opposite side of the cell. We have also hypothesized that ParA1 might
behave like Soj of B. subtilis or T. thermophilus. The functional domain search analysis
showed that ParA1 contain deviant Walker type ATPase domains and a characteristic
arginine pair implicated in the DNA protein interaction and functioning as a DNA
binding ATPase. The purified recombinant ParA1 was checked for its interaction with
DNA. It showed dsDNA binding activity in vitro (Fig 3.2.3). Gel mobility shift assay of
ParA1 with a 400bp dsDNA yielded multiple mobility retarded DNA bands suggesting
concentration dependent binding of ParA1 on DNA.
Fig 3.2.3: DNA binding activity of ParA1: A) DNA binding activity of purified ParA1
was checked with 400bp PCR amplified nonspecific DNA substrate (denoted as S) and
increasing concentration of protein and products were analyzed on 1.2 % Agarose gel. B)
0.0 0.5 1.0 1.5 2.0 2.5 3.0 3.5 4.0 4.5 5.0 5.5 6.00
10
20
30
40
50
60
70
80
90
100
110
Concentration of ParA1 (uM)
Percen
tag
e o
f S
ub
str
ate
S
P
0.0 0.5 1.0 1.5 2.0 2.5 3.0 3.5 4.0 4.5 5.0 5.5 6.00
10
20
30
40
50
60
70
80
90
100
110
Concentration of ParA1 (uM)
Percen
tag
e o
f S
ub
str
ate
S
P
ABA
Pe
rce
nta
ge
of
DN
A
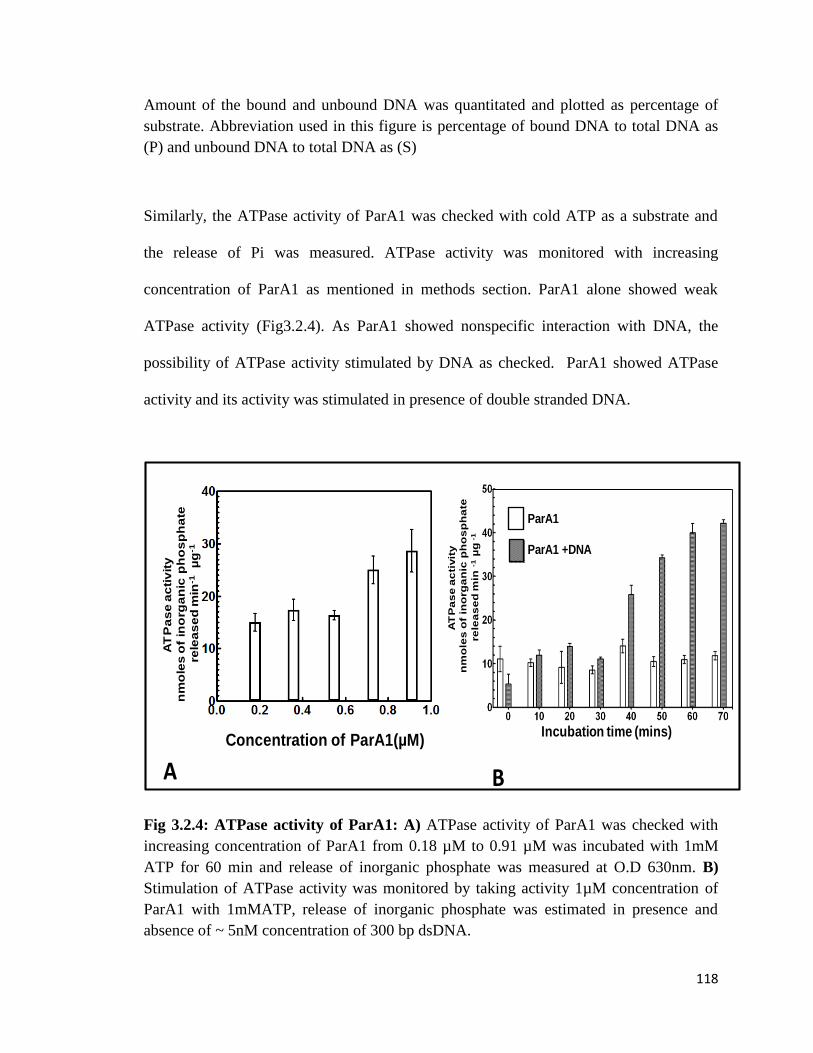
118
Amount of the bound and unbound DNA was quantitated and plotted as percentage of
substrate. Abbreviation used in this figure is percentage of bound DNA to total DNA as
(P) and unbound DNA to total DNA as (S)
Similarly, the ATPase activity of ParA1 was checked with cold ATP as a substrate and
the release of Pi was measured. ATPase activity was monitored with increasing
concentration of ParA1 as mentioned in methods section. ParA1 alone showed weak
ATPase activity (Fig3.2.4). As ParA1 showed nonspecific interaction with DNA, the
possibility of ATPase activity stimulated by DNA as checked. ParA1 showed ATPase
activity and its activity was stimulated in presence of double stranded DNA.
Incubation time (mins)
AT
Pa
se
ac
tivit
y
nm
ole
s o
f in
org
an
ic p
ho
sp
ha
te
rele
as
ed
min
-1
µg
-1
ParA1
ParA1 +DNA
A B
AT
Pa
se
ac
tiv
ity
nm
ole
s o
f in
org
an
ic p
ho
sp
ha
te
rele
as
ed
min
-1µ
g-1
Concentration of ParA1(µM)
A B
Fig 3.2.4: ATPase activity of ParA1: A) ATPase activity of ParA1 was checked with
increasing concentration of ParA1 from 0.18 µM to 0.91 µM was incubated with 1mM
ATP for 60 min and release of inorganic phosphate was measured at O.D 630nm. B)
Stimulation of ATPase activity was monitored by taking activity 1µM concentration of
ParA1 with 1mMATP, release of inorganic phosphate was estimated in presence and
absence of ~ 5nM concentration of 300 bp dsDNA.

119
3.2.2.4 Interaction of ParA1 filament with DNA:
Functional analyses of ParA1 in different organisms showed that ParA interacts non-
specifically with the dsDNA and also contain weak ATPase activity. ParA1 interaction
with DNA can be possible either through wrapping around the DNA like ParA of P1
plasmid etc or sequestration on DNA and forming higher order oligomeric structure like
SopA of F plasmid. To ascertain how ParA1 is interacting with the DNA, the
sedimentation and light scattering analysis was done.
Sedimentation analysis:
Sedimentation analysis was carried out as mentioned for ATPase assay i.e. 1µM
concentration of ParA1 was incubated in ATPase buffer in presence and absence of DNA
(segS1) and reaction was incubated at 37oC for 30 min.
Fig 3.2.5 Interaction of ParA1 with DNA by using sedimentation analysis:
Recombinant ParA1 was incubated with DNA, ATP and in presence of both. Mixtures
were incubated at 37oC for 30 min, these mixtures were centrifuged at 22,000 x g for 30
min and both supernatant (S) and pellets (P) fractions were analyzed on SDS-PAGE (A).

120
Gel was stained with silver nitrate and the intensity of protein band corresponding to
ParA1 was estimated by densitometric scanning from the respective gel (B). Amount of
ParA1 in pellet was measured by densitometric analysis as shown in this graph.
The distribution of ParA1 between pellet and supernatant was monitored on SDS-PAGE
gel (Bouet et al., 2007). Nearly 20% of protein in case of ParA1 incubated alone goes to
pellet, which did not change with DNA in presence and absence of ATP (Fig3.2.5). It has
been shown that SopA sequesters on DNA to produce the larger size pellet of these
proteins upon centrifugation. However ParA1 in presence or absence of DNA does not
form higher oligomeric structures, indicating ParA1 can interact with DNA without
forming higher oligomeric structures.
Light scattering analysis:
The light scattering approach has been used earlier for determining the dynamic
variations in size of macromolecular complexes.

121
Fig 3.2.6: Light scattering analysis: Light scattering studies of ParA1 incubated with
DNA in presence and absence of ATP. Light scattering spectra was recorded as a
function of time. Data presented here is the mean of values obtained with 10 shots at
every single time point from a representative experiment.
The effect of ATP, DNA on oligomerization of ParA1 was also checked through light
scattering. Results showed that there was no significant change in amount of light
scattering (counts/sec) when ParA1 was incubated with DNA in presence or absence of
ATP (Fig 3.2.6). Sedimentation results as well as light scattering results specified that the
ParA1 interacts with dsDNA and doesn‟t sequester on it to form super order structures
(Hassan et al., 2004).
3.2.2.5 ParA1 interaction with ParB1 bound with DNA:
The ATPase activity of some members of the ParA and MinD one of the proteins
regulating mini cell formation in bacteria, family proteins has been shown to get
stimulated in vitro by the cognate ParB bound to cognate centromere. The MinE (mini
cell regulatory protein) stimulation of ATPase of MinD is required for the proper
functioning of MinD in vivo.
Stimulation of ATPase activity of ParA1
Bioinformatic analysis indicated that ParA1 is close to ParA homologues belonging to the
deviant Walker type ATPase family. Since, the ATPase activity of ParA family protein is
stimulated by its cognate ParB, the possibility of ParA1 activity also stimulated by ParB1
could be envisaged and monitored in vitro. Purified ParB1 was incubated with different
segS elements (hereafter referred as segS-ParB1 complex) and then ParA1 was added to
it. The release of inorganic phosphate was measured using malachite green reagent as
mentioned in methods. ATPase activity stimulation was observed when ParB1 was
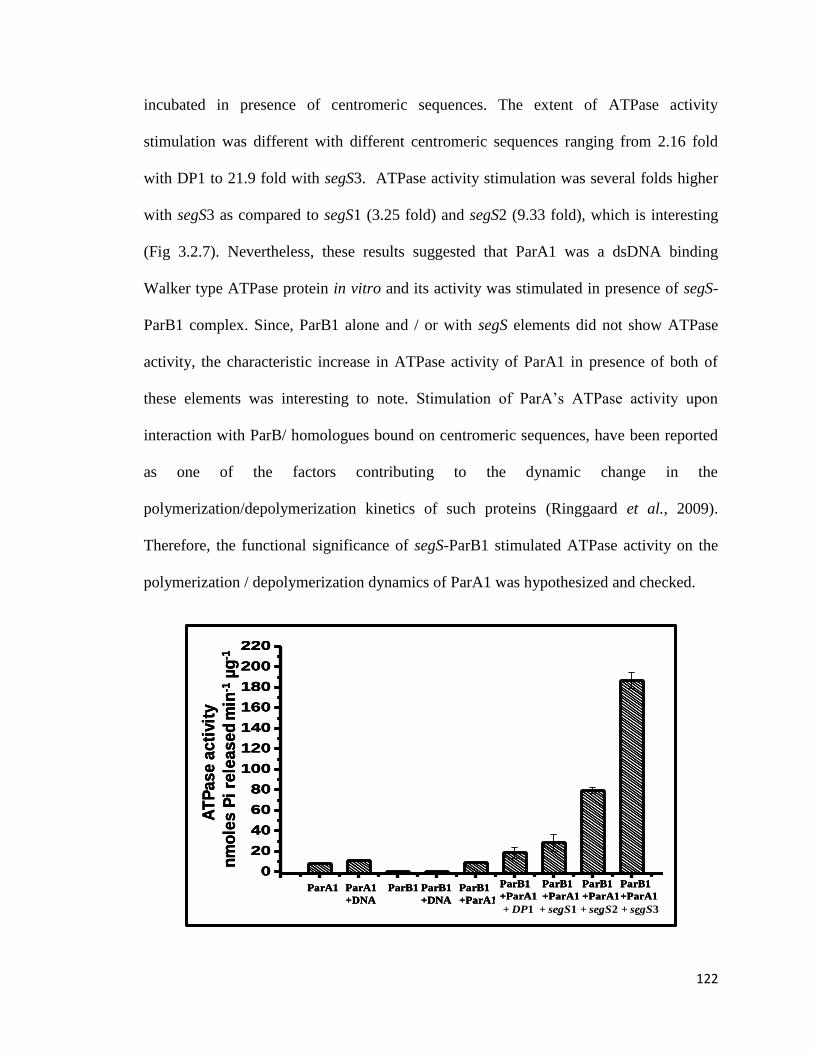
122
incubated in presence of centromeric sequences. The extent of ATPase activity
stimulation was different with different centromeric sequences ranging from 2.16 fold
with DP1 to 21.9 fold with segS3. ATPase activity stimulation was several folds higher
with segS3 as compared to segS1 (3.25 fold) and segS2 (9.33 fold), which is interesting
(Fig 3.2.7). Nevertheless, these results suggested that ParA1 was a dsDNA binding
Walker type ATPase protein in vitro and its activity was stimulated in presence of segS-
ParB1 complex. Since, ParB1 alone and / or with segS elements did not show ATPase
activity, the characteristic increase in ATPase activity of ParA1 in presence of both of
these elements was interesting to note. Stimulation of ParA‟s ATPase activity upon
interaction with ParB/ homologues bound on centromeric sequences, have been reported
as one of the factors contributing to the dynamic change in the
polymerization/depolymerization kinetics of such proteins (Ringgaard et al., 2009).
Therefore, the functional significance of segS-ParB1 stimulated ATPase activity on the
polymerization / depolymerization dynamics of ParA1 was hypothesized and checked.
ParA1ParA1+DNAParB1ParB1+DNAParA1+ParB1ParA1+ParB1+DP1ParA1+ParB1+segS1ParA1+ParB1+segS2ParA1+ParB1+segS3
0
20
40
60
80
100
120
140
160
180
200
220
Mea
n
A
Statistics On Rows of [Book2]Sheet1!Col(B)[1]:Col(D)[9]
AT
Pa
se
ac
tivit
y
nm
ole
sP
i re
lea
se
d m
in-1
µg
-1
ParA1 ParA1
+DNA
ParB1 ParB1
+DNA
ParB1
+ParA1
ParB1
+ParA1
+DP1
ParB1
+ParA1
+segS1
ParB1
+ParA1
+segS2
ParB1
+ParA1
+segS3
ParA1ParA1+DNAParB1ParB1+DNAParA1+ParB1ParA1+ParB1+DP1ParA1+ParB1+segS1ParA1+ParB1+segS2ParA1+ParB1+segS3
0
20
40
60
80
100
120
140
160
180
200
220
Mea
n
A
Statistics On Rows of [Book2]Sheet1!Col(B)[1]:Col(D)[9]
AT
Pa
se
ac
tivit
y
nm
ole
sP
i re
lea
se
d m
in-1
µg
-1
ParA1 ParA1
+DNA
ParB1 ParB1
+DNA
ParB1
+ParA1
ParB1
+ParA1
+DP1
ParB1
+ParA1
+segS1
ParB1
+ParA1
+segS2
ParB1
+ParA1
+segS3+ segS3+ segS2+ segS1+ DP1

123
Fig 3.2.7: Stimulation of ParA1 ATPase activity: ATPase activity of ParA1, ParB1
with and without DNA, similarly ParA1+ParB1 was incubated with aberrant parS
(DP1+A1B1), segS1 (S1+A1B1), segS2 (S2+A1B1) and segS3 (S3+A1B1) of
chromosome I, release of inorganic phosphate was measured as described in methods.
Polymerization or depolymerization of ParA1 with ParB1
ParA1 has shown differential stimulation of ATPase activity with different segS
complexes. In order to check ParB1 effect on ParA1 oligomerization in presence and
absence of different segS elements, the sedimentation assay was done. Purified
recombinant ParA1 protein was incubated with different segS complexes in presence and
absence of ATP and the distribution of ParA1 between pellet and supernatant were
monitored. ParA1 alone showed certain levels of sedimentation, which did not change in
presence of ATP (Fig 3.2.8).
Fig 3.2.8: Interaction of ParA1 with ParB1 nucleoprotein complex: Sedimentation
analysis of ParA1 in presence of its cognate putative chromosome I partitioning
components. Recombinant ParA1 was incubated with segS1 (S1), segS2 (S2), and segS3
(S3), ParB1 and ATP in different combinations. Mixtures were centrifuged at 22,000 g
124
for 30 min and both supernatant (S) and pellets (P) fractions were analyzed on SDS-
PAGE. Gel was stained with silver nitrate and the intensity of protein band corresponding
to ParA1 was estimated by densitometric scanning from the respective gel.
However in presence of ParB1- segS1/segS2 complexes without ATP, the amount of
ParA1 had increased significantly in pellet (Fig 3.2.8). This increase of ParA1 in pellet
was relatively more with segS3 as compared to segS2. However in presence of ATP, the
levels of ParA1 in pellet increased in case of segS1 and segS2, where as it decreased
significantly in case of segS3. This showed that although ParB1 forms complex with all
segS elements, the interactions of ParA1 with segS3-ParB1 complex was different in
presence of ATP. Presumably, it dissociates faster from a hypothetical {segS3- ParA1B1}
complex in presence of ATP as compared to similar types of complexes with segS1and
segS2 (Fig 3.2.8). This result also agrees with an independent observation where the
faster mobility of segS3-ParA1B1 nucleoprotein complex was observed in presence of
ATP. The ATP effect on faster mobility of segS3 nucleoprotein complex, the higher
sedimentation of ParA1 in mixture containing ParA1 incubated with segS3-ParB1
complex, and the greater stimulation of ATPase activity in presence of segS3, together
suggested a correlation between ATPase activity stimulation and depolymerization of
ParA1 polymer. ATPase activity stimulation mediated depolymerization of ParA, which
provides the force for the movement of replicated genome in the direction of higher
concentration of ParA as has been suggested earlier (Gerdes et al., 2010).
Light scattering analysis:
ParA1 behaved differently in presence of different segS complexes indicating a change in
the degree of polymersation of ParA1 protein. Sedimentation analysis and supershift
assays have shown that ParA1 depolymerised from segS3 complex in presence of ATP.
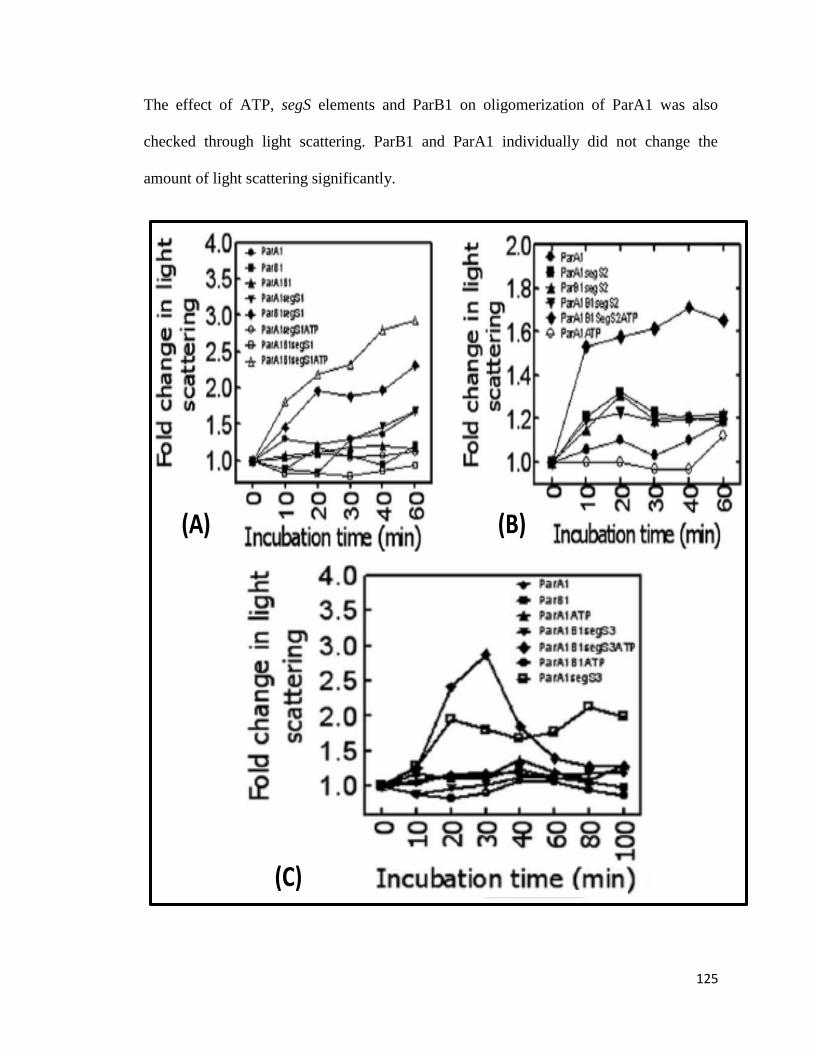
125
The effect of ATP, segS elements and ParB1 on oligomerization of ParA1 was also
checked through light scattering. ParB1 and ParA1 individually did not change the
amount of light scattering significantly.
A B C
A B C
(A) (B)
(C)

126
Fig 3.2.9 Interaction of ParA1 with ParB1 nucleoprotein complex studied using
Light scattering analysis: Light scattering studies of ParA1 incubated with ParB1 and
segS elements in presence and absence of ATP. The recombinant purified ParA1 (ParA1)
and ParB1 (ParB1) were taken alone and together in different combinations with segS1
(A) / segS2 (B)/ segS3 (C) and ATP and light scattering spectra was recorded as a
function of time. For experiments where both ParA1 and ParB1 were incubated with segS
elements, the ParB1 was pre incubated with segS before ParA1 was added. For ATP
effect, the ATP was added last in any given combination.
However, the incubation of ParA1 with segS-ParB1 complexes of all three segS elements
showed a steady increase in light scattering, albeit in absence of ATP (Fig 3.2.9). In
presence of ATP, the increase in light scattering was continued for 60 min in case of
segS1 and segS2. With segS3 however, the initial increase in light scattering for 30 min
followed to a sharp decrease, indicating the possibility of a rapid change in
macromolecular interaction between ParA1 and segS3-ParB1 complex. The light
scattering approach has been used earlier for determining the dynamic variations in size
of macromolecular complexes. An increase in light scattering with time has been
attributed to an increase in size of ParA protein polymers (Bouet et al., 2007) while the
decrease in light scattering has been suggested due to disassembly of ParA filament
(Ringgaard et al., 2009;Soberon et al., 2011). It may be noted that ParA belonging to type
I categerory of ParA proteins polymerizes in presence of ATP and DNA. Such an
interaction of this complex with Spo0J (ParB) stimulates the intrinsic ATPase activity of
Soj (ParA) leading to its depolymerization (Pratto et al., 2008;Pratto et al., 2009;Ptacin et
al., 2010). Thus, a rapid decrease in light scattering, faster gel mobility and relatively
lesser amount of ParA1 in pellet in presence of segS3 and ATP, may possibly suggest that
the higher ATPase activity of ParA1 upon interaction with ParB1-segS3 complex, could
lead to its rapid depolymerization. In vitro results obtained so far suggested that the
ParB1 is a sequence specific centromere binding protein and ParA1 is a DNA binding
127
ATPase. Sequence specific interaction of ParB1 to all three segS elements with nearly
similar Kd values indicated a strong possibility of multiple centromere like sequences
functioning in chromosome I partitioning in D. radiodurans
3.2.2.6 In vivo characterization of chromosome I partition proteins:
In vivo characterization of chromosome I partition system was carried out by the
analyzing the functions of both cis elements and partitioning proteins in genome
segregation. In vitro results produced some interesting observations like segS1 and segS2
elements bound to ParB1 produced stable complex with ParA1 even in presence of ATP
while these interaction behaved differently with segS3. We hypothesized that the
differential stimulation of ParA1 activities could be due to the minor changes in the
centromere sequences. In order to test the hypothesis and to check the in vivo functions of
these segS elements as centromere like sequences and thus in genome segregation, we
employed different methods like stabilization of unstable plasmid, looking for genomic
instability and in vivo monitoring of the dynamics of ParA1 protein.
Plasmid stabilization
Earlier, the plasmid stability assay using unstable vectors like mini-F plasmid pDAG203
(Hirano et al., 1998), has been employed for the characterization of genome partitioning
systems in other bacteria (Dubarry et al., 2006;Godfrin-Estevenon et al., 2002).
Functional complementation of complete „par‟ system is a direct method to show that
these „Par‟ proteins are involved in the chromosome segregation. Plasmid stabilization
assays was done using unstable mini-F plasmid pDAG203. All three segS elements
(segS1, segS2 and segS3) were PCR amplified and cloned in pDAG203, yielding pDAG
128
derivatives i.e. pDAGS1, pDAGS2, pDAGS3, respectively (Fig 3.2.10a). Cloning was
confirmed by restriction analysis as described in methods (Fig 3.2.10b) and transformed
into E. coli. Cells harboring these derivatives were grown to different generations in
minimal CSA medium (M9 salts, 0.2% glucose , 2% casamino acids) and the numbers
of cells conferring chloramphenicol resistance (a phenotype encoded on pDAG203) were
scored as mentioned in material and methods. Interestingly, the cells carrying pDAGS1,
pDAGS2 showed nearly 100% stable inheritance of respective plasmids independent of
ParA1B1 (Fig 3.210c) while stability of plasmid pDAGS3, in terms of cells expressing
chloramphenicol resistance, was although significantly high even in absence of ParA1B1
as compared to control, it improved further to nearly 100 % when both ParA1B1 (Fig
3.210d) were co-expressed using pDSWparA1B1 vector (Fig 3.2.11). However, the
possibility of any changes in copy number in terms of amount of plasmid DNA per unit
chromosomal DNA and mutations in segS elements have been ruled out (Fig 3.2.10e).
These results indicated that (i) all three segS elements could function like bacterial
centromere, (ii) we hypothesized unknown proteins in E. coli are functional
complementing „Par‟ proteins. These proteins recognize segS1 and segS2 which
increased plasmid stability in host cells while segS3 recognition by E. coli complements
were partial and required cognate ParA1B1 for its complete inheritance in dividing
population. Differential functions of different segS elements in stabilizing instable
plasmid in E. coli could be due to slight difference in their nucleotide sequence. These
results suggested that segS3 functions differently from segS1 and segS2 and the function
of segS3 required ParA1B1 for its complete segregation in E. coli. The molecular basis of

129
segS1 and segS2 stabilizing the unstable mini-F plasmid independent of its cognate
partitioning proteins in E. coli is not clear.
S1/S2/S3
pDAGS3pDAGS2
pDAGS1
A B
1
697
1393
2089
2785
3481
4177
4873
5569
6265
pDAGS1/S2/S3
rfsf
ccdA
ccdB
resD
repEincC
rpsl
Cam
Ori
SegS1/S2/S3
AarI 3983
AflII 5241
NdeI 692
PmlI 4741
RsrII 1497
ScaI 6013
XbaI 2538
EcoRV 5345
EcoRV 3703
EcoRV 3474
A B
S1/S2/S3
pDAGS3pDAGS2
pDAGS1
A B
1
697
1393
2089
2785
3481
4177
4873
5569
6265
pDAGS1/S2/S3
rfsf
ccdA
ccdB
resD
repEincC
rpsl
Cam
Ori
SegS1/S2/S3
AarI 3983
AflII 5241
NdeI 692
PmlI 4741
RsrII 1497
ScaI 6013
XbaI 2538
EcoRV 5345
EcoRV 3703
EcoRV 3474
A B
S1/S2/S3
pDAGS3pDAGS2
pDAGS1
A B
1
697
1393
2089
2785
3481
4177
4873
5569
6265
pDAGS1/S2/S3
rfsf
ccdA
ccdB
resD
repEincC
rpsl
Cam
Ori
SegS1/S2/S3
AarI 3983
AflII 5241
NdeI 692
PmlI 4741
RsrII 1497
ScaI 6013
XbaI 2538
EcoRV 5345
EcoRV 3703
EcoRV 3474
A B
(A)
(B)
pDAGS1/S2/S3 stability pDAGS3 stabilisationC
D
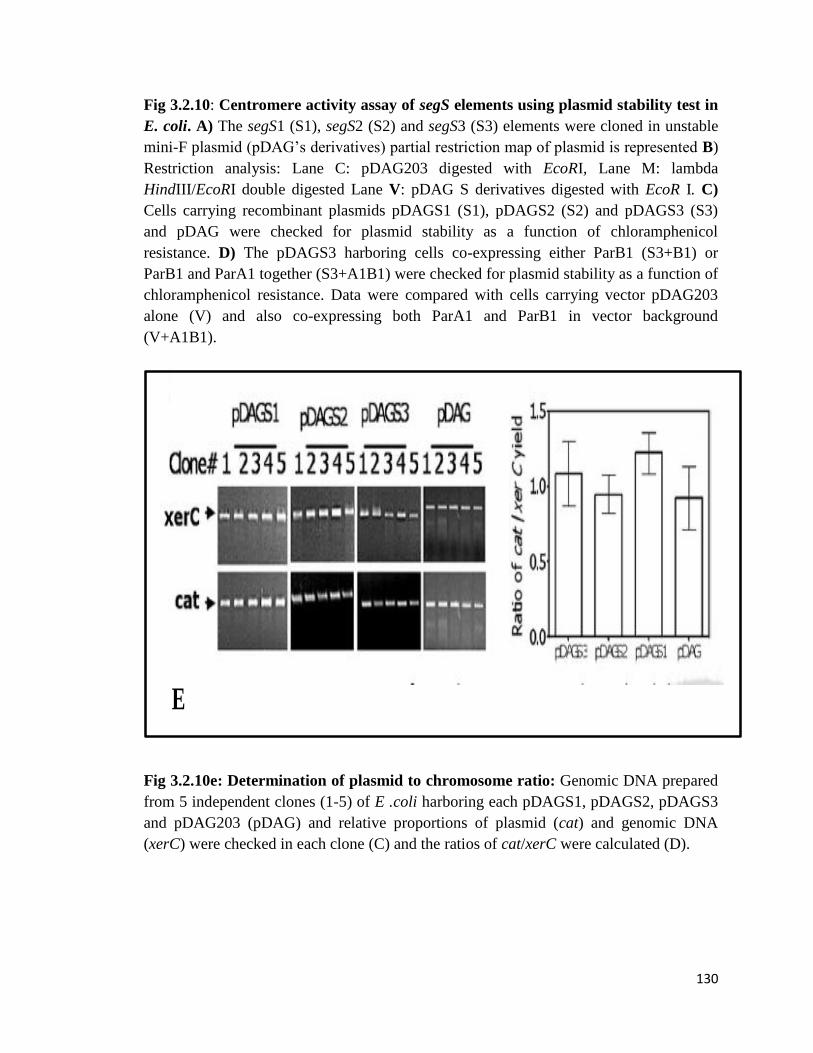
130
Fig 3.2.10: Centromere activity assay of segS elements using plasmid stability test in
E. coli. A) The segS1 (S1), segS2 (S2) and segS3 (S3) elements were cloned in unstable
mini-F plasmid (pDAG‟s derivatives) partial restriction map of plasmid is represented B)
Restriction analysis: Lane C: pDAG203 digested with EcoRI, Lane M: lambda
HindIII/EcoRI double digested Lane V: pDAG S derivatives digested with EcoR I. C)
Cells carrying recombinant plasmids pDAGS1 (S1), pDAGS2 (S2) and pDAGS3 (S3)
and pDAG were checked for plasmid stability as a function of chloramphenicol
resistance. D) The pDAGS3 harboring cells co-expressing either ParB1 (S3+B1) or
ParB1 and ParA1 together (S3+A1B1) were checked for plasmid stability as a function of
chloramphenicol resistance. Data were compared with cells carrying vector pDAG203
alone (V) and also co-expressing both ParA1 and ParB1 in vector background
(V+A1B1).
E
Fig 3.2.10e: Determination of plasmid to chromosome ratio: Genomic DNA prepared
from 5 independent clones (1-5) of E .coli harboring each pDAGS1, pDAGS2, pDAGS3
and pDAG203 (pDAG) and relative proportions of plasmid (cat) and genomic DNA
(xerC) were checked in each clone (C) and the ratios of cat/xerC were calculated (D).
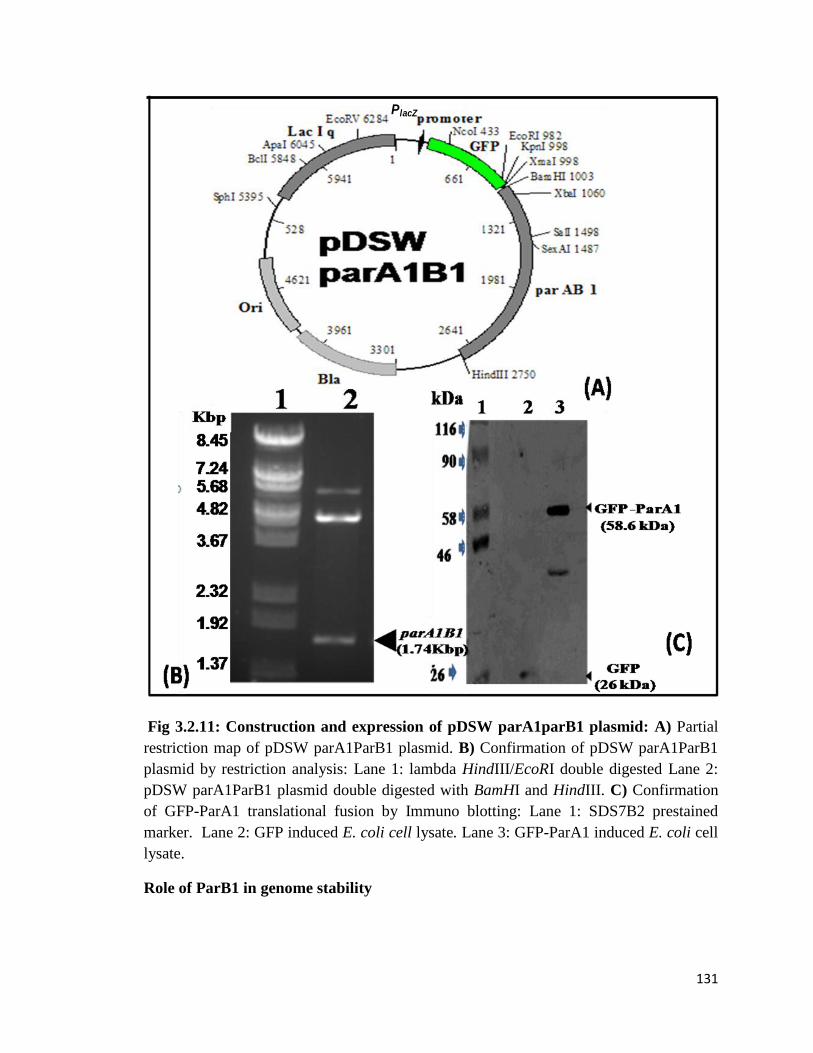
131
PlacZ
Fig 3.2.11: Construction and expression of pDSW parA1parB1 plasmid: A) Partial
restriction map of pDSW parA1ParB1 plasmid. B) Confirmation of pDSW parA1ParB1
plasmid by restriction analysis: Lane 1: lambda HindIII/EcoRI double digested Lane 2:
pDSW parA1ParB1 plasmid double digested with BamHI and HindIII. C) Confirmation
of GFP-ParA1 translational fusion by Immuno blotting: Lane 1: SDS7B2 prestained
marker. Lane 2: GFP induced E. coli cell lysate. Lane 3: GFP-ParA1 induced E. coli cell
lysate.
Role of ParB1 in genome stability

132
Plasmid stabilization studies showed the essentiality of ParA1B1 proteins in stabilization
of pDAGS3 plasmid. To find out the role of ParB1 in maintenance of D. radiodurans
genome, we have generated pNOK0012 vector as described in methodology. In brief the
~1 kbp upstream and downstream regions to the DR0012 encoding genomic fragment
were PCR amplified and cloned at pNOKOUT (Fig 3.2.12a) and confirmed by restriction
analysis. The release of correct size fragment was evident (Fig 3.212b). The pNOK0012
recombinant plasmid was linearized using XmnI restriction enzyme and transformed into
D. radiodurans wild type cells to generate homozygous deletion of ParB1. The complete
replacement of the chromosomal copy of parB1 from the Deinococcus genome with
selection marker gene nptII was confirmed by PCR amplification of nptII cassette, which
was absent in wild type (Fig 3.212c). The ΔparB1 mutant was also confirmed by the
absence of PCR amplification of parB1 encoding sequences in genome of the mutants
(Fig 3.2.12c). Homozygous parB1 deletion mutant used in subsequent work is named as
∆parB1.
Effect of parB1 deletion on growth characteristics and genomic instability in D.
radiodurans was checked. Mutant cells showed significant decrease in turbidity
measured at 600nm as compared to wild type cells (Fig 3.2.13a). Deletion of parB1
showed similar effect as parB deletion in other bacteria e.g. Pseudomonas putida
(Godfrin-Estevenon et al., 2002). Fluorescent micrographs of mutant cells stained with
DAPI showed notable effects of parB1 deletion on genome maintenance under normal
growth conditions. During exponential growth phase, these cells showed an increased
frequency of anucleated cells and there was no change in the cell morphology (Fig

133
3.2.14). The anucleation frequency in mutant cells was in range of 8-13 % against less
than 1% observed in wild type cells (Table 3.2).
1
606
1211
1816
2421
3026
3631
4236
4841
5446
pNOK CIB vector
PstI 1743
BamHI 2839
SacI 3858
EcoRI 1733
EcoRI 3261HindIII 2522
SmaI 2278
StuI 1227
XbaI 1545
XhoI 2004
XmaI 2276
XmnI 5744
NPT II gene
Ori
Bla gene KpnI 658
ParB UP
ParB1 DN
pNOk parB1vector
1 2 3 4 5 61 2 3 4 5 61 2 3 4 5 61 2 3 4 5 61 2 3 4 5 61 2 3 4 5 61 2 3 4 5 61 2 3 4 5 61 2 3 4 5 61 2 3 4 5 61 2 3 4 5 61 2 3 4 5 6
0.56
0.830.94
1.371.581.90
3.534.265.14
21.12
kbp 1 2 3 4 5 6
0.56
0.830.94
1.371.581.90
3.534.265.14
21.12
kbp1 2 3 4 5 6
A B C
pNOK0012
plasmid
Up/Dn
Fragment
( ~1kbp)
nptII (960bp)
parB1 (867 bp)
parB1 internal
(560bp)
A B C1
606
1211
1816
2421
3026
3631
4236
4841
5446
pNOK CIB vector
PstI 1743
BamHI 2839
SacI 3858
EcoRI 1733
EcoRI 3261HindIII 2522
SmaI 2278
StuI 1227
XbaI 1545
XhoI 2004
XmaI 2276
XmnI 5744
NPT II gene
Ori
Bla gene KpnI 658
ParB UP
ParB1 DN
pNOk parB1vector
1 2 3 4 5 61 2 3 4 5 61 2 3 4 5 61 2 3 4 5 61 2 3 4 5 61 2 3 4 5 61 2 3 4 5 61 2 3 4 5 61 2 3 4 5 61 2 3 4 5 61 2 3 4 5 61 2 3 4 5 6
0.56
0.830.94
1.371.581.90
3.534.265.14
21.12
kbp 1 2 3 4 5 6
0.56
0.830.94
1.371.581.90
3.534.265.14
21.12
kbp1 2 3 4 5 6
A B C
pNOK0012
plasmid
1
606
1211
1816
2421
3026
3631
4236
4841
5446
pNOK CIB vector
PstI 1743
BamHI 2839
SacI 3858
EcoRI 1733
EcoRI 3261HindIII 2522
SmaI 2278
StuI 1227
XbaI 1545
XhoI 2004
XmaI 2276
XmnI 5744
NPT II gene
Ori
Bla gene KpnI 658
ParB UP
ParB1 DN
pNOk parB1vector
1 2 3 4 5 61 2 3 4 5 61 2 3 4 5 61 2 3 4 5 61 2 3 4 5 61 2 3 4 5 61 2 3 4 5 61 2 3 4 5 61 2 3 4 5 61 2 3 4 5 61 2 3 4 5 61 2 3 4 5 6
0.56
0.830.94
1.371.581.90
3.534.265.14
21.12
kbp 1 2 3 4 5 6
0.56
0.830.94
1.371.581.90
3.534.265.14
21.12
kbp1 2 3 4 5 6
A B C
pNOK0012
plasmid
Up/Dn
Fragment
( ~1kbp)
nptII (960bp)
parB1 (867 bp)
parB1 internal
(560bp)
A B C(B) (C)
(A)
Fig 3.2.12: Generation of ΔparB1 mutant
A) Partial restriction map of pNOK0012. B) Confirmation of pNOK0012 by
restriction analysis: Lane1: lambda HindIII / EcoRI marker. Lane2: pNOK0012

134
double digested with KpnI / PstI. Lane 3: pNOK0012 double digested with KpnI
and SacI. Lane 4: pNOK0012 double digested with BamHI and SacI. Lane 5:
pNOK0012 digested with BamHI. Lane 6: pNOK0012undigested plasmid. C)
Confirmation of Mutant by PCR analysis: Lane 1: λ HindIII / EcoR I marker.
Lane 2: Amplification of parB1 gene full length from wild type D.radiodurans.
Lane 3: The parB1 gene amplification using internal primers from wild type
D.radiodurans. Lane 4: Amplification of parB1 gene using internal primers from
∆ParB1 mutant. Lane 5: Amplification of nptII cassette from ∆ParB1 mutant
Lane 6. Amplification of parB1 gene using internal reverse external forward
primers in ∆ParB1 mutant.
Micrographs of DAPI stained several tetrad cells were seen as triads possibly because
one of the four cells is anucleated and did not survive (Fig 3.2.14 B &C). Also a large
number of tetrad populations showed relatively a low density of DNA in one of the
four compartments of tetrads. These results suggested that ParB1 interacts with
nucleoid i.e. specifically with centromere sequence and helps in genome segregation
in D. radiodurans.
A BA
Fig 3.2.13: Effect of ParB1 deletion on genome maintenance in Deinococcus
radiodurans. A) The parB1 deletion mutant (∆parB1) of D. radiodurans was generated
and its growth pattern at OD.600 nm was compared with D. radiodurans R1 (WT). B)

135
The effect of parB1 deletion on anucleation was examined microscopically and the cells
grown at different time interval were micro graphed under bright field (BF) and cells
stained with DAPI (DAPI). Percentage of anucleation was calculated from the number of
cells missing genome from the total number of cells counted. C) Percentage of
anucleation was measured in wild type (WT) and ∆parB1 mutant cells in a time
dependent, under normal growth conditions.
B
Table3.2: Effect of ParB1 Deletion on anucleation of D. radiodurans.
Growth
period (h)
Wild type
No. of cells
counted
Mean anucleation
Frequency(%) SE
∆ parB1 mutant
No. of cells
counted
Mean anucleation
Frequency(%) SE‗+‗+
2 189 0.60 0.12 280 8.57 1.34
4 203 0 297 9.42 0.98
6 202 0.049 0.021 258 10.07 1.45
8 249 0 255 10.19 1.58
10 295 0 206 13.39 0.87
‗+
‗+
‗+
‗+
‗+
‗+
‗+

136
Cell
dia
mete
r(µ
m)
Growth period (h)
Wild type (D.radiodurans)
parB1 mutant
Fig 3.2.14: Effect of ParB1 deletion on D. radiodurans cell morphology: The effect of
parB1 deletion on anucleation was examined microscopically and the cells grown at
different time intervals were micro graphed under bright field. Cell diameter is calculated
by using Image J software and change in cell diameter of parB1 deletion mutant data is
compared with the wild type cells at different time intervals.
Heterogeneity in cell population showing anucleation could be attributed to toroidal
packaging of all genome replication units and also to the functional redundancy if
contributed by other ParB type proteins encoded on other replication units in this
bacterium.
In vivo localization of ParB1 in D. radiodurans
Different assays like plasmid stabilization and parB1 deletion mutant analysis gave a
strong indication about ParB1 specificity with centromere sequence and its role in
chromosome segregation. In order to study the localization of ParB1 in cells, the
pD12GFP was constructed and GFP-ParB1 fusion was expressed in the cells. The cells
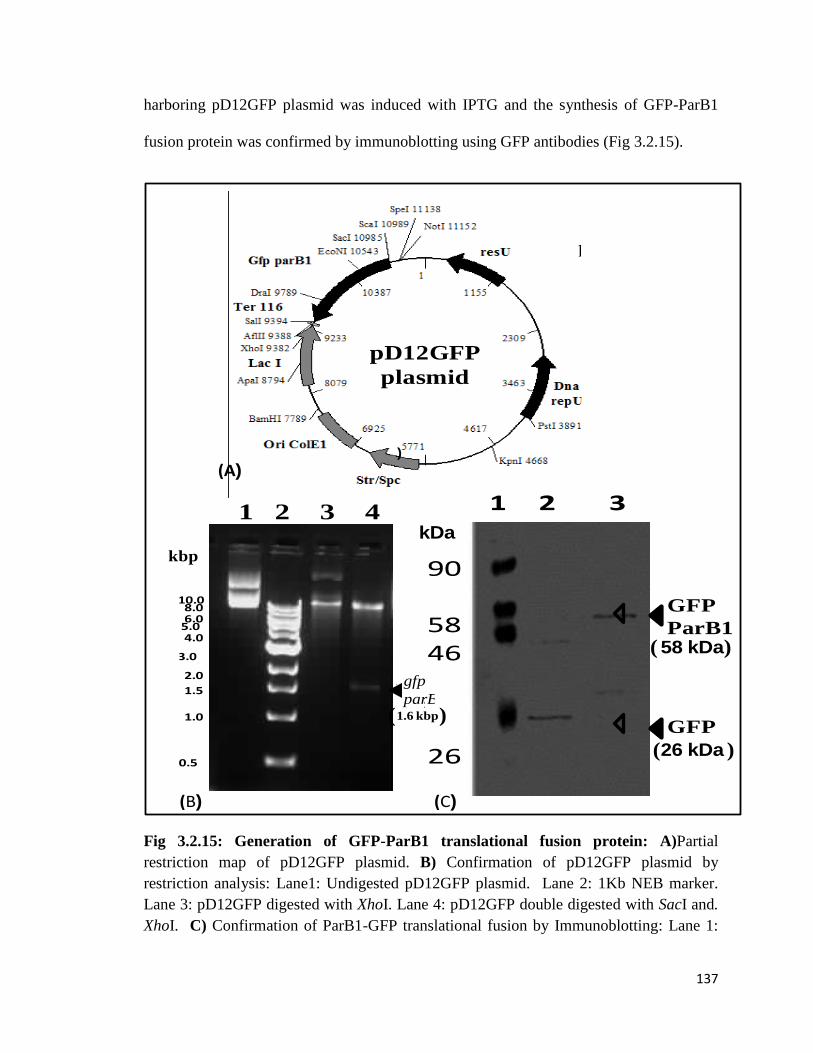
137
harboring pD12GFP plasmid was induced with IPTG and the synthesis of GFP-ParB1
fusion protein was confirmed by immunoblotting using GFP antibodies (Fig 3.2.15).
1 2 3
26
4658
90
Gfp
parB1
Gfp
gfp
parB1
0.5
1.0
1.5
2.0
3.0
4.05.06.08.0
10.0
1 2 3 4
gfp
parB1
1 2 3
26
4658
90
Gfp
parB1
Gfp
gfp
parB1
0.5
1.0
1.5
2.0
3.0
4.05.06.08.0
10.0
1 2 3 4
GFP
ParB1
GFP
A B C
pD12GFP
plasmid
1 2 3
26
4658
90
Gfp
parB1
Gfp
gfp
parB1
0.5
1.0
1.5
2.0
3.0
4.05.06.08.0
10.0
1 2 3 4
gfp
parB1
1 2 3
26
4658
90
Gfp
parB1
Gfp
gfp
parB1
0.5
1.0
1.5
2.0
3.0
4.05.06.08.0
10.0
1 2 3 4
GFP
ParB1
GFP
A B C
pD12GFP
plasmid
kDa
58 kDa
26 kDa
1 2 3
26
4658
90
Gfp
parB1
Gfp
gfp
parB1
0.5
1.0
1.5
2.0
3.0
4.05.06.08.0
10.0
1 2 3 4
gfp
parB1
1 2 3
26
4658
90
Gfp
parB1
Gfp
gfp
parB1
0.5
1.0
1.5
2.0
3.0
4.05.06.08.0
10.0
1 2 3 4
GFP
ParB1
GFP
A B C
pD12GFP
plasmid
kbp
1.6 kbp( )
( )
( )
A BC
1 2 3
26
4658
90
Gfp
parB1
Gfp
gfp
parB1
0.5
1.0
1.5
2.0
3.0
4.05.06.08.0
10.0
1 2 3 4
gfp
parB1
1 2 3
26
4658
90
Gfp
parB1
Gfp
gfp
parB1
0.5
1.0
1.5
2.0
3.0
4.05.06.08.0
10.0
1 2 3 4
GFP
ParB1
GFP
A B C
pD12GFP
plasmid
1 2 3
26
4658
90
Gfp
parB1
Gfp
gfp
parB1
0.5
1.0
1.5
2.0
3.0
4.05.06.08.0
10.0
1 2 3 4
gfp
parB1
1 2 3
26
4658
90
Gfp
parB1
Gfp
gfp
parB1
0.5
1.0
1.5
2.0
3.0
4.05.06.08.0
10.0
1 2 3 4
GFP
ParB1
GFP
A B C
pD12GFP
plasmid
kDa
58 kDa
26 kDa
1 2 3
26
4658
90
Gfp
parB1
Gfp
gfp
parB1
0.5
1.0
1.5
2.0
3.0
4.05.06.08.0
10.0
1 2 3 4
gfp
parB1
1 2 3
26
4658
90
Gfp
parB1
Gfp
gfp
parB1
0.5
1.0
1.5
2.0
3.0
4.05.06.08.0
10.0
1 2 3 4
GFP
ParB1
GFP
A B C
pD12GFP
plasmid
kbp
1.6 kbp( )
( )
( )
A BC
(A))
(B) (C)
Fig 3.2.15: Generation of GFP-ParB1 translational fusion protein: A)Partial
restriction map of pD12GFP plasmid. B) Confirmation of pD12GFP plasmid by
restriction analysis: Lane1: Undigested pD12GFP plasmid. Lane 2: 1Kb NEB marker.
Lane 3: pD12GFP digested with XhoI. Lane 4: pD12GFP double digested with SacI and.
XhoI. C) Confirmation of ParB1-GFP translational fusion by Immunoblotting: Lane 1:
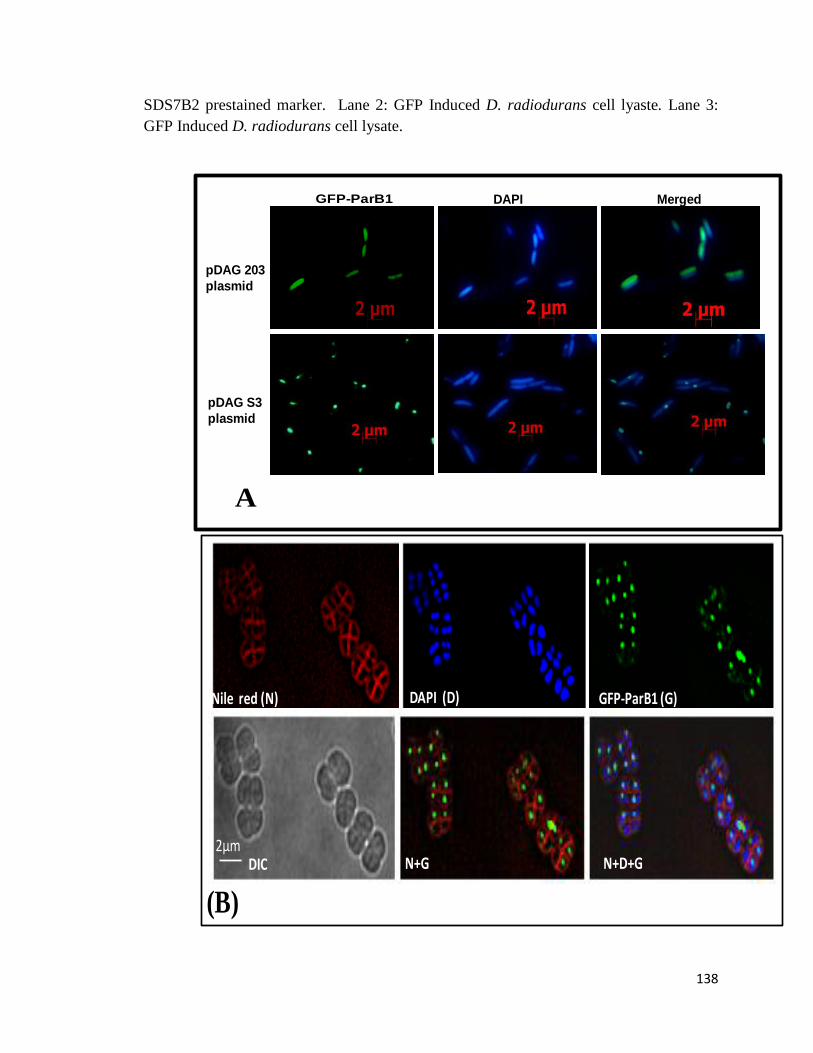
138
SDS7B2 prestained marker. Lane 2: GFP Induced D. radiodurans cell lyaste. Lane 3:
GFP Induced D. radiodurans cell lysate.
ParBGFP DAPI Merged
pDAG 203
plasmid
pDAG S3
plasmid
A
GFP-ParB1
Nile red (N) DAPI (D) GFP-ParB1 (G)
N+G N+D+G2µm
(B)
DIC

139
Fig 3.2.16. Interaction of GFP-ParB1 with nucleoid. GFP-ParB1 were expressed by
inducing with IPTG Culture was photographed for GFP fluorescence (GFP- ParB1) as
(G) and cells stained with DAPI (D) and Nile red (N). These images were merged
(Merged) to localize the position of GFP spot on nucleoid. (A) E. coli cells harboring
pDAG203 vector (pDAG) and pDAGS3 (pDAGS3), with IPTG. (B) D. radiodurans. (C)
Statistical analysis of GFP- ParB1 localization with in D. radiodurans.
Microscopic examination of D. radiodurans cells expressing GFP-ParB1 fusion showed
the presence of at least one fluorescent focus per cell, which was not observed in wild
type cells harboring p11559- GFP vector control. Staining cells with DAPI checked
localization of GFP-ParB1. Overlapping the micrographs of GFP and DAPI fluorescence
showed that GFP-ParB1 formed foci directly on nucleoid of Deinococcus cells (Fig
3.2.16 b). On the other hand when GFP-ParB1 fusion was expressed in E. coli, GFP-
ParB1 was found distributed throughout the cells and no foci formation was observed in
C
140
wild type cells. Functional complementation of segS3 element using pDAGS3, GFP-
ParB1 showed the discrete foci formation on DNA, which was not observed in cells
harboring pDAG203 as a vector control (Fig 3.2.16a).
These results suggest that ParB1 nucleates on segS3 sequence present on plasmid in E.
coli and on genome in D. radiodurans. Statistical analysis of GFP – ParB1 localization
was done by using Image J software. Results indicated GFP-ParB1 localized at two
distinct positions with in the cell i.e. mid cell position or ¾ position (Fig 3.2.16b).
Role of ParA1 in chromosome segregation
Different bacterial segregation models (plasmid or chromosome) represent movement of
paired or duplicated plasmid or chromosome because of the functional interaction
between ParB and ParA protein. Our in vitro data indicated that ParA1 interacts with
ParB nucleoprotein complexes while in vivo results provided evidence on plasmid
stabilization by the ParA1, ParB1 and parS in ΔsopABC mini-F plasmid derivative
pDAGS3 in E. coli. However, the mechanisms by which ParA1 and ParB1 stabilize
unstable plasmid were not clear. Previous models showed that plasmids are stabilized due
to involvement of ParA protein and hence we further looked for functioning of ParA1
protein. In order to investigate the role of ParA1 in segregation, we checked the
localization as well as dynamics of ParA1 protein in cells harboring cognate partitioning
system.
Localization of ParA1 protein:
For GFP-ParA1 localization studies, the pHJ0013 plasmid (Plac-gfp-parA1) or
pDSWparA1B1 plasmid (Placgfp-parA1parB1) were generated and transformed in E. coli

141
JM109. These cells were grown till exponential phase and induced with 100 µM IPTG.
The synthesis of GFP-ParA1 fusion protein was confirmed by immunoblotting using GFP
antibodies.
ParA1
ParA1+
ParB1
ParA1+
ParB1+
pDAGS3 Plasmid
GFP DAPI Merged
ParA1 +
ParB1+pDAGS3plasmid
pDAGS3
plasmid
A
B
C
Fig 3.2.17: Localization of GFP-ParA1 in E. coli cells: E. coli cells expressing GFP-
ParA1 (A) and GFP-ParA1 along with ParB1 were transformed with pDAG203 vector
(B) and pDAGS3 plasmid (C) and micro graphed for GFP, DAPI fluorescence. Both
images were merged.
Cells were stained with 4'-6-diamidino-2-Phenylindole (DAPI) and mounted on 1%
Agarose slant and microscopy was performed as described in methods. Results showed
that the GFP-ParA1 fusion protein is co-localized with the E. coli nucleoid (Fig 3.2.17a)
and also the localization of GFP-ParA1 has not changed in presence of ParB1 (Fig 3.2.17
b). Distribution of GFP- ParA1 was measured by Image J software (Fig 3.2.17.d).

142
10 20 30 40 50
50
100
150
200
50
100
150
200
10 20 30 40 50 10 20 30 40 50
40
20
60
80
100
10 20 30 40 50
40
20
60
80
100
10 20 30 40 50
50
100
150
200
50
100
150
200
10 20 30 40 50
50
100
150
200
10 20 30 40 50 60 10 20 30 40 50 60
50
100
150
200
20
40
60
80
100
10 20 30 40
20
40
60
80
100
10 20 30 40
20
40
60
80
100
10 20 30 40
20
10 20 30 40
40
60
80
100
20
40
60
80
100
10 20 30 40 50
20
40
60
80
100
10 20 30 40 50
20
40
60
80
100
10 20 30 40 50
20
40
60
80
100
10 20 30 40 50
Flor
esce
nce
Inte
nsity
(a.u
)
Cell length (Pixels)( D )
40
80
160
120
200
10 20 30 40
40
80
160
120
200
10 20 30 40
40
80
160
120
200
10 20 30 40
40
80
160
120
200
10 20 30 40
40
80
160
120
200
10 20 30 40
40
80
160
120
200
10 20 30 40
40
80
160
120
200
10 20 30 40
40
80
160
120
200
10 20 30 40
40
80
160
120
200
10 20 30 40 50
40
80
160
120
200
10 20 30 40 50
40
80
160
120
200
10 20 30 40 50
40
80
160
120
200
10 20 30 40 50
40
80
160
120
200
10 20 30 40 50
40
80
160
120
200
10 20 30 40 50
40
80
160
120
200
10 20 30 40 50
40
80
160
120
200
10 20 30 40 50
40
80
160
120
200
10 20 30 40 50
120
40
80
160
200
10 20 30 40 50
40
80
160
120
200
10 20 30 40
40
80
160
120
200
10 20 30 40
20
4060
80
100
10 20 30 40 50
120
20
4060
80
100
10 20 30 40 50
120
20
4060
80
10 20 30 40 50
120100
20
4060
80
10 20 30 40 50
120100
20
4060
80
100
10 20 30 40 50
120Flo
res
ce
nc
e I
nte
ns
ity (
a.u
)
Cell length (Pixels)( E )Cell length
(Pixels)
Cell length
(Pixels)
GFP-ParA1
- pDAG 203
GFP-ParA1+ParB1
- pDAG S3
Fig 3.2.17(d). Statistical analysis of GFP-ParA1 localization throughout the length of E.
coli cells. The GFP fluorescent images taken in Figure 3.2.17 were scanned, Florescence
intensity was measured by using Image – J software.
Dynamics of ParA1
GFP-ParA1 was expressed in E.coli JM109 strains containing pDAG segS1 (pDAG S1),
pDAG segS2 (pDAG S2), and pDAG segS3 (pDAG S3) plasmids individually and the
dynamics of the ParA1 was studied using Time lapse microscopy (Fig 3.2.19) GFP-

143
ParA1 has shown oscillation from one end to another but degree of movement is varied
for different segS elements.
A pDAG 203 plasmid pDAG S1 plasmidB
GFP-ParA1 had shown slow movement or no movement with pDAGS1 (Fig 3.2.18b),
and faster dynamics with pDAG S2 plasmid and pDAG S3 (Fig 3.2.18c, d) compared to
pDAG or pDAG S1 plasmid. Thus the dynamics of GFP ParA1inside the cells in
presence of with segS elements, revealed that these elements indeed as centromere
sequences for Deinococcus and ParB-segS3 nucleoprotein complex is essential for
dynamics of ParA1.
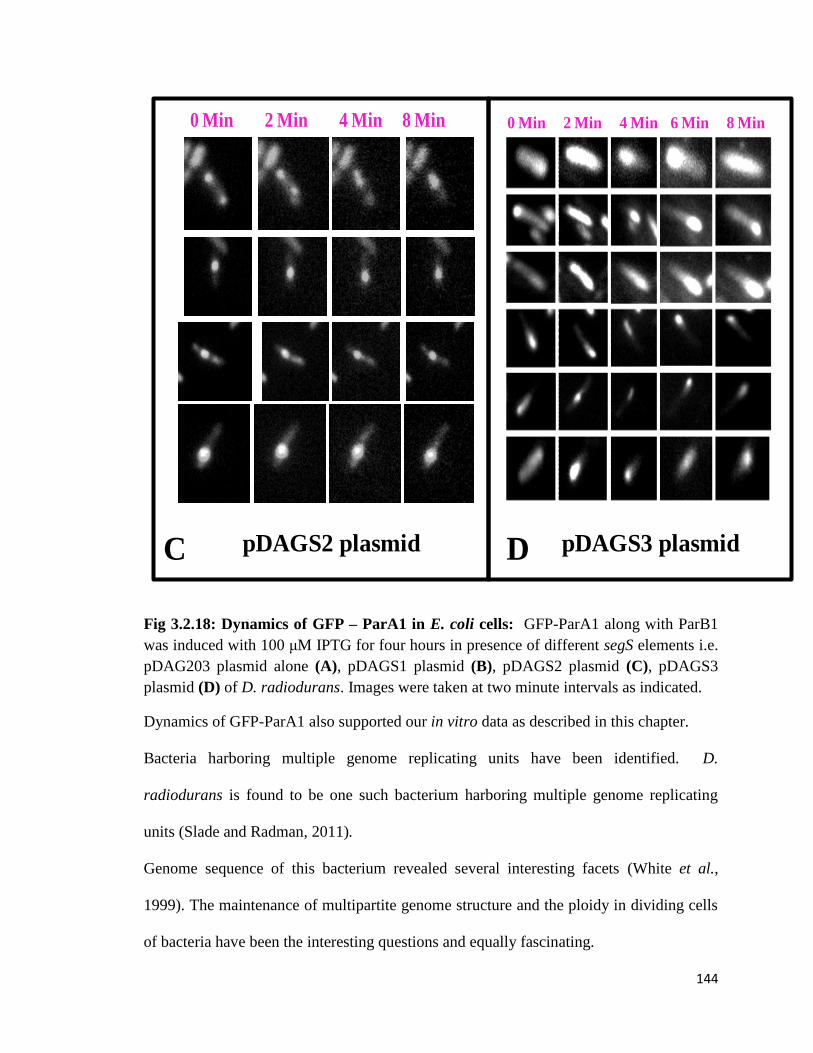
144
pDAG seg S2
0 Min 2 Min 4 Min 6 Min 8 Min
pDAG segS3
0 Min 2 Min 4 Min 8 Min
pDAG segS3
0 Min 2 Min 4 Min 8 Min
pDAG segS3
0 Min 2 Min 4 Min 8 Min
pDAG seg S2
0 Min 2 Min 4 Min 6 Min 8 Min
pDAG segS3
0 Min 2 Min 4 Min 8 Min
pDAG segS3
0 Min 2 Min 4 Min 8 Min
pDAG segS3
0 Min 2 Min 4 Min 8 Min
C pDAGS2 plasmid pDAGS3 plasmidD
Fig 3.2.18: Dynamics of GFP – ParA1 in E. coli cells: GFP-ParA1 along with ParB1
was induced with 100 μM IPTG for four hours in presence of different segS elements i.e.
pDAG203 plasmid alone (A), pDAGS1 plasmid (B), pDAGS2 plasmid (C), pDAGS3
plasmid (D) of D. radiodurans. Images were taken at two minute intervals as indicated.
Dynamics of GFP-ParA1 also supported our in vitro data as described in this chapter.
Bacteria harboring multiple genome replicating units have been identified. D.
radiodurans is found to be one such bacterium harboring multiple genome replicating
units (Slade and Radman, 2011).
Genome sequence of this bacterium revealed several interesting facets (White et al.,
1999). The maintenance of multipartite genome structure and the ploidy in dividing cells
of bacteria have been the interesting questions and equally fascinating.

145
10 20 30 40 50
50
100
150
200
50
100
150
200
10 20 30 40 50
10 20 30 40 50
40
20
60
80
100
10 20 30 40 50
40
20
60
80
100
10 20 30 40 50
40
20
60
80
100
Flo
res
ce
nc
e I
nte
ns
ity
(a.u
)
Cell length (Pixels)
0
min
2
4
6
8
Time
(mins)
0
2
4
6
8
pDAG 203 pDAGS2/3
0
Time
(mins)
4
6
8
10
Cell length
(Pixels)
Flo
rescen
ce In
ten
sit
y (a
.u)
2
20 40 60 80 100 120
40
80
120
20 40 60 80 100 120
40
80
120
20 40 60 80 100 120
40
80
120
20 40 60 80 100 120
40
80
120
20 40 60 80 100 120
40
80
120
20 40 60 80 100 120
40
80
120
Time
pDAGS3
Fig 3.2.19: GFP –ParA1 florescence distribution in E. coli : The Florescence intensity
of GFP – ParA1 was measured in E. coli cells harboring pDAG203 and pDAGS3.
Localization of GFP-ParA1 was measured in time dependent manner and florescence
intensity distribution with in single E.coli cell are represented over here.
Recent studies in other multichromosome containing bacteria like V. cholerae also
demonstrated both chromosome I and II encode independent genome segregation
systems. This study has brought forth some interesting findings to suggest the role of
„Par‟ proteins in segregation of DNA in multichromosome bacteria. Chromosome I of D.
radiodurans contains one functional partitioning system that includes the three
chromosomal type centromeric sequences named as „segS1-segS3’ and the partitioning
proteins ParA1/ParB1. We demonstrated the roles of these elements in segregation of

146
unstable mini-F plasmid as well as monitoring the ParA1 dynamics and functional
significance of ParB1 in D. radiodurans.
Chromosome I „Par‟ proteins probably obey general principles of known „Par‟
proteins e.g. ParA interacts with the DNA and when it encounters to ParB nucleoprotein
complex, it stimulates its ATPase activity. As a result the duplicated DNA is pulled to
opposite poles. However, the possibility of other types of mechanisms helping in
segregation of secondary genomes cannot be ruled out. Nearly 8-13 % loss of nucleoid in
ΔparB1 mutant of D. radiodurans in comparison of 1% in normal cells (Table
3.2) further supported the role of ParB1 in genome maintenance. Molecular interaction
studies between the ParA1/ParB1 and segS elements showed that ParA1 could interact
with dsDNA and there is no formation of higher order structures as evidenced from
sedimentation analysis and light scattering studies. However ParA1 behaved differently
in presence of segS nucleoprotein complex i.e. ATPase activity of ParA1 in presence of
segS3-ParB1 as compared to other centromeric complexes is higher, and the amount of
protein in {segS3-ParB1P} nucleoprotein complex, but not {segS1- ParB1P} / {segS2-
ParB1P} complex especially in presence of ATP. ParA1 polymerization /
depolymerization may be regulated by the levels of its ATPase activity. Both DNA
binding of ParA1 and its polymerization/ depolymerization as a function of its ATPase
activity are the typical characteristics of other Walker type ATPases associated with
genome segregation (Leonard et al., 2004;Leonard et al., 2005;Pratto et al.,
2008;Soberon et al., 2011).
D. radiodurans cells expressing GFP-ParB1 produced foci on nucleoid, and the ∆parB1
mutant similar to other ParB deletion mutant showed effect on the growth and increased
147
percentage of anucleation as compared to D. radiodurans wild type cells. These findings
collectively suggested that both segS elements and „Par‟ proteins encoded on
chromosome I of D. radiodurans are functionally active and play a role in genome
segregation and maintenance of chromosome in this bacterium. GFP-ParA1 in presence
of ParB1 and centromere sequence showed dynamicity, similar to the ParA of pB171
plasmid as well as Soj of B. subtilis. Overall studies indicate (i) the ParA1 as a DNA
binding ATPase, (ii) the ParB1 as a sequence specific centromere binding protein, (iii)
the ATPase activity of ParA1 was stimulated in presence of both ParB1 and dsDNA that
seems to be regulating the dynamics of ParA1 polymerization, (iv) segS elements
function like bacterial centromere‟s for unstable plasmid segregation and ParB1 has a
role in genome maintenance in D. radiodurans. ParA1 dynamics was very fast in
presence of segS3 elements. An attempt was made to generate homozygous deletion
mutant, as cells approaching to homozygous replacement of segS3 with selection marker
loose viability. This might indicate for a strong possibility of segS3 acting as a preferred
centromere during ParAB1 mediated partitioning of chromosome I in D. radiodurans and
segregation of DNA mostly likely by pulling type mechanism.
148
Molecular studies on
chromosome II partitioning
proteins

149
The roles of „Par‟ proteins in chromosome segregation have been understood better in
bacteria containing single set of „Par‟ proteins. The pleiotropic roles of „ParA‟ proteins
have also been demonstrated in functions like, origin localization, cell division and gene
regulation in B. subtilis (Ireton et al., 1994; Lee et al., 2006;Lee et al., 2003;Ogura et al.,
2003; Sharpe and Errington, 1995; Wu and Errington, 2004), cell division and cell cycle
progression in C. crescentus (Mohl et al., 2001), chromosome organization, cell growth,
and motility in P. aeruginosa (Bartosik et al., 2004;Lasocki et al., 2007), cell
morphology in P. putida (Godfrin-Estevenon et al., 2002;Lewis et al., 2002) and cell
division in S. coelicolor (Jakimowicz et al., 2007;Kim et al., 2000). Pleiotropic effects of
„ParA‟ proteins may depend upon the adaptation of bacteria to particular environmental
condition. The involvement of „Par‟ proteins in cell division regulation has been mostly
observed in some bacteria containing single chromosome. Recently, the deletion mutant
of „ParA‟ proteins showed defect in cell division in different bacteria like B. subtilis, C.
crescentus, P. aeruginosa and S. coelicolor. Molecular basis of cell division inhibition
by ParA is not understood.
D. radiodurans harbors four ParA like proteins, which are encoded in an operon and
these proteins belong to weak walker type of ATPase family. Clustal W analysis of D.
radiodurans „Par‟ proteins showed nearly 40 % sequence similarity within these proteins.
Phylogenetic analysis revealed „Par‟ proteins on the accessory chromosome are diverged
from the „Par‟ proteins of primary chromosome (chromosome I of D. radiodurans) as
well as from „Par‟ proteins of other bacteria. Since, ParA2 encoded on chromosome II in

150
D. radiodurans is distinctly different from chromosomal ParA‟s, the functional
characterization of ParA2 has been carried out and reported in this chapter.
3.3. 1 Materials and Methods:
3.3. 1.1 Cloning of recombinant ParA2 protein:
The 780 bp DNA fragment encoding putative ParA (DRA0001) type protein on
chromosome II (ParA2) of D. radiodurans was PCR amplified from genomic DNA using
dr_A0001F and dr_A0001R primers. The PCR product was digested, cloned at NdeI-
XhoI sites in pET28a+ to yield pETA2 and confirmed by restriction digestion as well as
by sequencing. For making CFP translation fusion, the drA0001 was PCR amplified
using forward primer parA2CF and reverse primer parA2CR (Table ) having HindIII
and BamHI sites incorporated at the 5‟ of the primers. PCR product was cloned at
HindIII and BamHI sites in pAMCYAN (Clonetech Inc) to yield pA2CFP. The
pETA2 WAS transformed into E. coli BL21 DE3 pLysS for the expression of recombinant
protein while PA2CFP WAS transformed into E. coli MG1655 strain. The inducible
expression of his tag recombinant ParA2 was confirmed by SDS -PAGE and ParA2-CFP
by immunoblotting using GFP antibodies.
3.3.1.2 Expression and purification of recombinant proteins:
The recombinant pETA2 plasmid is transformed into E. coli BL21 (DE3) pLysS, induced
with 250 µM IPTG, 6x histidine tagged protein was purified by nickel -affinity
chromatography under denaturation condition as mentioned in material and method
section. In brief, the IPTG induced cell pellet was directly suspended in Cell Lytic
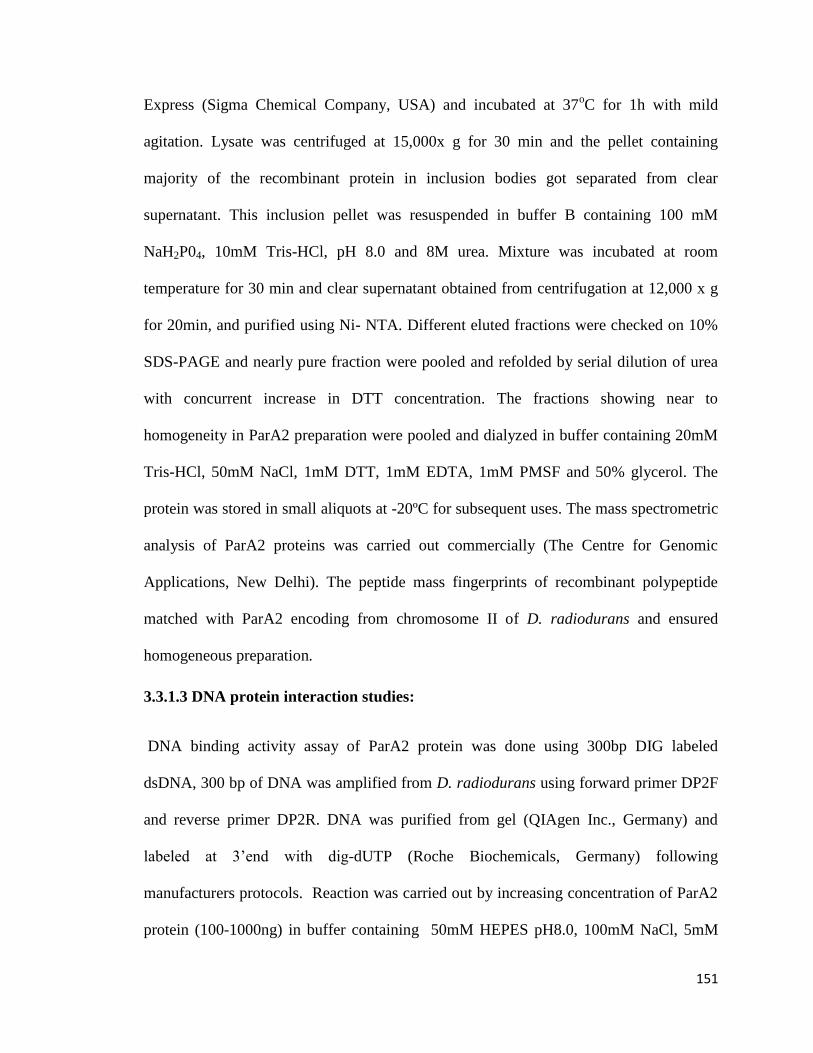
151
Express (Sigma Chemical Company, USA) and incubated at 37oC for 1h with mild
agitation. Lysate was centrifuged at 15,000x g for 30 min and the pellet containing
majority of the recombinant protein in inclusion bodies got separated from clear
supernatant. This inclusion pellet was resuspended in buffer B containing 100 mM
NaH2P04, 10mM Tris-HCl, pH 8.0 and 8M urea. Mixture was incubated at room
temperature for 30 min and clear supernatant obtained from centrifugation at 12,000 x g
for 20min, and purified using Ni- NTA. Different eluted fractions were checked on 10%
SDS-PAGE and nearly pure fraction were pooled and refolded by serial dilution of urea
with concurrent increase in DTT concentration. The fractions showing near to
homogeneity in ParA2 preparation were pooled and dialyzed in buffer containing 20mM
Tris-HCl, 50mM NaCl, 1mM DTT, 1mM EDTA, 1mM PMSF and 50% glycerol. The
protein was stored in small aliquots at -20ºC for subsequent uses. The mass spectrometric
analysis of ParA2 proteins was carried out commercially (The Centre for Genomic
Applications, New Delhi). The peptide mass fingerprints of recombinant polypeptide
matched with ParA2 encoding from chromosome II of D. radiodurans and ensured
homogeneous preparation.
3.3.1.3 DNA protein interaction studies:
DNA binding activity assay of ParA2 protein was done using 300bp DIG labeled
dsDNA, 300 bp of DNA was amplified from D. radiodurans using forward primer DP2F
and reverse primer DP2R. DNA was purified from gel (QIAgen Inc., Germany) and
labeled at 3‟end with dig-dUTP (Roche Biochemicals, Germany) following
manufacturers protocols. Reaction was carried out by increasing concentration of ParA2
protein (100-1000ng) in buffer containing 50mM HEPES pH8.0, 100mM NaCl, 5mM

152
MgCl2, 30mM Na-Acetate and nearly 10 picomoles of labeled dsDNA substrate.
Reaction was incubated at 37oC for 20 min in a 20µl reaction. Mixtures were separated
on 5 % native PAGE and digoxigenin labeled DNA probe was immuno blotted with anti-
Digoxigenin-AP antibodies (Roche biochemical‟s Germany) and signals were detected
using NBT / BCIP (Roche Biochemical) color reagent using manufacturer‟s protocol.
3.3.1.4 Measurements of ATPase and GTPase activities:
ATPase activity of recombinant ParA2 was checked using a modified protocol as
described in (Kota et al., 2010). In brief, reaction was carried out with increasing
concentrations of ParA2 (0.1 to 1µg) in 50mM HEPES pH 8.0, 100mM NaCl, 5mM
MgCl2 and 30mM Sodium acetate, incubated at 37oC for 20 min with and without DNA.
Reaction was stopped using malachite green reagent and ATP hydrolysis was indirectly
measured by checking release of inorganic phosphate at O.D 630nm and levels of Pi
quantified using standard procedure essentially described in (Yakunin et al., 2004).
ATPase activity was calculated as nmoles Pi formed per min/ µg protein. For studying
the effect of dsDNA on ATPase activity of ParA2, the dsDNA was pre-incubated with
ParA2 and then incubated with ATP for different time period and assayed as described
above. Similarly GTPase activity of FtsZDr (D. radiodurans) was measured as the release
of Pi from GTP and estimated as described above. In brief, ~4 µg purified recombinant
FtsZ was incubated with 1mM GTP for 1h at 37oC in reaction mixture containing 25mM
PIPES, pH 7.6, 50mM KCl, 5mM MgCl2 and 1mM GTP. The reaction was stopped with
malachite green reagent and release of inorganic Pi was measured as described above.
For studying the effect of ParA2 on GTPase activity of FtsZ, the above reaction mixture

153
was incubated with FtsZ with and without 3µg ParA2, 200ng DNA and 1mMATP as
required. The DNA, ATP, ParA2 and FtsZ controls were processed in parallel under
identical conditions.
3.3.1.5 Sedimentation Analysis:
For studying the effect of ParA2 on FtsZ polymerization, ~2µg FtsZ protein was
incubated in 25mM PIPES, pH 7.6, 50mM KCl, 5mM MgCl2 and then ~1.5µg ParA2 was
added along with 200ng dsDNA and 1mMATP. These mixtures were incubated at 37oC
for 30 min and centrifuged at 20,000g for 20 min. Both pellets and supernatants were
separated and analyzed on 12% SDS-PAGE. Protein bands were visualized with
Commasie staining and quantified by densitometric scanning.
3.3.1.6 Construction of parB2 deletion mutant in D. radiodurans:
pNOKA0002 was made to generate parB2 deletion mutant in D. radiodurans,
pNOKA0002 was constructed by amplifying 1kb upstream to DRA0002 ORF was PCR
amplified using drA0002UF and drA0002UR primers, similarly of 1kb downstream to
DRA0002 using drA0002DF and drA0002 DR primers for downstream fragment (Table
2.4) and PCR amplified products were digested and cloned at ApaI-EcoRI and BamHI-
SacI sites respectively. The recombinant plasmid pNOKA0002 was linearized using
XmnI restriction enzyme and linearized plasmid was transformed into D. radiodurans as
mentioned in material method section. Transformants were selected through several
generations to obtain homozygous replacement of parB2 with nptII cassette, generation
of homozygous mutant was confirmed by PCR amplification of parB2 using internal
primers parB2iF and parB2iR.

154
3.3.1.7 Microscopic studies:
ParA2-CFP is expressed from pA2CFP plasmid in E. coli MG1655 strain, culture was
grown to 0.3 O.D and induced with 100 µm IPTG, cell were grown up to 0.6 O.D, 1ml of
cells were taken and DAPI (2µg µl-1
) was added and incubated for 30 min. To confirm
ParA2 co-localization with the nucleoid, the chloramphenicol (100µg µl-1
) was added 1hr
before 0.6 O.D culture, stained cells with DAPI as mentioned above. Fluorescence
microscopy of E. coli cells was carried using Zeiss Axio Imager (Model- LSMS10
META, Carl Zeiss) equipped with Zeiss AxioCam HRm camera. Both CFP and DAPI
fluorescence‟s were imaged. Micrographs were superimposed for localization of ParA2-
CFP on DAPI stained nucleoid.
Effect of parB2 deletion on anucleation in D. radiodurans was carried out using, both
∆parB2 mutant and wild type cells, 1ml of exponential growing cells of wild type as well
as mutant were taken and stained with 0.2µg µl-1
of DAPI was added and incubated for
30 min and cells were analyzed under florescence microscope. In brief, the 5µl cells
expressing these proteins in different combinations were mounted onto 1% agarose
coated slide and pictures were taken on Axio Imager M1 Florescence Microscope (Carl
Zeiss) in different combinations and the images were analyzed using Axiovision 4.8 Rel
software. Final image preparation was done using Adobe Photoshop CS3 software. Cell
length measurements were done using Axiovision 4.8 software graph was analyzed and
plotted by using Graph pad prism (Donovan et al., 2010).
3.3.1.8 Co-localization of ParA2-CFP and FtsZ-YFP and Fluorescence microscopic
studies:

155
Co-expression of ParA2 and FtsZEc YFP was achieved by co-transforming pETA2 and
pLAU85 in E. coli cells. These transformed cells were grown in LB supplemented with
kanamycin (25µg /ml) and ampicillin (100µg /ml) overnight, expression of ParA2
proteins was achieved with 200µM IPTG while FtsZEc YFP with 0.005% arabinose using
standard protocols (Sambrook J and Russell DW, 2001). Expression of recombinant
proteins were confirmed by immunoblotting using respective antibodies as described
earlier (Khairnar et al., 2007). 1ml of exponential growing cells were taken and
Fluorescence microscopy of E. coli cells were carried out as described earlier (Weiss et
al., 1999) using Axio Imager M1 Florescence Microscope. In brief, the 0.3 O.D E. coli
cells were induced for 4hr with 200µM IPTG, these IPTG induced cells were further
treated with 0.005% arabinose half an hour before fluorescence microscopic experiments
was carried out.
3.3.2.0 Results:
3.3.2.1 The parB2 mutant of D. radiodurans showed pleiotropic phenotypes:
In silico analysis indicated that ParA2 and ParB2 are diverged from the common pools of
chromosomal, plasmid and other cell division regulatory „Par‟ proteins. To understand
the role of ParB2 in growth and genome maintenance of this bacterium, we generated
parB2 deletion mutant. For that, the ~1K bp upstream and downstream regions to the
DRA0002 (parB2 gene) encoding genomic fragment were PCR amplified and cloned at
pNOK vector to generate the recombinant plasmid pNOKA0002 (Fig3.3.1a), which was
analyzed on 1% agarose gel after restriction digestion. The release of right size fragments
was evident (Fig3.3.1b). The pNOKA0002 recombinant plasmid was linearized and
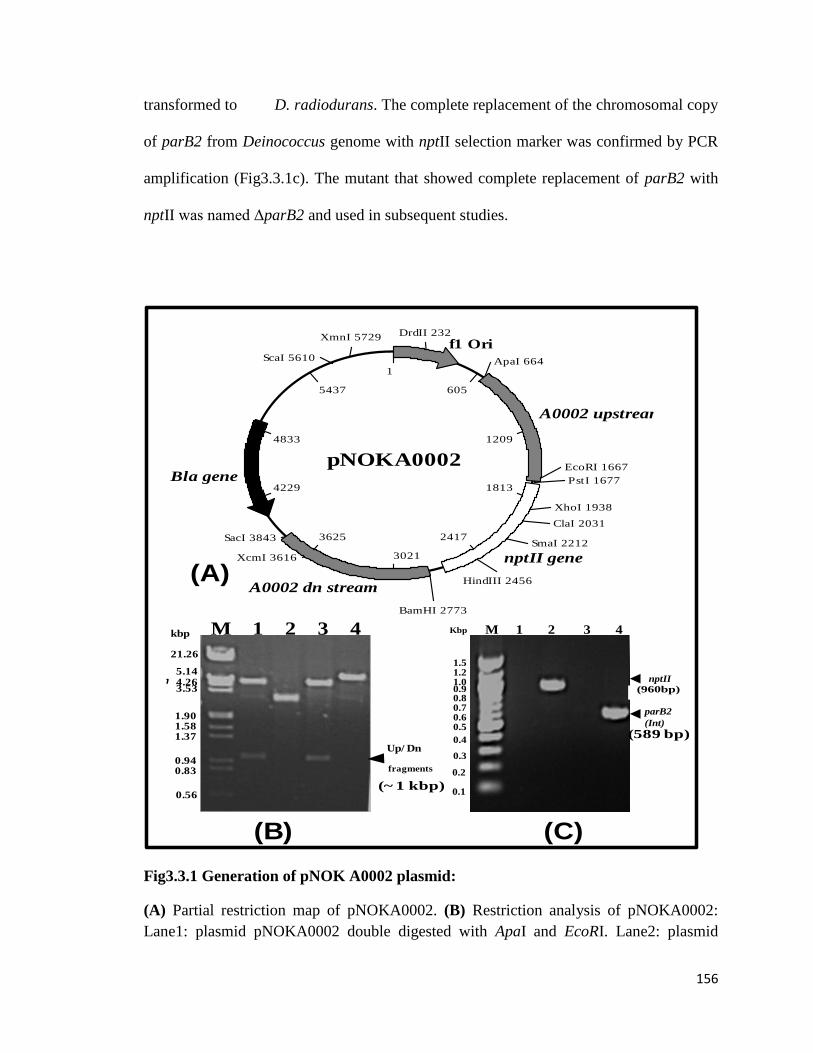
156
transformed to D. radiodurans. The complete replacement of the chromosomal copy
of parB2 from Deinococcus genome with nptII selection marker was confirmed by PCR
amplification (Fig3.3.1c). The mutant that showed complete replacement of parB2 with
nptII was named ΔparB2 and used in subsequent studies.
0.1
0.2
0.3
0.4
0.50.60.70.80.91.01.21.5
Kbp M 1 2 3 4
nptII
parB2
(Int)
kbp
0.56
0.830.94
1.371.581.90
3.534.265.14
21.26
M 1 2 3 4
Up/ Dn
fragments
A B C
1
605
1209
1813
2417
3021
3625
4229
4833
5437
pNOKA0002
ApaI 664
EcoRI 1667
BamHI 2773
SacI 3843
A0002 up stream
A0002 upstream
A0002 dn stream
nptII gene
f1 Ori
Bla gene
ClaI 2031
DrdII 232
HindIII 2456
PstI 1677
ScaI 5610
SmaI 2212
XcmI 3616
XmnI 5729
XhoI 1938
(900bp)
(589 bp)
(~ 1 kbp)
(960bp)
(A)
(B) (C)
Fig3.3.1 Generation of pNOK A0002 plasmid:
(A) Partial restriction map of pNOKA0002. (B) Restriction analysis of pNOKA0002:
Lane1: plasmid pNOKA0002 double digested with ApaI and EcoRI. Lane2: plasmid

157
pNOKA0002 digested with KpnI and scaI. Lane3: pNOKA0002 plasmid digested with
BamHI. Lane4: pNOKA0002 plasmid is digested with XmnI. Lane M: DNA size marker
λ DNA Hind III & EcoRI digested.
(C) Confirmation of parB2 deletion in bacterial genome: The genomic DNA from
prospective mutant and wild type (R1) used as template for PCR amplification of nptII
cassette and parB2 gene. Lane M: 100 bp ladder. Lane1: Amplification of nptII cassette
in wild type. Lane 2: nptII cassette amplification in parB2 mutant. Lane3: PCR
amplification of parB2 gene by using parB2iF and parB2iR primers in parB2 mutant
cells. Lane4: PCR amplification of parB2 gene using parB2iF and parB2iR primers in D.
radiodurans wild type cells.
Effect of parB2 deletion on various phenotypes of D. radiodurans
The parB2 deletion mutant was generated and the effect of parB2 deletion on growth as
well as genome stability was checked. The functional role of ParB2 on the growth was
monitored by measuring O.D 600 nm. Mutant cells showed a significant reduction in the
turbidity (Fig.3.3.2) as compared with wild type D. radiodurans.
Reduction in growth can be correlated with loss of chromosome. Therefore, the
anucleation phenotype of the mutant was checked. The 1ml of exponential growing
culture of D. radiodurans wild type and ∆parB2 was stained by DAPI as mentioned in
methods, micrographs of nearly 1000 cells were observed. From analysis of the results
we concluded that ~6% cells have shown anucleation phenotype i.e. loss of nucleoid
within the mutant cells (Fig 3.3.3)
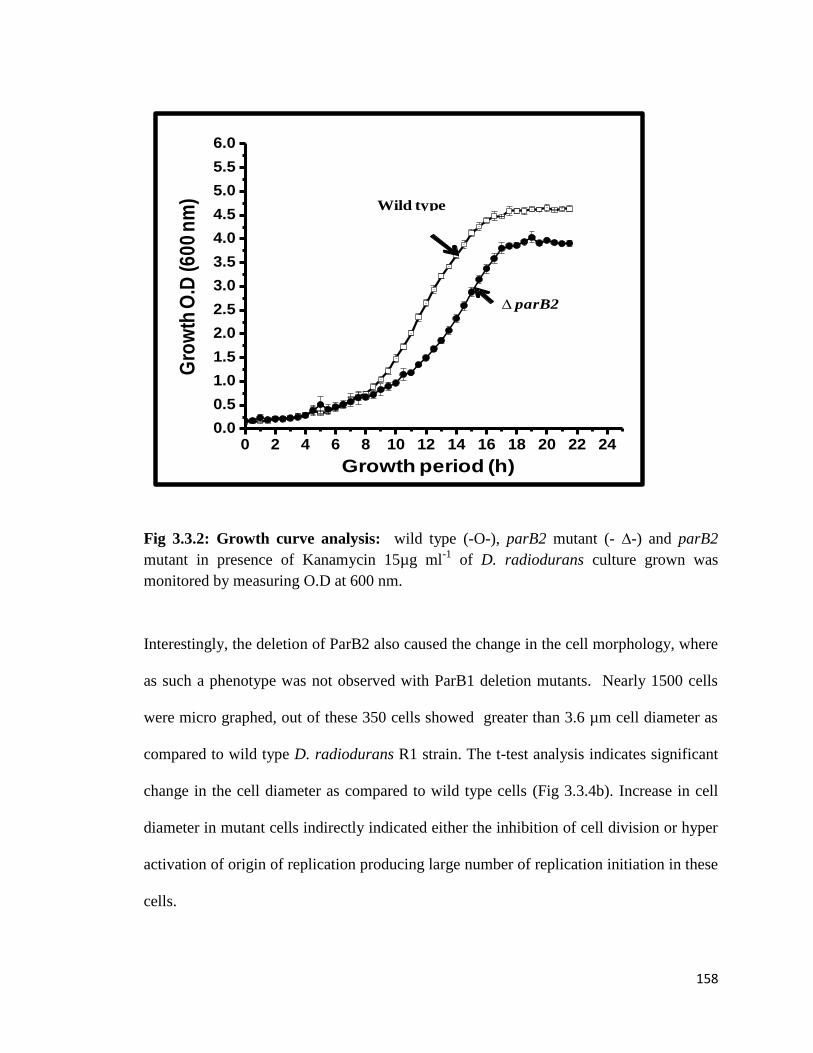
158
0 2 4 6 8 10 12 14 16 18 20 22 240.0
0.5
1.0
1.5
2.0
2.5
3.0
3.5
4.0
4.5
5.0
5.5
6.0
Wild type (D.radiodurans)
(D.radiodurans)∆ parB2
Growth period (h)
Gro
wth
O.D
(6
00
nm
)
Fig 3.3.2: Growth curve analysis: wild type (-O-), parB2 mutant (- ∆-) and parB2
mutant in presence of Kanamycin 15µg ml-1
of D. radiodurans culture grown was
monitored by measuring O.D at 600 nm.
Interestingly, the deletion of ParB2 also caused the change in the cell morphology, where
as such a phenotype was not observed with ParB1 deletion mutants. Nearly 1500 cells
were micro graphed, out of these 350 cells showed greater than 3.6 µm cell diameter as
compared to wild type D. radiodurans R1 strain. The t-test analysis indicates significant
change in the cell diameter as compared to wild type cells (Fig 3.3.4b). Increase in cell
diameter in mutant cells indirectly indicated either the inhibition of cell division or hyper
activation of origin of replication producing large number of replication initiation in these
cells.
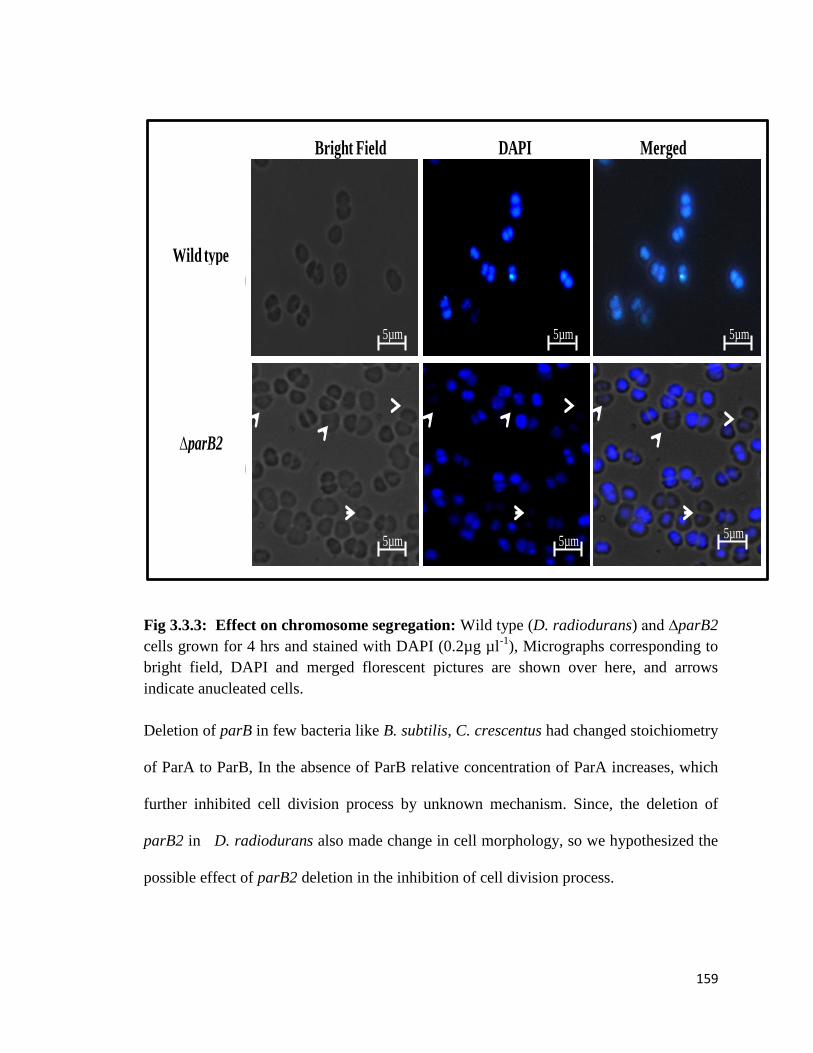
159
Bright Field DAPI Merged
Wild type
(D.radiodurans)
∆parB2
(D.radiodurans)
5µm 5µm 5µm
5µm5µm 5µm
Fig 3.3.3: Effect on chromosome segregation: Wild type (D. radiodurans) and ∆parB2
cells grown for 4 hrs and stained with DAPI (0.2µg µl-1
), Micrographs corresponding to
bright field, DAPI and merged florescent pictures are shown over here, and arrows
indicate anucleated cells.
Deletion of parB in few bacteria like B. subtilis, C. crescentus had changed stoichiometry
of ParA to ParB, In the absence of ParB relative concentration of ParA increases, which
further inhibited cell division process by unknown mechanism. Since, the deletion of
parB2 in D. radiodurans also made change in cell morphology, so we hypothesized the
possible effect of parB2 deletion in the inhibition of cell division process.

160
Perc
en
tag
e o
f cell
s
Cell diameter (µm)
∆parB2 -D.radiodurans
2.8 0.08
Perc
en
tag
e o
f cell
s
Cell diameter (µm)
Wild type
D.radiodurans
2.08 0.07+_
Wild type
D.radiodurans
∆parB2 D.radiodurans
+_
A B
Fig3.3.4: Effect of ParB2 on cell morphology: A) Micrographs of 1ml of exponential
growing cells of D. radiodurans wild type and ∆parB2 cells are observed using Axio
Imager M1 Florescence Microscope. B) Cell diameter of individual cell was measured
using Image J software and plotted by using Graph pad prism 4.8 software. Mutant cells
appeared as increased in cell diameter.
In order to study the cell division process and the mechanism(s) underlying parB2
deletion on cell division, the exponentially growing parB2 mutant and wild type cells
were stained with the Nile red and DAPI separately and cells were micro graphed
(Fig3.3.5). Intriguingly, nearly 60% of parB2 mutant cells were found with septum
trapped chromosome when as compared with wild type D. radiodurans (Fig3.3.5). In

161
addition, some cells had shown increase in the nucleoid content as well. Since, parB2
deletion would not have affected ParA2 expression in parA2B2 operon, we argued if this
effect of parB2 deletion was due to defect if duplicated genome separation and /or was
the cause of change in the ratio of ParA2 to ParB2. We tested the later hypothesis by over
expressing ParA2 on recombinant plasmid p11559A2 in the wild type D. radiodurans
cells. D. radiodurans cells over expressing ParA2 showed an increased percentage of
cells with septum trapped DNA as compared to wild type (Fig3.3.5). Nearly similar
phenotype of higher frequency of septum trapped chromosome was observed in both
parB2 deletion mutant and ParA2 over expressing cells. These results collectively
suggest that the ratio of ParA2 to ParB2 is critical for regulation of genome segregation
or in cell division regulation process. Similar observation has been reported earlier in
case of C. cresentus (Mohl et al., 2001). This hypothesis was further tested by studying
the effect of recombinant ParA2 expressing to different levels in E. coli, which does not
have ParB2 and cell division is better understood. Initially ParA2 protein was expressed
using pA2CFP plasmid constructed by cloning his tagged parA2 gene under the control
of lac promoter of pAMCYAN vector in E. coli. ParA2 was over expressed and it effect
was checked on growth of this bacterium and compared with E. coli vector control.
Transgenic E. coli expressing ParA2 showed nearly no change in O.D at 600nm as
compared to vector control grown under similar conditions (Fig 3.3.6a). However, the
ParA2 expressing cells
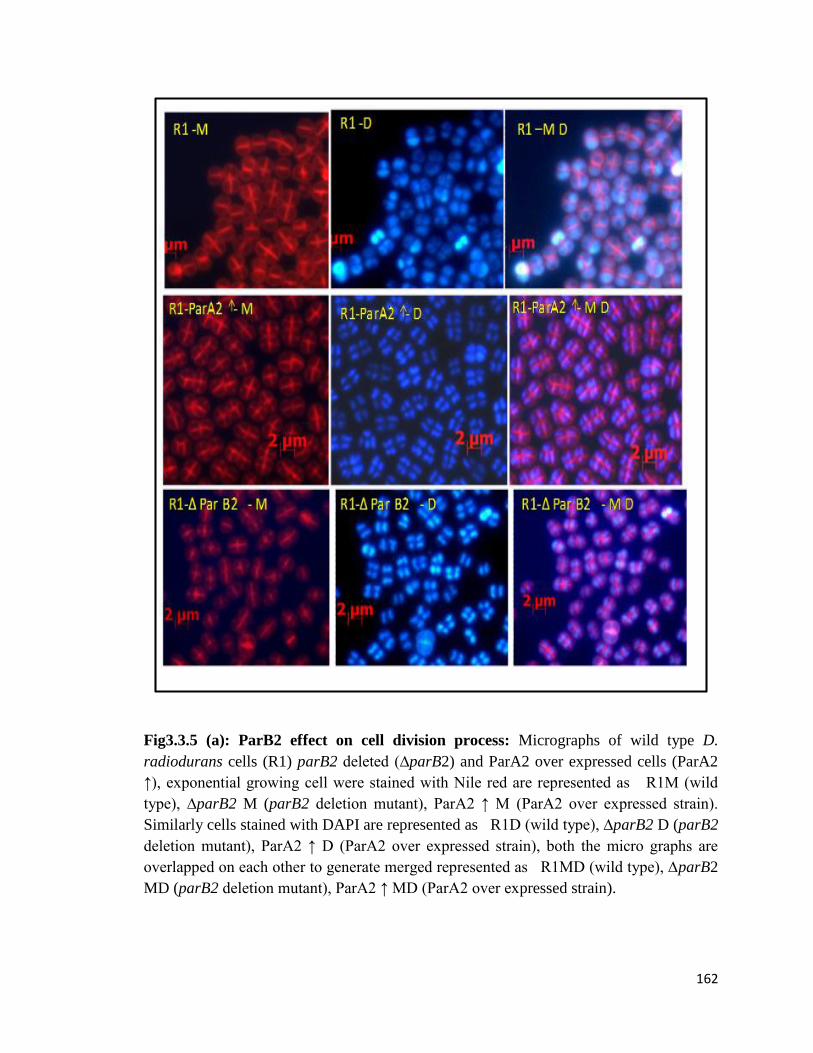
162
Fig3.3.5 (a): ParB2 effect on cell division process: Micrographs of wild type D.
radiodurans cells (R1) parB2 deleted (∆parB2) and ParA2 over expressed cells (ParA2
↑), exponential growing cell were stained with Nile red are represented as R1M (wild
type), ∆parB2 M (parB2 deletion mutant), ParA2 ↑ M (ParA2 over expressed strain).
Similarly cells stained with DAPI are represented as R1D (wild type), ∆parB2 D (parB2
deletion mutant), ParA2 ↑ D (ParA2 over expressed strain), both the micro graphs are
overlapped on each other to generate merged represented as R1MD (wild type), ∆parB2
MD (parB2 deletion mutant), ParA2 ↑ MD (ParA2 over expressed strain).

163
Perc
en
tag
e o
f cells
WT ΔparB2 WT+ParA2
Septum disrupted cells
Septated cells
1μm
2μm
2μm
WT
∆ parB2
ParA2 ↑
Nile Red (N) DAPI+(N)
Figure 3.3.5b: Statistical analysis of cell division inhibition: Enlarged view of figure
3.3.5 a (A) showing septum disruption is represented and number of abnormal septa
formed due to change in ratio of ParA2 to ParB2 was measured (B)
Gro
wth
(O
.D 6
00n
m)
Time (h)
A
B
Controls
ParA2 clone
Co
lon
y fo
rm
ing
un
its
Time (h)
(A)(B)
Fig 3.3.6: Effect of ParA2 expression on growth characteristics of E. coli: E. coli
cells harboring expression vector pAMCYAN (green color line) represented as (- ∆-)

164
and plasmid expressing ParA2 ( red color line) represented as (- O -) were induced with
IPTG and compared with uninduced cells harboring pAMCYAN (blue color line) and
ParA2 (black color line) (- ◊ - / and -□-) .The effect of ParA2 expression on (A) optical
density and (B).cell forming units was monitored.
showed a dramatic reduction in number of colony forming units (CFU) upon induction
with IPTG (Fig 3.3.6b). The reduction in colony forming units (CFU) was directly
correlated with the amount of ParA2 made with time during post IPTG induction which
was confirmed by immunoblotting of ParA2 protein using anti (His) 6 antibodies.
Interestingly, ParA2 over expression showed cell elongated phenotype in E. coli, which
showed nearly similar O.D 600 but different CFU (Fig 3.3.7).

165
CFP- 0hr
CFP- 5hr ParA2 - 5hrParA2 - 3hr
ParA2 - 0hr ParA2 - 1hr
M
ParA2
-CFP
CTime (h) M C
3626
4858
84
116
ParA2
-CFP
kDa
66
45
362920
14
kDa
Time (h)
(A)
(B) (C)
Fig 3.3.7.Effect of ParA2 expression on increase in cell size of E. coli: A) E. coli cells
harboring pAMCYAN, pDSParA1 and pA2CFP plasmid were grown in absence and
presence of IPTG (pAMCYAN +IPTG and pA2CFP +IPTG) for 5h and cells were
imaged. B) Expression of ParA2 CFP was checked in cells incubated for increasing time
with IPTG, by SDS-PAGE (B) and immunoblot analysis (C).
Cell length was measured by using Axiovision REL 4.8 software and plotted by using
Graph Pad prism software. The t-test results of change in cell length of ParA2 over
expressing cells is significant as compared to un induced or vector control, which further
supported the ParA2 functions in dose dependent manner and that is causing E. coli cell
size increase. Unlike vector (Fig3.3.8a) and uninduced ParA2 (Fig3.3.8b) controls, the
ParA2 cells induced with IPTG (Fig3.3.8c) showed a gradual increase in number of E.
coli cells with larger cell size. Cells induced for 4h and more showed a very large
population of cells with more than 2µm length as compared to controls that had nearly all
the population of less than 2µm size. These results suggested that the increase in cell
length and decrease in CFU of cells expressing ParA2 was possibly due to negative effect
of this protein on cell division.

166
CFP– Induced
Cell length ( µm)
Pe
rce
nta
ge
of
ce
lls
Cell length ( µm)
_ParA2
Pe
rce
nta
ge
of
ce
lls
Cell length ( µm)
ParA2 +
Pe
rce
nta
ge
of
ce
lls
A B
C
Fig3.3.8: Analysis of ParA2 expression on increase in cell size of E. coli: Cell length
of CFP induced (A), ParA2 uninduced (B) , ParA2 induced (C) E. coli was measured
after 4hr of post IPTG induction by Axio vision rel. 4.8 software and the percentage of
relative frequency of cells showing different sizes was calculated using Graph pad Prism
5 software.
3.3.2.2 Mechanism(s) of ParA2 inhibition of cell division:
Formation of FtsZ ring structure is an important step in initiation of cell division. Cell
division studies in E. coli and B. subtilis indicated that normally the Z ring is formed at
the mid cell position in symmetrically dividing bacteria. Selection of division site at the
mid of the cell is regulated by at least two well established mechanisms 1) MinCDE
system which prevents septum formation at the poles, 2) Nucleoid occlusion mechanism
which determines the concentration of nucleoid at the vicinity of Z ring (Bramkamp and
van, 2009;Errington et al., 2003). While spatial regulation through MinCDE system is
better understood in E. coli, the nucleoid occlusion mechanism is not well known.
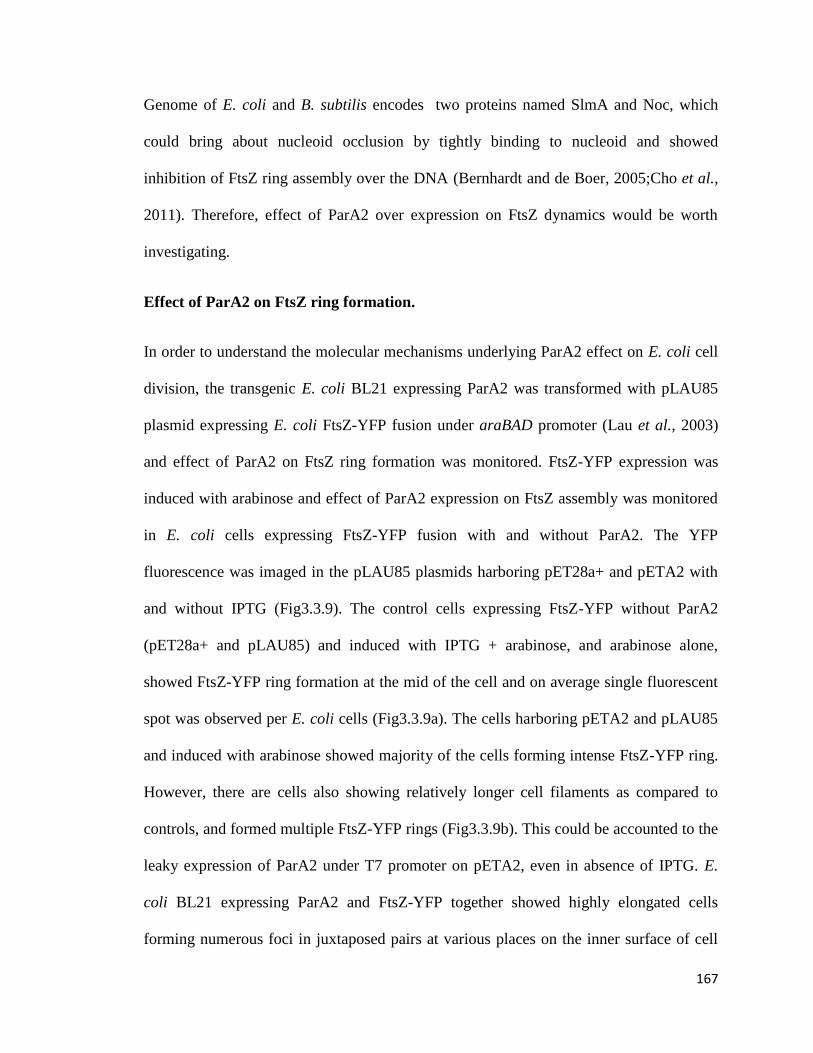
167
Genome of E. coli and B. subtilis encodes two proteins named SlmA and Noc, which
could bring about nucleoid occlusion by tightly binding to nucleoid and showed
inhibition of FtsZ ring assembly over the DNA (Bernhardt and de Boer, 2005;Cho et al.,
2011). Therefore, effect of ParA2 over expression on FtsZ dynamics would be worth
investigating.
Effect of ParA2 on FtsZ ring formation.
In order to understand the molecular mechanisms underlying ParA2 effect on E. coli cell
division, the transgenic E. coli BL21 expressing ParA2 was transformed with pLAU85
plasmid expressing E. coli FtsZ-YFP fusion under araBAD promoter (Lau et al., 2003)
and effect of ParA2 on FtsZ ring formation was monitored. FtsZ-YFP expression was
induced with arabinose and effect of ParA2 expression on FtsZ assembly was monitored
in E. coli cells expressing FtsZ-YFP fusion with and without ParA2. The YFP
fluorescence was imaged in the pLAU85 plasmids harboring pET28a+ and pETA2 with
and without IPTG (Fig3.3.9). The control cells expressing FtsZ-YFP without ParA2
(pET28a+ and pLAU85) and induced with IPTG + arabinose, and arabinose alone,
showed FtsZ-YFP ring formation at the mid of the cell and on average single fluorescent
spot was observed per E. coli cells (Fig3.3.9a). The cells harboring pETA2 and pLAU85
and induced with arabinose showed majority of the cells forming intense FtsZ-YFP ring.
However, there are cells also showing relatively longer cell filaments as compared to
controls, and formed multiple FtsZ-YFP rings (Fig3.3.9b). This could be accounted to the
leaky expression of ParA2 under T7 promoter on pETA2, even in absence of IPTG. E.
coli BL21 expressing ParA2 and FtsZ-YFP together showed highly elongated cells
forming numerous foci in juxtaposed pairs at various places on the inner surface of cell
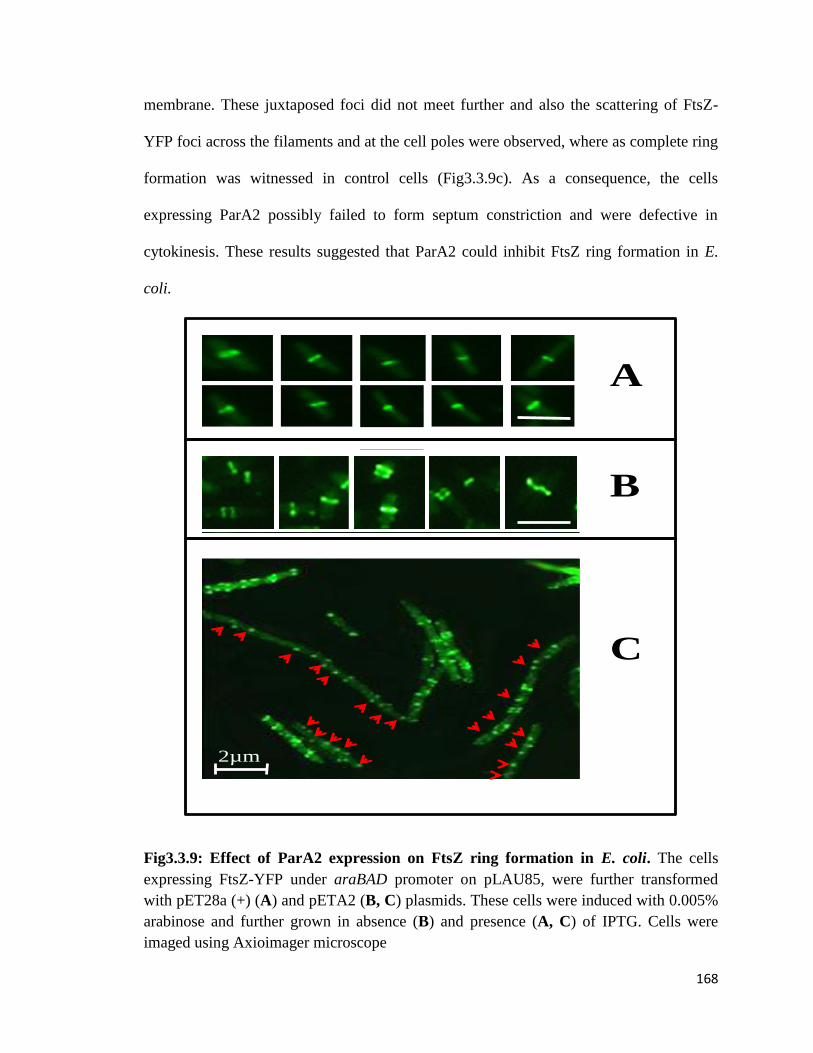
168
membrane. These juxtaposed foci did not meet further and also the scattering of FtsZ-
YFP foci across the filaments and at the cell poles were observed, where as complete ring
formation was witnessed in control cells (Fig3.3.9c). As a consequence, the cells
expressing ParA2 possibly failed to form septum constriction and were defective in
cytokinesis. These results suggested that ParA2 could inhibit FtsZ ring formation in E.
coli.
2µm
2µm
2µm
A
B
C
Fig3.3.9: Effect of ParA2 expression on FtsZ ring formation in E. coli. The cells
expressing FtsZ-YFP under araBAD promoter on pLAU85, were further transformed
with pET28a (+) (A) and pETA2 (B, C) plasmids. These cells were induced with 0.005%
arabinose and further grown in absence (B) and presence (A, C) of IPTG. Cells were
imaged using Axioimager microscope

169
Over expression or deletion of Min proteins cause mislocalization of FtsZ of E. coli
resulted in asymmetric cell division (Lee and Price, 1993; Levin et al., 2000;
Leutkenhaus, 1997). Although, the ParA2 also shares similarity with MinD family
proteins, the co-expression studies of FtsZ-YFP indicated there are few foci formed on
inner membrane at the poles in E. coli cell expressing ParA2 might rule out the
mechanistic similarities of ParA2 with MinD type proteins. It further indicated that
ParA2 over expression did not affect the localization of FtsZ, but expression of ParA2
perturbed complete FtsZ ring formation. Co-expression of ParA2 with FtsZEc revealed
FtsZ complete ring formation is inhibited in presence of ParA2 protein. Inhibition of
complete FtsZ ring formation can occur by either direct interaction of FtsZ with the
ParA2 protein and inhibit lateral interaction between FtsZ polymers as similar to the
MinD protein of E. coli or ParA2 might be binding to DNA and inhibiting FtsZ ring
formation like SlmA, Noc protein which are involved in nucleoid occlusion.
3.3.2.3 ParA2 effect on characteristics features of recombinant FtsZEc:
The DRA0001 gene (790 bp) was PCR amplified from genomic DNA of D. radiodurans
cloned at NdeI & XhoI sites in pET28a+ vector (Fig3.3.10a). Cloning was confirmed by
restriction digestion where recombinant plasmid released a 790 bp fragment and vector
alone was not (Fig3.3.10b). The protein was expressed in BL 21 pLysS E. coli strain and
a 30 kDa protein band was induced in SDS-PAGE gel, which corresponds to the
estimated molecular weight of His tagged ParA2 protein and which was absent in the
controlled cells that were transformed only with pET28a+ plasmid. Recombinant ParA2
was purified to near homogeneity under denaturing conditions, refolded by serial dilution
of urea (Fig3.3.10c) and its identity was confirmed by peptide mass fingerprinting.
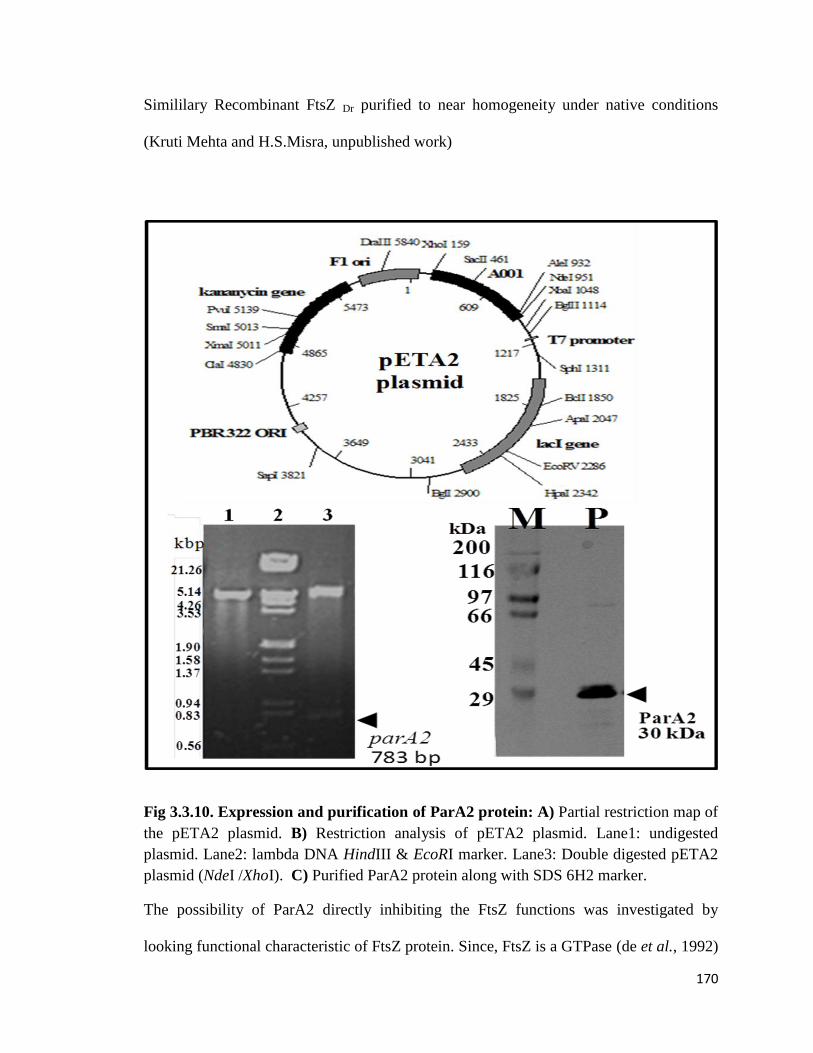
170
Simililary Recombinant FtsZ Dr purified to near homogeneity under native conditions
(Kruti Mehta and H.S.Misra, unpublished work)
Fig 3.3.10. Expression and purification of ParA2 protein: A) Partial restriction map of
the pETA2 plasmid. B) Restriction analysis of pETA2 plasmid. Lane1: undigested
plasmid. Lane2: lambda DNA HindIII & EcoRI marker. Lane3: Double digested pETA2
plasmid (NdeI /XhoI). C) Purified ParA2 protein along with SDS 6H2 marker.
The possibility of ParA2 directly inhibiting the FtsZ functions was investigated by
looking functional characteristic of FtsZ protein. Since, FtsZ is a GTPase (de et al., 1992)

171
and undergoes polymerization in presence of GTP, both GTPase activity and
sedimentation (polymerization) characteristic of FtsZ were monitored under standard in
vitro condition as mentioned in methods. Sedimentation pattern of recombinant FtsZ was
unaffected in presence of ParA2 incubated with and without ATP and DNA (Fig3.3.12b).
Interestingly, it was found that ParA2 in presence of GTP showed higher GTPase activity
as compare to FtsZ control (Fig3.3.11). ParA2 hydrolysis of GTP did not change
significantly in presence of DNA, ATP and FtsZ (Fig3.3.11compare A2+G with
Z+A2+P+G/D). Subtraction of GTP hydrolysis of ParA2 from FtsZ incubated with
ParA2 indicated no change in net GTPase activity of FtsZ (Fig3.3.11). These results
suggest that ParA2 possibly inhibits FtsZ ring formation by a mechanism that is
independent of its direct inhibition of FtsZ functions.
66
45362924
FtsZ
ParA2
FtsZ
ParA2
FtsZ + + + + + + + +
GTP + + + + + + + +
ATP + + + + - - + +
DNA - - - - + + + +
ParA2 - - + + + + + +
P S P S P S P SkDa
FtsZ + + + + + + + +
GTP - - + + + + + +ATP - - - - + + + +
DNA - - - - - - + +
P S P S P S P S
45
36
kDa
66
45362924
FtsZ
ParA2
FtsZ
ParA2
FtsZ + + + + + + + +
GTP + + + + + + + +
ATP + + + + - - + +
DNA - - - - + + + +
ParA2 - - + + + + + +
P S P S P S P SkDa
66
45362924
FtsZ
ParA2
FtsZ
ParA2
FtsZ + + + + + + + +
GTP + + + + + + + +
ATP + + + + - - + +
DNA - - - - + + + +
ParA2 - - + + + + + +
P S P S P S P S
66
45362924
66
45362924
FtsZ
ParA2
FtsZ
ParA2
FtsZ
ParA2
FtsZ
ParA2
FtsZ + + + + + + + +
GTP + + + + + + + +
ATP + + + + - - + +
DNA - - - - + + + +
ParA2 - - + + + + + +
P S P S P S P SkDa
FtsZ + + + + + + + +
GTP - - + + + + + +ATP - - - - + + + +
DNA - - - - - - + +
P S P S P S P S
45
36
kDa
FtsZ + + + + + + + +
GTP - - + + + + + +ATP - - - - + + + +
DNA - - - - - - + +
P S P S P S P S
45
36
kDa
GT
Pas
e act
ivit
y
(nm
ole
sPi/
min
/mg
pro
tein
)
0
160180200220
140120100
80804020
Z+
P
Z+
G
Z+
G+
P
A2
+G
Z+
A2
+G
+P
Z+
A2
+G
+P
+D
GT
Pas
e act
ivit
y
(nm
ole
sPi/
min
/mg
pro
tein
)
0
160180200220
140120100
80804020
Z+
P
Z+
G
Z+
G+
P
A2
+G
Z+
A2
+G
+P
Z+
A2
+G
+P
+D
Z+
P
Z+
G
Z+
G+
P
A2
+G
Z+
A2
+G
+P
Z+
A2
+G
+P
+D
A
B
66
45362924
FtsZ
ParA2
FtsZ
ParA2
FtsZ + + + + + + + +
GTP + + + + + + + +
ATP + + + + - - + +
DNA - - - - + + + +
ParA2 - - + + + + + +
P S P S P S P SkDa
FtsZ + + + + + + + +
GTP - - + + + + + +ATP - - - - + + + +
DNA - - - - - - + +
P S P S P S P S
45
36
kDa
66
45362924
FtsZ
ParA2
FtsZ
ParA2
FtsZ + + + + + + + +
GTP + + + + + + + +
ATP + + + + - - + +
DNA - - - - + + + +
ParA2 - - + + + + + +
P S P S P S P SkDa
66
45362924
FtsZ
ParA2
FtsZ
ParA2
FtsZ + + + + + + + +
GTP + + + + + + + +
ATP + + + + - - + +
DNA - - - - + + + +
ParA2 - - + + + + + +
P S P S P S P S
66
45362924
66
45362924
FtsZ
ParA2
FtsZ
ParA2
FtsZ
ParA2
FtsZ
ParA2
FtsZ + + + + + + + +
GTP + + + + + + + +
ATP + + + + - - + +
DNA - - - - + + + +
ParA2 - - + + + + + +
P S P S P S P SkDa
FtsZ + + + + + + + +
GTP - - + + + + + +ATP - - - - + + + +
DNA - - - - - - + +
P S P S P S P S
45
36
kDa
FtsZ + + + + + + + +
GTP - - + + + + + +ATP - - - - + + + +
DNA - - - - - - + +
P S P S P S P S
45
36
kDa
GT
Pas
e act
ivit
y
(nm
ole
sPi/
min
/mg
pro
tein
)
0
160180200220
140120100
80804020
Z+
P
Z+
G
Z+
G+
P
A2
+G
Z+
A2
+G
+P
Z+
A2
+G
+P
+D
GT
Pas
e act
ivit
y
(nm
ole
sPi/
min
/mg
pro
tein
)
0
160180200220
140120100
80804020
Z+
P
Z+
G
Z+
G+
P
A2
+G
Z+
A2
+G
+P
Z+
A2
+G
+P
+D
Z+
P
Z+
G
Z+
G+
P
A2
+G
Z+
A2
+G
+P
Z+
A2
+G
+P
+D
66
45362924
FtsZ
ParA2
FtsZ
ParA2
FtsZ + + + + + + + +
GTP + + + + + + + +
ATP + + + + - - + +
DNA - - - - + + + +
ParA2 - - + + + + + +
P S P S P S P SkDa
FtsZ + + + + + + + +
GTP - - + + + + + +ATP - - - - + + + +
DNA - - - - - - + +
P S P S P S P S
45
36
kDa
66
45362924
FtsZ
ParA2
FtsZ
ParA2
FtsZ + + + + + + + +
GTP + + + + + + + +
ATP + + + + - - + +
DNA - - - - + + + +
ParA2 - - + + + + + +
P S P S P S P SkDa
66
45362924
FtsZ
ParA2
FtsZ
ParA2
FtsZ + + + + + + + +
GTP + + + + + + + +
ATP + + + + - - + +
DNA - - - - + + + +
ParA2 - - + + + + + +
P S P S P S P S
66
45362924
66
45362924
FtsZ
ParA2
FtsZ
ParA2
FtsZ
ParA2
FtsZ
ParA2
FtsZ + + + + + + + +
GTP + + + + + + + +
ATP + + + + - - + +
DNA - - - - + + + +
ParA2 - - + + + + + +
P S P S P S P SkDa
FtsZ + + + + + + + +
GTP - - + + + + + +ATP - - - - + + + +
DNA - - - - - - + +
P S P S P S P S
45
36
kDa
FtsZ + + + + + + + +
GTP - - + + + + + +ATP - - - - + + + +
DNA - - - - - - + +
P S P S P S P S
45
36
kDa
GT
Pas
e act
ivit
y
(nm
ole
sPi/
min
/mg
pro
tein
)
0
160180200220
140120100
80804020
Z+
P
Z+
G
Z+
G+
P
A2
+G
Z+
A2
+G
+P
Z+
A2
+G
+P
+D
GT
Pas
e act
ivit
y
(nm
ole
sPi/
min
/mg
pro
tein
)
0
160180200220
140120100
80804020
Z+
P
Z+
G
Z+
G+
P
A2
+G
Z+
A2
+G
+P
Z+
A2
+G
+P
+D
Z+
P
Z+
G
Z+
G+
P
A2
+G
Z+
A2
+G
+P
Z+
A2
+G
+P
+D
A
B
FtsZ-ZParA2-A2ATP-PGTP-GDNA-D
Inor
gani
c ph
osph
ate
rele
ased
66
45362924
FtsZ
ParA2
FtsZ
ParA2
FtsZ + + + + + + + +
GTP + + + + + + + +
ATP + + + + - - + +
DNA - - - - + + + +
ParA2 - - + + + + + +
P S P S P S P SkDa
FtsZ + + + + + + + +
GTP - - + + + + + +ATP - - - - + + + +
DNA - - - - - - + +
P S P S P S P S
45
36
kDa
66
45362924
FtsZ
ParA2
FtsZ
ParA2
FtsZ + + + + + + + +
GTP + + + + + + + +
ATP + + + + - - + +
DNA - - - - + + + +
ParA2 - - + + + + + +
P S P S P S P SkDa
66
45362924
FtsZ
ParA2
FtsZ
ParA2
FtsZ + + + + + + + +
GTP + + + + + + + +
ATP + + + + - - + +
DNA - - - - + + + +
ParA2 - - + + + + + +
P S P S P S P S
66
45362924
66
45362924
FtsZ
ParA2
FtsZ
ParA2
FtsZ
ParA2
FtsZ
ParA2
FtsZ + + + + + + + +
GTP + + + + + + + +
ATP + + + + - - + +
DNA - - - - + + + +
ParA2 - - + + + + + +
P S P S P S P SkDa
FtsZ + + + + + + + +
GTP - - + + + + + +ATP - - - - + + + +
DNA - - - - - - + +
P S P S P S P S
45
36
kDa
FtsZ + + + + + + + +
GTP - - + + + + + +ATP - - - - + + + +
DNA - - - - - - + +
P S P S P S P S
45
36
kDa
GT
Pas
e act
ivit
y
(nm
ole
sPi/
min
/mg
pro
tein
)
0
160180200220
140120100
80804020
Z+
P
Z+
G
Z+
G+
P
A2
+G
Z+
A2
+G
+P
Z+
A2
+G
+P
+D
GT
Pas
e act
ivit
y
(nm
ole
sPi/
min
/mg
pro
tein
)
0
160180200220
140120100
80804020
Z+
P
Z+
G
Z+
G+
P
A2
+G
Z+
A2
+G
+P
Z+
A2
+G
+P
+D
Z+
P
Z+
G
Z+
G+
P
A2
+G
Z+
A2
+G
+P
Z+
A2
+G
+P
+D
A
B
66
45362924
FtsZ
ParA2
FtsZ
ParA2
FtsZ + + + + + + + +
GTP + + + + + + + +
ATP + + + + - - + +
DNA - - - - + + + +
ParA2 - - + + + + + +
P S P S P S P SkDa
FtsZ + + + + + + + +
GTP - - + + + + + +ATP - - - - + + + +
DNA - - - - - - + +
P S P S P S P S
45
36
kDa
66
45362924
FtsZ
ParA2
FtsZ
ParA2
FtsZ + + + + + + + +
GTP + + + + + + + +
ATP + + + + - - + +
DNA - - - - + + + +
ParA2 - - + + + + + +
P S P S P S P SkDa
66
45362924
FtsZ
ParA2
FtsZ
ParA2
FtsZ + + + + + + + +
GTP + + + + + + + +
ATP + + + + - - + +
DNA - - - - + + + +
ParA2 - - + + + + + +
P S P S P S P S
66
45362924
66
45362924
FtsZ
ParA2
FtsZ
ParA2
FtsZ
ParA2
FtsZ
ParA2
FtsZ + + + + + + + +
GTP + + + + + + + +
ATP + + + + - - + +
DNA - - - - + + + +
ParA2 - - + + + + + +
P S P S P S P SkDa
FtsZ + + + + + + + +
GTP - - + + + + + +ATP - - - - + + + +
DNA - - - - - - + +
P S P S P S P S
45
36
kDa
FtsZ + + + + + + + +
GTP - - + + + + + +ATP - - - - + + + +
DNA - - - - - - + +
P S P S P S P S
45
36
kDa
GT
Pas
e act
ivit
y
(nm
ole
sPi/
min
/mg
pro
tein
)
0
160180200220
140120100
80804020
Z+
P
Z+
G
Z+
G+
P
A2
+G
Z+
A2
+G
+P
Z+
A2
+G
+P
+D
GT
Pas
e act
ivit
y
(nm
ole
sPi/
min
/mg
pro
tein
)
0
160180200220
140120100
80804020
Z+
P
Z+
G
Z+
G+
P
A2
+G
Z+
A2
+G
+P
Z+
A2
+G
+P
+D
Z+
P
Z+
G
Z+
G+
P
A2
+G
Z+
A2
+G
+P
Z+
A2
+G
+P
+D
66
45362924
FtsZ
ParA2
FtsZ
ParA2
FtsZ + + + + + + + +
GTP + + + + + + + +
ATP + + + + - - + +
DNA - - - - + + + +
ParA2 - - + + + + + +
P S P S P S P SkDa
FtsZ + + + + + + + +
GTP - - + + + + + +ATP - - - - + + + +
DNA - - - - - - + +
P S P S P S P S
45
36
kDa
66
45362924
FtsZ
ParA2
FtsZ
ParA2
FtsZ + + + + + + + +
GTP + + + + + + + +
ATP + + + + - - + +
DNA - - - - + + + +
ParA2 - - + + + + + +
P S P S P S P SkDa
66
45362924
FtsZ
ParA2
FtsZ
ParA2
FtsZ + + + + + + + +
GTP + + + + + + + +
ATP + + + + - - + +
DNA - - - - + + + +
ParA2 - - + + + + + +
P S P S P S P S
66
45362924
66
45362924
FtsZ
ParA2
FtsZ
ParA2
FtsZ
ParA2
FtsZ
ParA2
FtsZ + + + + + + + +
GTP + + + + + + + +
ATP + + + + - - + +
DNA - - - - + + + +
ParA2 - - + + + + + +
P S P S P S P SkDa
FtsZ + + + + + + + +
GTP - - + + + + + +ATP - - - - + + + +
DNA - - - - - - + +
P S P S P S P S
45
36
kDa
FtsZ + + + + + + + +
GTP - - + + + + + +ATP - - - - + + + +
DNA - - - - - - + +
P S P S P S P S
45
36
kDa
GT
Pas
e act
ivit
y
(nm
ole
sPi/
min
/mg
pro
tein
)
0
160180200220
140120100
80804020
Z+
P
Z+
G
Z+
G+
P
A2
+G
Z+
A2
+G
+P
Z+
A2
+G
+P
+D
GT
Pas
e act
ivit
y
(nm
ole
sPi/
min
/mg
pro
tein
)
0
160180200220
140120100
80804020
Z+
P
Z+
G
Z+
G+
P
A2
+G
Z+
A2
+G
+P
Z+
A2
+G
+P
+D
Z+
P
Z+
G
Z+
G+
P
A2
+G
Z+
A2
+G
+P
Z+
A2
+G
+P
+D
A
B
FtsZ-ZParA2-A2ATP-PGTP-GDNA-D
Inor
gani
c ph
osph
ate
rele
ased

172
Fig 3.3.11. Interaction of ParA2 with FtsZ by using GTPase assay: The GTPase
activity of FtsZ was checked in presence of ParA2, ParA2 with and without GTP, ATP,
DNA, reaction was carried out in different combinations and incubated at 37oC for 1h,
release of inorganic phosphate is measured by using malachite green method.
Abbreviations used in this figure are as Fts Z (Z), ParA2 (A2), ATP (P), GTP (G), and
DNA (D).
66
45362924
FtsZ
ParA2
FtsZ
ParA2
FtsZ + + + + + + + +
GTP + + + + + + + +
ATP + + + + - - + +
DNA - - - - + + + +
ParA2 - - + + + + + +
P S P S P S P SkDa
FtsZ + + + + + + + +
GTP - - + + + + + +ATP - - - - + + + +
DNA - - - - - - + +
P S P S P S P S
45
36
kDa
66
45362924
FtsZ
ParA2
FtsZ
ParA2
FtsZ + + + + + + + +
GTP + + + + + + + +
ATP + + + + - - + +
DNA - - - - + + + +
ParA2 - - + + + + + +
P S P S P S P SkDa
66
45362924
FtsZ
ParA2
FtsZ
ParA2
FtsZ + + + + + + + +
GTP + + + + + + + +
ATP + + + + - - + +
DNA - - - - + + + +
ParA2 - - + + + + + +
P S P S P S P S
66
45362924
66
45362924
FtsZ
ParA2
FtsZ
ParA2
FtsZ
ParA2
FtsZ
ParA2
FtsZ + + + + + + + +
GTP + + + + + + + +
ATP + + + + - - + +
DNA - - - - + + + +
ParA2 - - + + + + + +
P S P S P S P SkDa
FtsZ + + + + + + + +
GTP - - + + + + + +ATP - - - - + + + +
DNA - - - - - - + +
P S P S P S P S
45
36
kDa
FtsZ + + + + + + + +
GTP - - + + + + + +ATP - - - - + + + +
DNA - - - - - - + +
P S P S P S P S
45
36
kDa
GT
Pase
activity
(n
mo
lesP
i/m
in
/m
g p
ro
tein
)
0
160180200220
140120100
80804020
Z+
P
Z+
G
Z+
G+
P
A2
+G
Z+
A2
+G
+P
Z+
A2
+G
+P
+D
GT
Pase
activity
(n
mo
lesP
i/m
in
/m
g p
ro
tein
)
0
160180200220
140120100
80804020
Z+
P
Z+
G
Z+
G+
P
A2
+G
Z+
A2
+G
+P
Z+
A2
+G
+P
+D
Z+
P
Z+
G
Z+
G+
P
A2
+G
Z+
A2
+G
+P
Z+
A2
+G
+P
+D
A
B
66
45362924
FtsZ
ParA2
FtsZ
ParA2
FtsZ + + + + + + + +
GTP + + + + + + + +
ATP + + + + - - + +
DNA - - - - + + + +
ParA2 - - + + + + + +
P S P S P S P SkDa
FtsZ + + + + + + + +
GTP - - + + + + + +ATP - - - - + + + +
DNA - - - - - - + +
P S P S P S P S
45
36
kDa
66
45362924
FtsZ
ParA2
FtsZ
ParA2
FtsZ + + + + + + + +
GTP + + + + + + + +
ATP + + + + - - + +
DNA - - - - + + + +
ParA2 - - + + + + + +
P S P S P S P SkDa
66
45362924
FtsZ
ParA2
FtsZ
ParA2
FtsZ + + + + + + + +
GTP + + + + + + + +
ATP + + + + - - + +
DNA - - - - + + + +
ParA2 - - + + + + + +
P S P S P S P S
66
45362924
66
45362924
FtsZ
ParA2
FtsZ
ParA2
FtsZ
ParA2
FtsZ
ParA2
FtsZ + + + + + + + +
GTP + + + + + + + +
ATP + + + + - - + +
DNA - - - - + + + +
ParA2 - - + + + + + +
P S P S P S P SkDa
FtsZ + + + + + + + +
GTP - - + + + + + +ATP - - - - + + + +
DNA - - - - - - + +
P S P S P S P S
45
36
kDa
FtsZ + + + + + + + +
GTP - - + + + + + +ATP - - - - + + + +
DNA - - - - - - + +
P S P S P S P S
45
36
kDa
GT
Pase
activity
(n
mo
lesP
i/m
in
/m
g p
ro
tein
)
0
160180200220
140120100
80804020
Z+
P
Z+
G
Z+
G+
P
A2
+G
Z+
A2
+G
+P
Z+
A2
+G
+P
+D
GT
Pase
activity
(n
mo
lesP
i/m
in
/m
g p
ro
tein
)
0
160180200220
140120100
80804020
Z+
P
Z+
G
Z+
G+
P
A2
+G
Z+
A2
+G
+P
Z+
A2
+G
+P
+D
Z+
P
Z+
G
Z+
G+
P
A2
+G
Z+
A2
+G
+P
Z+
A2
+G
+P
+D
66
45362924
FtsZ
ParA2
FtsZ
ParA2
FtsZ + + + + + + + +
GTP + + + + + + + +
ATP + + + + - - + +
DNA - - - - + + + +
ParA2 - - + + + + + +
P S P S P S P SkDa
FtsZ + + + + + + + +
GTP - - + + + + + +ATP - - - - + + + +
DNA - - - - - - + +
P S P S P S P S
45
36
kDa
66
45362924
FtsZ
ParA2
FtsZ
ParA2
FtsZ + + + + + + + +
GTP + + + + + + + +
ATP + + + + - - + +
DNA - - - - + + + +
ParA2 - - + + + + + +
P S P S P S P SkDa
66
45362924
FtsZ
ParA2
FtsZ
ParA2
FtsZ + + + + + + + +
GTP + + + + + + + +
ATP + + + + - - + +
DNA - - - - + + + +
ParA2 - - + + + + + +
P S P S P S P S
66
45362924
66
45362924
FtsZ
ParA2
FtsZ
ParA2
FtsZ
ParA2
FtsZ
ParA2
FtsZ + + + + + + + +
GTP + + + + + + + +
ATP + + + + - - + +
DNA - - - - + + + +
ParA2 - - + + + + + +
P S P S P S P SkDa
FtsZ + + + + + + + +
GTP - - + + + + + +ATP - - - - + + + +
DNA - - - - - - + +
P S P S P S P S
45
36
kDa
FtsZ + + + + + + + +
GTP - - + + + + + +ATP - - - - + + + +
DNA - - - - - - + +
P S P S P S P S
45
36
kDa
GT
Pase
activity
(n
mo
lesP
i/m
in
/m
g p
ro
tein
)
0
160180200220
140120100
80804020
Z+
P
Z+
G
Z+
G+
P
A2
+G
Z+
A2
+G
+P
Z+
A2
+G
+P
+D
GT
Pase
activity
(n
mo
lesP
i/m
in
/m
g p
ro
tein
)
0
160180200220
140120100
80804020
Z+
P
Z+
G
Z+
G+
P
A2
+G
Z+
A2
+G
+P
Z+
A2
+G
+P
+D
Z+
P
Z+
G
Z+
G+
P
A2
+G
Z+
A2
+G
+P
Z+
A2
+G
+P
+D
A
B
66
45362924
FtsZ
ParA2
FtsZ
ParA2
FtsZ + + + + + + + +
GTP + + + + + + + +
ATP + + + + - - + +
DNA - - - - + + + +
ParA2 - - + + + + + +
P S P S P S P SkDa
FtsZ + + + + + + + +
GTP - - + + + + + +ATP - - - - + + + +
DNA - - - - - - + +
P S P S P S P S
45
36
kDa
66
45362924
FtsZ
ParA2
FtsZ
ParA2
FtsZ + + + + + + + +
GTP + + + + + + + +
ATP + + + + - - + +
DNA - - - - + + + +
ParA2 - - + + + + + +
P S P S P S P SkDa
66
45362924
FtsZ
ParA2
FtsZ
ParA2
FtsZ + + + + + + + +
GTP + + + + + + + +
ATP + + + + - - + +
DNA - - - - + + + +
ParA2 - - + + + + + +
P S P S P S P S
66
45362924
66
45362924
FtsZ
ParA2
FtsZ
ParA2
FtsZ
ParA2
FtsZ
ParA2
FtsZ + + + + + + + +
GTP + + + + + + + +
ATP + + + + - - + +
DNA - - - - + + + +
ParA2 - - + + + + + +
P S P S P S P SkDa
FtsZ + + + + + + + +
GTP - - + + + + + +ATP - - - - + + + +
DNA - - - - - - + +
P S P S P S P S
45
36
kDa
FtsZ + + + + + + + +
GTP - - + + + + + +ATP - - - - + + + +
DNA - - - - - - + +
P S P S P S P S
45
36
kDa
GT
Pase
activity
(n
mo
lesP
i/m
in
/m
g p
ro
tein
)
0
160180200220
140120100
80804020
Z+
P
Z+
G
Z+
G+
P
A2
+G
Z+
A2
+G
+P
Z+
A2
+G
+P
+D
GT
Pase
activity
(n
mo
lesP
i/m
in
/m
g p
ro
tein
)
0
160180200220
140120100
80804020
Z+
P
Z+
G
Z+
G+
P
A2
+G
Z+
A2
+G
+P
Z+
A2
+G
+P
+D
Z+
P
Z+
G
Z+
G+
P
A2
+G
Z+
A2
+G
+P
Z+
A2
+G
+P
+D
66
45362924
FtsZ
ParA2
FtsZ
ParA2
FtsZ + + + + + + + +
GTP + + + + + + + +
ATP + + + + - - + +
DNA - - - - + + + +
ParA2 - - + + + + + +
P S P S P S P SkDa
FtsZ + + + + + + + +
GTP - - + + + + + +ATP - - - - + + + +
DNA - - - - - - + +
P S P S P S P S
45
36
kDa
66
45362924
FtsZ
ParA2
FtsZ
ParA2
FtsZ + + + + + + + +
GTP + + + + + + + +
ATP + + + + - - + +
DNA - - - - + + + +
ParA2 - - + + + + + +
P S P S P S P SkDa
66
45362924
FtsZ
ParA2
FtsZ
ParA2
FtsZ + + + + + + + +
GTP + + + + + + + +
ATP + + + + - - + +
DNA - - - - + + + +
ParA2 - - + + + + + +
P S P S P S P S
66
45362924
66
45362924
FtsZ
ParA2
FtsZ
ParA2
FtsZ
ParA2
FtsZ
ParA2
FtsZ + + + + + + + +
GTP + + + + + + + +
ATP + + + + - - + +
DNA - - - - + + + +
ParA2 - - + + + + + +
P S P S P S P SkDa
FtsZ + + + + + + + +
GTP - - + + + + + +ATP - - - - + + + +
DNA - - - - - - + +
P S P S P S P S
45
36
kDa
FtsZ + + + + + + + +
GTP - - + + + + + +ATP - - - - + + + +
DNA - - - - - - + +
P S P S P S P S
45
36
kDa
GT
Pase
activity
(n
mo
lesP
i/m
in
/m
g p
ro
tein
)
0
160180200220
140120100
80804020
Z+
P
Z+
G
Z+
G+
P
A2
+G
Z+
A2
+G
+P
Z+
A2
+G
+P
+D
GT
Pase
activity
(n
mo
lesP
i/m
in
/m
g p
ro
tein
)
0
160180200220
140120100
80804020
Z+
P
Z+
G
Z+
G+
P
A2
+G
Z+
A2
+G
+P
Z+
A2
+G
+P
+D
Z+
P
Z+
G
Z+
G+
P
A2
+G
Z+
A2
+G
+P
Z+
A2
+G
+P
+D
A
B
66
45362924
FtsZ
ParA2
FtsZ
ParA2
FtsZ + + + + + + + +
GTP + + + + + + + +
ATP + + + + - - + +
DNA - - - - + + + +
ParA2 - - + + + + + +
P S P S P S P SkDa
FtsZ + + + + + + + +
GTP - - + + + + + +ATP - - - - + + + +
DNA - - - - - - + +
P S P S P S P S
45
36
kDa
66
45362924
FtsZ
ParA2
FtsZ
ParA2
FtsZ + + + + + + + +
GTP + + + + + + + +
ATP + + + + - - + +
DNA - - - - + + + +
ParA2 - - + + + + + +
P S P S P S P SkDa
66
45362924
FtsZ
ParA2
FtsZ
ParA2
FtsZ + + + + + + + +
GTP + + + + + + + +
ATP + + + + - - + +
DNA - - - - + + + +
ParA2 - - + + + + + +
P S P S P S P S
66
45362924
66
45362924
FtsZ
ParA2
FtsZ
ParA2
FtsZ
ParA2
FtsZ
ParA2
FtsZ + + + + + + + +
GTP + + + + + + + +
ATP + + + + - - + +
DNA - - - - + + + +
ParA2 - - + + + + + +
P S P S P S P SkDa
FtsZ + + + + + + + +
GTP - - + + + + + +ATP - - - - + + + +
DNA - - - - - - + +
P S P S P S P S
45
36
kDa
FtsZ + + + + + + + +
GTP - - + + + + + +ATP - - - - + + + +
DNA - - - - - - + +
P S P S P S P S
45
36
kDa
GT
Pase activ
ity
(n
mo
lesP
i/m
in/m
g p
ro
tein
)
0
160180200220
140120100
80804020
Z+
P
Z+
G
Z+
G+
P
A2
+G
Z+
A2
+G
+P
Z+
A2
+G
+P
+D
GT
Pase activ
ity
(n
mo
lesP
i/m
in/m
g p
ro
tein
)
0
160180200220
140120100
80804020
Z+
P
Z+
G
Z+
G+
P
A2
+G
Z+
A2
+G
+P
Z+
A2
+G
+P
+D
Z+
P
Z+
G
Z+
G+
P
A2
+G
Z+
A2
+G
+P
Z+
A2
+G
+P
+D
66
45362924
FtsZ
ParA2
FtsZ
ParA2
FtsZ + + + + + + + +
GTP + + + + + + + +
ATP + + + + - - + +
DNA - - - - + + + +
ParA2 - - + + + + + +
P S P S P S P SkDa
FtsZ + + + + + + + +
GTP - - + + + + + +ATP - - - - + + + +
DNA - - - - - - + +
P S P S P S P S
45
36
kDa
66
45362924
FtsZ
ParA2
FtsZ
ParA2
FtsZ + + + + + + + +
GTP + + + + + + + +
ATP + + + + - - + +
DNA - - - - + + + +
ParA2 - - + + + + + +
P S P S P S P SkDa
66
45362924
FtsZ
ParA2
FtsZ
ParA2
FtsZ + + + + + + + +
GTP + + + + + + + +
ATP + + + + - - + +
DNA - - - - + + + +
ParA2 - - + + + + + +
P S P S P S P S
66
45362924
66
45362924
FtsZ
ParA2
FtsZ
ParA2
FtsZ
ParA2
FtsZ
ParA2
FtsZ + + + + + + + +
GTP + + + + + + + +
ATP + + + + - - + +
DNA - - - - + + + +
ParA2 - - + + + + + +
P S P S P S P SkDa
FtsZ + + + + + + + +
GTP - - + + + + + +ATP - - - - + + + +
DNA - - - - - - + +
P S P S P S P S
45
36
kDa
FtsZ + + + + + + + +
GTP - - + + + + + +ATP - - - - + + + +
DNA - - - - - - + +
P S P S P S P S
45
36
kDa
GT
Pase activ
ity
(n
mo
lesP
i/m
in/m
g p
ro
tein
)
0
160180200220
140120100
80804020
Z+
P
Z+
G
Z+
G+
P
A2
+G
Z+
A2
+G
+P
Z+
A2
+G
+P
+D
GT
Pase activ
ity
(n
mo
lesP
i/m
in/m
g p
ro
tein
)
0
160180200220
140120100
80804020
Z+
P
Z+
G
Z+
G+
P
A2
+G
Z+
A2
+G
+P
Z+
A2
+G
+P
+D
Z+
P
Z+
G
Z+
G+
P
A2
+G
Z+
A2
+G
+P
Z+
A2
+G
+P
+D
A
B
66
45362924
FtsZ
ParA2
FtsZ
ParA2
FtsZ + + + + + + + +
GTP + + + + + + + +
ATP + + + + - - + +
DNA - - - - + + + +
ParA2 - - + + + + + +
P S P S P S P SkDa
FtsZ + + + + + + + +
GTP - - + + + + + +ATP - - - - + + + +
DNA - - - - - - + +
P S P S P S P S
45
36
kDa
66
45362924
FtsZ
ParA2
FtsZ
ParA2
FtsZ + + + + + + + +
GTP + + + + + + + +
ATP + + + + - - + +
DNA - - - - + + + +
ParA2 - - + + + + + +
P S P S P S P SkDa
66
45362924
FtsZ
ParA2
FtsZ
ParA2
FtsZ + + + + + + + +
GTP + + + + + + + +
ATP + + + + - - + +
DNA - - - - + + + +
ParA2 - - + + + + + +
P S P S P S P S
66
45362924
66
45362924
FtsZ
ParA2
FtsZ
ParA2
FtsZ
ParA2
FtsZ
ParA2
FtsZ + + + + + + + +
GTP + + + + + + + +
ATP + + + + - - + +
DNA - - - - + + + +
ParA2 - - + + + + + +
P S P S P S P SkDa
FtsZ + + + + + + + +
GTP - - + + + + + +ATP - - - - + + + +
DNA - - - - - - + +
P S P S P S P S
45
36
kDa
FtsZ + + + + + + + +
GTP - - + + + + + +ATP - - - - + + + +
DNA - - - - - - + +
P S P S P S P S
45
36
kDa
GT
Pase activ
ity
(n
mo
lesP
i/m
in/m
g p
ro
tein
)
0
160180200220
140120100
80804020
Z+
P
Z+
G
Z+
G+
P
A2
+G
Z+
A2
+G
+P
Z+
A2
+G
+P
+D
GT
Pase activ
ity
(n
mo
lesP
i/m
in/m
g p
ro
tein
)
0
160180200220
140120100
80804020
Z+
P
Z+
G
Z+
G+
P
A2
+G
Z+
A2
+G
+P
Z+
A2
+G
+P
+D
Z+
P
Z+
G
Z+
G+
P
A2
+G
Z+
A2
+G
+P
Z+
A2
+G
+P
+D
66
45362924
FtsZ
ParA2
FtsZ
ParA2
FtsZ + + + + + + + +
GTP + + + + + + + +
ATP + + + + - - + +
DNA - - - - + + + +
ParA2 - - + + + + + +
P S P S P S P SkDa
FtsZ + + + + + + + +
GTP - - + + + + + +ATP - - - - + + + +
DNA - - - - - - + +
P S P S P S P S
45
36
kDa
66
45362924
FtsZ
ParA2
FtsZ
ParA2
FtsZ + + + + + + + +
GTP + + + + + + + +
ATP + + + + - - + +
DNA - - - - + + + +
ParA2 - - + + + + + +
P S P S P S P SkDa
66
45362924
FtsZ
ParA2
FtsZ
ParA2
FtsZ + + + + + + + +
GTP + + + + + + + +
ATP + + + + - - + +
DNA - - - - + + + +
ParA2 - - + + + + + +
P S P S P S P S
66
45362924
66
45362924
FtsZ
ParA2
FtsZ
ParA2
FtsZ
ParA2
FtsZ
ParA2
FtsZ + + + + + + + +
GTP + + + + + + + +
ATP + + + + - - + +
DNA - - - - + + + +
ParA2 - - + + + + + +
P S P S P S P SkDa
FtsZ + + + + + + + +
GTP - - + + + + + +ATP - - - - + + + +
DNA - - - - - - + +
P S P S P S P S
45
36
kDa
FtsZ + + + + + + + +
GTP - - + + + + + +ATP - - - - + + + +
DNA - - - - - - + +
P S P S P S P S
45
36
kDa
GT
Pase activ
ity
(n
mo
lesP
i/m
in/m
g p
ro
tein
)
0
160180200220
140120100
80804020
Z+
P
Z+
G
Z+
G+
P
A2
+G
Z+
A2
+G
+P
Z+
A2
+G
+P
+D
GT
Pase activ
ity
(n
mo
lesP
i/m
in/m
g p
ro
tein
)
0
160180200220
140120100
80804020
Z+
P
Z+
G
Z+
G+
P
A2
+G
Z+
A2
+G
+P
Z+
A2
+G
+P
+D
Z+
P
Z+
G
Z+
G+
P
A2
+G
Z+
A2
+G
+P
Z+
A2
+G
+P
+D
A
B
66
45362924
FtsZ
ParA2
FtsZ
ParA2
FtsZ + + + + + + + +
GTP + + + + + + + +
ATP + + + + - - + +
DNA - - - - + + + +
ParA2 - - + + + + + +
P S P S P S P SkDa
FtsZ + + + + + + + +
GTP - - + + + + + +ATP - - - - + + + +
DNA - - - - - - + +
P S P S P S P S
45
36
kDa
66
45362924
FtsZ
ParA2
FtsZ
ParA2
FtsZ + + + + + + + +
GTP + + + + + + + +
ATP + + + + - - + +
DNA - - - - + + + +
ParA2 - - + + + + + +
P S P S P S P SkDa
66
45362924
FtsZ
ParA2
FtsZ
ParA2
FtsZ + + + + + + + +
GTP + + + + + + + +
ATP + + + + - - + +
DNA - - - - + + + +
ParA2 - - + + + + + +
P S P S P S P S
66
45362924
66
45362924
FtsZ
ParA2
FtsZ
ParA2
FtsZ
ParA2
FtsZ
ParA2
FtsZ + + + + + + + +
GTP + + + + + + + +
ATP + + + + - - + +
DNA - - - - + + + +
ParA2 - - + + + + + +
P S P S P S P SkDa
FtsZ + + + + + + + +
GTP - - + + + + + +ATP - - - - + + + +
DNA - - - - - - + +
P S P S P S P S
45
36
kDa
FtsZ + + + + + + + +
GTP - - + + + + + +ATP - - - - + + + +
DNA - - - - - - + +
P S P S P S P S
45
36
kDa
GT
Pase activ
ity
(n
mo
lesP
i/m
in/m
g p
ro
tein
)
0
160180200220
140120100
80804020
Z+
P
Z+
G
Z+
G+
P
A2
+G
Z+
A2
+G
+P
Z+
A2
+G
+P
+D
GT
Pase activ
ity
(n
mo
lesP
i/m
in/m
g p
ro
tein
)
0
160180200220
140120100
80804020
Z+
P
Z+
G
Z+
G+
P
A2
+G
Z+
A2
+G
+P
Z+
A2
+G
+P
+D
Z+
P
Z+
G
Z+
G+
P
A2
+G
Z+
A2
+G
+P
Z+
A2
+G
+P
+D
66
45362924
FtsZ
ParA2
FtsZ
ParA2
FtsZ + + + + + + + +
GTP + + + + + + + +
ATP + + + + - - + +
DNA - - - - + + + +
ParA2 - - + + + + + +
P S P S P S P SkDa
FtsZ + + + + + + + +
GTP - - + + + + + +ATP - - - - + + + +
DNA - - - - - - + +
P S P S P S P S
45
36
kDa
66
45362924
FtsZ
ParA2
FtsZ
ParA2
FtsZ + + + + + + + +
GTP + + + + + + + +
ATP + + + + - - + +
DNA - - - - + + + +
ParA2 - - + + + + + +
P S P S P S P SkDa
66
45362924
FtsZ
ParA2
FtsZ
ParA2
FtsZ + + + + + + + +
GTP + + + + + + + +
ATP + + + + - - + +
DNA - - - - + + + +
ParA2 - - + + + + + +
P S P S P S P S
66
45362924
66
45362924
FtsZ
ParA2
FtsZ
ParA2
FtsZ
ParA2
FtsZ
ParA2
FtsZ + + + + + + + +
GTP + + + + + + + +
ATP + + + + - - + +
DNA - - - - + + + +
ParA2 - - + + + + + +
P S P S P S P SkDa
FtsZ + + + + + + + +
GTP - - + + + + + +ATP - - - - + + + +
DNA - - - - - - + +
P S P S P S P S
45
36
kDa
FtsZ + + + + + + + +
GTP - - + + + + + +ATP - - - - + + + +
DNA - - - - - - + +
P S P S P S P S
45
36
kDa
GT
Pase activ
ity
(n
mo
lesP
i/m
in/m
g p
ro
tein
)
0
160180200220
140120100
80804020
Z+
P
Z+
G
Z+
G+
P
A2
+G
Z+
A2
+G
+P
Z+
A2
+G
+P
+D
GT
Pase activ
ity
(n
mo
lesP
i/m
in/m
g p
ro
tein
)
0
160180200220
140120100
80804020
Z+
P
Z+
G
Z+
G+
P
A2
+G
Z+
A2
+G
+P
Z+
A2
+G
+P
+D
Z+
P
Z+
G
Z+
G+
P
A2
+G
Z+
A2
+G
+P
Z+
A2
+G
+P
+D
A
B
66
45362924
FtsZ
ParA2
FtsZ
ParA2
FtsZ + + + + + + + +
GTP + + + + + + + +
ATP + + + + - - + +
DNA - - - - + + + +
ParA2 - - + + + + + +
P S P S P S P SkDa
FtsZ + + + + + + + +
GTP - - + + + + + +ATP - - - - + + + +
DNA - - - - - - + +
P S P S P S P S
45
36
kDa
66
45362924
FtsZ
ParA2
FtsZ
ParA2
FtsZ + + + + + + + +
GTP + + + + + + + +
ATP + + + + - - + +
DNA - - - - + + + +
ParA2 - - + + + + + +
P S P S P S P SkDa
66
45362924
FtsZ
ParA2
FtsZ
ParA2
FtsZ + + + + + + + +
GTP + + + + + + + +
ATP + + + + - - + +
DNA - - - - + + + +
ParA2 - - + + + + + +
P S P S P S P S
66
45362924
66
45362924
FtsZ
ParA2
FtsZ
ParA2
FtsZ
ParA2
FtsZ
ParA2
FtsZ + + + + + + + +
GTP + + + + + + + +
ATP + + + + - - + +
DNA - - - - + + + +
ParA2 - - + + + + + +
P S P S P S P SkDa
FtsZ + + + + + + + +
GTP - - + + + + + +ATP - - - - + + + +
DNA - - - - - - + +
P S P S P S P S
45
36
kDa
FtsZ + + + + + + + +
GTP - - + + + + + +ATP - - - - + + + +
DNA - - - - - - + +
P S P S P S P S
45
36
kDa
GT
Pase activ
ity
(n
mo
lesP
i/m
in/m
g p
ro
tein
)
0
160180200220
140120100
80804020
Z+
P
Z+
G
Z+
G+
P
A2
+G
Z+
A2
+G
+P
Z+
A2
+G
+P
+D
GT
Pase activ
ity
(n
mo
lesP
i/m
in/m
g p
ro
tein
)
0
160180200220
140120100
80804020
Z+
P
Z+
G
Z+
G+
P
A2
+G
Z+
A2
+G
+P
Z+
A2
+G
+P
+D
Z+
P
Z+
G
Z+
G+
P
A2
+G
Z+
A2
+G
+P
Z+
A2
+G
+P
+D
66
45362924
FtsZ
ParA2
FtsZ
ParA2
FtsZ + + + + + + + +
GTP + + + + + + + +
ATP + + + + - - + +
DNA - - - - + + + +
ParA2 - - + + + + + +
P S P S P S P SkDa
FtsZ + + + + + + + +
GTP - - + + + + + +ATP - - - - + + + +
DNA - - - - - - + +
P S P S P S P S
45
36
kDa
66
45362924
FtsZ
ParA2
FtsZ
ParA2
FtsZ + + + + + + + +
GTP + + + + + + + +
ATP + + + + - - + +
DNA - - - - + + + +
ParA2 - - + + + + + +
P S P S P S P SkDa
66
45362924
FtsZ
ParA2
FtsZ
ParA2
FtsZ + + + + + + + +
GTP + + + + + + + +
ATP + + + + - - + +
DNA - - - - + + + +
ParA2 - - + + + + + +
P S P S P S P S
66
45362924
66
45362924
FtsZ
ParA2
FtsZ
ParA2
FtsZ
ParA2
FtsZ
ParA2
FtsZ + + + + + + + +
GTP + + + + + + + +
ATP + + + + - - + +
DNA - - - - + + + +
ParA2 - - + + + + + +
P S P S P S P SkDa
FtsZ + + + + + + + +
GTP - - + + + + + +ATP - - - - + + + +
DNA - - - - - - + +
P S P S P S P S
45
36
kDa
FtsZ + + + + + + + +
GTP - - + + + + + +ATP - - - - + + + +
DNA - - - - - - + +
P S P S P S P S
45
36
kDa
GT
Pase activ
ity
(n
mo
lesP
i/m
in/m
g p
ro
tein
)
0
160180200220
140120100
80804020
Z+
P
Z+
G
Z+
G+
P
A2
+G
Z+
A2
+G
+P
Z+
A2
+G
+P
+D
GT
Pase activ
ity
(n
mo
lesP
i/m
in/m
g p
ro
tein
)
0
160180200220
140120100
80804020
Z+
P
Z+
G
Z+
G+
P
A2
+G
Z+
A2
+G
+P
Z+
A2
+G
+P
+D
Z+
P
Z+
G
Z+
G+
P
A2
+G
Z+
A2
+G
+P
Z+
A2
+G
+P
+D
A
B
66
45362924
FtsZ
ParA2
FtsZ
ParA2
FtsZ + + + + + + + +
GTP + + + + + + + +
ATP + + + + - - + +
DNA - - - - + + + +
ParA2 - - + + + + + +
P S P S P S P SkDa
FtsZ + + + + + + + +
GTP - - + + + + + +ATP - - - - + + + +
DNA - - - - - - + +
P S P S P S P S
45
36
kDa
66
45362924
FtsZ
ParA2
FtsZ
ParA2
FtsZ + + + + + + + +
GTP + + + + + + + +
ATP + + + + - - + +
DNA - - - - + + + +
ParA2 - - + + + + + +
P S P S P S P SkDa
66
45362924
FtsZ
ParA2
FtsZ
ParA2
FtsZ + + + + + + + +
GTP + + + + + + + +
ATP + + + + - - + +
DNA - - - - + + + +
ParA2 - - + + + + + +
P S P S P S P S
66
45362924
66
45362924
FtsZ
ParA2
FtsZ
ParA2
FtsZ
ParA2
FtsZ
ParA2
FtsZ + + + + + + + +
GTP + + + + + + + +
ATP + + + + - - + +
DNA - - - - + + + +
ParA2 - - + + + + + +
P S P S P S P SkDa
FtsZ + + + + + + + +
GTP - - + + + + + +ATP - - - - + + + +
DNA - - - - - - + +
P S P S P S P S
45
36
kDa
FtsZ + + + + + + + +
GTP - - + + + + + +ATP - - - - + + + +
DNA - - - - - - + +
P S P S P S P S
45
36
kDa
GT
Pase
activity
(n
mo
lesP
i/m
in
/m
g p
ro
tein
)
0
160180200220
140120100
80804020
Z+
P
Z+
G
Z+
G+
P
A2
+G
Z+
A2
+G
+P
Z+
A2
+G
+P
+D
GT
Pase
activity
(n
mo
lesP
i/m
in
/m
g p
ro
tein
)
0
160180200220
140120100
80804020
Z+
P
Z+
G
Z+
G+
P
A2
+G
Z+
A2
+G
+P
Z+
A2
+G
+P
+D
Z+
P
Z+
G
Z+
G+
P
A2
+G
Z+
A2
+G
+P
Z+
A2
+G
+P
+D
66
45362924
FtsZ
ParA2
FtsZ
ParA2
FtsZ + + + + + + + +
GTP + + + + + + + +
ATP + + + + - - + +
DNA - - - - + + + +
ParA2 - - + + + + + +
P S P S P S P SkDa
FtsZ + + + + + + + +
GTP - - + + + + + +ATP - - - - + + + +
DNA - - - - - - + +
P S P S P S P S
45
36
kDa
66
45362924
FtsZ
ParA2
FtsZ
ParA2
FtsZ + + + + + + + +
GTP + + + + + + + +
ATP + + + + - - + +
DNA - - - - + + + +
ParA2 - - + + + + + +
P S P S P S P SkDa
66
45362924
FtsZ
ParA2
FtsZ
ParA2
FtsZ + + + + + + + +
GTP + + + + + + + +
ATP + + + + - - + +
DNA - - - - + + + +
ParA2 - - + + + + + +
P S P S P S P S
66
45362924
66
45362924
FtsZ
ParA2
FtsZ
ParA2
FtsZ
ParA2
FtsZ
ParA2
FtsZ + + + + + + + +
GTP + + + + + + + +
ATP + + + + - - + +
DNA - - - - + + + +
ParA2 - - + + + + + +
P S P S P S P SkDa
FtsZ + + + + + + + +
GTP - - + + + + + +ATP - - - - + + + +
DNA - - - - - - + +
P S P S P S P S
45
36
kDa
FtsZ + + + + + + + +
GTP - - + + + + + +ATP - - - - + + + +
DNA - - - - - - + +
P S P S P S P S
45
36
kDa
GT
Pase
activity
(n
mo
lesP
i/m
in
/m
g p
ro
tein
)
0
160180200220
140120100
80804020
Z+
P
Z+
G
Z+
G+
P
A2
+G
Z+
A2
+G
+P
Z+
A2
+G
+P
+D
GT
Pase
activity
(n
mo
lesP
i/m
in
/m
g p
ro
tein
)
0
160180200220
140120100
80804020
Z+
P
Z+
G
Z+
G+
P
A2
+G
Z+
A2
+G
+P
Z+
A2
+G
+P
+D
Z+
P
Z+
G
Z+
G+
P
A2
+G
Z+
A2
+G
+P
Z+
A2
+G
+P
+D
A
B
66
45362924
FtsZ
ParA2
FtsZ
ParA2
FtsZ + + + + + + + +
GTP + + + + + + + +
ATP + + + + - - + +
DNA - - - - + + + +
ParA2 - - + + + + + +
P S P S P S P SkDa
FtsZ + + + + + + + +
GTP - - + + + + + +ATP - - - - + + + +
DNA - - - - - - + +
P S P S P S P S
45
36
kDa
66
45362924
FtsZ
ParA2
FtsZ
ParA2
FtsZ + + + + + + + +
GTP + + + + + + + +
ATP + + + + - - + +
DNA - - - - + + + +
ParA2 - - + + + + + +
P S P S P S P SkDa
66
45362924
FtsZ
ParA2
FtsZ
ParA2
FtsZ + + + + + + + +
GTP + + + + + + + +
ATP + + + + - - + +
DNA - - - - + + + +
ParA2 - - + + + + + +
P S P S P S P S
66
45362924
66
45362924
FtsZ
ParA2
FtsZ
ParA2
FtsZ
ParA2
FtsZ
ParA2
FtsZ + + + + + + + +
GTP + + + + + + + +
ATP + + + + - - + +
DNA - - - - + + + +
ParA2 - - + + + + + +
P S P S P S P SkDa
FtsZ + + + + + + + +
GTP - - + + + + + +ATP - - - - + + + +
DNA - - - - - - + +
P S P S P S P S
45
36
kDa
FtsZ + + + + + + + +
GTP - - + + + + + +ATP - - - - + + + +
DNA - - - - - - + +
P S P S P S P S
45
36
kDa
GT
Pase
activity
(n
mo
lesP
i/m
in
/m
g p
ro
tein
)
0
160180200220
140120100
80804020
Z+
P
Z+
G
Z+
G+
P
A2
+G
Z+
A2
+G
+P
Z+
A2
+G
+P
+D
GT
Pase
activity
(n
mo
lesP
i/m
in
/m
g p
ro
tein
)
0
160180200220
140120100
80804020
Z+
P
Z+
G
Z+
G+
P
A2
+G
Z+
A2
+G
+P
Z+
A2
+G
+P
+D
Z+
P
Z+
G
Z+
G+
P
A2
+G
Z+
A2
+G
+P
Z+
A2
+G
+P
+D
66
45362924
FtsZ
ParA2
FtsZ
ParA2
FtsZ + + + + + + + +
GTP + + + + + + + +
ATP + + + + - - + +
DNA - - - - + + + +
ParA2 - - + + + + + +
P S P S P S P SkDa
FtsZ + + + + + + + +
GTP - - + + + + + +ATP - - - - + + + +
DNA - - - - - - + +
P S P S P S P S
45
36
kDa
66
45362924
FtsZ
ParA2
FtsZ
ParA2
FtsZ + + + + + + + +
GTP + + + + + + + +
ATP + + + + - - + +
DNA - - - - + + + +
ParA2 - - + + + + + +
P S P S P S P SkDa
66
45362924
FtsZ
ParA2
FtsZ
ParA2
FtsZ + + + + + + + +
GTP + + + + + + + +
ATP + + + + - - + +
DNA - - - - + + + +
ParA2 - - + + + + + +
P S P S P S P S
66
45362924
66
45362924
FtsZ
ParA2
FtsZ
ParA2
FtsZ
ParA2
FtsZ
ParA2
FtsZ + + + + + + + +
GTP + + + + + + + +
ATP + + + + - - + +
DNA - - - - + + + +
ParA2 - - + + + + + +
P S P S P S P SkDa
FtsZ + + + + + + + +
GTP - - + + + + + +ATP - - - - + + + +
DNA - - - - - - + +
P S P S P S P S
45
36
kDa
FtsZ + + + + + + + +
GTP - - + + + + + +ATP - - - - + + + +
DNA - - - - - - + +
P S P S P S P S
45
36
kDa
GT
Pase
activity
(n
mo
lesP
i/m
in
/m
g p
ro
tein
)
0
160180200220
140120100
80804020
Z+
P
Z+
G
Z+
G+
P
A2
+G
Z+
A2
+G
+P
Z+
A2
+G
+P
+D
GT
Pase
activity
(n
mo
lesP
i/m
in
/m
g p
ro
tein
)
0
160180200220
140120100
80804020
Z+
P
Z+
G
Z+
G+
P
A2
+G
Z+
A2
+G
+P
Z+
A2
+G
+P
+D
Z+
P
Z+
G
Z+
G+
P
A2
+G
Z+
A2
+G
+P
Z+
A2
+G
+P
+D
A
B
66
45362924
FtsZ
ParA2
FtsZ
ParA2
FtsZ + + + + + + + +
GTP + + + + + + + +
ATP + + + + - - + +
DNA - - - - + + + +
ParA2 - - + + + + + +
P S P S P S P SkDa
FtsZ + + + + + + + +
GTP - - + + + + + +ATP - - - - + + + +
DNA - - - - - - + +
P S P S P S P S
45
36
kDa
66
45362924
FtsZ
ParA2
FtsZ
ParA2
FtsZ + + + + + + + +
GTP + + + + + + + +
ATP + + + + - - + +
DNA - - - - + + + +
ParA2 - - + + + + + +
P S P S P S P SkDa
66
45362924
FtsZ
ParA2
FtsZ
ParA2
FtsZ + + + + + + + +
GTP + + + + + + + +
ATP + + + + - - + +
DNA - - - - + + + +
ParA2 - - + + + + + +
P S P S P S P S
66
45362924
66
45362924
FtsZ
ParA2
FtsZ
ParA2
FtsZ
ParA2
FtsZ
ParA2
FtsZ + + + + + + + +
GTP + + + + + + + +
ATP + + + + - - + +
DNA - - - - + + + +
ParA2 - - + + + + + +
P S P S P S P SkDa
FtsZ + + + + + + + +
GTP - - + + + + + +ATP - - - - + + + +
DNA - - - - - - + +
P S P S P S P S
45
36
kDa
FtsZ + + + + + + + +
GTP - - + + + + + +ATP - - - - + + + +
DNA - - - - - - + +
P S P S P S P S
45
36
kDa
GT
Pase
activity
(n
mo
lesP
i/m
in
/m
g p
ro
tein
)
0
160180200220
140120100
80804020
Z+
P
Z+
G
Z+
G+
P
A2
+G
Z+
A2
+G
+P
Z+
A2
+G
+P
+D
GT
Pase
activity
(n
mo
lesP
i/m
in
/m
g p
ro
tein
)
0
160180200220
140120100
80804020
Z+
P
Z+
G
Z+
G+
P
A2
+G
Z+
A2
+G
+P
Z+
A2
+G
+P
+D
Z+
P
Z+
G
Z+
G+
P
A2
+G
Z+
A2
+G
+P
Z+
A2
+G
+P
+D
66
45362924
FtsZ
ParA2
FtsZ
ParA2
FtsZ + + + + + + + +
GTP + + + + + + + +
ATP + + + + - - + +
DNA - - - - + + + +
ParA2 - - + + + + + +
P S P S P S P SkDa
FtsZ + + + + + + + +
GTP - - + + + + + +ATP - - - - + + + +
DNA - - - - - - + +
P S P S P S P S
45
36
kDa
66
45362924
FtsZ
ParA2
FtsZ
ParA2
FtsZ + + + + + + + +
GTP + + + + + + + +
ATP + + + + - - + +
DNA - - - - + + + +
ParA2 - - + + + + + +
P S P S P S P SkDa
66
45362924
FtsZ
ParA2
FtsZ
ParA2
FtsZ + + + + + + + +
GTP + + + + + + + +
ATP + + + + - - + +
DNA - - - - + + + +
ParA2 - - + + + + + +
P S P S P S P S
66
45362924
66
45362924
FtsZ
ParA2
FtsZ
ParA2
FtsZ
ParA2
FtsZ
ParA2
FtsZ + + + + + + + +
GTP + + + + + + + +
ATP + + + + - - + +
DNA - - - - + + + +
ParA2 - - + + + + + +
P S P S P S P SkDa
FtsZ + + + + + + + +
GTP - - + + + + + +ATP - - - - + + + +
DNA - - - - - - + +
P S P S P S P S
45
36
kDa
FtsZ + + + + + + + +
GTP - - + + + + + +ATP - - - - + + + +
DNA - - - - - - + +
P S P S P S P S
45
36
kDa
GT
Pase
activity
(n
mo
lesP
i/m
in
/m
g p
ro
tein
)
0
160180200220
140120100
80804020
Z+
P
Z+
G
Z+
G+
P
A2
+G
Z+
A2
+G
+P
Z+
A2
+G
+P
+D
GT
Pase
activity
(n
mo
lesP
i/m
in
/m
g p
ro
tein
)
0
160180200220
140120100
80804020
Z+
P
Z+
G
Z+
G+
P
A2
+G
Z+
A2
+G
+P
Z+
A2
+G
+P
+D
Z+
P
Z+
G
Z+
G+
P
A2
+G
Z+
A2
+G
+P
Z+
A2
+G
+P
+D
A
B
66
45362924
FtsZ
ParA2
FtsZ
ParA2
FtsZ + + + + + + + +
GTP + + + + + + + +
ATP + + + + - - + +
DNA - - - - + + + +
ParA2 - - + + + + + +
P S P S P S P SkDa
FtsZ + + + + + + + +
GTP - - + + + + + +ATP - - - - + + + +
DNA - - - - - - + +
P S P S P S P S
45
36
kDa
66
45362924
FtsZ
ParA2
FtsZ
ParA2
FtsZ + + + + + + + +
GTP + + + + + + + +
ATP + + + + - - + +
DNA - - - - + + + +
ParA2 - - + + + + + +
P S P S P S P SkDa
66
45362924
FtsZ
ParA2
FtsZ
ParA2
FtsZ + + + + + + + +
GTP + + + + + + + +
ATP + + + + - - + +
DNA - - - - + + + +
ParA2 - - + + + + + +
P S P S P S P S
66
45362924
66
45362924
FtsZ
ParA2
FtsZ
ParA2
FtsZ
ParA2
FtsZ
ParA2
FtsZ + + + + + + + +
GTP + + + + + + + +
ATP + + + + - - + +
DNA - - - - + + + +
ParA2 - - + + + + + +
P S P S P S P SkDa
FtsZ + + + + + + + +
GTP - - + + + + + +ATP - - - - + + + +
DNA - - - - - - + +
P S P S P S P S
45
36
kDa
FtsZ + + + + + + + +
GTP - - + + + + + +ATP - - - - + + + +
DNA - - - - - - + +
P S P S P S P S
45
36
kDa
GT
Pase
activity
(n
mo
lesP
i/m
in
/m
g p
ro
tein
)
0
160180200220
140120100
80804020
Z+
P
Z+
G
Z+
G+
P
A2
+G
Z+
A2
+G
+P
Z+
A2
+G
+P
+D
GT
Pase
activity
(n
mo
lesP
i/m
in
/m
g p
ro
tein
)
0
160180200220
140120100
80804020
Z+
P
Z+
G
Z+
G+
P
A2
+G
Z+
A2
+G
+P
Z+
A2
+G
+P
+D
Z+
P
Z+
G
Z+
G+
P
A2
+G
Z+
A2
+G
+P
Z+
A2
+G
+P
+D
66
45362924
FtsZ
ParA2
FtsZ
ParA2
FtsZ + + + + + + + +
GTP + + + + + + + +
ATP + + + + - - + +
DNA - - - - + + + +
ParA2 - - + + + + + +
P S P S P S P SkDa
FtsZ + + + + + + + +
GTP - - + + + + + +ATP - - - - + + + +
DNA - - - - - - + +
P S P S P S P S
45
36
kDa
66
45362924
FtsZ
ParA2
FtsZ
ParA2
FtsZ + + + + + + + +
GTP + + + + + + + +
ATP + + + + - - + +
DNA - - - - + + + +
ParA2 - - + + + + + +
P S P S P S P SkDa
66
45362924
FtsZ
ParA2
FtsZ
ParA2
FtsZ + + + + + + + +
GTP + + + + + + + +
ATP + + + + - - + +
DNA - - - - + + + +
ParA2 - - + + + + + +
P S P S P S P S
66
45362924
66
45362924
FtsZ
ParA2
FtsZ
ParA2
FtsZ
ParA2
FtsZ
ParA2
FtsZ + + + + + + + +
GTP + + + + + + + +
ATP + + + + - - + +
DNA - - - - + + + +
ParA2 - - + + + + + +
P S P S P S P SkDa
FtsZ + + + + + + + +
GTP - - + + + + + +ATP - - - - + + + +
DNA - - - - - - + +
P S P S P S P S
45
36
kDa
FtsZ + + + + + + + +
GTP - - + + + + + +ATP - - - - + + + +
DNA - - - - - - + +
P S P S P S P S
45
36
kDa
GT
Pase
activity
(n
mo
lesP
i/m
in
/m
g p
ro
tein
)
0
160180200220
140120100
80804020
Z+
P
Z+
G
Z+
G+
P
A2
+G
Z+
A2
+G
+P
Z+
A2
+G
+P
+D
GT
Pase
activity
(n
mo
lesP
i/m
in
/m
g p
ro
tein
)
0
160180200220
140120100
80804020
Z+
P
Z+
G
Z+
G+
P
A2
+G
Z+
A2
+G
+P
Z+
A2
+G
+P
+D
Z+
P
Z+
G
Z+
G+
P
A2
+G
Z+
A2
+G
+P
Z+
A2
+G
+P
+D
A
B
Kda
A B
Fig3.3.12 Interaction of ParA2 with FtsZ by using sedimentation analysis: A)
Recombinant FtsZ protein was incubated with GTP, ATP, DNA reaction was carried out
37oC for 30 min, these mixtures were centrifuged at 22,000 x g for 30 min and both
supernatant (S) and pellets (P) fractions were analyzed on SDS-PAGE. Gel was stained
with Coomassie blue and the intensity of protein band corresponding to ParA2 was
estimated by densitometric scanning from the respective gel. Amount of FtsZ in pellet
and supernatant was measured by densitometric analysis. B) Similarly Recombinant
ParA2 was incubated with FtsZ and in presence and absence of DNA, ATP and both.
Mixtures were incubated at 37oC for 30 min, reaction mixtures were analyzed as
mentioned above.
3.3.2.4 Cell division inhibition through Nucleoid occlusion mechanism in ParA2
expressing cells
Purified protein was checked for DNA binding activity, ATPase activity and
oligomerization characteristics. ParA2 showed DNA binding activity, which increased
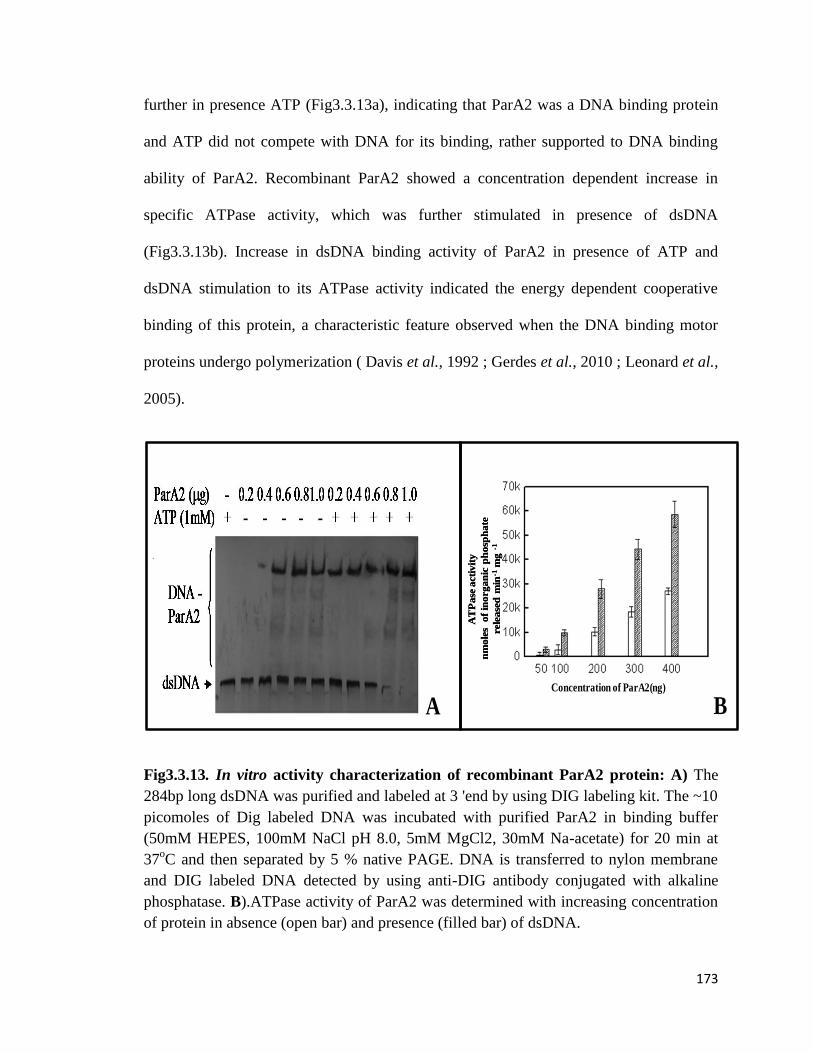
173
further in presence ATP (Fig3.3.13a), indicating that ParA2 was a DNA binding protein
and ATP did not compete with DNA for its binding, rather supported to DNA binding
ability of ParA2. Recombinant ParA2 showed a concentration dependent increase in
specific ATPase activity, which was further stimulated in presence of dsDNA
(Fig3.3.13b). Increase in dsDNA binding activity of ParA2 in presence of ATP and
dsDNA stimulation to its ATPase activity indicated the energy dependent cooperative
binding of this protein, a characteristic feature observed when the DNA binding motor
proteins undergo polymerization ( Davis et al., 1992 ; Gerdes et al., 2010 ; Leonard et al.,
2005).
A
TP
ase
acti
vit
y
nm
ole
s o
f in
org
an
ic p
ho
sph
ate
rele
ase
d m
in-1
mg
-1
Concentration of ParA1 (ng)
AT
Pa
se a
cti
vit
y
nm
ole
s o
f in
org
an
ic p
ho
sph
ate
rele
ase
d m
in-1
mg
-1
Concentration of ParA1 (ng)
Concentration of ParA2(ng)
A B
ATPase activity
nmoles of inorganic phosph
ate
released min-1 mg -1
Concentration of ParA1 (ng)
ATPase activity
nmoles of inorganic phosph
ate
released min-1 mg -1
Concentration of ParA1 (ng)
Concentration of ParA2(ng)
A B
ParA2 alone
ParA2 + ds DNA
Fig3.3.13. In vitro activity characterization of recombinant ParA2 protein: A) The
284bp long dsDNA was purified and labeled at 3 'end by using DIG labeling kit. The ~10
picomoles of Dig labeled DNA was incubated with purified ParA2 in binding buffer
(50mM HEPES, 100mM NaCl pH 8.0, 5mM MgCl2, 30mM Na-acetate) for 20 min at
37oC and then separated by 5 % native PAGE. DNA is transferred to nylon membrane
and DIG labeled DNA detected by using anti-DIG antibody conjugated with alkaline
phosphatase. B).ATPase activity of ParA2 was determined with increasing concentration
of protein in absence (open bar) and presence (filled bar) of dsDNA.
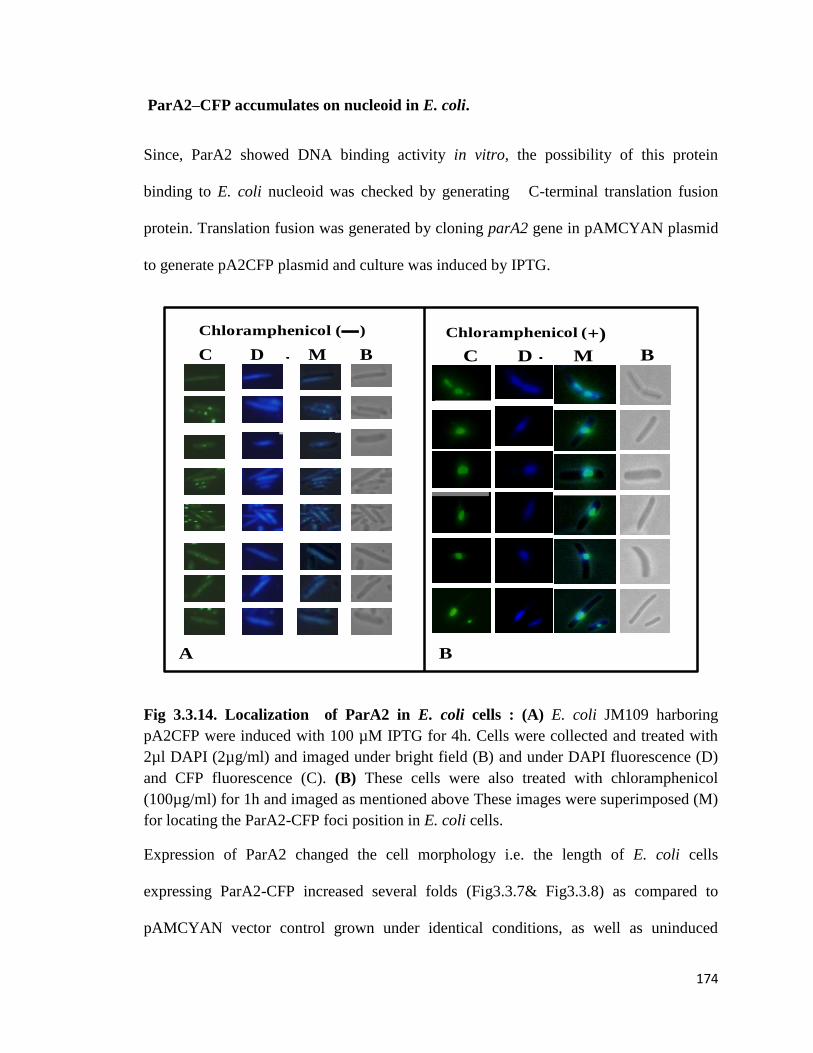
174
ParA2–CFP accumulates on nucleoid in E. coli.
Since, ParA2 showed DNA binding activity in vitro, the possibility of this protein
binding to E. coli nucleoid was checked by generating C-terminal translation fusion
protein. Translation fusion was generated by cloning parA2 gene in pAMCYAN plasmid
to generate pA2CFP plasmid and culture was induced by IPTG.
Chloramphenicol - Chloramphenicol +Chloramphenicol - Chloramphenicol +
A B
C D M B
Chloramphenicol - Chloramphenicol +Chloramphenicol - Chloramphenicol +
A B
C D M B
Chloramphenicol ( ) Chloramphenicol (+)
A B
Fig 3.3.14. Localization of ParA2 in E. coli cells : (A) E. coli JM109 harboring
pA2CFP were induced with 100 µM IPTG for 4h. Cells were collected and treated with
2µl DAPI (2µg/ml) and imaged under bright field (B) and under DAPI fluorescence (D)
and CFP fluorescence (C). (B) These cells were also treated with chloramphenicol
(100µg/ml) for 1h and imaged as mentioned above These images were superimposed (M)
for locating the ParA2-CFP foci position in E. coli cells.
Expression of ParA2 changed the cell morphology i.e. the length of E. coli cells
expressing ParA2-CFP increased several folds (Fig3.3.7& Fig3.3.8) as compared to
pAMCYAN vector control grown under identical conditions, as well as uninduced
175
transgenic E. coli (Fig3.3.7& Fig3.3.8). This further confirmed that both ParA2-CFP and
ParA2 alone are making similar phenotypic change in E. coli. Exponential growing cells
were stained with DAPI micrographs showed in most of the cells nucleoid spreading
across the cell filaments as normally observed in typical E. coli cells (Fig3.3.14a) except
few cells have shown DNA condensation. Overlapping micrographs of bright field, DAPI
stained and CFP fluorescent cells confirmed the localization of ParA2-CFP all along the
nucleoid of E. coli cells (Fig3.3.14). To further confirm ParA2 binds to dsDNA
exponential growing ParA2-CFP expressing cells was treated with Chloramphenicol
(translation inhibitor) of 100 µgml-1
, chloramphenicol treated cells showed condensation
of the DNA along with it ParA2-CFP florescent signal also condensed (Fig3.3.14b),
suggesting ParA2 could bind to E. coli nucleoid, which could be a possible mechanism of
cell division inhibition and a cause of cell size increase.
ParA2 complements for SlmA phenotype in E. coli.
Deletion of ParB2 in D. radiodurans or over expression of ParA2 in E. coli as well as in
D. radiodurans inhibited cell division process mostly by preventing FtsZ ring formation.
In- vitro, in-vivo experiments suggested ParA2 randomly binds to DNA. Here we
hypothesized binding of ParA2 with nucleoid could possibly inhibit the cell division a
known functions of the Nucleoid occlusion proteins , SlmA in E. coli (Bernhardt and de
Boer, 2005;Cho et al., 2011) and the „Noc‟ protein in Bacillus subtilis (Wu et al., 2009).
These proteins are known to inhibit cell division by bringing nucleoid occlusion at the
vicinity of FtsZ ring formation. Thus, the possibilities of ParA2 inhibiting cell division by
either nucleoid occlusion or on other hand it may be through the affecting DNA
replication and genome segregation. The functional complementation of ParA2 in slmA

176
single and slmA minCDE double mutant phenotypes of E. coli was examined. E. coli
strain TB85 (∆slmA) and E. coli strain TB86 (∆minCDE ∆slmA) were transformed with
pA2CFP plasmid and expression of ParA2-CFP was confirmed by immunoblotting. The
slmA mutant expressing ParA2 grew similar to slmA single mutant control. The
slmAminCDE double mutant expressing ParA2 helped these cells to recover the growth
defect of double mutant in rich medium (Fig3.3.15a). Since, ParA2 expression did not
posed lethality in slmA single mutant, which could be anticipated if this protein had
affected DNA replication or genome segregation in E. coli, suggesting that ParA2 does
not seem to be affecting these DNA metabolic processes at least in this background.
slmA minCDE + Vector
slmA minCDE + ParA2
slmA + vector
slmA + ParA2
A
B
Vector
A
B
A
B
A
B
2µm 2µm 2µm 2µm
2µm2µm2µm
2µm
Δ slmA
Δ slmA
+Δ minCDE
10 -1 10-2 10-3 10-4
Vector +IPTG pSPDA01 pSPDA01 +IPTG
Fig 3.3.15: Functional complementation studies: The slmA, slmA∆minCDE double
mutants of E. coli were transformed with pAMCYAN (vector) and pA2CFP (ParA2). A)
Induced cells were spotted in different dilutions and growth of different culture was
recorded after overnight B) Similarly micrographs of ParA2 trans-complemented culture
was checked by inducing cultures with 100 µm IPTG.
177
On the other hand, the over expression of ParA2 in slmAminCDE double mutant showed
functional complementation and these cells showed asymmetric cell division producing a
very high frequency of polar cell bodies (Fig3.3.15b). Asymmetric cell division has been
observed in E. coli cells lacking MinCDE system. This indicated that ParA2 expression
could make slmAminCDE double mutant to behave like minCDE single mutant. These
results therefore, suggested that ParA2 effect on cell division was possibly not by
affecting DNA replication or other related DNA metabolism but most likely by
functioning similar to SlmA protein in E. coli, which is known for bringing nucleoid
occlusion to the vicinity of septum formation.
Bacteria‟s having multiple chromosomes like V. cholerae, B. coencephacia etc. encodes
partitioning system on both primary and secondary chromosomes. Indespensibility of
cognate „par‟ system for their segregation (Egan and Waldor, 2003;Hui et al.,
2010;Passot et al., 2012) and also in controlling and coordinating segregation process
(Mohl et al., 2001) have been demonstrated. Here the deletion of parB2 showed
pleiotropic effects such as growth defect, anucleation and cell morphology as studied in
this thesis. The effect of ParB deletion in regulation of cell division has been shown in
C. crescentus (Mohl et al., 2001). In case of C. crescentus, it is shown that the deletion
of parB resulted in change in the ratio of ParA to ParB in the cell, which could result in
the blockage of cell division. ParB2 mutant of D. radiodurans and over expression of
ParA2 showed septum breakage and nucleoid occlusion was observed at the vicinity of
FtsZ ring growth.
Studies on FtsZ regulation in B. subtilis and E. coli showed spatiotemporal regulation of
FtsZ could be either by direct interaction with FtsZ and modulating its activities almost

178
similar to MinD inhibit lateral interaction of FtsZ and formation of FtsZ ring at the
poles. SlmA in E. coli (Bernhardt and de Boer, 2005) and Noc in B. subtilis (Wu et al.,
2009) strongly interact with the nucleoid and prevents FtsZ ring formation on nucleoid.
In vitro studies of ParA2 along with FtsZ revealed nearly no change in the functional
characteristics of FtsZ. However ParA2 is found to be a strong DNA binding ATPase and
co localizes along the nucleoid. This overall mechanism is analogues to the nucleoid
occlusion mechanism reported in other bacteria.
To further confirm ParA2 inhibiting cell division process through nucleoid occlusion
mechanism, we checked the functional complementation of ParA2 protein in slmA mutant
as well as in slmAminCD mutant. We found that the expression of ParA2 in slmA mutant
of E. coli showed functional complementation to SlmA loss and rescued the cells from
lethality (Bernhardt and de Boer, 2005). The results presented in this thesis together
suggested that ParA2 in absence of ParB2 or in higher ratio regulates cell division by
inhibiting FtsZ ring progression in E. coli by nucleoid occlusion mechanism and to
septum breakage in D. radiodurans.

179
Discussion

180
Segregation of duplicated genome is a pre-requisite for cell division. Regulation of these
two mutually inclusive processes has been better understood in eukaryotes possibly
because of the large cell size with a better characterized cytoskeleton and an ease to
image the real time protein-protein and DNA protein interactions in the cells. However,
in prokaryotes these two processes have been studied with limited details. Like in
eukaryotes, the faithful transmission of genetic information from one cell to other cells by
accurate genome partitioning is also coordinated with cell division in bacteria (Gerdes et
al., 2010). Here, the genome partitioning mainly occurs by either pushing or pulling of
duplicated genome toward the cell poles. This involves three core components (i) an
origin-proximal centromere or similar cis-element (ii) a centromere binding and (iii) P-
loop Walker ATPases, which through polymerization/ depolymerization dynamics
provide force leading to the movement of centromere (Gerdes et al., 2010;Hayes and
Barilla, 2006). Understanding on the mechanisms of genome segregation has come
mainly from bacteria segregating low copy plasmids and or single circular chromosome.
Recently, the genome sequence of several bacteria from the diverse phylogenetic groups,
have been published. Deinococcus radiodurans (White et al., 1999) along with some
other notable ones like Agrobacterium tumefaciens, Sinorhizobium meliloti (Kahng and
Shapiro, 2003), and human pathogen Vibrio cholerae (Heidelberg et al., 2000) harbors
multipartite genome and both primary as well as secondary chromosomes in many of
these bacteria contain multiple centromeres (Livny et al., 2007). However, the molecular
basis of multipartite genome segregation and the nature of chromosome partitioning
systems in these organisms are not studied, except Vibrio cholerae and Burkholderia
cenocepacia (Dubarry et al., 2006; Fogel and Waldor, 2005 & 2006; Yamaichi et al.,
2007). D. radiodurans is a polyextremophile with an extraordinary resistance to gamma
radiation (Slade and Radman, 2011). Genome sequence of this bacterium revealed
several interesting facets (White et al., 1999). Amongst these, the presence of multipartite
genome system, ploidy and multicopy genes were speculated to hold key for its extreme
phenotypes. This bacterium contains four genetic elements designated as chromosome I
(2.65 Mb), chromosome II (412 kb), megaplasmid (177 kb) and small plasmid (46kb).
The maintenance of multipartite genome and ploidy in dividing cells of bacteria has been
the interesting questions and equally intriguing.

181
In order to understand the mechanisms of genome segregation in this bacterium, its
genome sequences was searched for the presence of typical partitioning proteins and
centromere like elements. Results showed that chromosome I and chromosome II have
some of the conserved boxes of P1 parS element. But these were lacking the complete
structure of P1 parS and did not have the binding site for integration host factor (IHF)
between the „B‟ boxes responsible for ParB binding. Because of these limitations, the
possibility of chromosome I and chromosome II have plasmid type centromeres were
conceptually ruled out. However, chromosome I contained three chromosomal type (B.
subtilis type) centromeric sequences named as segS1, segS2 and segS3 while
chromosome II does not have typical B. subtilis type chromosomal centromeres. Genome
sequence of this bacterium was found containing multiple sets of genes for both ParA and
ParB partitioning proteins. These are organized in form of parAB operon on chromosome
I, chromosome II and megaplasmid. Small plasmid did not have these proteins encoded
upon. Functional motif analysis in these proteins showed that ParA of chromosome I
(ParA1) is very close to its homologues reported from chromosomes of different bacteria.
While ParA encoded on chromosome II (ParA2) and mega plasmid‟s (ParA3 and ParA4)
are clustered much away from chromosomal type ParA‟s in phylogenetic tree and these
clustered with aberrant ParA proteins closer to cell division regulatory proteins in
bacteria. ParB‟s encoded from all four „par‟ operons (ParB1 on chromosome I, ParB2 on
chromosome II and ParB3 and ParB4 on mega plasmid) were nearly similar except some
crucial differences in helix turn helix motifs of these proteins. ParB proteins of accessory
chromosome showed change in the helix7 known to function in recognition of the
centromere like sequence (Leonard et al., 2004), where as ParA1 and ParA4 of D.

182
radiodurans had extra N-terminal region (Leonard et al., 2005). The ParB2 deletion
mutant showed a higher frequency of anucleation as compared to wild type cells.
Although, the functional significance of these structural changes in ParB variants of
D. radiodurans is not understood, the possibility of these ParB‟s recognizing different
types of centromeric sequences or having pleiotropic effects cannot be ruled out. These
results indicated that chromosome I most probably contains both cis elements and trans
acting factors of genome partitioning similar to chromosomal type. Absence of typical
centromeric sequences either parS type or B. subtilis type, in chromosome II and
megaplasmid and clustering of their ParA proteins with a different class of regulatory
proteins might argue that partitioning of chromosome II and megaplasmid might follow
different mechanisms. The possibility of either aberrant P1 parS type element without
IHF binding region and or a completely unknown centromere functioning in these
secondary genomes partitioning using the different sets of correspondingly encoded „Par‟
proteins cannot be ruled out and would be worth investigating.
The functional significance of both centromeric sequences and putative partitioning
proteins were evaluated experimentally. It is observed that an unstable mini-F plasmid
pDAG203 (Dubarry et al., 2006;Lemonnier et al., 2000), bearing putative centromere‟s
of chromosome I could stabilize in dividing population of E. coli at much higher
frequency than pDAG203 plasmid vector. Interestingly, segS1 and segS2 elements could
help nearly 100% segregation of pDAG203 irrespective of cognate ParA and ParB
proteins expression in trans. In case of segS3, though cells containing pDAG203 bearing
segS3 could segregate this plasmid at much higher frequency than vector alone but this
frequency increased further when the cognate ParAB operon was expressed in these cells.

183
This suggested that segS elements have property of centromere and segS1 and segS2
could be recognized by perhaps uncharacterized trans acting factors in E. coli, which
would be worth studying independently. Molecular interaction studies between the
ParA1/ParB1 and segS elements suggested that ParA1 could form polymers in presence
of dsDNA as evidenced from sedimentation analysis and light scattering studies. Higher
ATPase activity of ParA1 in presence of segS3-ParB1 as compared to other centromeric
complexes, and the faster gel mobility of a hypothetical {segS3-ParB1P} nucleoprotein
complex, but not {segS1- ParB1P} / {segS2-ParB1P} complex specially in presence of
ATP, suggested that ParA1 is a DNA binding protein and the ParA1 polymerization /
depolymerization may be regulated by the levels of its intrinsic ATPase activity. Both
DNA binding of ParA1 and its polymerization / depolymerization as a function of its
ATPase activity, are the typical characteristics of ATPases associated with genome
segregation. Further studies will be required to understand the real-time functioning of
segS and ParA1B1, and the oscillation of ParA1 proteins on genome of D. radiodurans.
Results obtained on the ParA1B1 dependent role of segS3 elements in mini-F plasmid
stability and nearly 8-13 % loss of nucleoid in ∆parB1 mutant of D. radiodurans in
comparison of 1% in normal cells strongly supported the roles of both segS and „Par‟
proteins of this bacterium in its genome segregation.
Results presented here report for the first time, that (i) the ParA1 was a DNA binding
ATPase, (ii) the ParB1 was sequence specific centromere binding protein, (iii) the
ATPase activity of ParA1 was stimulated in presence of both ParB1 and dsDNA that
seems to be regulating the dynamics of ParA1 polymerization, (iv) segS elements
function like bacterial centromere‟s for unstable plasmid segregation and ParB1 has a
184
role in genome maintenance in D. radiodurans. These findings collectively suggested
that both segS elements and „Par‟ proteins encoded on chromosome I of D. radiodurans
are functionally active and play a role in genome segregation and maintenance of
chromosome in this bacterium. Time lapse fluorescence microscopy showing the
formation of GFP-ParA1 gradient in E. coli cells having unstable plasmid cloned with
segS elements further suggesting a characteristic feature associated with pulling
mechanisms of genome segregation in bacteria.
Chromosome II is not found to contain the typical bacterial centromeres of either P1
plasmid type (parS) and / or chromosomal type. Multiple sequence alignment and
homology search analysis have grouped ParA2, a ParA type protein encoded on
chromosome II of D. radiodurans R1, with small ParA‟s between the
chromosome partitioning protein ParA, and cell division regulatory proteins like MinD
and MipZ. These proteins were functionally characterized both in vitro and in vivo.
ParA2 was found to be a DNA binding ATPase in vitro. ParA2 expressing in E. coli
inhibited cell division and produced ParA2-CFP foci on nucleoid. These cells showed
localization of FtsZ-YFP on membrane but the formation of complete FtsZ ring was not
observed. The formation of FtsZ ring a component of divisome is temporally and
spatially regulated by the coordination of a large number of cell division proteins forming
a functional divisome complex (Adams and Errington, 2009). Further the DNA
replication, genome segregation and position of the nucleoid in the cells play regulatory
roles in cell division (Lutkenhaus, 2007). In certain bacteria, the spatial regulation of FtsZ
is brought about by the mechanism of nucleoid occlusion, which involves proteins like
„Noc‟ in Bacillus (Wu and Errington, 2004) and „SlmA‟ in E. coli (Tonthat et al., 2011).
185
These proteins bind to nucleoid and bring occlusion at the vicinity of septum formation.
„SulA‟ a SOS response protein in E. coli (Bridges, 1995;Lowe et al., 2004) functions
directly by interacting with FtsZ and by inhibiting its GTPase activity. Further, the cell
wall and cell membrane of D. radiodurans, Bacillus subtilis and E. coli are entirely
different in composition and architecture but the divisome components in these bacteria
are largely conserved. Except that, the B. subtilis and E. coli have Div IVA, MinE,
respectively, while D. radiodurans contains both of these cell division regulatory
proteins. E. coli cells defective in MinCDE proteins undergo asymmetric cell division at
the poles leading to formation of mini cells. The FtsZ from these bacteria have
considerable sequence homology with FtsZ from D. radiodurans and mechanistically
they perform identical functions. Molecular mechanisms underlying ParA2 inhibition of
cell division was further investigated around these known facts. It was observed that
mixing of ParA2 with FtsZ of D. radiodurans and E. coli separately, neither affected
GTPase activity or polymerization characteristics of FtsZ. Suggesting no direct effect of
ParA2 on FtsZ activity and polymerization at least, in vitro. Also, the data obtained on
ParA2 inhibition of FtsZ ring formation in vivo and almost no effect of ParA2 on FtsZ
localization to the membrane in both E. coli and D. radiodurans, further ruled out any
possibility of ParA2 inhibiting the binding of FtsZ at the site of Z ring initiation.
Although, the possibility of ParA2 inhibiting lateral interaction of FtsZ protofilaments
has not been ruled out in vivo, it is very clear that the over expression of ParA2 brings
nucleoid in the path of FtsZ ring growth, further suggesting the possible role of ParA2 in
nucleoid occlusion. ParA2 expressing in slmAminCDE mutant of E. coli complemented
slmA mutant phenotype and these cells now produced polar cell division a characteristic

186
phenotype of minCDE mutation in E. coli. The D. radiodurans expressing ParA2 showed
the initiation of septum formation but its further growth was inhibited at nucleoid.
Functional complementation of ParA2 for SlmA defect in E. coli and the arrest of septal
growth at the vicinity of nucleoid in ParA2 over expressing D. radiodurans suggested
that ParA2 play a role in regulation of cell division most likely by nucleoid occlusion
mechanism.
Thus, in this study we have first time identified the centromeric sequences from
D. radiodurans and functionally characterized centromere as well as putative partitioning
proteins encoded on chromosome I in vivo and in vitro. Enhanced stability of unstable
mini-F plasmid in presence centromere and its cognate partitioning proteins, oscillation
of GFP-ParA1 in E. coli harboring plasmid with centromere, and loss of nucleoid in
parB1 deletion mutant of D. radiodurans strongly supported the in vitro activity
characterization of these elements and their roles in genome segregation by pulling
mechanisms. ParA2 in absence or lower ratio of ParB2 perform a different function other
than genome segregation i.e. in the regulation of cell division has been another new and
novel finding from this study. Increase in cell size and anucleation in parB2 deletion
mutant further suggested the role of ParA2B2 system beyond genome segregation, which
would be worth investigating.

187
Summary, conclusion
and future perspectives

188
This work was carried out to address some of the questions related to chromosome
segregation in a radiation resistant bacterium Deinococcus radiodurans harboring
multipartite genome system. Using databases and on-line software, the primary
sequences of ParA‟s and ParB‟s encoded on chromosome I, chromosome II and
megaplasmid were compared with ParA and ParB homologues from other bacteria.
Analyses showed that ParA and ParB encoded on chromosome I are closer to
chromosomal type ParA and ParB. Nevertheless, the ParB1 and ParB4 of D. radiodurans
have slight differences in HTH motifs as compared to chromosomal ParB‟s of other
bacteria indicating the possibility of these proteins might be recognizing centromeric
sequences structurally different from conserved cis elements. Similarly, ParA‟s of this
bacterium were compared with ParA type proteins in database and noticed that ParA1 in
chromosome I is similar to chromosomal type ParA‟s while ParA of secondary genome
(ParA2, ParA3 and ParA4) were distinctly different from ParA‟s reported in the
literature. Interestingly, ParA of secondary genomes are phylogenetically closer to
bacterial cell division regulatory proteins. These analyses therefore, could allow us to
speculate that there may not be functional redundancy amongst these proteins.
Using bioinformatic analysis, the centromeric sequences were searched for both P1 type
plasmid as well as Bacillus subtilis type chromosomal centromeres. Chromosome I
showed the presence of centromeric sequences similar to that reported from Bacillus
subtilis. Thus through this study, we have been able to predict three centromeric
sequences in chromosome I named as segS1.segS2 and segS3, and functional prediction
of ParA‟s and ParB‟s encoded on all the genome replicating units of D.radiodurans.
Further study was carried out for validation of bioinformatic predictions. In vitro studies

189
with purified recombinant proteins confirmed ParA1 as a DNA binding ATPase and
ParB1 as a sequences specific centromere segS, binding protein. Co-incubation of ParA1
with segS bound ParB1 showed formation of higher order structure as detected by
increased light scattering and sedimentation of ParA1 in pellet fraction. This structure
was selectively destabilized within 30 min, once ATP was added at least in case of segS3
elements. ParA1 incubation with ParB1 bound to segS3 showed highest ATPase activity
stimulation as compared to segS1/segS2/DP1 elements. These results indicated that
ParA1 interaction with segS3-ParB1complex was different than similar complex with
other putative centromeric sequences. Using plasmid stability assay of mini-F instable
plasmid, parB1 deletion mutant analysis under fluorescence microscope, it was
demonstrated that putative centromeric sequences segS1/ segS2/ segS3 are true bacterial
centromeres in D. radiodurans. Unlike segS3, the segS1 and segS2 bearing instable
plasmid could distribute evenly in dividing population by almost 100% frequency.
However, segS3 required its cognate ParA1 and ParB1 for its efficient function in
plasmid segregation in E. coli. Interestingly, the E. coli cells bearing segS2 and segS3
elements cloned plasmid showed dynamic oscillation of ParA1 in presence of ParB1.
GFP-ParA1 fusion formed a dynamic fluorescent gradient of ParA from one pole to other
within the cell. These results collectively characterized the complete partitioning system
of chromosome I in D. radiodurans. Characteristic features of these elements
indicated a strong possibility of chromosome I segregation might be occurring by pulling
mechanism.
In silico analysis also indicated that „ParA‟ proteins of secondary chromosome are
catgeriosed into separate group between chromosomal and plasmid type of „ParA‟

190
proteins. Therefore, the „Par‟ proteins of its chromosome II were functionally
characterized. The parB2 gene was deleted from the genome of D. radiodurans and
effect of parB2 deletion was monitored on growth and anucleation phenotypes. The
parB2 deletion resulted in growth inhibition and higher frequency of anucleation as well
as change in cell morphology. Microscopic examination of mutant and wild type cells (D.
radiodurans) stained with Nile red and DAPI showed increased percentage of cell
division blockage. Molecular basis of parB2 deletion making impact on cell division was
not known. Since, ParA2 and ParB2 are expressing in an operon and in a stoichiometric
ratio are important in genome segregation, absence of ParB2 would make change in the
ratio of ParA2 within the cell and regulation of cell division due to change in ParA2
stiochiometry cannot be ruled out and was therefore, hypothesized. To test this
hypothesis, the ParA2 was over expressed in wild type D. radiodurans cells and cell
morphology was examined. Interestingly, ParA2 over expressing and parB2 deletion
mutant cells of D. radiodurans showed similar phenotype of cell morphology change and
cell septum breakage. This supported the hypothesis that change in stiochiometry of
ParA2 to ParB2 could have inhibited cell division. Similar observation was also made in
the E. coli cell expressing ParA2. These cells showed a very high degree of cell
elongation by inhibition of FtsZ ring maturation. FtsZ localization in mid cell was not
inhibited but the progression of Z ring was inhibited and that would have possibly led to
cell elongation. Molecular mechanisms underlying the inhibition of FtsZ ring formation
was investigated and found that ParA2 does not interfere directly with the activity and
polymerization characteristics of FtsZ in vitro. The possibility of ParA2 having roles in
resolution of duplicated genome from the vicinity of FtsZ ring growth cannot be ruled

191
out. ParA2 is characterized as a DNA binding ATPase and expression of ParA2-CFP
showed its binding on nucleoid of both D. radiodurans and E. coli cells, which raised a
strong possibility of ParA2 bringing out nucleoid occlusion in these cells. For testing this
hypothesis, the ParA2 was expressed on a plasmid, in slmAminCDE double mutant
background of E. coli and the functional loss of SlmA a nucleoid occlusion protein, in E.
coli was monitored. The cells expressing ParA2 in trans showed complete
complementation of growth defect in rich medium. Although, ParA2 and SlmA do not
have structural similarities and unlike SlmA, ParA2 does not affect FtsZ functions in
vitro, these can still be functionally similar in terms of their DNA binding functions may
be speculated. This speculation might get strong support from the facts that Noc of
Bacillus subtilis and SlmA of E. coli are two quite different proteins in terms of structure
and also Noc does not affect FtsZ activities in vitro, they still play roles in cell division
regulation in respective hosts by bringing nucleoid occlusion at the vicinity of FtsZ ring
growth. These results suggested that ParA2 over expression inhibited bacterial cell
division by interfering with septal ring growth possibly through the nucleoid occlusion
mechanism as known for SlmA protein in E. coli.
This thesis for the first time reports the characterization of complete genome partitioning
system of chromosome I in D. radiodurans. The work includes the identification and
characterization of centromeric sequences and partitioning proteins. Chromosome II does
not have classical bacterial centromere‟s neither Bacillus type nor P1 plasmid type. The
role of partitioning protein ParB2 is demonstrated in genome maintenance while ParA2
over expression incidentally showed growth defect in both E. coli and D. radiodurans.
Further studies revealed that this growth defect was largely at the levels of cell division

192
inhibition, most probably by inhibiting the separation of duplicated genome due to its
tight binding on nucleoid in the absence of ParB2. As described above, this study has
provided some answer to the question of „Par‟ proteins functional redundancy but clearly
demonstrated that the mechanism for primary chromosome segregation is mostly like by
pulling mechanism as known in both multi chromosome and single chromosome
containing bacteria characterized till date. ParB deletion studies have provided
significant clues that ParB‟s are strongly regulating the segregation of cognate genome, it
had not completely ruled out however, whether other „ParB‟ proteins would work in the
absence of one because genome of this bacterium exists in toroidal form and the mere
anucleation may not be sufficient to conclude that ParB‟s are non-redundant.
Work carried out under this thesis has answered some of the questions on mechanisms of
genome segregation and functional redundancy of “Par” proteins, and tested the proposed
hypotheses both experimentally as well as bioinformatically. It has however, raised and
left several questions unanswered. The immediate ones that may require attention include
(i) Real-time monitoring of ParB1 protein interaction with centromere‟s and
demonstration of ParA1 dynamic movement on genome leading to duplicated genome
segregation in D. radiodurans. (ii) How do three segS function in chromosome I
partitioning in vivo, (iii) Functional redundancy of various ParA and ParB proteins during
genome segregation, (iv) ParA2 characterization has provided strong clues that this
protein is linked between cell division and genome segregation, the factors necessary for
ParA2 performing one of these two functions at a given time, at the molecular levels, and
(v) whether putative centromeric sequences marginally different from typical parS have
any role in genome maintenance Further it would be interesting to see if aberrant parS

193
present on chromosome II and mega plasmid, are also centromeric region on these
replication units and that would be a novel finding leading to a logical shift in highly
focused paradigm on the nature of bacterial centromere‟s.
Reference List
Adams,D.W., and Errington,J. (2009) Bacterial cell division: assembly, maintenance and disassembly of
the Z ring. Nat Rev Microbiol 7: 642-653.
Aravind,L., Wolf,Y.I., and Koonin,E.V. (2000) The ATP-cone: an evolutionarily mobile, ATP-binding
regulatory domain. J Mol Microbiol Biotechnol 2: 191-194.
Austin,S., and Abeles,A. (1983) Partition of unit-copy miniplasmids to daughter cells. II. The partition
region of miniplasmid P1 encodes an essential protein and a centromere-like site at which it acts. J Mol
Biol 169: 373-387.
Bartosik,A.A., Lasocki,K., Mierzejewska,J., Thomas,C.M., and Jagura-Burdzy,G. (2004) ParB of
Pseudomonas aeruginosa: interactions with its partner ParA and its target parS and specific effects on
bacterial growth. J Bacteriol 186: 6983-6998.
Battista,J.R., Park,M.J., and McLemore,A.E. (2001) Inactivation of two homologues of proteins presumed
to be involved in the desiccation tolerance of plants sensitizes Deinococcus radiodurans R1 to desiccation.
Cryobiology 43: 133-139.
Bentchikou,E., Servant,P., Coste,G., and Sommer,S. (2007) Additive effects of SbcCD and PolX
deficiencies in the in vivo repair of DNA double-strand breaks in Deinococcus radiodurans. J Bacteriol
189: 4784-4790.
Bernhardt,T.G., and de Boer,P.A. (2005) SlmA, a nucleoid-associated, FtsZ binding protein required for
blocking septal ring assembly over Chromosomes in E. coli. Mol Cell 18: 555-564.
Blasius,M., Sommer,S., and Hubscher,U. (2008) Deinococcus radiodurans: what belongs to the survival
kit? Crit Rev Biochem Mol Biol 43: 221-238.
Bloom,K., and Joglekar,A. (2010) Towards building a chromosome segregation machine. Nature 463: 446-
456.
Bouet,J.Y., Ah-Seng,Y., Benmeradi,N., and Lane,D. (2007) Polymerization of SopA partition ATPase:
regulation by DNA binding and SopB. Mol Microbiol 63: 468-481.
Bouet,J.Y., and Funnell,B.E. (1999) P1 ParA interacts with the P1 partition complex at parS and an ATP-
ADP switch controls ParA activities. EMBO J 18: 1415-1424.
Bradford,M.M. (1976) A rapid and sensitive method for the quantitation of microgram quantities of protein
utilizing the principle of protein-dye binding. Anal Biochem 72: 248-254.
Bramkamp,M., and van,B.S. (2009) Division site selection in rod-shaped bacteria. Curr Opin Microbiol 12:
683-688.
194
Bridges,B.A. (1995) Are there DNA damage checkpoints in E. coli? Bioessays 17: 63-70.
Cho,H., McManus,H.R., Dove,S.L., and Bernhardt,T.G. (2011) Nucleoid occlusion factor SlmA is a DNA-
activated FtsZ polymerization antagonist. Proc Natl Acad Sci U S A 108: 3773-3778.
Clark,A.J. (1971) Toward a metabolic interpretation of genetic recombination of E. coli and its phages.
Annu Rev Microbiol 25: 437-464.
Cox,M.M., Keck,J.L., and Battista,J.R. (2010) Rising from the Ashes: DNA Repair in Deinococcus
radiodurans. PLoS Genet 6: e1000815.
Dabrazhynetskaya,A., Brendler,T., Ji,X., and Austin,S. (2009) Switching protein-DNA recognition
specificity by single-amino-acid substitutions in the P1 par family of plasmid partition elements. J
Bacteriol 191: 1126-1131.
Daly,M.J., and Minton,K.W. (1995) Interchromosomal recombination in the extremely radioresistant
bacterium Deinococcus radiodurans. J Bacteriol 177: 5495-5505.
Daly,M.J., Gaidamakova,E.K., Matrosova,V.Y., Kiang,J.G., Fukumoto,R., Lee,D.Y. et al. (2010) Small-
molecule antioxidant proteome-shields in Deinococcus radiodurans. PLoS One 5: e12570.
Das,A.D., and Misra,H.S. (2011) Characterization of DRA0282 from Deinococcus radiodurans for its role
in bacterial resistance to DNA damage. Microbiology 157: 2196-2205.
Das,A.D., and Misra,H.S. (2012) DR2417, a hypothetical protein characterized as a novel beta-CASP
family nuclease in radiation resistant bacterium, Deinococcus radiodurans. Biochim Biophys Acta 1820:
1052-1061.
Davis.M.A., Martin. K.A., and Austin. S.J.(1992) Biochemical activities of the parA partition protein of
the P1 plasmid. Mol Microbiol. 6:1141–1147.
De,B.P., Crossley,R., and Rothfield,L. (1992) The essential bacterial cell-division protein FtsZ is a GTPase.
Nature 359: 254-256.
Dedrick,R.M., Wildschutte,H., and McCormick,J.R. (2009) Genetic interactions of smc, ftsK, and parB
genes in Streptomyces coelicolor and their developmental genome segregation phenotypes. J Bacteriol 191:
320-332.
Desai,S.S., Rajpurohit,Y.S., Misra,H.S., and Deobagkar,D.N. (2011) Characterization of the role of the
RadS/RadR two-component system in the radiation resistance of Deinococcus radiodurans. Microbiology
157: 2974-2982.
Donovan,C., Schwaiger,A., Kramer,R., and Bramkamp,M. (2010) Subcellular localization and
characterization of the ParAB system from Corynebacterium glutamicum. J Bacteriol 192: 3441-3451.
Draper,G.C., and Gober,J.W. (2002) Bacterial chromosome segregation. Annu Rev Microbiol 56: 567-597.
Dubarry,N., Pasta,F., and Lane,D. (2006) ParABS systems of the four replicons of Burkholderia
cenocepacia: new chromosome centromeres confer partition specificity. J Bacteriol 188: 1489-1496.
Duggan,D.E.,Anderson,A.W.,and Elliker,P.R.(1963) Inactivation of the radiation resistant spoilage
bacterium Micrococcus radiodurans. I.Radiation inactivation rates in three substrates and in buffers.Appl
Microbiol 11:398-403.
195
Dunham,T.D., Xu,W., Funnell,B.E., and Schumacher,M.A. (2009) Structural basis for ADP-mediated
transcriptional regulation by P1 and P7 ParA. EMBO J 28: 1792-1802.
Dworkin,J., and Losick,R. (2002) Does RNA polymerase help drive chromosome segregation in bacteria?
Proc Natl Acad Sci U S A 99: 14089-14094.
Earl,A.M., Rankin,S.K., Kim,K.P., Lamendola,O.N., and Battista,J.R. (2002) Genetic evidence that the
uvsE gene product of Deinococcus radiodurans R1 is a UV damage endonuclease. J Bacteriol 184: 1003-
1009.
Easter,J., Jr., and Gober,J.W. (2002) ParB-stimulated nucleotide exchange regulates a switch in
functionally distinct ParA activities. Mol Cell 10: 427-434.
Ebersbach,G., and Gerdes,K. (2001) The double par locus of virulence factor pB171: DNA segregation is
correlated with oscillation of ParA. Proc Natl Acad Sci U S A 98: 15078-15083.
Ebersbach,G., and Gerdes,K. (2005) Plasmid segregation mechanisms. Annu Rev Genet 39: 453-479.
Ebersbach,G., Sherratt,D.J., and Gerdes,K. (2005) Partition-associated incompatibility caused by random
assortment of pure plasmid clusters. Mol Microbiol 56: 1430-1440.
Egan,E.S., and Waldor,M.K. (2003) Distinct replication requirements for the two Vibrio cholerae
chromosomes. Cell 114: 521-530.
Egan,E.S., Fogel,M.A., and Waldor,M.K. (2005) Divided genomes: negotiating the cell cycle in
prokaryotes with multiple chromosomes. Mol Microbiol 56: 1129-1138.
Erdmann,N., Petroff,T., and Funnell,B.E. (1999) Intracellular localization of P1 ParB protein depends on
ParA and parS. Proc Natl Acad Sci U S A 96: 14905-14910.
Errington,J. (2003) Regulation of endospore formation in Bacillus subtilis. Nat Rev Microbiol 1: 117-126.
Errington,J., Daniel,R.A., and Scheffers,D.J. (2003) Cytokinesis in bacteria. Microbiol Mol Biol Rev 67:
52-65, table.
Fiebig,A., Keren,K., and Theriot,J.A. (2006) Fine-scale time-lapse analysis of the biphasic, dynamic
behaviour of the two Vibrio cholerae chromosomes. Mol Microbiol 60: 1164-1178.
Fogel,M.A., and Waldor,M.K. (2005) Distinct segregation dynamics of the two Vibrio cholerae
chromosomes. Mol Microbiol 55: 125-136.
Fogel,M.A., and Waldor,M.K. (2006) A dynamic, mitotic-like mechanism for bacterial chromosome
segregation. Genes Dev 20: 3269-3282.
Funayama,T., Narumi,I., Kikuchi,M., Kitayama,S., Watanabe,H., and Yamamoto,K. (1999) Identification
and disruption analysis of the recN gene in the extremely radioresistant bacterium Deinococcus
radiodurans. Mutat Res 435: 151-161.
Funnell,B.E. (1988) Mini-P1 plasmid partitioning: excess ParB protein destabilizes plasmids containing the
centromere parS. J Bacteriol 170: 954-960.
Galkin,V.E., Orlova,A., Rivera,C., Mullins,R.D., and Egelman,E.H. (2009) Structural polymorphism of the
ParM filament and dynamic instability. Structure 17: 1253-1264.

196
Gerdes,K., and Molin,S. (1986) Partitioning of plasmid R1. Structural and functional analysis of the parA
locus. J Mol Biol 190: 269-279.
Gerdes,K., Howard,M., and Szardenings,F. (2010) Pushing and pulling in prokaryotic DNA segregation.
Cell 141: 927-942.
Ghosh,S.K., Hajra,S., Paek,A., and Jayaram,M. (2006) Mechanisms for chromosome and plasmid
segregation. Annu Rev Biochem 75: 211-241.
Gitai,Z. (2006) Plasmid segregation: a new class of cytoskeletal proteins emerges. Curr Biol 16: R133-
R136.
Godfrin-Estevenon,A.M., Pasta,F., and Lane,D. (2002) The parAB gene products of Pseudomonas putida
exhibit partition activity in both P. putida and Escherichia coli. Mol Microbiol 43: 39-49.
Gordon,G.S., and Wright,A. (2000) DNA segregation in bacteria. Annu Rev Microbiol 54: 681-708.
Gordon,S., Rech,J., Lane,D., and Wright,A. (2004) Kinetics of plasmid segregation in Escherichia coli.
Mol Microbiol 51: 461-469.
Guynet,C., and de la,C.F. (2011) Plasmid segregation without partition. Mob Genet Elements 1: 236-241.
Guynet,C., Cuevas,A., Moncalian,G., and de la,C.F. (2011) The stb operon balances the requirements for
vegetative stability and conjugative transfer of plasmid R388. PLoS Genet 7: e1002073.
Hales,L.M., Gumport,R.I., and Gardner,J.F. (1994) Determining the DNA sequence elements required for
binding integration host factor to two different target sites. J Bacteriol 176: 2999-3006.
Hassan,P.A., Sawant,S.N., Bagkar,N.C., and Yakhmi,J.V. (2004) Polyaniline nanoparticles prepared in
rodlike micelles. Langmuir 20: 4874-4880.
Hatano,T., and Niki,H. (2010) Partitioning of P1 plasmids by gradual distribution of the ATPase ParA. Mol
Microbiol 78: 1182-1198.
Hatano,T., Yamaichi,Y., and Niki,H. (2007) Oscillating focus of SopA associated with filamentous
structure guides partitioning of F plasmid. Mol Microbiol 64: 1198-1213.
Hayes,F., and Barilla,D. (2006) Assembling the bacterial segrosome. Trends Biochem Sci 31: 247-250.
Hazan,R., and Ben-Yehuda,S. (2006) Resolving chromosome segregation in bacteria. J Mol Microbiol
Biotechnol 11: 126-139.
Heidelberg,J.F., Eisen,J.A., Nelson,W.C., Clayton,R.A., Gwinn,M.L., Dodson,R.J. et al. (2000) DNA
sequence of both chromosomes of the cholera pathogen Vibrio cholerae. Nature 406: 477-483.
Helsberg,M., and Eichenlaub,R. (1986) Twelve 43-base-pair repeats map in a cis-acting region essential for
partition of plasmid mini-F. J Bacteriol 165: 1043-1045.
Hester,C.M., and Lutkenhaus,J. (2007) Soj (ParA) DNA binding is mediated by conserved arginines and is
essential for plasmid segregation. Proc Natl Acad Sci U S A 104: 20326-20331.
Hiemstra,H., Nanninga,N., Woldringh,C.L., Inouye,M., and Witholt,B. (1987) Distribution of newly
synthesized lipoprotein over the outer membrane and the peptidoglycan sacculus of an Escherichia coli lac-
lpp strain. J Bacteriol 169: 5434-5444.

197
Higgins,D.G., and Sharp,P.M. (1988) CLUSTAL: a package for performing multiple sequence alignment
on a microcomputer. Gene 73: 237-244.
Hirano,M., Mori,H., Onogi,T., Yamazoe,M., Niki,H., Ogura,T., and Hiraga,S. (1998) Autoregulation of the
partition genes of the mini-F plasmid and the intracellular localization of their products in Escherichia coli.
Mol Gen Genet 257: 392-403.
Hui,M.P., Galkin,V.E., Yu,X., Stasiak,A.Z., Stasiak,A., Waldor,M.K., and Egelman,E.H. (2010) ParA2, a
Vibrio cholerae chromosome partitioning protein, forms left-handed helical filaments on DNA. Proc Natl
Acad Sci U S A 107: 4590-4595.
Ireton,K., Gunther,N.W., and Grossman,A.D. (1994) spo0J is required for normal chromosome segregation
as well as the initiation of sporulation in Bacillus subtilis. J Bacteriol 176: 5320-5329.
Jakimowicz,D., Brzostek,A., Rumijowska-Galewicz,A., Zydek,P., Dolzblasz,A., Smulczyk-
Krawczyszyn,A. et al. (2007) Characterization of the mycobacterial chromosome segregation protein ParB
and identification of its target in Mycobacterium smegmatis. Microbiology 153: 4050-4060.
Jakimowicz,D., Zydek,P., Kois,A., Zakrzewska-Czerwinska,J., and Chater,K.F. (2007) Alignment of
multiple chromosomes along helical ParA scaffolding in sporulating Streptomyces hyphae. Mol Microbiol
65: 625-641.
Jensen,R.B., Wang,S.C., and Shapiro,L. (2001) A moving DNA replication factory in Caulobacter
crescentus. EMBO J 20: 4952-4963.
Jha,J.K., Baek,J.H., Venkova-Canova,T., and Chattoraj,D.K. (2012) Chromosome dynamics in
multichromosome bacteria. Biochim Biophys Acta 1819: 826-829.
Kahng,L.S., and Shapiro,L. (2003) Polar localization of replicon origins in the multipartite genomes of
Agrobacterium tumefaciens and Sinorhizobium meliloti. J Bacteriol 185: 3384-3391.
Kamble,V.A., and Misra,H.S. (2010) The SbcCD complex of Deinococcus radiodurans contributes to
radioresistance and DNA strand break repair in vivo and exhibits Mre11-Rad50 type activity in vitro. DNA
Repair (Amst) 9: 488-494.
Khairnar,N.P., and Misra,H.S. (2009) DNA polymerase X from Deinococcus radiodurans implicated in
bacterial tolerance to DNA damage is characterized as a short patch base excision repair polymerase.
Microbiology 155: 3005-3014.
Khairnar,N.P., Kamble,V.A., and Misra,H.S. (2008) RecBC enzyme overproduction affects UV and
gamma radiation survival of Deinococcus radiodurans. DNA Repair (Amst) 7: 40-47.
Khairnar,N.P., Kamble,V.A., Mangoli,S.H., Apte,S.K., and Misra,H.S. (2007) Involvement of a
periplasmic protein kinase in DNA strand break repair and homologous recombination in Escherichia coli.
Mol Microbiol 65: 294-304.
Khairnar,N.P., Misra,H.S., and Apte,S.K. (2003) Pyrroloquinoline-quinone synthesized in Escherichia coli
by pyrroloquinoline-quinone synthase of Deinococcus radiodurans plays a role beyond mineral phosphate
solubilization. Biochem Biophys Res Commun 312: 303-308.
Kim,H.J., Calcutt,M.J., Schmidt,F.J., and Chater,K.F. (2000) Partitioning of the linear chromosome during
sporulation of Streptomyces coelicolor A3(2) involves an oriC-linked parAB locus. J Bacteriol 182: 1313-
1320.

198
Kota,S., and Misra,H.S. (2008) Identification of a DNA processing complex from Deinococcus
radiodurans. Biochem Cell Biol 86: 448-458.
Kota,S., Kamble,V.A., Rajpurohit,Y.S., and Misra,H.S. (2010) ATP-type DNA ligase requires other
proteins for its activity in vitro and its operon components for radiation resistance in Deinococcus
radiodurans in vivo. Biochem Cell Biol 88: 783-790.
Kota,S., Kumar,C.V., and Misra,H.S. (2010) Characterization of an ATP-regulated DNA-processing
enzyme and thermotolerant phosphoesterase in the radioresistant bacterium Deinococcus radiodurans.
Biochem J 431: 149-157.
Larsen,R.A., Cusumano,C., Fujioka,A., Lim-Fong,G., Patterson,P., and Pogliano,J. (2007) Treadmilling of
a prokaryotic tubulin-like protein, TubZ, required for plasmid stability in Bacillus thuringiensis. Genes Dev
21: 1340-1352.
Lasocki,K., Bartosik,A.A., Mierzejewska,J., Thomas,C.M., and Jagura-Burdzy,G. (2007) Deletion of the
parA (soj) homologue in Pseudomonas aeruginosa causes ParB instability and affects growth rate,
chromosome segregation, and motility. J Bacteriol 189: 5762-5772.
Lau,I.F., Filipe,S.R., Soballe,B., Okstad,O.A., Barre,F.X., and Sherratt,D.J. (2003) Spatial and temporal
organization of replicating Escherichia coli chromosomes. Mol Microbiol 49: 731-743.
Lecointe,F., Coste,G., Sommer,S., and Bailone,A. (2004) Vectors for regulated gene expression in the
radioresistant bacterium Deinococcus radiodurans. Gene 336: 25-35.
Lee,M.J., Liu,C.H., Wang,S.Y., Huang,C.T., and Huang,H. (2006) Characterization of the Soj/Spo0J
chromosome segregation proteins and identification of putative parS sequences in Helicobacter pylori.
Biochem Biophys Res Commun 342: 744-750.
Lee, S., Price C. W., (1993)The minCD locus of Bacillus subtilis lacks the minE determinant that provides
topological specificity to cell division. Mol Microbiol. 7:601–610.
Lee,P.S., Lin,D.C., Moriya,S., and Grossman,A.D. (2003) Effects of the chromosome partitioning protein
Spo0J (ParB) on oriC positioning and replication initiation in Bacillus subtilis. J Bacteriol 185: 1326-1337.
Leipe,D.D., Wolf,Y.I., Koonin,E.V., and Aravind,L. (2002) Classification and evolution of P-loop GTPases
and related ATPases. J Mol Biol 317: 41-72.
Lemon,K.P., and Grossman,A.D. (2001) The extrusion-capture model for chromosome partitioning in
bacteria. Genes Dev 15: 2031-2041.
Lemonnier,M., Bouet,J.Y., Libante,V., and Lane,D. (2000) Disruption of the F plasmid partition complex
in vivo by partition protein SopA. Mol Microbiol 38: 493-505.
Leonard,T.A., Butler,P.J., and Lowe,J. (2004) Structural analysis of the chromosome segregation protein
Spo0J from Thermus thermophilus. Mol Microbiol 53: 419-432.
Leonard,T.A., Butler,P.J., and Lowe,J. (2005) Bacterial chromosome segregation: structure and DNA
binding of the Soj dimer--a conserved biological switch. EMBO J 24: 270-282.
Leonard,T.A., Moller-Jensen,J., and Lowe,J. (2005) Towards understanding the molecular basis of
bacterial DNA segregation. Philos Trans R Soc Lond B Biol Sci 360: 523-535.
Levin-Zaidman,S., Englander,J., Shimoni,E., Sharma,A.K., Minton,K.W., and Minsky,A. (2003) Ringlike
structure of the Deinococcus radiodurans genome: a key to radioresistance? Science 299: 254-256.
199
Lewis,R.A., Bignell,C.R., Zeng,W., Jones,A.C., and Thomas,C.M. (2002) Chromosome loss from par
mutants of Pseudomonas putida depends on growth medium and phase of growth. Microbiology 148: 537-
548.
Li,Y., and Austin,S. (2002) The P1 plasmid in action: time-lapse photomicroscopy reveals some
unexpected aspects of plasmid partition. Plasmid 48: 174-178.
Lin,D.C., and Grossman,A.D. (1998) Identification and characterization of a bacterial chromosome
partitioning site. Cell 92: 675-685.
Livny,J., Yamaichi,Y., and Waldor,M.K. (2007) Distribution of centromere-like parS sites in bacteria:
insights from comparative genomics. J Bacteriol 189: 8693-8703.
Livny,J., Yamaichi,Y., and Waldor,M.K. (2007) Distribution of centromere-like parS sites in bacteria:
insights from comparative genomics. J Bacteriol 189: 8693-8703.
Lowe,J., van den,E.F., and Amos,L.A. (2004) Molecules of the bacterial cytoskeleton. Annu Rev Biophys
Biomol Struct 33: 177-198.
Lutkenhaus .J., and Addinall .S.G., (1997) Bacterial cell division and the Z ring. Annu Rev Biochem, 66:
93–116.
Lutkenhaus,J. (2007) Assembly dynamics of the bacterial MinCDE system and spatial regulation of the Z
ring. Annu Rev Biochem 76: 539-562.
Martin,K.A., Davis,M.A., and Austin,S. (1991) Fine-structure analysis of the P1 plasmid partition site. J
Bacteriol 173: 3630-3634.
Mascarenhas,J., Volkov,A.V., Rinn,C., Schiener,J., Guckenberger,R., and Graumann,P.L. (2005) Dynamic
assembly, localization and proteolysis of the Bacillus subtilis SMC complex. BMC Cell Biol 6: 28.
Meima,R., and Lidstrom,M.E. (2000) Characterization of the minimal replicon of a cryptic Deinococcus
radiodurans SARK plasmid and development of versatile Escherichia coli-D. radiodurans shuttle vectors.
Appl Environ Microbiol 66: 3856-3867.
Minsky,A., Shimoni,E., and Englander,J. (2006) Ring-like nucleoids and DNA repair through error-free
nonhomologous end joining in Deinococcus radiodurans. J Bacteriol 188: 6047-6051.
Minton,K.W. (1994) DNA repair in the extremely radioresistant bacterium Deinococcus radiodurans. Mol
Microbiol 13: 9-15.
Misra,H.S., Khairnar,N.P., Barik,A., Indira,P.K., Mohan,H., and Apte,S.K. (2004) Pyrroloquinoline-
quinone: a reactive oxygen species scavenger in bacteria. FEBS Lett 578: 26-30.
Misra,H.S., Khairnar,N.P., Kota,S., Shrivastava,S., Joshi,V.P., and Apte,S.K. (2006) An exonuclease I-
sensitive DNA repair pathway in Deinococcus radiodurans: a major determinant of radiation resistance.
Mol Microbiol 59: 1308-1316.
Moe,E., Hall,D.R., Leiros,I., Monsen,V.T., Timmins,J., and McSweeney,S. (2012) Structure-function
studies of an unusual 3-methyladenine DNA glycosylase II (AlkA) from Deinococcus radiodurans. Acta
Crystallogr D Biol Crystallogr 68: 703-712.
Mohl,D.A., and Gober,J.W. (1997) Cell cycle-dependent polar localization of chromosome partitioning
proteins in Caulobacter crescentus. Cell 88: 675-684.

200
Mohl,D.A., Easter,J., Jr., and Gober,J.W. (2001) The chromosome partitioning protein, ParB, is required
for cytokinesis in Caulobacter crescentus. Mol Microbiol 42: 741-755.
Moseley,B.E., and Evans,D.M. (1983) Isolation and properties of strains of Micrococcus (Deinococcus)
radiodurans unable to excise ultraviolet light-induced pyrimidine dimers from DNA: evidence for two
excision pathways. J Gen Microbiol 129: 2437-2445.
Ni,L., Xu,W., Kumaraswami,M., and Schumacher,M.A. (2010) Plasmid protein TubR uses a distinct mode
of HTH-DNA binding and recruits the prokaryotic tubulin homolog TubZ to effect DNA partition. Proc
Natl Acad Sci U S A 107: 11763-11768.
Ogura,T., and Hiraga,S. (1983) Mini-F plasmid genes that couple host cell division to plasmid
proliferation. Proc Natl Acad Sci U S A 80: 4784-4788.
Ogura,Y., Ogasawara,N., Harry,E.J., and Moriya,S. (2003) Increasing the ratio of Soj to Spo0J promotes
replication initiation in Bacillus subtilis. J Bacteriol 185: 6316-6324.
Onogi,T., Miki,T., and Hiraga,S. (2002) Behavior of sister copies of mini-F plasmid after synchronized
plasmid replication in Escherichia coli cells. J Bacteriol 184: 3142-3145.
Passot,F.M., Calderon,V., Fichant,G., Lane,D., and Pasta,F. (2012) Centromere binding and evolution of
chromosomal partition systems in the Burkholderiales. J Bacteriol 194: 3426-3436.
Levin.P.A., Shim .J.J., and Grossman.A.D. (1998) Effect of minCD on FtsZ Ring Position and Polar
Septation in Bacillus subtilis J Bacteriol. 180: 6048–6051.
Pratto,F., Cicek,A., Weihofen,W.A., Lurz,R., Saenger,W., and Alonso,J.C. (2008) Streptococcus pyogenes
pSM19035 requires dynamic assembly of ATP-bound ParA and ParB on parS DNA during plasmid
segregation. Nucleic Acids Res 36: 3676-3689.
Pratto,F., Suzuki,Y., Takeyasu,K., and Alonso,J.C. (2009) Single-molecule analysis of proteinxDNA
complexes formed during partition of newly replicated plasmid molecules in Streptococcus pyogenes. J
Biol Chem 284: 30298-30306.
Ptacin,J.L., Lee,S.F., Garner,E.C., Toro,E., Eckart,M., Comolli,L.R. et al. (2010) A spindle-like apparatus
guides bacterial chromosome segregation. Nat Cell Biol 12: 791-798.
Rainey,F.A., Ray,K., Ferreira,M., Gatz,B.Z., Nobre,M.F., Bagaley,D. et al. (2005) Extensive diversity of
ionizing-radiation-resistant bacteria recovered from Sonoran Desert soil and description of nine new
species of the genus Deinococcus obtained from a single soil sample. Appl Environ Microbiol 71: 5225-
5235.
Rajpurohit,Y.S., and Misra,H.S. (2010) Characterization of a DNA damage-inducible membrane protein
kinase from Deinococcus radiodurans and its role in bacterial radioresistance and DNA strand break repair.
Mol Microbiol 77: 1470-1482.
Rajpurohit,Y.S., Gopalakrishnan,R., and Misra,H.S. (2008) Involvement of a protein kinase activity
inducer in DNA double strand break repair and radioresistance of Deinococcus radiodurans. J Bacteriol
190: 3948-3954.
Ravin,N.V., Rech,J., and Lane,D. (2003) Mapping of functional domains in F plasmid partition proteins
reveals a bipartite SopB-recognition domain in SopA. J Mol Biol 329: 875-889.
Ringgaard,S., van,Z.J., Howard,M., and Gerdes,K. (2009) Movement and equipositioning of plasmids by
ParA filament disassembly. Proc Natl Acad Sci U S A 106: 19369-19374.

201
Roberts,M.A., Wadhams,G.H., Hadfield,K.A., Tickner,S., and Armitage,J.P. (2012) ParA-like protein uses
nonspecific chromosomal DNA binding to partition protein complexes. Proc Natl Acad Sci U S A 109:
6698-6703.
Roy,A., Kucukural,A., and Zhang,Y. (2010) I-TASSER: a unified platform for automated protein structure
and function prediction. Nat Protoc 5: 725-738.
Sambrook,J. (2001) Molecular cloning : a laboratory manual / Joseph Sambrook, David W. Russell Cold
Spring Harbor, N.Y. : Cold Spring Harbor Laboratory.
Sandigursky,M., Sandigursky,S., Sonati,P., Daly,M.J., and Franklin,W.A. (2004) Multiple uracil-DNA
glycosylase activities in Deinococcus radiodurans. DNA Repair (Amst) 3: 163-169.
Sawitzke,J.A., and Austin,S. (2000) Suppression of chromosome segregation defects of Escherichia coli
muk mutants by mutations in topoisomerase I. Proc Natl Acad Sci U S A 97: 1671-1676.
Schumacher,M.A. (2007) Structural biology of plasmid segregation proteins. Curr Opin Struct Biol 17:
103-109.
Schumacher,M.A. (2012) Bacterial plasmid partition machinery: a minimalist approach to survival. Curr
Opin Struct Biol 22: 72-79.
Schumacher,M.A., and Funnell,B.E. (2005) Structures of ParB bound to DNA reveal mechanism of
partition complex formation. Nature 438: 516-519.
Sengupta,M., Nielsen,H.J., Youngren,B., and Austin,S. (2010) P1 plasmid segregation: accurate
redistribution by dynamic plasmid pairing and separation. J Bacteriol 192: 1175-1183.
Sharpe,M.E., and Errington,J. (1995) Postseptational chromosome partitioning in bacteria. Proc Natl Acad
Sci U S A 92: 8630-8634.
Shebelut,C.W., Guberman,J.M., van,T.S., Yakhnina,A.A., and Gitai,Z. (2010) Caulobacter chromosome
segregation is an ordered multistep process. Proc Natl Acad Sci U S A 107: 14194-14198.
Slade,D., and Radman,M. (2011) Oxidative stress resistance in Deinococcus radiodurans. Microbiol Mol
Biol Rev 75: 133-191.
Slade,D., Lindner,A.B., Paul,G., and Radman,M. (2009) Recombination and replication in DNA repair of
heavily irradiated Deinococcus radiodurans. Cell 136: 1044-1055.
Smith,M.D., Abrahamson,R., and Minton,K.W. (1989) Shuttle plasmids constructed by the transformation
of an Escherichia coli cloning vector into two Deinococcus radiodurans plasmids. Plasmid 22: 132-142.
Soberon,N.E., Lioy,V.S., Pratto,F., Volante,A., and Alonso,J.C. (2011) Molecular anatomy of the
Streptococcus pyogenes pSM19035 partition and segrosome complexes. Nucleic Acids Res 39: 2624-2637.
Surtees,J.A., and Funnell,B.E. (1999) P1 ParB domain structure includes two independent multimerization
domains. J Bacteriol 181: 5898-5908.
Surtees,J.A., and Funnell,B.E. (2003) Plasmid and chromosome traffic control: how ParA and ParB drive
partition. Curr Top Dev Biol 56: 145-180.
Sweet,D.M., and Moseley,B.E. (1976) The resistance of Micrococcus radiodurans to killing and mutation
by agents which damage DNA. Mutat Res 34: 175-186.
202
Tessema,M., Lehmann,U., and Kreipe,H. (2004) Cell cycle and no end. Virchows Arch 444: 313-323.
Thanbichler,M., and Shapiro,L. (2006) MipZ, a spatial regulator coordinating chromosome segregation
with cell division in Caulobacter. Cell 126: 147-162.
Tinsley,E., and Khan,S.A. (2006) A novel FtsZ-like protein is involved in replication of the anthrax toxin-
encoding pXO1 plasmid in Bacillus anthracis. J Bacteriol 188: 2829-2835.
Tonthat,N.K., Arold,S.T., Pickering,B.F., Van Dyke,M.W., Liang,S., Lu,Y. et al. (2011) Molecular
mechanism by which the nucleoid occlusion factor, SlmA, keeps cytokinesis in check. EMBO J 30: 154-
164.
Vecchiarelli,A.G., Han,Y.W., Tan,X., Mizuuchi,M., Ghirlando,R., Biertumpfel,C. et al. (2010) ATP
control of dynamic P1 ParA-DNA interactions: a key role for the nucleoid in plasmid partition. Mol
Microbiol 78: 78-91.
Weiss,D.S., Chen,J.C., Ghigo,J.M., Boyd,D., and Beckwith,J. (1999) Localization of FtsI (PBP3) to the
septal ring requires its membrane anchor, the Z ring, FtsA, FtsQ, and FtsL. J Bacteriol 181: 508-520.
White,O., Eisen,J.A., Heidelberg,J.F., Hickey,E.K., Peterson,J.D., Dodson,R.J. et al. (1999) Genome
sequence of the radioresistant bacterium Deinococcus radiodurans R1. Science 286: 1571-1577.
Wientjes,F.B., and Nanninga,N. (1989) Rate and topography of peptidoglycan synthesis during cell
division in Escherichia coli: concept of a leading edge. J Bacteriol 171: 3412-3419.
Wu,L.J., and Errington,J. (2004) Coordination of cell division and chromosome segregation by a nucleoid
occlusion protein in Bacillus subtilis. Cell 117: 915-925.
Wu,L.J., Ishikawa,S., Kawai,Y., Oshima,T., Ogasawara,N., and Errington,J. (2009) Noc protein binds to
specific DNA sequences to coordinate cell division with chromosome segregation. EMBO J 28: 1940-1952.
Yakunin,A.F., Proudfoot,M., Kuznetsova,E., Savchenko,A., Brown,G., Arrowsmith,C.H., and
Edwards,A.M. (2004) The HD domain of the Escherichia coli tRNA nucleotidyltransferase has 2',3'-cyclic
phosphodiesterase, 2'-nucleotidase, and phosphatase activities. J Biol Chem 279: 36819-36827.
Yamaichi,Y., and Niki,H. (2000) Active segregation by the Bacillus subtilis partitioning system in
Escherichia coli. Proc Natl Acad Sci U S A 97: 14656-14661.
Yamaichi,Y., Fogel,M.A., and Waldor,M.K. (2007) par genes and the pathology of chromosome loss in
Vibrio cholerae. Proc Natl Acad Sci U S A 104: 630-635.
Yamaichi,Y., Fogel,M.A., McLeod,S.M., Hui,M.P., and Waldor,M.K. (2007) Distinct centromere-like parS
sites on the two chromosomes of Vibrio spp. J Bacteriol 189: 5314-5324.
Yanagida,M. (2005) Basic mechanism of eukaryotic chromosome segregation. Philos Trans R Soc Lond B
Biol Sci 360: 609-621.
Zahradka,K., Slade,D., Bailone,A., Sommer,S., Averbeck,D., Petranovic,M. et al. (2006) Reassembly of
shattered chromosomes in Deinococcus radiodurans. Nature 443: 569-573