Embed Size (px)
Citation preview

IADC WG3 1/77
IADC-11-05 April 2013
CHARACTERIZATION OF EJECTA FROM HVI ON
SPACECRAFT OUTER SURFACES
April 2013
Prepared by the IADC WG3 members
Action Item 26.1

IADC WG3 2/77
Change Record
Issue /
Revision Date Section Change(s) Contributors
0.1 2010.03.12 All Issue of doc. V0.1 during WG Session 3.2 of
IADC28
A. Francesconi
J.C. Mandeville
0.9 2012.03.31 All Issue of doc. V0.9 for review by WG3 Chairman
and J.C. Mandeville (expert) A. Francesconi
0.95 2012.05.04 All
Issue of doc. V0.95 for review by WG3 Chairman
and discussion within WG3 plenary meeting.
Comments by J.C. Mandeville (expert) and inputs
from P. Krisko – S. Flegel (WG2) included
A. Francesconi
0.96 2012.05.16 All Update to document for review by WG3
Chairman and WG3 discussion E. Christiansen
1.0 2012.06.11 All Update to document with inclusion of M. Higashide comments and issue of doc. V1.0
A. Francesconi

AI26.1 Report Final.doc
IADC WG3 3/77
List of Contributors
Chapter Contributor Affiliation
1
A. Francesconi ASI - CISAS
M.Higashide JAXA
J.C. Mandeville CNES
S. Meshcheryakov ROSCOSMOS
P. Krisko NASA
S. Flegel TU Braunschweig - Institute of Aerospace Systems
2
A. Francesconi ASI – CISAS
J.C. Mandeville CNES
S. Meshcheryakov ROSCOSMOS
3
A. Francesconi ASI - CISAS
J.C. Mandeville CNES
M.Higashide JAXA
E. Christiansen NASA
4
A. Francesconi ASI – CISAS
J.C. Mandeville CNES
M.Higashide JAXA
E. Christiansen NASA
S. Meshcheryakov ROSCOSMOS
5
A. Francesconi ASI – CISAS
J.C. Mandeville CNES
M.Higashide JAXA

AI26.1 Report Final.doc
IADC WG3 4/77
Table of Contents
1 INTRODUCTION ................................................................................................................................... 12
1.1 Definitions .................................................................................................................................... 12
1.2 Summary of international activities on ejecta ............................................................................. 13
1.3 Damage to spacecraft induced by secondary debris .................................................................... 15
1.4 Environment pollution.................................................................................................................. 16
1.5 Orbital evolution of ejecta............................................................................................................ 18
2 EJECTA MODELS ................................................................................................................................... 19
2.1 Mechanisms involved in ejecta production .................................................................................. 19
2.2 Empirical models .......................................................................................................................... 20
2.2.1 Total mass of ejecta fragments ...................................................................................... 20
2.2.2 Size and speed distribution of fragments ....................................................................... 22
2.2.3 Ejection angles ................................................................................................................ 26
2.3 Numerical simulations .................................................................................................................. 28
2.4 ONERA synthesis model ............................................................................................................... 31
2.4.1 Total ejected mass .......................................................................................................... 31
2.4.2 Mass partitioning ............................................................................................................ 32
2.4.3 Cone fragments modeling .............................................................................................. 32
2.4.4 Spall fragments modelling .............................................................................................. 34
3 EXPERIMENTAL ACTIVITY BY WG3 MEMBER AGENCIES ....................................................................... 36
3.1 ASI ................................................................................................................................................. 36
3.1.1 Experimental setup ......................................................................................................... 36
3.1.2 Test summary ................................................................................................................. 38
3.1.3 Data utilization ............................................................................................................... 38
3.1.4 Results ............................................................................................................................ 42
3.2 CNES ............................................................................................................................................. 44
3.3 DLR ............................................................................................................................................... 45
3.4 JAXA .............................................................................................................................................. 47
3.4.1 Tests for evaluating standard procedures for ejecta characterization ........................... 47
3.4.2 Effects of projectile density and target heat treatment on ejecta distributions ............ 51
3.5 UKSPACE ....................................................................................................................................... 53
3.6 NASA ............................................................................................................................................. 55
4 RECOMMENDATIONS FOR EXPERIMENTAL CHARACTERIZATION OF EJECTA ........................................ 57
4.1 Measurement objectives .............................................................................................................. 57

AI26.1 Report Final.doc
IADC WG3 5/77
4.2 Experimental methods ................................................................................................................. 58
4.2.1 Materials selection ......................................................................................................... 58
4.2.2 Test conditions ............................................................................................................... 59
4.2.3 Benchmark cases ............................................................................................................ 61
4.3 Data analysis ................................................................................................................................. 63
4.3.1 Total amount of back-scattered ejecta Me,tot ................................................................. 63
4.3.2 Witness plates craters .................................................................................................... 64
4.3.3 Ejecta speed .................................................................................................................... 64
4.3.4 Procedure for deriving ejecta mass distribution in the cloud ........................................ 65
5 EJECTA DATABASE ............................................................................................................................... 67
5.1 Test setup ..................................................................................................................................... 67
5.2 Test conditions ............................................................................................................................. 67
5.3 Experimental/numerical results ................................................................................................... 67
6 ACRONYMS AND ABBREVIATIONS ....................................................................................................... 69
7 REFERENCES ........................................................................................................................................ 70

AI26.1 Report Final.doc
IADC WG3 6/77
List of Figures
Fig. 1-1. Secondary debris produced during HVI: downrange ejecta, back-scattered ejecta ................................ 12
Fig. 1-2. Sketch showing ejection processes (jetting, cone, spall) after normal (top) and oblique (bottom) impact
............................................................................................................................................................. 13
Fig. 2-1. Cross-section view of an impact crater on HST solar arrays cover glass (left), showing delamination
cracks and large ejected spalls. Solar cell schematic (right) [Rival et al, 1996] ................................... 22
Fig. 2-2. Schematic representation (cross-section view) of debris cone for normal impact (left), oblique impact
(center), and grazing impact (right). .................................................................................................... 27
Fig. 2-3. Numerical simulation of the ASI-CISAS test no.8648 (dp=2.3 mm, vp=5.34 km/s, normal impact) .......... 29
Fig. 2-4. Numerical simulation of the ASI-CISAS test no.8657 (dp=2.3 mm, vp=5.29 km/s, =60°) ....................... 29
Fig. 2-5. Ejecta cloud footprint on witness plates: geometrical parameters for comparing experimental and
numerical results regarding normal (left) and oblique (right) impacts ............................................... 30
Fig. 3-1. Instrument for ejecta characterization: normal (left) and oblique (right) impact configuration. In the
normal impact configuration, a central hole is evident in the witness plate to allow the projectile pass
through the plate and reach the target. .............................................................................................. 37
Fig. 3-2. Copper witness plate supported on sensorized pins ............................................................................... 37
Fig. 3-3. ASI/CISAS data analysis procedure .......................................................................................................... 39
Fig. 3-4. ASI/CISAS impact tests. Witness plate analysis for shot no. 8646 (1.5 mm projectile at 5.20 km/s on a 10
mm Al6082-T6 plate, normal impact): raw image (left), damage features recognized by the analysis
(center), craters identified after “false positives” subtraction (right). ................................................ 40
Fig. 3-5. ASI/CISAS impact tests. Witness plate analysis for shot no. 8656 (2.3 mm projectile at 5.34 km/s on a 10
mm Al6082-T6 plate, 45° impact): raw image (left), damage features recognized by the analysis
(center), craters identified after “false positives” subtraction (right). ................................................ 41
Fig. 3-6. ASI/CISAS impact tests. Shot no. 8641. Impact flash detector (red) and strain gauge (black) signals .... 42
Fig. 3-7. ASI/CISAS impact tests. Number of craters for dp=1 mm. ....................................................................... 43
Fig. 3-8. ASI/CISAS impact tests. Number of craters for dp=1.5 mm. .................................................................... 43
Fig. 3-9. ASI/CISAS impact tests. Number of craters for dp=2.3 mm. .................................................................... 43
Fig. 3-10. Witness plate used in the CNES/CEG test (5mm AISI304 projectile impacting an Al6061-T6 35 mm thick
plate at 5.6 km7s): ejecta damage (left) and cumulative size distribution of craters (right) .............. 45
Fig. 3-11. EMI test no. 2684: HST solar cell sample hit by a 0.5 mm projectile at 4.8 km/s, 45° impact angle ..... 46
Fig. 3-12. JAXA/KIT impact tests. Experimental configurations for semi-infinite targets (left) and thin targets
(right) ................................................................................................................................................... 48
Fig. 3-13. Microscope system for witness plate craters analysis ........................................................................... 48
Fig. 3-14. JAXA/KIT impact tests. Automatic crater analysis on plates with different surface finishes: damage

AI26.1 Report Final.doc
IADC WG3 7/77
features detected ................................................................................................................................ 49
Fig. 3-15. JAXA/KIT impact tests. Automatic crater analysis on plates with different surface finishes: comparison
of results .............................................................................................................................................. 50
Fig. 3-16. JAXA/KIT impact test on SiC target. Automatic crater analysis on plates with different surface finishes:
comparison of results .......................................................................................................................... 50
Fig. 3-17. JAXA/NIT test setup ............................................................................................................................... 51
Fig. 3-18. JAXA/NIT impact tests. Ejecta fragment collected after an impact test (left). Fragment geometric
model (right) ........................................................................................................................................ 52
Fig. 3-19. JAXA/NIT impact tests. Witness plate used in an experiment on a A6061-T6 target ............................ 52
Fig. 3-20. JAXA/NIT impact tests. Cumulative number of collected ejecta fragments .......................................... 53
Fig. 3-21. JAXA/NIT impact tests. Average cross section of collected ejecta fragments ....................................... 53
Fig. 3-22. Cross-section of NASA test setup .......................................................................................................... 55
Fig. 4-1. Target holder for brittle materials [Sugahara et al, 2009]. Sizes are given as preliminary indication. .... 61
Fig. 4-2. Sketch showing the recommended setup for normal impact tests (benchmark #1). Interface with the
impact facility is considered to vary from one facility to another. ...................................................... 62
Fig. 4-3. Sketch showing the recommended setup for oblique impact tests (benchmark #2). Interface with the
impact facility is considered to vary from one facility to another. ...................................................... 62

AI26.1 Report Final.doc
IADC WG3 8/77
List of Tables
Tab. 2-1. Values for C and A coefficients in Eq. 2-1 (SI units). p and t are the projectile and target density ..... 20
Tab. 2-2. Mass partitioning between cone and spall fragments ........................................................................... 22
Tab. 2-3. Power-law size distribution of ejecta according to different authors .................................................... 23
Tab. 2-4. Ejecta speed as function of projectile velocity vp according to different authors .................................. 25
Tab. 2-5. Ejecta elevation angles according to different authors .......................................................................... 27
Tab. 2-6. ASI-CISAS test no.8648: comparison between experimental results and numerical simulation. .......... 30
Tab. 2-7. ASI-CISAS test no.8657: comparison between experimental results and numerical simulation. The
simulation was stopped when the ejecta cloud was still evolving ........................................................ 30
Tab. 2-8. Values of (Eq. 2-9) for different classes of targets and different projectile diameters (dp unit is m) .. 32
Tab. 2-9. Values of coefficients in Eq. 2-11. .......................................................................................................... 33
Tab. 3-1. ASI/CISAS test program for ejecta characterization: summary. dp, vp and are respectively the projectile
diameter, velocity and impact angle * Uncertainty in speed measurement is always below or equal to
3% .......................................................................................................................................................... 38
Tab. 3-2. Test performed on Hubble Space Telescope (HST) solar cell samples at EMI (Germany): impact
conditions .............................................................................................................................................. 45
Tab. 3-3. Test performed on Hubble Space Telescope (HST) solar cell samples at EMI (Germany): ejecta cone
angles .................................................................................................................................................... 45
Tab. 3-4. Test performed on Hubble Space Telescope (HST) solar cell samples at EMI (Germany): cumulative
number of craters per size .................................................................................................................... 47
Tab. 3-5. JAXA/KIT impact test on SiC target. Number of craters ......................................................................... 51
Tab. 3-6. Test performed on Hubble Space Telescope (HST) and EuReCa solar cell samples at UniSpace Kent (UK):
impact conditions .................................................................................................................................. 54
Tab. 3-7. Test performed on Hubble Space Telescope (HST) and EuReCa solar cell samples at UniSpace Kent (UK):
cumulative number of craters per size .................................................................................................. 54
Tab. 3-8. Secondary ejecta characteristics for various bumper materials. Data from HVI of 0.32cm Al projectile at
6.8 km/s, normal impact, on 0.22 g/cm2 bumpers. *Rank based on damage to ejecta catcher, with the
highest rank resulting in the least amount of damage to the ejecta catcher. ...................................... 55

AI26.1 Report Final.doc
IADC WG3 9/77
Scope
The scope of this document is to summarize the knowledge available among WG3 members and
the international community with respect to the production of backscattered ejecta from
spacecraft outer surfaces as a consequence of hypervelocity impact of space debris and
micrometeoroids.
This includes (1) consideration and models of ejecta effects on spacecraft subsystems and space
environment pollution; (2) experimental results from WG3 members and recommendations for
implementing experimental and numerical investigations on secondary debris production and (3)
description of the structure of an ejecta database that could be regularly updated as new data
become available.

AI26.1 Report Final.doc
IADC WG3 10/77
Summary
In addition to the damage imparted to structures and internal components, space debris and
micrometeoroids hitting external spacecraft surfaces produce a large amount of fragments that
are ejected towards space. Such particles are named ejecta or secondary debris; they contribute
to the environment pollution and are potentially harmful for nearby spacecraft parts, especially
in case of grazing impacts.
Knowledge of the ejecta distribution is therefore important for both predicting the debris
growth into the environment and for assessing the risk posed by secondary debris to spacecraft
components. Moreover, a better understanding of ejecta production mechanisms could help in
mitigating the secondary debris population, e.g. by a careful selection of surface materials that
still obey all design requirements.
In order to address such issues, this report summarizes the available knowledge on ejecta as
emerges from an extensive literature review, and provides indications on experimental and
numerical methods that could be followed to obtain, analyze and organize new data on ejecta
production.
The ejecta phenomenon is presented in Section 1 (Introduction), in which some relevant
definitions are provided and the consequences of the secondary debris population are discussed,
both in terms of environment contamination and damage induced to spacecraft. Furthermore,
the orbital evolution of ejecta clouds is addressed.
Section 2 (Ejecta models) discusses the physical mechanisms behind ejecta production and
presents common empirical models used to depict ejecta clouds, with special attention to the
mass/speed distribution of secondary debris and its dependence from primary impact
conditions. Consideration is also given to numerical approaches employed to simulate the very
early stages of ejecta production and evolution.
Section 3 (Experimental activity by WG3 member agencies) contains a review of WG3 members
recent activities to study secondary debris.
In Section 4 (Recommendations for experimental characterization of ejecta), indications are
given on significant parameters to be measured for describing ejecta production mechanisms.
Moreover, target materials and setup are recommended to represent realistic spacecraft
configurations and suitable impact test conditions are proposed with reference to two
benchmark cases useful to establish a common reference for comparing results obtained by
different test facilities. Procedures for data utilization are suggested as well.
Section 5 (Ejecta database), a database structure is proposed to provide users with data
concerning the behavior of material upon HVI with respect to their ejecta-production capability.
The database will initially be populated with public data and could be regularly updated as soon
as new test or simulation results become available.

AI26.1 Report Final.doc
IADC WG3 11/77

AI26.1 Report Final.doc Section 1. Introduction
IADC WG3 12/77
1 Introduction
All spacecraft in Earth orbit are exposed to the risk of impact with micrometeoroids and orbital
debris (M/OD). Because of the large collision velocities, hypervelocity impacts (HVI) with M/OD
may cause significant damage to various subsystems and components up to mission failure.
Furthermore, a large amount of new particles are produced which in part travel into the
spacecraft and in part are ejected towards the space. As regards this latter aspect, brittle
materials hit at hypervelocity are of particular concern, because of their peculiar impact
response and their wide use for large satellites surfaces exposed directly to the space
environment.
Return of the solar arrays from Eureca and the Hubble Space Telescope (HST) showed damage
features not observed on ductile targets: low fracture toughness and high yield strength result in
a wide range of failure modes, including cracking, spall and shatter. Thus, a great number of
fragments in a wide size range (e.g. 15-100 µm for the HST solar arrays) are likely ejected at high
velocities and contribute in the potential degradation of the space environment.
1.1 Definitions
We define as ejecta or secondary debris the amount of matter produced during a primary HVI of
a M/OD upon a given target, e.g. a spacecraft surface. Such matter can be ejected under liquid,
solid or gaseous state and comes from both the projectile and the impacted sample. A first
classification of secondary debris is based upon the direction of ejection (Fig. 1-1):
Back-scattered ejecta are emitted towards the half-space from which the primary projectile
was coming, i.e. they come back to space thus contributing to the environment pollution.
However, in case of oblique impact, back-scattered ejecta can immediately hit external
spacecraft parts close to the primary impact point. Impacts due to secondary particles are
called secondary impacts;
Downrange ejecta travel into the spacecraft interior and can damage internal components
placed on their trajectory. Downrange ejecta are produced only when targets are thin
enough for spall formation on the rear face or complete perforation. On thin targets, back-
scattered debris are less important than downrange fragments, which normally represent
the largest part of the total ejected mass [Schneider, 1997].
projectile
thick target
back scattered ejecta
downstream 1/2 space
backstream 1/2 space
projectile
perforated thin target
downrange ejecta
projectile
marginal thickness target
downrange ejecta (spalls)
backstream 1/2 space
downstream 1/2 space
back scattered ejecta back scattered ejecta
backstream 1/2 space
downstream 1/2 space
Fig. 1-1. Secondary debris produced during HVI: downrange ejecta, back-scattered ejecta

AI26.1 Report Final.doc Section 1. Introduction
IADC WG3 13/77
This report mostly deals with backscattered ejecta. With limitation to this case, Fig. 1-2 presents
a sketch showing the ejection processes following normal as well as oblique impacts. This is
useful to introduce some basic nomenclature on ejecta particles that are here divided into three
different categories: jet fragments, cone fragments and spall fragments.
Fig. 1-2. Sketch showing ejection processes (jetting, cone, spall) after normal (top) and oblique (bottom)
impact
1.2 Summary of international activities on ejecta
Secondary particles produced upon HVI on a target have been known since the beginning of HVI
investigation, with initial attention given to material ejected from the surfaces of celestial
bodies, such as the Moon and other planets. Early paper from Lecomte [1963] described the
process, other works from Gault and Heitowit [1963], Gault et al. [1963, 1969, 1972] and Gault
[1973] provided quantitative data concerning the amount and distribution of ejected particles
from rocks and lunar materials. At the same time, it was suspected that secondary debris could
contaminate sensors measuring solid particles fluxes on spacecraft.

AI26.1 Report Final.doc Section 1. Introduction
IADC WG3 14/77
Stump and Christiansen [1986] ran a series of light-gas gun (LGG) shots to determine empirical
relationships for the size, mass, velocity and spatial distribution of spall and ejecta for targets
representative of Space Station elements, with the objective of quantifying the threat posed by
secondary debris to the station. They observed that the crater amount may be significantly
increased with respect of what is calculated during the spacecraft design phase and proposed to
consider the ejecta contribution as an additional flux over the primary one that is accounted for
in the design process. They found from geometry considerations that secondary impact damage
could concentrate in areas of station that are out-of-plane and trailing the majority of the
modules. They suggested a 10% factor applied to the primary M/OD flux could account for
secondary damage from ejecta.
Schonberg and Taylor [1990] developed recommendations to protect external spacecraft
subsystems against damage by ricochet particles formed during oblique impacts. In the same
framework, Schonberg [2001] reported empirical models describing the angles defining the
spread of ricochet debris and the trajectory of the ricochet debris cloud center-of-mass as well
as the velocity and diameter of the largest ejecta particle as a function of impact parameters and
target plate geometry.
A first systematic review on ejecta phenomena was conducted under ESA contract by the
University of Kent and ONERA/DESP in Toulouse [McDonnell et al, 1998], including a survey of
the technical literature on secondary debris and the realization of some specific impact
experiments. Furthermore, an analytical model was proposed to compute the amount of ejecta
produced by HVI on selected target materials, such as aluminum alloys, solar cells cover glass
and thermal control paint. A detailed description of the model and its use to predict the damage
imparted by secondary particles on spacecraft is reported in [Rival and Mandeville, 1998], while
the consequent generation of small orbital debris in space is discussed in [Bariteau and
Mandeville, 2001]. The same ejecta model was later adopted by the ESA MASTER environment
model and the ESABASE software.
CNES and CEA [Michel et al, 2005, 2006] conducted joint experimental and numerical studies on
the ejection processes that occur during HVI on thin brittle targets, representative of solar cells
and optics for space applications as well as instruments and laser optics employed in
experimental activities relevant to nuclear research. In 2007, CNES and ONERA [Siguier and
Mandeville, 2007] proposed within the Working Group 6 of ISO TC20/SC14 to set up a new
standard concerning the space debris environment, with the aim of establishing a common test
method to characterize the amount of ejecta produced by HVI on materials used on spacecraft
outer surfaces. At the time of the first issue of this report, such standard was in the approval
stage.
In the meantime, further independent investigations have been initiated by different institutions
in countries belonging to the IADC. CISAS-University of Padova (Italy) conducted impact
experiments to derive probability functions describing the number, size and speed distribution

AI26.1 Report Final.doc Section 1. Introduction
IADC WG3 15/77
of ejecta from three different targets representative of spacecraft materials, i.e. simple
aluminum-alloy plates, silicon solar cells and simple aluminum-alloy plates covered by MLI
blankets [Francesconi et al, 2010].
JAXA and KIT (Kyushu Institute of Technology) performed studies on ejecta characterization in
support to the definition of the standard procedure ISO/CD 11227 to evaluate spacecraft
material ejecta upon hypervelocity impact [Sugahara et al, 2009 – Mandeville et al, 2010].
Distribution of ejecta fragments were measured from craters in a witness plate, and a
measurement process useful also for facility calibration was suggested.
Nagoya Institute of Technology (NIT) [Nishida et al, 2010] investigated the influence projectile
density and target heat treatment on ejecta distributions. Craters in a witness plate were
analyzed with a X-ray spectrometer to determine the structure of ejecta clouds, while size
distribution of ejecta was obtained from fragments retrieved in the test chamber.
In Russia, a great deal of work has been made upon the ISTC 4312 Project [Shutov et al. 2010] to
study many aspects concerning meteoroids and space debris. Hypervelocity impact tests were
performed with emphasis on the collection of ejecta on soft witness plates. The evolution of
ejecta clouds in near earth space was modeled in order to perform predictions on the future
particles environment in orbit [Mescheryakov, 2009].
1.3 Damage to spacecraft induced by secondary debris
Damage to spacecraft parts in consequence of secondary debris impacts have been primarily
investigated with respect to downrange ejecta, and extensive work on this point is available in
the technical literature. Many studies have been performed to characterize the size and speed of
secondary debris clouds expanding in the spacecraft interior after perforation of the external
structure of the vehicle [Piekutowski 1987, 1990, 1993, 2001; Stilp et at 1990, 1997; Anderson et
al 1990; Cohen 1995; Corvonato et al 2001], and several papers discuss the vulnerability of
satellites internal components to secondary impacts (Melin 1990; Finnegan et al 1995; Lambert
et al 1997; Paul 1997; Schaefer and Schneider 1997, Putzar et al 2008; Schaefer et al 2008].
On the other hand, back-scattered ejecta are usually very small particles (mainly sub-micron),
with insufficient kinetic energy for producing damages as serious as those caused by downrange
debris. However, in case of oblique impact, relatively large hypervelocity fragments can be
generated and hit nearby spacecraft parts. Yet, typically backscattered ejecta does not have the
capability of penetrating the completely through shielding or into the spacecraft body. Rather,
they can trigger damage modes including the following:
Degradation of surface properties. Solar cells, sensors, optics, MLI blankets and other
thermal control coatings can suffer continuous degradation related to the production of
impact craters, whose total area provides a measure of the degree of deterioration of the

AI26.1 Report Final.doc Section 1. Introduction
IADC WG3 16/77
surface. It is believed that secondary impacts have little effect on the transparency of solar
panel glasses [Semkin et al, 2009], since degradation is mainly due to UV radiation and
atomic oxygen. Optical systems of telescopes are instead more vulnerable.
Generation of false signals in photodetectors. Stray pick-ups which can disturb the normal
operation sensors can arise due to reflection of sun light by near passing particles
[Mandeville et al, 2001]. Other false signals can be due to diffuse light flashes from
secondary impacts on outer surfaces [Eichhorn, 1975, 1976; Semkin et al, 2009]. Impact
flashes and light scattering can also disturb laser communication lines between satellites.
Electrostatic discharges. Especially at low altitude, secondary debris can cause collective
plasma effects which can lead to electric breakdowns between different spacecraft surfaces
and/or solar arrays [Borisov et al, 2010; Korsun, 2010].
Disturbances to electronic boards. Emission of microwave radiation is known to occur
during HVI [Takano et al, 2000, 2002, 2005; Maki et al, 2002]. Distributed impacts of small
particles clouds onto spacecraft surfaces can produce microwave emission strong enough to
cause malfunctions in nearby electronic equipment [Caswell et al, 1995; Mc Donnell et al,
1997].
Penetration of lightly protected or thin materials such as EVA suits. Thin materials on
spacecraft and space suits used for extravehicular activity (EVA) are susceptible to
penetration by small ejecta and M/OD particles. For instance, the Shuttle space suit gloves
are relatively thin to increase dexterity of the glove, and hypervelocity particles on order of
0.2mm diameter (aluminum) can penetrate through the outer cover and inner bladder of
the fingers [Christiansen et al, 1999]. Some of the ejecta particles produced in M/OD
impacts would be capable of penetrating the EVA suit under typical impact conditions for
debris in low Earth orbit; see for example the ejecta fragment size produced in experiments
described in this report such as Fig. 3-10 and Fig. 3-18.
It is clear that backscattered ejecta can represent a threat for current and future space missions,
since they can contribute to the deterioration of specific surface properties, interfere with
scientific measurements, disturb electronic boards, as well as cause serious mechanical damage
to thin membranes used for solar sailing or aerodynamic de-orbiting of spacecraft. It is therefore
important to better understand the extent of the secondary debris phenomenon, in order to
define strategies for reducing the risk posed to future missions.
1.4 Environment pollution
Downrange secondary debris can remain trapped within the satellite, or leak out into the space
environment over time via hole or gaps in the spacecraft outer structure. Backscattered ejecta,
on the other hand, are emitted directly to the free space around the spacecraft, adding to the
environment thus increasing the number of existing debris. If backscattered ejecta are not
stopped by a surface on the satellite close to the primary impact point, they escape from the
vicinity of the parent vehicle and are injected into the environment on their own orbital
trajectory. Depending on their size and orbital parameters, they can have long lifetimes on orbit
and strike other spacecraft at large distance or re-enter rapidly in the atmosphere.
AI26.1 Report Final.doc Section 1. Introduction
IADC WG3 17/77
Backscattered ejecta are currently modeled and provided to the general public by two space
agencies, ESA and NASA, within orbital debris engineering models, MASTER and ORDEM,
respectively. Each group follows a unique approach in the derivation of these populations.
For the ESA-MASTER-2009 model, ejecta are provided in quarterly population snapshots for the
years 1957 to 2055. Ejecta are simulated by calculating the debris flux onto all payloads and
rocket bodies. The resulting impacts are evaluated based on the equations by Rival and
Mandeville [Rival and Mandeville, 1999]. Only cone and spall ejecta are taken into account as
only about 1% of the ejected mass are produced by jetting. The resulting ejecta population is
validated by comparing the simulated flux onto LDEF, the Hubble-Space Telescope and EuReCa
to measurement data from the retrieved surfaces.
The NASA model ORDEM 3.0 contains yearly degradation/ejecta populations (2010-2035), of
sizes 10m to about 1mm. The principal data used are in-situ hypervelocity impact records that
are accumulated in over 30 post-flight damage surveys of NASA Space Shuttle radiator panels
and window panes [Xu et al, 2011]. Populations are derived based on varying the production
rate of degradation/ejecta from large resident space objects (>10cm), and reconstructing the
hypervelocity data.
In summary, it is believed that ejecta contribution to the orbital debris population cannot be
neglected, being of about 2-3% in LEO and 5-6% in GEO [Siguier and Mandeville, 2007].
The regions of geostationary and high elliptical orbits are the most prone to experience pollution
by ejecta [Kessler, 1990; Kolesnikov and Chernov, 2009]. Here, debris is resident for a long time
and many spacecraft are present that can be a source of new fragments.
Special attention should be given to ejecta in the geostationary region. Among the long orbital
lifetime, it must be considered that the average power of spacecraft in GEO is high (the total
power is 1.8 MW) and therefore the total solar arrays area is relevant (20’000 m2). Due to the
brittle nature of the materials involved, the mass of spall fragments coming from solar cells
cover glass can be three orders of magnitude larger than that of the impactor [Rival et al, 1996].
Results of the analysis of servicing missions on the HST solar arrays show that 0.02 g/m2 of
ejecta can be generated per year [Moussi et al, 2005] and thus a production of 400 g/year of
glass fragments can be predicted in GEO. Such particles spread over a large volume and it could
be expected that critical levels of secondary debris would be reached in the near future even
though the average ejecta flux is currently two orders of magnitude lower than that of
meteoroids (30 particles/year/m2 compared to 4000 particles/year/m2) [Oswald et al, 2005].
In fact, ejecta continue to pollute the GEO region even after the parent vehicle has been moved
to a disposal orbit. At present, the belt of microparticles in GEO is already visible by space based
optical or infrared sensors [Drolshagen et al, 2009].
Even in the case of high elliptical orbits, the flux of ejecta fragments crossing the LEO region is

AI26.1 Report Final.doc Section 1. Introduction
IADC WG3 18/77
about half of the total debris flux [Kessler et al, 1996].
1.5 Orbital evolution of ejecta
Knowledge of ejecta orbital evolution is important not only for estimating the secondary debris
contribution to the environment, but also for defining test methods and instrumentation needed
for ejecta characterization. In fact, sensitivity as well as resolution of recommended
experimental techniques should be adapted to those particles that contribute significantly to the
OD fluxes.
Backscattered ejecta can remain for a long time at altitude greater than 1000 km where drag is
negligible. The solar radiation pressure and various gravitational disturbances are conservative
and therefore tend to redistribute the ejecta between different regions of the space instead of
facilitating their de-orbiting. As a consequence, secondary debris are inclined to accumulate in
some orbital regions and form ejecta belts [Kessler and Cour-Palais, 1978; Drolshagen et al,
2009] and even the formation of temporary clusters of small particles becomes possible
[Myagkov, 2009].
Orbital evolution of ejecta has been studied to some extent by Bariteau and Mandeville (2001)
and Bariteau (2001), with special attention to GTO and LEO regions. In particular, a simplified
analytical model has been derived [Mandeville and Bariteau, 2004]. Shutov et al (2010) describe
in detail the orbital evolution of ejecta produced by primary meteoroid impacts on the solar
arrays of the ISS.
In the case of ORDEM, degradation/ejecta produced from large resident space objects are
propagated in orbit accounting for standard perturbative forces, J2, J3, J4, solar-lunar gravity,
solar radiation pressure with Earth shadow, and atmospheric drag based on Jacchia 77.
The evolution of the ejecta population of the MASTER-2009 model is predicted using a semi-
analytical propagator. Zonal harmonics up to degree five, third body perturbations from the sun
and moon, solar radiation pressure with cylindrical Earth shadow and atmospheric drag are
taken into account. Atmospheric density calculation is based on the MSIS’77 model.

AI26.1 Report Final.doc Section 2. Ejecta models
IADC WG3 19/77
2 Ejecta models
This section provides a summary of models describing ejecta phenomena. Information refers to
literature findings as well as specific activities carried out by WG3 members in the framework of
the IADC AI 26-1 “Characterization of ejecta from HVI on spacecraft outer surfaces”.
Although no complete ejecta model is currently available, different empirical approaches are
reported to predict the number, size, speed and direction of back-scattered secondary particles
generated during a single hypervelocity impact, as a function of impact parameters and
projectile properties.
Such models are mostly based upon impact test data collected in different and various
conditions, while theoretical and/or numerical analysis to extend experimental data and/or
address secondary effects (e.g. plasma) are less diffused.
2.1 Mechanisms involved in ejecta production
Although several and diverse phenomena occur to produce ejecta, investigations carried out so
far are mostly limited to the physical state and distribution of the ejected particles (number, size,
speed, direction). However, a few common elements emerge among the large variety of
experimental and theoretical information available from the technical literature:
Ejecta production is related to three main mechanisms which lead to the production of jet,
cone and spall fragments (see Fig. 1-2). Jet fragments are small and fast particles emitted at
grazing angles in the very early stages of impact (i.e. few microseconds); cone fragments are
formed just after the completion of the jetting process and are small and fast particles
emitted at constant elevation angle, creating a cone around the impact crater; spall
fragments appear at later stages (i.e. tenths of microseconds), they are large particles
ejected at low velocity perpendicularly to the impacted surface.
The most important parameters influencing the ejection mechanisms are the impactor
kinetic energy and incidence angle, and the ductile or fragile nature of the target.
The thickness of the target relative to the projectile diameter is another important
parameter influencing the mass and size of the ejecta particles. For targets that are
completely penetrated, ejecta production and size are reduced as target thickness
decreases.
The total ejected mass, the number, size, shape, speed, direction and physical state of
emitted particles are often considered for ejecta characterization. Models reported in the
following refer to the aforementioned parameters, except for describing the effect of target
thickness.
In contrast, secondary effects are rarely considered only when they could affect specific
applications:

AI26.1 Report Final.doc Section 2. Ejecta models
IADC WG3 20/77
Plasma clouds and impact flashes are formed around the primary impact crater, resulting in
possible interference with sensitive equipment. Plasma generation is strongly dependent
from the impact obliquity, with a significant enhancement for shallow angles.
2.2 Empirical models
This section summarizes available models describing ejecta particles in terms of:
Total mass, physical state and mass partitioning between jet, cone and spall fragments
Size and speed distribution
Ejection angles.
Consideration is also given to experimental data used for models derivation.
2.2.1 Total mass of ejecta fragments
The bulk of the total ejecta mass is in solid state within cone and spall fragments. In few
experimental cases, evidence of liquid ejecta was provided by the presence of re-solidified
droplets ("splashes"). However, no experimental measurements of the liquid (and/or gaseous)
amount of matter can be found in the literature.
a. Total ejecta mass
Measurement of the total ejected mass Me,tot is usually done by collection and weighing of
ejected fragments, which is compared to target mass loss. Most authors try to relate Me,tot to the
impact kinetic energy Ek :
iECM A
ktote
2
, cos Eq. 2-1
C and A are experimental coefficients depending from the projectile and target materials, i is the
impact angle (i=0° means normal impact). Values for C and A are given in Tab. 2-1, according to
experiments carried out by different authors.
Author Target A C
Gault and Heitowit, 1963 Sand, rocks 1.0 1.25E-5
Dohnanyi, 1967 Basalt 1.0 1.0E-5
Gault, 1973 Basalt 1.133 7.41E-6 (p/t)1/2
Bess, 1975 Satellite wall 1.0 2.0E-5
Seebaugh, 1977 Soil 0.9 1.0E-4
Frisch, 1991 Ice 1.13 4.9E-5
Woodward et al, 1994 Ceramics 1.0 0.9E-5
Tab. 2-1. Values for C and A coefficients in Eq. 2-1 (SI units). p and t are the projectile and target density

AI26.1 Report Final.doc Section 2. Ejecta models
IADC WG3 21/77
C and A values obtained by Gault and Heitowit (1963) are based on hypervelocity impacts on
sand and various rocks, on low-velocity impacts, and on chemical or nuclear explosion craters.
Dohnanyi (1967) used the same experimental data for deriving specific values of the C and A
coefficients for basalt. The dependence of C from the projectile and target density was
introduced by Gault (1973), using hypervelocity impacts data on basalt and granite targets, with
crater size ranging from 10 m to 10 m; the influence of the impact angle was considered as
well. Bess (1975) obtained values of the C and A coefficients using few satellite wall destruction
tests (thin target case). Seebaugh's experiments refer to explosion in soil with craters larger than
10 m. Frisch’s data show that the amount of matter ejected during hypervelocity impacts on icy
targets could be 5 times larger than on rock targets. Data from Woodward and al. (1994) show
that the amount of ejecta decreases when the fracture resistance KIC of the target increases: the
ejecta volume is halved when KIC is doubled.
Some important information comes out from Eq. 2-1 and Tab. 2-1:
Total amount of the ejected matter. From the values of coefficients C and A, it appears
that Me,tot is much larger than the projectile mass mp, as soon as the hypervelocity regime is
reached. For instance, the Me/mp ratio is about 250 for a 10-2g projectile at 7 km/s velocity.
Influence of target material. Most of the targets used in the experiments cited above are
brittle (rocks, basalt, ice, ceramics) since very limited data are available as regards ductile
targets. The amount of ejected matter during an hypervelocity impact on an icy target is 5
times larger than on a rock target. Material density is accounted for only in C coefficient
suggested by Gault (1973).
Influence of impact angle. In the case of oblique impacts, Gault (1973) observed that the
total amount of ejected matter decreases when the incidence angle i increases. This can be
due to the shallow profile of craters resulting from oblique impacts.
b. Mass partitioning between the 3 ejection processes
The total ejecta mass is partitioned between the three ejection mechanisms of jetting, cone and
spallation:
spallconejettote MMMM , Eq. 2-2
Schneider (1975) and Eichhorn (1976) estimated that the mass ejected in the jet is about 10-6
and 10-4 of the projectile mass. This is very low compared to the total ejecta mass and hence it
can be assumed that Me,tot is shared between cone and spall fragments only. The relative
contribution of both processes depends on the impact crater size: spall fragments become more
and more evident as craters size increases (Tab. 2-2).
However, it should be reminded that no spall formation is reported on ductile targets.

AI26.1 Report Final.doc Section 2. Ejecta models
IADC WG3 22/77
Author Target Crater size Mspall/Me,tot
Lange et al (1984) Rock 1-10 cm 60-80%
Polanskey et Ahrens (1990) Rock 1-10 cm 39-67%
Rival et al (1996) Glass 10 m 0
“ Glass 100 m >40%
“ Glass 1 mm >60%
“ Solar cell 10 m 0
“ Solar cell 100 m >40%
“ Solar cell 1 mm 90%
Tab. 2-2. Mass partitioning between cone and spall fragments
Special attention should be given to solar cells, whose multilayer structure of solar cells prepares
for large cracks propagation and delamination at interfaces. Fig. 2-1 [Rival et al, 1996] shows a
cross-section view of an impact on a solar cell from the HST arrays left) and a schematic
representation of spall phenomenon due to delamination (right). As a consequence, the mass
ejected trough spallation is relatively larger than on a brittle homogeneous surface. Examination
of HST solar cells performed by Rival et al. (1996) highlighted that the spall mass could reach
90% of the total ejected mass for mm-sized impact craters.
Fig. 2-1. Cross-section view of an impact crater on HST solar arrays cover glass (left), showing delamination
cracks and large ejected spalls. Solar cell schematic (right) [Rival et al, 1996]
2.2.2 Size and speed distribution of fragments
a. Size distributions
Many experiments were devoted to fragment size estimation, in order to derive empirical
distribution laws. A variety of measurement techniques were used, e.g. sifting, secondary craters
study and pictures analysis. Most authors agree on a power-law distribution for ejecta size:
ddn Eq. 2-3
Where n() d is the number of fragments of size (mean diameter) between and +d, and is

AI26.1 Report Final.doc Section 2. Ejecta models
IADC WG3 23/77
the exponent of the cumulative distribution. Other important parameters define the lower (cut-
off) and upper limits of fragments described by the power-law distribution
Other important parameters are the largest and the smallest (cut-off) fragment mass. Tab. 2-3
provides a summary of parameters for power-law size distributions according to different
authors.
Author (comment) Target Cutoff Upper limit
Gault, 1973
(spall fragments excluded)
Basalt -3.7 to -3.3
-3.6 nominal
0.1 m 0.1Me,tot
or 0.2Me,tot0.8
or 10-100 mp
Dohnanyi, 1967 Balsalt -3.4 0.1Me,tot
Asada, 1985 Basalt
Copper
Ice
-3.5
-3.0
-2.5 to -2.0
0.1 m 100 m
Fujiwara et al, 1977, 1980 Gypse -3.47
Lange et al, 1984
(only spall fragments)
Rock -2.8 to -2.5
Frisch, 1991
(only spall fragments)
Ice
Basalt, granite
-2.75
-3.5 to -2.6
Barge and Pellat, 1993
(non destructive impacts)
(destructive impacts)
Various
-3
-4
Bess, 1975 – McKnight, 1991 –
McKnight and Edelstein, 1992
(satellite wall)
Hard metal
Soft metal
-3.66 to -3.4
-2.2
Cour-Palais, 1982 Graphite-epoxy
Aluminum alloy
-5.26 to -4.48
-4.48 to -3.88
Seebaugh, 1977 Soil -3.5
Eichhorn, 1975, 1976 Gold 2-3 mp
Tab. 2-3. Power-law size distribution of ejecta according to different authors
However, authors note a discrepancy between experimental measurements and power-law
distribution predictions at the smallest and largest ejecta diameters. For smallest sizes,
predictions over-estimate the number of fragments. This could be due, on one hand, to the
experimental detection limits and, on the other hand, to the physically natural roll-off of the
distribution when the cut-off size is approached. For largest sizes, experimental measurements
are disturbed by spall fragments, whose formation is different from cone fragments, and this
introduces additional discrepancy. McKnight (1991) proposed other distribution functions with
more degrees of freedom (parabolic or hyperbolic functions): this gives a better data fitting but
the various coefficients do not have any physical significance.
Additional comments on the power-law distribution validity:
Influence of target material. O'Donnell (1991) and Woodward et al (1994) experiments on
ceramics targets showed that increasing the materials fracture toughness KIC results in

AI26.1 Report Final.doc Section 2. Ejecta models
IADC WG3 24/77
increasing the relative fraction of small fragments.
Influence of impact velocity. Starting from the experiments of Bess (1975) and McKnight
(1991), it was shown that the fraction of small fragments increases when impact kinetic
energy increases. This is confirmed by O'Donnell (1991) and Woodward et al (1994) results
on ceramics. This can be explained by a more significant number of activated micro-cracks
in the target.
Oblique and grazing impacts. Schonberg (1989) showed of a relative increase of fragments
size (large particles are more numerous) for grazing impact incidence. This can be explained
on one hand by a tearing effect on the target (shearing) and, on the other hand, by
incomplete destruction of the projectile. For oblique, but non-grazing impacts, the size
distribution of fragments is similar to the one obtained from normal impacts.
Distinguishing between spall and cone fragments. The number of spall fragments is small
and their size is usually large (at least projectile size). However, spall fragments can also
break after ejection, because of residual stress or collision with other fragments. They
usually have a plane side because they are generated near the target free-surfaces. Cone
fragments are much smaller and much more numerous. They come from target disruption
near the primary crater.
b. Speed distributions
Experimental measurement of ejection velocity is complex: in most cases, only maxima and
minima velocities are estimated. However, there is a consensus on the inverse relation between
secondary particle size and its ejection velocity: smallest fragments are the fastest and largest
ones are the slowest. Spall fragments velocities are clearly distinct from cone and jet particles,
while smallest cone fragments and jet particles have similar ejection velocities, and some
authors do not state precisely whether the maximal ejection velocity refers to a jet or a cone
particle. Tab. 2-4 gives a summary a various velocity measurements for different projectile
velocities vp.
Author Target vp (km/s) Jet (km/s) Cone (km/s) Spall (km/s)
Schneider, 1975 Rock 4.1 > 3
Gault et al, 1963 Basalt 6.4 Max 3vp vp <0.1
0.01-0.1vp
Eichhorn, 1976 Gold 5.0 30
Frisch, 1991 Ice 1.8-9.6 0.004-0.57
Arakawa et al, 1995 ??? 0.03-0.5 <0.01
Polanskey and
Ahrens, 1990
Rock 1.7-6.5 0.001-0.03
Woodward et al,
1991
Ceramics 1.0 0.15-0.25
Asada, 1985 Basalt 4.0 10 >1 (average) 0.1
Christiansen, 1987 Aluminum
alloy
6.45
6.7 (max)

AI26.1 Report Final.doc Section 2. Ejecta models
IADC WG3 25/77
35%SiC-Al
alloy
Al mesh
6.71
6.50
5.2 (max)
2.1 (max)
Lecomte, 1963 Aluminum
alloy
5.0 3.8-5.7 0.47-1.05
Stoffler et al, 1975 sand 6.5 0.2
Schonberg, 1989 Aluminum
alloy
5.0-7.5 0.5-10
Tab. 2-4. Ejecta speed as function of projectile velocity vp according to different authors
Additional comments:
Influence of impact velocity. Gault et al (1963), Eichhorn (1976) and Polanskey and Ahrens
(1990) showed that the fastest fragments velocities (jet particles and small cone fragments)
are directly related to impact velocity. On the contrary, spalls ejection velocity is not very
sensitive to impact speed variations
Oblique and grazing impacts. Svedhem and Pedersen (1992) showed a slight dependence of
the jet particles velocity on angle of incidence : maximal ejection velocity appeared to
increase as impact obliquity increases. In the case of grazing impact, Schonberg (1989)
measured higher velocities for cone fragments, from 500 m/s for largest ejecta to 10 km/s
for smallest ones. Similar tests performed at EMI [Schneider and Stilp 1993] evidenced that
jet particles velocities could reach 2 to 3 times the primary impact speed: this was
attributed to the plasma cloud generated in the early phases of impact which accelerates
the smallest jet particles [Schneider, 1997].
c. Coupled size-speed distributions
Most authors agree on the inverse dependence between ejecta size and ejection velocity.
However, it should be considered that fragments speed can be modified just after ejection by
collisions inside the ejecta cloud.
Precise measurement of individual fragment velocities is currently unfeasible. In the remainder
of this section, two semi-empirical models exist to describe the coupled size-speed distribution
of fragments are reported.
O'Keefe and Ahrens (1987) proposed the following mass-velocity empirical model from
Gault experimental results and additional numerical simulations:
3
min
61
1,
v
vmvm
vm
mvmf
bbv
bv
Eq. 2-4

AI26.1 Report Final.doc Section 2. Ejecta models
IADC WG3 26/77
In the above formulas, f(m,v) is the cumulative number of fragments with mass larger than
m and ejection velocity equal to v, mbv(v) is the mass of the largest fragment ejected at
velocity v, mb is the mass of the heaviest fragment (given by the Gault equation mb =
0.2Me,tot0.8, see Tab. 2-3) and vmin in the minimum velocity in the ejecta cloud.
Su (1990) combined the Bess (1975) size distribution model for collision fragments and a
specific function to derive ejection velocity from ejecta size and impact parameters. The
model refers to catastrophic collisions (i.e. satellite destruction) rather than individual
micro-impacts. It was adopted by several authors (McKnight 1991, Hill 1990) and has been
used in NASA orbital debris environment models [Kessler et al, 1996]:
C
E
ifA
ifBA
v
v
k
m
m
m
m
P
3/1
2log
log
Eq. 2-5
In the above formulas, vp is the projectile velocity, is the fragment diameter and Ek is the
projectile’s kinetic energy (J). A, B and C values are 0.2225, -0.1022 and 6.194E7 in the high
velocity regime, and -0.9090, -0.0868 and 1.347E7 in the low velocity regime (yet, the
author does not provide any criterion for distinguishing between the two velocity ranges).
For very energetic impacts, the <mcondition is always true, therefore all fragments are
ejected at the same velocity. However, to account for velocity differences at a given
fragment size, an artificial scattering is suggested: 50% of the fragments have speed equal
to the exact v value given by Eq. 2-4, 20% have speed equal to 0.6v, 20% have speed equal
to 1.4v, 5% have speed equal to 0.2v and 5% have speed equal to 1.8v.
2.2.3 Ejection angles
Fragments ejection directions can be described in terms of elevation (angle between the velocity
vector and the target plane) and azimuth (angle between the velocity vector projection on the
target plane and a reference axis in the same plane). However, most authors focus on the
elevation only (Fig. 2-2), while very few data are available on oblique impacts and consequent
azimuth variations of ejection directions.

AI26.1 Report Final.doc Section 2. Ejecta models
IADC WG3 27/77
Fig. 2-2. Schematic representation (cross-section view) of debris cone for normal impact (left), oblique
impact (center), and grazing impact (right).
Fragments ejected in the 3 processes (jetting, cone, spall) can be distinguished by their elevation
angle. Formation of the debris cone is evidenced in all cases. It consist of a great number of
fragments ejected at nearly the same elevation, which gives a conical aspect to this debris cloud
(cone centered at impact point, with an axis perpendicular to the target plane (Fig. 2-2, left).
Cone elevation angles measured by several authors are reported in Tab. 2-5. It should be noted
that the cone angle is not constant. During the impact process, as the projectile first contacts the
target, the cone angle (elevation angle) is at its minimum value. But as the projectile penetration
deepens into the target, the cone angle (elevation angle) increases to its maximum value. Spall
fragments typically are ejected normal to the target, whereas the jets occur at very low angle
relative to the target.
Author (comment) Target Projectile Jet (°) Cone (°) Spall (°)
Schneider, 1993 Glass Steel 20 60-70
Gault et al, 1963 Basalt Aluminum <40 40-60 80
Asada, 1985 Basalt Nylon 10-40 45-55 90
Oberbeck and
Morrison, 1976
Sand Plastic 35-40
Stoffler et al, 1975 Sand Plastic 35-50
Frisch, 1991 Ice Glass 90
Eichhorn, 1976 Gold Iron, Carbon >20 50-70
Christiansen, 1987 Al alloy
35% SiC – Al
alloy
Aluminum
Aluminum
64 (max)
63 (max)
Lecomte, 1963
(vp=3.5 km/s)
(vp=7 km/s)
Al alloy Polyethylene
50
80
40
50
Svedhem and
Pedersen (1992)
Gold Iron 60
Polanskey and
Ahrens, 1990
Rock Various 90
Tab. 2-5. Ejecta elevation angles according to different authors

AI26.1 Report Final.doc Section 2. Ejecta models
IADC WG3 28/77
Additional comments:
Influence of projectile and target material. The cone elevation is related to crater depth:
for a relatively deeper primary crater, the fragments are guided in a more perpendicular
direction, therefore the cone elevation increases. Crater depth depends highly on the p/t
ratio: the larger the relative projectile density is, the deeper the crater is. It is also possible
to find very deep craters on high density, but highly ductile targets, such as gold.
Influence of impact velocity. Increase of elevation angle with increasing impact velocity can
also be explained by primary crater shape, which becomes deeper with increasing impact
velocity. This influence is less important on brittle targets.
Oblique and grazing impacts. The influence of impact incidence on shape and opening of
the cone has been studied by Svedhem and Pedersen (1992). They found that cone
elevation decreases for oblique impacts (flattening of cone) and the relative amount of
ejected mass is increased in the downrange azimuth direction (distortion of cone).
Schonberg (1989) performed tests at grazing incidence (less than 25° elevation), showing
that fragments are no longer ejected in a cone around an axis perpendicular to the target,
but in a conical beam centered on an axis of about 15° elevation and parallel to the impact
azimuth direction. This conical beam is concentrated within a few degrees of elevation
aperture, while it has a larger azimuth scattering. This phenomenon is often called
"ricochet" (Fig. 2-2, right).
2.3 Numerical simulations
Numerical simulation of ejecta phenomena have been mainly performed referring to impacts of
asteroids on planet-like celestial bodies, while limited consideration has been given to
production of secondary fragments from HVI on spacecraft surfaces.
In the framework of the ASI “Space Debris Program”, hydrocodes calculations were carried out
by CISAS-University of Padova with the aim of reproducing the ejecta distribution resulting from
specific impact experiments on satellite materials (see test program in the following section 3.1).
Two tests (no.8648 and no.8657, see Tab. 3-1) were selected as benchmark for normal and
oblique impact on aluminum alloy targets and the comparison between experimental results and
numerical simulations were performed referring to the damage pattern resulting on 2 mm thick
copper witness plates located close to the primary target. Simulations were carried out using
Ansys-Autodyn 2D and 3D for normal and oblique impacts respectively (Fig. 2-3 and Fig. 2-4).

AI26.1 Report Final.doc Section 2. Ejecta models
IADC WG3 29/77
Fig. 2-3. Numerical simulation of the ASI-CISAS test no.8648 (dp=2.3 mm, vp=5.34 km/s, normal impact)
Fig. 2-4. Numerical simulation of the ASI-CISAS test no.8657 (dp=2.3 mm, vp=5.29 km/s, =60°)
In the first case (test no.8648, 2D-axial symmetry), SPH meshes with two different resolutions
(i.e. 0.03 mm and 0.5 mm) were used for both the projectile, the target and the witness plate.
The highest resolution is similar to that achievable from real witness plates crater
measurements, but led to a significant computational burden. On the other hand, the lowest
resolution does not allow prediction of witness plate craters in most of the range of interest and
therefore only a raw assessment of the shape and size of the witness plate damage pattern was

AI26.1 Report Final.doc Section 2. Ejecta models
IADC WG3 30/77
possible.
In the second case (test no.8657, 3D), SPH were used only for the projectile, the target close to
the impact point and the witness plate surface and a 40 mm resolution was set to further
decrease the computational load. Furthermore, it was necessary to stop the simulation when the
ejecta cloud was still evolving.
Considering the above limitation, a comparison between experimental and numerical results was
performed as regards the global extension of the ejecta cloud footprint on the witness plates,
according to the parameters described in Fig. 2-5. Results are presented in Tab. 2-6 (normal
impact) and Tab. 2-7 (oblique impact).
Fig. 2-5. Ejecta cloud footprint on witness plates: geometrical parameters for comparing experimental and
numerical results regarding normal (left) and oblique (right) impacts
Test no.8648 Dmin (mm) Dmax (mm) Daverage (mm)
Experiment 22.4 60.7 41.5
Simulation 34.6 67.8 51.2
Tab. 2-6. ASI-CISAS test no.8648: comparison between experimental results and numerical simulation.
Test no.8657 Dbase (mm) Dh (mm)
Experiment 90.9 64.9
SPH 75.1 54.6
Tab. 2-7. ASI-CISAS test no.8657: comparison between experimental results and numerical simulation. The
simulation was stopped when the ejecta cloud was still evolving
In both cases, a satisfactory agreement is reported between experimental results (in terms of
witness plate global damage shape and extension) and numerical simulations.

AI26.1 Report Final.doc Section 2. Ejecta models
IADC WG3 31/77
2.4 ONERA synthesis model
This section describes the ejecta model developed by Onera (Mandeville and Rival, 1996) and
later implemented in the ESABASE2/DEBRIS analysis tool.
The same model has been used for the computation of the contribution of ejecta particles to the
population of small orbital debris. Approach is described in detail within the Final Report of the
ISTC Project 3412 “Investigation of astrosols in the near earth space”. (Shutov and Zheltov, 2010)
The model is based upon a synthesis of available experimental data and theoretical/numerical
results on ejecta phenomena.
Starting from knowledge of target (density t and brittle/ductile behavior), projectile (density p
and mass mp) and impact characteristics (velocity vp and direction, given in terms of zenith and
azimuth angles), the model computes the number of fragments having size between and
+d ,ejected with a velocity between v and v+dv in the solid angle d d d
around the (, ) direction:
n(, , dddv Eq. 2-6
The frame is referenced to the satellite: the target (satellite surface) is fixed and velocities are
relative to the target. Assuming a given impact site (point O) and a plane surface in the vicinity of
impact point, The (x, y, z) coordinates frame is centered in O, with the z axis being perpendicular
to the target surface. Spherical coordinates are used as well in the form (v, , ).
It is assumed that the value of n in Eq. 2-6 is given by the sum of jet, cone and spall contributions
for brittle targets and jet and cone particles only for ductile targets.
2.4.1 Total ejected mass
For estimating the total ejected mass, the basic equation by Gault (1973) is used as baseline
together with a correction for application to ductile targets:
601071.3
60cos1041.7
133.1
5.0
6
2133.1
5.0
6
,
k
t
p
k
t
p
tote
EK
EK
M
Eq. 2-7
In the above equation, the K=1 for brittle targets and K=0.001 – 0.01 for ductile targets. Units

AI26.1 Report Final.doc Section 2. Ejecta models
IADC WG3 32/77
are SI.
2.4.2 Mass partitioning
The total ejecta mass is partitioned in three components as in Eq. 2-2. However, jetting is
neglected by this model because there is a general consensus on the fact that the mass emitted
within the jet is very low compared to that of cone and spall fragments. It should nevertheless
be considered that the high velocity of jet particles could lead to significant secondary damage
on components adjacent to the primary impact point.
With this assumption, Eq. 2-2 becomes:
spallconetote MMM , Eq. 2-8
Specific models are then provided for the cone and spall mass:
totespall
totecone
MM
MM
,
,
1
Eq. 2-9
Empirical equations are given in Tab. 2-8 for estimating the value of in Eq. 2-9.
Target type dp1m 1m<dp10m 10m <dp<100m dp100m
Ductile, homogeneous = 1 = 1 = 1. = 1
Brittle, homogeneous = 1. = -0.3 log dp - 0.8 = -0.3 log dp - 0.8 = 0.4
Brittle, solar cell = 1. = -0.3 log dp - 0.8 = -0.6 log dp - 2.3 = 0.1
Tab. 2-8. Values of (Eq. 2-9) for different classes of targets and different projectile diameters (dp unit is
m)
2.4.3 Cone fragments modeling
Referring to cone fragments, the distribution of Eq. 2-6 is modeled in the following way:
,,,,, coneconeconeconeconecone vvhgfKvn Eq. 2-10
In the above equation, is the Dirac delta function and fcone, gcone, hcone are probability density
functions for fragments size, zenith and azimuth angles; vcone is the velocity of the cone ejecta.

AI26.1 Report Final.doc Section 2. Ejecta models
IADC WG3 33/77
a. Size probability density
maxmin ,1
min
1
max
11
conef Eq. 2-11
In the above equation, 1 is the interval function, whose value is 1 if is within the [min, max]
range and 0 elsewhere ( unit is m); is coefficient depending on the brittle or ductile behavior
of the target, min and max are the minimum (cutoff) and maximum size of cone fragments:
Target type min max ≤ >
Ductile -2.6 0.1 m 3
,6
t
toteM
0.01 0.05
Brittle -3.5 0.1 0.5
Tab. 2-9. Values of coefficients in Eq. 2-11.
b. Zenith probability density
2,02
2
max 12
exp2
1
coneg Eq. 2-12
In the above equation, angles are in radians and the suggested value for is 0.05 (i.e. 3°).
max is the half aperture of the cone and depends on the projectile zenith angle p, and the cone
aperture for normal impact max,0 and oblique impact at ricochet limit max,60:
60
603/
60max,
0max,
0max,60max,
max
p
Eq. 2-13
Suggested values for max,0 and max,60 are /6 and 4/9, respectively (these values seem to adapt
to many cases involving different materials).
c. Azimuth probability density
602
exp2
1
601cos32
3
2
1
2,02'
2
'
2,0
1
1
p
p
pp
p
p
coneh
Eq. 2-14
In the above equation, angles are in radians and the suggested value for ' is 0.09 (i.e. 5°).

AI26.1 Report Final.doc Section 2. Ejecta models
IADC WG3 34/77
It is evident that the density hcone is uniform for normal impact. For oblique impact, hcone is
maximum for =p (downstream impact direction) and minimum for =p + (backstream
direction). The ratio between downstream and backstream densities is measured by the
coefficient in front of the cosine. This ratio is equal to 1 for a normal impact; it increases with
p and becomes infinite for p = 60° when the amount of fragments ejected in the backstream
direction becomes zero.
d. Velocity probability density
It is assumed no dependence from the zenith angle:
minmax
minmaxmaxminminmax
minmax
minmax,,
vvvvv Eq. 2-15
Where vmin=10-100 m/s and:
603
604
31cos
4
361
max
pp
p
p
p
pp
p
v
v
v
Eq. 2-16
e. Normalization
The value of Kcone in Eq. 2-10 is found by integrating the ncone distribution and imposing that the
result equals the value of Mcone predicted by Eq. 2-9:
4
min
4
max
1
min
1
max
max 1
4
sin
6
t
cone
cone
MK Eq. 2-17
2.4.4 Spall fragments modelling
As regards spall fragments, the distribution of Eq. 2-6 is modeled in the following way:
vjhgfKvn spallspallspallspallspallspall ,,, Eq. 2-18
In the above equation, fspall, gspall, hspall and jspall are probability density functions for fragments
size, zenith and azimuth angles, and velocity.

AI26.1 Report Final.doc Section 2. Ejecta models
IADC WG3 35/77
a. Size probability density
][6
3 mN
M
f
tspall
spall
spall
spallspall
Eq. 2-19
Eq. 2-19 assumes that Mspall (Eq. 2-9) is distributed between Nspall fragments having the same
mass and equivalent diameter equal to spall. It is suggested to adopt Nspall =10. is the Dirac
delta function.
b. Zenith probability density
spall
spall
spallg
,011
Eq. 2-20
In the above equation, it is assumed that spall=0.09 (i.e. 5°)
c. Azimuth probability density
2,012
1spallh Eq. 2-21
d. Velocity probability density
110010
msv
vvvj
spall
spallspall
Eq. 2-22
e. Normalization
The value of Kspall in Eq. 2-18 is found by integrating the nspall distribution and imposing that the
result equals the value of Mspall predicted by Eq. 2-9:
spall
spall
spallspall NK
cos1 Eq. 2-23

AI26.1 Report Final.doc Section 3. Experimental activity by WG3 member agencies
IADC WG3 36/77
3 Experimental activity by WG3 member agencies
This section reports relevant experimental activity carried out by WG3 members on ejecta, with
special attention to what has been recently done in the framework of the IADC AI 26-1
“Characterization of ejecta from HVI on spacecraft outer surfaces”.
3.1 ASI
Twenty-eight hypervelocity impact experiments [Francesconi et al, 2010] were carried out at
CISAS-University of Padova impact facility in the framework of the ASI “Space Debris Program”,
with the aim of contributing to IADC AI26-1 activities.
The objective was to count the number and to assess the size and speed distribution of ejecta
from three different targets representative of spacecraft materials, i.e. simple aluminum-alloy
plates, silicon solar cells and simple aluminum-alloy plates covered by MLI blankets. Projectiles
having different size (1, 1.5 and 2.3 mm diameter) were launched at speed ranging from 4 to 5.5
km/s and impact angle from 0° to 80°. Laboratory instrumentation and analysis methods to
characterize ejecta produced during LGG impact testing were developed as well.
3.1.1 Experimental setup
The instrument package for ejecta characterization was conceived to satisfy the two following
requirements:
To count the number and measure the equivalent diameter of craters left on witness plates
located close to the target in order to record the footprint of the ejecta cloud;
To infer information about the size-speed distribution of the ejecta fragments that have
produced the crater patterns earlier analyzed on witness plates.
According to the above requirements, a simple system to mount the experiment into the LGG
impact chamber was realized (Fig. 3-1), consisting in two independent supporting frames on
which the target and the copper witness plates are fixed. The choice of having two separate
supports makes possible to easily change their mutual orientation and hence the impact angle.

AI26.1 Report Final.doc Section 3. Experimental activity by WG3 member agencies
IADC WG3 37/77
Fig. 3-1. Instrument for ejecta characterization: normal (left) and oblique (right) impact configuration. In
the normal impact configuration, a central hole is evident in the witness plate to allow the projectile pass
through the plate and reach the target.
The witness plate is connected to the frame structure through six sensorized pins on which strain
gauges are bonded to record the propagation of pressure waves generated by the ejecta cloud
impact onto the plate itself (Fig. 3-2).
Fig. 3-2. Copper witness plate supported on sensorized pins
Thanks to an appropriate time reference given by an impact flash detector that is sensitive to the
light emitted by the projectile hitting the target, strain gauges signals can provide a time-of-flight
information for the ejecta cloud tip and hence a redundant assessment of the speed of the
fastest ejecta particle. In some situation, even the impact flash detector can be used directly to
assess the bulk velocity of the ejecta cloud, since both the target and the witness plate are
contained in its field of view and it can therefore record two separate flashes, one originated
from the primary impact and the other produced by the secondary one.

AI26.1 Report Final.doc Section 3. Experimental activity by WG3 member agencies
IADC WG3 38/77
3.1.2 Test summary
Tab. 3-1 below provides a summary of the experiments conducted within the test program. In
every test, pure copper witness plates 2 mm thick were employed.
Test
ID
Target
material
Target
thickness
dp
(mm)
vp*
(km/s)
(°)
(mm)
8621 Al7075-T6 3 1.0 5.03
8622 Al7075-T6 3 2.3 5.29
8629 Al7075-T6 3 1.5 4.71
8630 Al7075-T6 3 1.5 4.41
8631 Al7075-T6 3 1.0 4.47
8632 Al7075-T6 3 2.3 4.40
8646 Al7075-T6 10 1.5 5.20
8647 Al7075-T6 10 1.5 4.22
8648 Al7075-T6 10 2.3 5.34
8649 Al7075-T6 10 2.3 4.47
8650 Al7075-T6 10 1.0 4.42
8655 Al7075-T6 10 1.0 5.10
8656 Al7075-T6 10 2.3 5.34
8657 Al7075-T6 10 2.3 5.29
8658 Al7075-T6 10 1.0 5.29
8659 Al7075-T6 10 1.5 5.23
8660 Al7075-T6 10 1.5 5.25
8662 Al7075-T6 10 1.5 5.16
8664 Al7075-T6 10 2.3 5.29
8623 Al7075-T6 + MLI 3 2.3 5.29
8634 Al7075-T6 + MLI 3 1.5 5.36
8635 Al7075-T6 + MLI 3 1.5 4.39
8637 Al7075-T6 + MLI 3 1.0 4.35
8638 Al7075-T6 + MLI 3 2.3 4.46
8626 Si Solar cell 3** 1.0 4.97
8627 Si Solar cel 3** 2.3 5.16
8640 Si Solar cell 3** 1.0 4.20
8641 Si Solar cell 3** 2.3 4.23
Tab. 3-1. ASI/CISAS test program for ejecta characterization: summary. dp, vp and are respectively the
projectile diameter, velocity and impact angle
* Uncertainty in speed measurement is always below or equal to 3%
** Cover glass thickness
3.1.3 Data utilization
For each experiment, the first information acquired includes the number and size of witness
plate craters, obtained through the automatic analysis of high-resolution (1200 dpi) witness

AI26.1 Report Final.doc Section 3. Experimental activity by WG3 member agencies
IADC WG3 39/77
plate photographs. However, this is not enough to derive size-speed probability functions for
ejecta, since craters extension is not sufficient to univocally determine the velocity and size of
the particles that caused the damage. A second piece of information is therefore given by the
signals of the impact flash detector and the strain gauges bonded to witness plates, which
provide an estimation of the ejecta cloud tip speed with its related uncertainty. The last input to
the analysis procedure is provided by well-known empirical crater equations which correlate
crater diameter and depth observed on witness plates to the size and speed of the ejecta
particles that produced the damage. In the framework of this activity, Eq. 3-1 [Lambert, 1997]
and Eq. 3-2 [Tanaka et al, 2008] were arbitrary selected: specific assessment of the
adequateness of different crater equations was not performed, since the main focus was the
methodology’s development: once a suitable analysis procedure is outlined, other equations
could be used in the same way, affecting only the overall method uncertainty.
3/2352.06/1
np vmkp Eq. 3-1
18.1
60.9/
T
nc
c
vdp Eq. 3-2
In the previous equations, p and dc are the crater depth and diameter expressed in cm; p, m and
vn are the impactor density, mass and normal speed expressed in gcm-3, g and km/s; cT is the
speed of propagation of longitudinal waves in the target expressed in km/s and k∞ is a constant
depending from the target material’s hardness (k∞ was assumed to vary in the range 0.40-0.45
for copper).
A flow chart of the procedure for data analysis is presented in Fig. 3-3.
From Witness Plate analysis
Number N and equivalent diameter dc,j
of Witness Plate craters
Njd jc ..1, Crater equations
3/2
,
352.06/1
, ntipjpjc vmkp
18.1
,
,
,60.9
T
ntip
jc
jc
c
v
d
pFrom photodetector and strain gauges
Ejecta cloud tip speed normal to Witness
Plate surface
ntipv ,
EXPERIMENTS LITERATURE
Speed-mass Probability Function of
fragments within the ejecta cloud
),( mvP n
Fig. 3-3. ASI/CISAS data analysis procedure
Experimental results (craters number and size, ejecta velocity distribution) are used as input to
available crater equations, to finally obtain mass-speed probability functions which describe the

AI26.1 Report Final.doc Section 3. Experimental activity by WG3 member agencies
IADC WG3 40/77
characteristics of fragments within each ejecta cloud.
Some further details on the analysis steps presented in Fig. 3-3 are given in the remainder of this
section.
a. Witness plates analysis
High-resolution images of copper witness plates were analyzed to infer information about
craters pattern, distribution and size. For this purpose, specific ad-hoc software was developed
in Matlab environment. Craters identification, counting and measurement are based upon the
identification of color variations in pictures properly treated through the application of specific
color maps. Moreover, to avoid erroneous craters identifications due to scratches or
imperfections of the plate, comparisons were implemented between images of the plates before
and after the experiment: damage features recognized on both pictures are labeled as “false
positives” and then cancelled from the analysis results. Accepted craters are finally sorted in four
bins referring to the following ranges of equivalent diameter: 0.025 to 0.05 mm, 0.05 to 0.1 mm,
0.1 to 1 mm and >1mm. Final and intermediate analysis results are made available in both
graphical and in data structure format while a text report is provided with all the analysis
messages.
Two examples of the witness plate analysis procedure are given in Fig. 3-4 and Fig. 3-5, referring
to shots no. 8646 and 8656 respectively (see Tab. 3-1 to review the relevant test parameters). In
both figures, left pictures are raw images of the witness plates after the test and right pictures
highlight the “real” craters identified after “false positives” deletion. In the central pictures,
green and blue symbols highlight damage features recognized on pre-shot (e.g. due to plate
imperfections) and post-shot images, respectively; magenta and cyan symbols are features that
are present on both pre-shot and post-shot pictures and are therefore labeled as “false
positives”; red squares mark craters that come out from the post-shot image only and hence
they are recognized as “real craters”.
Fig. 3-4. ASI/CISAS impact tests. Witness plate analysis for shot no. 8646 (1.5 mm projectile at 5.20 km/s
on a 10 mm Al6082-T6 plate, normal impact): raw image (left), damage features recognized by the analysis
(center), craters identified after “false positives” subtraction (right).

AI26.1 Report Final.doc Section 3. Experimental activity by WG3 member agencies
IADC WG3 41/77
Fig. 3-5. ASI/CISAS impact tests. Witness plate analysis for shot no. 8656 (2.3 mm projectile at 5.34 km/s
on a 10 mm Al6082-T6 plate, 45° impact): raw image (left), damage features recognized by the analysis
(center), craters identified after “false positives” subtraction (right).
b. Time-of-Flight measurements
Among the complexity of the instrumentation, to estimate the ejecta speed is indeed much
more critical than measuring the craters extent on witness plates. In fact, ejecta clouds are
complex structures in which particles of various size travel in different directions and have a
wide range of velocities. In this framework, only the ejecta cloud tip speed was estimated, which
indeed could give a misleading picture of the phenomenon under investigation.
An impact flash photo-detector and six strain gauges on the witness plates supports were used
to provide an estimation of the time of flight of the ejecta cloud travelling from the target to the
witness plate. In fact, the photo-detector is sensitive to the light emitted by the primary impact
onto the target and the secondary impact onto the plate, while the strain gauges record the
stress waves propagating along the witness plates as a consequence of the transient load
imparted by the cloud to the structure. Sample signals of the photo-detector and one strain
gauge are presented in Fig. 3-6. All of them were sampled at 1 MS/s and therefore provide
enough time resolution for the Time-of-Flight (ToF) estimation.
It appears that the photo-detector records the flash emitted by both the primary and secondary
impact: the projectile hitting the target produces a narrow signal, while the ejecta cloud provides
a wider signal, since its impact on the witness plate is much more distributed in time according
to the fragments speed range. In conclusion, taking the narrow peak maximum as reference (t0
defines the instant on which the primary impact occurs), the average and standard deviation of
the debris cloud time of flight can be estimated through the identification of t1 and t2 (we
assumed a Gaussian distribution for the ejecta cloud speed, although different assumptions
might be considered to better represent the velocity scatter within the cloud):
12
02
tt
ttToF
ToF
avg
Eq. 3-3

AI26.1 Report Final.doc Section 3. Experimental activity by WG3 member agencies
IADC WG3 42/77
t0
t1
t2
Ejecta cloud impact
Projectile impact
Signal
onsetEM
spike
Fig. 3-6. ASI/CISAS impact tests. Shot no. 8641. Impact flash detector (red) and strain gauge (black) signals
Considering the strain gauge, two signal features are evident in Fig. 3-6. Referring to the debris
cloud impact, a certain delay appears between the onsets of the photo-detector and strain
gauge signals. This is due to the finite time of propagation of stress waves in the witness plate
material between the impact zone and the sensor and introduces a systematic error in the ToF
estimation that can be corrected with some effort. Another drawback in using the strain gauge is
that it records the dynamic response of the plate and it can provide only the time of arrival of
the wave to the sensor, since further oscillations continue until the plate vibration modes are
damped, even if the impact phenomenon is over. For these reasons, the use of the photo-
detector should be preferred for ToF estimation, as far its output has adequate signal to noise
ratio. In fact, there are materials which do not emit enough light upon impact (e.g. MLI, Kevlar,
Nextel, etc.) and in such cases the employment of information coming from strain gauges
becomes unavoidable.
Once the ToF is assessed, the ejecta speed vn along a direction perpendicular to the witness
plate is simply computed dividing the normal distance between the target and the witness plate
by the time of flight. The standard deviation vn is obtained accordingly.
3.1.4 Results
Results about craters counting and craters size estimation are presented hereafter. Even though
craters counting does not provide information about the mass and speed of fragments which
produce the damage, it nevertheless gives a first idea of the extent of the ejecta phenomenon,
offering also the opportunity of comparing the behavior of different spacecraft materials in
various impact conditions.

AI26.1 Report Final.doc Section 3. Experimental activity by WG3 member agencies
IADC WG3 43/77
Three figures are presented in the following, each of them referring to experiments performed
using projectiles having fixed size (dp= 1mm in Fig. 3-7, dp=1.5 mm in Fig. 3-8 and dp=2.3 mm in
Fig. 3-9). In the three cases, the number of craters is plotted as a function of the impact velocity
range (two speed bins have been considered: 4.0-4.5 km/s and 5.0-5.5 km/s) and the crater
diameter range (four size bins have been considered: 0.025-0.05 mm, 0.05-0.1 mm, 0.1-1 mm
and >1 mm). The images on the left compare the behavior of different target materials and
configurations, while the images on the right evaluate the response of a single target
configuration (Al 6082-T6 alloy, 10 mm thick) with different values of the impact angle.
Fig. 3-7. ASI/CISAS impact tests. Number of craters for dp=1 mm.
Fig. 3-8. ASI/CISAS impact tests. Number of craters for dp=1.5 mm.
Fig. 3-9. ASI/CISAS impact tests. Number of craters for dp=2.3 mm.
AI26.1 Report Final.doc Section 3. Experimental activity by WG3 member agencies
IADC WG3 44/77
Even considering the scattering of results, some important conclusion can be immediately drawn
by looking at the three above figures:
A single HVI on whatever spacecraft material produces a significantly high number of
new debris (order of thousands) in a wide size range up to the magnitude of the original
one;
HVI with large debris create more ejecta than impacts with small ones and increasing the
impact velocity causes a slight raise of the fragments number;
HVI on brittle materials (e.g. solar cells cover-glass) produce more ejecta than impacts
on ductile ones (e.g. metals), but the environment pollution and the damage potential of
particles coming from metals are higher, since large fragments seem to be prevalent;
moreover, metals covered by MLI blankets generate less fragments than similar targets
without MLI;
The impact obliquity seems to have a non-monotonous effect: the number of ejecta
increase from 0° to 45°, then is almost stable up to 60° and finally falls down significantly
above 60°.
3.2 CNES
An impact test was performed at Centre d'Etudes de Gramat (CEG, France) with a light-gas gun
able to accelerate millimetre-sized projectiles to hypervelocity, with a limit of 10 g launch
package launched at 8 km/s [Loupias, 1996].
After the shot of a 5 mm steel projectile at 5.6 ± 0.2 km/s on an Al6061-T6 target 35 mm thick,
ejecta were collected on a copper witness plate 1 mm thick, located at 148 mm in front of the
target. The number of secondary impacts (due to cone ejecta) on the witness plate was lower
than that obtainable from brittle targets, there were no spall fragments and the total ejected
mass was rather low. The primary crater volume was about 1 cm3, corresponding to about 3g of
aluminium. However, it should be considered that a significant part of material was compressed
at the bottom of the crater, or remained attached to the target by forming a lip around the
crater.
The witness plate is shown in Fig. 3-10, left. The location of secondary impacts on a ring gives an
evidence for the conical shape of the ejecta cloud; cone angle is about 34°, which corresponds to
a 56° elevation angle; width of the ring on the witness plate corresponds to an angle of about 6°.
The number of secondary craters is maximum at the centre of the ring, and decreases at the
periphery. The size distribution is homogeneous on the whole ring. The cumulative size
distribution of craters larger than 100m (referring to three positions near the ring centre) is
shown in Fig. 3-10, right. The slope of the distribution is about -1.6, that gives a -2.6 value for the
coefficient of the ejecta size distribution (see section 2.2.2). Depth to diameter ratio of
secondary craters is close to 0.2: this value suggests that ejecta larger than 100m have an
ejection velocity less than 1km/s.

AI26.1 Report Final.doc Section 3. Experimental activity by WG3 member agencies
IADC WG3 45/77
1,21,00,80,60,40,20,0
0
10
20
30
exp3
exp6
exp9
Ejecta diameter (mm)
Flu
en
ce
/c
m2
Fig. 3-10. Witness plate used in the CNES/CEG test (5mm AISI304 projectile impacting an Al6061-T6 35 mm
thick plate at 5.6 km7s): ejecta damage (left) and cumulative size distribution of craters (right)
3.3 DLR
Experimental tests with light-gas gun were performed at EMI (Freiburg, Germany) on solar cell
samples from the Hubble Space Telescope (HST) using 500 m glass bead projectiles at speed
close to 5 km/s. Impact angle of 30°, 45° and 60° [Schaefer and Schneider, 1997]. Test conditions
are presented in Tab. 3-2.
Test
ID
Target
material
dp
(m)
vp*
(km/s)
(°) Comments
2677 HST solar cell 500 4.5 30 Small secondary ejecta
2684 HST solar cell 500 4.8 45 Target perforation
2686 HST solar cell 500 4.8 60 Target perforation
Tab. 3-2. Test performed on Hubble Space Telescope (HST) solar cell samples at EMI (Germany): impact
conditions
For tests performed with an incidence of 30° and 45°, the ejection angles corresponding to the
maximum of ejecta were consistent with models predictions, the cone of ejecta was however
widely open with a value of 15-20°. For test case 2686, with an incidence of 60°, the angular
distribution was characterized by a narrow band, heavily cratered, however the limit for the
ricochet was not reached (the difference with other experiments reported in the literature could
be due to the use here, of glass material as projectile).
Test
ID
Ejecta cone angle
Experiment (°)
Ejecta cone angle
Model (°) Comments
2677 45 55 Spread: 15°
2684 62 67 Spread: 20°
2686 85 80 Spread: 4°
Tab. 3-3. Test performed on Hubble Space Telescope (HST) solar cell samples at EMI (Germany): ejecta
cone angles

AI26.1 Report Final.doc Section 3. Experimental activity by WG3 member agencies
IADC WG3 46/77
Microscopic observation of test sample 2684 (Fig. 3-11) provides interesting results about the
size distribution and the amount of ejecta. The crater is typical of impact perforation produced
on solar cells. The shape reflects the oblique incidence (45°). The mean diameter of the
conchoidal zone is 2750 µm; the cover glass (thickness 150 µm) was crushed and ejected within
two zones, i.e. a circular conic zone with an outer diameter of 2750 µm and an inner diameter of
1500 µm and a cylindrical central zone with a diameter of 1500 µm.
Fig. 3-11. EMI test no. 2684: HST solar cell sample hit by a 0.5 mm projectile at 4.8 km/s, 45° impact angle
The silicon layer (thickness 250 µm) was crushed and ejected within a central zone, 1500 µm in
diameter. Taking into account these data it is possible to estimate the total mass of material
ejected during the impact as Mej = 2.43x10⁻³ g. Since the mass of a 500 µm glass projectile is mp=
1.6x10⁻⁴ g, the ratio of the ejected mass to the mass of the impactor is Mej/mp 15. Using the
equation proposed by Gault [1973] for the computation of total mass ejected upon cratering of a
simple semi-infinite brittle target gives a ratio of about 50. Considering that in our case the
target (formed of several layers of materials bound by an adhesive) was perforated (with a
significant ejection of matter downstream) the agreement between both results is reasonably
good.
Many small fragments (some could have been trapped by the adhesive used for the
manufacturing of the cells) are still visible inside the crater: their sizes vary from 5 µm (optical
resolution limit) to 30 µm. The smallest are roughly cubical in shape, the largest are elongated
fragments. Some large (100 µm) spall fragments in the outer spall zone were not ejected.
The cumulative number of craters split in different size bins are shown in Tab. 3-4.

AI26.1 Report Final.doc Section 3. Experimental activity by WG3 member agencies
IADC WG3 47/77
Crater equivalent diameter
(m)
No. of craters
Test no.2684
No. of craters
Test no.2686
>500 0 8
200-500 0 65
100-200 0 140
50-100 180 350
20-50 400 0
10-20 3500 7500
5-10 0 26000
Tab. 3-4. Test performed on Hubble Space Telescope (HST) solar cell samples at EMI (Germany):
cumulative number of craters per size
3.4 JAXA
Two main programs were recently conducted in Japan referring to ejecta characterization.
On one hand, a study was performed in collaboration with Kyushu Institute of Technology (KIT)
in the framework of ISO activities for defining a standard test procedure to evaluate spacecraft
ejecta upon hypervelocity impact [Sugahara et al, 2009]. Distribution of ejecta fragments was
evaluated from craters on witness plates and the measurement process was suggested by JAXA
as a method of facility calibration for ejecta tests.
On the other hand, the Nagoya Institute of Technology (NIT) investigated the difference of ejecta
distributions according to projectile density and heat treatment of target materials [Nishida et al,
2010]. Craters in witness plates were analyzed with an X-ray spectrometer to evaluate the ejecta
fragment cloud structure. Size distribution of ejecta particles was also obtained from fragments
recovered in the test chamber.
3.4.1 Tests for evaluating standard procedures for ejecta characterization
HVI experiments were conducted with two-stage light gas guns at Kyushu Institute of Technology
(KIT) and the Institute of Space and Astronautical Science/JAXA (ISAS). Their calibers are 5 and 7
mm, respectively. Post-impact analysis was conducted at KIT.
a. Impact conditions and experimental setup
Al2017 spheres (1 mm diameter) were used as projectiles and were accelerated to 4 and 5 km/s.
In general, a large amount of spall fragments is generated from targets made by brittle materials
(e.g. silica), and samples can be broken by the impact pressure. For these reasons, brittle targets
were covered with a rubber sponge and an aluminum case (Fig. 4-1). Witness plates were
mounted as shown in Fig. 3-12 (in case of thin targets, two witness plates were installed in front
and behind the sample). Copper alloy (C1100P-1/4H) witness plates were mounted parallel to
the target impact surface and the standoff distance was 100 mm. The front witness plate had a
hole of 30 mm in diameter.

AI26.1 Report Final.doc Section 3. Experimental activity by WG3 member agencies
IADC WG3 48/77
270mm
240mmTarget
Fig. 3-12. JAXA/KIT impact tests. Experimental configurations for semi-infinite targets (left) and thin
targets (right)
b. Post-impact analysis
The mass of the target was measured before and after the experiment to assess the total
amount of ejecta fragments Me,tot. The obtained values were compared to those predicted by Eq.
3-4 [Gault, 1973] to empirically calculate the value of K in the equation.
2133.15.06
, cos1041.7 iitptote EKM Eq. 3-4
K is a material-dependant coefficient, p and t are the density of projectile and target, Ei is the
projectile kinetic energy, and i is the impact incidence angle.
Position and size of craters on the witness plates were measured with a microscope system (Fig.
3-13) having 0.025 mm resolution. Craters were detected by comparing witness plate images
recorded before and after the impact test.
Craters shape was approximated by an ellipse, and the average of major and minor axes was
defined as crater equivalent diameter.
Fig. 3-13. Microscope system for witness plate craters analysis
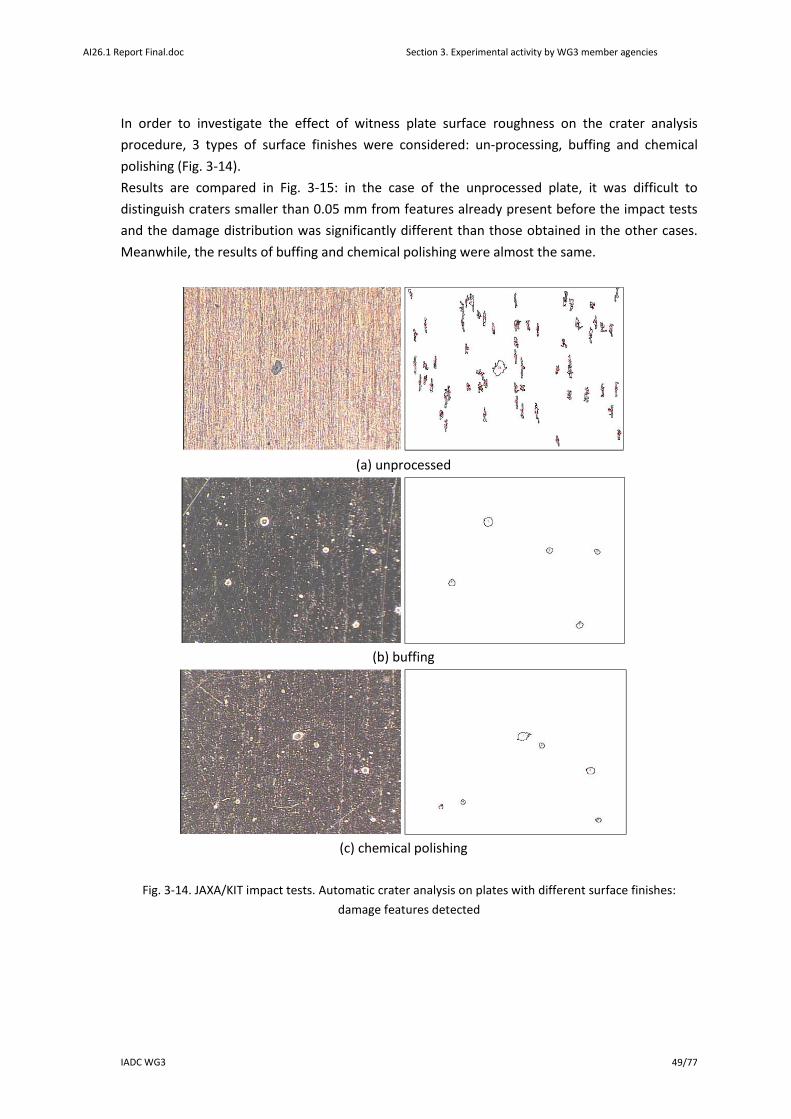
AI26.1 Report Final.doc Section 3. Experimental activity by WG3 member agencies
IADC WG3 49/77
In order to investigate the effect of witness plate surface roughness on the crater analysis
procedure, 3 types of surface finishes were considered: un-processing, buffing and chemical
polishing (Fig. 3-14).
Results are compared in Fig. 3-15: in the case of the unprocessed plate, it was difficult to
distinguish craters smaller than 0.05 mm from features already present before the impact tests
and the damage distribution was significantly different than those obtained in the other cases.
Meanwhile, the results of buffing and chemical polishing were almost the same.
(a) unprocessed
(b) buffing
(c) chemical polishing
Fig. 3-14. JAXA/KIT impact tests. Automatic crater analysis on plates with different surface finishes:
damage features detected

AI26.1 Report Final.doc Section 3. Experimental activity by WG3 member agencies
IADC WG3 50/77
Chemicalpolishing
Buffing
Unprocessed
Fig. 3-15. JAXA/KIT impact tests. Automatic crater analysis on plates with different surface finishes:
comparison of results
c. Results on SiO2 targets
Craters counting and measurement was performed on a witness plate used for an impact test on
a SiO2 target (Fig. 4-1). Impact speed was 3.71 km/s. Ejecta mass was 70.2 mg. Size distribution
of craters is shown in Fig. 3-16. Scatter angle of the ejecta fragments was 35°. Number and size
of craters is shown in Tab. 3-5.
Fig. 3-16. JAXA/KIT impact test on SiO2 target. Automatic crater analysis on plates with different surface
finishes: comparison of results

AI26.1 Report Final.doc Section 3. Experimental activity by WG3 member agencies
IADC WG3 51/77
Diameter
range
(mm)
0.025 to
0.05
0.05 to
0.075
0.075 to
0.10
0.10 to
0.15
0.15 to
0.20
0.20 to
0.30
0.30 to
0.40
0.40 to
0.50
0.50 to
0.75
0.75 to 1.0
Number of
craters 7944 1420 376 196 64 21 3 1 0 0
Tab. 3-5. JAXA/KIT impact test on SiO2 target. Number of craters
3.4.2 Effects of projectile density and target heat treatment on ejecta distributions
HVI experiments were conducted with two-stage light-gas guns at Nagoya Institute of
Technology (NIT) and the Institute of Space and Astronautical Science/JAXA (ISAS). Their calibers
are 14 and 7 mm, respectively. Post-impact analysis was conducted at NIT.
a. Impact conditions and experimental setup
Spherical projectiles (3.2, 7.1, and 14.3 mm) made by polycarbonate, steel, iron, and aluminum
alloy were launched at 2, 4 and 6 km/s.
Copper alloy (C1100P-1/4H) witness plates were mounted in front of targets (Fig. 3-17) at a 50
mm standoff. Witness plate holes were 20 mm except for 3.2 mm projectiles (in this case, hole
diameter was 30 mm). Targets were made of A1100-O, A1100-H, A6061-O, and A6061-T6
aluminum alloy.
Fig. 3-17. JAXA/NIT test setup
b. Post-impact analysis and results
Front velocity of ejecta clouds was measured by images from a high speed camera. Ejecta
fragments larger than 0.001 g were collected from the test chamber (Fig. 3-18, left) and their
mass and size were measured, providing a fragment characteristic length Lc = (a+b+c)/3 (the

AI26.1 Report Final.doc Section 3. Experimental activity by WG3 member agencies
IADC WG3 52/77
geometric model for size measurements is shown in Fig. 3-18, right). The ejecta cone angle was
estimated starting from the crater distribution on witness plates (Fig. 3-19). Craters were
analyzed with an energy dispersive X-ray spectrometer to identify the material of impacting
fragments.
Fig. 3-18. JAXA/NIT impact tests. Ejecta fragment collected after an impact test (left). Fragment geometric
model (right)
Fig. 3-19. JAXA/NIT impact tests. Witness plate used in an experiment on a A6061-T6 target
c. Results
In case of impacts at vp=6 km/s of 7.1 mm polycarbonate projectiles, the front velocity of the
ejecta cloud was in the range 0.8-1.2 vp. The number and average cross section of collected
ejecta fragments are shown in Fig. 3-20 and Fig. 3-21, respectively.

AI26.1 Report Final.doc Section 3. Experimental activity by WG3 member agencies
IADC WG3 53/77
Fig. 3-20. JAXA/NIT impact tests. Cumulative number of collected ejecta fragments
Fig. 3-21. JAXA/NIT impact tests. Average cross section of collected ejecta fragments
3.5 UKSPACE
Light-gas gun impact tests were performed at Unispace (Baron, 1997; McDonnell et al, 1998) on
solar cell samples from the Hubble Space Telescope (HST) or EuReCA using 500 m glass bead
projectiles at speed close to 5 km/s. Impact angle was set in the range 30° - 75° (test conditions
and results summary are presented in Tab. 3-6).
All targets were completely perforated (cover glass, silicon and substrate) and hence test
conditions were somewhat different from the ideal semi-infinite case. A significant part of debris
cloud was therefore ejected downstream, thus reducing the amount of backscattered ejecta.
Moreover, in some tests more than one projectile impacted the target at the same time, at some
distance apart. It was difficult in these conditions to assess precisely the amount of ejecta and
the angular distribution of fragments.

AI26.1 Report Final.doc Section 3. Experimental activity by WG3 member agencies
IADC WG3 54/77
Test
ID
Target
material
dp
(m)
vp*
(km/s)
(°) Comments
33 HST solar cell 500 4.63 45 2 or 3 hits
37 HST solar cell 500 4.51 75 1 hit*
38 EuReCa solar cell 500 4.73 45 3 hits
39 EuReCa solar cell 500 4.66 75 1 hit
* Sabot impact on the stopper edge could have produced additional fragments
Tab. 3-6. Test performed on Hubble Space Telescope (HST) and EuReCa solar cell samples at UniSpace Kent
(UK): impact conditions
Since targets were hit by more than one projectile, secondary damages observed on witness
plates were quite scattered. Nevertheless, it was possible to recognize a clear variation in the
density of impact features, along a line going upward from the base of the witness plate. For test
no. 33, the maximum number of secondary impacts corresponded to an ejection angle of 60°.
For test no. 38, the debris cone was widely open and the maximum number of secondary
impacts occurred at an angle between 50° and 55°. For tests cases no. 37 and 39, secondary
impacts were observed in a narrow band, corresponding to an ejection angle of about 80°-85°.
The ricochet phenomena expected to occur for impact angles larger than 60° was observed only
at angles greater than 75 °.
With the exception of test case 33 (no secondary damage larger than 200 µm were observed in
this case), size of craters varied from 5 µm (optical resolution limit) to 750 µm. Even though such
distribution is consistent with the one given by other experiments on brittle targets, the
cumulative number is less than expected (about a factor of 2, this is due mainly to the
perforation of the primary target as previously stated). Many small craters were circular in
shape, with a depth to diameter ratio between 0.25 and 0.40 (this low ratio is consistent with
impacts produced in copper and also with the low density of ejected silicon material). Large
craters were irregular or oblong in shape (either sign of oblique impact or irregular shaped
fragments). Velocity of ejecta was not measured, but morphology and geometry of secondary
craters suggested an impact velocity speed exceeding 1 km/s.
The cumulative number of craters split in different size bins is shown in Tab. 3-7.
Crater equivalent
diameter (m)
No. of craters
Test no.33
No. of craters
Test no.37
No. of craters
Test no.38
No. of craters
Test no.39
>500 0 7 4 12
200-500 6 100 16 12
100-200 80 180 40 48
50-100 250 240 170 240
20-50 0 0 0 10000
10-20 0 0 0 21000
5-10 0 0 0 0
Tab. 3-7. Test performed on Hubble Space Telescope (HST) and EuReCa solar cell samples at UniSpace Kent
(UK): cumulative number of craters per size

AI26.1 Report Final.doc Section 3. Experimental activity by WG3 member agencies
IADC WG3 55/77
3.6 NASA
NASA has performed a number of impact tests over the years to study ejecta generation and
effects on spacecraft. One study is described in Christiansen (1993), where a 0.2cm thick Al
3003-0 ejecta catcher was positioned 10cm in front of a variety of different bumper shield
materials. A 1.27cm diameter hole was drilled in the center of the ejecta catcher, to allow the
projectile to pass by the ejecta catcher without interference. All projectiles were 0.32cm
diameter Aluminum 2017-T4 alloy spheres, impacting the target materials at nominally 6.8 km/s
and at a 0o impact angle (normal to the target surface).
Fig. 3-22. Cross-section of NASA test setup
Table 3-8 provides data from these tests obtained by high-speed cameras and visual
observations of the ejecta catcher. As indicated, no ejecta damage was evident from the
aluminum mesh and Kevlar bumpers, and the ejecta expansion velocity was very low with these
materials.
Rank* Bumper Material Ejecta Maximum
Velocity (km/s)
Damage to ejecta catcher
1 Aluminum mesh 2.1 No holes, no damage
2 Kevlar 2.4 No holes, no damage
3 Alumina/aluminum
laminate
4.2 No holes, small scratches
4 Aluminum/graphite-
epoxy laminate
3.9 A few small holes (<20)
5 35% SiC-Al
composite
5.2 130 small holes (0.46mm max
hole diameter), estimate
largest secondary particle size
is 0.2mm
6 Aluminum 6061-T6
alloy
6.7 Many holes > 1mm diameter
Tab. 3-8. Secondary ejecta characteristics for various bumper materials. Data from HVI of 0.32cm Al
projectile at 6.8 km/s, normal impact, on 0.22 g/cm2 bumpers. *Rank based on damage to ejecta catcher,
with the highest rank resulting in the least amount of damage to the ejecta catcher.
NASA performed another ejecta study reported by Shephard and Scheer (1993). A number of
Projectile
Al 2017T4
0.32cm diameter
6.8 km/s, 0o
Ejecta Catcher
Al 3003-0
0.2mm thick
15cmx15cm
10cm
Bumper
(various mat’l)
0.22 g/cm2
Rear wall
Al 2024T3
1.3mm thick
15cmx15cm
Witness Plate
Al 3003-0
0.4mm thick
15cmx15cm
10cm5cm

AI26.1 Report Final.doc Section 3. Experimental activity by WG3 member agencies
IADC WG3 56/77
impact tests were performed to evaluate the consequences of secondary ejecta impacts on
Space Station hardware, including electronic boxes, fluid and electrical umbilical lines, and
antenna waveguides. Although these systems were damaged from secondary ejecta impacts, no
failures of the hardware were observed.

AI26.1 Report Final.doc Section 4. Recommendations for experimental characterization of ejecta
IADC WG3 57/77
4 Recommendations for experimental characterization of
ejecta
This section provides recommendations on experimental methods for ejecta characterization,
with the aim of setting common references for the comparison and utilization of data obtained
by different facilities. This includes the identification of ejecta parameters to be measured during
and after impact experiments, the selection of materials and configurations suitable to represent
realistic spacecraft hardware, the definition of impact test conditions and a complete description
of two benchmark cases for normal and oblique angle. Finally, procedures for data utilization are
suggested to derive information on total ejecta mass, fragments spatial distribution and average
velocity.
The content on this section is based but not limited to the ISO Working Document ISO/TC 20/SC
14 - FDIS 11227 [ISO, 2012].
4.1 Measurement objectives
Knowledge of the 3-D spatial mass-speed distribution, shape and ballistic coefficients of
fragments in function of impact conditions and target parameters would in principle provide a
full characterization of backscattered ejecta clouds. There is a variety of experimental techniques
suitable for this scope, employing soft catchers, witness plates, photographic and X-ray imaging
and indirect methods which allows a determination of the mass, momentum or energy of the
fragments (Nysmith and Denardo, 1969; Wilbeck and Young, 1992). Some of these techniques
have been described elsewhere in this report and used by researchers from ASI and JAXA.
However, full characterization of each secondary debris particle in the ejecta cloud (especially
individual measurement of the velocity) is currently unfeasible and/or unpractical. Considering
such limitations, and in accordance to the proposed ISO standard [ISO, 2012], it is suggested to
set the following parameters as measurement objectives:
Total amount of back-scattered ejecta Me,tot
Me,tot includes the mass of fragments belonging to both the target and the projectile:
Me,tot = Me,target + Me,proj Eq. 4-1
When comparing the ejecta mass emerging from different materials, only fragments coming
from the target could be of interest. However, it should be considered that projectile ejecta
are usually less than 1% of the total secondary debris mass and therefore negligible.
Moreover, a comparison between the behavior of different targets could be done by fixing
the projectile properties (material and impact conditions) during experimental activity.
Crater pattern and size distribution of craters on a witness plate facing the target.
The crater pattern left by secondary debris on a witness plate placed close to the target
AI26.1 Report Final.doc Section 4. Recommendations for experimental characterization of ejecta
IADC WG3 58/77
provides information on the ejecta cloud bulk geometry (primarily the cone angle, see Fig.
1-2) as well as the number and size distribution of craters. These data give a raw estimate of
the mass of individual fragments in the cloud. However, craters extension is not sufficient to
univocally determine the velocity and size of the particles that caused the damage: in fact a
crater of given size could be both produced by large and slow particles, as well as small and
fast ones.
Average (or maximum) speed of ejecta.
As an option, the average (or maximum) speed of ejecta particles can be assessed using
proper instrumentation (e.g. active sensors or high speed cameras) that provide a direct
measure of the time of flight of secondary debris from the impact point on the target to the
witness plate. Measurement of the individual velocity of particles is currently unfeasible
and/or unpractical.
4.2 Experimental methods
4.2.1 Materials selection
The choice of materials regards the target from which secondary debris come as well as witness
plates or catchers located close to the target to record information on ejecta particles.
a. Target materials
Criteria for materials selection are based on their representativeness of real space hardware and
on the extent of their utilization in space (e.g. total area). However, material type, thickness
(relative to projectile dimension), and surface conditions (e.g. roughness) as well as
configuration (fabric, mesh versus solid plate, etc.) influences quantity and damage potential of
secondary ejecta and therefore additional geometric information of target samples has to be
taken into account.
The bulk of ejecta come from brittle materials (i.e. solar cells and glass windows), while the
amount of secondary debris from aluminum alloys is more than two times lower. Furthermore,
ageing of materials could contribute to increase with time the quantity of ejecta from solar
panels [Myagkov et al, 2009]. However, the large presence of aluminum surfaces on orbit makes
it necessary to account from aluminum ejecta.
It is suggested to consider the following:
Aluminum alloy (AMG-6, Al6061-T6, Al7075-T6), representative of rocket bodies
structures, skins of honeycomb sandwich panels and bumper panels on manned vehicles
(>1000 m2 on the ISS, thickness 0.08-0.2 cm);
Aluminum alloy (AMG-6, Al1100-O, Al1100-H, Al6061-O, Al6061-T6) coated with

AI26.1 Report Final.doc Section 4. Recommendations for experimental characterization of ejecta
IADC WG3 59/77
inorganic white paint, representative of the face-sheets of honeycomb sandwich
radiator panels (>500 m2 on the ISS, US segment, thickness 0.028 cm);
Aluminum alloy (AMG-6, Al1100-O, Al1100-H, Al6061-O, Al6061-T6) covered by MLI
thermal blankets, representative of surface panels and external equipment boxes;
CFRP plates, representative of the face-sheets of honeycomb sandwich panels for
spacecraft structures;
Fused silica or quartz glass, representative of the cover-glass of solar cells and manned
vehicles windows (outer panel thickness 10-14 mm);
Solar cells assembly, consisting of relatively thin (1mm) sandwiches made by (through-
the-thickness): cover-glass, silicon cell, kapton.
MLI coated with a protective thin layer of silicon (MAPATOX) becoming brittle after
exposure to space.
Thermal control paint on aluminum substrate (either on S/C components or on launcher
bodies)
As a preliminary indication, the speed of secondary ejecta particles is much lower for fabrics
than solid plates [Christiansen et al, 2010].
b. Witness plates and catchers
Witness plates or particles catchers are used to record information on ejecta fragments. The
main difference between the two solutions is that catchers made by soft material (e.g. low
density foams) in principle permit the recovery of almost intact fragments, while witness plates
give only indirect information on ejecta properties based upon the characteristics of the
resulting impact craters.
However, catchers require long manual operations to retrieve particles from the collector bulk
material, whereas witness plates can be analyzed automatically by means of suitable imaging
systems.
A comparative evaluation between witness plates and catchers for derive ejecta properties is
discussed in [Francesconi et al, 2010]. Few impact experiments were conducted to evaluate the
behavior of different catchers made of low density foams for industrial application such as
thermal and acoustic insulation. Because of the extremely brittle nature of the foams, results
were not satisfactory: ejecta fragments contributed to the global collapse of the catcher
structure at every impact condition and recovery of fragments was not possible. On the contrary,
useful information was retrieved by automatic analysis of the crater patterns left on metal
witness plate (see section 4.2.3 for a description of witness plate analysis procedures).
4.2.2 Test conditions
The choice of test conditions should be based upon a reproducibility requirement, i.e. selected

AI26.1 Report Final.doc Section 4. Recommendations for experimental characterization of ejecta
IADC WG3 60/77
experimental parameters should be achievable by most facilities in order to make the
comparison of results easy.
The list below is just a minimum set of test conditions that every facility running ejecta
experiments should consider to provide a common benchmark. Other test conditions for
deepening the knowledge on ejecta phenomena and populating databases are recommended as
well.
a. Projectile parameters
Material: aluminum alloy (e.g. Al 6061-T6, Al 2024-T6, Al 2017, Al 1100)
Shape and size: sphere, dp = 0.1±0.01 cm diameter
Impact velocity: vp = 5.0±0.1 km/s
Impact angle: = 0°, = 45° and = 60° (TBC)
The execution of tests at non-zero impact angle is recommended in addition to normal impact.
In fact, oblique impact is the only mean of not loosing fragments through the hole realized in the
witness plate to make the projectile reach the primary target (especially when testing brittle
targets, which typically produce narrow ejecta cones).
b. Target parameters
Material: aluminum alloy (e.g. Al 6061-T6, Al 7075-T6)
Size: ax x ay ≥ 50 mm x 50 mm
Thickness: t ≥ 10 mm
Fixture: threaded rods and bolts or clamps on the edges
Back surface left free
Among the target material and impact conditions, the production of ejecta depends on the
target thickness over projectile diameter ratio (t/d). To fix such degree of freedom, it is
recommended to select semi-infinite targets (i.e. target with thickness sufficient to prevent
formation of spall on the rear surface). However, if the behavior of specific spacecraft
components is the major interest, the target thickness should be selected to be representative
of the real flight hardware.
As an indication, thinner targets generate less damaging secondary ejecta than thicker ones
[Christiansen et al, 2010].
c. Witness plate parameters
Material: pure copper, annealed (e.g. C1100)
Size (normal impact): wx x wy ≥ 200 mm x 200 mm, with central circular hole having
diameter ≤ 30 mm
Size (oblique impact): wx x wz ≥ 200 mm x wz, with wz greater than 4 times the later size

AI26.1 Report Final.doc Section 4. Recommendations for experimental characterization of ejecta
IADC WG3 61/77
of the target (see Fig. 4-3)
Position (normal impact): in front of the target and parallel to the target surface, at
distance S ≤ 100 mm
Position (oblique impact): adjacent to one target edge and normal to the target surface
Thickness: tW = 2 mm
Surface processing: chemical polishing
Fixture: threaded rods and bolts or clamps on the edges
Back surface left free
Surface roughness should be specified in test reports.
4.2.3 Benchmark cases
Following the above indications, two benchmark cases are recommended for comparing results
on ejecta belonging to different test facilities.
In both cases, if brittle materials are used for targets, several spall fragments are generated and
the target can be disrupted by the impact pressure. It is therefore recommended to protect the
test specimen with a rubber sponge as shown in Fig. 4-1 [Sugahara et al, 2009].
Fig. 4-1. Target holder for brittle materials [Sugahara et al, 2009]. Sizes are given as preliminary indication.
a. Normal Impact

AI26.1 Report Final.doc Section 4. Recommendations for experimental characterization of ejecta
IADC WG3 62/77
Fig. 4-2. Sketch showing the recommended setup for normal impact tests (benchmark #1). Interface with
the impact facility is considered to vary from one facility to another.
To avoid deposit of dust coming from impact facility operations on the witness plate back face, a
protecting screen (not shown in the figure) with a central hole having diameter could be
placed uprange the witness plate (this could be useful to reduce uncertainty on witness plate
mass after the test).
b. Oblique Impact
Fig. 4-3. Sketch showing the recommended setup for oblique impact tests (benchmark #2). Interface with
the impact facility is considered to vary from one facility to another.

AI26.1 Report Final.doc Section 4. Recommendations for experimental characterization of ejecta
IADC WG3 63/77
4.3 Data analysis
4.3.1 Total amount of back-scattered ejecta Me,tot
Me,tot can be obtained by measuring the target and/or witness plate mass before (Mt,in and/or
Mwp,in) and after (Mt,fin and/or Mwp,fin) the impact test. The total ejecta mass can be in fact related
to the target and/or witness plate mass difference (Mt = Mt,in – Mt,fin and/or Mwp = Mwp,fin –
Mwp,in).
In both cases it is strongly recommended to specify the uncertainty in the ejecta mass
estimation, considering that:
The target mass after the test accounts for projectiles fragments that remain trapped
within the impact crater (Mtrap) and, depending on the impact facility used, dust can be
deposited on the target surface (Mdust,t):
Me,tot = Mt + Mtrap + Mdust,t Eq. 4-2
On one hand, Mtrap is usually less than 1% of the secondary debris mass and therefore
can be neglected. On the other hand, depending on the facility used, Mdust,t can be a
significant part of Mt, especially when small quantities of ejecta are produced (e.g.
ductile targets hit by small projectiles). In this case, it is suggested to experimentally
estimate Mdust,t by running few calibration experiments in which empty sabots with no
projectile inside are launched at the same impact conditions selected for the real testing
activity. Since no projectile hits the target, in such experimental condition Mdust,t is equal
to Mt.
In case of normal impacts, the witness plate cannot capture fragments ejected back
within the plate central hole (Mloss) and the plate back face can be contaminated by dust
consequent to impact facility operations (Mdust,wp):
Me,tot = Mwp + Mloss - Mdust,wp Eq. 4-3
On one hand, Mloss can be significant especially when the target is brittle and its
estimation might be difficult. On the other hand, Mdust,wp can be nearly null if a protecting
screen is used uprange the witness plate.
The different estimations of Me,tot obtained by Eq. 4-2 and Eq. 4-3 must be compatible within
their uncertainty ranges. However, It’s worth to notice that both Mloss and Mdust,wp (Eq. 4-3)
become negligible in case of oblique impact. It therefore seems that measuring the witness plate
mass difference Mwp in case of oblique impact could provide the best estimation of the total
ejecta mass.

AI26.1 Report Final.doc Section 4. Recommendations for experimental characterization of ejecta
IADC WG3 64/77
4.3.2 Witness plates craters
Analysis of the damage pattern on witness plates (position, number and size of craters) provides
data on the bulk geometry of the ejecta cloud. If witness plates inspected with some
reproducible technique (e.g. by a medium-power optical microscope), craters analysis can
benefit from automated pattern recognition procedures, see Sugahara et al [2009], Francesconi
et al [2010].
To avoid erroneous craters identifications due to scratches or imperfections of the plate and to
reduce the uncertainty of the image processing results, it is suggested to use chemically polished
witness plates and to compare high resolution plates images acquired before and after the
impact experiment.
It is then recommended to sort the impact craters in the following classes of equivalent
diameter. The resolution of the craters pattern analysis system should be specified as well.
- between 0.025 mm and 0.05 mm (mainly from the ejecta cone);
- between 0.05 and 0.1 mm (mainly from the ejecta cone);
- between 0.1 and 1 mm (mainly from spall);
- > 1 mm (from spall).
The size distribution of craters provides only a raw estimate of the mass of individual fragments
in the cloud, since craters extension is not sufficient to univocally determine the velocity and size
of the particles that caused the damage. Additional information is therefore requested, e.g. an
estimation of fragments velocity normal to the witness plate face (see section 4.3.3) and a
procedure using well-established empirical equations relating craters extension to the size and
speed of impacting particles (see section 4.3.4).
4.3.3 Ejecta speed
The velocity of ejecta fragments can be evaluated by analyzing pictures of high-speed video
camera systems looking at the impact event and/or with adequate point sensors which provide a
measure of the ejecta time-of-flight from the primary target to the witness plate. However, the
employment of both systems has significant drawbacks which could make difficult and/or
inaccurate the ejecta speed assessment:
High speed camera systems can in principle provide combined information on velocity
and size of individual fragments. Nevertheless, automatic tracking of particles within the
ejecta cloud is a difficult task and consequent trajectory/speed evaluation can be
affected by large errors.
Time-of-flight measurements can be achieved by sensors detecting ejecta impacts on the
witness plate and triggered by the projectile impact on the primary target. Possible
alternatives are given by contactless impact flesh detectors looking at both the target

AI26.1 Report Final.doc Section 4. Recommendations for experimental characterization of ejecta
IADC WG3 65/77
and the witness plate and/or impact sensors (e.g. strain gauges, accelerometers, PDVF
films, etc.) located on the witness plate. However, in both cases, it should be considered
that ejecta clouds are complex structures in which particles of various size travel in
different directions and have a wide range of velocities. Hence, time-of-flight sensors
can provide only an estimation of the average (or maximum) ejecta cloud speed and this
could give a misleading picture of the phenomenon under investigation.
In both cases, it is recommended to assess and specify the uncertainty on the speed estimation.
4.3.4 Procedure for deriving ejecta mass distribution in the cloud
Ejecta mass (size) distribution can be obtained if the following information is available:
Witness plates craters number and size (see section 4.3.2);
Ejecta fragments speed (at least average or maximum, see section 4.3.3);
Empirical equations relating craters extension to the size and speed of impacting
particles, in the form of Eq. 4-4:
DC = f (dp, vp, , projectile material, target material) Eq. 4-4
In the above equation, Dc is the crater equivalent diameter, dp and vp are the projectile’s
diameter and speed, is the impact angle. Projectile and target material normally appears in the
equation through density and/or other specific empirical coefficients.
When the three pieces of information above are available, the analysis of the witness plate
damage pattern gives a measure of the equivalent diameter DC,j of the j-th crater larger than
0.025 mm and knowledge of the j-th crater position on the witness plate provides an estimation
of the impact direction and hence the angle j.
Furthermore, proper instrumentation (high-speed camera system and/or impact sensors)
provides the speed of j-th ejecta fragment ve,j and/or the average velocity of the cloud ve,avg.
Finally, if empirical crater equations such as Eq. 4-4 are available from the technical literature, it
is therefore possible to estimate the mass of the j-th fragment me,j and/or the average mass
me,avg of the particles in the cloud:
jjejcje vDfm ,, ,,
1
,
Eq. 4-5
javgejcavge vDfavgm ,, ,,
1
,
Eq. 4-6
In both cases, it is recommended to assess and specify the uncertainty on the fragments mass
estimation.

AI26.1 Report Final.doc Section 4. Recommendations for experimental characterization of ejecta
IADC WG3 66/77
Uncertainty depends on the imaging system used to analyze craters onto witness plates, the
accuracy of the ejecta speed estimations and the reliability of empirical equations describing
craters size as a function of fragments speed and mass. It should be reminded that the validity of
such equations is often limited to certain experimental ranges and in general holds for spherical
particles only.

AI26.1 Report Final.doc Section 5. Ejecta database
IADC WG3 67/77
5 Ejecta database
The section summarizes the information that should be contained in a database describing the
behavior of material upon HVI with respect to their ejecta-production capability, with the scope
of providing users with data to predict/reduce the environment pollution from secondary
fragments.
The database will initially be populated with public data, provided in a later version of this
report, and could be regularly updated as soon as new tests or simulation results become
available.
5.1 Test setup
The following information should be provided:
Target category (e.g. brittle or ductile)
Target material, thickness, size and mass (with uncertainty) before impact
Witness plate (or catcher) material, size, mass (with uncertainty) and surface finish before
impact
Sketch showing the relative position (standoff and angle) between target and witness plate
(or catcher) as well as their fixture
Description of instrumentation for ejecta speed measurement (if any)
In case of numerical simulations, additional information is requested:
Target material models, mesh type (SPH, Euler, etc.) and resolution
Projectile material models, mesh type (SPH, Euler, etc.) and resolution
Witness plate material models, mesh type (SPH, Euler, etc.) and resolution
5.2 Test conditions
The following information should be provided:
Projectile material, shape, size, impact speed (with uncertainty) and impact angle
5.3 Experimental/numerical results
The following information should be provided:
Total ejecta mass (with uncertainty)
WP high resolution picture
Cone angle (with uncertainty)

AI26.1 Report Final.doc Section 5. Ejecta database
IADC WG3 68/77
Number of WP craters in size bins
Number of retrieved fragments in size bins, including aspect ratio
Ejecta cloud maximum (and/or average) speed (with uncertainty)

AI26.1 Report Final.doc Section 6. Acronyms and Abbreviations
IADC WG3 69/77
6 Acronyms and Abbreviations
AI Action Item
Al Aluminum
ASI Agenzia Spaziale Italiana (Italian Space Agency)
BLE Ballistic Limit Equation
CEA Atomic Energy Commission (France)
CEG Centre d'Etudes de Gramat
CFRP Carbon Fiber Reinforced Polymer
CISAS Interdepartmental Center for Space Studies and Activities
CNES National Center for Space Studies
DLR Deutsche Zentrum für Luft- und Raumfahrt (German Aerospace Center)
EMI Ernst-Mach Institute
ESA European Space Agency
EVA extravehicular activity
GEO Geostationary Earth Orbit
HST Hubble Space Telescope
HVI Hypervelocity Impact
IADC Interagency Space Debris Coordination Committee
ISAS Institute of Space and Astronautical Science
ISO International Standards Organization
ISS International Space Station
ISTC International Science and Technology Center
JAXA Japan Aerospace Exploration Agency
JSC Johnson Space Center
KIT Kyushu Institute of Technology
LDEF Long Duration Exposure Facility
LEO Low Earth Orbit
M/OD Meteoroids and Orbital Debris
MMOD Micrometeoroid and Orbital Debris
MASTER Meteoroid and Space Debris Terrestrial Environment Reference
MLI Multilayer Insulation
NASA National Aeronautics and Space Administration
NIT Nagoya Institute of Technology
ONERA Office National d'Études et de Recherches Aérospatiales
ORDEM Orbital Debris Environment Model (NASA)
ROSCOSMOS Russian Federal Space Agency
S/C Spacecraft
SiO2 Silicon Dioxide
SPH Smoothed-Particle Hydrodynamics
TU Braunschweig Technische Universität Braunschweig
UV UltraViolet
WG Working Group
WP Witness Plate

AI26.1 Report Final.doc Section 7. ReferencesAcronyms and Abbreviations
IADC WG3 70/77
7 References
Anderson C.E. Jr, Trucano T.G, Mullin S.A. (1990). Debris cloud dynamics. Int. J. Impact Engng. 9-
1, 89-113.
Arakawa M. et al (1995), Ejection velocity of ice impact fragments. Icarus 118, pp 341-354.
Asada N. (1985) Fine fragments in high-velocity impact experiments. JGR 90-B14, pp 12445-
12453.
Barge P. and Pellat R. (1993) Mass spectrum and velocity dispersion during planetesimal
accumulation: II-Fragmentation. Icarus 104, pp 79-96.
Bariteau M. and J.C. Mandeville (2001). A modelling of ejecta as a space debris source, ESA SP-
473, 321-326.
Bariteau M., J.C. Mandeville, F. Schäfer (2001). Ejecta production mechanism on painted
surfaces, ESA SP- 473, p.249-251
Bariteau M. (2001) Prolifération des débris orbitaux: production et évolution des particules
secondaires, Thèse ENSAE, Toulouse 2001
Baron (1997), private communication to J.C. Mandeville.
Bess T.D. (1975) Mass distribution of orbiting man-made space debris. NASA TN D-8108.
Borisov B.S, Garkusha V.I, Korsun A.G, Sisov A.A, Khomich T.M, Tverdokhlebova E.M. (2010).
Investigation of characteristics of electrical discharge at metal-dielectric surfaces of ISS. In Proc.
Conf. Information technologies in science, engineering, and education devoted to 50th
Anniversary of the first flight of a man in space – Yu.A.Gagarin. A.M. Prokhorov Academy of
Engineering Sciences. Pitsunda, Abkhazia, 20 Sept. - 1 Oct. 2010.
Caswell R.D, McBride N, Taylor A.D. (1995). Olympus end of life anomaly – a Perseid meteoroid
impact event? Int. J. Impact Engng, 17, 139- 150
Christiansen E.L., Cour-Palais B.G., Friesen L.J. (1999). Extravehicular Activity Suit Penetration
Resistance, International Journal of Impact Engineering, Vol. 23, pp. 113-124.
Christiansen, E.L. (1987). Evaluation of Space Station Meteoroid/Debris Shielding Materials,
Eagle Engineering Report No. 87-163.
Christiansen, E.L. (2003). Meteoroid/Debris Shielding, NASA Technical Publication, NASA/TP-
2003-210788.

AI26.1 Report Final.doc Section 7. ReferencesAcronyms and Abbreviations
IADC WG3 71/77
Christiansen, E.L. et al. (2009). Handbook for Designing MMOD Protection, NASA TM-2009-
214785.
Christiansen E.L., Nagy K, Hyde J. (2010) NASA secondary ejecta status. In Proc. 28th IADC
Meeting. March 2010, Trivandrum, India
Cohen L.J. (1995). A debris cloud cratering model. Int. J. Impact Engng. 17/1-3, 229-240.
Corvonato E., Destefanis R., Faraud M. (2001). Integral model for the description of the debris
cloud structure and impact, Int. J. Impact Engng. 26/1-10, 115-128
Cour-Palais B.G. (1982). Hypervelocity impact investigation and meteoroid shielding experiments
related to Apollo and Skylab. Orbital Debris. NASA CP 2360.
Dohnanyi J.S (1967). Collisional models of asteroids and their debris. Symposium n.33 of IAU, in
Physics and Dynamics of Meteors, (Kresak and Millmaneds), Reidel Publishing Company,
Dordrecht, Holland.
Drolshagen G, Nehls T and Noomen R. (2009) The small debris population in the GEO belt. In
Proc. 5th Europ. Conf. Space Debris. 30 March – 2 April 2009, ESOC, Darmstadt, Germany
Eichhorn G. (1975) Measurement of the light flash produced by high velocity particle impact.
Planet. Space Sci.,23, pp.1519-1525.
Eichhorn G. (1976), Analysis of the hypervelocity impact process from impact flash
measurements, Planet Space Sci., 24, 771.
Finnegan S.A, Pringle J.K, Atwood A.I, Heimdahl O.E.R, Covino J. (1995). Characterization of
impact-induced violent reaction behavior in solid rocket motors using a planar motor test model.
Int. J. Impact Engng. 17/1-3 311-322.
Francesconi A., C. Giacomuzzo and L. Barilaro (2010). A method to assess the average properties
of spacecraft ejecta from hypervelocity impact, Proc. of the 11 th Hypervelocity impact
symposium.
Francesconi A, Giacomuzzo C, Barilaro L, Segato E (2010). Number, size and speed distribution of
particles ejected from spacecraft surfaces during hypervelocity impact, in proc. 61st ARA
Meeting.
Frisch W. (1991), Hypervelocity impact experiments with water ice target, in Hypervelocity
Impacts in Space, J.A.M. McDonnell editor, pp 7-14.

AI26.1 Report Final.doc Section 7. ReferencesAcronyms and Abbreviations
IADC WG3 72/77
Fujiwara A., Kamimoto G. and Tsukamoto A. (1977), Destruction of basaltic bodies by high-
velocity impact, Icarus 31, pp 277-288.
Fujiwara A. and A. Tsukamoto (1980), Experimental study on the velocity of fragments in
collisional breakup, Icarus 44, 142-153.
Gault D.E. and Heitowit E.D. (1963), The partition of energy for hypervelocity impact craters
formed in rocks, Proc. of the 6th Hypervelocity Impact Symposium
Gault D.E., Shoemaker E.M. and Moore H.J. (1963), Spray ejected from the lunar surface by
meteoroid impact, NASA TN D-1767.
Gault D.E. and Wedekind J.A. (1969) The destruction of tektites by micrometeoroid impact,
Journal of Geophysical Research, Vol. 74, No 27.
Gault D.E., Hörz F. and Hartung J.B. (1972), Effects of microcratering on the lunar surface, Proc.
IIIrd Lunar Sci. Conf., vol. 3.
Gault D.E. (1973), Displaced mass, depth, diameter, and effects of oblique trajectories for impact
craters formed in dense crystalline rocks, The Moon 6, pp.32-44.
Hill D.C. (1990). The micrometeoroid impact hazard in space: techniques for damage simulation
by pulsed lasers and environmental modelling, PhD. Thesis, University of Kent at Canterbury, UK.
ISO/TC 20/SC 14 - FDIS 11227 (2012). Space Systems – Test procedures to evaluate spacecraft
material ejecta upon hypervelocity impact
Kessler D.J. and Cour-Palais B. (1978) Collision frequency of artificial satellites: creation of debris
belt. Journal of Geophysical research, 83, A6, 2637-2644
Kessler D.J. (1990) Collision probability at low altitudes resulting from elliptical orbits. Adv. Space
Res. 10/3-4, 393 – 396.
Kessler D.J, Zhang J, Matney M.J, Eichler P, Reynolds R.C, Anz-Meador P.D, and Stansbery E.G.
(1996) A computer based orbital debris environment model for spacecraft design and
observations in low Earth orbit. NASA TM-104825.
Kolesnikov E.K, Chernov S.V. (2009) On the possibility of long time existence of man-made
microparticles injected on oblong elliptic orbits with low perigee altitude in the near Earth space.
In Proc. 5th Europ. Conf. on Space Debris. 30 March – 2 April 2009, ESOC, Darmstadt, Germany.
Korsun A.G. (2010) Prediction of liquid propulsion impact on electric discharge processes at the
surface of the International space station. In Proc. Space Propulsion Conf., San Sebastian, Spain,

AI26.1 Report Final.doc Section 7. ReferencesAcronyms and Abbreviations
IADC WG3 73/77
3-6 May 2010.
Korsun A.G. (2010) Electric discharge processes in the plasma environment of the ISS generated
by high voltage solar arrays. In Proc. Conf. Information technologies in science, engineering, and
education devoted to 50th Anniversary of the first flight of a man in space – Yu.A. Gagarin. A.M.
Prokhorov Academy of Engineering Sciences. Pitsunda, Abkhazia, 20 Sept. – 1 Oct. 2010.
Lambert M, Schneider E. (1997). Hypervelocity impacts on gas filled pressure vessels. Int. J.
Impact Engng 20/6-10, 491-498.
Lange M.A, Ahrens T.J. and Boslough M.B. (1984). Impact cratering and spall failure of Gabbro.
Icarus 58, pp 383-395.
Lecomte C. (1963), Particules secondaires émises lors d'impacts à grande vitesse, Notice N29/63,
Institut Franco-Allemand de Recherches de Saint-Louis.
Loupias C. (1996), Private comunication to J.C. Mandeville.
Maki K. et al (2002). Detection of microwave emission in hypervelocity impact on aluminium. In
Proc. Asia-Pacific Microwave Conference, Kyoto, pp.1327-1330
Mandeville J.C. and Rival M. (1996), Enhanced Debris/Micrometeoroid Environment Models and
3-D Tools - Technical Note TN2 : Review and Selection of a Model for Ejecta Characterization,
Partial Report 452200/01, ONERA-CERT Toulouse.
Mandeville J.C, Perrin J.M, Vuillemin A. (2001). Space borne photometry perturbations from
solar light scattered by debris. In Proc. 3rd Europ. Conf. on Space Debris, ESOC, Darmstadt,
Germany, 19-21 March 2001.
Mandeville J.C., M. Bariteau (2004). Contribution of secondary ejecta to the debris population.
Adv. Space Res. 34, 944-950.
Mandeville J.C., Kitazawa Y., Akahoshi Y., Matsumoto H. (2010). Current status on CD11227 Test
procedures to evaluate S/C material ejecta upon HVI, ISO/TC20/SC14 Meeting, BSI London, May
10-14, 2010.
McDonnell J.A.M, McBride N. and Gardner D.J. (1997). The Leonid meteoroid stream: spacecraft
interactions and effects. In Proc. 2nd Europ. Conf. on Space Debris, Darmstadt 1997, pp.391-396
McDonnell J.A.M. et al. (1998) Meteoroid and debris flux and ejecta models, Final report ESA
contract 1887/96NL/JG, CR 4252.
McKnight D.S. (1991). Determination of initial break-up conditions, J. Spacecraft and Rockets 28-

AI26.1 Report Final.doc Section 7. ReferencesAcronyms and Abbreviations
IADC WG3 74/77
4, July-August.
McKnight D. and Edelstein K.S. (1992), Analysis of Shuttle window impact data, in Hypervelocity
impacts in space, ed. McDonnell J.A.M., publ. Univ. of Kent at Canterbury.
Melin R.W. (1990). Hypervelocity impact testing of heat pipe samples. Int. J. Impact Engng 10/1-
4, 389-401.
Meshcheryakov S.A. (2009). Analytical formulas for evaluation of meteoroid distributions in the
near-Earth space. In proc. 5th Europ. Conf. on Space Debris, ESOC, Darmstadt, Germany, 29
March-3 April 2009.
Michel Y. et al. (2005). Damaging and ejection processes during HVI on brittle targets. Proc. 4 th
European Conference on Space Debris, ESA SP-587, 2005.
Michel Y. et al. (2006), Damages and matter ejection during HVI on brittle structures:
implications for space environment, 10th ISME proceedings, Collioure, France.
Michel Y, Chevalier J.M, Durin C, Espinosa C, Malaise F, Barrau J.J. (2006) Hypervelocity impacts
on thin brittle targets: experimental data and SPH simulations. Int. J. of impact Engng 33, 441-
451
Michel Y. et al. (2006), SPH modelling of glasses behaviour under shock loadings : application to
matter ejection on thin targets, J. Phys. IV ..
Moussi A, Drolshagen G, McDonnell J.A.M, Mandeville J.C, Kearsley A. (2005) Results of impact
analysis on HST service mission 3B solar arrays. In Proc. 4th Europ. Conf. on Space debris. ESOC,
Darmstadt, Germany, 18-20 April, 2005.
Moussi A, Drolshagen G, McDonnell J.A.M, Mandeville J.C, Kearsley A.T. and Ludwig H. (2005)
Hypervelocity impacts on HST solar arrays and the debris and meteoroids population. Adv. Space
Res., 35:1243–1253
Myagkov N.N, Valiev H.H, Yanovsky Y.G, Kornev Y.V, Yumashev O.B, Rebrikov V.N. (2009)
Investigation of the nanostructures on solar cells exposed on orbital space station MIR. In Proc.
5th Europ. Conf. on Space Debris. 30 March – 2 April 2009, ESOC, Darmstadt, Germany
Myagkov N.N. (2009). On bunching of orbital debris microparticles in circular and elliptic orbits.
In Proc. 5th Europ. Conf. on Space Debris. 30 March – 2 April 2009, ESOC, Darmstadt, Germany
Nishida M, Kato H, Kuzuya K, Hayashi K and Hasegawa S. (2010) Effects of Different Series
Aluminum Alloys and Their Heat Treatments on Crater Formation and Ejecta Composition. In
Proc. 29th International Congress on High-Speed Imaging and Photonics, B12-1-6.

AI26.1 Report Final.doc Section 7. ReferencesAcronyms and Abbreviations
IADC WG3 75/77
Nysmith C.R. and B.P. Denardo (1969). Experimental investigation of the momentum transfer
associated with impact into thin aluminium targets. NASA TN-D-5492.
O'Donnell R.G. (1991). An investigation of the fragmentation behaviour of impacted ceramics.
Journal of Materials Science Letters 10, pp 685-688.
O'Keefe J.D. and Ahrens T.J. (1987). The size distribution of fragments ejected at a given velocity
from impact craters. Int.J. Impact Engng. 5, pp 493-499.
Oberbeck V.R. and Morrison R.H. (1976). Candidate areas for in situ ancient lunar materials,
Proc.Lunar Sci. Conf. 7th, pp 2983-3005.
Oswald M, Stabroth S, Wiedemann C, Wegener P, Martin C, Klinkrad H. (2005) Upgrade of the
MASTER Model , ESA, Institute of Aerospace systems.
Paul K.G. (1997). Ejecta clouds from hypervelocity collisions as seen by the LDEF interplanetary
dust experiment. Adv. Space Res. 20-8, p.1545.
Piekutowski A.J. (1987). Debris clouds generated by hypervelocity impact of cylindrical
projectiles with thin aluminum plates, Int.J.Impact Engng. 5/1-4, 509-518.
Piekutowski A.J. (1990). A simple dynamic model for the formation of debris clouds. Int.J.Impact
Engng. 10/1-4, 453-471.
Piekutowski A.J. (1993) Characteristics of debris clouds produced by hypervelocity impact of
aluminum spheres with thin aluminum plates. Int.J.Impact Engng 14/1-4, 573-586.
Piekutowski A.J. (2001). Debris clouds produced by the hypervelocity impact of nonspherical
projectiles. Int.J.Impact Engng 26/1-10, 613-624.
Polanskey C.A. and Ahrens T.J. (1990). Impact spallation experiments: fracture patterns and spall
velocities. Icarus 87, pp.140-155.
Putzar R, Schaefer F, Lambert M. (2008). Vulnerability of spacecraft harnesses to hypervelocity
impacts, Int. J. Impact Engng 35-12, 1728-1734.
Rival M, Mandeville J.C. and Durin C. (1996). Impact phenomena on brittle materials : analysis of
1m to 1mm impact features on solar arrays. Adv. Space Res. 20-8, 1451-1456.
Rival M., J.C. Mandeville (1999), Modelling of ejecta produced upon hypervelocity impacts,
Space debris 1, 45-57.

AI26.1 Report Final.doc Section 7. ReferencesAcronyms and Abbreviations
IADC WG3 76/77
Schäfer F. and Schneider E., (1997). Hypervelocity mpacts on Solar Cells, EMI-Report No.HVISC-
001.
Schafer F.K, Ryan S, Lambert M, Putzar R. (2008). Ballistic limit equation for equipment placed
behind satellite structure walls. Int. J. Impact Engng 35-12, 1784-1791.
Schneider E. (1975). Impact ejecta exceeding lunar escape velocity. The Moon 13-1/2/3.
Schneider E. and Stilp A. (1993). Meteoroids/Debris simulation at EMI: Experimental methods
and recent results, Proc. 1st European Conference on Space Debris, ESA SD-01, pp.401-404.
Schneider E., (1997), Private communication.
Schonberg W. (1989), Characterizing the damage potential of ricochet debris due to an oblique
HVI, AIAA 89-1410 CP, pp 2180.
Schonberg W.P., Taylor R.A. (1990). Exterior spacecraft subsystem protective shielding analysis
and design. J. Spacecraft and Rockets, 29, 267-274
Schonberg W.P. (2001). Characterizing Secondary Debris Impact Ejecta, Int. J. of Impact Engng.,
26, 713-724
Seebaugh W.R. (1977). A dynamic crater ejecta model. Impact and Explosion Cratering,
Pergamon Press (Roddy, Pepin and Merrill editors), pp 1043-1056.
Semkin N.D, Voronov K.E, Piyakov A.V, Novikov L.S. (2009). Ion’s formation and photo issue at
interaction of high-speed dust particles with optical glass. In Proc. 5th Europ. Conf. on Space
Debris, 30 March – 2 April 2009, ESOC, Darmstadt, Germany.
Shephard G.L.Y. and Scheer, S.A. (1993). Secondary debris impact damage and environment
study, International Journal of Impact Engineering, Vol.14, pp.671-682.
Shutov V.I. and Zheltov S.Y. (2010). Investigation of astrosols in near earth space. ISTC project
3412 Final report, GosNIIAS, Moscow.
Siguier J.M. and J.C. Mandeville (2007). Test procedures to evaluate spacecraft materials ejecta
upon hypervelocity impact, Proc. ImechEvol 221 Part G: J. Aerospace Engineering.
Stilp A.J, Hohler V, Schneider E, Weber K. (1990). Debris cloud expansion studies. Int. J. Impact
Engng 10/1-4, 543-553.
Stilp A.J, Weber K. (1997). Debris clouds behind double-layer targets. Int. J. Impact Engng 20/6-
10, 765-778.

AI26.1 Report Final.doc Section 7. ReferencesAcronyms and Abbreviations
IADC WG3 77/77
Stöffler D., Gault D.E., Wedekind J. and Polkowski G. (1975). Experimental hypervelocity impacts
into quartz sand : distribution and shock metamorphism of ejecta. Journal of Geophysical
Research, 80-29.
Stump W.R., Christiansen E.L. (1986). Secondary impact hazard assessment. Report No. 86-128,
Eagle Engineering Inc., Houston, Texas.
Su S.Y. (1990). The velocity distribution of collisional fragments and its effect on future space
debris environment. Adv. Space Res.10-3/4, pp (3) 389-392.
Sugahara K, Aso K, Akahoshi Y, Koura T, and Narumi T. (2009) Intact Measurement of Fragments
in Ejecta due to Hypervelocity Impact, In Proc. 60th International Astronautical Congress, IAC-09-
A6.3.06, October 2009.
Svedhem H. and Pedersen A. (1992). Behaviour of ejecta particles and generated plasma at
hypervelocity impacts. Hypervelocity impacts in space, ed. McDonnell J.A.M., Univ. of Kent at
Canterbury.
Tanaka K. et al. (2008) Hypervelocity crater formation in aluminum alloys at low temperatures.
Int. J. Impact Engng. 35, 1821–1826
Takano T, Murotani Y, Toda Y. et al., (2000). Microwave generation due to hypervelocity impact.
In Proc. 51st IAF Congress, IAA-00-IAA.6.5.07, Brazil.
Takano T, Murotani Y, Maki K. et al. (2002). Microwave emission due to hypervelocity impacts
and its correlation with mechanical destruction. J.Appl.Phys. 92-9,5550-5554.
Takano T, Maki K, Soma E, Ohnishi H, Ishii K, Chiba S, Fujiwara A, and Yamori A. (2005). Material
Dependence Of Microwave Emission Due To A Hypervelocity Impact. In Proc. 4th Europ. Conf. on
Space Debris, Darmstadt, Germany, 18-20 April 2005.
Wilbeck J.S. and R.P. Young (1992). Experience with techniques for characterizing debris
generated during hypervelocity impact testing. AIAA 92-1586.
Woodward R.L. et al (1994). A study of fragmentation in the ballistic impact of ceramics. Int. J.
Impact Engng., Vol.15-5, pp 605-618.
Xu Y-L, Christiansen E, Hyde J, Matney M, and Prior T (2011). Simulation of Micron-Sized Debris
Populations in Low Earth Orbit. NASA Orbital Debris Quarterly Newsletterl 15-2, April 2011.


![Atmospheric Effects On Ejecta Emplacementejection velocity), ejecta size, and atmospheric pressure (i.e., density). Schultz and Gault [1979] compared this critical ejecta size for](https://img.pdfslide.us/doc/110x75/6064ee3cd22347643a4f2160/atmospheric-effects-on-ejecta-ejection-velocity-ejecta-size-and-atmospheric-pressure.jpg)