Embed Size (px)
Citation preview
Technical Report Documentation Page 1. Report No.
TX-04/7-4954-1
2. Government Accession No.
3. Recipient’s Catalog No.
5. Report Date
September 2001 Resubmitted: January 2003
4. Title and Subtitle
CHARACTERIZATION OF CRUSHED CONCRETE MATERIALS FOR PAVING AND NON-PAVING APPLICATIONS
6. Performing Organization Code
7. Author(s)
Seungwook Lim, Dirk Kestner, Dan G. Zollinger, and David W. Fowler
8. Performing Organization Report No.
Report 7-4954-1 10. Work Unit No. (TRAIS)
9. Performing Organization Name and Address
Texas Transportation Institute Center for Transportation Research The Texas A&M University System The University of Texas at Austin College Station, Texas 77843-3135 Austin, Texas 78712
11. Contract or Grant No.
Project No. 7-4954 13. Type of Report and Period Covered
Research: September 1999 – August 2001
12. Sponsoring Agency Name and Address
Texas Department of Transportation Research and Technology Implementation Office P. O. Box 5080 Austin Texas 78763-5080
14. Sponsoring Agency Code
15. Supplementary Notes
Research performed in cooperation with the Texas Department of Transportation. Research Project Title: Use of Recycled Portland Cement Concrete Fines in TxDOT Applications 16. Abstract
This project focused on the evaluation of the feasibility of using crushed portland cement concrete
(CPCC) materials in TxDOT applications. Special interest was given to the use of CPCC fines passing the No.4 sieve. The research approach for exploring potential applications was divided into two ways as follows:
� paving applications: flexible base, cement treated base, and HMA bond breaker; and � non-paving applications: portland cement concrete, flowable fill, backfill, and embankment. Much of the research effort was devoted to a laboratory test program for material characterization.
The test program identified aggregate properties, mix design properties, basic mechanistic properties, workability, and moisture susceptibility of the applied mixtures containing crushed concrete materials. Although the use of crushed concrete materials generally resulted in increased water demand and decreased workability, test results indicated that crushed concrete materials are highly feasible to use in the selected applications. However, CPCC fines were determined not to be suitable for the reproduction of portland cement concrete because the loss of workability was so severe in this application. Based on the results of the test program, recommendations and revised specifications, which allow for the use of CPCC fines, are provided for the selected applications: flexible base, cement treated base, HMA bond breaker, flowable fill, backfill, and roadway embankment.
17. Key Words
Recycling, Crushed Portland Cement Concrete, CPCC Fines, Material Characterization, Mix Design, Mechanistic Property, Workability, Moisture Susceptibility
18. Distribution Statement
No restrictions. This document is available to the public through NTIS: National Technical Information Service 5285 Port Royal Road Springfield, Virginia 22161
19. Security Classif.(of this report)
Unclassified
20. Security Classif.(of this page)
Unclassified
21. No. of Pages
178
22. Price
Form DOT F 1700.7 (8-72) Reproduction of completed page authorized


CHARACTERIZATION OF CRUSHED CONCRETE MATERIALS
FOR PAVING AND NON-PAVING APPLICATIONS
by
Seungwook Lim Research Assistant
Texas Transportation Institute
Dirk Kestner Research Assistant
Center for Transportation Research The University of Texas at Austin
Dan G. Zollinger Associate Research Engineer Texas Transportation Institute
and
David W. Fowler
Professor of Civil Engineering Center for Transportation Research The University of Texas at Austin
Report 7-4954-1 Project Number 7-4954
Research Project Title: Use of Recycled Portland Cement Concrete Fines in TxDOT Applications
Sponsored by the Texas Department of Transportation
September 2001 Resubmitted: January 2003
TEXAS TRANSPORTATION INSTITUTE Texas A&M University System
College Station, Texas 77843-3135

v
DISCLAIMER
The contents of this report reflect the views of the authors, who are responsible for the
facts and the accuracy of the data presented herein. The contents do not necessarily reflect the
official view of policies of the Texas Department of Transportation. This report does not
constitute a standard, specification, or regulation. Engineering recommendations presented
herein are not intended for construction, bidding, or permit purposes. The engineer in charge of
the project is Dan G. Zollinger, P.E. #67129.

vi
ACKNOWLEDGMENTS
Dr. Moon Won was the project director for this project. His support, encouragement, and
patience are greatly appreciated. Appreciation is extended to the Texas Department of
Transportation for the financial support provided through the Research Management Committee
for Pavements and Design.
vii
TABLE OF CONTENTS
Page
LIST OF FIGURES.......................................................................................................................xii
LIST OF TABLES ........................................................................................................................ xv
CHAPTER 1. INTRODUCTION ................................................................................................... 1
RESEARCH BACKGROUND....................................................................................................... 1
RESEARCH OBJECTIVES. .......................................................................................................... 1
SCOPE OF RESEARCH PROGRAM............................................................................................ 2
CHAPTER 2. PRELIMINARY STUDIES..................................................................................... 5
PAST STUDIES ON THE USE OF CPCC FINES. ....................................................................... 5
Paving Applications. ................................................................................................................. 5
Non-paving Applications. ......................................................................................................... 7
TxDOT Experience. .................................................................................................................. 8
POTENTIAL TxDOT APPLICATIONS........................................................................................ 9
Paving Applications. ................................................................................................................. 9
Flexible Base ....................................................................................................................... 9
Cement Treated Base. ....................................................................................................... 10
Hot Mix Asphalt Bond Breaker. ........................................................................................ 11
Non-paving Applications. ....................................................................................................... 11
Portland Cement Concrete................................................................................................ 12
Flowable Fill. .................................................................................................................... 12
Backfill .............................................................................................................................. 13
Embankment ...................................................................................................................... 13
PRODUCERS OF CRUSHED CONCRETE ............................................................................... 13
Williams Brothers ................................................................................................................... 14
Southern Crushed Concrete..................................................................................................... 14
viii
Big City Crushed Concrete ..................................................................................................... 15
Frontera Materials ................................................................................................................... 16
Linn Materials ......................................................................................................................... 16
Ballanger Construction............................................................................................................ 16
CHAPTER 3. AGGREGATE PROPERTIES............................................................................... 17
MATERIAL COLLECTION ........................................................................................................ 17
Williams Brothers ................................................................................................................... 17
Southern Crushed Concrete..................................................................................................... 18
Big City Crushed Concrete ..................................................................................................... 19
Frontera Materials ................................................................................................................... 19
Sample Labeling...................................................................................................................... 19
TEST PROCEDURES FOR AGGREGATE CHARACTERIZATION....................................... 20
Wet and Dry Sieve Analysis ................................................................................................... 20
Specific Gravity and Absorption............................................................................................. 21
Dry Rodded Unit Weight and Voids ....................................................................................... 21
Methylene Blue Test ............................................................................................................... 21
Plasticity Index........................................................................................................................ 23
pH Measurements.................................................................................................................... 23
Chemical Analysis................................................................................................................... 24
TEST RESULTS AND DISCUSSION......................................................................................... 24
Wet and Dry Sieve Analysis ................................................................................................... 24
Specific Gravity and Absorption............................................................................................. 29
Dry Rodded Unit Weight and Voids ....................................................................................... 29
Methylene Blue Test ............................................................................................................... 29
Plasticity Index........................................................................................................................ 31
pH Measurements.................................................................................................................... 31
Chemical Analysis................................................................................................................... 32
SUMMARY .................................................................................................................................. 35

ix
CHAPTER 4. PAVING APPLICATIONS ................................................................................... 37
FLEXIBLE BASE......................................................................................................................... 37
Test Program ........................................................................................................................... 37
Test Variable ........................................................................................................................... 38
Materials.................................................................................................................................. 39
Aggregate Proportioning ......................................................................................................... 39
Moisture Content..................................................................................................................... 40
Texas Triaxial Test.................................................................................................................. 41
Test Results and Discussion .............................................................................................. 42
Tube Suction Test.................................................................................................................... 46
Test Results and Discussion .............................................................................................. 48
Summary ................................................................................................................................. 50
CEMENT TREATED BASE........................................................................................................ 51
Test Program ........................................................................................................................... 51
Test Variables.......................................................................................................................... 52
Materials.................................................................................................................................. 54
Aggregate Proportioning ......................................................................................................... 55
Moisture Content..................................................................................................................... 57
Uniaxial Compression............................................................................................................. 59
Compressive Strength........................................................................................................ 60
Modulus of Elasticity......................................................................................................... 63
Free Shrinkage......................................................................................................................... 71
Test Results and Discussion .............................................................................................. 72
Stress Relaxation Test ............................................................................................................. 77
Sample Preparation and Test ............................................................................................ 77
Test Results and Discussion .............................................................................................. 80
Restrained Shrinkage Ring Test .............................................................................................. 82
Sample Preparation and Test ............................................................................................ 83
Test Results and Discussion .............................................................................................. 85
x
Tube Suction Test.................................................................................................................... 89
Test Results and Discussion .............................................................................................. 89
Summary ................................................................................................................................. 90
HOT MIX ASPHALT BOND BREAKER................................................................................... 92
Mix Design.............................................................................................................................. 93
Aggregate Blending........................................................................................................... 93
Mix Design Results............................................................................................................ 94
Moisture Sensitivity ................................................................................................................ 94
Test Results and Discussion .............................................................................................. 96
Summary ................................................................................................................................. 99
CHAPTER 5. NON-PAVING APPLICATIONS ....................................................................... 101
FLOWABLE FILL...................................................................................................................... 101
Materials................................................................................................................................ 101
Mixture Proportioning........................................................................................................... 103
Sample Preparation ............................................................................................................... 104
Flow....................................................................................................................................... 105
Unit Weight, Air Content, and Bleeding............................................................................... 105
Setting Time .......................................................................................................................... 108
Splitting Tensile Strength...................................................................................................... 108
Compressive Strength ........................................................................................................... 113
Load-Deflection Response .................................................................................................... 116
Summary ............................................................................................................................... 119
PORTLAND CEMENT CONCRETE........................................................................................ 120
Materials................................................................................................................................ 120
Mixture Proportioning........................................................................................................... 121
Sample Preparation ............................................................................................................... 122
Slump, Unit Weight, and Air Content................................................................................... 123
Compressive Strength ........................................................................................................... 124
xi
Flexural Strength ................................................................................................................... 124
Summary ............................................................................................................................... 126
GEOTECHNICAL APPLICATIONS ........................................................................................ 126
Backfill .................................................................................................................................. 127
Embankment.......................................................................................................................... 127
CHAPTER 6. SUMMARY AND CONCLUSIONS .................................................................. 129
PAVING APPLICATIONS. ....................................................................................................... 130
NON-PAVING APPLICATIONS. ............................................................................................. 132
FUTURE CONSIDERATIONS.................................................................................................. 134
REFERENCES............................................................................................................................ 135
APPENDIX A. REVISED SPECIFICATIONS: PAVING APPLICATIONS.......................... 139
A.1 Item 247 Flexible Base.................................................................................................. 141
A.2 Item 276 Portland Cement Treated Base (Plant Mixed) ............................................... 143
A.3 Special Specification: Hot Mix Asphalt Bond Breaker................................................. 144
APPENDIX B. REVISED SPECIFICATIONS: NON-PAVING APPLICATIONS ............... 147
B.1 Special Specification Item 4438 Flowable Backfill ...................................................... 149
B.2 Item 400 Backfill ........................................................................................................... 153
B.3 Item 132 Embankment................................................................................................... 156
APPENDIX C. GRADING DATA FOR CPCC FINES............................................................ 157
xii
LIST OF FIGURES
Figure Page
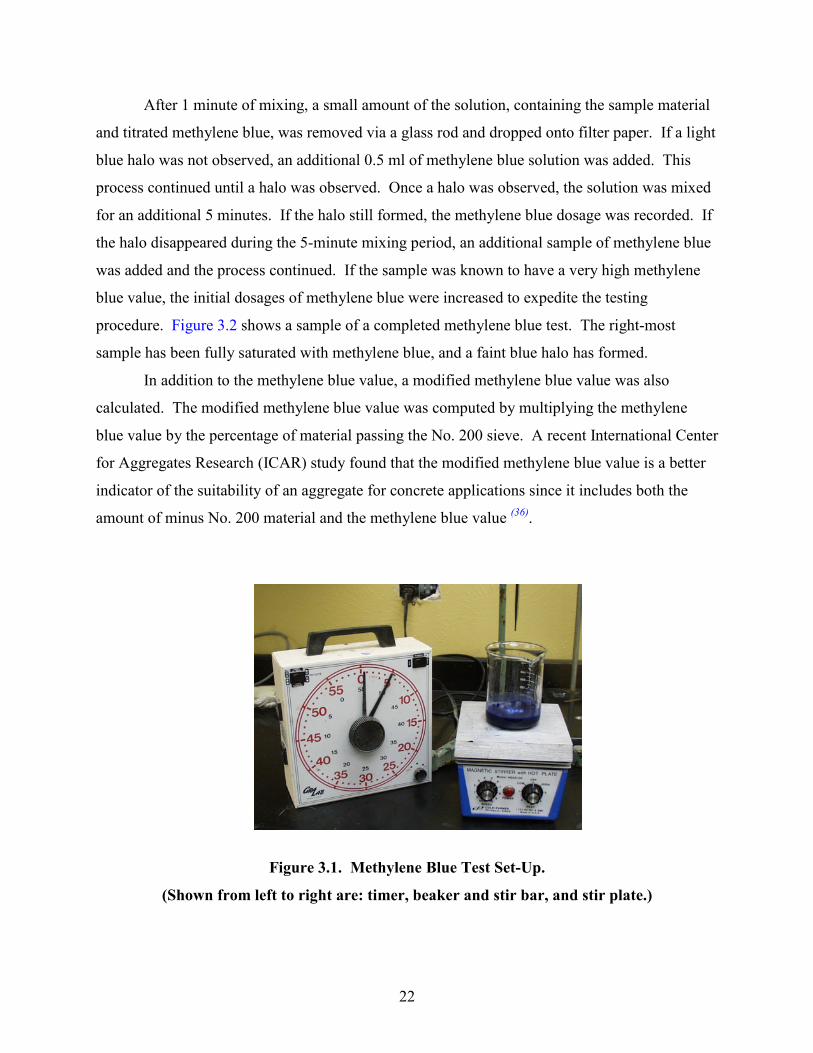
3.1 Methylene Blue Test Set-Up.......................................................................................... 22
3.2 Filter Paper Used in Methylene Blue Test ..................................................................... 23
3.3 Grading of Williams Brothers CPCC Fines: Samples WB-A-1 to WB-A-8 ................. 25
3.4 Grading of Williams Brothers CPCC Fines: Samples WB-B to WB-H ........................ 25
3.5 Grading of Williams Brothers Manufactured Sand: Samples MS-A to MS-D.............. 26
3.6 Grading of Southern Crushed CPCC Fines: Samples SC-A to SC-D............................ 26
3.7 Grading of Big City CPCC Fines: Samples BC-A to BC-D.......................................... 27
3.8 Grading of Frontera Materials CPCC Fines: Samples FM-A to FM-D ......................... 27
4.1 Aggregate Gradation for Flexible Base Test Mixes....................................................... 40
4.2 Stress-Strain Relations of Flexible Base Test Mixtures................................................. 43
4.3 Mohr-Coulomb Failure Envelope for Flexible Base Test Mixtures .............................. 44
4.4 Test Set-Up for Tube Suction Test................................................................................. 47
4.5 Results of Tube Suction Tests on Flexible Base Test Mixtures..................................... 49
4.6 Aggregate Gradation Curves for CTB Test Mixes......................................................... 56
4.7 Configuration for Uniaxial Compression Tests ............................................................. 59
4.8 Effect of Test Variables on the Compressive Strength of CTB Test Mixtures.............. 62
4.9 Prediction of Compressive Strength Developments in CTB Mixtures .......................... 64
4.10 Typical Compressive Stress-Strain Relations in CTB Mixtures.................................... 65
4.11 Development of Modulus of Elasticity in CTB Mixtures .............................................. 67
4.12 Relationship between Compressive Strength and Modulus
of Elasticity in CTB Mixtures ........................................................................................ 69
4.13 Comparisons of Measured and Estimated Modulus of Elasticity
for CTB Test Mixtures ................................................................................................... 70
4.14 Compaction Mold for Shrinkage Beam Samples........................................................... 71
4.15 Set-Up for Drying Shrinkage Measurement................................................................... 72
4.16 Results of Drying Shrinkage Measurements in CTB Mixtures ..................................... 73
xiii
Figure Page
4.17 Effects of Test Variables on Drying Shrinkage of
Crushed Concrete CTB Mixtures................................................................................... 75
4.18 Effects of Test Variables on Drying Shrinkage of
Crushed Limestone CTB Mixtures ................................................................................ 76
4.19 Compaction Mold for Relaxation Test Specimen.......................................................... 78
4.20 Relaxation Test Specimen in Ready............................................................................... 79
4.21 Tensile Relaxation Test System ..................................................................................... 80
4.22 Results of Tensile Relaxation Tests for CTB Mixtures ................................................. 81
4.23 Configuration for the Restrained Shrinkage Ring Test .................................................. 84
4.24 Measured Deformations for the Restrained Shrinkage Ring Tests ................................ 85
4.25 Development of Restrained Shrinkage Strains in the Shrinkage Ring Tests ................. 87
4.26 Comparisons of Stress and Strength Developments in Shrinkage Ring Specimens ...... 88
4.27 Results of Tube Suction Tests on CTB Test Mixtures................................................... 90
4.28 Gradation Curves for HMA Bond Breaker Design Mixtures ........................................ 95
4.29 Indirect Tensile Tests and Moisture Sensitivity of Bond Breaker Test Mixtures.......... 99
5.1 Grading Graph of Concrete Sand Used in Flowable Fill Mixtures.............................. 102
5.2 Cylinders Used for Flowable Fill Test Specimens....................................................... 104
5.3 Collapsed Flow Specimen and Method Used to Measure Flow .................................. 106
5.4 Setting Time Graph for Air Entrained Flowable Fill Mixtures.................................... 109
5.5 Setting Time Graph for Fly Ash Flowable Fill Mixtures............................................. 109
5.6 Setting Time Graph for Fly Ash Flowable Fill Mixtures Containing
Varying Cement Contents ............................................................................................ 110
5.7 Flowable Fill Specimen Failed in Splitting Tension.................................................... 110
5.8 Splitting Tensile Strength of Air Entrained Flowable Fill Mixtures
at 7, 28, and 91 Days .................................................................................................... 111
5.9 Splitting Tensile Strength of Fly Ash Flowable Fill Mixtures
at 7, 28, and 91 Days .................................................................................................... 112
5.10 Splitting Tensile Strength of Fly Ash Flowable Fill Mixtures Containing
Varying Cement Contents at 7, 28, and 91 Days ......................................................... 112

xiv
Figure Page
5.11 Compressive Strength Tests on Flowable Fill Mixtures .............................................. 113
5.12 Flowable Fill Specimen Failed in Compression .......................................................... 114
5.13 Compressive Strength of Air Entrained Flowable Fill Mixtures
at 7, 28, and 91 Days .................................................................................................... 115
5.14 Compressive Strength of Fly Ash Flowable Fill Mixtures
at 7, 28, and 91 Days .................................................................................................... 115
5.15 Compressive Strength of Fly Ash Flowable Fill Mixtures Containing
Varying Cement Contents at 7, 28, and 91 Days ......................................................... 116
5.16 Load-Deflection Response of Air Entrained Mixtures at 28 Days .............................. 117
5.17 Load-Deflection Response of Fly Ash Mixtures at 28 Days ....................................... 118
5.18 Load-Deflection Response of Fly Ash Mixtures Containing
Varying Cement Contents at 28 Days .......................................................................... 118
5.19 Grading Graph for Concrete Sand Used in Concrete Mixtures ................................... 121
5.20 Compressive Strengths of Concrete Mixtures at 7 and 28 Days.................................. 125
5.21 Flexural Strengths of Concrete Mixtures at 7 Days ..................................................... 125
xv
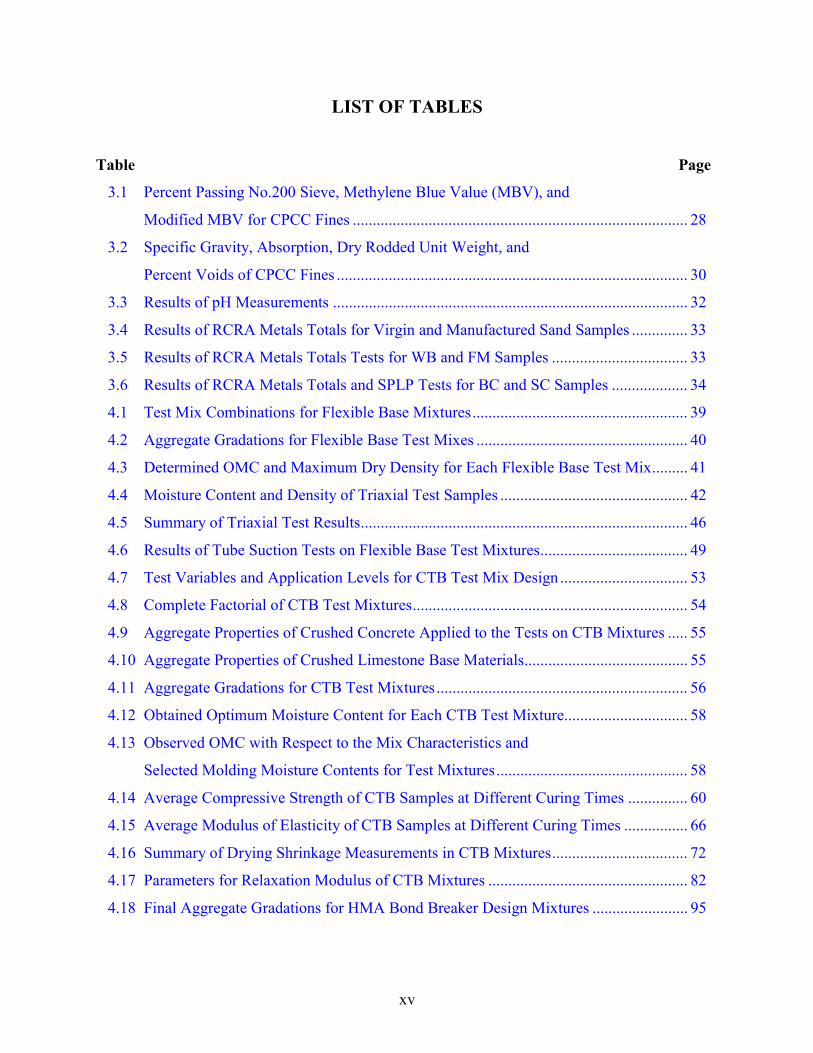
LIST OF TABLES
Table Page
3.1 Percent Passing No.200 Sieve, Methylene Blue Value (MBV), and
Modified MBV for CPCC Fines .................................................................................... 28
3.2 Specific Gravity, Absorption, Dry Rodded Unit Weight, and
Percent Voids of CPCC Fines ........................................................................................ 30
3.3 Results of pH Measurements ......................................................................................... 32
3.4 Results of RCRA Metals Totals for Virgin and Manufactured Sand Samples .............. 33
3.5 Results of RCRA Metals Totals Tests for WB and FM Samples .................................. 33
3.6 Results of RCRA Metals Totals and SPLP Tests for BC and SC Samples ................... 34
4.1 Test Mix Combinations for Flexible Base Mixtures...................................................... 39
4.2 Aggregate Gradations for Flexible Base Test Mixes ..................................................... 40
4.3 Determined OMC and Maximum Dry Density for Each Flexible Base Test Mix......... 41
4.4 Moisture Content and Density of Triaxial Test Samples ............................................... 42
4.5 Summary of Triaxial Test Results.................................................................................. 46
4.6 Results of Tube Suction Tests on Flexible Base Test Mixtures..................................... 49
4.7 Test Variables and Application Levels for CTB Test Mix Design ................................ 53
4.8 Complete Factorial of CTB Test Mixtures..................................................................... 54
4.9 Aggregate Properties of Crushed Concrete Applied to the Tests on CTB Mixtures ..... 55
4.10 Aggregate Properties of Crushed Limestone Base Materials......................................... 55
4.11 Aggregate Gradations for CTB Test Mixtures............................................................... 56
4.12 Obtained Optimum Moisture Content for Each CTB Test Mixture............................... 58
4.13 Observed OMC with Respect to the Mix Characteristics and
Selected Molding Moisture Contents for Test Mixtures................................................ 58
4.14 Average Compressive Strength of CTB Samples at Different Curing Times ............... 60
4.15 Average Modulus of Elasticity of CTB Samples at Different Curing Times ................ 66
4.16 Summary of Drying Shrinkage Measurements in CTB Mixtures.................................. 72
4.17 Parameters for Relaxation Modulus of CTB Mixtures .................................................. 82
4.18 Final Aggregate Gradations for HMA Bond Breaker Design Mixtures ........................ 95

xvi
Table Page
4.19 Results of Mix Design for Bond Breaker Applications ................................................. 96
4.20 Tensile Strength Test Results for HMA Bond Breaker Mixtures .................................. 98
4.21 Tensile Strength Test Results for 1 Percent Lime Added
HMA Bond Breaker Mixtures........................................................................................ 98
5.1 Chemical Composition of Class F Fly Ash.................................................................. 102
5.2 Mixture Proportions for Flowable Fill Mixtures.......................................................... 103
5.3 Water Demand vs. Flow for Flowable Fill Mixtures ................................................... 106
5.4 Unit Weight, Percent Air, Air Entraining Agent Dosage, and
Bleed Percentage for Flowable Fill Mixtures .............................................................. 107
5.5 Grading of Coarse Aggregate Used in Concrete Mixtures .......................................... 121
5.6 Mixture Proportions for Concrete Mixtures................................................................. 122
5.7 Fresh Properties of Trial Concrete Mixtures................................................................ 124
C.1 Sieve Results for Samples WB-A.1 to WB-A.8........................................................... 159
C.2 Sieve Results for Samples WB-B to WB-H ................................................................. 160
C.3 Sieve Results for Samples WB-MS-A.1 to SC-A.3 ..................................................... 161
C.4 Sieve Results for Samples BC-A to FM-D................................................................... 162
1
CHAPTER 1. INTRODUCTION
RESEARCH BACKGROUND
The production of crushed portland cement concrete (CPCC) continues to grow year by
year. Currently, in excess of 100 million tons of crushed concrete are generated annually in the
United States. In conjunction with the straight increase of this waste product, recycling of CPCC
has been also addressed as an attractive alternative to disposal. Consequently, many agencies
responsible for roadway construction all over the world have investigated the reuse of crushed
concrete materials. Although crushed concrete contains particles of all size, from inches to
microns, most previous studies focused on the use of coarse aggregates (over No. 4 sieve size) of
CPCC for making new concrete. These studies found that, in general, the use of CPCC fines
(minus No. 4 sieve size) is unacceptable for structural concrete. Since CPCC fines tend to be
more angular and absorptive in nature, greater difficulty has been experienced in processing and
using them in concrete mixtures than natural sand. Many Texas Department of Transportation
(TxDOT) districts also have successfully used the coarse particles of CPCC as coarse aggregate
in concrete for various purposes. However, this has resulted in growing stockpiles of CPCC
fines. It is imperative that effective and full use of CPCC be found other than structural
concrete. Many TxDOT districts presently use all size particles of CPCC as a base layer material
with cement treatment. Greater opportunities can be found for the use of CPCC fines when
proper selection, processing, and testing demonstrate conformance to specific requirements.
RESEARCH OBJECTIVES
The main objective of this research is to find ways to effectively use CPCC fines within
TxDOT applications. In order to accomplish this, the project has the following sub-objectives:
1. Survey available information to determine the state-of-the-art for the use of CPCC
fines.
2
2. Characterize aggregate properties of CPCC fines produced throughout the state of
Texas.
3. Identify areas of possible TxDOT applications of CPCC fines through the gathered
information and a review of current TxDOT specifications.
4. Evaluate the properties of applied mixtures associated with the selected areas of
TxDOT application.
5. Provide guidelines and specifications regarding the use of CPCC fines in the selected
applications.
SCOPE OF RESEARCH PROGRAM
This research program was a joint project by two institutions: the Texas Transportation
Institute (TTI) at Texas A&M University and the Center for Transportation Research (CTR) at
The University of Texas at Austin. Under the framework of the joint project, the research efforts
for finding good use of CPCC fines were divided into two different directions. As for the
TxDOT applications, one is paving area, and the other is non-paving area. TTI and CTR
addressed the paving and non-paving applications, respectively.
Given research objectives, the research team devoted a large part of their research efforts
to laboratory work. The laboratory test program consisted of two main stages. The first
characterized aggregate properties of CPCC fines. Five samples of CPCC fines were collected
from four producers located in three areas of the state; they were then characterized by a set of
standard aggregate tests. The second stage consisted of investigating selected TxDOT
applications through the material characterization of applied mixtures. Applications investigated
included:
� paving applications: flexible base, cement treated base, and hot mix asphalt bond
breaker; and
� non-paving applications: portland cement concrete, flowable fill (controlled low
strength material), backfill, and embankment.

3
Test programs for paving applications focused on the conformance of applied mixtures to
the current specifications required for conventional materials. For non-paving applications, the
investigation of flowable fill and portland cement concrete involved designing and casting
product specimens. The investigation of backfill and embankment entailed investigating the
material properties of the CPCC fines and comparing them to the present specified requirements
for materials used in these applications. This investigation was accomplished through a thorough
review of existing TxDOT specifications and discussions with TxDOT personnel.

5
CHAPTER 2. PRELIMINARY STUDIES
The research team conducted a wide survey to obtain the basis for the effective use of
recycled CPCC fines. Relevant information has been gathered from published literature as well
as practical experience. As a result of the review, several items were selected that have a good
potential for TxDOT applications. This chapter also includes a brief introduction on the
production of crushed concrete within the state of Texas.
PAST STUDIES ON THE USE OF CPCC FINES
This section contains the summary of gathered information. Consistent with the
designated research scope, the result of the literature review is summarized in two ways: paving
and non-paving applications. A field experience of TxDOT for the use of CPCC fines to
concrete is introduced at the end of this section.
Paving Applications
Although most studies focused on the recycling of coarse particles to new structural
concrete, one study performed in Indiana pointed out that great potential exists for fine
aggregates from crushed concrete to be used in road construction, besides structural concrete (1).
These include shoulder pavement, fill soil stabilizer, pavement base, and subbase materials. In
fact, the use of recycled fine aggregates in road base construction was suggested earlier (2). A
recent study in Kansas also demonstrated the high feasibility of using graded, recycled
aggregates including fines in cement treated base (CTB) applications (3). Field experience
indicated that cracking in CTB has not been excessive compared to conventional materials.
Researchers also found that recycled concrete materials make CTB mixtures reach initial setting
quicker with slightly higher (about 2 percent) density than conventional aggregates.
Crusher fines below 2 mm (No. 10 sieve) was found to modify and somewhat improve
the structure of soil materials when they are blended into a plastic wet clay (4). Such
improvement is attributed to calcium hydroxide from recycled concrete fines reacting with clay
minerals to form clods. It was also found that hardening due to such an effect alone can result in
6
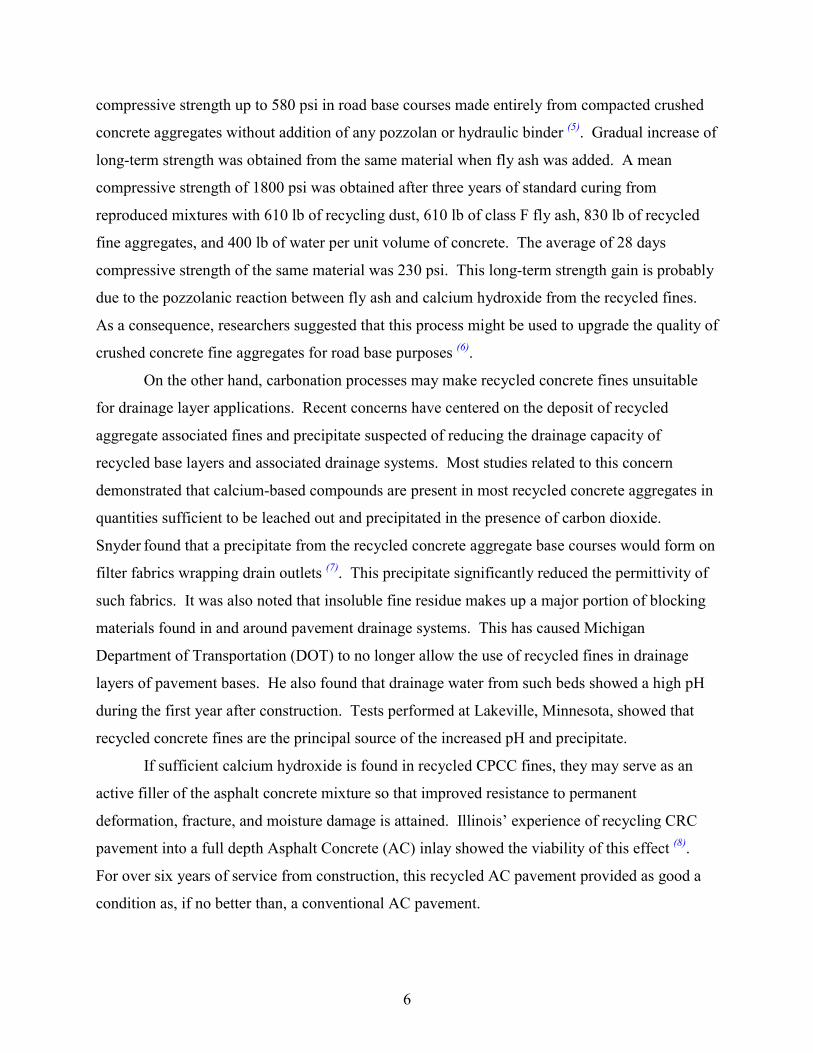
compressive strength up to 580 psi in road base courses made entirely from compacted crushed
concrete aggregates without addition of any pozzolan or hydraulic binder (5). Gradual increase of
long-term strength was obtained from the same material when fly ash was added. A mean
compressive strength of 1800 psi was obtained after three years of standard curing from
reproduced mixtures with 610 lb of recycling dust, 610 lb of class F fly ash, 830 lb of recycled
fine aggregates, and 400 lb of water per unit volume of concrete. The average of 28 days
compressive strength of the same material was 230 psi. This long-term strength gain is probably
due to the pozzolanic reaction between fly ash and calcium hydroxide from the recycled fines.
As a consequence, researchers suggested that this process might be used to upgrade the quality of
crushed concrete fine aggregates for road base purposes (6).
On the other hand, carbonation processes may make recycled concrete fines unsuitable
for drainage layer applications. Recent concerns have centered on the deposit of recycled
aggregate associated fines and precipitate suspected of reducing the drainage capacity of
recycled base layers and associated drainage systems. Most studies related to this concern
demonstrated that calcium-based compounds are present in most recycled concrete aggregates in
quantities sufficient to be leached out and precipitated in the presence of carbon dioxide.
Snyder found that a precipitate from the recycled concrete aggregate base courses would form on
filter fabrics wrapping drain outlets (7). This precipitate significantly reduced the permittivity of
such fabrics. It was also noted that insoluble fine residue makes up a major portion of blocking
materials found in and around pavement drainage systems. This has caused Michigan
Department of Transportation (DOT) to no longer allow the use of recycled fines in drainage
layers of pavement bases. He also found that drainage water from such beds showed a high pH
during the first year after construction. Tests performed at Lakeville, Minnesota, showed that
recycled concrete fines are the principal source of the increased pH and precipitate.
If sufficient calcium hydroxide is found in recycled CPCC fines, they may serve as an
active filler of the asphalt concrete mixture so that improved resistance to permanent
deformation, fracture, and moisture damage is attained. Illinois’ experience of recycling CRC
pavement into a full depth Asphalt Concrete (AC) inlay showed the viability of this effect (8).
For over six years of service from construction, this recycled AC pavement provided as good a
condition as, if no better than, a conventional AC pavement.
7
Non-paving Applications
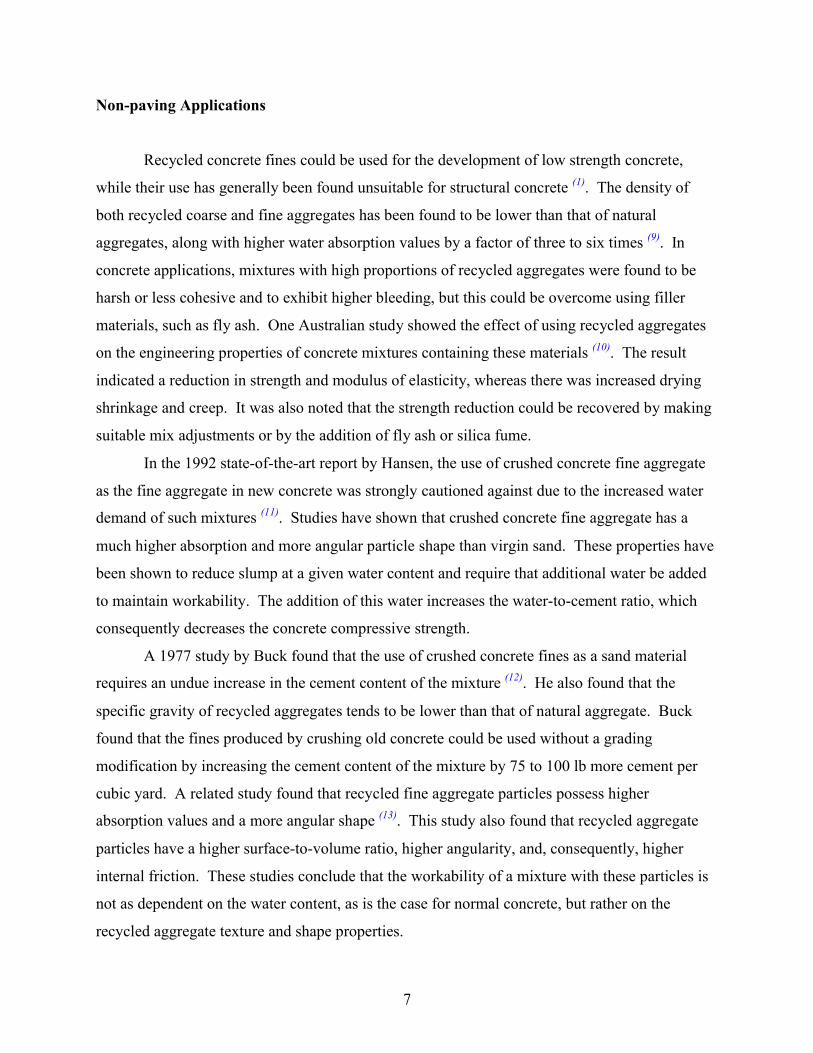
Recycled concrete fines could be used for the development of low strength concrete,
while their use has generally been found unsuitable for structural concrete (1). The density of
both recycled coarse and fine aggregates has been found to be lower than that of natural
aggregates, along with higher water absorption values by a factor of three to six times (9). In
concrete applications, mixtures with high proportions of recycled aggregates were found to be
harsh or less cohesive and to exhibit higher bleeding, but this could be overcome using filler
materials, such as fly ash. One Australian study showed the effect of using recycled aggregates
on the engineering properties of concrete mixtures containing these materials (10). The result
indicated a reduction in strength and modulus of elasticity, whereas there was increased drying
shrinkage and creep. It was also noted that the strength reduction could be recovered by making
suitable mix adjustments or by the addition of fly ash or silica fume.
In the 1992 state-of-the-art report by Hansen, the use of crushed concrete fine aggregate
as the fine aggregate in new concrete was strongly cautioned against due to the increased water
demand of such mixtures (11). Studies have shown that crushed concrete fine aggregate has a
much higher absorption and more angular particle shape than virgin sand. These properties have
been shown to reduce slump at a given water content and require that additional water be added
to maintain workability. The addition of this water increases the water-to-cement ratio, which
consequently decreases the concrete compressive strength.
A 1977 study by Buck found that the use of crushed concrete fines as a sand material
requires an undue increase in the cement content of the mixture (12). He also found that the
specific gravity of recycled aggregates tends to be lower than that of natural aggregate. Buck
found that the fines produced by crushing old concrete could be used without a grading
modification by increasing the cement content of the mixture by 75 to 100 lb more cement per
cubic yard. A related study found that recycled fine aggregate particles possess higher
absorption values and a more angular shape (13). This study also found that recycled aggregate
particles have a higher surface-to-volume ratio, higher angularity, and, consequently, higher
internal friction. These studies conclude that the workability of a mixture with these particles is
not as dependent on the water content, as is the case for normal concrete, but rather on the
recycled aggregate texture and shape properties.

8
Another study found that mixtures using recycled CPCC fine aggregates had a sharp
increase in water demand compared to similar mixtures that did not include CPCC fine
aggregates (14). This increase in water demand was found to be particularly prevalent when
CPCC fines passing the No. 100 sieve were included. It was also found that the minus No. 100
portion of the fine aggregate consisted principally of hydrated cement particles. For this reason,
researchers concluded that concrete mixtures utilizing recycled fine aggregates should replace
the minus No. 100 portion with a corresponding fraction of natural sand.
These studies found that the use of recycled CPCC fines (minus No. 4 sieve materials) in
concrete is not practical due to their high absorption and extreme variability compared to natural
sand. However, opportunities exist for the use of CPCC fines in applications that can
accommodate sands with higher fines contents and that are not sensitive to sands with higher
absorption.
TxDOT Experience
One TxDOT project utilized crushed concrete fines as concrete aggregate. This project,
the reconstruction of a section of Interstate 10 in the Houston District, utilized both crushed
concrete coarse and fine aggregates. This study was performed to evaluate the performance of
pavement using 100 percent recycled aggregates (15). The recycled fine aggregate used in this
study was washed of minus No. 200 materials and regraded before application. This study found
that the recycled aggregates do not have a pronounced effect on the compressive strength of the
concrete. Interestingly, however, a significant reduction was reported for the modulus of
elasticity of the mixtures containing recycled aggregates. In addition, this study found that when
recycled aggregates are used, changes must be made to the construction sequence to ensure
consistent concrete. During the early stages of this project, a difficulty was experienced in
producing workable concrete that met the specified strength and durability requirements. This
problem was solved by the addition of a sprinkler system that kept the recycled fine aggregate
constantly moist (16). Construction crews involved with this project stated that the concrete using
recycled sand was inconsistent and extremely difficult to work with. They also noted that the
concrete using recycled aggregate set too quickly to be adequately finished.
9
POTENTIAL TxDOT APPLICATIONS
Information from the literature indicates that applications other than medium to high
strength structural concrete would be relevant for the effective use of recycled CPCC fines. As
proposed, the areas of possible TxDOT applications of CPCC fines are addressed in two ways:
paving and non-paving applications. All test programs in this project focused on identifying
material properties with respect to the development of specifications for proposed potential
applications.
Many TxDOT personnel were solicited for information concerning the possible use of
CPCC fines in selected applications. These discussions addressed the required end properties of
the selected applications, constructability requirements, and environmental issues associated with
the substitution of CPCC fines for conventional materials.
Paving Applications
Three potential areas were identified for paving applications: unbound flexible aggregate
base, cement treated base, and hot mix asphalt concrete bond breaker. Expected properties to be
considered for effective field implementations are summarized below for each item.
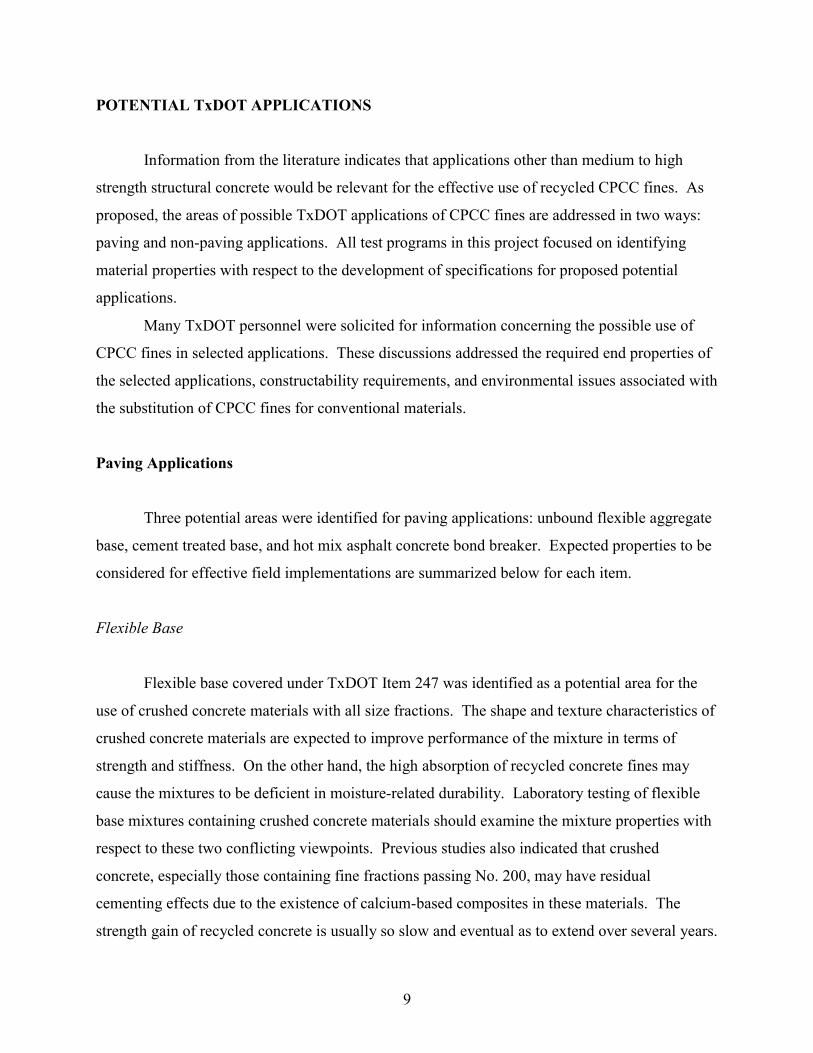
Flexible Base
Flexible base covered under TxDOT Item 247 was identified as a potential area for the
use of crushed concrete materials with all size fractions. The shape and texture characteristics of
crushed concrete materials are expected to improve performance of the mixture in terms of
strength and stiffness. On the other hand, the high absorption of recycled concrete fines may
cause the mixtures to be deficient in moisture-related durability. Laboratory testing of flexible
base mixtures containing crushed concrete materials should examine the mixture properties with
respect to these two conflicting viewpoints. Previous studies also indicated that crushed
concrete, especially those containing fine fractions passing No. 200, may have residual
cementing effects due to the existence of calcium-based composites in these materials. The
strength gain of recycled concrete is usually so slow and eventual as to extend over several years.
10
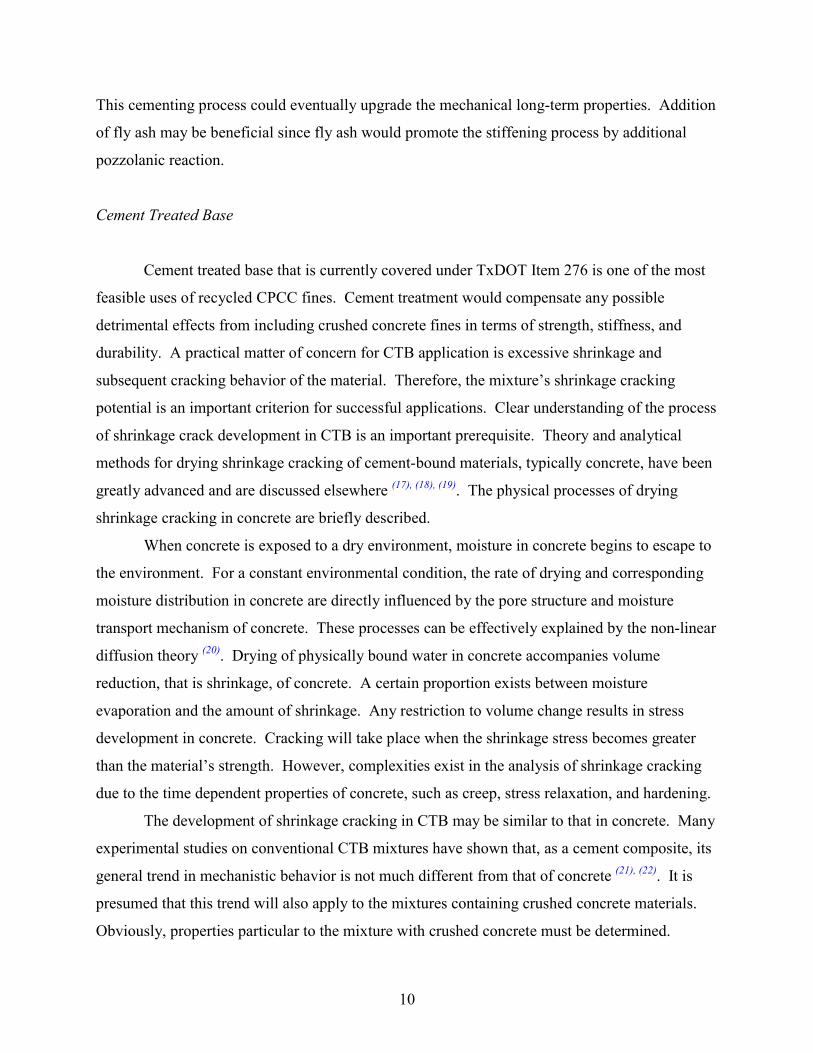
This cementing process could eventually upgrade the mechanical long-term properties. Addition
of fly ash may be beneficial since fly ash would promote the stiffening process by additional
pozzolanic reaction.
Cement Treated Base
Cement treated base that is currently covered under TxDOT Item 276 is one of the most
feasible uses of recycled CPCC fines. Cement treatment would compensate any possible
detrimental effects from including crushed concrete fines in terms of strength, stiffness, and
durability. A practical matter of concern for CTB application is excessive shrinkage and
subsequent cracking behavior of the material. Therefore, the mixture’s shrinkage cracking
potential is an important criterion for successful applications. Clear understanding of the process
of shrinkage crack development in CTB is an important prerequisite. Theory and analytical
methods for drying shrinkage cracking of cement-bound materials, typically concrete, have been
greatly advanced and are discussed elsewhere (17), (18), (19). The physical processes of drying
shrinkage cracking in concrete are briefly described.
When concrete is exposed to a dry environment, moisture in concrete begins to escape to
the environment. For a constant environmental condition, the rate of drying and corresponding
moisture distribution in concrete are directly influenced by the pore structure and moisture
transport mechanism of concrete. These processes can be effectively explained by the non-linear
diffusion theory (20). Drying of physically bound water in concrete accompanies volume
reduction, that is shrinkage, of concrete. A certain proportion exists between moisture
evaporation and the amount of shrinkage. Any restriction to volume change results in stress
development in concrete. Cracking will take place when the shrinkage stress becomes greater
than the material’s strength. However, complexities exist in the analysis of shrinkage cracking
due to the time dependent properties of concrete, such as creep, stress relaxation, and hardening.
The development of shrinkage cracking in CTB may be similar to that in concrete. Many
experimental studies on conventional CTB mixtures have shown that, as a cement composite, its
general trend in mechanistic behavior is not much different from that of concrete (21), (22). It is
presumed that this trend will also apply to the mixtures containing crushed concrete materials.
Obviously, properties particular to the mixture with crushed concrete must be determined.

11
Ideally, it involves material properties such as the ultimate shrinkage, strength, stiffness, creep or
relaxation modulus, and related fracture parameters. Relative to this research project, a specific
analysis or prediction of shrinkage cracking is not of interest. However, one aspect of this
project will focus on a comparative investigation of the shrinkage cracking potential of CTB
mixtures. The shrinkage cracking potential of a CTB mixture can be inferred from the material
properties associated with the process of shrinkage cracking. Therefore, laboratory testing of
CTB mixtures should concentrate on the material characterization with respect to the shrinkage
cracking behavior.
Hot Mix Asphalt Bond Breaker
Recycled CPCC fines are expected to be usable as a part of fine aggregate or filler in hot
mix asphalt (HMA) bond breaker, as covered under Item 345, “Plant Mix Asphalt Stabilized
Base.” If recycled concrete fines contain sufficient calcium hydroxide (hydrated lime), it is also
expected that CPCC fines may work as an active filler, which contributes to the improvement of
cracking resistance and susceptibility to moisture damage in the mixture. On the other hand,
inclusion of recycled fines may bring a significant increase of asphalt content, which in turn may
cause low mixture stability and higher costs.
Considering the purpose of a bond breaker layer, rigorous structural properties are not
necessarily required. Workability with proper mix design properties should suffice for bond
breaker applications. Consequently, a program of laboratory testing should focus on the mix
design properties and the maximum feasible inclusions of recycled concrete materials in bond
breaker mixtures. The maximum aggregate size of bond breaker mixture is normally limited to
be less than 1⁄2 inch due to the thin layer thickness. Therefore, only the fine portion (passing
No. 4 sieve) of recycled concrete materials will be considered in bond breaker applications.
Non-paving Applications
Researchers identified four items as potential TxDOT applications in the non-paving
area: portland cement concrete, flowable fill, backfill, and embankment. Expected properties to
be considered for effective field implementations are discussed below for each item.
12
Portland Cement Concrete
The research team discussed with TxDOT personnel the possible applications utilizing
low strength portland cement concrete, TxDOT class A and B. Applications discussed included
median barriers, curb and gutter, rip-rap, and culverts. In addition to requirements specific to
individual applications, general requirements for TxDOT concrete were discussed. During this
discussion it was revealed that all concrete used for the above applications is entrained with
6 percent air for durability reasons (23). Approximately 50 percent of curb and gutter cast by
TxDOT is extruded, and the remainder is formed and hand placed. Concrete used in extruded
mixtures requires a 11⁄2-inch to 2-inch slump; hand placed mixtures require a 3-inch to 4-inch
slump. Personnel contacted also indicated that a great deal of difficulty has been experienced
when manufactured sand is used in extruded mixtures. These mixtures are typically extremely
sticky and, consequently, very difficult to extrude. The possibility of using CPCC fines as
aggregate in median barriers and culverts was also explored. However, because these items are
usually constructed with a higher grade of concrete, they were eliminated as applications that
could use CPCC fines as aggregate (24).
Flowable Fill
Flowable fill, also known as controlled low strength material (CLSM), is presently
covered under TxDOT special specification number 4438 (25). TxDOT primarily uses flowable
fill as a repair material. Typically, flowable fill is used as a void fill for repairs that are difficult
to access. These applications do not anticipate subsequent excavation; therefore, long-term
strength gain and the tensile strength of the material are not a concern. Currently, aggregates
used in flowable fill must have a plasticity index below 6; all aggregate must pass the 3⁄4-inch
sieve, and no more than 30 percent of the aggregate may pass the No. 200 sieve. The 28-day
unconfined compressive strength of the hardened flowable fill must be between 80 and 150 psi.
Other studies have investigated the use of high fines materials as aggregate in flowable
fill (26). These studies found that while high fines materials can be used as aggregate, they cause
difficulties entraining high amounts of air. However, with proper modifications to the mixture
design, flowable fill was found to be an application that could make use of the fines.
13
Backfill
Backfill for structures is covered under TxDOT Item 400.5. Presently, the only material
requirements referred to in these specifications relate to limiting materials, such as wood, that
will adversely affect compaction or have other deleterious effects. This specification covers
backfill for items such as pipe, bridge foundations, retaining walls, and culverts. Item 400.6
covers cement stabilized backfill. This material, which is largely sand mixed with 7 percent
portland cement, is primarily used around sewers and manholes. The only material requirement
for this application is that use be approved by the engineer, as would be shown on the plans (27).
Embankment
Currently, four types of embankment, TxDOT Item 132, are specified. The four types
— A, B, C, and D — are used in different applications, and, consequently, the requirements for
their constituent materials differ. Type A embankment has the most stringent material
requirements. However, Type A embankments are rarely specified. Type B and C
embankments must be constructed from suitable soils that will form a stable embankment.
TxDOT personnel felt that embankment would be an application that could reuse large amounts
of crushed concrete material. This application could use both CPCC material and/or CPCC
fines. The only modification that might be needed for embankments using CPCC materials is to
specify that a clay cap be added to minimize surface erosion. However, this minimal
modification is not expected to significantly impact the construction of the embankment (28).
PRODUCERS OF CRUSHED CONCRETE
Six producers of crushed concrete were contacted and questioned about various aspects
of their concrete crushing operations. Issues discussed with the producers included: the input
materials accepted; the approximate volume of crushed concrete produced; disposal problems, if
any, encountered with the crushed concrete; and applications utilizing the crushed concrete
produced.
14
Williams Brothers
Williams Brothers Construction produces crushed concrete at two sites in the greater
Houston area. Their primary crushing operation occurs at the Airtex crusher located adjacent to
Interstate 45 in the northern part of Houston. Presently, crushing, washing, and re-grading
operations take place at this location.
Williams Brothers personnel indicated that all concrete crushed at this location comes
directly from TxDOT work sites. There are three different stockpiles of crushed concrete in this
field. The first stockpile consists of the materials taken directly from the crusher. This stockpile
contains all particles from inches to minus No. 200 sieve sized. They reported this material has
been successfully used in CTB. The second and third stockpiles involve the process of washing
and sieving, in addition to crushing. The second stockpile consists of coarse particles of CPCC
remaining on the No. 4 sieve. The coarse aggregates are used as aggregates in fresh concrete
primarily during periods of aggregate shortages. The remaining material, that passes the No. 4
sieve, is then washed to remove silt and clay sized particles passing the No. 200 sieve. After
washing, this material is regraded to meet ASTM C-33 specifications for fine aggregate. The
third stockpile consists of these washed and regraded fine particles of CPCC. However, this
material, referred to as regraded washed crushed portland cement concrete (RCPCC) fines, does
not perform adequately when used as concrete sand. This material was used during an
experimental paving project but has not been used for that purpose since (29). The only
application that presently uses this material is cement treated backfill, TxDOT Item 400.6.
Southern Crushed Concrete
Southern Crushed Concrete operates five crushers in the greater Houston area. Southern
Crushed Concrete accepts various types of concrete and does not limit the material crushed to
concrete from TxDOT projects. TxDOT personnel reported that Southern Crushed Concrete
sells all of their crushed concrete as road base and has never had a problem disposing of the
material (16).
15
Big City Crushed Concrete
Big City Crushed Concrete, located in Dallas, runs an urban recycling program and
crushes concrete from a variety of sources. Big City does not attempt to use the material as
concrete aggregate or as road base for TxDOT applications. After crushing the material, it is
separated by size into four products.
Material between 3 inches and 11⁄2 inches is used as a base for heavy duty roads located in
landfills. Material between 11⁄2 and 3⁄4 inches is used as septic and free draining fill. Material
from 13⁄4 inches to dust is used in applications ranging from sidewalk base to replacing expansive
clays located below residential slabs. The remaining material, which passes the 3/8-inch sieve, is
used as a trench backfill material (30).
The trench backfill material is widely used and is the primary product that Big City
produces. This material is typically used to backfill sewer lines and has been so successful that
certain municipalities have developed special specifications for its use. The City of University
Park has a special specification for sewer line backfill and finds that the recycled trench backfill
material works better than conventional materials. Mr. Bob Whaling, city engineer, said that the
material is cheaper than cement-stabilized sand yet offers better properties than conventional
sand. The primary advantage to using the recycled material is that the more angular particles
increase the friction angle and reduce the amount of soil that must be excavated when repairs are
made. The recycled pipe backfill material has been used on approximately five projects, and the
city has been pleased with the results (31).
Big City intentionally does not regrade material to meet existing ASTM and TxDOT
approved gradations. They feel that this is a waste of both time and money due to the large
number of applications that use the material in its ungraded state. Furthermore, a substantial
demand exists for the pipe backfill material, and there are no problems selling all material that
they produce (30).
16
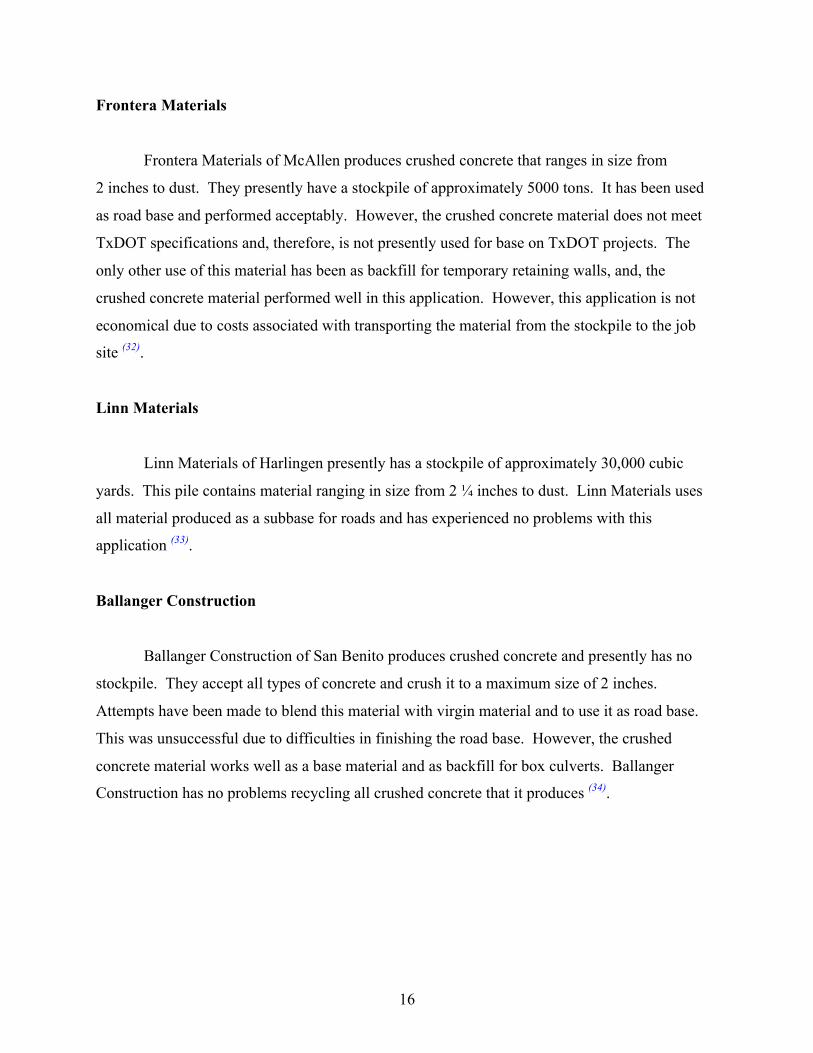
Frontera Materials
Frontera Materials of McAllen produces crushed concrete that ranges in size from
2 inches to dust. They presently have a stockpile of approximately 5000 tons. It has been used
as road base and performed acceptably. However, the crushed concrete material does not meet
TxDOT specifications and, therefore, is not presently used for base on TxDOT projects. The
only other use of this material has been as backfill for temporary retaining walls, and, the
crushed concrete material performed well in this application. However, this application is not
economical due to costs associated with transporting the material from the stockpile to the job
site (32).
Linn Materials
Linn Materials of Harlingen presently has a stockpile of approximately 30,000 cubic
yards. This pile contains material ranging in size from 2 1⁄4 inches to dust. Linn Materials uses
all material produced as a subbase for roads and has experienced no problems with this
application (33).
Ballanger Construction
Ballanger Construction of San Benito produces crushed concrete and presently has no
stockpile. They accept all types of concrete and crush it to a maximum size of 2 inches.
Attempts have been made to blend this material with virgin material and to use it as road base.
This was unsuccessful due to difficulties in finishing the road base. However, the crushed
concrete material works well as a base material and as backfill for box culverts. Ballanger
Construction has no problems recycling all crushed concrete that it produces (34).
17
CHAPTER 3. AGGREGATE PROPERTIES
This chapter describes the test methods used to characterize the CPCC fines and the
results of the tests. The aggregate characterization program, an essential component of this
study, allowed the crushed concrete fines to be compared to virgin aggregates by both their
physical properties and by the effect they have on the properties of applications such as flowable
fill and concrete. The aggregate characterization program consisted of the following tests: wet
and dry sieve analysis, specific gravity and absorption, dry rodded unit weight and voids,
methylene blue value, plasticity index, pH measurements, and chemical analysis using
inductively coupled plasma technology. Aggregate properties for coarse particles of crushed
concrete were separately identified when they were required in conjunction with the studies of
specific applications.
MATERIAL COLLECTION
The research team collected crushed concrete for aggregate tests from four crushers
around the state of Texas. Included crushers are Williams Brothers, Southern Crushed Concrete,
Big City Crushed Concrete, and Frontera Materials. All collected materials were sieved in the
lab to extract inclusions of coarse particles over the No. 4 sieve size.
Williams Brothers
As described in the previous chapter, the Williams Brothers crusher has three different
stockpiles of crushed concrete materials. Each stockpile contains materials such that:
� stockpile 1: base material containing all sized particles from +2 inches to –No. 200,
� stockpile 2: washed coarse aggregates sized +No. 4, and
� stockpile 3: manufactured sand that is washed and regraded fine aggregates sized
from –No. 4 to +No. 200.
18
Considering the various kinds of stockpiles, the Williams Brothers crusher was selected
as the primary source of materials throughout the project. Researchers collected a large amount
of samples from stockpile 1, base material, and stockpile 3, manufactured sand. The
manufactured sand is sometimes denoted as washed and regraded CPCC fines. Materials in
stockpile 2, coarse aggregates, were not collected because they could be obtained when
necessary from the stockpile 1 samples.
Total samples collected from the Williams Brothers consisted of 30 55-gallon drums.
Among them, 13 (10 base material and 3 manufactured sand) were used for studies for paving
applications, and 17 (12 base material and 5 manufactured sand) were used for non-paving
applications. Researchers used part of those samples for aggregate tests under both paving and
non-paving studies.
The base materials from stockpile 1 were sieved in the lab to produce samples of CPCC
fines passing No. 4. No additional sieving work was placed for manufactured sand. Samples of
CPCC fines and manufactured sand were then separately treated according to ASTM C 702,
“Standard Practice for Reducing Samples of Aggregate to Testing Size” to achieve a
homogenous sample. Final samples for aggregate testing were taken as needed from the
homogenized samples of each material.
In addition to the large sampling, separate small samples were collected from various
locations of each stockpile. These samples were used to assess the variability of materials in a
single stockpile. Seven 5-gallon samples came from various locations of stockpile 1.
Southern Crushed Concrete
A total of seven 55-gallon drums of crushed concrete were sampled from Southern
Crushed Concrete. Studies on paving applications used two of them, and the remaining five
barrels were used for aggregate tests in conjunction with the studies on non-paving applications.
All stockpiles in Southern Crushed Concrete contain base materials of all-sized particles.
Similar to samples taken from the Williams Brothers stockpile 1, materials were divided at the
No. 4 sieve size. CPCC fines passing the No. 4 sieve were then treated in accordance with
ASTM C 702, “Standard Practice for Reducing Samples of Aggregate to Testing Size” to
achieve a homogenous sample.
19
Big City Crushed Concrete
Big City Crushed Concrete supplied four 55-gallon drums of crushed concrete. These
barrels contained samples from different areas of Big City’s minus 3/8-inch pipe backfill
material. Any material retained on the No. 4 sieve was removed to obtain samples of CPCC
fines. Final samples for aggregate testing were then taken as needed. Researchers used this
material for the studies on non-paving applications.
Frontera Materials
Frontera Materials supplied four 55-gallon drums. These materials were then sieved to
remove any material retained on the No. 4 sieve. The resultant CPCC fines were tested
according to the material characterization program. Researchers also used this material for the
studies on non-paving applications.
Sample Labeling
Sample identification was organized as follows:
[Two-Letter Code]-[One-Letter Code]-(Sample Number)
The first two-letter code represents the source of materials. It is basically the
abbreviation of each source. There are five different sources to be distinguished. They are
CPCC fines from four different crushers and manufactured sand from Williams Brothers. The
codes WB, SC, BC, and FM represent the CPCC fines collected from Williams Brothers,
Southern Crushed Concrete, Big City Crushed Concrete, and Frontera Materials, respectively.
The code MS stands for manufactured sand from Williams Brothers.
The one-letter code in the middle delineates the sample group within the given source. It
is simply designated according to alphabetic order. CPCC fines from Williams Brothers sources
are divided into eight sample groups, so they have the identification from WB-A through WB-H.
Recalling the manner in which material collection of the Williams Brothers source was carried
20
out, WB-A represents the large sample taken with numbers of 55-gallon barrels, and WB-B
through WB-H represent small samples taken from seven different locations. Samples WB-B
and WB-C came from the top of the stockpile. Samples WB-D through WB-H came from
equally spaced areas around the stockpile at about 5 ft above ground. Samples from other
sources (SC, BC, FM, and MS) also have the sample group codes from A to C or A to D. The
last sample number is used only for the sample of WB-A. For this large sample, eight test
samples were taken from the subsets of homogenized materials that resulted from the ASTM C
702 procedure.
The above sample identification system results in 30 subsets of samples as follows:
� WB-A-1 to WB-A-8: Williams Brothers stockpile 1,
� WB-B to WB-H: Williams Brothers stockpile 1 (different locations of the stockpile),
� MS-A to MS-D: Williams Brothers stockpile 3 (washed fines or manufactured sand),
� SC-A to SC-C: Southern Crushed Concrete,
� BC-A to BC-D: Big City Crushed Concrete, and
� FM-A to FM-D: Frontera Materials.
TEST PROCEDURES FOR AGGREGATE CHARACTERIZATION
This section describes the methods of selected tests for characterizing CPCC fines. The
test program includes tests for sieve analysis, specific gravity and absorption, unit weight and
voids, methylene blue value, plasticity index, pH measurements, and chemical analysis.
Wet and Dry Sieve Analysis
The gradation and fineness modulus of each aggregate were determined by first washing
and then sieving each aggregate. All aggregates were sampled in the as-delivered state. The
material was washed according to ASTM C 117, “Standard Test Method for Materials Finer than
No. 200 (75 µm) Sieve in Mineral Aggregates by Washing.” The gradation of the washed
sample was determined in accordance with ASTM C 136, “Standard Test Method for Sieve
Analysis of Fine and Coarse Aggregates.”

21
Specific Gravity and Absorption
The specific gravity and absorption capacity of an aggregate affect not only concrete
mixture designs but also other aggregate characterization tests. Testing for these properties was
conducted in accordance with ASTM C 128, “Standard Test Method for Specific Gravity and
Absorption of Fine Aggregate.” This test determined the bulk, surface-saturated dry (SSD) and
apparent specific gravity as well as the absorption capacity of each aggregate.
Dry Rodded Unit Weight and Voids
The dry rodded unit weight and voids test determines the bulk density of the aggregate.
The bulk density of an aggregate is required for many methods of concrete mixture design. This
test was performed in accordance with ASTM C 29, “Bulk Density (Unit Weight) and Voids in
Aggregate.” All testing used the rodding procedure.
Methylene Blue Test
The methylene blue test, first used in France, is an effective method to evaluate the
presence of potentially harmful materials in the fraction of an aggregate finer than the No. 200
(75 µm) sieve. The test procedure used in this study was developed in NCHRP Project 4-19 for
determining the presence of potentially deleterious materials in aggregates (35). ASTM C 837,
“Standard Test Method for Methylene Blue Index of Clay,” is a similar test used to measure
methylene blue absorption. However, ASTM C 837 is better suited for clays than crushed
concrete fines.
The methylene blue test was performed by saturating 10.0 g (±0.05 g) of sample passing
the No. 200 (75 µm) sieve with 30.0 g (±0.05 g) of distilled water. A solution containing 1 g of
methylene blue in enough distilled water to produce 200 ml of solution (each 1 ml of solution
contains 5 mg of methylene blue) was used to titrate the slurry. This solution was added to the
slurry in 0.5 ml increments as the slurry was mixed. Figure 3.1 shows the setup used for the
methylene blue test.
22
After 1 minute of mixing, a small amount of the solution, containing the sample material
and titrated methylene blue, was removed via a glass rod and dropped onto filter paper. If a light
blue halo was not observed, an additional 0.5 ml of methylene blue solution was added. This
process continued until a halo was observed. Once a halo was observed, the solution was mixed
for an additional 5 minutes. If the halo still formed, the methylene blue dosage was recorded. If
the halo disappeared during the 5-minute mixing period, an additional sample of methylene blue
was added and the process continued. If the sample was known to have a very high methylene
blue value, the initial dosages of methylene blue were increased to expedite the testing
procedure. Figure 3.2 shows a sample of a completed methylene blue test. The right-most
sample has been fully saturated with methylene blue, and a faint blue halo has formed.
In addition to the methylene blue value, a modified methylene blue value was also
calculated. The modified methylene blue value was computed by multiplying the methylene
blue value by the percentage of material passing the No. 200 sieve. A recent International Center
for Aggregates Research (ICAR) study found that the modified methylene blue value is a better
indicator of the suitability of an aggregate for concrete applications since it includes both the
amount of minus No. 200 material and the methylene blue value (36).
Figure 3.1. Methylene Blue Test Set-Up.
(Shown from left to right are: timer, beaker and stir bar, and stir plate.)
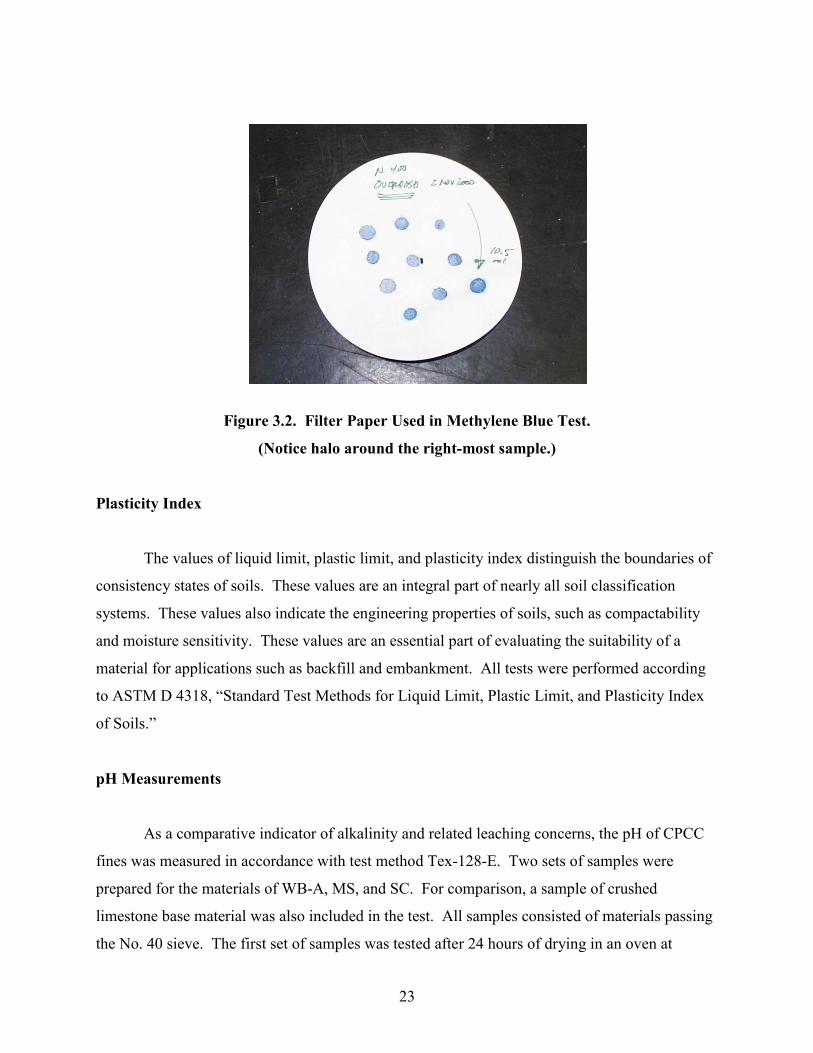
23
Figure 3.2. Filter Paper Used in Methylene Blue Test.
(Notice halo around the right-most sample.)
Plasticity Index
The values of liquid limit, plastic limit, and plasticity index distinguish the boundaries of
consistency states of soils. These values are an integral part of nearly all soil classification
systems. These values also indicate the engineering properties of soils, such as compactability
and moisture sensitivity. These values are an essential part of evaluating the suitability of a
material for applications such as backfill and embankment. All tests were performed according
to ASTM D 4318, “Standard Test Methods for Liquid Limit, Plastic Limit, and Plasticity Index
of Soils.”
pH Measurements
As a comparative indicator of alkalinity and related leaching concerns, the pH of CPCC
fines was measured in accordance with test method Tex-128-E. Two sets of samples were
prepared for the materials of WB-A, MS, and SC. For comparison, a sample of crushed
limestone base material was also included in the test. All samples consisted of materials passing
the No. 40 sieve. The first set of samples was tested after 24 hours of drying in an oven at
24
115±5°C. The second set was washed over the No. 200 sieve before the oven dry. To make a
dispersed aggregate solution, 30 g of each dried sample was added to 150 ml of distilled water.
Measurements on each prepared sample conformed to test method Tex 128-E.
Chemical Analysis
Two types of chemical analysis were conducted by Analysys Inc. of Austin, Texas.
Eleven samples—samples WB-A through WB-H and SC-A, BC-A, and FM-A—were tested for
the Resource Conservation and Recovery Act of 1976 (RCRA) metals using inductively coupled
plasma (ICP) technology. Two of theses samples, SC-A and BC-A, were also tested according
to the Synthetic Precipitation Leaching Procedure (SPLP). This test, a modified version of the
Toxicity Characteristic Leaching Procedure (TCLP), is designed to determine the mobility of
contaminates in the material. SPLP uses a slightly less acidic solution than TCLP to measure the
mobility of contaminates.
In addition to the CPCC fines samples tested, six samples of concrete sand were tested
for total levels of RCRA metals. These samples, three virgin sands and three manufactured
sands, came from TxDOT approved producers of fine aggregates.
TEST RESULTS AND DISCUSSION
Wet and Dry Sieve Analysis
The results of the wet and dry sieve analyses are shown in Figures 3.3 to 3.8. The
percentage of material passing the No. 200 sieve is shown in Table 3.1. The dotted lines in each
graph represent obtained gradation of each sample, and the solid lines show the ASTM C 33
requirements. It can be shown that the crushed concrete samples did not meet ASTM C 33
grading requirements, especially for the materials passing the No. 40 sieve. Typically, between
10 and 20 percent of the crushed concrete material passed the No. 200 sieve. The grading plots
also show the considerable variation of the material from different producers and from different
areas of a given stockpile. These differences could be caused by a number of factors including
crushing speed, type of crusher, type of concrete crushed, and the amount of foreign material

25
(soil and clay) attached to the concrete as it enters the crusher. The only sample that met ASTM
C 33 grading requirements was the Williams Brothers manufactured sand, which is washed
CPCC fines. This material is intentionally regraded to meet ASTM C 33.
Figure 3.3. Grading of Williams Brothers CPCC Fines: Samples WB-A-1 to WB-A-8.
Figure 3.4. Grading of Williams Brothers CPCC Fines: Samples WB-B to WB-H.
0%
10%
20%
30%
40%
50%
60%
70%
80%
90%
100%
Pan No. 200 No. 100 No. 50 No. 30 No. 16 No. 8 No. 4 3/8"
Sieve Size
0%
10%
20%
30%
40%
50%
60%
70%
80%
90%
100%
Pan No. 200 No. 100 No. 50 No. 30 No. 16 No. 8 No. 4 3/8"
Sieve Size
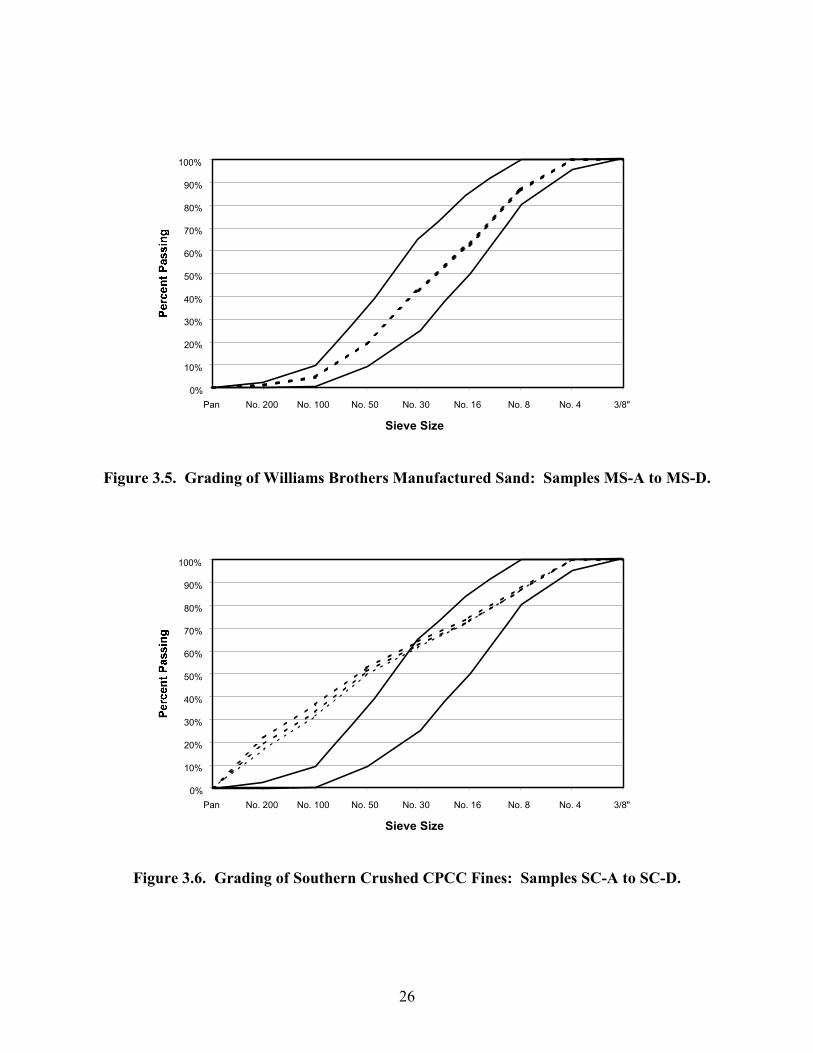
26
Figure 3.5. Grading of Williams Brothers Manufactured Sand: Samples MS-A to MS-D.
Figure 3.6. Grading of Southern Crushed CPCC Fines: Samples SC-A to SC-D.
0%
10%
20%
30%
40%
50%
60%
70%
80%
90%
100%
Pan No. 200 No. 100 No. 50 No. 30 No. 16 No. 8 No. 4 3/8"
Sieve Size
0%
10%
20%
30%
40%
50%
60%
70%
80%
90%
100%
Pan No. 200 No. 100 No. 50 No. 30 No. 16 No. 8 No. 4 3/8"
Sieve Size
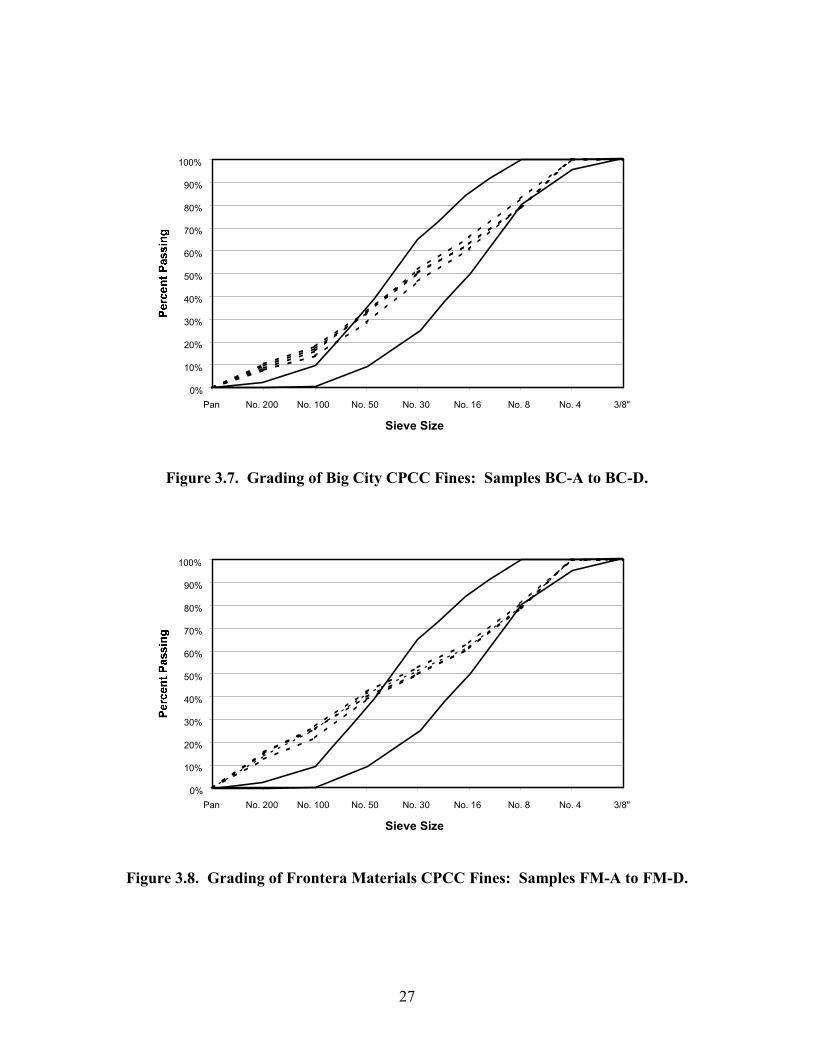
27
Figure 3.7. Grading of Big City CPCC Fines: Samples BC-A to BC-D.
Figure 3.8. Grading of Frontera Materials CPCC Fines: Samples FM-A to FM-D.
0%
10%
20%
30%
40%
50%
60%
70%
80%
90%
100%
Pan No. 200 No. 100 No. 50 No. 30 No. 16 No. 8 No. 4 3/8"
Sieve Size
0%
10%
20%
30%
40%
50%
60%
70%
80%
90%
100%
Pan No. 200 No. 100 No. 50 No. 30 No. 16 No. 8 No. 4 3/8"
Sieve Size
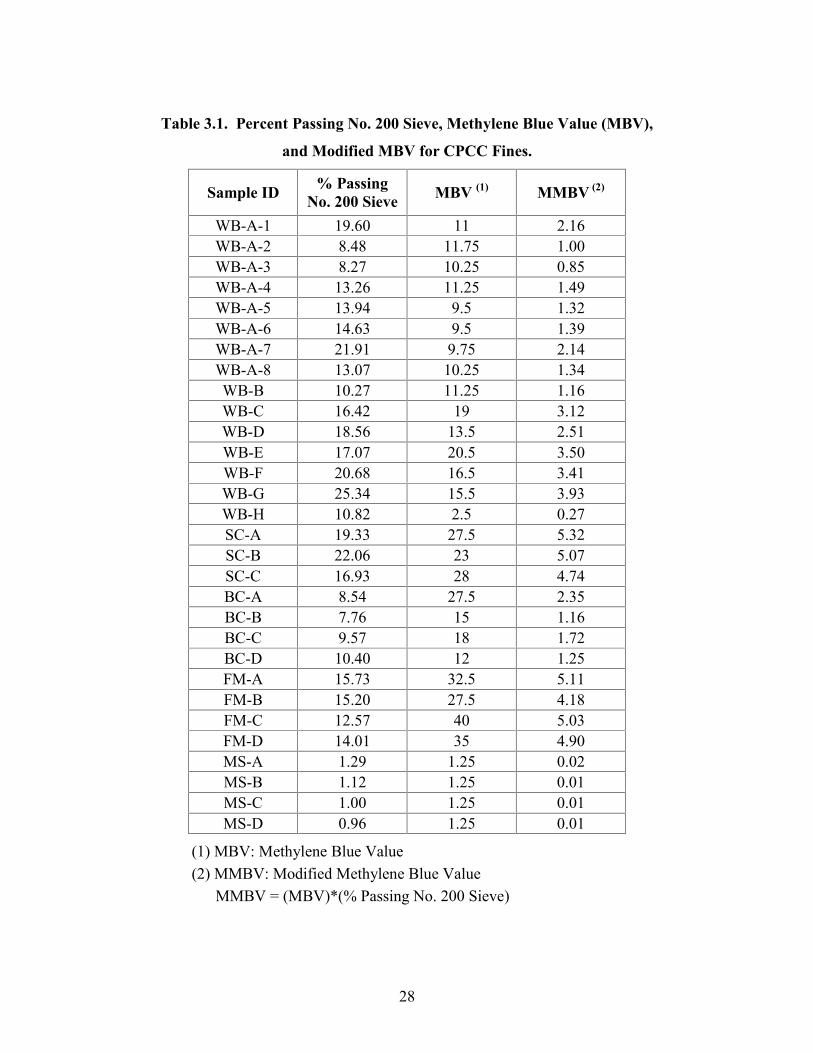
28
Table 3.1. Percent Passing No. 200 Sieve, Methylene Blue Value (MBV),
and Modified MBV for CPCC Fines.
Sample ID % Passing No. 200 Sieve MBV (1) MMBV (2)
WB-A-1 19.60 11 2.16 WB-A-2 8.48 11.75 1.00 WB-A-3 8.27 10.25 0.85 WB-A-4 13.26 11.25 1.49 WB-A-5 13.94 9.5 1.32 WB-A-6 14.63 9.5 1.39 WB-A-7 21.91 9.75 2.14 WB-A-8 13.07 10.25 1.34 WB-B 10.27 11.25 1.16 WB-C 16.42 19 3.12 WB-D 18.56 13.5 2.51 WB-E 17.07 20.5 3.50 WB-F 20.68 16.5 3.41 WB-G 25.34 15.5 3.93 WB-H 10.82 2.5 0.27 SC-A 19.33 27.5 5.32 SC-B 22.06 23 5.07 SC-C 16.93 28 4.74 BC-A 8.54 27.5 2.35 BC-B 7.76 15 1.16 BC-C 9.57 18 1.72 BC-D 10.40 12 1.25 FM-A 15.73 32.5 5.11 FM-B 15.20 27.5 4.18 FM-C 12.57 40 5.03 FM-D 14.01 35 4.90 MS-A 1.29 1.25 0.02 MS-B 1.12 1.25 0.01 MS-C 1.00 1.25 0.01 MS-D 0.96 1.25 0.01
(1) MBV: Methylene Blue Value (2) MMBV: Modified Methylene Blue Value MMBV = (MBV)*(% Passing No. 200 Sieve)
29
Specific Gravity and Absorption
Table 3.2 shows the test results for specific gravity, absorption, and dry rodded unit
weight. The specific gravity and absorption of the crushed concrete fines varied considerably,
not only from producer to producer but also within a stockpile. The bulk specific gravity of the
crushed concrete fines varied from 2.10 to 2.38. The samples from Big City typically had lower
specific gravity values, while the samples from the Williams Brothers generally had higher
values. The absorption capacity also varied greatly. The Big City crushed concrete was by far
the most absorptive, more than twice as absorptive as the samples from Southern Crushed
Concrete. Most samples had absorption values ranging from 6 to 8 percent.
In addition, the absorption of the Williams Brothers manufactured sand exceeded
5 percent, which is about 2 percent lower than that of unwashed Williams Brothers CPCC fines,
and is higher than the absorption of CPCC fines from Southern Crushed Concrete. This indicates
that while the minus No. 200 faction of crushed concrete increases the water demand of the
material, the larger particles also significantly contribute to the increased absorption of CPCC
fines.
Dry Rodded Unit Weight and Voids
Table 3.2 includes the results of the dry rodded unit weight test. The dry rodded unit
weight for material from the Williams Brothers stockpile was typically between 87 and 89 lb/ft3.
The dry rodded unit weight of material from Frontera Materials and Southern Crushed was
slightly lower, ranging from 82 to 85 lb/ft3. The Big City crushed concrete showed the greatest
variability ranging from 77 to 87 lb/ft3.
Methylene Blue Test
Measured methylene blue values for each test sample are included in Table 3.1. The
methylene blue value of the crushed concrete samples varied from 2.5 to 40. This variability was
even more pronounced when the modified methylene blue value was calculated. The modified
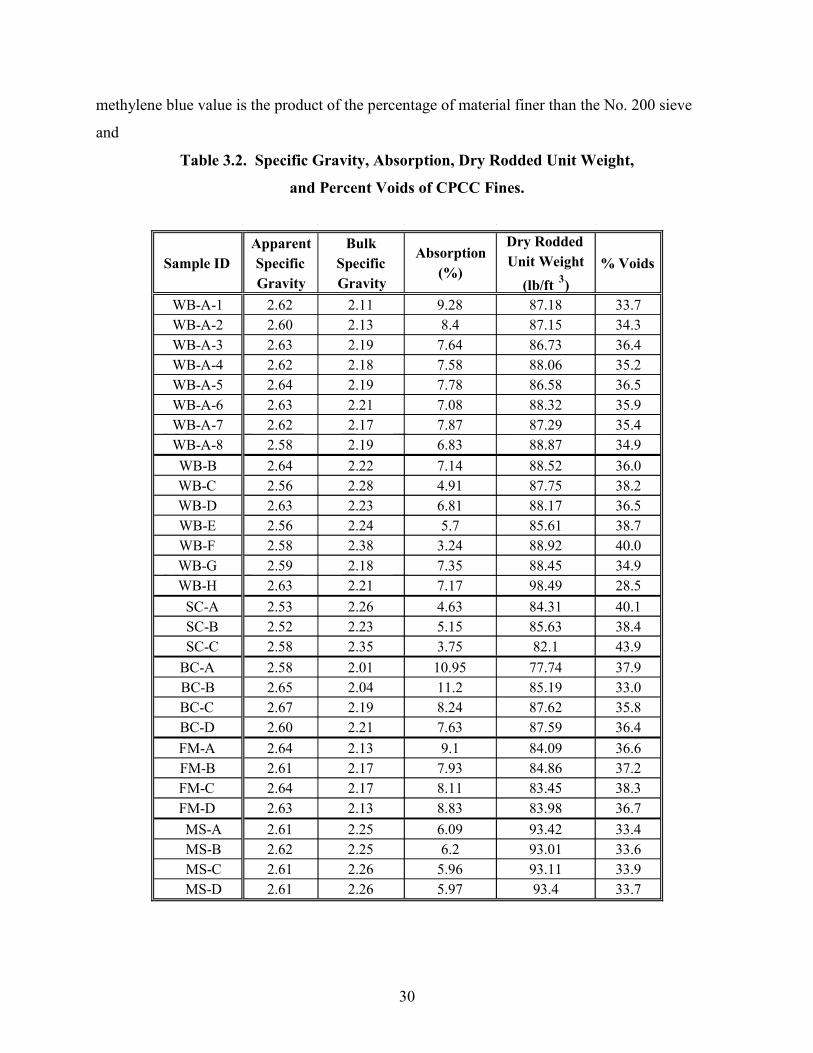
30
methylene blue value is the product of the percentage of material finer than the No. 200 sieve
and
Table 3.2. Specific Gravity, Absorption, Dry Rodded Unit Weight,
and Percent Voids of CPCC Fines.
Sample ID Apparent Specific Gravity
Bulk Specific Gravity
Absorption (%)
Dry Rodded Unit Weight
(lb/ft 3 ) % Voids
WB-A-1 2.62 2.11 9.28 87.18 33.7 WB-A-2 2.60 2.13 8.4 87.15 34.3 WB-A-3 2.63 2.19 7.64 86.73 36.4 WB-A-4 2.62 2.18 7.58 88.06 35.2 WB-A-5 2.64 2.19 7.78 86.58 36.5 WB-A-6 2.63 2.21 7.08 88.32 35.9 WB-A-7 2.62 2.17 7.87 87.29 35.4 WB-A-8 2.58 2.19 6.83 88.87 34.9 WB-B 2.64 2.22 7.14 88.52 36.0 WB-C 2.56 2.28 4.91 87.75 38.2 WB-D 2.63 2.23 6.81 88.17 36.5 WB-E 2.56 2.24 5.7 85.61 38.7 WB-F 2.58 2.38 3.24 88.92 40.0 WB-G 2.59 2.18 7.35 88.45 34.9 WB-H 2.63 2.21 7.17 98.49 28.5
SC-A 2.53 2.26 4.63 84.31 40.1 SC-B 2.52 2.23 5.15 85.63 38.4 SC-C 2.58 2.35 3.75 82.1 43.9
BC-A 2.58 2.01 10.95 77.74 37.9 BC-B 2.65 2.04 11.2 85.19 33.0 BC-C 2.67 2.19 8.24 87.62 35.8 BC-D 2.60 2.21 7.63 87.59 36.4 FM-A 2.64 2.13 9.1 84.09 36.6 FM-B 2.61 2.17 7.93 84.86 37.2 FM-C 2.64 2.17 8.11 83.45 38.3 FM-D 2.63 2.13 8.83 83.98 36.7 MS-A 2.61 2.25 6.09 93.42 33.4 MS-B 2.62 2.25 6.2 93.01 33.6 MS-C 2.61 2.26 5.96 93.11 33.9 MS-D 2.61 2.26 5.97 93.4 33.7

31
the methylene blue value. These methylene blue values, and modified methylene blue values,
are considerably higher than that of typical concrete aggregates. A recent ICAR study found that
most manufactured sands have methylene blue values below four with isolated materials having
methylene blue values as high as 12. Certain crushed concrete samples had methylene blue
values more than three times this value.
The methylene blue value varied from producer to producer. Typically, the Williams
Brothers material had methylene blue values ranging from 10 to 20. Big City material had a
slightly greater range but was also between 12 and 28. Materials from Southern Crushed
Concrete and Frontera Materials had higher values ranging from 23 to 28 and 27 to 40,
respectively. This increase could be due to either the type of material crushed in these operations
or the soil conditions in the local areas.
Plasticity Index
The primary interest of performing ASTM D 4318 was to determine the plasticity index
of the crushed concrete fines. All samples were first tested for the plastic limit, thus eliminating
the necessity to test all samples for the liquid limit. In all cases, it was impossible to determine
the plastic limit of the crushed concrete fines. Therefore, all crushed concrete fines were
classified as non-plastic. In addition, selected samples were evaluated for the liquid limit to
classify the soils according to ASTM D 3398, “Standard Practice for Classification of Soils for
Engineering Purposes (Unified Soil Classification System).” The liquid limit of all samples
tested was well below 40. Therefore, all samples were classified as silty sand.
pH Measurements
Table 3.3 shows measured pH values for each test sample. The sample CL represents
crushed limestone base material. As previously described, researchers performed the test for two
sets of samples. The first tests measured pH values of dried samples, which consisted of every
material passing the No. 40 sieve. The second set of samples was washed on the No. 200 sieve
so as to investigate any impact of ultra fines on the alkalinity of the material. The weight portion
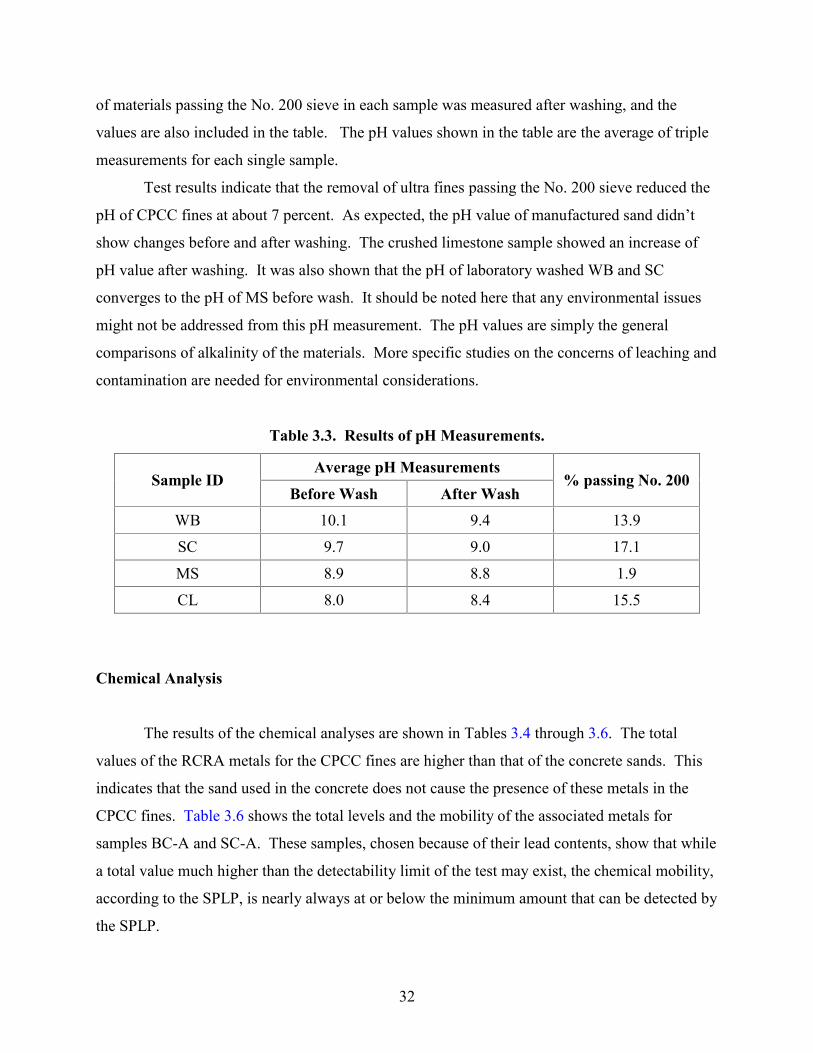
32
of materials passing the No. 200 sieve in each sample was measured after washing, and the
values are also included in the table. The pH values shown in the table are the average of triple
measurements for each single sample.
Test results indicate that the removal of ultra fines passing the No. 200 sieve reduced the
pH of CPCC fines at about 7 percent. As expected, the pH value of manufactured sand didn’t
show changes before and after washing. The crushed limestone sample showed an increase of
pH value after washing. It was also shown that the pH of laboratory washed WB and SC
converges to the pH of MS before wash. It should be noted here that any environmental issues
might not be addressed from this pH measurement. The pH values are simply the general
comparisons of alkalinity of the materials. More specific studies on the concerns of leaching and
contamination are needed for environmental considerations.
Table 3.3. Results of pH Measurements.
Average pH Measurements Sample ID
Before Wash After Wash % passing No. 200
WB 10.1 9.4 13.9
SC 9.7 9.0 17.1
MS 8.9 8.8 1.9
CL 8.0 8.4 15.5
Chemical Analysis
The results of the chemical analyses are shown in Tables 3.4 through 3.6. The total
values of the RCRA metals for the CPCC fines are higher than that of the concrete sands. This
indicates that the sand used in the concrete does not cause the presence of these metals in the
CPCC fines. Table 3.6 shows the total levels and the mobility of the associated metals for
samples BC-A and SC-A. These samples, chosen because of their lead contents, show that while
a total value much higher than the detectability limit of the test may exist, the chemical mobility,
according to the SPLP, is nearly always at or below the minimum amount that can be detected by
the SPLP.

33
Table 3.4. Results of RCRA Metals Totals for Virgin and Manufactured Sand Samples.
Metal Lattimore: Stringtown
(mg/kg)
DDS: Cleveland (mg/kg)
TXI: Sunmount
(mg/kg)
Reynolds: Euless
(mg/kg)
Lattimore: Ambrose (mg/kg)
Hallett: Porter
(mg/kg)
Reporting Limit
(mg/kg) Arsenic 2.58 < 2 < 2 < 2 < 2 < 2 2 Barium 13.2 2.76 16.1 18.0 5.94 < 2 2
Cadmium < 0.5 < 0.5 < 0.5 0.636 < 0.5 < 0.5 0.5 Chromium 3.44 < 1 1.94 2.24 < 1 < 1 1
Lead 1.35 < 1 2.99 < 1 < 1 < 1 1 Mercury < 0.04 < 0.04 < 0.04 < 0.04 < 0.04 < 0.04 0.04 Selenium 1.73 < 1 1.03 < 1 < 1 1.02 1
Silver < 2 < 2 < 2 < 2 < 2 < 2 2
Table 3.5. Results RCRA Metals Totals Tests for WB and FM Samples.
Metal WB-A (mg/kg)
WB-B (mg/kg)
WB-C (mg/kg)
WB-D (mg/kg)
WB-E (mg/kg)
WB-F (mg/kg)
WB-G (mg/kg)
WB-H (mg/kg)
FM-A (mg/kg)
Reporting Limit
(mg/kg) Arsenic 3.09 2.39 2.11 < 2 < 2 < 2 3.9 4.62 4.59 2 Barium 102 111 96.9 75.3 90.6 84.8 118 69.4 323 2
Cadmium < 0.5 < 0.5 < 0.5 < 0.5 < 0.5 < 0.5 < 0.5 < 0.5 < 0.5 0.5 Chromium 11.2 13.2 23.8 8.8 9.72 15.7 43.5 33.4 11.5 1
Lead 12.5 15 16.2 6.05 19.4 34.6 24.6 17.6 4.65 1 Mercury < 0.04 < 0.04 < 0.04 < 0.04 < 0.04 < 0.04 < 0.04 < 0.04 < 0.04 0.04 Selenium 1.08 < 1 < 1 < 1 < 1 1.07 1.31 1.09 1.02 1
Silver < 2 < 2 < 2 < 2 < 2 < 2 < 2 < 2 < 2 2
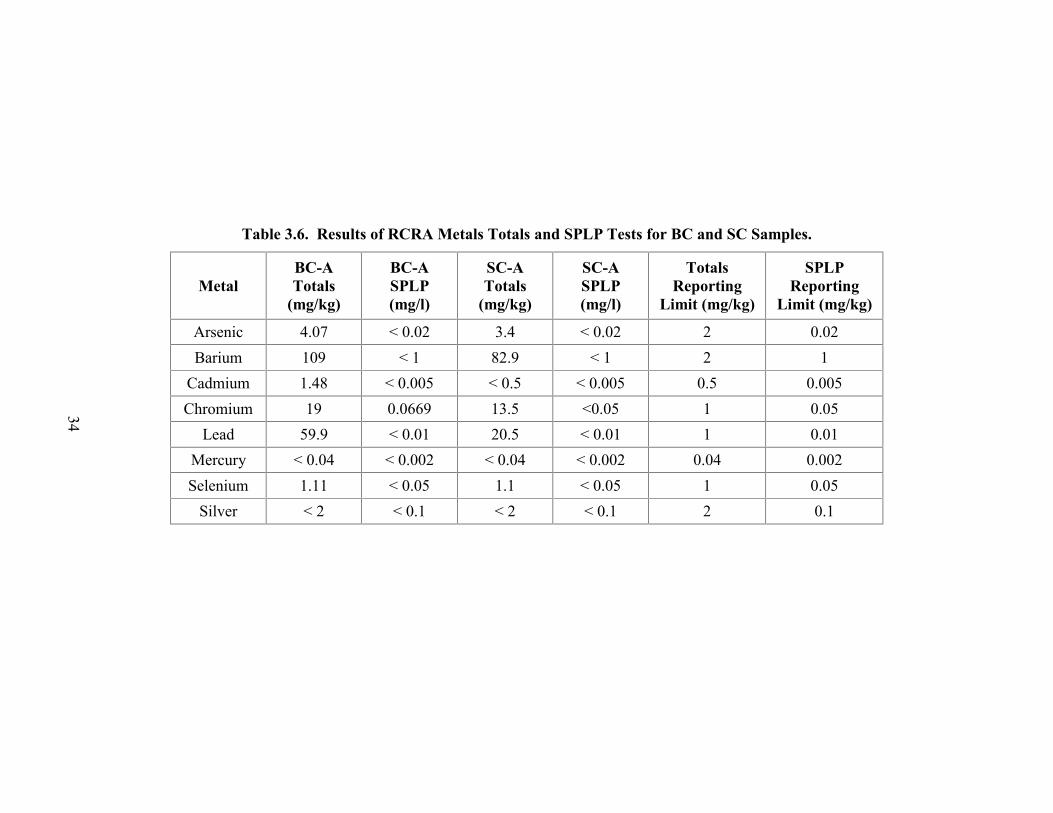
34
Table 3.6. Results of RCRA Metals Totals and SPLP Tests for BC and SC Samples.
Metal BC-A Totals
(mg/kg)
BC-A SPLP (mg/l)
SC-A Totals
(mg/kg)
SC-A SPLP (mg/l)
Totals Reporting
Limit (mg/kg)
SPLP Reporting
Limit (mg/kg)
Arsenic 4.07 < 0.02 3.4 < 0.02 2 0.02 Barium 109 < 1 82.9 < 1 2 1
Cadmium 1.48 < 0.005 < 0.5 < 0.005 0.5 0.005 Chromium 19 0.0669 13.5 <0.05 1 0.05
Lead 59.9 < 0.01 20.5 < 0.01 1 0.01 Mercury < 0.04 < 0.002 < 0.04 < 0.002 0.04 0.002 Selenium 1.11 < 0.05 1.1 < 0.05 1 0.05
Silver < 2 < 0.1 < 2 < 0.1 2 0.1
35
SUMMARY
Researchers performed aggregate characterization tests on materials from four crushed
concrete producers located around the state of Texas. Thirty samples were tested for seven
physical properties. Furthermore, chemical analyses using inductive couple plasma technology
were performed on selected samples to test for levels of the eight RCRA metals.
The aggregate characterization program showed that a great deal of variability exists in
crushed concrete material. Crushed concrete fines typically do not meet ASTM C 33 grading
requirements and have absorption and methylene blue values much higher than those of typical
concrete sands. Crushed concrete varies not only from producer to producer but also within a
given stockpile. In cases where a number of samples are taken from the same section of a
stockpile and thoroughly mixed, the material properties can vary considerably. This variation
could be caused by a variety of factors, including, but not limited to, crushing method, type of
concrete crushed, clays and soils introduced during the transportation process, and other
contaminates, such as glass or gypsum from building construction.
The methylene blue values and modified methylene blue values of crushed concrete were
much higher than those of virgin aggregates. Not only does crushed concrete have fines with a
high methylene blue value, it also contains a substantial amount of them. These values are
significantly higher than those of virgin aggregates and indicate that difficulties may be
encountered, especially with regard to water demand, when using crushed concrete fines as
aggregates in concrete mixtures.
The plastic limit of all samples of the crushed concrete fines could not be determined.
Therefore, all samples of crushed concrete fines were classified as non-plastic. Furthermore, the
liquid limit of the crushed concrete fines is well below 40. As a result, all crushed concrete fines
are classified as silt sand based on the Unified Classification System.
The pH measurements showed high alkalinity of CPCC fines. Removal of ultra fine
materials passing the No. 200 sieve helped to reduce the high alkalinity of CPCC fines. The
alkalinity does not necessarily imply any negative impact on the environment. For the
environmental considerations, more specific study is needed on contaminative leachate problems
for applied mixtures.

36
CPCC fines were tested for the presence of RCRA metals through totals testing
employing ICP technology. In addition, chemical mobility tests, performed following the SPLP
procedure, were performed. The tests for RCRA total contents showed that the CPCC fines
contain higher levels of RCRA metals than typical virgin and manufactured sands. However,
when two samples were tested to assess these metals’ ability to leach, the levels detected in 15 of
the 16 cases were below the detectability limits of the test. These values are substantially lower
than the present Environmental Protection Agency values for TCLP. Similar values for the
SPLP test were unavailable to the researchers. In the single case where levels were detectable,
they barely exceeded the detectability limits of the test. Thus, although measurable amounts of
heavy metals may exist in CPCC fines, the leaching characteristics of these metals are more
important than the presence of the metals in the sample.
37
CHAPTER 4. PAVING APPLICATIONS
This chapter describes the laboratory test program performed to characterize mixture
properties associated with selected paving applications: flexible base, cement treated base, and
hot mix asphalt bond breaker. Applied test methods and the results of the tests are included. The
test program for each application area was established with considerations of desired field
performances with regard to the development of specifications.
FLEXIBLE BASE
Flexible base is currently covered under TxDOT Item 247. The applicability of crushed
concrete materials to flexible base mixtures was investigated through a laboratory test program.
Flexible base mixtures consisting of 100 percent crushed concrete materials were characterized
in terms of strength and durability. The mixture properties were compared with those of
conventional crushed limestone aggregate base mixtures. Procedures of applied tests and
findings from them are discussed below.
Test Program
Item 247 specifies five different classes of mixtures and corresponding requirements on
the physical properties of aggregates and resulting mixtures. Mixtures of class 3 through class 5
are required to meet the grading and physical properties of aggregate criteria such as liquid limit
(LL) and plastic index (PI) limits. In addition to these requirements, strength criteria are
imposed for the mixtures of class 1 and class 2. Required minimum compressive strengths (Test
Method Tex-117-E) are 35 to 45 psi without confining pressure and 175 psi with 15 psi of lateral
confining pressure.
Preliminary tests on aggregates showed that the properties of crushed concrete materials
meet the imposed requirements on the physical aggregate properties. These results may be
interpreted such that recycled concrete materials can be used in any of the lower class flexible
base mixtures as long as aggregate grading conforms to the specifications. However, further
38
investigations on the mixture properties, including strength, are required to assure the use of
crushed concrete materials to all classes of flexible base mixtures. Another concern exists with
respect to the durability of mixtures containing the highly absorptive crushed concrete materials.
As a consequence, a test program has been designed to address the strength and durability of the
mixtures. The test program relative to flexible base applications includes:
� Texas Triaxial Strength Test, and
� Tube Suction Test (TST).
The triaxial test is a standardized test (Test Method Tex-117-E) to evaluate the
performance of flexible base mixtures in terms of strength. The tube suction test is a simplified
method for estimating a mixture’s moisture susceptibility. A standard test method for TST does
not yet exist, and the test method recommended by Scullion and Saarenketo (37) was employed in
this project. TST gives a relative property on the moisture-related durability of mixtures with
simple measurements of dielectric values at the surface of the test sample. Detailed descriptions
on tests and corresponding results are given in the following sections.
Test Variable
Researchers selected only one variable, the content of soil binders (passing No. 40
materials), for the test of mixtures for flexible base application. The main objective of the tests
was to investigate the general engineering properties of base mixtures consisting of crushed
concrete materials. Since crushed concrete materials are known to be highly variable in
aggregate quality, the variability in a given field condition was considered in determining the test
variable.
Field variability for a given stockpile would be mainly manifested by the localized
variations in aggregate proportion and size distribution. Contents of materials passing the No. 40
and No. 200 sieves particularly affect the resulting properties of a mixture. Preliminary studies
on size distribution of crushed concrete materials showed that there is a proportional relation
between the contents of these size fractions. Based on these observations, the content of
materials passing the No. 40 sieve was selected as a test variable.

39
Two levels of passing No. 40 materials’ contents were applied for each aggregate source
(crushed concrete and crushed limestone). The application levels were selected within the ranges
found from the measured size distribution. Applied low and high levels were 22 and 42 percent,
respectively, of total aggregate by weight. This combination results in four different test mixes
in total, as shown in Table 4.1.
Table 4.1. Test Mix Combinations for Flexible Base Mixtures.
Test Variables Designation
Aggregate Source Level of Passing No. 40
1. RC-Fine Mix High (42%)
2. RC-Coarse Mix Recycled Concrete (RC)
Low (22%)
3. CL-Fine Mix High (42%)
4. CL-coarse Mix Crushed Limestone(CL)
Low (22%)
Materials
Test mixtures for flexible base applications contained 100 percent recycled concrete
materials, including from the 1-3/4 inches to –No. 200 materials. Conventional crushed
limestone base mixtures with the same aggregate size were also tested for comparison. The
previous chapter presented relevant aggregate properties. Aggregates coarser than 1-3/4 inches
were sieved out from raw materials in order to facilitate making laboratory size test samples.
Aggregate Proportioning
Aggregate gradations for test mixes conform to the grading requirements for Item 247.
Proportions of each size of aggregate were kept constant, except fine materials passing the
No. 40 sieve. Table 4.2 shows aggregate mix proportioning of the test mixes. Corresponding
gradation curves are given with the ranges of specifications in Figure 4.1.
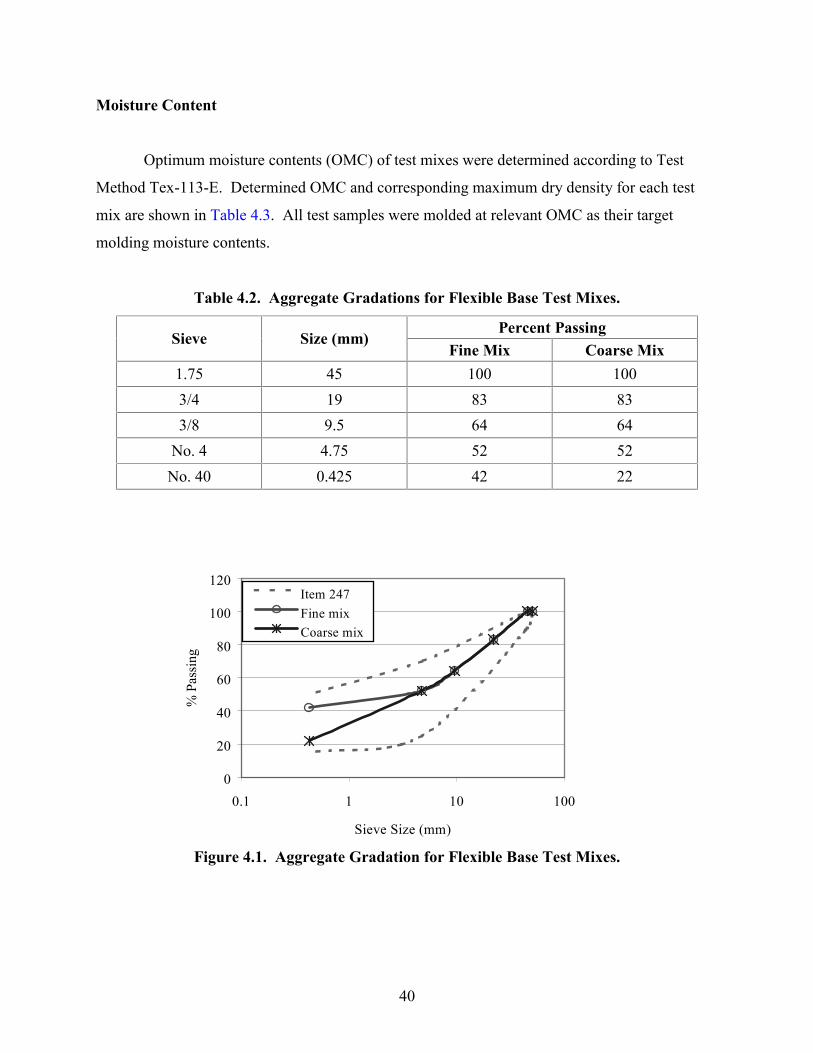
40
Moisture Content
Optimum moisture contents (OMC) of test mixes were determined according to Test
Method Tex-113-E. Determined OMC and corresponding maximum dry density for each test
mix are shown in Table 4.3. All test samples were molded at relevant OMC as their target
molding moisture contents.
Table 4.2. Aggregate Gradations for Flexible Base Test Mixes.
Percent Passing Sieve Size (mm)
Fine Mix Coarse Mix 1.75 45 100 100 3/4 19 83 83 3/8 9.5 64 64
No. 4 4.75 52 52 No. 40 0.425 42 22
Figure 4.1. Aggregate Gradation for Flexible Base Test Mixes.
0
20
40
60
80
100
120
0.1 1 10 100
Sieve Size (mm)
% P
assi
ng
Item 247Fine mixCoarse mix

41
Table 4.3. Determined OMC and Maximum Dry Density for Each Flexible Base Test Mix.
Aggregate Mix OMC (%) Max. Dry Density (lb/inch3)
1. RC Fine Mix 11.0 131.2 Recycled Concrete
2. RC Coarse Mix 10.5 132.5
3. CL Fine Mix 7.0 142.7 Crushed Limestone
4. CL Coarse Mix 6.5 143.0
Texas Triaxial Test
Triaxial strength tests were conducted according to the accelerated method (Tex-117-E,
Part II). Six 6�8-inch cylinder samples were prepared for each of four test mix combinations
(see Table 4.1). For each test mix, three samples were tested without lateral pressure, and the
other three were tested with 15 psi of lateral confining pressure. Samples are molded in
accordance with Test Method Tex-113-E. It was intended to mold the samples at the OMC and
maximum density of each mix. Sample density was measured right after molding, and the
moisture content was measured with a broken sample after the test. Table 4.4 shows the
measured average sample moisture content and density of each test mix with targeted OMC and
maximum density. While the measured sample densities are close to the intended values,
moisture contents show some difference between target value and molded samples. From the
sample density measurements, it can be assumed that the samples were molded at or near target
molding moisture condition. The difference in moisture contents can be explained by the
moisture migration that occurred during the process of sample preparation. The test procedure
requires samples to be subjected overnight to moisture capillarity before testing. During this
process, samples soak up water through porous stone, and the sample moisture content at testing
could be higher than OMC. The increase of moisture content will depend on the material and
structure of the mixture. The results shown in Table 4.4 indicate that mixtures including
recycled concrete materials with high fine content are most absorptive. In general, recycled
concrete mixtures are more absorptive than crushed limestone mixtures, and, as expected, the
higher the fine contents the more absorptive the mixture regardless of the type of aggregate.
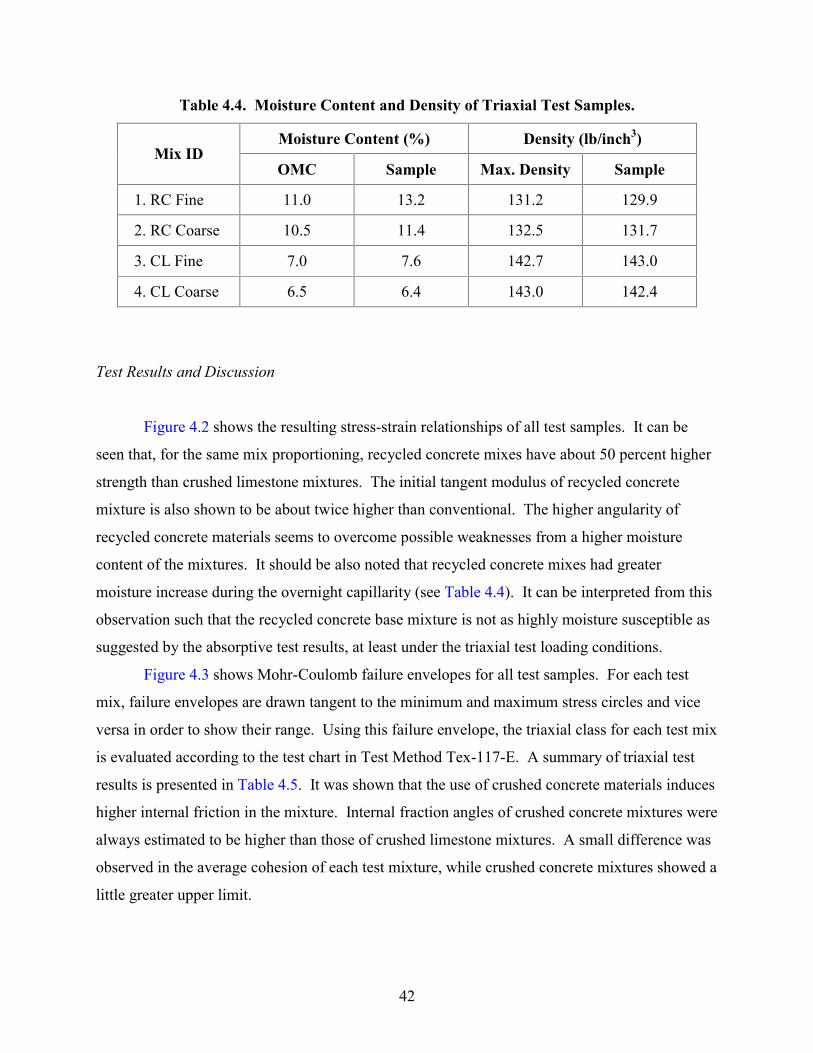
42
Table 4.4. Moisture Content and Density of Triaxial Test Samples.
Moisture Content (%) Density (lb/inch3) Mix ID
OMC Sample Max. Density Sample
1. RC Fine 11.0 13.2 131.2 129.9
2. RC Coarse 10.5 11.4 132.5 131.7
3. CL Fine 7.0 7.6 142.7 143.0
4. CL Coarse 6.5 6.4 143.0 142.4
Test Results and Discussion
Figure 4.2 shows the resulting stress-strain relationships of all test samples. It can be
seen that, for the same mix proportioning, recycled concrete mixes have about 50 percent higher
strength than crushed limestone mixtures. The initial tangent modulus of recycled concrete
mixture is also shown to be about twice higher than conventional. The higher angularity of
recycled concrete materials seems to overcome possible weaknesses from a higher moisture
content of the mixtures. It should be also noted that recycled concrete mixes had greater
moisture increase during the overnight capillarity (see Table 4.4). It can be interpreted from this
observation such that the recycled concrete base mixture is not as highly moisture susceptible as
suggested by the absorptive test results, at least under the triaxial test loading conditions.
Figure 4.3 shows Mohr-Coulomb failure envelopes for all test samples. For each test
mix, failure envelopes are drawn tangent to the minimum and maximum stress circles and vice
versa in order to show their range. Using this failure envelope, the triaxial class for each test mix
is evaluated according to the test chart in Test Method Tex-117-E. A summary of triaxial test
results is presented in Table 4.5. It was shown that the use of crushed concrete materials induces
higher internal friction in the mixture. Internal fraction angles of crushed concrete mixtures were
always estimated to be higher than those of crushed limestone mixtures. A small difference was
observed in the average cohesion of each test mixture, while crushed concrete mixtures showed a
little greater upper limit.
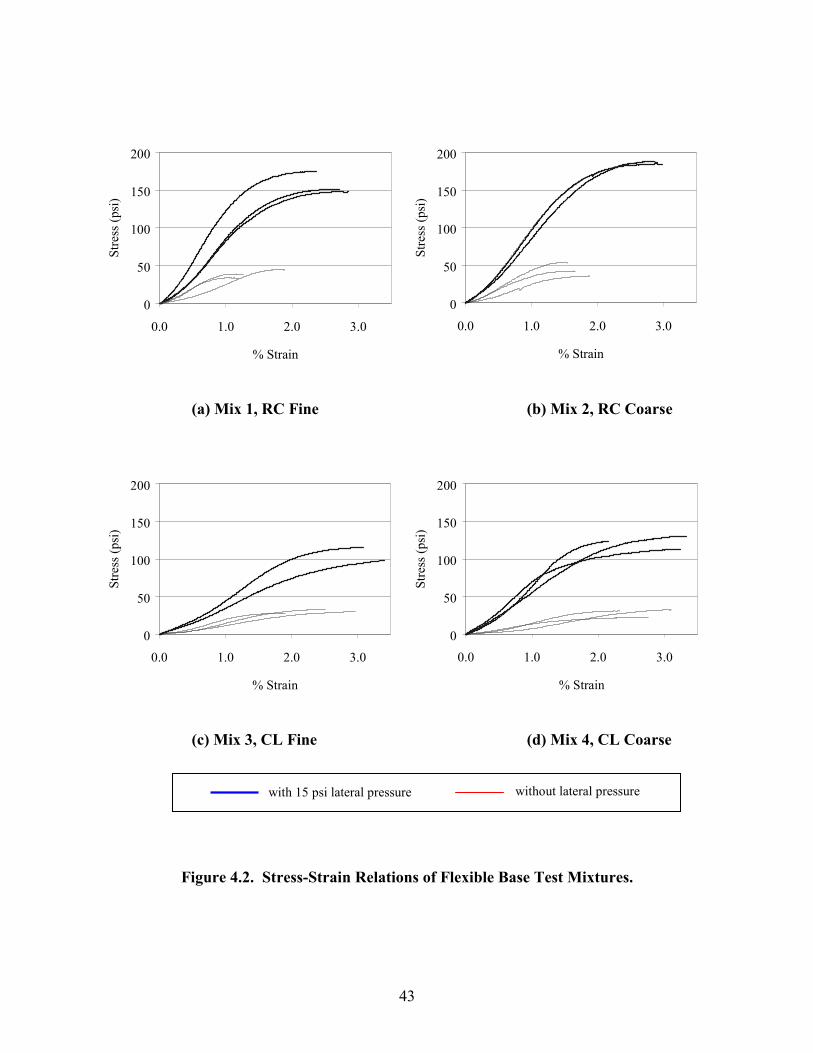
43
(a) Mix 1, RC Fine (b) Mix 2, RC Coarse
(c) Mix 3, CL Fine (d) Mix 4, CL Coarse
Figure 4.2. Stress-Strain Relations of Flexible Base Test Mixtures.
0
50
100
150
200
0.0 1.0 2.0 3.0
% Strain
Stre
ss (p
si)
0
50
100
150
200
0.0 1.0 2.0 3.0
% Strain
Stre
ss (p
si)
0
50
100
150
200
0.0 1.0 2.0 3.0
% Strain
Stre
ss (p
si)
0
50
100
150
200
0.0 1.0 2.0 3.0
% Strain
Stre
ss (p
si)
with 15 psi lateral pressure without lateral pressure
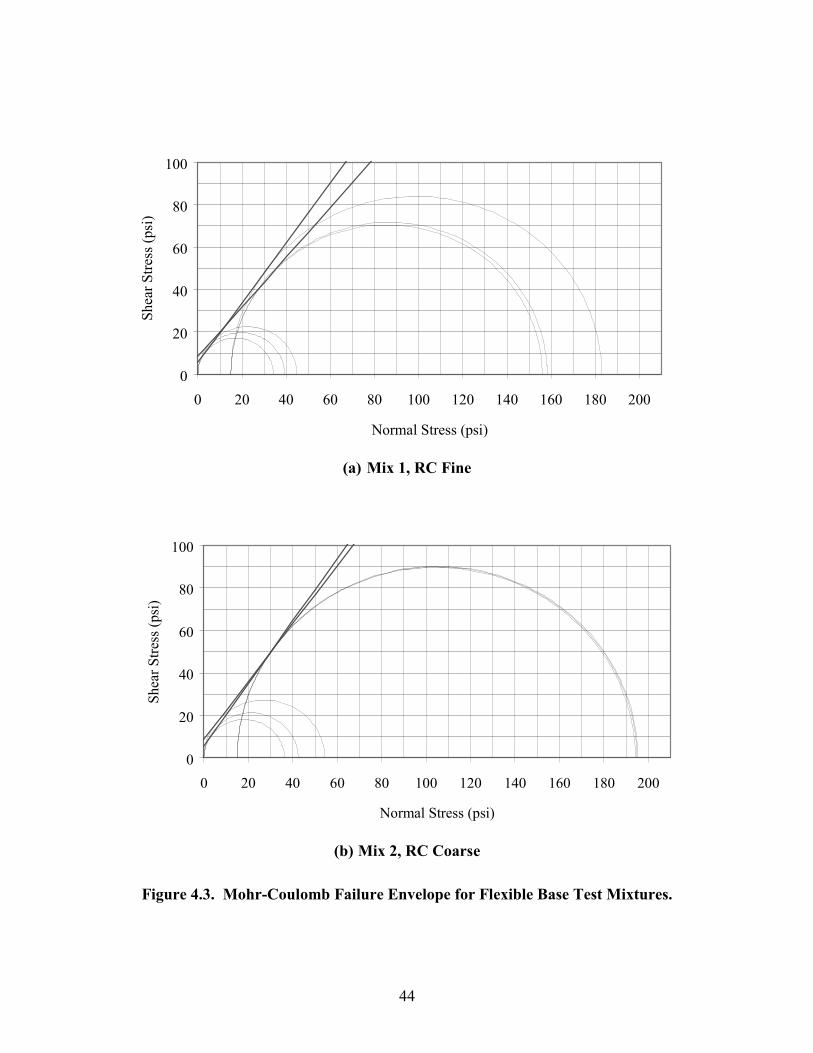
44
(a) Mix 1, RC Fine
(b) Mix 2, RC Coarse
Figure 4.3. Mohr-Coulomb Failure Envelope for Flexible Base Test Mixtures.
0
20
40
60
80
100
0 20 40 60 80 100 120 140 160 180 200
Normal Stress (psi)
Shea
r Stre
ss (p
si)
0
20
40
60
80
100
0 20 40 60 80 100 120 140 160 180 200
Normal Stress (psi)
Shea
r Stre
ss (p
si)
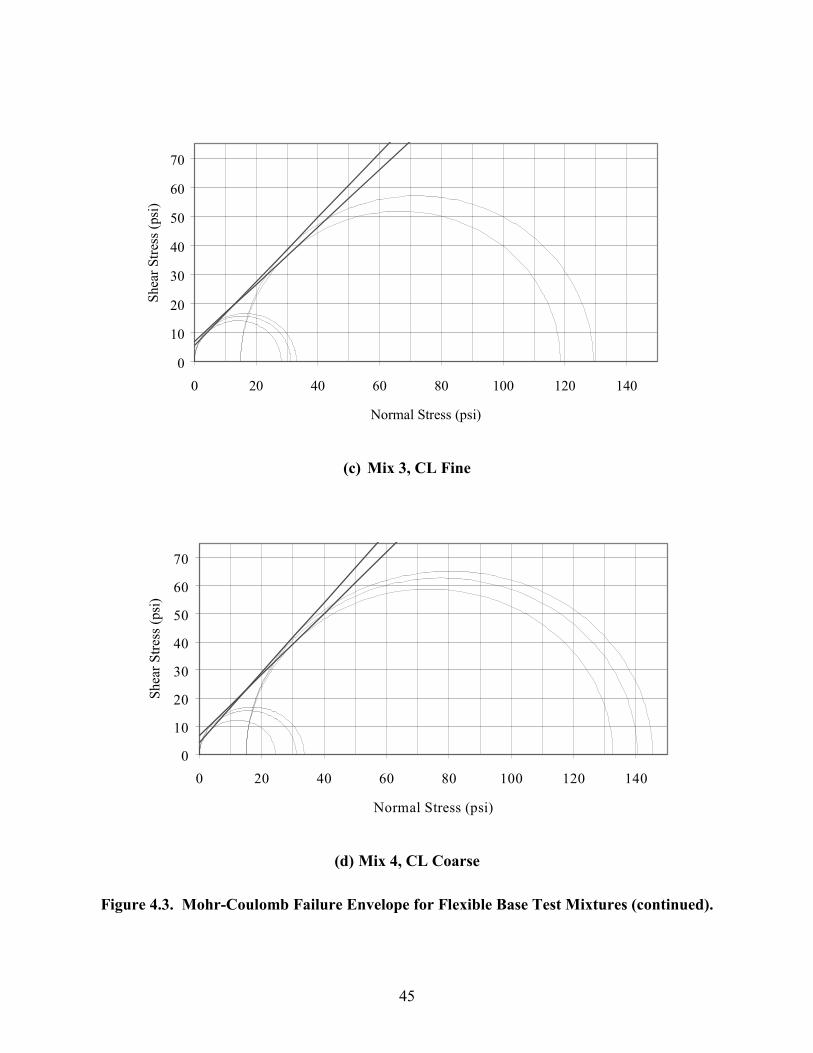
45
(c) Mix 3, CL Fine
(d) Mix 4, CL Coarse
Figure 4.3. Mohr-Coulomb Failure Envelope for Flexible Base Test Mixtures (continued).
0
10
20
30
40
50
60
70
0 20 40 60 80 100 120 140
Normal Stress (psi)
Shea
r Stre
ss (p
si)
0
10
20
30
40
50
60
70
0 20 40 60 80 100 120 140
Normal Stress (psi)
Shea
r Stre
ss (p
si)

46
Table 4.5. Summary of Triaxial Test Results.
Mix ID
1. RC Fine 2. RC Coarse 3. CL Fine 4. CL Coarse
σ3* = 0 psi 39.4 44.4 30.8 29.4 Normal
Strength (psi) σ3 = 15 psi 165.7 194.8 123.9 139.5
σ3 = 0 psi 19.7 21.2 15.4 14.8 Shear Strength
(psi) σ3 = 15 psi 75.3 89.9 54.5 62.2
Cohesion (psi) 5.4-8.2 5.6-8.9 5.4-6.9 4.3-6.5
Internal Friction Angle (deg) 49.7-54.8 53.7-55.9 44.5-47.9 47.4-51.2
Triaxial Class 2.6-2.7 2.2-2.5 3.1-3.2 3.0-3.1
* σ3 = Lateral Confining Pressure
Listed normal and shear strengths are the average value of three samples for each test
mix. Note that the minimum requirements for normal strength in the TxDOT specifications are
35 psi without lateral confining pressure and 175 psi with 15 psi confining pressure. Test results
indicate that the strength of recycled concrete mixtures satisfy, for the most part, these
requirements. Referring to Figure 4.3, measured compressive strength of all six samples for test
mix #2 (coarse mix with crushed concrete) exceeded these requirements. The test results
indicate that crushed concrete materials can be applied to any specified flexible base mix under
the current specifications with proper selection of mix proportioning. On the other hand, crushed
limestone used in this project is not suitable for class 1 or class 2 applications.
Tube Suction Test
A test set up for the tube suction test is illustrated in Figure 4.4. Because a standard test
method is not yet available, the test method recommended by Scullion and Saarenketo was
applied in this project, with a small modification.(37) TST involves monitoring of dielectric
values at the surface of a cylinder sample that is partly submerged at the bottom. The surface
dielectric value normally increases with time due to capillary rise. The rate of increase and its
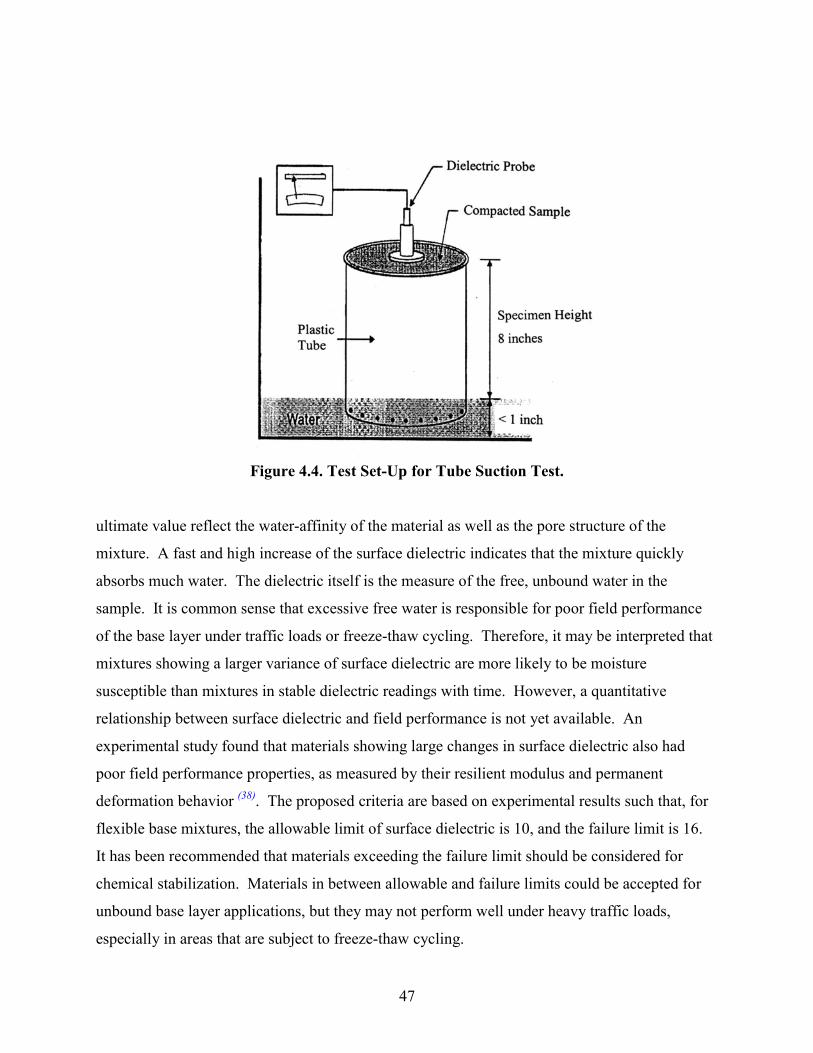
47
Figure 4.4. Test Set-Up for Tube Suction Test.
ultimate value reflect the water-affinity of the material as well as the pore structure of the
mixture. A fast and high increase of the surface dielectric indicates that the mixture quickly
absorbs much water. The dielectric itself is the measure of the free, unbound water in the
sample. It is common sense that excessive free water is responsible for poor field performance
of the base layer under traffic loads or freeze-thaw cycling. Therefore, it may be interpreted that
mixtures showing a larger variance of surface dielectric are more likely to be moisture
susceptible than mixtures in stable dielectric readings with time. However, a quantitative
relationship between surface dielectric and field performance is not yet available. An
experimental study found that materials showing large changes in surface dielectric also had
poor field performance properties, as measured by their resilient modulus and permanent
deformation behavior (38). The proposed criteria are based on experimental results such that, for
flexible base mixtures, the allowable limit of surface dielectric is 10, and the failure limit is 16.
It has been recommended that materials exceeding the failure limit should be considered for
chemical stabilization. Materials in between allowable and failure limits could be accepted for
unbound base layer applications, but they may not perform well under heavy traffic loads,
especially in areas that are subject to freeze-thaw cycling.
48
However, it should be noted that recycled concrete materials were not included in the
experiments. Therefore, the proposed criteria may not be relevant for the mixtures containing
recycled concrete materials.
Samples were compacted in accordance with test method Tex-113-E in a φ6H8-inch
plastic cylinder mold, which is normally used for making concrete cylinders. Four cylinders, one
for each test mix, were prepared with the same mix design that was used for the triaxial tests. It
was intended to mold the samples at the optimum moisture content. The bottom of the mold is
closed, and a series of small diameter holes are drilled around the side, near the bottom. Water
flows into the sample through these holes. Compacted cylinder molds were dried in a 104°F
room for 3 days, and then the initial moisture content was checked by weight change from the
time of molding, assuming the samples were molded exactly at OMC. Drying is allowed only
through the top surface of the mold. Afterwards, the samples were placed in a pan containing
water of at most a 1-inch depth. Capillary rise in the sample was monitored for 10 days at the
top surface with a dielectric probe. The final moisture contents of samples were measured after
the tests.
Test Results and Discussion
Results of the tests are summarized in Table 4.6. The initial dielectric was measured
right after the dried samples were put into the water container. The final value was measured at
the end of 10 days of monitoring. Transient dielectric values between the initial and final state
are shown in Figure 4.5. Recall that the proposed criteria for the final surface dielectric are 10
for the allowable limit and 16 for the failure limit (38). Under these criteria, recycled concrete
mixtures are not suitable for unbound flexible base applications. However, as previously noted,
the proposed criteria are not directly applicable to recycled concrete materials. Consideration
needs to be given to shape and texture characteristics.
The triaxial test results described in the previous section indicate that higher moisture
requirements over the OMC would not be very detrimental to the strength properties of crushed
concrete mixtures. An interesting result was obtained from a recent study conducted at the Texas
Transportation Institute (39). In that study, unconfined compressive strengths of recycled concrete
mixtures were determined before and after TST. TST resulted in 30.9 as the final dielectric and
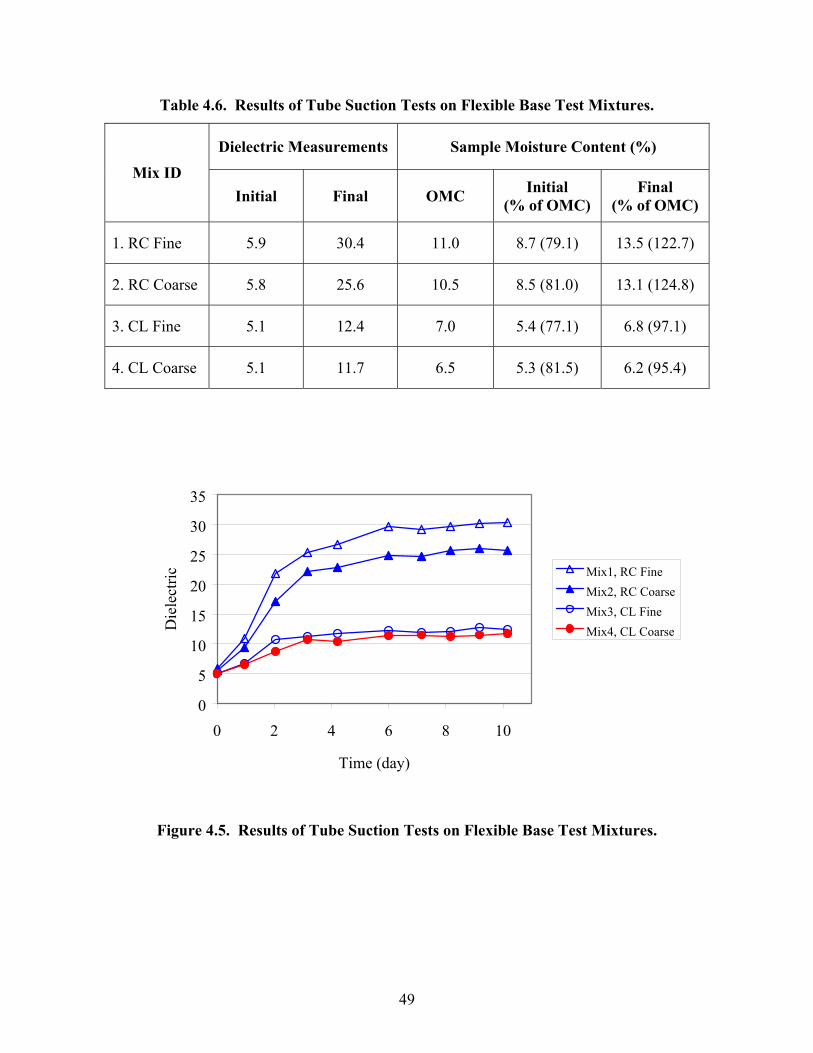
49
Table 4.6. Results of Tube Suction Tests on Flexible Base Test Mixtures.
Dielectric Measurements Sample Moisture Content (%) Mix ID
Initial Final OMC Initial (% of OMC)
Final (% of OMC)
1. RC Fine 5.9 30.4 11.0 8.7 (79.1) 13.5 (122.7)
2. RC Coarse 5.8 25.6 10.5 8.5 (81.0) 13.1 (124.8)
3. CL Fine 5.1 12.4 7.0 5.4 (77.1) 6.8 (97.1)
4. CL Coarse 5.1 11.7 6.5 5.3 (81.5) 6.2 (95.4)
Figure 4.5. Results of Tube Suction Tests on Flexible Base Test Mixtures.
0
5
10
15
20
25
30
35
0 2 4 6 8 10
Time (day)
Die
lect
ric Mix1, RC FineMix2, RC CoarseMix3, CL FineMix4, CL Coarse
50
about a 15 percent increase of sample moisture content compared to the OMC. Interestingly,
however, the sample after TST showed 37 percent higher strength than before TST. More study
is needed on the development of performance criteria for recycled concrete materials with
respect to the surface dielectric measurements.
Also included in Table 4.6 is the change of sample moisture contents during the tests. The initial
moisture content is estimated by the weight of the dried sample. All mixtures showed, after the 3
days of the drying process, about a 20 percent reduction in moisture content compared to OMC,
although recycled concrete mixtures had greater net change in sample weight. The final
moisture content was directly measured from the sample after testing. As expected, recycled
concrete materials are shown to be highly absorptive. While the capillary rise in crushed
limestone resulted in moisture recovery close to the initial moisture content, recycled concrete
mixtures continued to soak up water beyond the initial condition. Measured moisture contents of
recycled concrete samples were more than 20 percent higher than OMC.
Summary
Researchers examined the feasibility of using crushed concrete materials in flexible base
mixtures (Item 247) through selected laboratory tests. Mixtures consisting of crushed concrete
materials were characterized by the Texas triaxial test and tube suction test for the properties
related respectively to strength and moisture susceptibility. Two different mixture gradations,
fine and coarse, were determined so as to produce test mixtures containing 42 percent and
22 percent of materials passing the No. 40 sieve, respectively. The mixture properties were
compared to those of conventional crushed limestone base mixtures. All test mixtures were
compacted at the optimum moisture content. The absorptive nature of crushed concrete
materials required 50 percent higher moisture content to reach OMC.
The strength of crushed concrete mixtures satisfied, for the most part, the strength
requirements of Item 247. Crushed concrete mixtures always showed higher strength than
conventional limestone mixtures, regardless of the higher moisture content. The moisture
content of crushed concrete mixture samples increased from 10 to 20 percent of OMC during the
overnight capillary rise before testing, while limestone mixture samples showed less than a
10 percent increase relative to OMC. Higher angularity of crushed concrete materials resulted in
51
a higher friction angle of the mixture. The triaxial class of crushed concrete mixtures was
determined in the range of 2.2 to 2.7. Although the range is not very wide, coarse mixtures
showed a lower triaxial class at which the mixture can be expected to have better performance in
terms of strength.
It was shown again by TST that the use of crushed concrete materials results in highly
absorptive mixtures. Based on the dielectric measurements, crushed concrete mixtures failed to
meet the currently accepted failure criteria of moisture susceptibility for flexible base materials.
However, the criteria did not cover crushed concrete materials when they were proposed. The
triaxial test results indicated that crushed concrete mixtures are as highly moisture susceptible as
suggested by the absorptive properties. More study is recommended to develop performance
criteria for crushed concrete flexible base mixtures with respect to the moisture susceptibility,
especially under the repeated loading condition.
CEMENT TREATED BASE
Literature and existing practical experience indicate that cement treated base is one of the
most promising applications for the use of recycled concrete materials in the paving area. CTB
is currently covered under TxDOT Item 276. Researchers investigated the applicability of
crushed concrete materials to CTB through a laboratory test program.
Test Program
The effect of cement hardening is expected to compensate the possible weakness in terms
of durability, which may result from the use of recycled concrete materials. On the other hand,
cement treatment may aggravate drying shrinkage of the mixture and cause a concern for the
early age shrinkage cracking in the layer. The growth of shrinkage cracks to unacceptable wide
ones may bring a premature failure of a pavement structure. Therefore, the main focus in CTB
applications particularly points to the drying shrinkage and shrinkage cracking behavior of the
mixtures. Relevant aggregate and mixture properties were evaluated through a laboratory test
program. One more concern of CTB application is moisture-related durability of applied
mixtures. Some experiences have indicated that moisture ingress or cycling in the CTB layer
52
may cause significant loss of serviceability of the pavement structure. Like the flexible base
mixtures, the tube suction test was performed on the CTB test mixtures. The test program in the
study of CTB applications includes:
tests for compressive strength and elastic modulus,
free shrinkage measurements,
stress relaxation tests,
restrained shrinkage ring tests, and
tube suction tests.
Measurements of elastic properties and linear free shrinkage provide parameters
associated with material behavior for predicting shrinkage cracking of CTB mixtures. Free
shrinkage represents a mixture’s tendency to shrink when it is drying. When a CTB layer is
restrained against the free shrinkage, shrinkage strain and stress develop. The degree of stress
development under a given strain condition depends on the stiffness of the material. When the
developed stress becomes greater than the material’s resistance to cracking, the shrinkage crack
will start to propagate. It should be noted that shrinkage cracking is time dependent. The
strength increases with time so that the probability of cracking reduces. On the other hand, the
modulus of elasticity also increases with time so that the stress at a given strain becomes larger.
Furthermore, stress relaxation occurs under the sustained action of restrained shrinkage, and it is
especially significant at the early ages of cement based mixtures. These time dependent material
properties were evaluated for both crushed concrete and crushed limestone test mixtures and
compared to each other so as to estimate the shrinkage cracking potential of the CTB mixtures.
Test Variables
It was intended to include as many parameters as possible that are anticipated to have
large effects on the produced mixture behavior. Within the limitations of resources, researchers
selected the following three mix parameters as test variables. These variables are expected to be
the most influencing parameters on the mixture behavior:
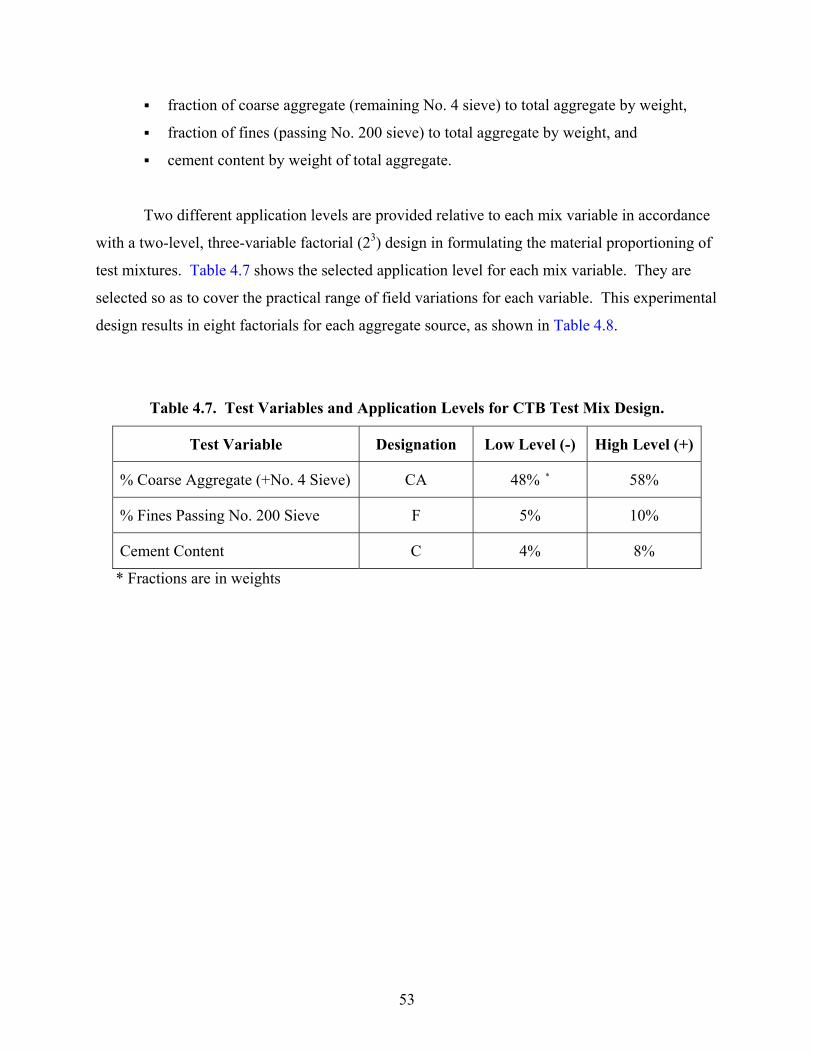
53
fraction of coarse aggregate (remaining No. 4 sieve) to total aggregate by weight,
fraction of fines (passing No. 200 sieve) to total aggregate by weight, and
cement content by weight of total aggregate.
Two different application levels are provided relative to each mix variable in accordance
with a two-level, three-variable factorial (23) design in formulating the material proportioning of
test mixtures. Table 4.7 shows the selected application level for each mix variable. They are
selected so as to cover the practical range of field variations for each variable. This experimental
design results in eight factorials for each aggregate source, as shown in Table 4.8.
Table 4.7. Test Variables and Application Levels for CTB Test Mix Design.
Test Variable Designation Low Level (-) High Level (+)
% Coarse Aggregate (+No. 4 Sieve) CA 48% * 58%
% Fines Passing No. 200 Sieve F 5% 10%
Cement Content C 4% 8%
* Fractions are in weights
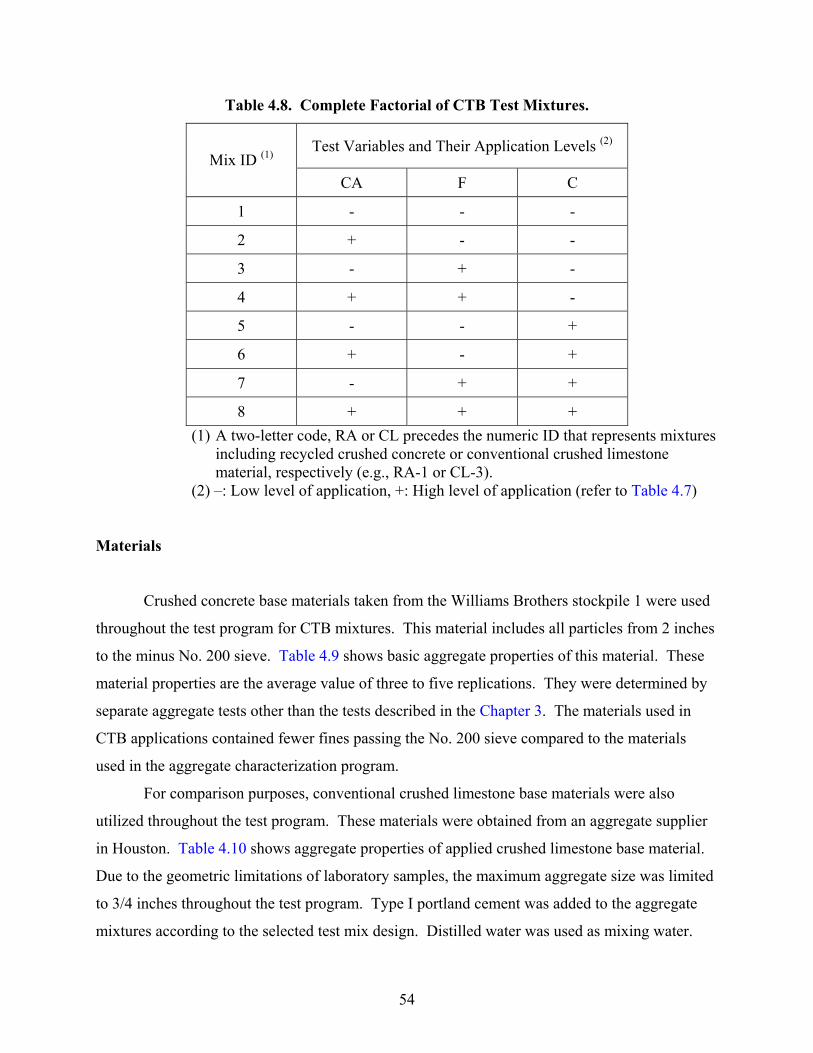
54
Table 4.8. Complete Factorial of CTB Test Mixtures.
Test Variables and Their Application Levels (2) Mix ID (1)
CA F C
1 - - -
2 + - -
3 - + -
4 + + -
5 - - +
6 + - +
7 - + +
8 + + + (1) A two-letter code, RA or CL precedes the numeric ID that represents mixtures
including recycled crushed concrete or conventional crushed limestone material, respectively (e.g., RA-1 or CL-3).
(2) –: Low level of application, +: High level of application (refer to Table 4.7)
Materials
Crushed concrete base materials taken from the Williams Brothers stockpile 1 were used
throughout the test program for CTB mixtures. This material includes all particles from 2 inches
to the minus No. 200 sieve. Table 4.9 shows basic aggregate properties of this material. These
material properties are the average value of three to five replications. They were determined by
separate aggregate tests other than the tests described in the Chapter 3. The materials used in
CTB applications contained fewer fines passing the No. 200 sieve compared to the materials
used in the aggregate characterization program.
For comparison purposes, conventional crushed limestone base materials were also
utilized throughout the test program. These materials were obtained from an aggregate supplier
in Houston. Table 4.10 shows aggregate properties of applied crushed limestone base material.
Due to the geometric limitations of laboratory samples, the maximum aggregate size was limited
to 3/4 inches throughout the test program. Type I portland cement was added to the aggregate
mixtures according to the selected test mix design. Distilled water was used as mixing water.
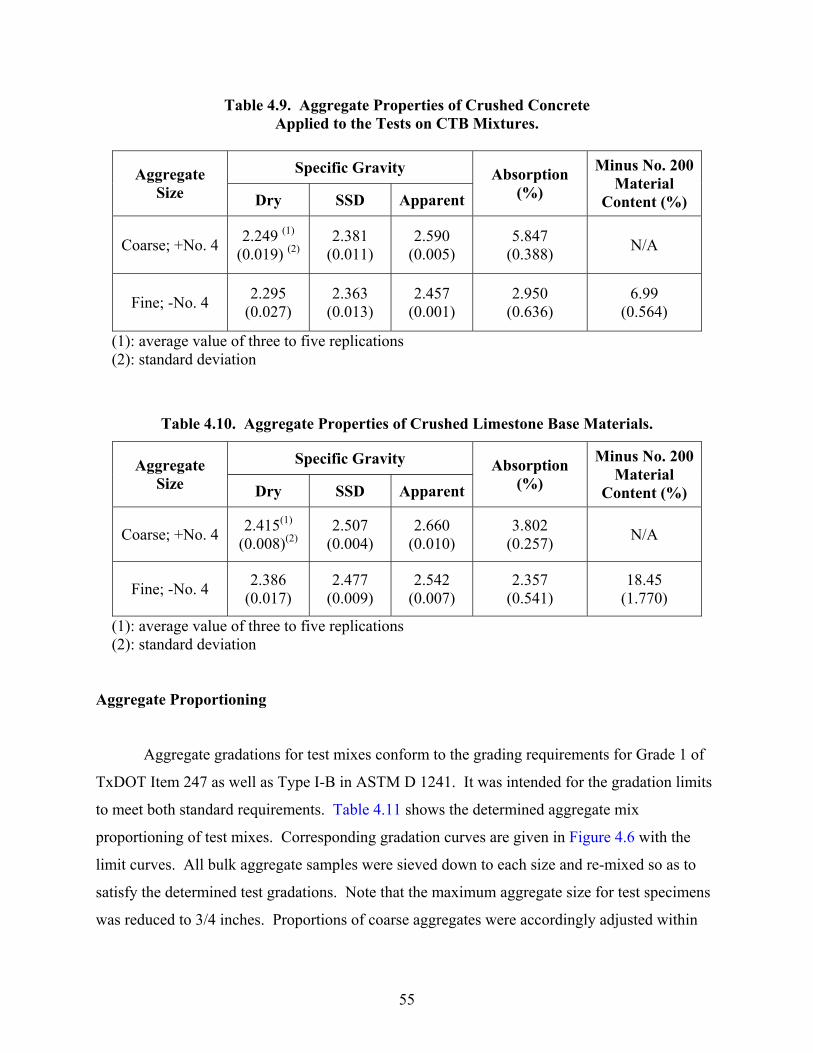
55
Table 4.9. Aggregate Properties of Crushed Concrete Applied to the Tests on CTB Mixtures.
Specific Gravity Aggregate
Size Dry SSD ApparentAbsorption
(%)
Minus No. 200 Material
Content (%)
Coarse; +No. 4 2.249 (1) (0.019) (2)
2.381 (0.011)
2.590 (0.005)
5.847 (0.388) N/A
Fine; -No. 4 2.295 (0.027)
2.363 (0.013)
2.457 (0.001)
2.950 (0.636)
6.99 (0.564)
(1): average value of three to five replications (2): standard deviation
Table 4.10. Aggregate Properties of Crushed Limestone Base Materials.
Specific Gravity Aggregate Size Dry SSD Apparent
Absorption (%)
Minus No. 200 Material
Content (%)
Coarse; +No. 4 2.415(1) (0.008)(2)
2.507 (0.004)
2.660 (0.010)
3.802 (0.257) N/A
Fine; -No. 4 2.386 (0.017)
2.477 (0.009)
2.542 (0.007)
2.357 (0.541)
18.45 (1.770)
(1): average value of three to five replications (2): standard deviation
Aggregate Proportioning
Aggregate gradations for test mixes conform to the grading requirements for Grade 1 of
TxDOT Item 247 as well as Type I-B in ASTM D 1241. It was intended for the gradation limits
to meet both standard requirements. Table 4.11 shows the determined aggregate mix
proportioning of test mixes. Corresponding gradation curves are given in Figure 4.6 with the
limit curves. All bulk aggregate samples were sieved down to each size and re-mixed so as to
satisfy the determined test gradations. Note that the maximum aggregate size for test specimens
was reduced to 3/4 inches. Proportions of coarse aggregates were accordingly adjusted within
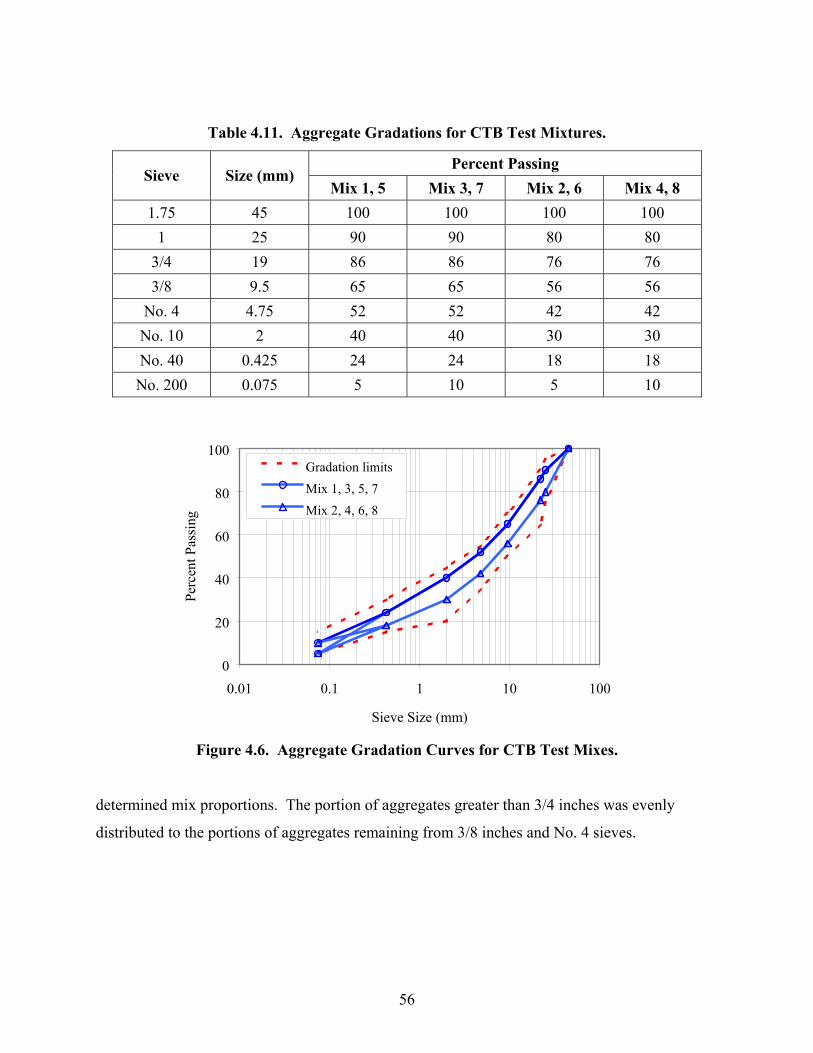
56
Table 4.11. Aggregate Gradations for CTB Test Mixtures.
Percent Passing Sieve Size (mm)
Mix 1, 5 Mix 3, 7 Mix 2, 6 Mix 4, 8 1.75 45 100 100 100 100
1 25 90 90 80 80 3/4 19 86 86 76 76 3/8 9.5 65 65 56 56
No. 4 4.75 52 52 42 42 No. 10 2 40 40 30 30 No. 40 0.425 24 24 18 18 No. 200 0.075 5 10 5 10
Figure 4.6. Aggregate Gradation Curves for CTB Test Mixes.
determined mix proportions. The portion of aggregates greater than 3/4 inches was evenly
distributed to the portions of aggregates remaining from 3/8 inches and No. 4 sieves.
0
20
40
60
80
100
0.01 0.1 1 10 100
Sieve Size (mm)
Perc
ent P
assi
ng
Gradation limitsMix 1, 3, 5, 7Mix 2, 4, 6, 8
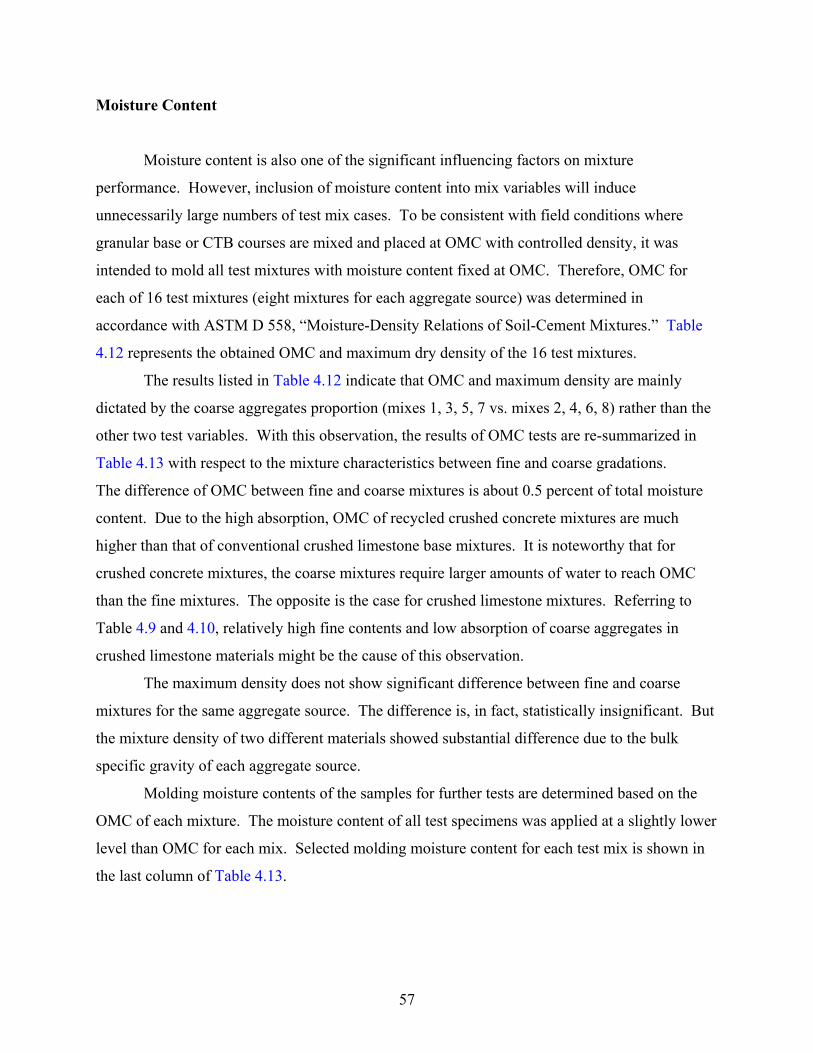
57
Moisture Content
Moisture content is also one of the significant influencing factors on mixture
performance. However, inclusion of moisture content into mix variables will induce
unnecessarily large numbers of test mix cases. To be consistent with field conditions where
granular base or CTB courses are mixed and placed at OMC with controlled density, it was
intended to mold all test mixtures with moisture content fixed at OMC. Therefore, OMC for
each of 16 test mixtures (eight mixtures for each aggregate source) was determined in
accordance with ASTM D 558, “Moisture-Density Relations of Soil-Cement Mixtures.” Table
4.12 represents the obtained OMC and maximum dry density of the 16 test mixtures.
The results listed in Table 4.12 indicate that OMC and maximum density are mainly
dictated by the coarse aggregates proportion (mixes 1, 3, 5, 7 vs. mixes 2, 4, 6, 8) rather than the
other two test variables. With this observation, the results of OMC tests are re-summarized in
Table 4.13 with respect to the mixture characteristics between fine and coarse gradations.
The difference of OMC between fine and coarse mixtures is about 0.5 percent of total moisture
content. Due to the high absorption, OMC of recycled crushed concrete mixtures are much
higher than that of conventional crushed limestone base mixtures. It is noteworthy that for
crushed concrete mixtures, the coarse mixtures require larger amounts of water to reach OMC
than the fine mixtures. The opposite is the case for crushed limestone mixtures. Referring to
Table 4.9 and 4.10, relatively high fine contents and low absorption of coarse aggregates in
crushed limestone materials might be the cause of this observation.
The maximum density does not show significant difference between fine and coarse
mixtures for the same aggregate source. The difference is, in fact, statistically insignificant. But
the mixture density of two different materials showed substantial difference due to the bulk
specific gravity of each aggregate source.
Molding moisture contents of the samples for further tests are determined based on the
OMC of each mixture. The moisture content of all test specimens was applied at a slightly lower
level than OMC for each mix. Selected molding moisture content for each test mix is shown in
the last column of Table 4.13.
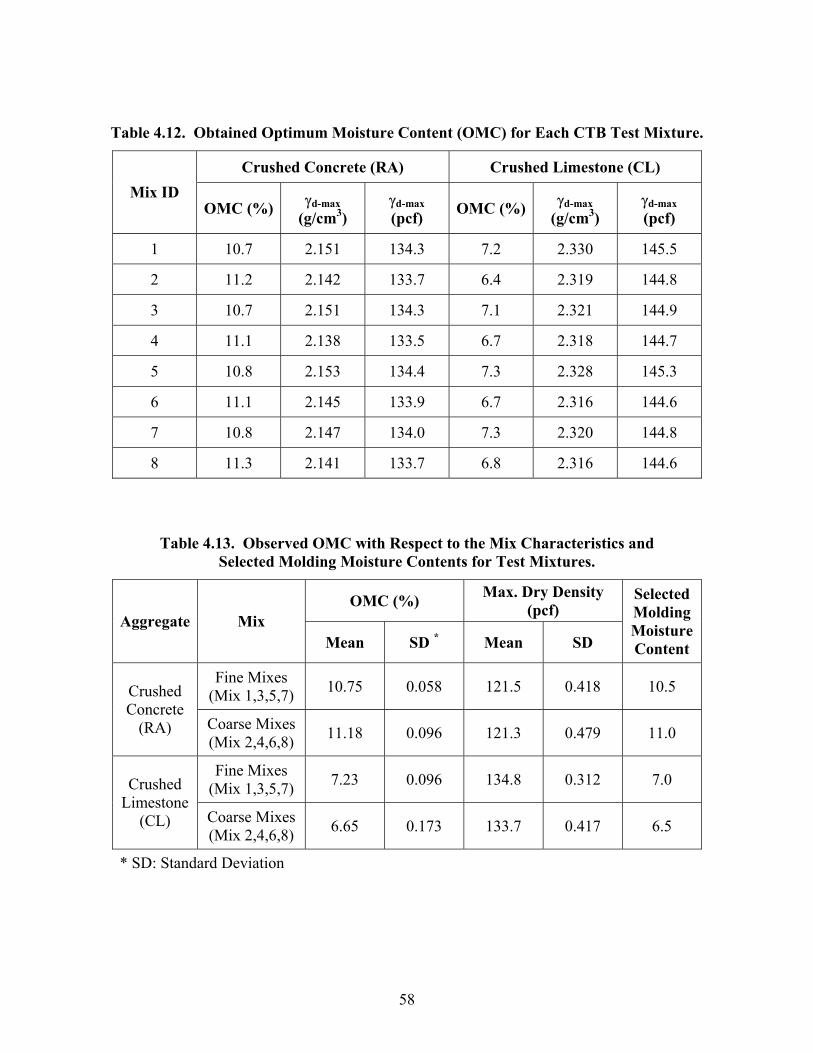
58
Table 4.12. Obtained Optimum Moisture Content (OMC) for Each CTB Test Mixture.
Crushed Concrete (RA) Crushed Limestone (CL) Mix ID
OMC (%) γd-max (g/cm3)
γd-max (pcf) OMC (%) γd-max
(g/cm3) γd-max (pcf)
1 10.7 2.151 134.3 7.2 2.330 145.5
2 11.2 2.142 133.7 6.4 2.319 144.8
3 10.7 2.151 134.3 7.1 2.321 144.9
4 11.1 2.138 133.5 6.7 2.318 144.7
5 10.8 2.153 134.4 7.3 2.328 145.3
6 11.1 2.145 133.9 6.7 2.316 144.6
7 10.8 2.147 134.0 7.3 2.320 144.8
8 11.3 2.141 133.7 6.8 2.316 144.6
Table 4.13. Observed OMC with Respect to the Mix Characteristics and Selected Molding Moisture Contents for Test Mixtures.
OMC (%) Max. Dry Density (pcf)
Aggregate Mix Mean SD * Mean SD
Selected Molding MoistureContent
Fine Mixes (Mix 1,3,5,7) 10.75 0.058 121.5 0.418 10.5 Crushed
Concrete (RA) Coarse Mixes
(Mix 2,4,6,8) 11.18 0.096 121.3 0.479 11.0
Fine Mixes (Mix 1,3,5,7) 7.23 0.096 134.8 0.312 7.0 Crushed
Limestone (CL) Coarse Mixes
(Mix 2,4,6,8) 6.65 0.173 133.7 0.417 6.5
* SD: Standard Deviation
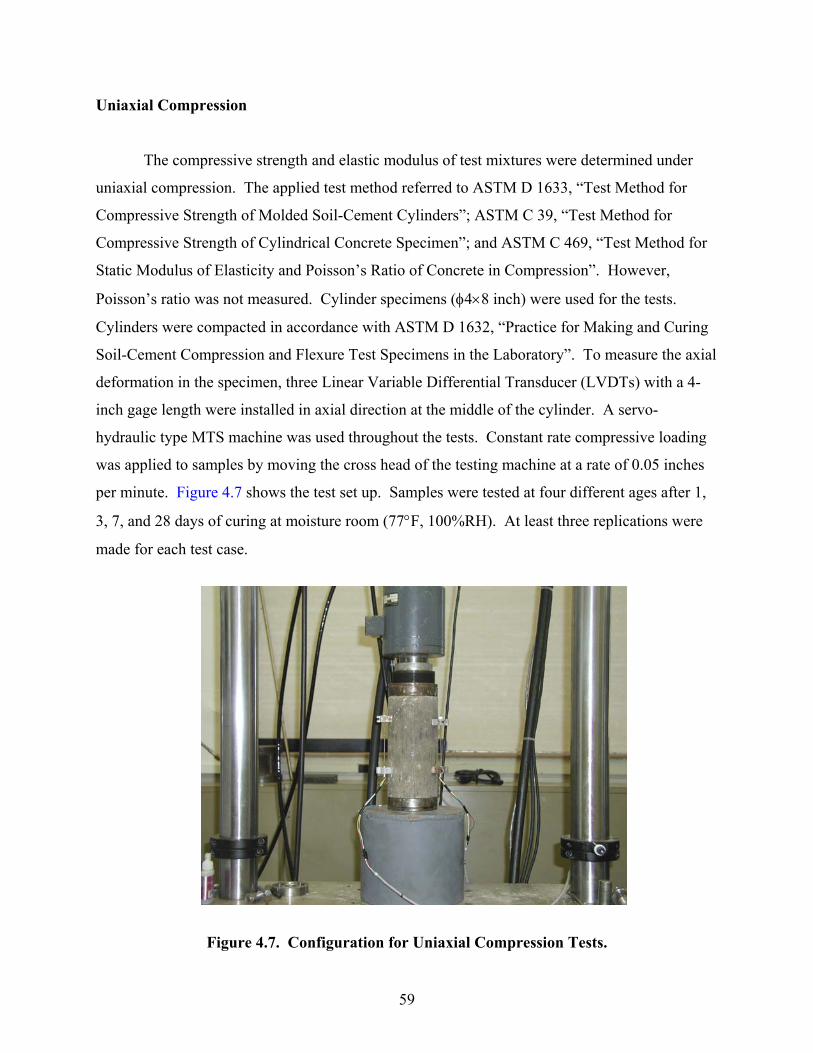
59
Uniaxial Compression
The compressive strength and elastic modulus of test mixtures were determined under
uniaxial compression. The applied test method referred to ASTM D 1633, “Test Method for
Compressive Strength of Molded Soil-Cement Cylinders”; ASTM C 39, “Test Method for
Compressive Strength of Cylindrical Concrete Specimen”; and ASTM C 469, “Test Method for
Static Modulus of Elasticity and Poisson’s Ratio of Concrete in Compression”. However,
Poisson’s ratio was not measured. Cylinder specimens (φ4×8 inch) were used for the tests.
Cylinders were compacted in accordance with ASTM D 1632, “Practice for Making and Curing
Soil-Cement Compression and Flexure Test Specimens in the Laboratory”. To measure the axial
deformation in the specimen, three Linear Variable Differential Transducer (LVDTs) with a 4-
inch gage length were installed in axial direction at the middle of the cylinder. A servo-
hydraulic type MTS machine was used throughout the tests. Constant rate compressive loading
was applied to samples by moving the cross head of the testing machine at a rate of 0.05 inches
per minute. Figure 4.7 shows the test set up. Samples were tested at four different ages after 1,
3, 7, and 28 days of curing at moisture room (77°F, 100%RH). At least three replications were
made for each test case.
Figure 4.7. Configuration for Uniaxial Compression Tests.
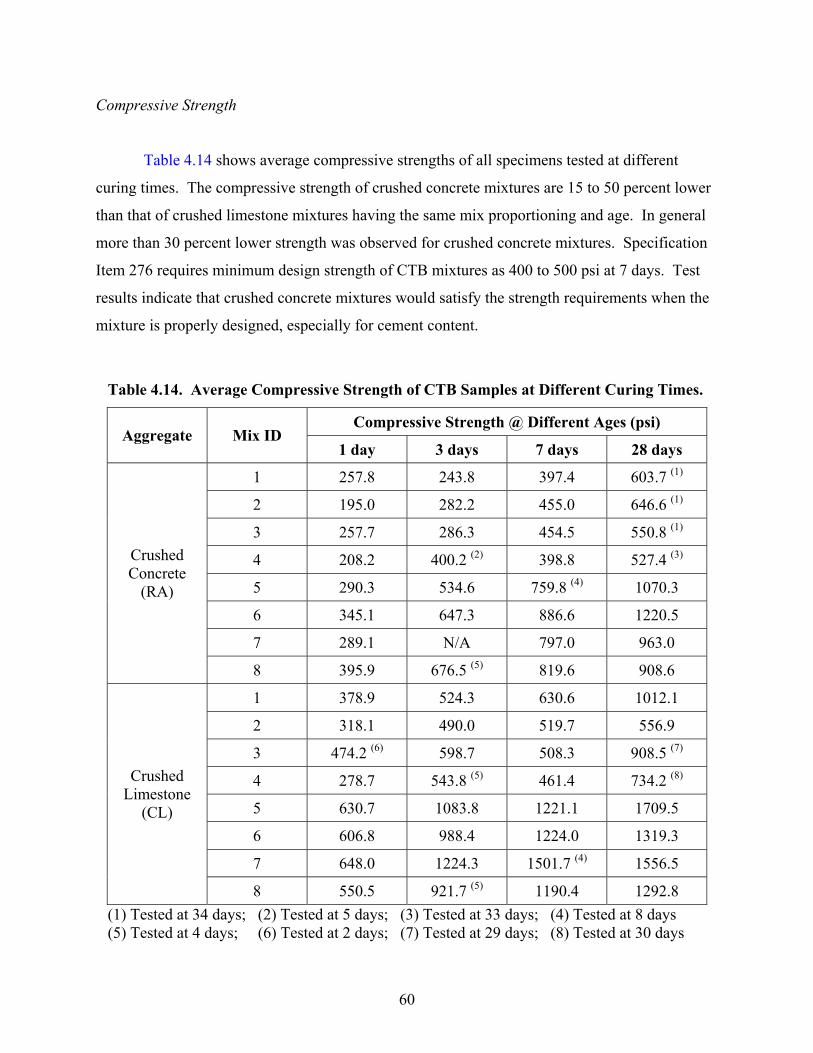
60
Compressive Strength
Table 4.14 shows average compressive strengths of all specimens tested at different
curing times. The compressive strength of crushed concrete mixtures are 15 to 50 percent lower
than that of crushed limestone mixtures having the same mix proportioning and age. In general
more than 30 percent lower strength was observed for crushed concrete mixtures. Specification
Item 276 requires minimum design strength of CTB mixtures as 400 to 500 psi at 7 days. Test
results indicate that crushed concrete mixtures would satisfy the strength requirements when the
mixture is properly designed, especially for cement content.
Table 4.14. Average Compressive Strength of CTB Samples at Different Curing Times.
Compressive Strength @ Different Ages (psi) Aggregate Mix ID
1 day 3 days 7 days 28 days
1 257.8 243.8 397.4 603.7 (1)
2 195.0 282.2 455.0 646.6 (1)
3 257.7 286.3 454.5 550.8 (1)
4 208.2 400.2 (2) 398.8 527.4 (3)
5 290.3 534.6 759.8 (4) 1070.3
6 345.1 647.3 886.6 1220.5
7 289.1 N/A 797.0 963.0
Crushed Concrete
(RA)
8 395.9 676.5 (5) 819.6 908.6
1 378.9 524.3 630.6 1012.1
2 318.1 490.0 519.7 556.9
3 474.2 (6) 598.7 508.3 908.5 (7)
4 278.7 543.8 (5) 461.4 734.2 (8)
5 630.7 1083.8 1221.1 1709.5
6 606.8 988.4 1224.0 1319.3
7 648.0 1224.3 1501.7 (4) 1556.5
Crushed Limestone
(CL)
8 550.5 921.7 (5) 1190.4 1292.8 (1) Tested at 34 days; (2) Tested at 5 days; (3) Tested at 33 days; (4) Tested at 8 days (5) Tested at 4 days; (6) Tested at 2 days; (7) Tested at 29 days; (8) Tested at 30 days
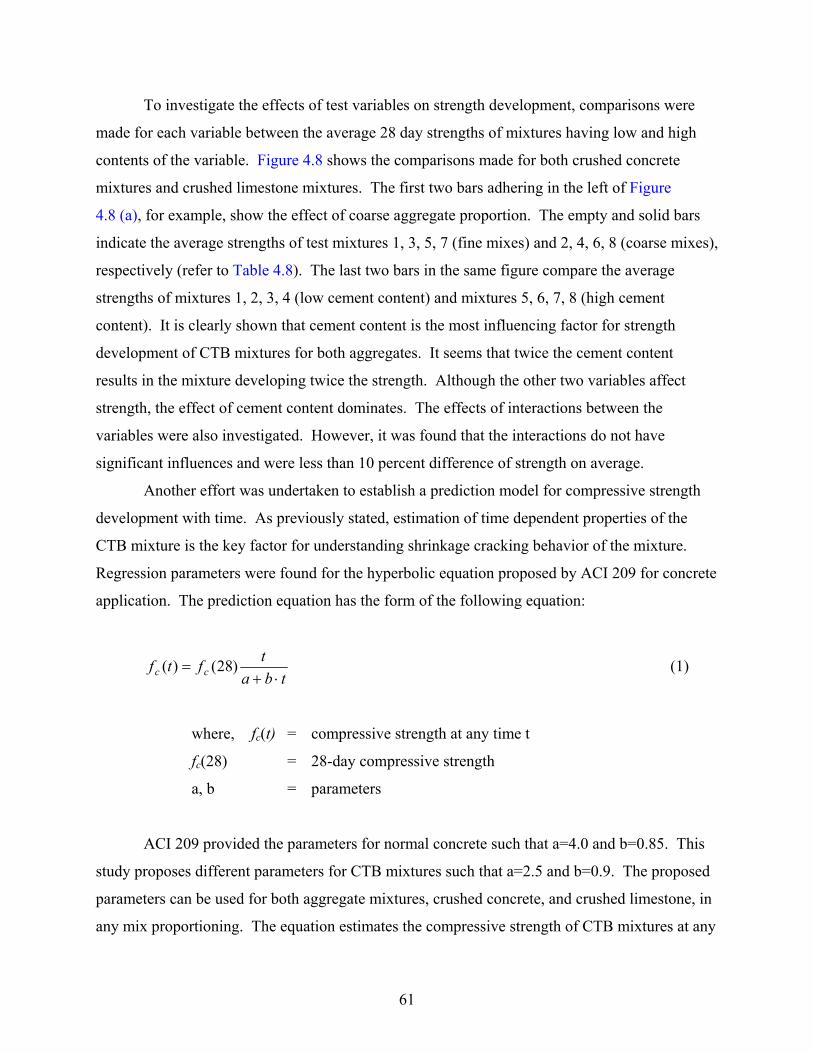
61
To investigate the effects of test variables on strength development, comparisons were
made for each variable between the average 28 day strengths of mixtures having low and high
contents of the variable. Figure 4.8 shows the comparisons made for both crushed concrete
mixtures and crushed limestone mixtures. The first two bars adhering in the left of Figure
4.8 (a), for example, show the effect of coarse aggregate proportion. The empty and solid bars
indicate the average strengths of test mixtures 1, 3, 5, 7 (fine mixes) and 2, 4, 6, 8 (coarse mixes),
respectively (refer to Table 4.8). The last two bars in the same figure compare the average
strengths of mixtures 1, 2, 3, 4 (low cement content) and mixtures 5, 6, 7, 8 (high cement
content). It is clearly shown that cement content is the most influencing factor for strength
development of CTB mixtures for both aggregates. It seems that twice the cement content
results in the mixture developing twice the strength. Although the other two variables affect
strength, the effect of cement content dominates. The effects of interactions between the
variables were also investigated. However, it was found that the interactions do not have
significant influences and were less than 10 percent difference of strength on average.
Another effort was undertaken to establish a prediction model for compressive strength
development with time. As previously stated, estimation of time dependent properties of the
CTB mixture is the key factor for understanding shrinkage cracking behavior of the mixture.
Regression parameters were found for the hyperbolic equation proposed by ACI 209 for concrete
application. The prediction equation has the form of the following equation:
tbatftf cc ⋅+
= )28()( (1)
where, fc(t) = compressive strength at any time t
fc(28) = 28-day compressive strength
a, b = parameters
ACI 209 provided the parameters for normal concrete such that a=4.0 and b=0.85. This
study proposes different parameters for CTB mixtures such that a=2.5 and b=0.9. The proposed
parameters can be used for both aggregate mixtures, crushed concrete, and crushed limestone, in
any mix proportioning. The equation estimates the compressive strength of CTB mixtures at any
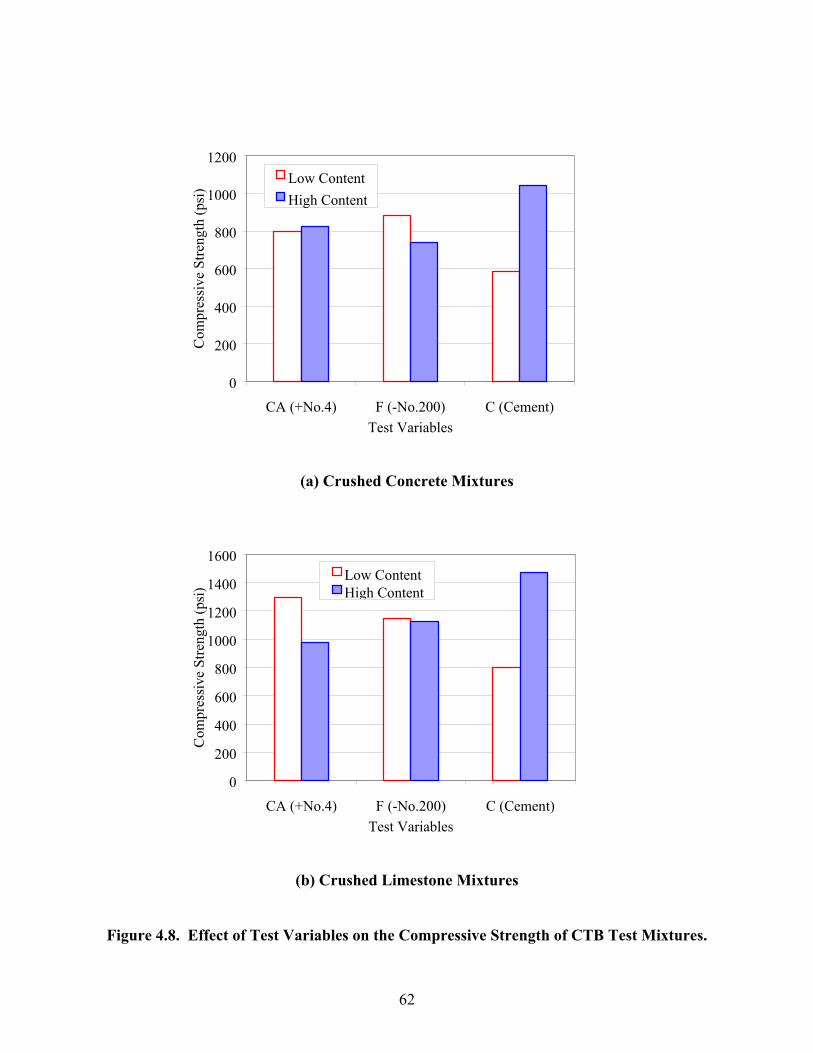
62
(a) Crushed Concrete Mixtures
(b) Crushed Limestone Mixtures
Figure 4.8. Effect of Test Variables on the Compressive Strength of CTB Test Mixtures.
0
200
400
600
800
1000
1200
CA (+No.4) F (-No.200) C (Cement)Test Variables
Com
pres
sive
Stre
ngth
(psi
)Low ContentHigh Content
0
200
400
600
800
1000
1200
1400
1600
CA (+No.4) F (-No.200) C (Cement)Test Variables
Com
pres
sive
Stre
ngth
(psi
)
Low ContentHigh Content
63
time with a given 28 day compressive strength value. Figure 4.9 shows the prediction curves of
compressive strength with average test data. Both the current ACI 209 and the proposed
equations give similar estimations, while the ACI equation gives a little more conservative
values compared to the test data for CTB mixtures.
Modulus of Elasticity
The modulus of elasticity of the test sample was evaluated from the stress-strain curve.
Stress was calculated by dividing applied load to the cross section of a 4-inch diameter cylinder
specimen. Strain was calculated by dividing measured LVDT displacement to the length of
LVDT (4 inches). The modulus of elasticity was then determined using the initial secant
modulus up to 25 percent of ultimate stress. Figure 4.10 shows typical stress-strain relationships
observed from the tests. It includes stress-strain curves observed from 3, 7, and 28 day samples
of test mixtures RA-5 and CL-5. Note that the axis scales are different for each aggregate
mixture. It was found that the mixtures having compressive strengths higher than 500 psi show
the stress-strain behavior similar to that of normal concrete. The lower strength mixtures tend to
show unbound mixture behavior such that some yielding plateau exists.
The average values of observed modulus of elasticity of test mixtures are summarized in
Table 4.15. The effects of test variables on modulus of elasticity appear to be same as that of
compressive strength. The most influencing parameter is again the cement content. Use of more
cement results in stiffer mixtures. The ratio of elastic modulus of 8 percent cement mixtures to
4 percent cement mixtures reaches over 2.0 in very early ages, but the ratio ranges 1.3 to 1.7 for
the samples cured more than 7 days.
Figure 4.11 shows the development of modulus of elasticity in test mixtures. Solid lines
in the figure were drawn by equation (1) with the same parameters but with modulus of elasticity
substituted strengths. As shown, it gives reasonable estimates of the time dependent elastic
modulus of CTB mixtures for both aggregates.
Along with the strength development, the change of modulus with time is also an
important factor in shrinkage cracking behavior of CTB mixtures. It is also crucial for
mechanistic thickness design approaches, although thickness design is not of interest in this
project. Previous studies have recommended that the development of modulus of elasticity in

64
(a) Crushed Concrete Mixtures
(b) Crushed Limestone Mixtures
Figure 4.9. Prediction of Compressive Strength Developments in CTB Mixtures.
0
500
1000
1500
2000
0 10 20 30
Time (day)
UC
S (p
si) 4% Cement
8% Cement
ACI 209
Proposed
0
500
1000
1500
2000
0 10 20 30 40
Time (day)
UC
S (p
si) 4% Cement
8% Cement
ACI 209Proposed
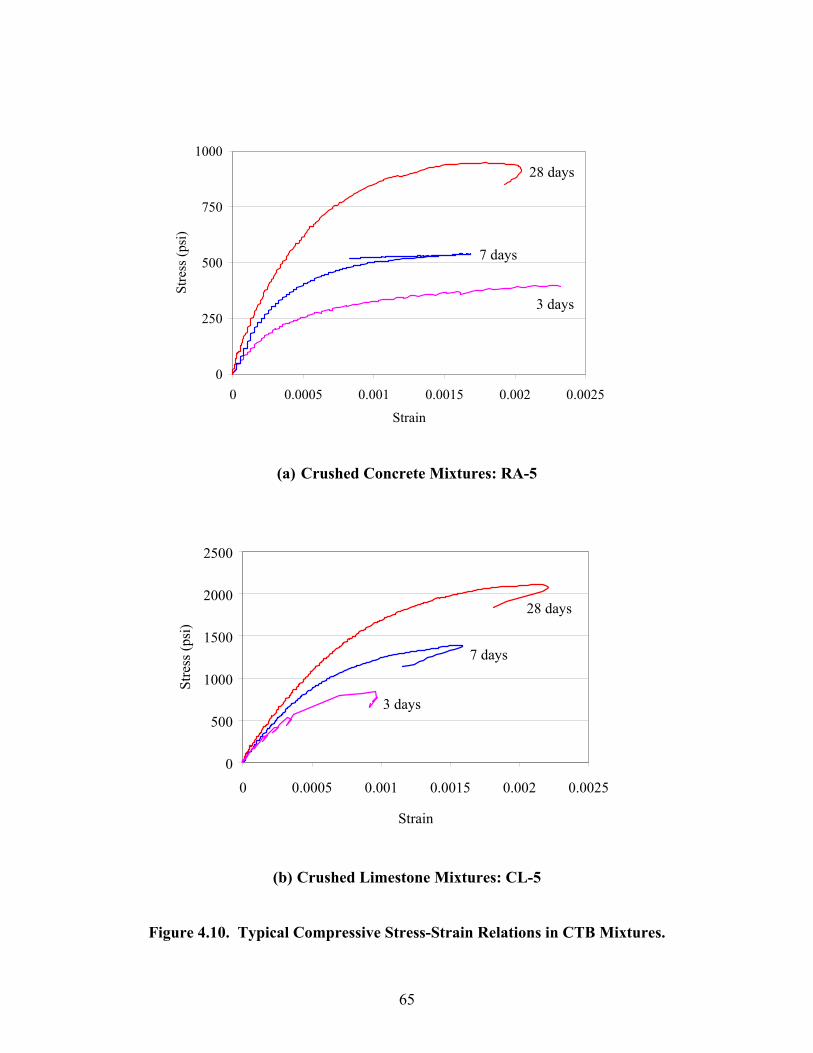
65
(a) Crushed Concrete Mixtures: RA-5
(b) Crushed Limestone Mixtures: CL-5
Figure 4.10. Typical Compressive Stress-Strain Relations in CTB Mixtures.
0
250
500
750
1000
0 0.0005 0.001 0.0015 0.002 0.0025
Strain
Stre
ss (p
si)
0
500
1000
1500
2000
2500
0 0.0005 0.001 0.0015 0.002 0.0025
Strain
Stre
ss (p
si)
28 days
7 days
3 days
28 days
7 days
3 days
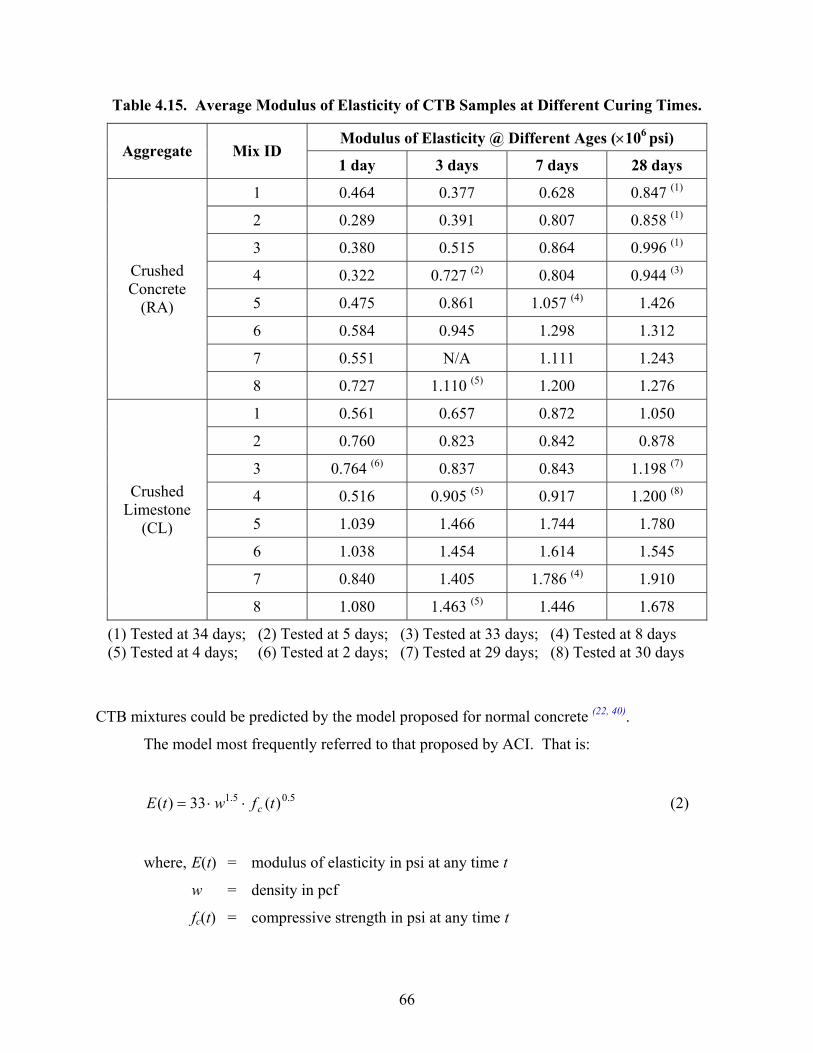
66
Table 4.15. Average Modulus of Elasticity of CTB Samples at Different Curing Times.
Modulus of Elasticity @ Different Ages (×106 psi) Aggregate Mix ID
1 day 3 days 7 days 28 days
1 0.464 0.377 0.628 0.847 (1)
2 0.289 0.391 0.807 0.858 (1)
3 0.380 0.515 0.864 0.996 (1)
4 0.322 0.727 (2) 0.804 0.944 (3)
5 0.475 0.861 1.057 (4) 1.426
6 0.584 0.945 1.298 1.312
7 0.551 N/A 1.111 1.243
Crushed Concrete
(RA)
8 0.727 1.110 (5) 1.200 1.276
1 0.561 0.657 0.872 1.050
2 0.760 0.823 0.842 0.878
3 0.764 (6) 0.837 0.843 1.198 (7)
4 0.516 0.905 (5) 0.917 1.200 (8)
5 1.039 1.466 1.744 1.780
6 1.038 1.454 1.614 1.545
7 0.840 1.405 1.786 (4) 1.910
Crushed Limestone
(CL)
8 1.080 1.463 (5) 1.446 1.678
(1) Tested at 34 days; (2) Tested at 5 days; (3) Tested at 33 days; (4) Tested at 8 days (5) Tested at 4 days; (6) Tested at 2 days; (7) Tested at 29 days; (8) Tested at 30 days
CTB mixtures could be predicted by the model proposed for normal concrete (22, 40).
The model most frequently referred to that proposed by ACI. That is:
5.05.1 )(33)( tfwtE c⋅⋅= (2)
where, E(t) = modulus of elasticity in psi at any time t
w = density in pcf
fc(t) = compressive strength in psi at any time t

67
(a) Crushed Concrete Mixtures
(b) Crushed Limestone Mixtures
Figure 4.11. Development of Modulus of Elasticity in CTB Mixtures.
0.0E+00
5.0E+05
1.0E+06
1.5E+06
2.0E+06
2.5E+06
0 10 20 30 40Time (day)
Mod
ulus
of E
last
icity
(ps
i) e
4% Cement8% Cement
0.0E+00
5.0E+05
1.0E+06
1.5E+06
2.0E+06
2.5E+06
0 10 20 30 40Time (day)
Mod
ulus
of E
last
icity
(ps
i) e
4% Cement8% Cement

68
However, it was found in this project that the above equation produces appreciable errors
when applied to CTB mixtures. New parameters relevant to CTB mixtures were found in this
project by regression analysis of observed strength and modulus relations. The proposed
equation is:
75.05.1 )(38.4)( tfwtE c⋅⋅= (3)
Equation (3) estimates time dependent elastic modulus of CTB mixtures with given
mixture density and compressive strength. This can be used for both crushed concrete and
crushed limestone mixtures in any mix proportioning. Compressive strength for a given time can
be estimated by equation (1). Therefore, when the 28 day compressive strength is known, the
time dependent strength and modulus of CTB mixtures can be estimated by using equations (1)
and (3).
Figure 4.12 shows the prediction curves of modulus of elasticity with observed test data.
The data points represent the results of all test specimens of each aggregate mixture without
classifying the different mix proportioning. The proposed equation shows good agreement to
test data, while the ACI equation overestimates modulus for a given strength. In fact, the ACI
equation has been proposed for normal concrete that generally has compressive strength in the
range of 3000 to 5000 psi. The equation proposed in this project covers CTB mixtures in a wide
range of compressive strengths from 200 to 2000 psi. Note that data points obtained for both
aggregate mixtures fall on the same line. Also note that field applied CTB mixtures with any
type of aggregates generally have a compressive strength between 400 to 1500 psi. It is expected
from these observations that the proposed equation will be effective for any CTB mixture in the
proper strength range.
Figure 4.13 shows the goodness of fit using the equation proposed in this project. The
modulus of elasticity of test samples were estimated with measured 28 day compressive strength
and sample density. Test samples were compacted at a higher density than the maximum dry
density obtained from the preliminary tests for OMC determination (see Table 4.13). Average
sample densities of crushed concrete mixtures were 134.1 and 134.2 pcf for low and high cement
content mixtures, respectively. Crushed limestone mixture samples had an average density of
144.3 for low and 145.5 for high cement content mixtures.
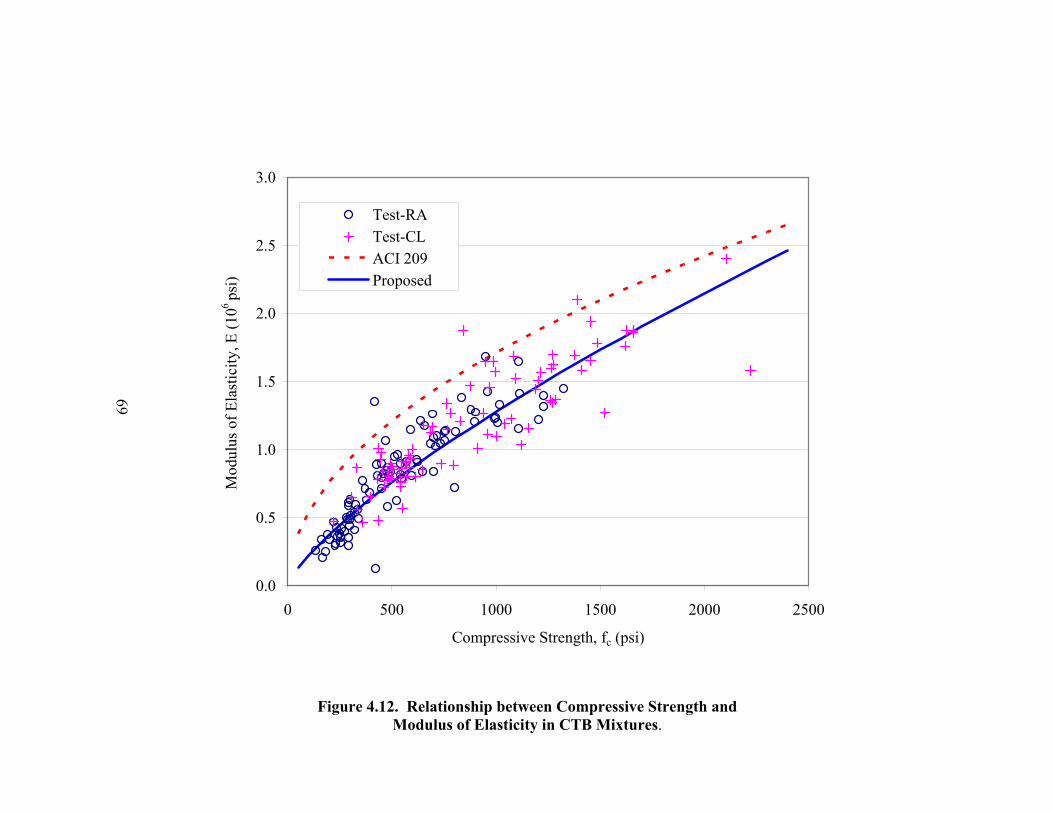
69
0.0
0.5
1.0
1.5
2.0
2.5
3.0
0 500 1000 1500 2000 2500
Compressive Strength, fc (psi)
Mod
ulus
of E
last
icity
, E (1
06 ps
i)Test-RATest-CLACI 209Proposed
Figure 4.12. Relationship between Compressive Strength and
Modulus of Elasticity in CTB Mixtures.
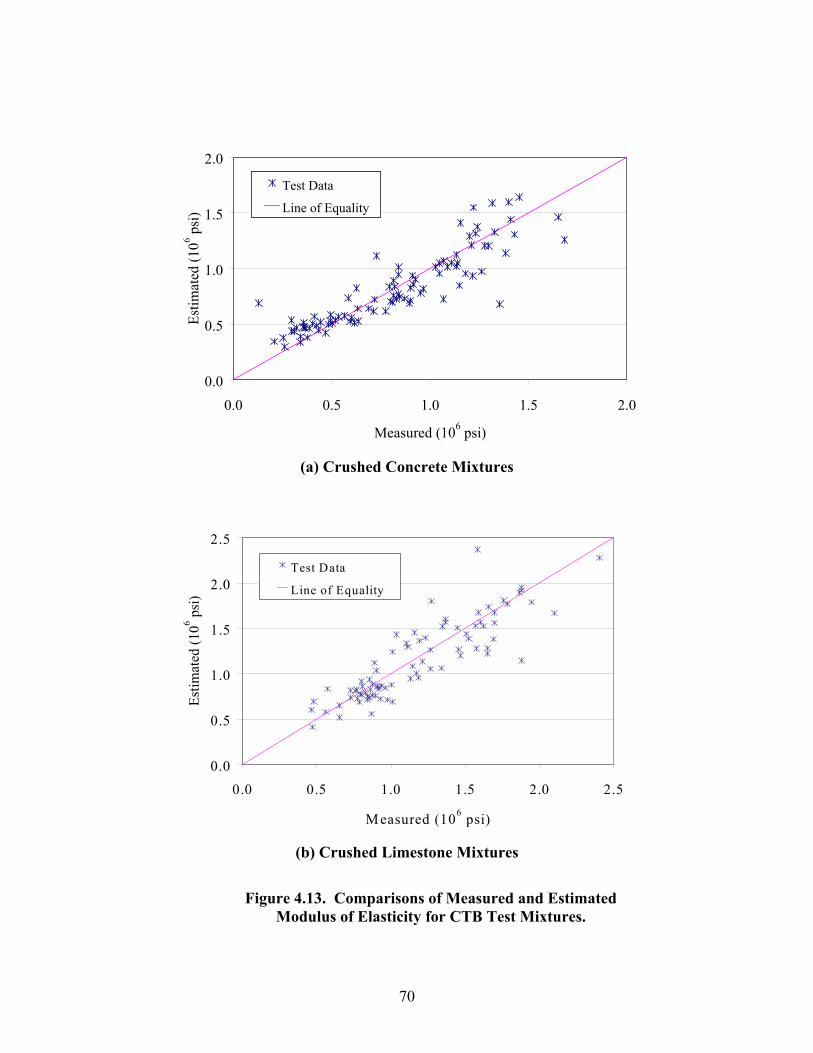
70
(a) Crushed Concrete Mixtures
(b) Crushed Limestone Mixtures
Figure 4.13. Comparisons of Measured and Estimated
Modulus of Elasticity for CTB Test Mixtures.
0.0
0.5
1.0
1.5
2.0
0.0 0.5 1.0 1.5 2.0
Measured (106 psi)
Estim
ated
(106 p
si)
Test Data
Line of Equality
0.0
0.5
1.0
1.5
2.0
2.5
0.0 0.5 1.0 1.5 2.0 2.5
M easured (106 psi)
Estim
ated
(106 p
si)
Test Data
Line of Equality

71
Free Shrinkage
The development of unrestrained free shrinkage under a constant temperature and
humidity condition at 77°F, 40%RH was identified in accordance with ASTM C 157, “Test
Method for Length Change of Hardened Hydraulic-Cement Mortar and Concrete.” Samples
were compacted in a 3×3×18-inch beam mold, shown in Figure 4.14, for three layers and 50
blows per layer with an 18-inch, 10-lb rammer. Samples were demolded on the next day and cut
by half-length with a saw-cut machine, producing two beams for each test mixture. Samples
were placed at a moisture room with 77°F, 100%RH for another day to remove the excessive
water applied during saw cutting. During this period, two pointing pin gages were attached to
each beam with epoxy at about 8 inches apart. At least a half day was required for the epoxy to
develop enough bond strength so that no slip could occur at the interface between the pins and
beam surface. Therefore, drying of the beams and the corresponding shrinkage measurements
initiated from 2 or 2.5 days after molding.
Samples were placed in a drying room (77°F, 40%RH) during the measurements. A
digital dial gage with the accuracy of 1/1000 mm was used to measure the shrinkage
deformations. Figure 4.15 shows the configuration of shrinkage measurements. Measurements
lasted up to more than 40 days of drying until the deformation showed stationary with time.
Figure 4.14. Compaction Mold for Shrinkage Beam Samples.
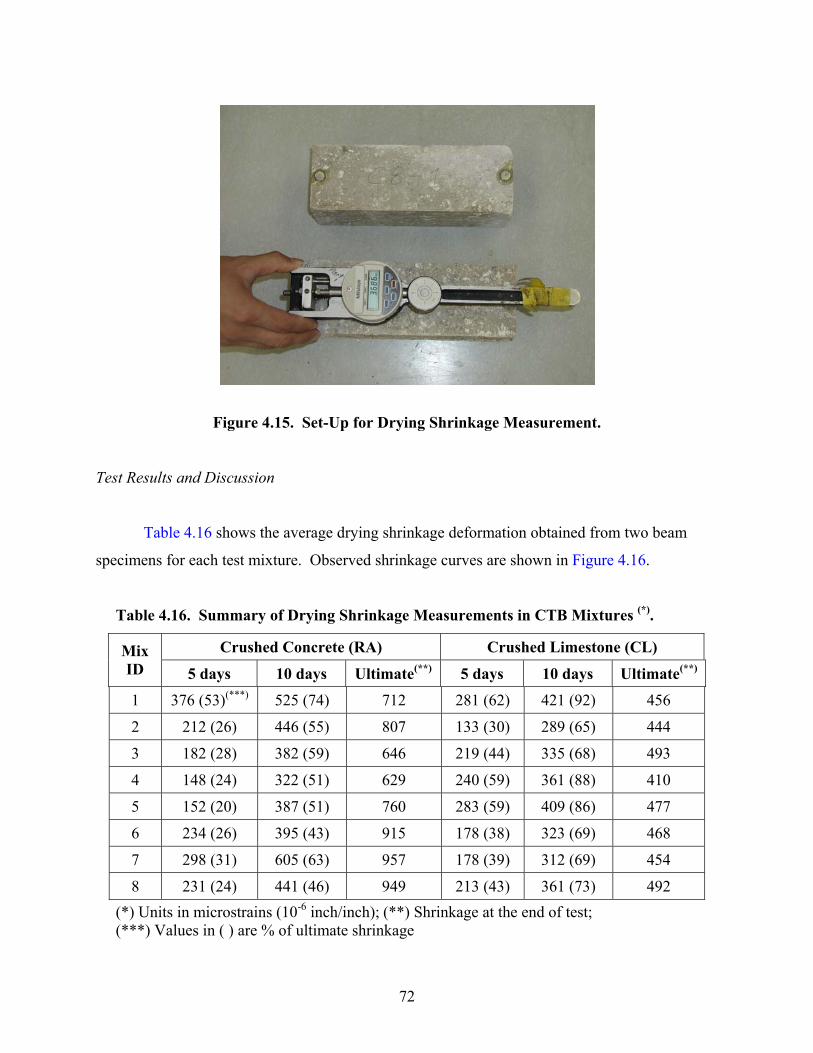
72
Figure 4.15. Set-Up for Drying Shrinkage Measurement.
Test Results and Discussion
Table 4.16 shows the average drying shrinkage deformation obtained from two beam
specimens for each test mixture. Observed shrinkage curves are shown in Figure 4.16.
Table 4.16. Summary of Drying Shrinkage Measurements in CTB Mixtures (*).
Crushed Concrete (RA) Crushed Limestone (CL) Mix ID 5 days 10 days Ultimate(**) 5 days 10 days Ultimate(**)
1 376 (53)(***) 525 (74) 712 281 (62) 421 (92) 456
2 212 (26) 446 (55) 807 133 (30) 289 (65) 444
3 182 (28) 382 (59) 646 219 (44) 335 (68) 493
4 148 (24) 322 (51) 629 240 (59) 361 (88) 410
5 152 (20) 387 (51) 760 283 (59) 409 (86) 477
6 234 (26) 395 (43) 915 178 (38) 323 (69) 468
7 298 (31) 605 (63) 957 178 (39) 312 (69) 454
8 231 (24) 441 (46) 949 213 (43) 361 (73) 492 (*) Units in microstrains (10-6 inch/inch); (**) Shrinkage at the end of test; (***) Values in ( ) are % of ultimate shrinkage
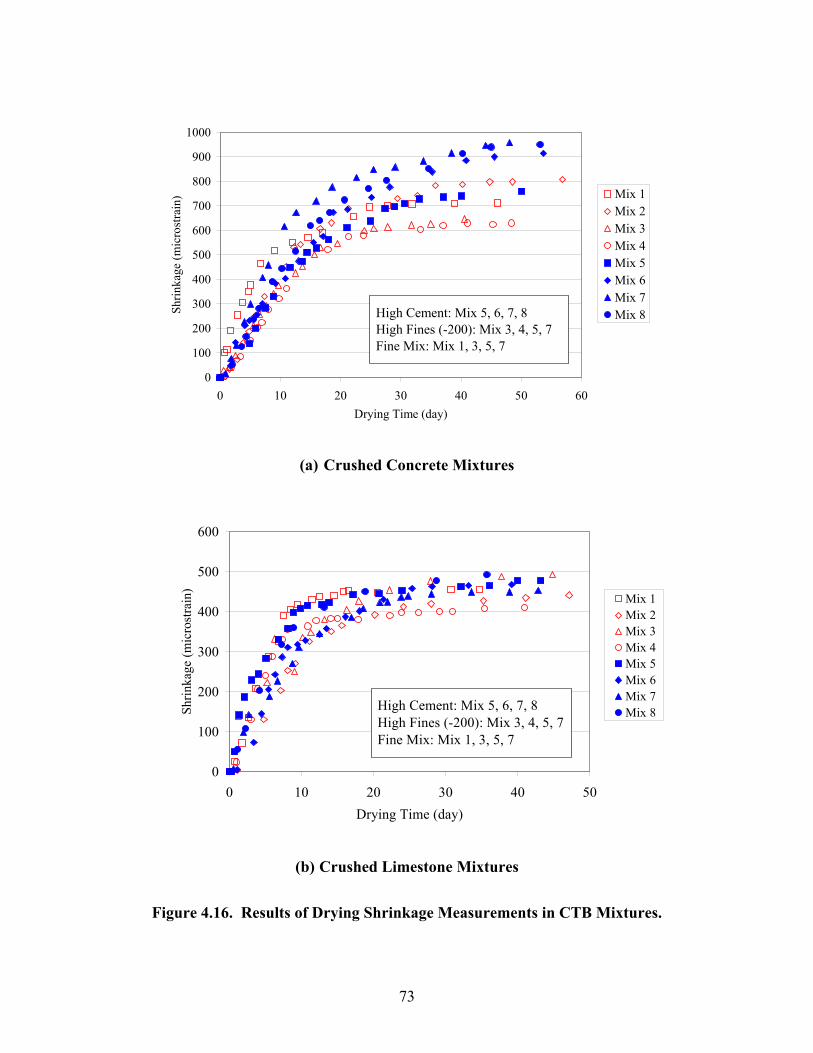
73
(a) Crushed Concrete Mixtures
(b) Crushed Limestone Mixtures
Figure 4.16. Results of Drying Shrinkage Measurements in CTB Mixtures.
0
100
200
300
400
500
600
700
800
900
1000
0 10 20 30 40 50 60Drying Time (day)
Shrin
kage
(mic
rost
rain
) Mix 1Mix 2Mix 3Mix 4Mix 5Mix 6Mix 7Mix 8High Cement: Mix 5, 6, 7, 8
High Fines (-200): Mix 3, 4, 5, 7Fine Mix: Mix 1, 3, 5, 7
0
100
200
300
400
500
600
0 10 20 30 40 50Drying Time (day)
Shrin
kage
(mic
rost
rain
)
Mix 1Mix 2Mix 3Mix 4Mix 5Mix 6Mix 7Mix 8High Cement: Mix 5, 6, 7, 8
High Fines (-200): Mix 3, 4, 5, 7Fine Mix: Mix 1, 3, 5, 7

74
Test results indicated that the final shrinkage values of crushed concrete mixtures at the
end of the test were about twice higher than that of conventional crushed limestone mixtures.
However, the shrinkage rate was found to be slower for crushed concrete mixtures than
limestone mixtures. Crushed concrete mixtures shrunk about 25 and 50 percents of the ultimate
shrinkage in 5 and 10 days of drying, respectively, while crushed limestone mixtures reached
more than 40 and 70 percents in those periods. The absolute amount of shrinkage within 10 days
of drying was shown to be close for both aggregate mixtures. This slow shrinkage rate is one of
the advantageous factors against early age shrinkage cracking even though the mixture shows
higher ultimate shrinkage.
As shown in Figure 4.16, the effects of test variables on the shrinkage of CTB mixtures
are not so distinctive. Especially for crushed limestone mixtures, very close shrinkage curves
were observed for the whole test period in all test mixtures, regardless of mix proportioning. At
the same drying periods, the differences in observed shrinkage for crushed limestone mixtures
were generally no more than 10 percent between any set of test mixtures. Use of high cement
content in crushed limestone mixtures resulted in just a 5 percent increase for ultimate shrinkage
compared to low cement mixtures. Although the same trend was observed for crushed concrete
mixtures within 10 days of drying, at longer periods of drying, mixtures with high cement
content (solid dots in Figure 4.16) showed 10 to 20 percent higher shrinkage than low cement
mixtures (empty dots).
Figures 4.17 and 4.18 provide more specific comparisons on the effects of test variables
for crushed concrete and crushed limestone mixtures, respectively. For each aggregate mixture,
a separate comparison was made for the average drying shrinkage measured after 10 days and
40 days of drying. Note that the scales of ordinates are different, but their ranges are all in
300 microstrains. Empty bars represent the average shrinkage of mixtures having low content of
each test variable, while solid bars represent that of mixtures with high content of each variable.
Mixtures having low content of +No. 4 aggregates, that is fine mixtures, showed a 5 to
15 percent higher shrinkage than coarse mixtures. However, fine mixtures of crushed concrete
showed a 5 percent less average shrinkage after 40 days of drying than coarse mixtures. In
general, fine mixtures shrunk more in early ages than coarse mixtures, and as drying continues
more than 10 days, the difference of shrinkage between fine and coarse mixtures becomes
smaller.
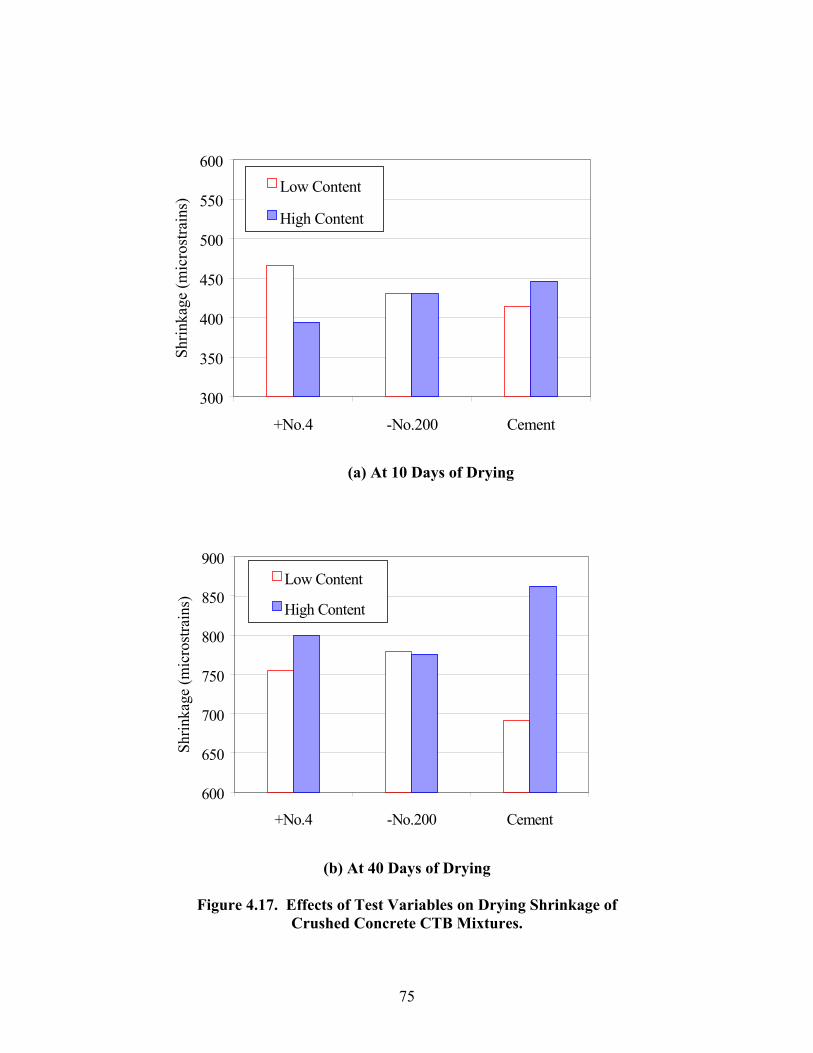
75
(a) At 10 Days of Drying
(b) At 40 Days of Drying
Figure 4.17. Effects of Test Variables on Drying Shrinkage of Crushed Concrete CTB Mixtures.
300
350
400
450
500
550
600
+No.4 -No.200 Cement
Shrin
kage
(mic
rost
rain
s)Low Content
High Content
600
650
700
750
800
850
900
+No.4 -No.200 Cement
Shrin
kage
(mic
rost
rain
s)
Low Content
High Content

76
(a) At 10 Days of Drying
(b) At 40 Days of Drying
Figure 4.18. Effects of Test Variables on Drying Shrinkage of Crushed Limestone CTB Mixtures.
200
250
300
350
400
450
500
+No.4 -No.200 Cement
Shrin
kage
(mic
rost
rain
s)Low Content
High Content
300
350
400
450
500
550
600
+No.4 -No.200 Cement
Shrin
kage
(mic
rost
rain
s)
Low Content
High Content
77
All mixtures with high cement content showed greater average shrinkage than low
cement mixtures. Crushed concrete mixtures were shown to be more sensitive to cement content
than conventional limestone mixtures. The effect of cement content in both aggregate mixtures
also appears to be appreciable at a longer period of drying. It can be shown that, for both
aggregate mixtures, the effect of passing No. 200 materials on drying shrinkage of the mixture is
negligible.
Stress Relaxation Test
As described earlier, stress relaxation is one important factor to be considered in the
studies of shrinkage cracking behavior of concrete, as well as CTB mixtures. Restrained
shrinkage results in shrinkage stress development, and shrinkage cracking occurs when the stress
becomes greater than the material’s resistance to cracking. Since, however, the restrained
shrinkage acts as a sustained strain condition, resulting stress reduces with time by stress
relaxation. The stress relaxation properties of CTB mixtures, including crushed concrete
materials, were identified by tensile relaxation tests. The same tests were conducted on
conventional crushed limestone CTB mixtures, and the stress relaxation properties of those two
different mixtures were compared.
Sample Preparation and Test
Tests were conducted on 7 day and 28 day cured specimens for the mixtures of RA-5 and
CL-5. One sample was tested for each test case. To investigate more relevant material
properties with respect to shrinkage stress development and cracking, researchers determined to
take the tests under uniaxial tension mode with a dog-bone shaped specimen. Figure 4.19 shows
the specially designed compaction mold for the dog-bone shaped CTB specimens. The length of
the specimen was 12 inches and included two 3-inch length tapered sections and a 6-inch test
section in the middle. The test section had a constant width of 4 inches, while the width of each
tapered section linearly varied from 4 inches at the middle to 5.5 inches at the end of the
specimen. The depth of the specimen was 4 inches.
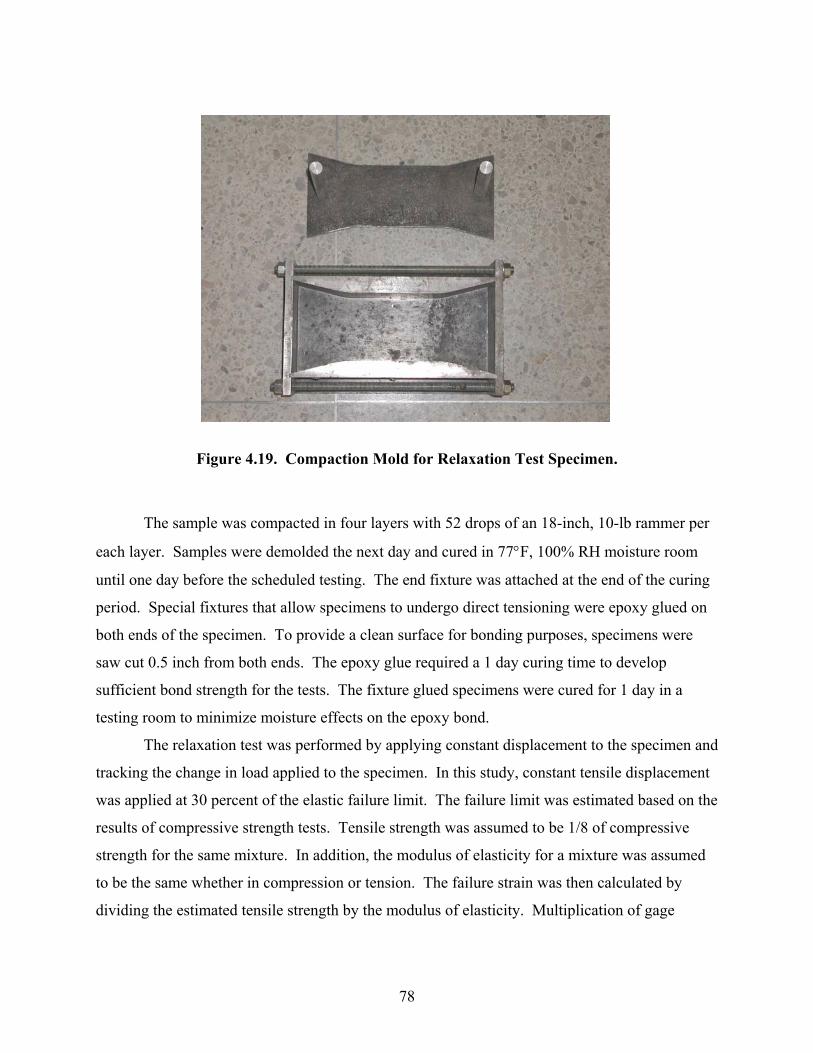
78
Figure 4.19. Compaction Mold for Relaxation Test Specimen.
The sample was compacted in four layers with 52 drops of an 18-inch, 10-lb rammer per
each layer. Samples were demolded the next day and cured in 77°F, 100% RH moisture room
until one day before the scheduled testing. The end fixture was attached at the end of the curing
period. Special fixtures that allow specimens to undergo direct tensioning were epoxy glued on
both ends of the specimen. To provide a clean surface for bonding purposes, specimens were
saw cut 0.5 inch from both ends. The epoxy glue required a 1 day curing time to develop
sufficient bond strength for the tests. The fixture glued specimens were cured for 1 day in a
testing room to minimize moisture effects on the epoxy bond.
The relaxation test was performed by applying constant displacement to the specimen and
tracking the change in load applied to the specimen. In this study, constant tensile displacement
was applied at 30 percent of the elastic failure limit. The failure limit was estimated based on the
results of compressive strength tests. Tensile strength was assumed to be 1/8 of compressive
strength for the same mixture. In addition, the modulus of elasticity for a mixture was assumed
to be the same whether in compression or tension. The failure strain was then calculated by
dividing the estimated tensile strength by the modulus of elasticity. Multiplication of gage

79
length to the failure strain gave the elastic failure limit within the gage length. Considering the
linearity, 30 percent of this elastic failure limit was applied to the specimen.
Four LVDTs, two in vertical and two in lateral, were installed on the surface of the
specimen. The gage lengths of vertical and lateral LVDTs were 4 and 3 inches, respectively.
Figure 4.20 shows a prepared specimen that is installed in the testing machine, and Figure 4.21
shows the overall configuration of the test. The tests were conducted with a servo-hydraulic
MTS machine. This machine allows the tests to be controlled by the constant LVDT
displacement. Another vertical LVDT was installed on the other side of the specimen shown in
the figure. A predetermined level of axial displacement that is 30 percent of the failure limit for
each test specimen was applied to the specimen through one of the vertical LVDTs. The load
cell attached on the top of specimen measured the change of applied force under the constant
displacement condition.
Figure 4.20. Relaxation Test Specimen in Ready.
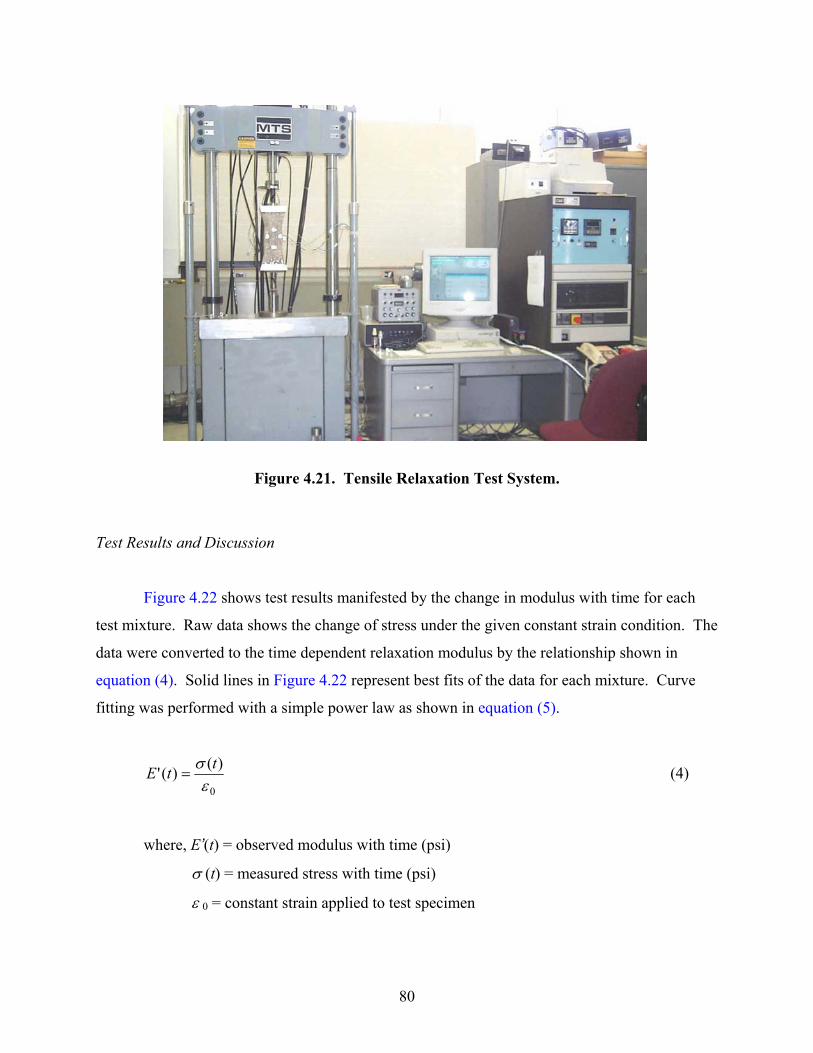
80
Figure 4.21. Tensile Relaxation Test System.
Test Results and Discussion
Figure 4.22 shows test results manifested by the change in modulus with time for each
test mixture. Raw data shows the change of stress under the given constant strain condition. The
data were converted to the time dependent relaxation modulus by the relationship shown in
equation (4). Solid lines in Figure 4.22 represent best fits of the data for each mixture. Curve
fitting was performed with a simple power law as shown in equation (5).
0
)()('εσ ttE = (4)
where, E’(t) = observed modulus with time (psi)
σ (t) = measured stress with time (psi)
ε 0 = constant strain applied to test specimen

81
ntEtE −⋅= 1)( (5)
where, E(t) = relaxation modulus (psi)
t = time (sec)
E1, n = regression parameters
Regression parameters E1 and n have physical meanings, and they are generally regarded
as material properties. The parameter E1 gives a rough estimation of the initial modulus that is
similar to the modulus of elasticity, and n represents the material’s ability to relax stress. The
higher the n values the greater the stress relaxation at the same condition. Highly viscous
materials, such as bituminous binder, generally have n values at around or over 0.5. The range
of n values for asphalt concrete mixtures is about 0.3 to 0.5. As cement bound material, CTB
mixtures were found to have less than 0.1 for their n values. Observed parameters E1 and n are
summarized in Table 4.17 with the modulus of elasticity in compression obtained earlier for each
test mixture.
Figure 4.22. Results of Tensile Relaxation Tests for CTB Mixtures.
1000000
1200000
1400000
1600000
1800000
2000000
2200000
2400000
0 20 40 60 80 100 120 140
Time (sec)
Mod
ulus
(psi
)
RA5-7 dayRA5-28 dayCL5-7 dayCL5-28 day
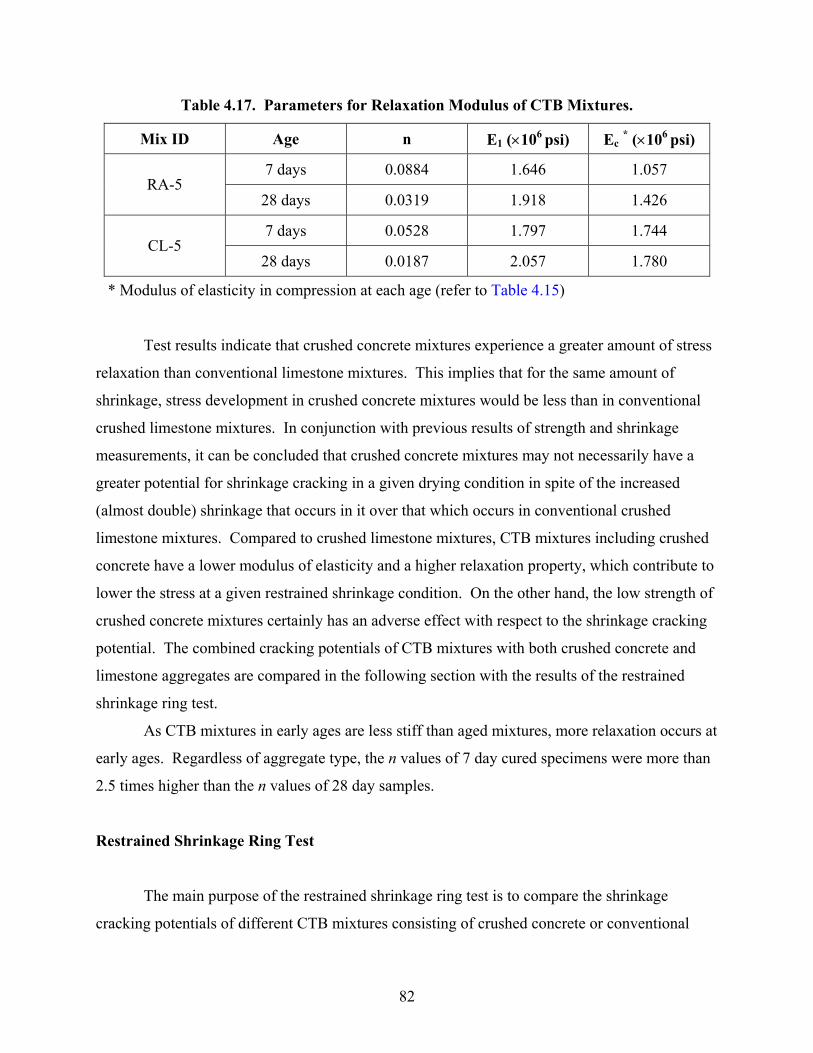
82
Table 4.17. Parameters for Relaxation Modulus of CTB Mixtures.
Mix ID Age n E1 (×106 psi) Ec * (×106 psi)
7 days 0.0884 1.646 1.057 RA-5
28 days 0.0319 1.918 1.426
7 days 0.0528 1.797 1.744 CL-5
28 days 0.0187 2.057 1.780
* Modulus of elasticity in compression at each age (refer to Table 4.15)
Test results indicate that crushed concrete mixtures experience a greater amount of stress
relaxation than conventional limestone mixtures. This implies that for the same amount of
shrinkage, stress development in crushed concrete mixtures would be less than in conventional
crushed limestone mixtures. In conjunction with previous results of strength and shrinkage
measurements, it can be concluded that crushed concrete mixtures may not necessarily have a
greater potential for shrinkage cracking in a given drying condition in spite of the increased
(almost double) shrinkage that occurs in it over that which occurs in conventional crushed
limestone mixtures. Compared to crushed limestone mixtures, CTB mixtures including crushed
concrete have a lower modulus of elasticity and a higher relaxation property, which contribute to
lower the stress at a given restrained shrinkage condition. On the other hand, the low strength of
crushed concrete mixtures certainly has an adverse effect with respect to the shrinkage cracking
potential. The combined cracking potentials of CTB mixtures with both crushed concrete and
limestone aggregates are compared in the following section with the results of the restrained
shrinkage ring test.
As CTB mixtures in early ages are less stiff than aged mixtures, more relaxation occurs at
early ages. Regardless of aggregate type, the n values of 7 day cured specimens were more than
2.5 times higher than the n values of 28 day samples.
Restrained Shrinkage Ring Test
The main purpose of the restrained shrinkage ring test is to compare the shrinkage
cracking potentials of different CTB mixtures consisting of crushed concrete or conventional
83
crushed limestone base materials. Two high cement content CTB mixtures were selected for this
purpose on the assumption that they would produce data that could be easily compared. Tested
mixtures, RA-5 and CL-5, have the same designations as the mixtures used for the relaxation
tests. Although a standard test method is not yet available, many studies used the shrinkage ring
test to identify the cracking tendency of particular concrete mixture (41, 42). Specimen geometry
and test apparatus are shown in Figure 4.23.
Sample Preparation and Test
The steel ring restrains the free shrinkage of the specimen placed around the ring. The
steel ring used in this study has an inside diameter of 11.75 inches and a thickness of 0.5 inches.
To constrain the mixture during compaction, another steel ring with an inside diameter of
18 inches was placed concentrically at the outside of the specimen so that the thickness of the
compacted specimen was 2.625 inches. The specimens were formed at a height of 6 inches.
Specimens were compacted in five layers with a 10-lb rammer and 125 drops per layer.
The top of the compacted specimen was covered with a plastic sheet and weighted with wooden
plates to minimize moisture loss. After 1 day of curing at room temperature, the outside ring
was removed to limit drying only in the radial direction through the circumferential surface of
the exposed ring specimen.
The specimen and restraining steel ring were instrumented with strain gages to measure
their displacements due to drying shrinkage of the specimen. Six strain gages were attached on
the inside of the steel ring, and six concrete strain gages were attached on the CTB specimen
surface after the removal of the outside steel ring. Circumferential strains of the steel ring and
CTB specimen were measured from these strain gages with data logging equipment as shown in
Figure 4.23 (b).
For monitoring the strains, each specimen was placed in a drying room at 77°F, 40%RH
after the installation of outside strain gages. In fact, the specimen was initially exposed to drying
for about 3 hours prior to the first measurement because of the strain gage installation. Although
this 3 hour pre-drying at the very early ages of cement bound mixtures may have had an effect on
stress relaxation, it was ignored in this comparative investigation. The measurements were
ceased after three weeks to 25 days of drying. According to the results of the free shrinkage

84
(a) Specimen Geometry
(b) Test Set-Up
Figure 4.23. Configuration for the Restrained Shrinkage Ring Test.
11.75 12.75 18.0
6.0
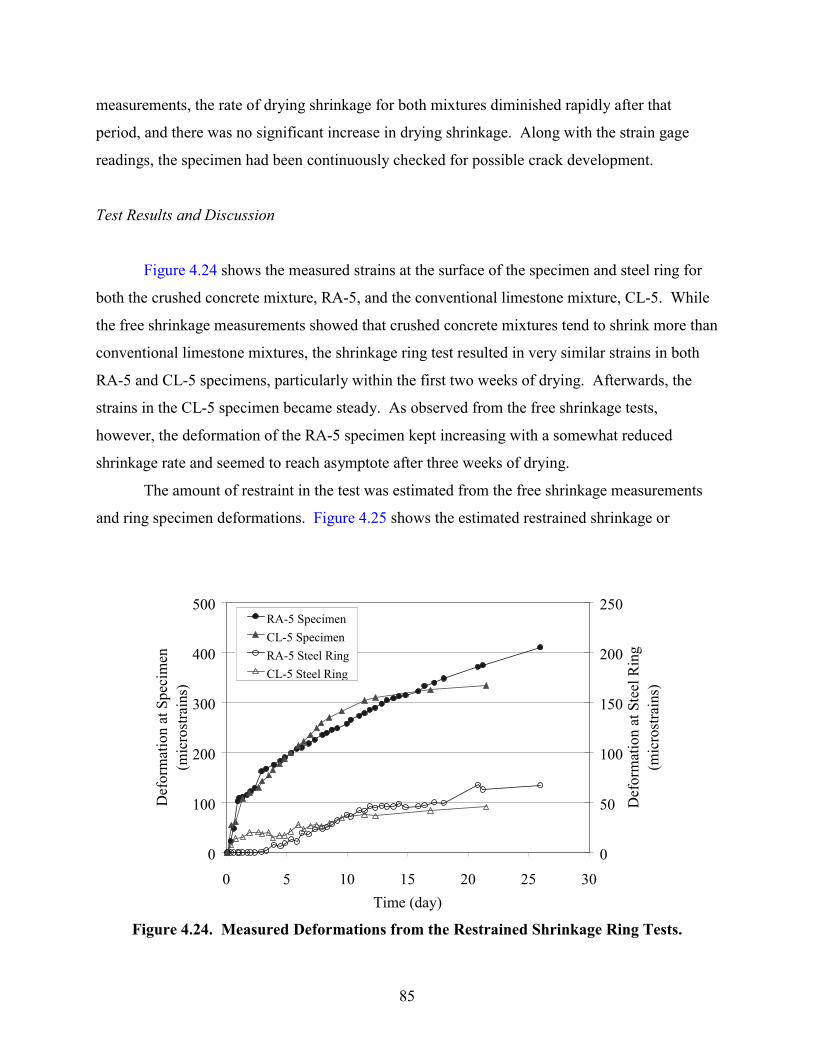
85
measurements, the rate of drying shrinkage for both mixtures diminished rapidly after that
period, and there was no significant increase in drying shrinkage. Along with the strain gage
readings, the specimen had been continuously checked for possible crack development.
Test Results and Discussion
Figure 4.24 shows the measured strains at the surface of the specimen and steel ring for
both the crushed concrete mixture, RA-5, and the conventional limestone mixture, CL-5. While
the free shrinkage measurements showed that crushed concrete mixtures tend to shrink more than
conventional limestone mixtures, the shrinkage ring test resulted in very similar strains in both
RA-5 and CL-5 specimens, particularly within the first two weeks of drying. Afterwards, the
strains in the CL-5 specimen became steady. As observed from the free shrinkage tests,
however, the deformation of the RA-5 specimen kept increasing with a somewhat reduced
shrinkage rate and seemed to reach asymptote after three weeks of drying.
The amount of restraint in the test was estimated from the free shrinkage measurements
and ring specimen deformations. Figure 4.25 shows the estimated restrained shrinkage or
Figure 4.24. Measured Deformations from the Restrained Shrinkage Ring Tests.
0
100
200
300
400
500
0 5 10 15 20 25 30Time (day)
Def
orm
atio
n at
Spe
cim
en(m
icro
stra
ins)
0
50
100
150
200
250
Def
orm
atio
n at
Ste
el R
ing
(mic
rost
rain
s)
RA-5 SpecimenCL-5 SpecimenRA-5 Steel RingCL-5 Steel Ring
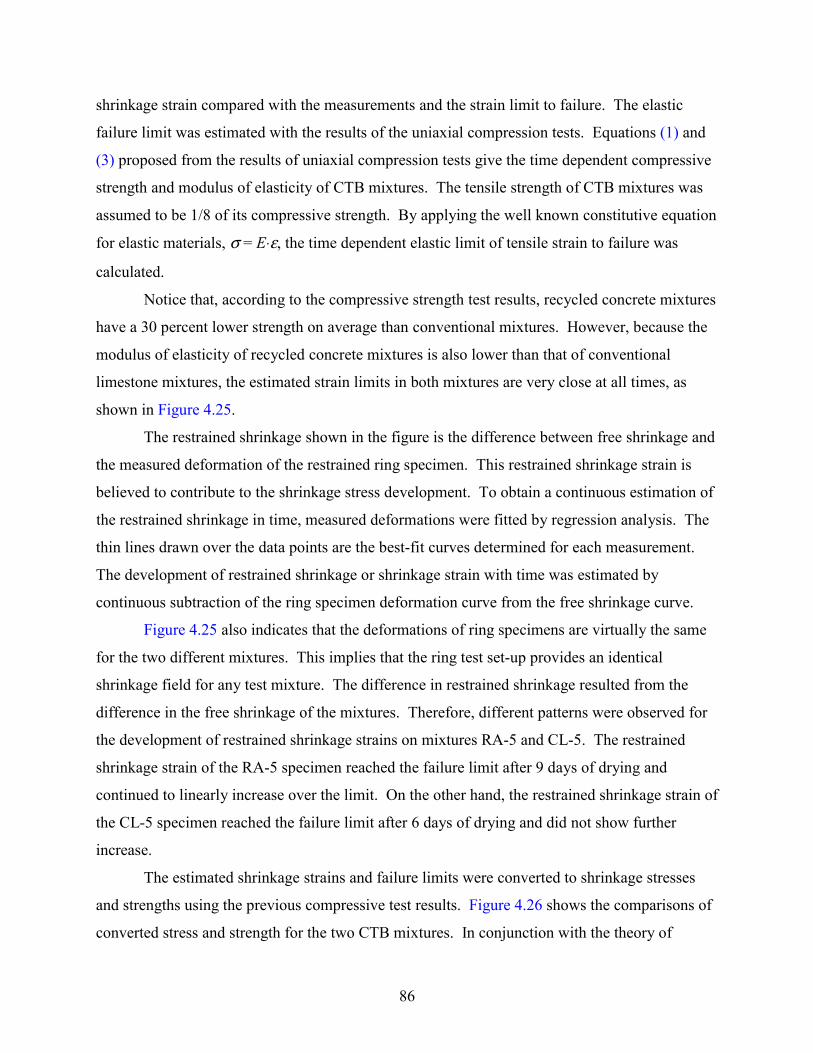
86
shrinkage strain compared with the measurements and the strain limit to failure. The elastic
failure limit was estimated with the results of the uniaxial compression tests. Equations (1) and
(3) proposed from the results of uniaxial compression tests give the time dependent compressive
strength and modulus of elasticity of CTB mixtures. The tensile strength of CTB mixtures was
assumed to be 1/8 of its compressive strength. By applying the well known constitutive equation
for elastic materials, σ = E⋅ε, the time dependent elastic limit of tensile strain to failure was
calculated.
Notice that, according to the compressive strength test results, recycled concrete mixtures
have a 30 percent lower strength on average than conventional mixtures. However, because the
modulus of elasticity of recycled concrete mixtures is also lower than that of conventional
limestone mixtures, the estimated strain limits in both mixtures are very close at all times, as
shown in Figure 4.25.
The restrained shrinkage shown in the figure is the difference between free shrinkage and
the measured deformation of the restrained ring specimen. This restrained shrinkage strain is
believed to contribute to the shrinkage stress development. To obtain a continuous estimation of
the restrained shrinkage in time, measured deformations were fitted by regression analysis. The
thin lines drawn over the data points are the best-fit curves determined for each measurement.
The development of restrained shrinkage or shrinkage strain with time was estimated by
continuous subtraction of the ring specimen deformation curve from the free shrinkage curve.
Figure 4.25 also indicates that the deformations of ring specimens are virtually the same
for the two different mixtures. This implies that the ring test set-up provides an identical
shrinkage field for any test mixture. The difference in restrained shrinkage resulted from the
difference in the free shrinkage of the mixtures. Therefore, different patterns were observed for
the development of restrained shrinkage strains on mixtures RA-5 and CL-5. The restrained
shrinkage strain of the RA-5 specimen reached the failure limit after 9 days of drying and
continued to linearly increase over the limit. On the other hand, the restrained shrinkage strain of
the CL-5 specimen reached the failure limit after 6 days of drying and did not show further
increase.
The estimated shrinkage strains and failure limits were converted to shrinkage stresses
and strengths using the previous compressive test results. Figure 4.26 shows the comparisons of
converted stress and strength for the two CTB mixtures. In conjunction with the theory of
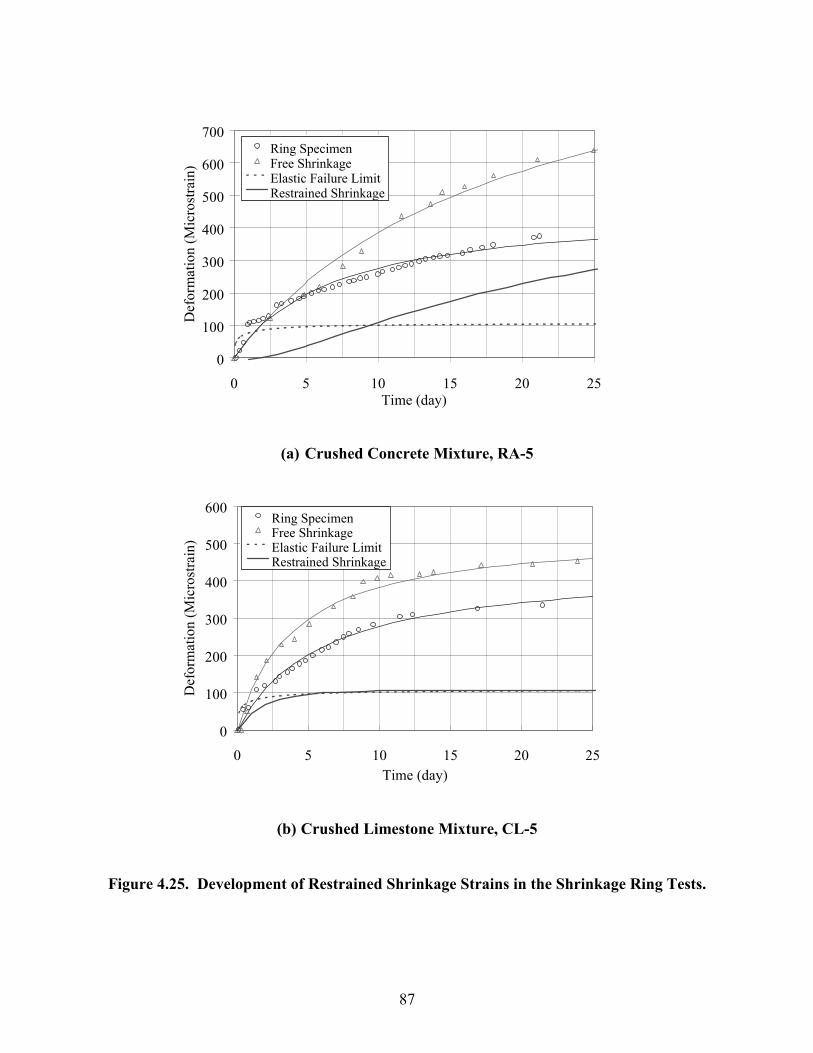
87
(a) Crushed Concrete Mixture, RA-5
(b) Crushed Limestone Mixture, CL-5
Figure 4.25. Development of Restrained Shrinkage Strains in the Shrinkage Ring Tests.
0
100
200
300
400
500
600
700
0 5 10 15 20 25Time (day)
Def
orm
atio
n (M
icro
stra
in)
Ring SpecimenFree ShrinkageElastic Failure LimitRestrained Shrinkage
0
100
200
300
400
500
600
0 5 10 15 20 25Time (day)
Def
orm
atio
n (M
icro
stra
in)
Ring SpecimenFree ShrinkageElastic Failure LimitRestrained Shrinkage
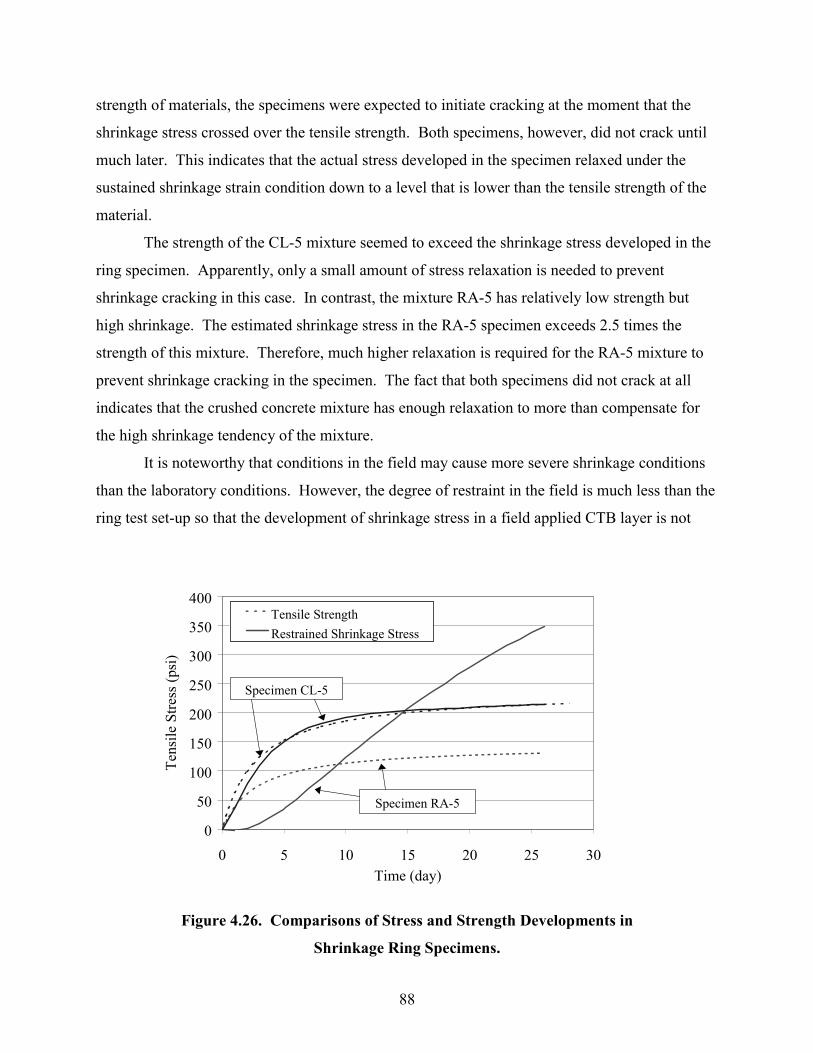
88
strength of materials, the specimens were expected to initiate cracking at the moment that the
shrinkage stress crossed over the tensile strength. Both specimens, however, did not crack until
much later. This indicates that the actual stress developed in the specimen relaxed under the
sustained shrinkage strain condition down to a level that is lower than the tensile strength of the
material.
The strength of the CL-5 mixture seemed to exceed the shrinkage stress developed in the
ring specimen. Apparently, only a small amount of stress relaxation is needed to prevent
shrinkage cracking in this case. In contrast, the mixture RA-5 has relatively low strength but
high shrinkage. The estimated shrinkage stress in the RA-5 specimen exceeds 2.5 times the
strength of this mixture. Therefore, much higher relaxation is required for the RA-5 mixture to
prevent shrinkage cracking in the specimen. The fact that both specimens did not crack at all
indicates that the crushed concrete mixture has enough relaxation to more than compensate for
the high shrinkage tendency of the mixture.
It is noteworthy that conditions in the field may cause more severe shrinkage conditions
than the laboratory conditions. However, the degree of restraint in the field is much less than the
ring test set-up so that the development of shrinkage stress in a field applied CTB layer is not
Figure 4.26. Comparisons of Stress and Strength Developments in
Shrinkage Ring Specimens.
0
50
100
150
200
250
300
350
400
0 5 10 15 20 25 30Time (day)
Tens
ile S
tress
(psi
)
Tensile StrengthRestrained Shrinkage Stress
Specimen CL-5
Specimen RA-5
89
necessarily higher than that which occurred in the ring specimen. Nonetheless, field
performance of CTB mixtures with respect to the shrinkage cracking needs to be studied further.
Tube Suction Test
As in for the study on flexible base applications, moisture susceptibility of CTB mixtures
was investigated by the tube suction test. The test method is basically the same as the method
used for flexible base mixtures. The difference is that while the flexible base mixtures had been
moved to a 104°C drying room right after compaction, the compacted CTB mixtures were moist
cured for 7 days before the drying.
The tests were conducted on the low cement mixtures with crushed concrete and crushed
limestone aggregates that are mixtures of RA-1 and CL-1. Each test mixture was compacted in a
φ6×8-inch plastic cylinder mold. Compacted cylinder molds had been cured for 7 days in a
moisture room at 77°C, 100% RH and then dried in a 104°C room for 3 days. The dried
cylinders were then placed in a pan containing water of at most a 1—inch depth. Capillary rise
in the sample was monitored for 10 days with a dielectric probe.
Test Results and Discussion
Figure 4.27 shows the surface dielectric measurements on the specimens during the test
period. The measurements initiated after the dried specimens were put into the water container.
The measured initial dielectric values are 5.9 and 4.8 for RA-1 and CL-1 mixtures, respectively.
The final dielectrics after 10 days of capillary rise were recorded at 6.1 for RA-1 and 5.2 for
CL-1.
Although the performance criteria on the dielectric values of CTB mixtures are not yet
available, test results indicate that the test specimens for both aggregates are not moisture
susceptible under capillary rise condition. Both test specimens showed stable surface dielectrics
during the test period. Comparing the TST results on flexible base mixtures, it seems that
cement treatment considerably reduces the capillary rise in the mixture, which in turn reduces the
moisture susceptibility of the mixture.

90
Figure 4.27 Results of Tube Suction Tests on CTB Test Mixtures.
Summary
The feasibility of using crushed concrete materials in cement treated base mixtures,
covered under Item 276, was examined through selected laboratory tests. CTB mixtures,
consisting of crushed concrete and conventional crushed limestone base materials, were
characterized and compared for the properties related to shrinkage cracking behavior and
moisture susceptibility. All test mixtures were compacted at OMC, and, like the flexible base
mixtures, CTB with crushed concrete materials required about 50 percent higher moisture
content than conventional crushed limestone mixtures to reach OMC.
Development of compressive strength and elastic modulus were evaluated for eight mix
combinations determined by three test variables: cement content, coarse aggregate fraction, and
content of passing the No. 200 materials. The cement content was found to be the most
influencing factor for the mixture properties. Twice the cement content seems to result in twice
the strength of the mixture. In general, about a 30 percent lower strength was observed for
crushed concrete mixtures than conventional limestone mixtures. However, test results indicated
that crushed concrete mixtures would satisfy the strength requirements of Item 276 when the
mixture is properly designed, especially for cement content.
4.0
4.5
5.0
5.5
6.0
6.5
7.0
7.5
8.0
0 2 4 6 8 10
Time (day)
Die
lect
ric
RA-1CL-1
91
A proportional relationship was observed for the CTB mixtures with both aggregate
sources between compressive strength and modulus of elasticity. However, difference in the
modulus of elasticity between the two materials was a little narrower than the strength
difference. Crushed concrete mixtures showed 20 to 25 percent lower modulus values than
crushed limestone mixtures. Prediction models were proposed for time dependent compressive
strength and modulus of elasticity of CTB mixtures based on the ACI equations prepared for
normal concrete. Good agreement was observed between test data and the estimations. It is
expected that the models will be useful for any CTB mixtures having a compressive strength
between 200 to 2000 psi.
The results of free shrinkage measurements indicated that crushed concrete mixtures tend
to shrink more than conventional limestone mixtures. After 40 days of drying, crushed concrete
mixtures showed twice the shrinkage of limestone mixtures. However, the shrinkage rate was
slower in crushed concrete samples so that the absolute amount of shrinkage at 10 days of drying
was shown to be close in both aggregate mixtures. This slow shrinkage rate would alleviate
shrinkage cracking potential in early ages, even though the mixture shrinks more in the ultimate
state.
Tensile relaxation tests were conducted with 7 and 28 days cured CTB mixtures. Test
results indicated that crushed concrete mixtures tend to relax more under sustained strain
conditions than crushed limestone mixtures. This implies, for a given restrained shrinkage
condition, stress development in crushed concrete mixtures would be less than in conventional
limestone mixtures.
All the evaluated properties, including strength, elastic modulus, free shrinkage, and
relaxation, provide a combined effect on the mixture’s shrinkage cracking potential. Compared
to crushed limestone mixtures, CTB with crushed concrete was shown to have lower strength
and higher shrinkage tendency, but lower stiffness and higher relaxation characteristics. The
first two properties increase shrinkage cracking potential of the mixture, but the latter two reduce
it.
The results of the restrained shrinkage ring test indicated that crushed concrete mixtures
do not necessarily have a higher shrinkage cracking potential as compared to the limestone
mixtures. The test continued for 25 days of drying under restrained conditions. During the first
two weeks of testing, less shrinkage stress was estimated for crushed concrete mixtures than
92
for the crushed limestone mixtures. At later ages, stress conditions near the strength of the
material was estimated for crushed limestone mixtures, while the stress in crushed concrete
mixtures continued to increase up to about 2.5 times the strength. However, the lack of cracking
suggests that the stress relaxation in the crushed concrete mixture compensated for the high
shrinkage stress.
More severe conditions related to drying shrinkage are expected under field conditions,
such as non-linear shrinkage over the depth of a layer that is likely to cause very highly localized
stress. On the other hand, however, the degree of restraints in the field condition is generally
much less than that which occurred in the ring test configuration so that the development of
cracking may be offset, similar to what was experienced in the lab. As before, the field
performance of CTB mixtures with respect to shrinkage cracking behavior needs to be studied
further.
Moisture susceptibility of CTB mixtures was evaluated by the tube suction test. Test
results indicated that the specimens of both crushed concrete and crushed limestone materials are
not moisture susceptible. Both specimens showed very stable surface dielectrics during the
10 days of testing. Comparing the TST results on flexible base mixtures, it seems that cement
treatment considerably reduces the capillary rise in the mixture and subsequent moisture
susceptibility.
HOT MIX ASPHALT BOND BREAKER
Laboratory tests for the study on hot mix asphalt bond breaker applications included:
� Mix design, and
� Moisture sensitivity test.
The main purpose of the test program is to find the maximum substitution of recycled
CPCC fines for natural or other conventional fine aggregates in HMA bond breaker mixtures.
The maximum inclusion of CPCC fines was so determined as the aggregate gradation to meet the
requirements as specified in Item 3116 Type B. Mix design properties and the optimum asphalt

93
content of those selected aggregate blends were investigated in accordance with test method Tex-
204-F.
One important item in the test program was to evaluate the designed mixture for its
susceptibility to moisture damage. In particular, since crushed concrete fines tend to have high
absorption, it was necessary to investigate the moisture damage potential. The moisture
sensitivity test was used to determine the moisture susceptibility of the designed mixtures. The
tests were conducted in accordance with test methods Tex-531-C and Tex-226-F.
Mix Design
Three different aggregate sources were used in this test program. The first was locally
obtained aggregate blend that is currently used as a conventional Type B bond breaker mixture.
This aggregate blend consists of Gifford Hill 1-inch aggregate, Fordyce D/F blend, Gifford Hill
washed screenings, and Texcon S&S sand. In addition to this, the washed and regraded CPCC
fines from the Williams Brothers crusher and unwashed CPCC fines from the Southern Crushed
Concrete were used as the second and third aggregate sources. Referring to the sample labeling
system shown in Chapter 3, the codes MS and SC designate washed and unwashed CPCC fines,
respectively. Asphalt binder of the grade PG-64-22 was used in all mixtures.
Aggregate Blending
Three mix designs (Design A, B, and C) were produced with the three different aggregate
sources. The first design, Design A, was the control mix with conventional materials. Designs B
and C included recycled CPCC fines as substitutions for part of the conventional fine aggregates
of the control mix. To maximize the amount of CPCC fines included in Designs B and C,
individual aggregate sources were blended to meet the gradation requirements for a Type B bond
breaker as specified in Item 3116. Finalized aggregate blends for each mix design are
summarized below:
� Design A: 30% Gifford Hill 1-inch aggregate
33% Fordyce D/F Blend
94
27% Gifford Hill washed screenings
10% Texcon S&S sand
� Design B: 40% Gifford Hill 1-inch aggregate
20% Fordyce D/F Blend
40% Washed and regraded CPCC fines (Williams Brothers)
� Design C: 40% Gifford Hill 1-inch aggregate
20% Fordyce D/F Blend
40% Unwashed CPCC fines (Southern Crushed Concrete)
Resulting aggregate gradations for each design are shown in Table 4.18 with the
specifications. Figure 4.28 shows the relevant gradation curves.
Mix Design Results
Individual batches of the blended aggregates were mixed with various asphalt binder
contents according to test method Tex-204-F. Details for mixing and compaction procedures
conformed to test methods Tex-205-F and Tex-206-F. The mixing temperature was controlled at
290°F. When mixing was completed, the mixtures were cured in a 250°F oven for 2 hours. A
set of three specimens was molded for selected asphalt contents to obtain the optimum amount of
asphalt in the mixture. These specimens were compacted by the use of the gyratory molding
press. The compacted specimens were allowed to cool down to room temperature and then
measured for height, density, and Hveem Stability. Table 4.19 presents a summary of the final
mix design results on the three test mixes.
Moisture Sensitivity
After determining the optimum asphalt content, eight specimens from each design were molded
and investigated for the possibility of moisture induced damage in accordance with test method
Tex-531-C. These specimens were molded to a density of 93±1 percent. The eight specimens
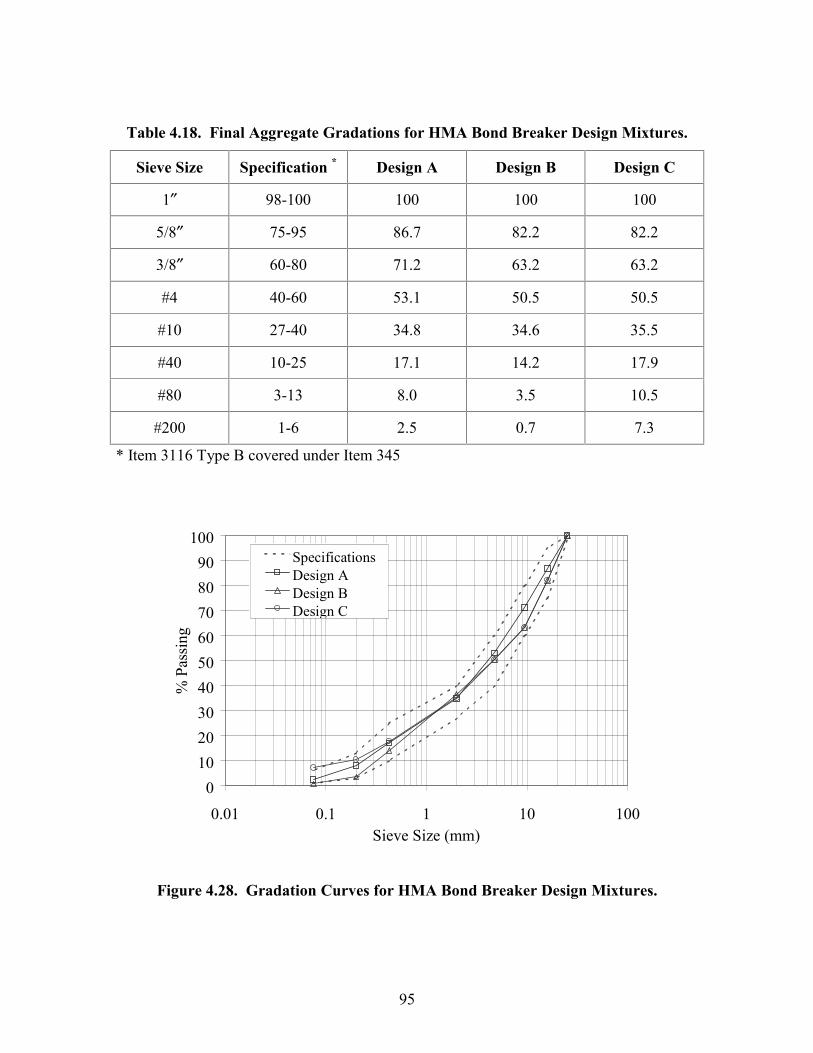
95
Table 4.18. Final Aggregate Gradations for HMA Bond Breaker Design Mixtures.
Sieve Size Specification * Design A Design B Design C
1″ 98-100 100 100 100
5/8″ 75-95 86.7 82.2 82.2
3/8″ 60-80 71.2 63.2 63.2
#4 40-60 53.1 50.5 50.5
#10 27-40 34.8 34.6 35.5
#40 10-25 17.1 14.2 17.9
#80 3-13 8.0 3.5 10.5
#200 1-6 2.5 0.7 7.3
* Item 3116 Type B covered under Item 345
Figure 4.28. Gradation Curves for HMA Bond Breaker Design Mixtures.
0102030405060708090
100
0.01 0.1 1 10 100Sieve Size (mm)
% P
assi
ng
SpecificationsDesign ADesign BDesign C
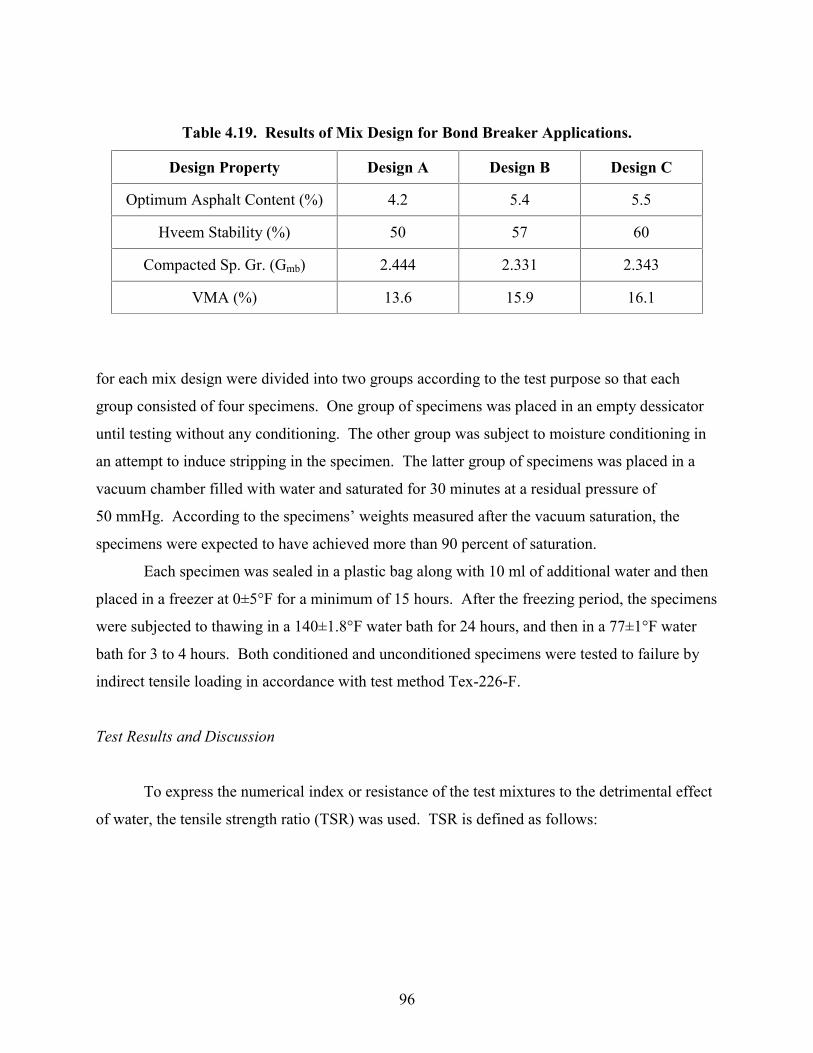
96
Table 4.19. Results of Mix Design for Bond Breaker Applications.
Design Property Design A Design B Design C
Optimum Asphalt Content (%) 4.2 5.4 5.5
Hveem Stability (%) 50 57 60
Compacted Sp. Gr. (Gmb) 2.444 2.331 2.343
VMA (%) 13.6 15.9 16.1
for each mix design were divided into two groups according to the test purpose so that each
group consisted of four specimens. One group of specimens was placed in an empty dessicator
until testing without any conditioning. The other group was subject to moisture conditioning in
an attempt to induce stripping in the specimen. The latter group of specimens was placed in a
vacuum chamber filled with water and saturated for 30 minutes at a residual pressure of
50 mmHg. According to the specimens’ weights measured after the vacuum saturation, the
specimens were expected to have achieved more than 90 percent of saturation.
Each specimen was sealed in a plastic bag along with 10 ml of additional water and then
placed in a freezer at 0±5°F for a minimum of 15 hours. After the freezing period, the specimens
were subjected to thawing in a 140±1.8°F water bath for 24 hours, and then in a 77±1°F water
bath for 3 to 4 hours. Both conditioned and unconditioned specimens were tested to failure by
indirect tensile loading in accordance with test method Tex-226-F.
Test Results and Discussion
To express the numerical index or resistance of the test mixtures to the detrimental effect
of water, the tensile strength ratio (TSR) was used. TSR is defined as follows:
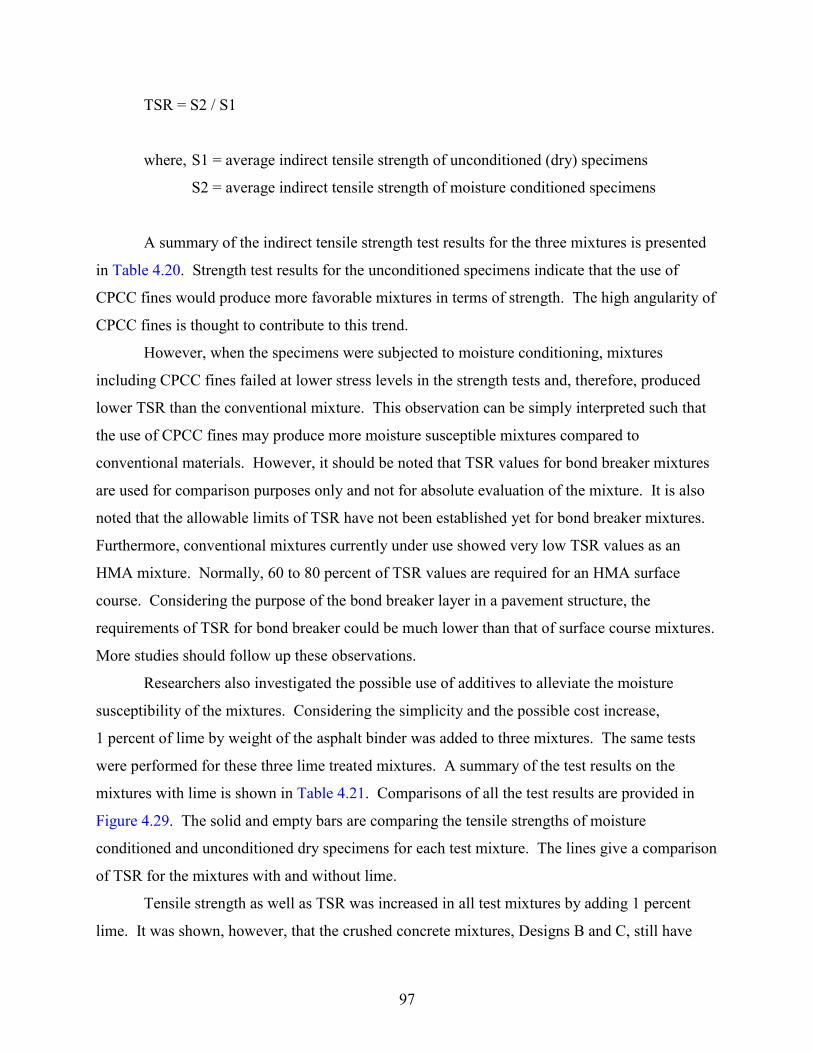
97
TSR = S2 / S1
where, S1 = average indirect tensile strength of unconditioned (dry) specimens
S2 = average indirect tensile strength of moisture conditioned specimens
A summary of the indirect tensile strength test results for the three mixtures is presented
in Table 4.20. Strength test results for the unconditioned specimens indicate that the use of
CPCC fines would produce more favorable mixtures in terms of strength. The high angularity of
CPCC fines is thought to contribute to this trend.
However, when the specimens were subjected to moisture conditioning, mixtures
including CPCC fines failed at lower stress levels in the strength tests and, therefore, produced
lower TSR than the conventional mixture. This observation can be simply interpreted such that
the use of CPCC fines may produce more moisture susceptible mixtures compared to
conventional materials. However, it should be noted that TSR values for bond breaker mixtures
are used for comparison purposes only and not for absolute evaluation of the mixture. It is also
noted that the allowable limits of TSR have not been established yet for bond breaker mixtures.
Furthermore, conventional mixtures currently under use showed very low TSR values as an
HMA mixture. Normally, 60 to 80 percent of TSR values are required for an HMA surface
course. Considering the purpose of the bond breaker layer in a pavement structure, the
requirements of TSR for bond breaker could be much lower than that of surface course mixtures.
More studies should follow up these observations.
Researchers also investigated the possible use of additives to alleviate the moisture
susceptibility of the mixtures. Considering the simplicity and the possible cost increase,
1 percent of lime by weight of the asphalt binder was added to three mixtures. The same tests
were performed for these three lime treated mixtures. A summary of the test results on the
mixtures with lime is shown in Table 4.21. Comparisons of all the test results are provided in
Figure 4.29. The solid and empty bars are comparing the tensile strengths of moisture
conditioned and unconditioned dry specimens for each test mixture. The lines give a comparison
of TSR for the mixtures with and without lime.
Tensile strength as well as TSR was increased in all test mixtures by adding 1 percent
lime. It was shown, however, that the crushed concrete mixtures, Designs B and C, still have

98
lower TSR than the conventional Design A mixture. It was also shown that the TSR of crushed
concrete mixtures with 1 percent lime approaches the TSR of the conventional Design A mixture
without lime. It is noteworthy that the Design A mixture is currently used without lime and
without any reported problems relative to moisture damage.
Table 4.20. Tensile Strength Test Results for HMA Bond Breaker Mixtures.
Design A Design B Design C
S1 67.6 83.4 79.3 Average Indirect Tensile Strength
(psi) S2 26.6 23.8 19.2
Tensile Strength Ratio, TSR (%) 39.3 28.5 24.2
Table 4.21. Tensile Strength Test Results for 1 Percent Lime Added HMA Bond Breaker Mixtures.
Design A Design B Design C
S1 70.5 93.2 90.6 Average Indirect Tensile Strength
(psi) S2 47.2 37.2 28.2
Tensile Strength Ratio, TSR (%) 67.0 39.9 31.1
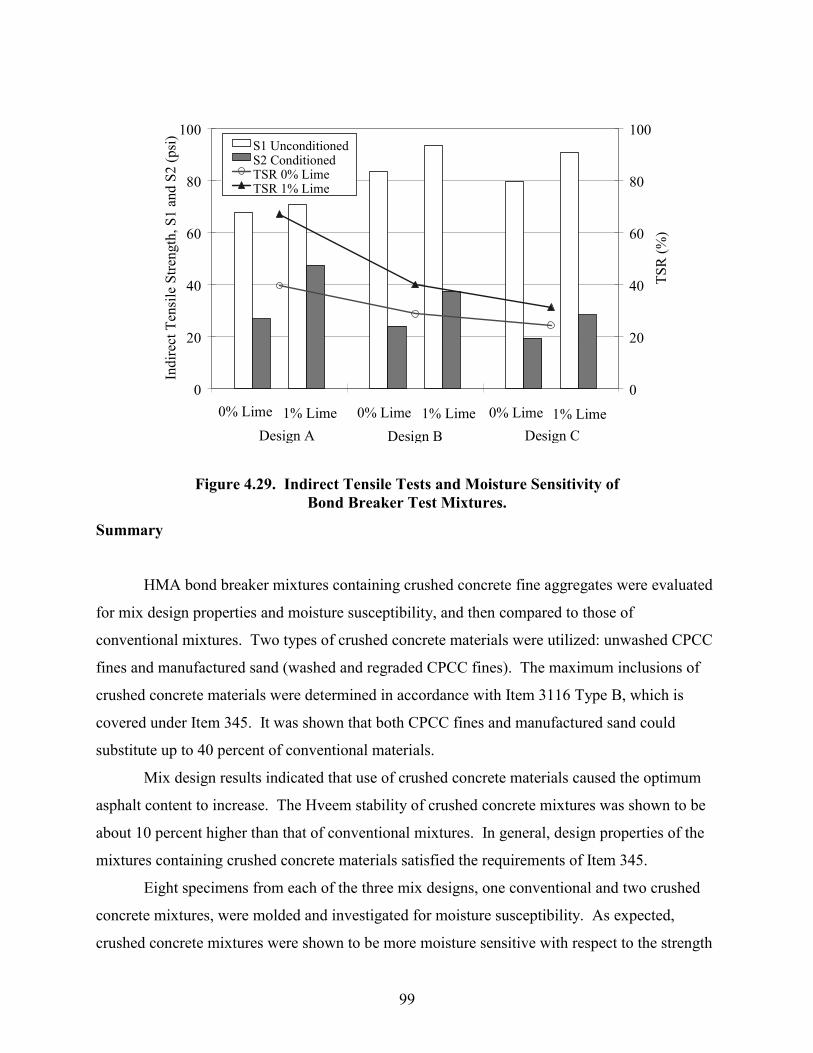
99
Figure 4.29. Indirect Tensile Tests and Moisture Sensitivity of
Bond Breaker Test Mixtures.
Summary
HMA bond breaker mixtures containing crushed concrete fine aggregates were evaluated
for mix design properties and moisture susceptibility, and then compared to those of
conventional mixtures. Two types of crushed concrete materials were utilized: unwashed CPCC
fines and manufactured sand (washed and regraded CPCC fines). The maximum inclusions of
crushed concrete materials were determined in accordance with Item 3116 Type B, which is
covered under Item 345. It was shown that both CPCC fines and manufactured sand could
substitute up to 40 percent of conventional materials.
Mix design results indicated that use of crushed concrete materials caused the optimum
asphalt content to increase. The Hveem stability of crushed concrete mixtures was shown to be
about 10 percent higher than that of conventional mixtures. In general, design properties of the
mixtures containing crushed concrete materials satisfied the requirements of Item 345.
Eight specimens from each of the three mix designs, one conventional and two crushed
concrete mixtures, were molded and investigated for moisture susceptibility. As expected,
crushed concrete mixtures were shown to be more moisture sensitive with respect to the strength
0
20
40
60
80
100
Indi
rect
Ten
sile
Stre
ngth
, S1
and
S2 (p
si)
0
20
40
60
80
100
TSR
(%)
S1 UnconditionedS2 ConditionedTSR 0% LimeTSR 1% Lime
0% Lime 0% Lime1% Lime 1% Lime 0% Lime 1% LimeDesign A Design B Design C

100
property than conventional mixtures. Possible use of lime was investigated to alleviate the
moisture sensitivity of crushed concrete mixtures. Crushed concrete mixtures including
1 percent lime showed a reduction in moisture sensitivity to the level experienced in
conventional mixtures.
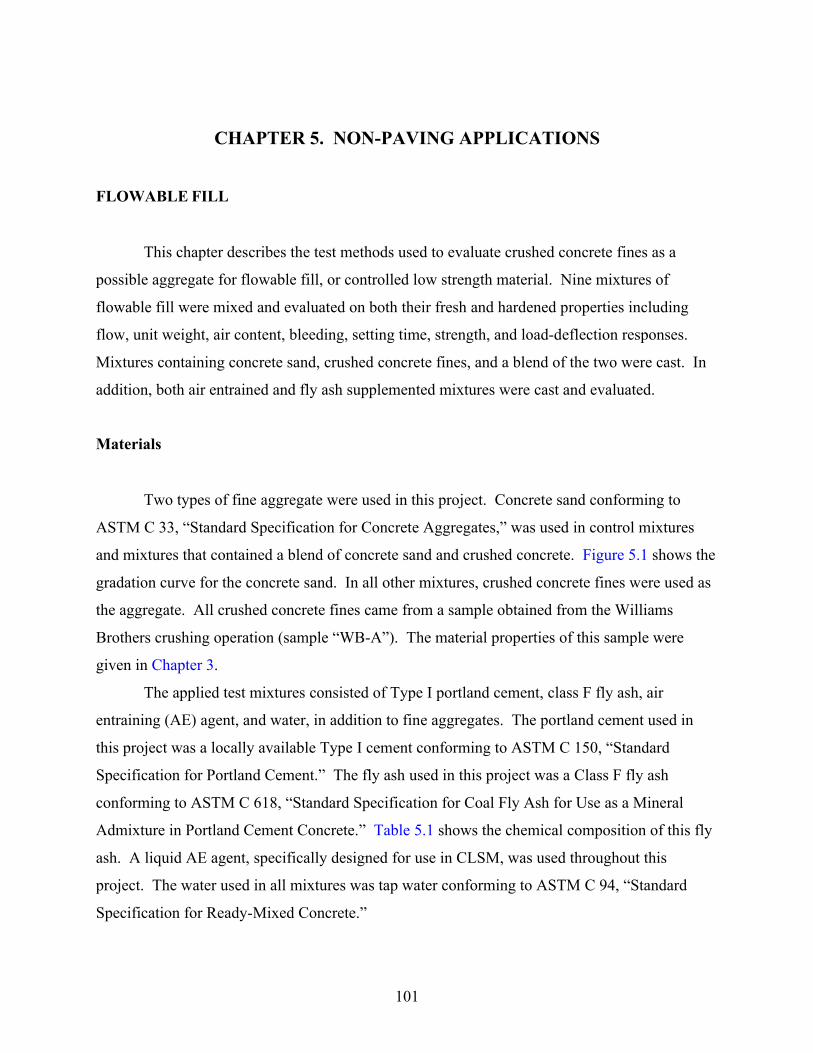
101
CHAPTER 5. NON-PAVING APPLICATIONS
FLOWABLE FILL
This chapter describes the test methods used to evaluate crushed concrete fines as a
possible aggregate for flowable fill, or controlled low strength material. Nine mixtures of
flowable fill were mixed and evaluated on both their fresh and hardened properties including
flow, unit weight, air content, bleeding, setting time, strength, and load-deflection responses.
Mixtures containing concrete sand, crushed concrete fines, and a blend of the two were cast. In
addition, both air entrained and fly ash supplemented mixtures were cast and evaluated.
Materials
Two types of fine aggregate were used in this project. Concrete sand conforming to
ASTM C 33, “Standard Specification for Concrete Aggregates,” was used in control mixtures
and mixtures that contained a blend of concrete sand and crushed concrete. Figure 5.1 shows the
gradation curve for the concrete sand. In all other mixtures, crushed concrete fines were used as
the aggregate. All crushed concrete fines came from a sample obtained from the Williams
Brothers crushing operation (sample “WB-A”). The material properties of this sample were
given in Chapter 3.
The applied test mixtures consisted of Type I portland cement, class F fly ash, air
entraining (AE) agent, and water, in addition to fine aggregates. The portland cement used in
this project was a locally available Type I cement conforming to ASTM C 150, “Standard
Specification for Portland Cement.” The fly ash used in this project was a Class F fly ash
conforming to ASTM C 618, “Standard Specification for Coal Fly Ash for Use as a Mineral
Admixture in Portland Cement Concrete.” Table 5.1 shows the chemical composition of this fly
ash. A liquid AE agent, specifically designed for use in CLSM, was used throughout this
project. The water used in all mixtures was tap water conforming to ASTM C 94, “Standard
Specification for Ready-Mixed Concrete.”
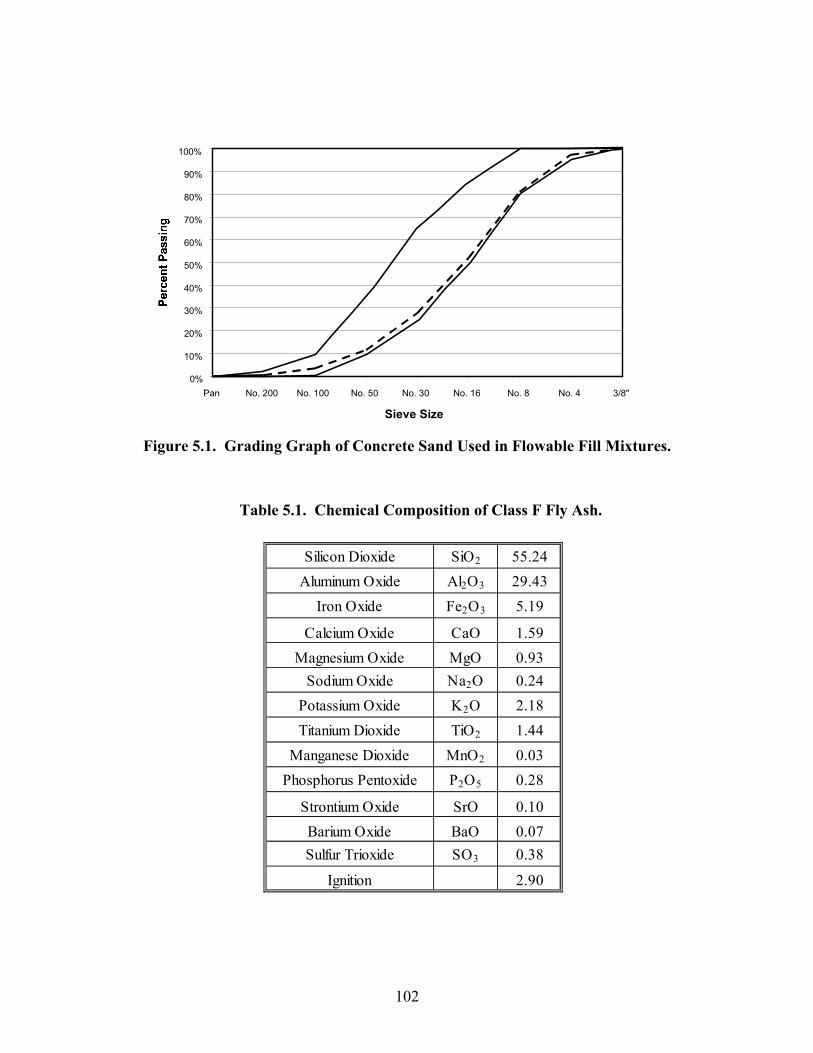
102
Figure 5.1. Grading Graph of Concrete Sand Used in Flowable Fill Mixtures.
Table 5.1. Chemical Composition of Class F Fly Ash.
Silicon Dioxide SiO2 55.24Aluminum Oxide Al2O3 29.43
Iron Oxide Fe2O3 5.19
Calcium Oxide CaO 1.59Magnesium Oxide MgO 0.93
Sodium Oxide Na2O 0.24Potassium Oxide K2O 2.18Titanium Dioxide TiO2 1.44
Manganese Dioxide MnO2 0.03Phosphorus Pentoxide P2O5 0.28
Strontium Oxide SrO 0.10Barium Oxide BaO 0.07Sulfur Trioxide SO3 0.38
Ignition 2.90
0%
10%
20%
30%
40%
50%
60%
70%
80%
90%
100%
Pan No. 200 No. 100 No. 50 No. 30 No. 16 No. 8 No. 4 3/8"
Sieve Size
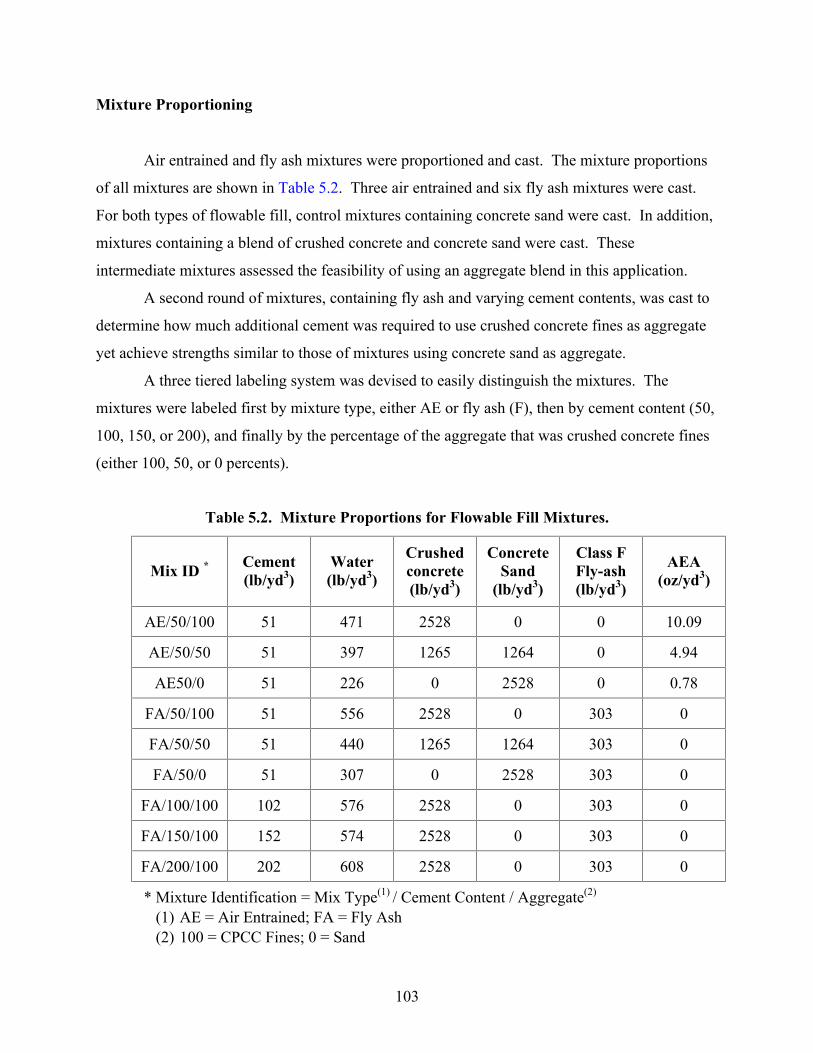
103
Mixture Proportioning
Air entrained and fly ash mixtures were proportioned and cast. The mixture proportions
of all mixtures are shown in Table 5.2. Three air entrained and six fly ash mixtures were cast.
For both types of flowable fill, control mixtures containing concrete sand were cast. In addition,
mixtures containing a blend of crushed concrete and concrete sand were cast. These
intermediate mixtures assessed the feasibility of using an aggregate blend in this application.
A second round of mixtures, containing fly ash and varying cement contents, was cast to
determine how much additional cement was required to use crushed concrete fines as aggregate
yet achieve strengths similar to those of mixtures using concrete sand as aggregate.
A three tiered labeling system was devised to easily distinguish the mixtures. The
mixtures were labeled first by mixture type, either AE or fly ash (F), then by cement content (50,
100, 150, or 200), and finally by the percentage of the aggregate that was crushed concrete fines
(either 100, 50, or 0 percents).
Table 5.2. Mixture Proportions for Flowable Fill Mixtures.
Mix ID * Cement (lb/yd3)
Water (lb/yd3)
Crushed concrete (lb/yd3)
Concrete Sand
(lb/yd3)
Class F Fly-ash (lb/yd3)
AEA (oz/yd3)
AE/50/100 51 471 2528 0 0 10.09
AE/50/50 51 397 1265 1264 0 4.94
AE50/0 51 226 0 2528 0 0.78
FA/50/100 51 556 2528 0 303 0
FA/50/50 51 440 1265 1264 303 0
FA/50/0 51 307 0 2528 303 0
FA/100/100 102 576 2528 0 303 0
FA/150/100 152 574 2528 0 303 0
FA/200/100 202 608 2528 0 303 0
* Mixture Identification = Mix Type(1) / Cement Content / Aggregate(2) (1) AE = Air Entrained; FA = Fly Ash (2) 100 = CPCC Fines; 0 = Sand
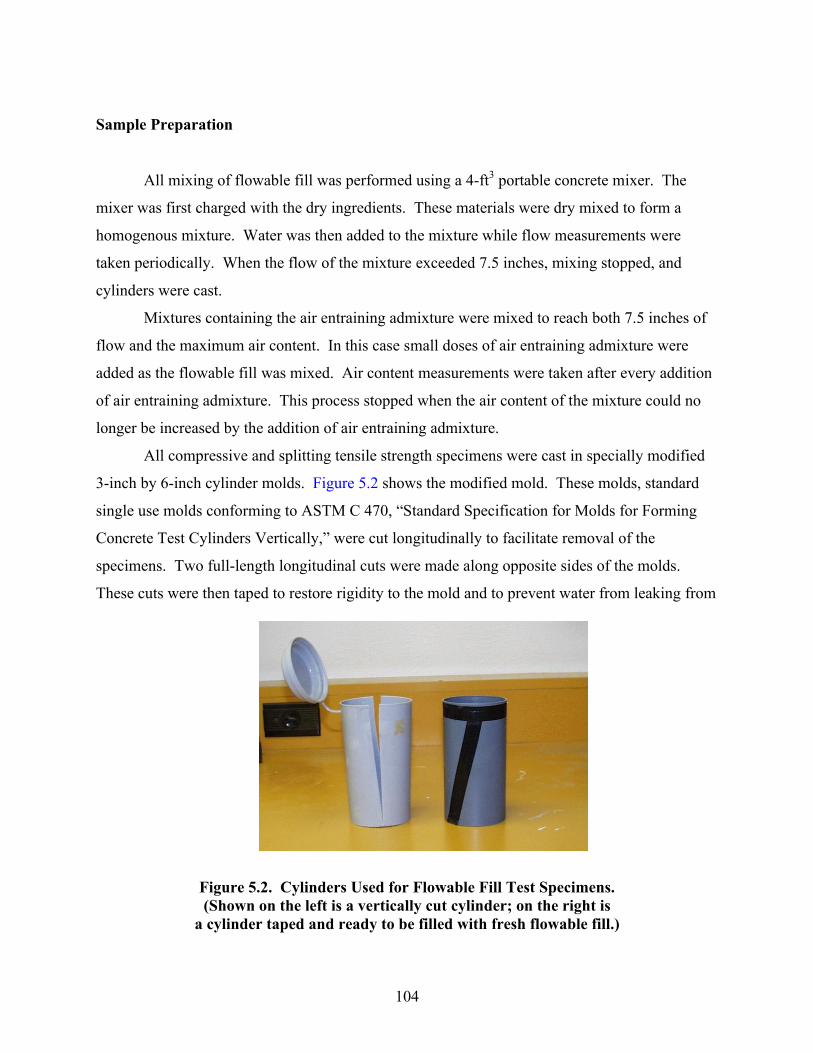
104
Sample Preparation
All mixing of flowable fill was performed using a 4-ft3 portable concrete mixer. The
mixer was first charged with the dry ingredients. These materials were dry mixed to form a
homogenous mixture. Water was then added to the mixture while flow measurements were
taken periodically. When the flow of the mixture exceeded 7.5 inches, mixing stopped, and
cylinders were cast.
Mixtures containing the air entraining admixture were mixed to reach both 7.5 inches of
flow and the maximum air content. In this case small doses of air entraining admixture were
added as the flowable fill was mixed. Air content measurements were taken after every addition
of air entraining admixture. This process stopped when the air content of the mixture could no
longer be increased by the addition of air entraining admixture.
All compressive and splitting tensile strength specimens were cast in specially modified
3-inch by 6-inch cylinder molds. Figure 5.2 shows the modified mold. These molds, standard
single use molds conforming to ASTM C 470, “Standard Specification for Molds for Forming
Concrete Test Cylinders Vertically,” were cut longitudinally to facilitate removal of the
specimens. Two full-length longitudinal cuts were made along opposite sides of the molds.
These cuts were then taped to restore rigidity to the mold and to prevent water from leaking from
Figure 5.2. Cylinders Used for Flowable Fill Test Specimens. (Shown on the left is a vertically cut cylinder; on the right is
a cylinder taped and ready to be filled with fresh flowable fill.)

105
the molds when the cylinders were cast. To remove the cylinders, the tape was removed, and the
opposite sides of the cylinder were pulled apart. This modification allowed extremely low
strength cylinders to be removed with minimal damage.
Immediately after casting, all specimens were placed in a moist curing room kept at 73°C
and 100% RH, conforming to ASTM C 511, “Standard Specification for Moist Cabinets, Moist
Rooms, and Water Storage Tanks Used in the Testing of Hydraulic Cements and Concretes.”
Specimens were left in this room, in their molds with their caps on, until they were tested.
Flow
The ability for a flowable fill mixture to flow easily into a confined area is one of its most
important properties. For this reason, all mixtures were mixed to achieve a constant flow. The
flow of each mixture was measured using ASTM D 6103, “Standard Test Method for Flow
Consistency of Controlled Low Strength Material.” This method consists of lifting a bottomless
3-inch by 6-inch cylinder filled with flowable fill. As the cylinder is lifted, the material flows
out. The diameter of the resulting specimen is measured. Typically an 8-inch diameter indicates
sufficient flow.
All mixtures had a final flow value between 7.75 inches and 8.5 inches. Table 5.3 shows
the water required to achieve approximately 8 inches of flow and the final flow value. The data
in Table 5.3 show that flowable fill using crushed concrete fines requires considerably more
water to reach a given flow value than a similar mixture made with concrete sand. The increased
water demand is believed to be caused by the large amount of very fine particles found in the
crushed concrete fines. Figure 5.3 shows a collapsed flow specimen and the method used to
measure flow of the mixture.
Unit Weight, Air Content, and Bleeding
The unit weight and air content of all flowable fill mixtures were measured according to
ASTM D 6023, “Standard Test Method for Flow Consistency of Controlled Low-Strength
Material.” The bleeding of each mixture was measured during the 24 hours immediately
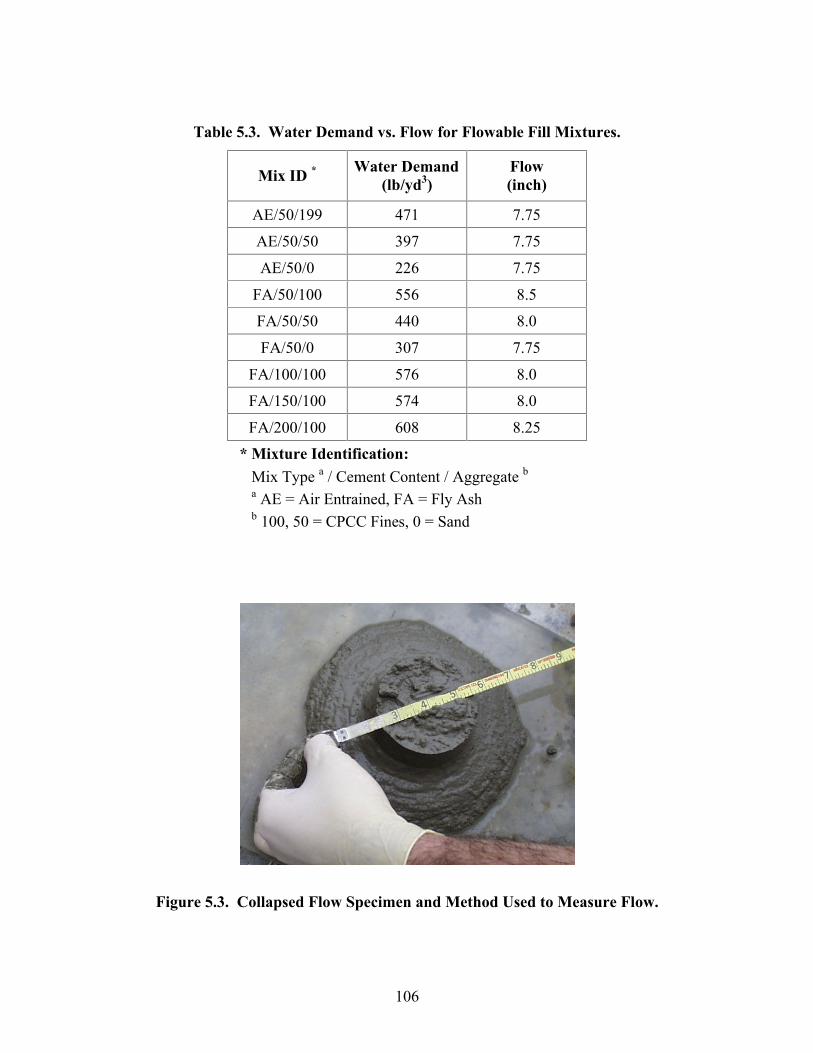
106
Table 5.3. Water Demand vs. Flow for Flowable Fill Mixtures.
Mix ID * Water Demand (lb/yd3)
Flow (inch)
AE/50/199 471 7.75
AE/50/50 397 7.75
AE/50/0 226 7.75
FA/50/100 556 8.5
FA/50/50 440 8.0
FA/50/0 307 7.75
FA/100/100 576 8.0
FA/150/100 574 8.0
FA/200/100 608 8.25 * Mixture Identification: Mix Type a / Cement Content / Aggregate b a AE = Air Entrained, FA = Fly Ash b 100, 50 = CPCC Fines, 0 = Sand
Figure 5.3. Collapsed Flow Specimen and Method Used to Measure Flow.
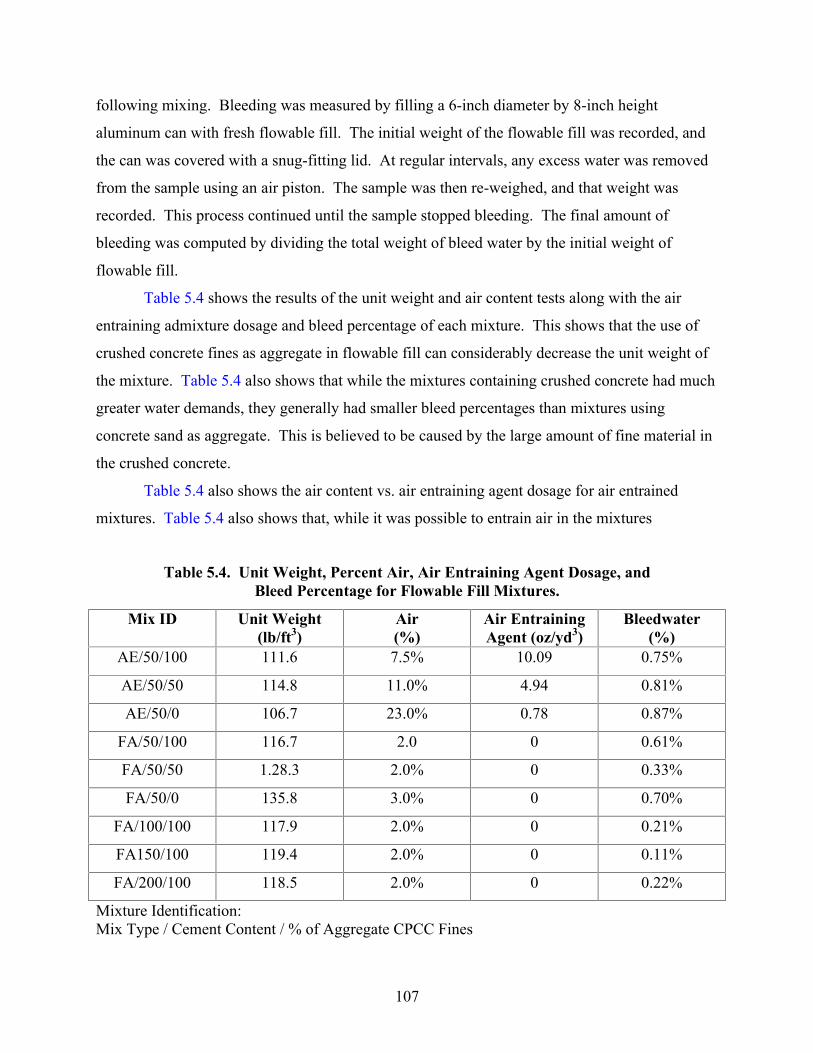
107
following mixing. Bleeding was measured by filling a 6-inch diameter by 8-inch height
aluminum can with fresh flowable fill. The initial weight of the flowable fill was recorded, and
the can was covered with a snug-fitting lid. At regular intervals, any excess water was removed
from the sample using an air piston. The sample was then re-weighed, and that weight was
recorded. This process continued until the sample stopped bleeding. The final amount of
bleeding was computed by dividing the total weight of bleed water by the initial weight of
flowable fill.
Table 5.4 shows the results of the unit weight and air content tests along with the air
entraining admixture dosage and bleed percentage of each mixture. This shows that the use of
crushed concrete fines as aggregate in flowable fill can considerably decrease the unit weight of
the mixture. Table 5.4 also shows that while the mixtures containing crushed concrete had much
greater water demands, they generally had smaller bleed percentages than mixtures using
concrete sand as aggregate. This is believed to be caused by the large amount of fine material in
the crushed concrete.
Table 5.4 also shows the air content vs. air entraining agent dosage for air entrained
mixtures. Table 5.4 also shows that, while it was possible to entrain air in the mixtures
Table 5.4. Unit Weight, Percent Air, Air Entraining Agent Dosage, and Bleed Percentage for Flowable Fill Mixtures.
Mix ID Unit Weight (lb/ft3)
Air (%)
Air Entraining Agent (oz/yd3)
Bleedwater (%)
AE/50/100 111.6 7.5% 10.09 0.75%
AE/50/50 114.8 11.0% 4.94 0.81%
AE/50/0 106.7 23.0% 0.78 0.87%
FA/50/100 116.7 2.0 0 0.61%
FA/50/50 1.28.3 2.0% 0 0.33%
FA/50/0 135.8 3.0% 0 0.70%
FA/100/100 117.9 2.0% 0 0.21%
FA150/100 119.4 2.0% 0 0.11%
FA/200/100 118.5 2.0% 0 0.22%
Mixture Identification: Mix Type / Cement Content / % of Aggregate CPCC Fines
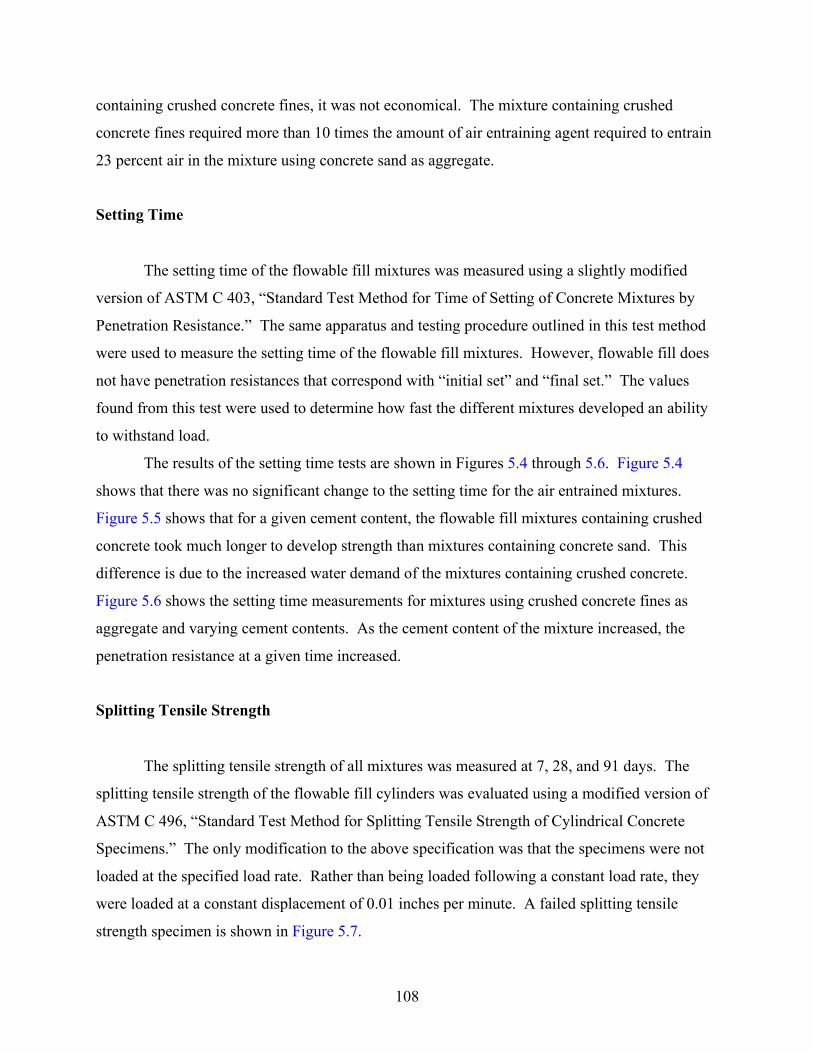
108
containing crushed concrete fines, it was not economical. The mixture containing crushed
concrete fines required more than 10 times the amount of air entraining agent required to entrain
23 percent air in the mixture using concrete sand as aggregate.
Setting Time
The setting time of the flowable fill mixtures was measured using a slightly modified
version of ASTM C 403, “Standard Test Method for Time of Setting of Concrete Mixtures by
Penetration Resistance.” The same apparatus and testing procedure outlined in this test method
were used to measure the setting time of the flowable fill mixtures. However, flowable fill does
not have penetration resistances that correspond with “initial set” and “final set.” The values
found from this test were used to determine how fast the different mixtures developed an ability
to withstand load.
The results of the setting time tests are shown in Figures 5.4 through 5.6. Figure 5.4
shows that there was no significant change to the setting time for the air entrained mixtures.
Figure 5.5 shows that for a given cement content, the flowable fill mixtures containing crushed
concrete took much longer to develop strength than mixtures containing concrete sand. This
difference is due to the increased water demand of the mixtures containing crushed concrete.
Figure 5.6 shows the setting time measurements for mixtures using crushed concrete fines as
aggregate and varying cement contents. As the cement content of the mixture increased, the
penetration resistance at a given time increased.
Splitting Tensile Strength
The splitting tensile strength of all mixtures was measured at 7, 28, and 91 days. The
splitting tensile strength of the flowable fill cylinders was evaluated using a modified version of
ASTM C 496, “Standard Test Method for Splitting Tensile Strength of Cylindrical Concrete
Specimens.” The only modification to the above specification was that the specimens were not
loaded at the specified load rate. Rather than being loaded following a constant load rate, they
were loaded at a constant displacement of 0.01 inches per minute. A failed splitting tensile
strength specimen is shown in Figure 5.7.
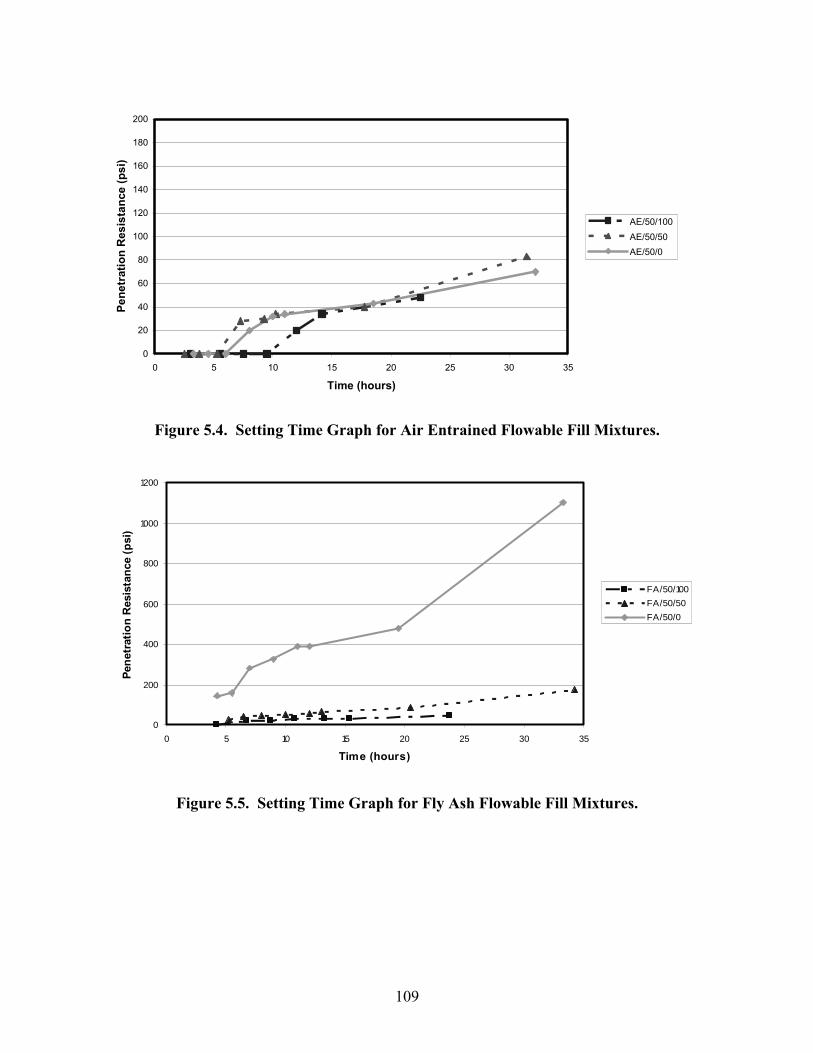
109
0
20
40
60
80
100
120
140
160
180
200
0 5 10 15 20 25 30 35
Time (hours)
Pene
trat
ion
Res
ista
nce
(psi
)
AE/50/100AE/50/50AE/50/0
Figure 5.4. Setting Time Graph for Air Entrained Flowable Fill Mixtures.
0
200
400
600
800
1000
1200
0 5 10 15 20 25 30 35
Time (hours)
Pene
trat
ion
Res
ista
nce
(psi
)
F A/50/100
F A/50/50
F A/50/0
Figure 5.5. Setting Time Graph for Fly Ash Flowable Fill Mixtures.
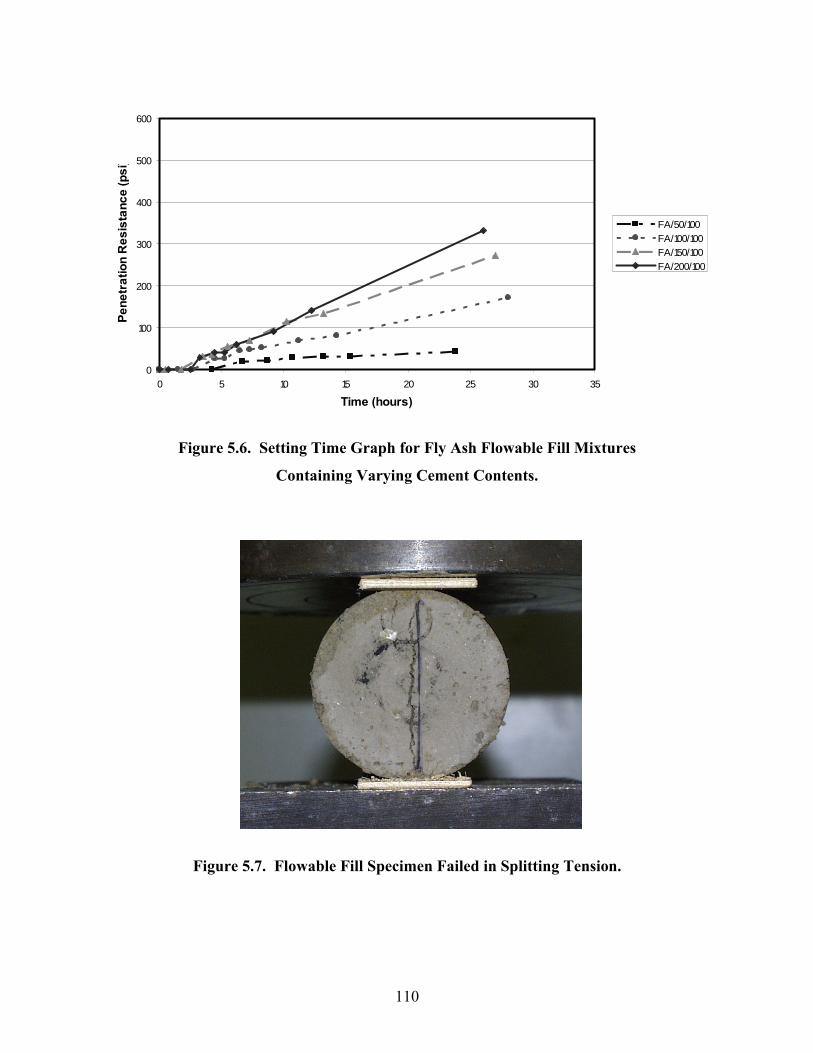
110
0
100
200
300
400
500
600
0 5 10 15 20 25 30 35
Time (hours)
Pene
trat
ion
Res
ista
nce
(ps i
)
FA/50/100FA/100/100FA/150/100FA/200/100
Figure 5.6. Setting Time Graph for Fly Ash Flowable Fill Mixtures
Containing Varying Cement Contents.
Figure 5.7. Flowable Fill Specimen Failed in Splitting Tension.
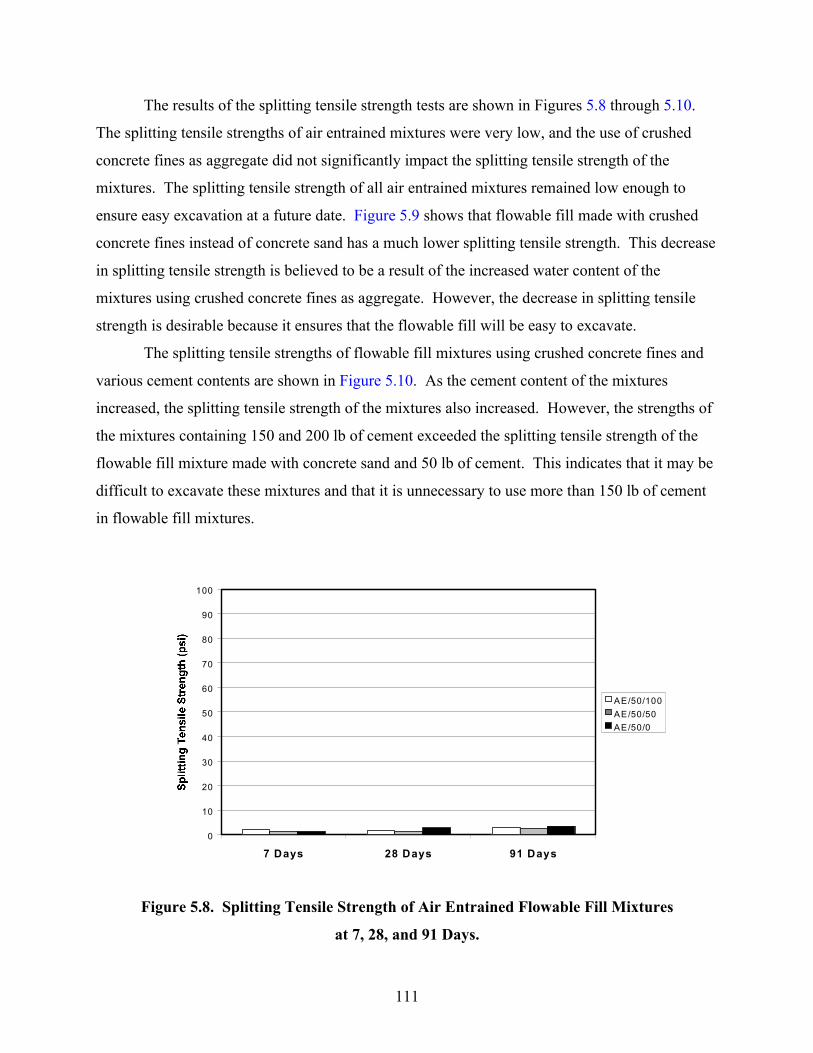
111
The results of the splitting tensile strength tests are shown in Figures 5.8 through 5.10.
The splitting tensile strengths of air entrained mixtures were very low, and the use of crushed
concrete fines as aggregate did not significantly impact the splitting tensile strength of the
mixtures. The splitting tensile strength of all air entrained mixtures remained low enough to
ensure easy excavation at a future date. Figure 5.9 shows that flowable fill made with crushed
concrete fines instead of concrete sand has a much lower splitting tensile strength. This decrease
in splitting tensile strength is believed to be a result of the increased water content of the
mixtures using crushed concrete fines as aggregate. However, the decrease in splitting tensile
strength is desirable because it ensures that the flowable fill will be easy to excavate.
The splitting tensile strengths of flowable fill mixtures using crushed concrete fines and
various cement contents are shown in Figure 5.10. As the cement content of the mixtures
increased, the splitting tensile strength of the mixtures also increased. However, the strengths of
the mixtures containing 150 and 200 lb of cement exceeded the splitting tensile strength of the
flowable fill mixture made with concrete sand and 50 lb of cement. This indicates that it may be
difficult to excavate these mixtures and that it is unnecessary to use more than 150 lb of cement
in flowable fill mixtures.
Figure 5.8. Splitting Tensile Strength of Air Entrained Flowable Fill Mixtures
at 7, 28, and 91 Days.
0
10
20
30
40
50
60
70
80
90
100
7 Days 28 Days 91 Days
AE/50/100AE/50/50AE/50/0
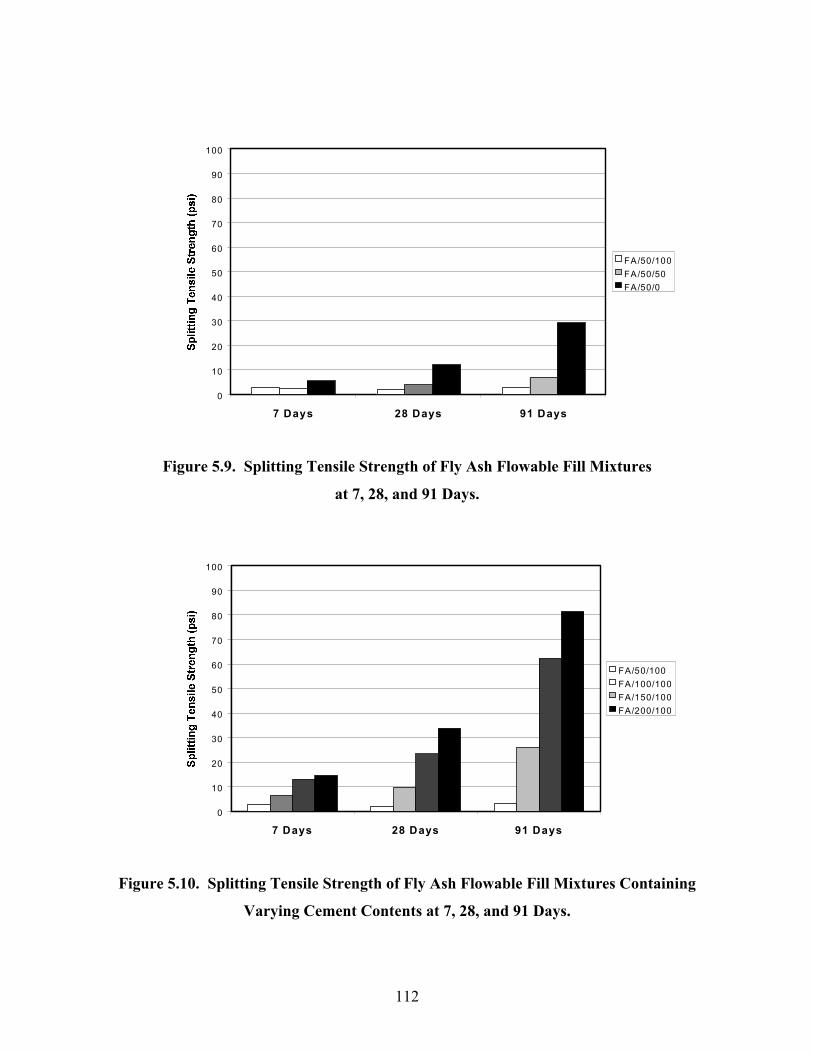
112
Figure 5.9. Splitting Tensile Strength of Fly Ash Flowable Fill Mixtures
at 7, 28, and 91 Days.
Figure 5.10. Splitting Tensile Strength of Fly Ash Flowable Fill Mixtures Containing
Varying Cement Contents at 7, 28, and 91 Days.
0
10
20
30
40
50
60
70
80
90
100
7 Days 28 Days 91 Days
FA/50/100FA/50/50FA/50/0
0
10
20
30
40
50
60
70
80
90
100
7 Days 28 Days 91 Days
FA/50/100FA/100/100FA/150/100FA/200/100
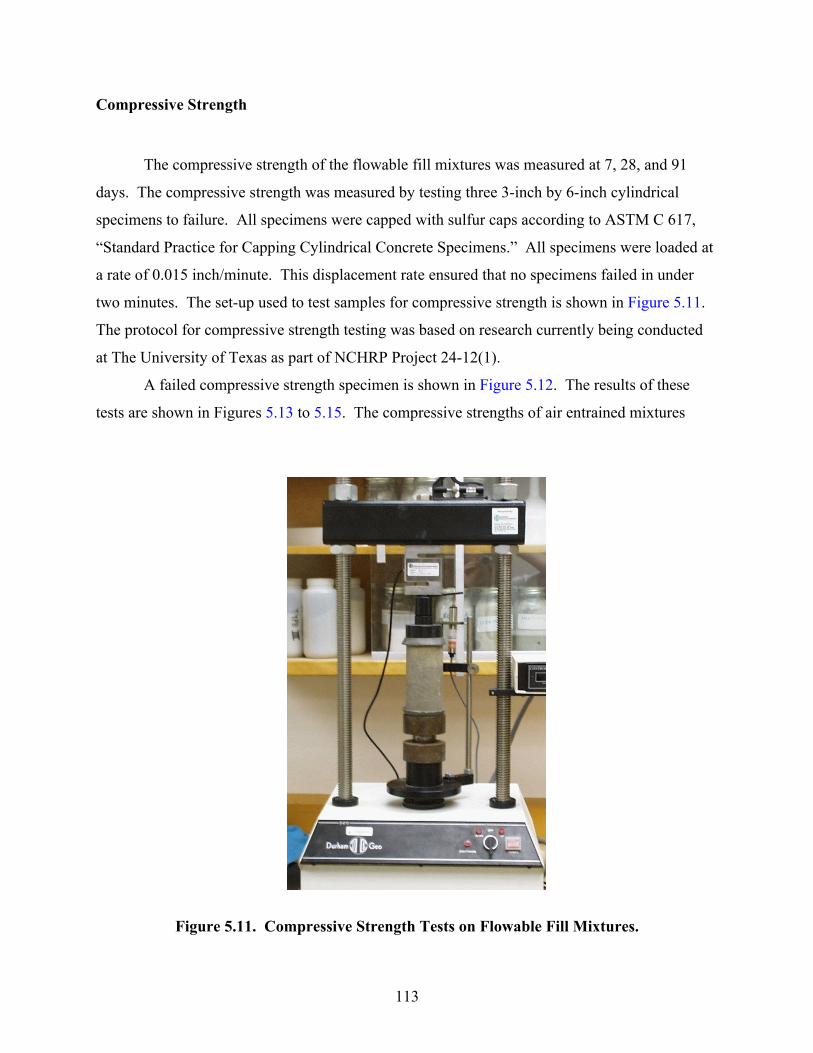
113
Compressive Strength
The compressive strength of the flowable fill mixtures was measured at 7, 28, and 91
days. The compressive strength was measured by testing three 3-inch by 6-inch cylindrical
specimens to failure. All specimens were capped with sulfur caps according to ASTM C 617,
“Standard Practice for Capping Cylindrical Concrete Specimens.” All specimens were loaded at
a rate of 0.015 inch/minute. This displacement rate ensured that no specimens failed in under
two minutes. The set-up used to test samples for compressive strength is shown in Figure 5.11.
The protocol for compressive strength testing was based on research currently being conducted
at The University of Texas as part of NCHRP Project 24-12(1).
A failed compressive strength specimen is shown in Figure 5.12. The results of these
tests are shown in Figures 5.13 to 5.15. The compressive strengths of air entrained mixtures
Figure 5.11. Compressive Strength Tests on Flowable Fill Mixtures.
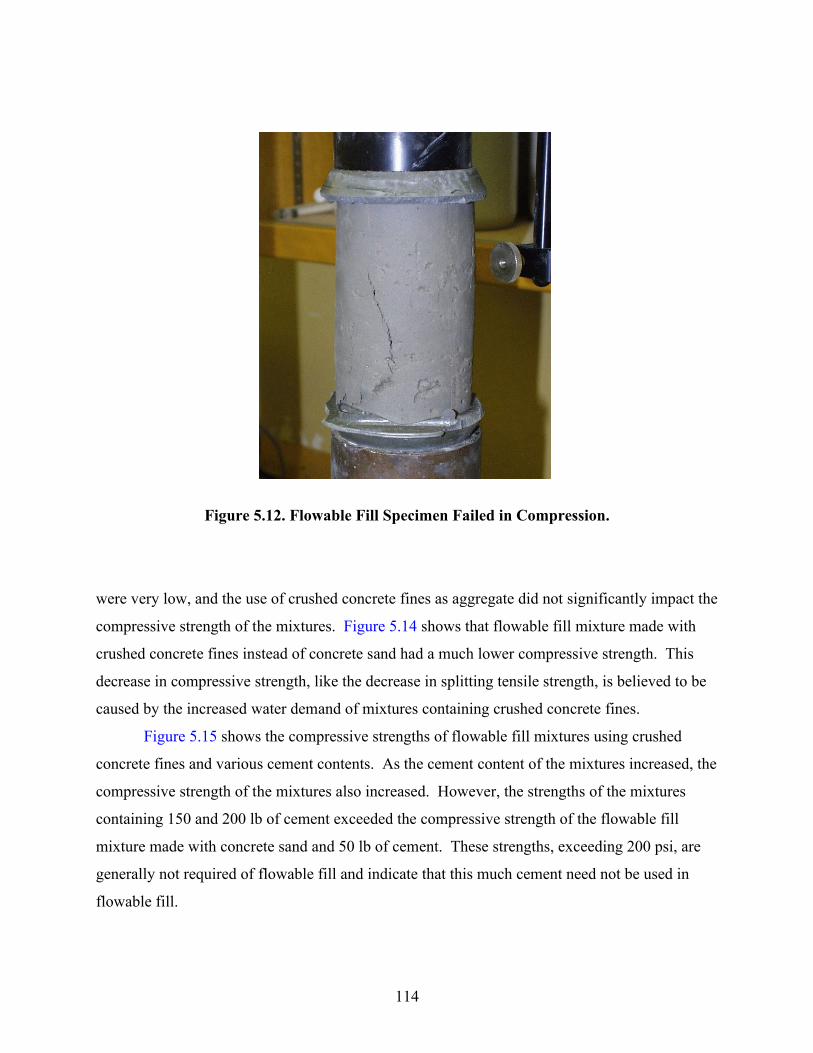
114
Figure 5.12. Flowable Fill Specimen Failed in Compression.
were very low, and the use of crushed concrete fines as aggregate did not significantly impact the
compressive strength of the mixtures. Figure 5.14 shows that flowable fill mixture made with
crushed concrete fines instead of concrete sand had a much lower compressive strength. This
decrease in compressive strength, like the decrease in splitting tensile strength, is believed to be
caused by the increased water demand of mixtures containing crushed concrete fines.
Figure 5.15 shows the compressive strengths of flowable fill mixtures using crushed
concrete fines and various cement contents. As the cement content of the mixtures increased, the
compressive strength of the mixtures also increased. However, the strengths of the mixtures
containing 150 and 200 lb of cement exceeded the compressive strength of the flowable fill
mixture made with concrete sand and 50 lb of cement. These strengths, exceeding 200 psi, are
generally not required of flowable fill and indicate that this much cement need not be used in
flowable fill.
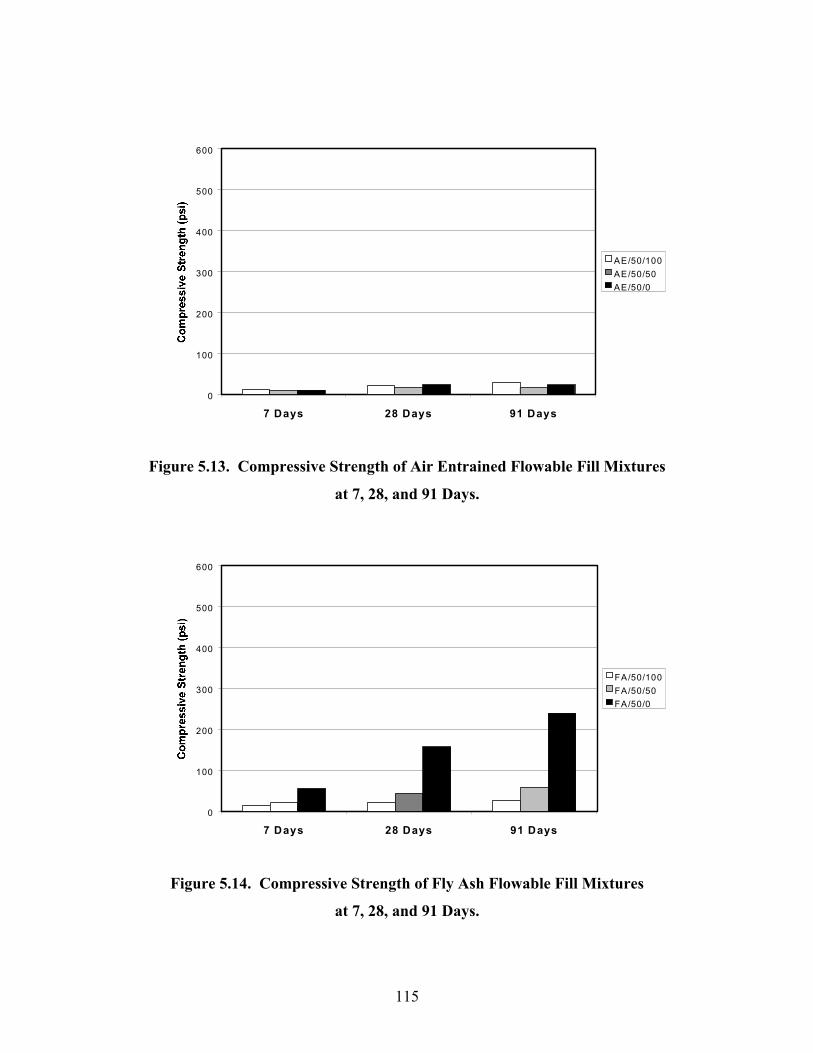
115
Figure 5.13. Compressive Strength of Air Entrained Flowable Fill Mixtures
at 7, 28, and 91 Days.
Figure 5.14. Compressive Strength of Fly Ash Flowable Fill Mixtures
at 7, 28, and 91 Days.
0
100
200
300
400
500
600
7 Days 28 Days 91 Days
AE/50/100AE/50/50AE/50/0
0
100
200
300
400
500
600
7 Days 28 Days 91 Days
FA/50/100FA/50/50FA/50/0

116
Figure 5.15. Compressive Strength of Fly Ash Flowable Fill Mixtures Containing
Varying Cement Contents at 7, 28, and 91 Days.
Load-Deflection Response
The load-deflection response of each mixture was measured while testing the cylinders in
compression. During every compressive strength test, load and displacement readings were
taken every 1⁄2 second. These load displacement curves were plotted to help illustrate the effect
of different mixture proportions on the properties of flowable fill.
The load-deflection response of selected flowable fill mixtures is shown in Figures 5.16
to 5.18. Figure 5.16 shows typical load-deflection behavior of the three air entrained mixtures at
28 days. Although the three mixtures have similar ultimate compressive strengths, the load-
deflection behavior of the three mixtures varies considerably. The control, mixture AE/50/0,
reaches its ultimate strength at a relatively small deflection and then rapidly unloads. In contrast,
the mixtures containing crushed concrete exhibit considerably more ductility and reach their
ultimate strength at larger deflections. Figure 5.17 shows the load-deflection response of
selected specimens from the fly ash mixtures. This figure shows that flowable fill using crushed
0
100
200
300
400
500
600
7 Days 28 Days 91 Days
FA/50/100FA/100/100FA/150/100FA/200/100
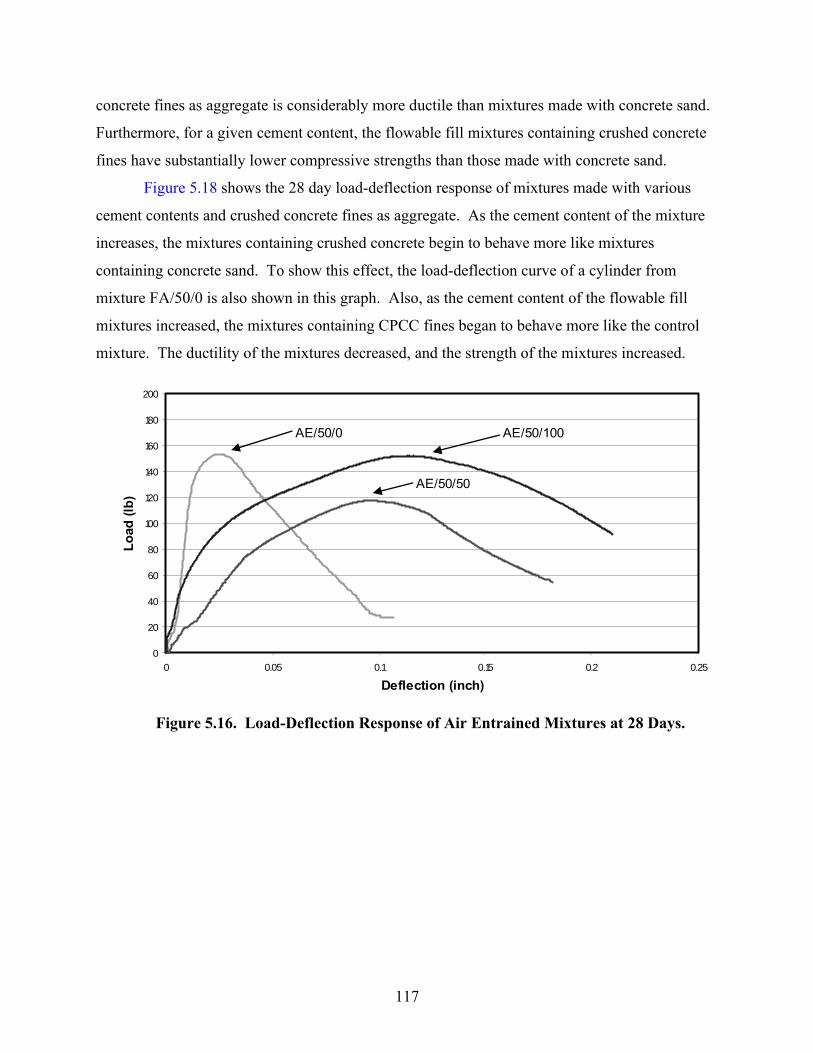
117
concrete fines as aggregate is considerably more ductile than mixtures made with concrete sand.
Furthermore, for a given cement content, the flowable fill mixtures containing crushed concrete
fines have substantially lower compressive strengths than those made with concrete sand.
Figure 5.18 shows the 28 day load-deflection response of mixtures made with various
cement contents and crushed concrete fines as aggregate. As the cement content of the mixture
increases, the mixtures containing crushed concrete begin to behave more like mixtures
containing concrete sand. To show this effect, the load-deflection curve of a cylinder from
mixture FA/50/0 is also shown in this graph. Also, as the cement content of the flowable fill
mixtures increased, the mixtures containing CPCC fines began to behave more like the control
mixture. The ductility of the mixtures decreased, and the strength of the mixtures increased.
0
20
40
60
80
100
120
140
160
180
200
0 0.05 0.1 0.15 0.2 0.25
Deflection (inch)
Load
(lb)
AE/50/100
AE/50/50
AE/50/0
Figure 5.16. Load-Deflection Response of Air Entrained Mixtures at 28 Days.
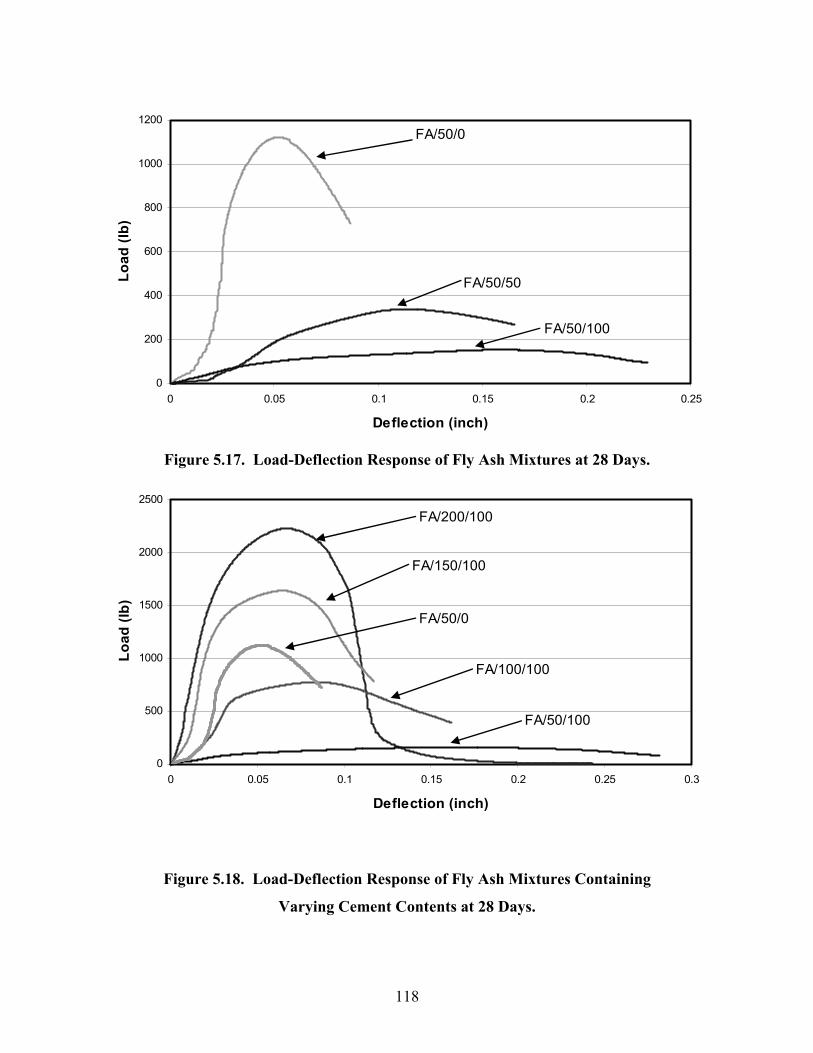
118
0
200
400
600
800
1000
1200
0 0.05 0.1 0.15 0.2 0.25
Deflection (inch)
Load
(lb)
FA/50/100
FA/50/50
FA/50/0
Figure 5.17. Load-Deflection Response of Fly Ash Mixtures at 28 Days.
0
500
1000
1500
2000
2500
0 0.05 0.1 0.15 0.2 0.25 0.3
Deflection (inch)
Load
(lb)
FA/50/100
FA/100/100
FA/200/100
FA/150/100
FA/50/0
Figure 5.18. Load-Deflection Response of Fly Ash Mixtures Containing
Varying Cement Contents at 28 Days.

119
Summary
Nine flowable fill mixtures, three air entrained and six using fly ash, were cast and
evaluated based on fresh and hardened properties. Mixtures containing crushed concrete fines
were compared to control mixtures that used concrete sand as aggregate. In addition, mixtures
using a blend of crushed concrete fines and concrete sand were cast to evaluate the feasibility of
using blended aggregates in flowable fill. A final set of mixtures, using fly ash and varying
cement contents, was tested to determine the additional amount of cement required to achieve
strengths similar to those of the control mixtures.
Air entrained mixtures using crushed concrete fines required much larger doses of air
entraining agent to achieve moderate air contents. Ten times the dosage used for the control
batch was added to the mixtures containing crushed concrete fines. This dosage only produced
air contents one-third of that of the control mixture. This difficulty to entrain air was likely
caused by the large amount of minus No. 200 material present in the crushed concrete fines.
The water demand for all mixtures, air entrained and fly ash, was considerably higher for
mixtures containing crushed concrete fines as aggregate compared to the water demand for the
control mixtures. The increased water demand was likely caused by the large amount of minus
No. 200 material in the crushed concrete fines. Consequently, the strengths of mixtures
containing crushed concrete fines were considerably lower than those of mixtures containing
concrete sand.
Flowable fill mixtures incorporating slight modifications to the mixture design exhibited
similar properties to flowable fill mixtures made with sand. The high fines content of crushed
concrete fines increased the water demand of mixtures making use of this material. However,
mixtures incorporating crushed concrete fines bled and subsided less due to the high fines
content of the crushed concrete fines.
It is difficult to entrain air into mixtures containing large amounts of fines due to the
deleterious effect these fines have on the entrained air. Mixtures containing fly ash and crushed
concrete fines are much weaker than similarly proportioned mixtures containing fly ash and
sand. This decrease in strength, caused by the increased water demand, can be compensated for
by increasing the cement content of mixtures using crushed concrete fines. Fly ash mixtures

120 120
containing crushed concrete fines also require more time to develop initial strength. This delay
in strength gain can also be overcome by increasing the cement content of the mixture.
PORTLAND CEMENT CONCRETE
This section describes the test methods used to evaluate crushed concrete fines as a
possible aggregate for portland cement concrete. Four mixtures of concrete were evaluated
based on both their fresh and hardened properties including slump, unit weight, air content, and
compressive and flexural strength. Mixtures containing CPCC fines and a blend of CPCC fines
and concrete sand were cast and evaluated.
Materials
A 3⁄4-inch river gravel, ASTM #67, was used as the coarse aggregate in all concrete
mixtures. Table 5.5 shows the grading of the coarse aggregate and the ASTM C-33, “Standard
Specification for Concrete Aggregate,” grading limits. Two types of fine aggregate were used in
this project. Concrete sand conforming to ASTM C 33, “Standard Specification for Concrete
Aggregates,” was used in mixtures that contained a blend of concrete sand and crushed concrete.
The grading of the ASTM C 33 sand is shown in Figure 5.19. In all other mixtures, crushed
concrete fines were used as the aggregate. All crushed concrete fines came from the large
sample obtained from the Williams Brothers crushing operation (sample “WB-A”). The material
properties of this sample are detailed in Chapter 3.
The portland cement used in this project was a locally available Type I cement
conforming to ASTM C 150, “Standard Specification for Portland Cement.” The water used in
all mixtures was tap water conforming to ASTM C 94, “Standard Specification for Ready-Mixed
Concrete.”
A mid-range water reducing admixture (MRWRA) was used throughout the project. The
manufacturer’s suggested dosage is 3 to 10 oz per 100 lb of cement. This mid-range water
reducer is described as an ASTM C 94 Type A and F admixture that is specially formulated to
reduce water demand and facilitate concrete placement. All mixtures in this project were given
the manufacturer’s maximum recommended dosage.
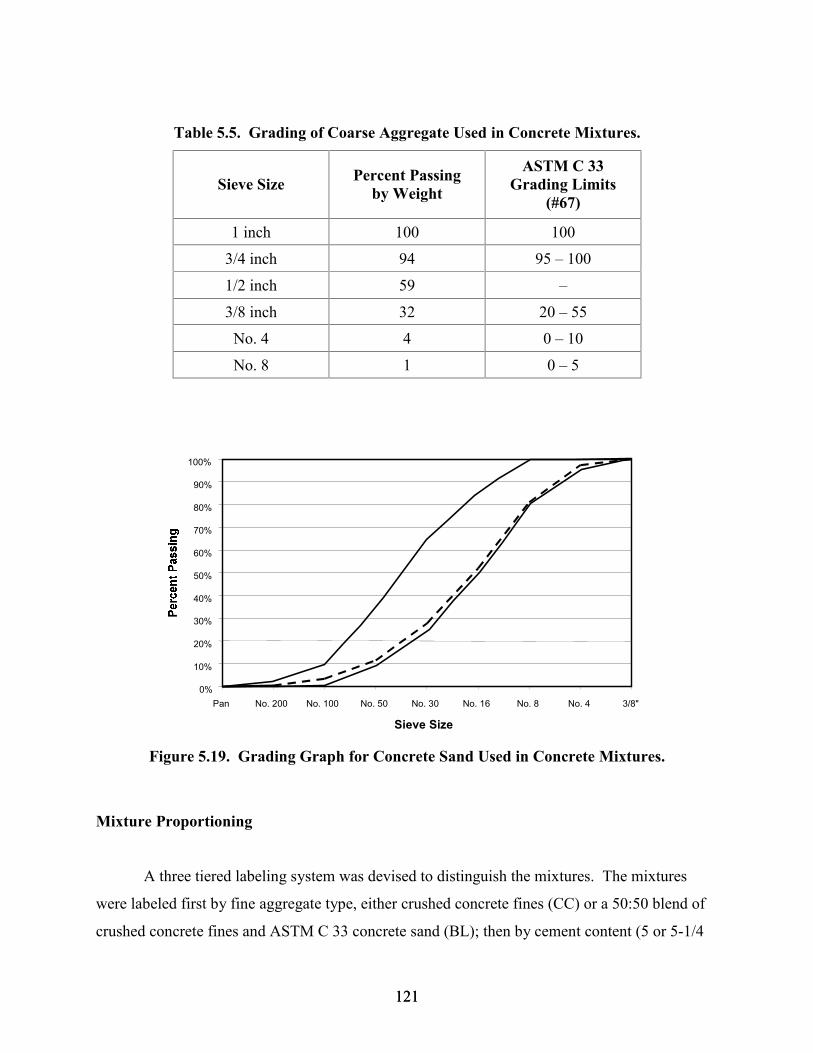
121 121
Table 5.5. Grading of Coarse Aggregate Used in Concrete Mixtures.
Sieve Size Percent Passing by Weight
ASTM C 33 Grading Limits
(#67)
1 inch 100 100
3/4 inch 94 95 – 100
1/2 inch 59 –
3/8 inch 32 20 – 55
No. 4 4 0 – 10
No. 8 1 0 – 5
Figure 5.19. Grading Graph for Concrete Sand Used in Concrete Mixtures.
Mixture Proportioning
A three tiered labeling system was devised to distinguish the mixtures. The mixtures
were labeled first by fine aggregate type, either crushed concrete fines (CC) or a 50:50 blend of
crushed concrete fines and ASTM C 33 concrete sand (BL); then by cement content (5 or 5-1/4
0%
10%
20%
30%
40%
50%
60%
70%
80%
90%
100%
Pan No. 200 No. 100 No. 50 No. 30 No. 16 No. 8 No. 4 3/8"
Sieve Size
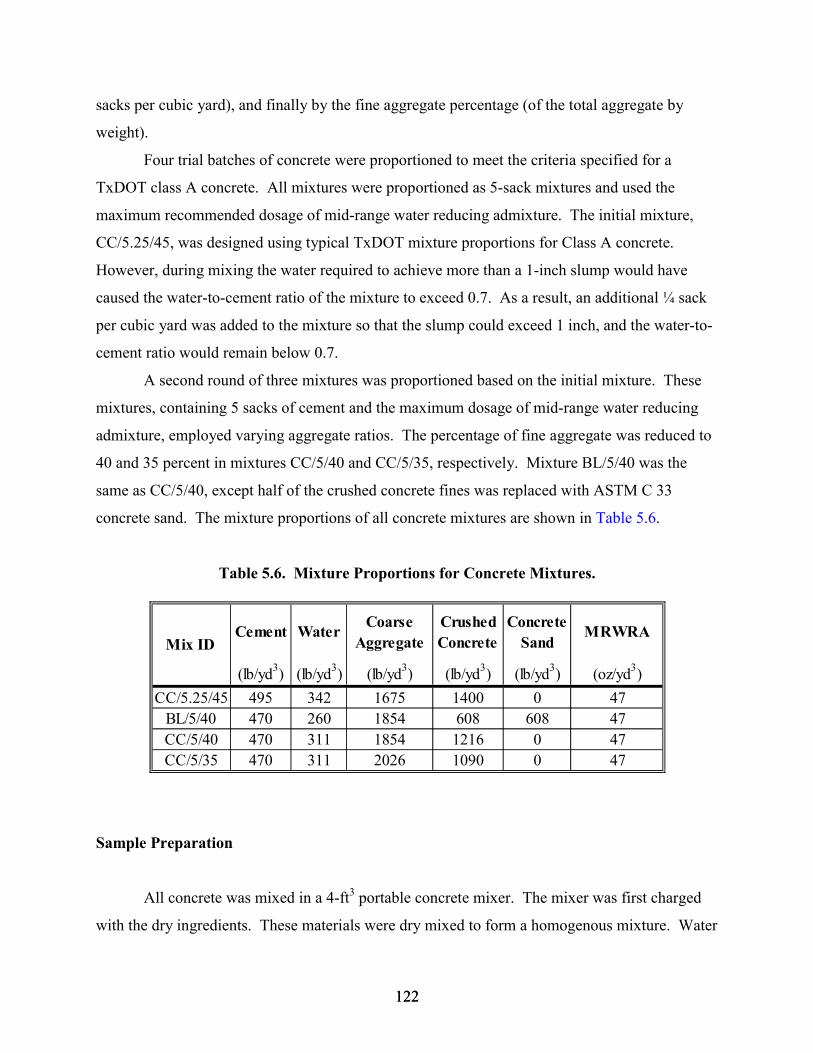
122 122
sacks per cubic yard), and finally by the fine aggregate percentage (of the total aggregate by
weight).
Four trial batches of concrete were proportioned to meet the criteria specified for a
TxDOT class A concrete. All mixtures were proportioned as 5-sack mixtures and used the
maximum recommended dosage of mid-range water reducing admixture. The initial mixture,
CC/5.25/45, was designed using typical TxDOT mixture proportions for Class A concrete.
However, during mixing the water required to achieve more than a 1-inch slump would have
caused the water-to-cement ratio of the mixture to exceed 0.7. As a result, an additional 1⁄4 sack
per cubic yard was added to the mixture so that the slump could exceed 1 inch, and the water-to-
cement ratio would remain below 0.7.
A second round of three mixtures was proportioned based on the initial mixture. These
mixtures, containing 5 sacks of cement and the maximum dosage of mid-range water reducing
admixture, employed varying aggregate ratios. The percentage of fine aggregate was reduced to
40 and 35 percent in mixtures CC/5/40 and CC/5/35, respectively. Mixture BL/5/40 was the
same as CC/5/40, except half of the crushed concrete fines was replaced with ASTM C 33
concrete sand. The mixture proportions of all concrete mixtures are shown in Table 5.6.
Table 5.6. Mixture Proportions for Concrete Mixtures.
Sample Preparation
All concrete was mixed in a 4-ft3 portable concrete mixer. The mixer was first charged
with the dry ingredients. These materials were dry mixed to form a homogenous mixture. Water
Cement Water Coarse Aggregate
Crushed Concrete
Concrete Sand
MRWRA
(lb/yd3) (lb/yd3) (lb/yd3) (lb/yd3) (lb/yd3) (oz/yd3)CC/5.25/45 495 342 1675 1400 0 47
BL/5/40 470 260 1854 608 608 47CC/5/40 470 311 1854 1216 0 47CC/5/35 470 311 2026 1090 0 47
Mix ID
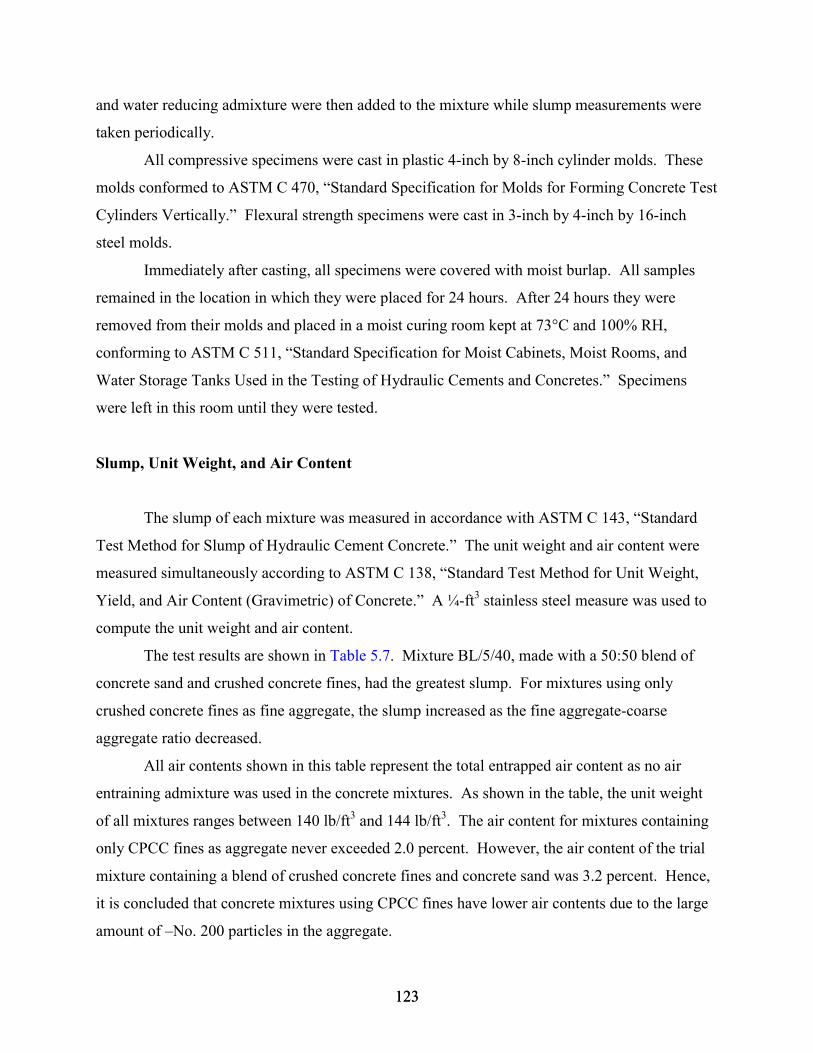
123 123
and water reducing admixture were then added to the mixture while slump measurements were
taken periodically.
All compressive specimens were cast in plastic 4-inch by 8-inch cylinder molds. These
molds conformed to ASTM C 470, “Standard Specification for Molds for Forming Concrete Test
Cylinders Vertically.” Flexural strength specimens were cast in 3-inch by 4-inch by 16-inch
steel molds.
Immediately after casting, all specimens were covered with moist burlap. All samples
remained in the location in which they were placed for 24 hours. After 24 hours they were
removed from their molds and placed in a moist curing room kept at 73°C and 100% RH,
conforming to ASTM C 511, “Standard Specification for Moist Cabinets, Moist Rooms, and
Water Storage Tanks Used in the Testing of Hydraulic Cements and Concretes.” Specimens
were left in this room until they were tested.
Slump, Unit Weight, and Air Content
The slump of each mixture was measured in accordance with ASTM C 143, “Standard
Test Method for Slump of Hydraulic Cement Concrete.” The unit weight and air content were
measured simultaneously according to ASTM C 138, “Standard Test Method for Unit Weight,
Yield, and Air Content (Gravimetric) of Concrete.” A 1⁄4-ft3 stainless steel measure was used to
compute the unit weight and air content.
The test results are shown in Table 5.7. Mixture BL/5/40, made with a 50:50 blend of
concrete sand and crushed concrete fines, had the greatest slump. For mixtures using only
crushed concrete fines as fine aggregate, the slump increased as the fine aggregate-coarse
aggregate ratio decreased.
All air contents shown in this table represent the total entrapped air content as no air
entraining admixture was used in the concrete mixtures. As shown in the table, the unit weight
of all mixtures ranges between 140 lb/ft3 and 144 lb/ft3. The air content for mixtures containing
only CPCC fines as aggregate never exceeded 2.0 percent. However, the air content of the trial
mixture containing a blend of crushed concrete fines and concrete sand was 3.2 percent. Hence,
it is concluded that concrete mixtures using CPCC fines have lower air contents due to the large
amount of –No. 200 particles in the aggregate.
124 124
Table 5.7. Fresh Properties of Trial Concrete Mixtures.
Compressive Strength
Compressive strength tests were performed according to ASTM C 39, “Standard Test
Method for Compressive Strength of Cylindrical Concrete Specimens” using a 600-kip capacity
hydraulically operated compression machine. Three 4-inch by 8-inch cylinders were tested for
each mixture. These specimens, capped with neoprene pads inserted in steel caps, were loaded at
a rate of 35 ± 15 psi per second until failure.
The results of the compressive strength tests are shown in Figure 5.20. Mixture BL/5/40
had both the highest 7 day and 28 day compressive strength. All mixtures except mixture
CC/5.25/45 met the TxDOT Class A 28 day compressive strength requirements.
Flexural Strength
The flexural strength (modulus of rupture) of all mixtures was evaluated according to
ASTM C 78, “Standard Test Method for Flexural Strength of Concrete (Using Simple Beam
with Third-Point Loading).” Three prisms, 3 inches by 4 inches by 16 inches, were cast for each
mixture. These prisms were oriented with a 4-inch depth during loading. They were loaded at a
rate of 150 ± 25 psi per second until rupture occurred,
The 7 day flexural strength results are shown in Figure 5.21. All mixtures except mixture
CC/4.5/45 met the TxDOT specified 7 day flexural strength for Class A concrete.
Mix ID Slump
(inch)
Water Cement Ratio
Unit Weight (lb/ft
3 ) Air (%)
CC/5.25/45 1.5 0.69 140 1.0 BL/5/40 2.5 0.55 144 3.2 CC/5/40 2 0.66 144 2.0 CC/5/35 2.5 0.66 143 1.0
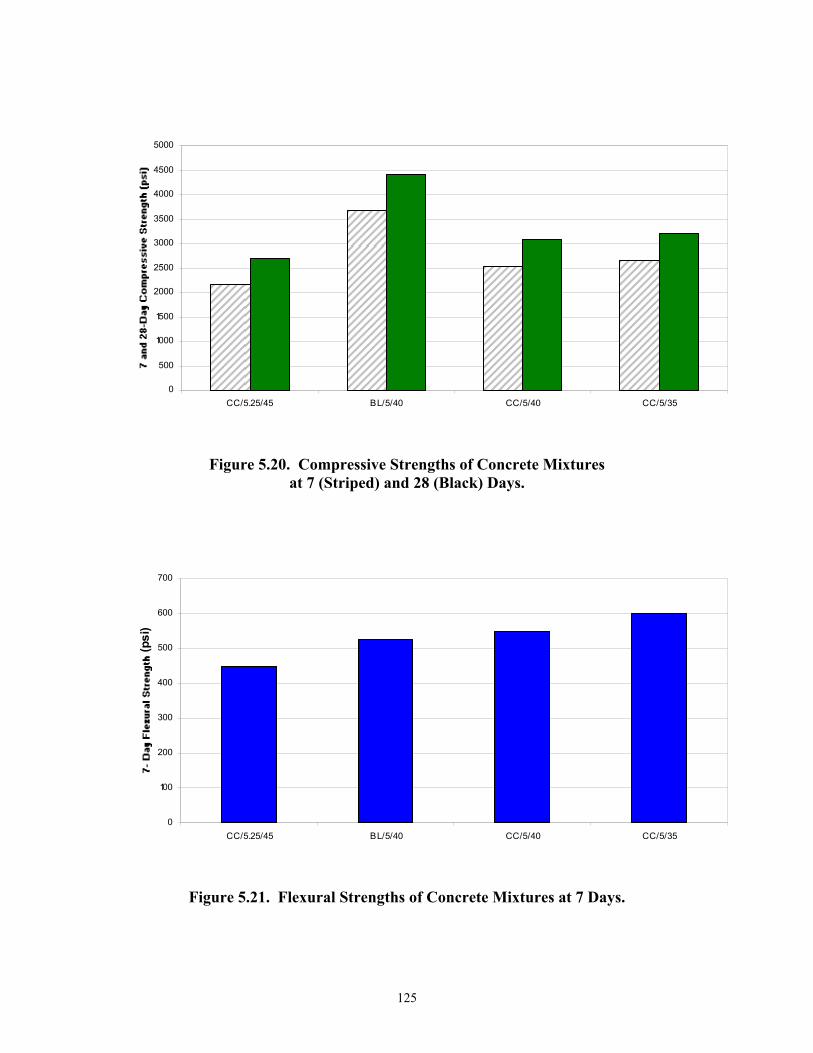
125
0
500
1000
1500
2000
2500
3000
3500
4000
4500
5000
CC/5.25/45 BL/5/40 CC/5/40 CC/5/35
Figure 5.20. Compressive Strengths of Concrete Mixtures at 7 (Striped) and 28 (Black) Days.
0
100
200
300
400
500
600
700
CC/5.25/45 BL/5/40 CC/5/40 CC/5/35
(psi
)
Figure 5.21. Flexural Strengths of Concrete Mixtures at 7 Days.
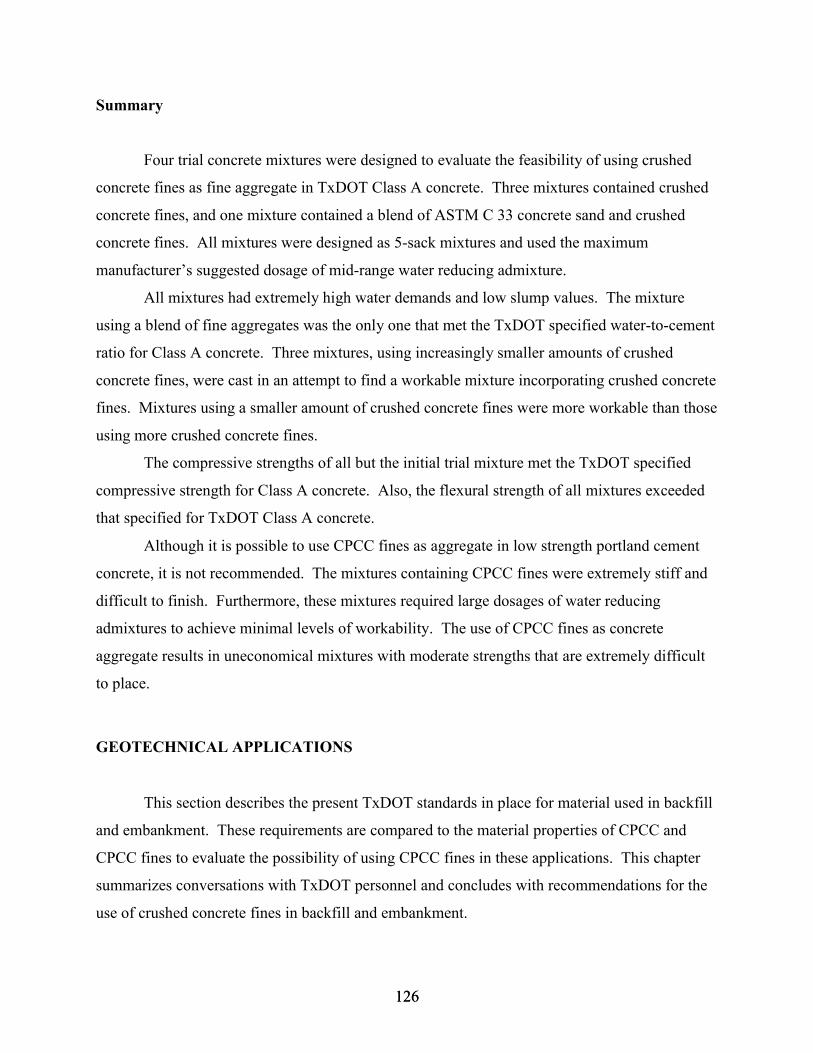
126 126
Summary
Four trial concrete mixtures were designed to evaluate the feasibility of using crushed
concrete fines as fine aggregate in TxDOT Class A concrete. Three mixtures contained crushed
concrete fines, and one mixture contained a blend of ASTM C 33 concrete sand and crushed
concrete fines. All mixtures were designed as 5-sack mixtures and used the maximum
manufacturer’s suggested dosage of mid-range water reducing admixture.
All mixtures had extremely high water demands and low slump values. The mixture
using a blend of fine aggregates was the only one that met the TxDOT specified water-to-cement
ratio for Class A concrete. Three mixtures, using increasingly smaller amounts of crushed
concrete fines, were cast in an attempt to find a workable mixture incorporating crushed concrete
fines. Mixtures using a smaller amount of crushed concrete fines were more workable than those
using more crushed concrete fines.
The compressive strengths of all but the initial trial mixture met the TxDOT specified
compressive strength for Class A concrete. Also, the flexural strength of all mixtures exceeded
that specified for TxDOT Class A concrete.
Although it is possible to use CPCC fines as aggregate in low strength portland cement
concrete, it is not recommended. The mixtures containing CPCC fines were extremely stiff and
difficult to finish. Furthermore, these mixtures required large dosages of water reducing
admixtures to achieve minimal levels of workability. The use of CPCC fines as concrete
aggregate results in uneconomical mixtures with moderate strengths that are extremely difficult
to place.
GEOTECHNICAL APPLICATIONS
This section describes the present TxDOT standards in place for material used in backfill
and embankment. These requirements are compared to the material properties of CPCC and
CPCC fines to evaluate the possibility of using CPCC fines in these applications. This chapter
summarizes conversations with TxDOT personnel and concludes with recommendations for the
use of crushed concrete fines in backfill and embankment.
127 127
Backfill
Backfill for structures is covered under TxDOT Item 400.5. Presently, the only stated
material requirements are that the material be free of materials that will restrict compaction and
deleterious materials, such as wood. This specification covers backfill for items such as pipe,
bridge foundations, retaining walls, and culverts. Item 400.6 covers cement stabilized backfill.
This material, sand mixed with 7 percent portland cement, is primarily used around sewers and
manholes. The only material requirement for this application is that the approved material be
specified on the plans. CPCC fines meet these requirements.
The results of the materials classification tests show that CPCC fines meet the present
requirements for materials used in TxDOT Item 400 backfill. Based upon the findings of this
study, CPCC fines are recommended for use in pipe backfill and cement stabilized backfill. A
revised version of the specification for these items is included in Appendix B. Additionally,
ongoing research as part of TxDOT Item 4177, which investigates durability aspects of using
CPCC in mechanically stabilized earthwalls, may yield useful information related to the
corrosion of metals when CPCC materials are used. The findings of these durability studies
concerning corrosion of metals should be reviewed when making further revisions to the
applicable specifications.
Embankment
As stated in Chapter 2, four types of embankment are described in TxDOT Item 132.
The two most commonly specified types of embankment are Type B and C. These types of
embankment require that the materials consist of suitable earth material that will form a stable
embankment and that the material is specified on the plans. CPCC fines meet these
requirements.
The results of the materials classification tests show that the CPCC fines and CPCC meet
the present requirements for materials used in TxDOT Item 132 Type C embankment. Based
upon the results of these tests, CPCC fines and CPCC are recommended for use in TxDOT Type
C embankments. A revised version of the specification for these items is included in
Appendix B.

129
CHAPTER 6. SUMMARY AND CONCLUSIONS
The overall objective of this research was to determine effective ways associated with
TxDOT applications for the use of crushed portland cement concrete fine materials passing the
No. 4 sieve. Specifically the goals were to:
� characterize aggregate properties of CPCC fines;
� select possible TxDOT applications that could incorporate the use of CPCC fines without
sacrificing workability or quality;
� cast trial batches of the selected applications, and evaluate the feasibility of using CPCC
fines; and
� provide guidelines and specifications for the selected applications.
The aggregate characterization program showed that CPCC fines contained a substantial
amount of material finer than the No. 200 sieve. This fraction of the material contained both
particles of hydrated cement and other contaminates, such as soil and clays, from the demolition
and removal process. It was found that the gradation of CPCC fines was highly variable from
different areas within one stockpile of crushed concrete. The methylene blue value, typically an
indicator of an aggregate’s suitability to be used in concrete, was much higher than that of
typical virgin aggregates. Total content tests, using ICP technology, found measurable amounts
of RCRA metals in samples of CPCC fines. However, the ability of these metals to leach from
the samples was at or below the detectable limits of the SPLP leaching test. Thus, it appears that
although these metals may be present in CPCC fines, they do not leach from the sample and,
therefore, are not a serious problem.
Potential TxDOT applications were addressed in two directions: paving and non-paving
applications. According to the results of preliminary study from literature and field experience,
potential areas of TxDOT applications were identified as follows:
� paving applications: flexible base, cement treated base, HMA bond breaker; and
� non-paving applications: portland cement concrete, flowable fill, backfill, embankment.
130
The feasibility of using CPCC fines to each selected application was investigated through
laboratory tests. Test programs mainly focused on the conformity of applied mixtures to the
current TxDOT specifications. Findings, concluding remarks, and recommendations for field
implementation are summarized in the following sections for each application.
PAVING APPLICATIONS
Flexible Base
1. Flexible base mixtures consisting of 100 percent crushed concrete materials were
evaluated for strength and moisture susceptibility, and the properties were compared to
those of conventional crushed limestone base mixtures.
2. The use of crushed concrete materials resulted in increased water demand to reach OMC.
Furthermore, an excessive capillary rise was observed for crushed concrete mixtures
under a continued soaking condition, indicating possible moisture susceptibility of the
mixture.
3. However, the strength test results indicated that crushed concrete mixtures are not so
highly moisture susceptible as suggested by the absorptive properties.
4. The strength of crushed concrete mixtures satisfied, for the most part, the minimum
requirements of Item 247. Crushed concrete mixtures always showed higher strength
than conventional mixtures.
5. Test results support the use of crushed concrete materials, including CPCC fines in
flexible base mixtures.
6. A revision of TxDOT Item 247, which allows the use of crushed concrete materials, is
attached in Appendix A.
Cement Treated Base
1. CTB mixtures consisted of crushed concrete materials, and conventional crushed
limestone base materials were characterized and compared for the properties related to
shrinkage cracking behavior and moisture susceptibility.
131
2. Although the compressive strength of crushed concrete mixtures was generally lower
than conventional CTB, they were shown to satisfy the requirements of Item 276 when
the cement content is properly selected.
3. A proportional relationship was observed between compressive strength and modulus of
elasticity of CTB mixtures. Therefore, the modulus of crushed concrete mixtures was
also lower than conventional.
4. Prediction models were established for the dependent compressive strength and modulus
of elasticity of CTB. Good agreement was observed between test data and estimations.
The proposed models are expected to be useful for any CTB mixture.
5. The use of crushed concrete materials also resulted in greater tendencies of the mixture
for drying shrinkage as well as stress relaxation.
6. As a combined effect of all relevant material properties, it was found that crushed
concrete mixtures are not more vulnerable to shrinkage cracking compared to
conventional CTB, albeit the mixture has lower strength and a higher tendency for
shrinkage. Lower modulus of crushed concrete mixtures produces smaller stress under a
given strain, and the strong relaxation property seems to further reduce the stress to a
level that could avoid cracking.
7. Like the flexible base application, the use of crushed concrete materials resulted in
increased water demand to reach OMC. Contrary to flexible base mixtures, however, all
CTB mixtures showed stable dielectric values under continued soaking. Cement
treatment seems to reduce capillary rise in the mixture and to subsequently eliminate
moisture susceptibility.
8. As experienced by many TxDOT districts, crushed concrete materials including CPCC
fines are highly recommended for use in CTB mixtures.
9. A revision of TxDOT Item 276, which allows the use of crushed concrete materials, is
attached in Appendix A.
HMA Bond Breaker
1. HMA bond breaker mix designs were produced with crushed concrete materials
substituting fine aggregates of conventional mixture in the forms of manufactured sand
and CPCC fines.
132
2. According to the gradation requirements of Item 3116 Type B, the maximum
substitutions of crushed concrete materials were determined at 40 percent of total
aggregates for both manufactured sand and CPCC fines.
3. The use of crushed concrete materials resulted in a slight increase of the optimum asphalt
content but higher strength and stability. In general, design properties of the mixtures
satisfied the requirements of Item 345.
4. Crushed concrete mixtures were also shown to be more moisture susceptible than
conventional with regard to strength. When moisture sensitivity is a primary design
criteria for bond breaker, limited amounts of lime could be used as a stabilizer.
5. Crushed concrete materials including CPCC fines are recommended for use in HMA
bond breaker mixtures.
6. A revision of TxDOT Item 345, which allows the use of crushed concrete materials, is
attached in Appendix A.
NON-PAVING APPLICATIONS
Flowable Fill
1. Flowable fill can be produced using CPCC fines instead of conventional aggregates, such
as ASTM C 33 concrete sand.
2. Due to the large amount of - No. 200 material in the CPCC fines, it was difficult to
entrain air into flowable fill mixtures containing this material. Therefore, trial mixing is
recommended when air entrainment is desired. Trial mixing will identify any potential
problems with air entrainment for a specific source of CPCC fines.
3. The high level of - No. 200 material in the CPCC fines increased the water demand of
flowable fill using CPCC fines.
4. For the same mixture proportions, flowable fill with CPCC fines was weaker than
flowable fill using conventional aggregates.
5. Increasing the cement content of the mixtures compensated for the strength decrease due
to the increased water demand.
6. It is recommended that fly ash flowable fill be made with CPCC fines.

133
7. A revision of TxDOT Special Specification 4438, which allows the use of CPCC fines, is
attached in Appendix B of this document. Recommended changes to the specification are
underlined.
Portland Cement Concrete
1. The use of CPCC fines in portland cement concrete caused increased water demand and
severely diminished workability.
2. Even with large dosages of water reducing admixtures, concrete using CPCC fines was
extremely stiff and unworkable.
3. As a result of the increased water demand and low workability, CPCC fines should not be
considered as potential aggregates for portland cement concrete.
4. An abundance of TxDOT applications capable of using unwashed and ungraded CPCC
appear to exist. Therefore, the future production of washed CPCC fines should be re-
evaluated to ensure the most efficient use of the entire crushed product.
Backfill
1. Both unwashed and washed CPCC fines meet current TxDOT standards for Items 400.5
and 400.6.
2. CPCC fines are recommended for use in these applications.
3. A revision of TxDOT Item 400, which allows the use of CPCC fines, is attached in
Appendix B of this document. Recommended changes to the specification are
underlined.
Embankment
1. Both washed and unwashed CPCC fines meet current TxDOT standards for Type C
embankment.
2. CPCC fines are recommended for use in this application.
3. A revision of TxDOT Item 132, which allows the use of CPCC fines, is attached in
Appendix B of this document. Recommended changes to the specification are
underlined.
134
FUTURE CONSIDERATIONS
The following considerations are suggested regarding field implementation as well as
other areas of future study.
General
1. A better method to determine the specific gravity and absorption of high fines materials,
such as CPCC fines, should be developed.
2. Continued efforts should be made to reduce the amount of CPCC fines produced and/or
find additional uses for the material.
Paving Applications
1. Flexible base mixtures consisting of crushed concrete materials showed so-called bulking
behavior when the test specimens were compacted. It is recommended for field studies to
address workability, especially related to compaction and finishing of the layer.
2. Material behavior under repeated loading and environmental cycling should be identified
in the field as well as the laboratory. Specific interest is given to resilient modulus and
permanent deformation for flexible base and fatigue behavior for CTB applications.
Non-paving Applications
1. Flowable fill mixture proportions for mixtures incorporating CPCC fines should be
investigated with the objective of reducing the amount of fly ash used in flowable fill
using CPCC fines due to the high amount of - No. 200 material in CPCC fines. This
reduction in fly ash content could eliminate concerns of long term strength gain and
excavatability.
2. The presence of heavy metals and their ability to leach from CPCC fines should be
investigated. If significant levels of heavy metals are found in CPCC fines, an
investigation to determine both the cause of these contaminates and their ability to leach
from the sample should be performed. An assessment of acceptable SPLP limits and
procedures for accurately assessing the levels of heavy metals and their ability to leach
from various samples may need to be developed.

135
REFERENCES
1. Burke, T.T., Cohen, M.D., and Scholer, C.F., Synthesis Study on the Use of Concrete
Recycled from Pavements and Building Rubble in the Indiana Highway System, Final
Report, 9107-9209, Purdue University/Indiana Department of Transportation JHRP, West
Lafayette, Indiana, 1992.
2. Forster, S.W., “Recycled Concrete as Aggregate,” Concrete International; Design and
Construction, ACI, 1986, pp. 34-40.
3. Wojakowski, J.B, Fager, G.A., and Catron, M.A., Recycling of Portland Cement Concrete
Pavement, Report No. FHWA-KS-95/3, Kansas DOT, Bureau of Materials and Research,
Topeka, Kansas, 1995.
4. Hansen, T.C., and Angelo, J., “Crushed Concrete Fines Recycled for Soil Stabilization
Purposes,” ACI Materials Journal, Vol. 83, No. 6, 1986, pp. 983-987.
5. Yoshikane, T., “The Instances of Concrete Recycled for Base Course Material in Japan,” in
Recycling of Demolished Concrete and Masonry: 1st Edition, edited by Hansen, T.C., 1992,
London, United Kingdom, pp. 756-765.
6. Hansen, T.C., “Recycled Concrete Aggregate and Fly Ash Produce Concrete without
Portland Cement,” Cement and Concrete Research, Vol. 20, No. 3, 1990, pp. 355-356.
7. Snyder, M.B., and Bruinsma, J.E., “Review of Studies Concerning Effects of Unbound
Crushed Concrete Bases on PCC Pavement Drainage,” Transportation Research Record,
No. 1519, Transportation Research Board, National Academy Press, Washington, D.C.,
1996, pp. 51-58.
8. Schutzbach, A., Recycling Old PCC Pavement, Illinois Department of Transportation,
Bureau of Materials & Physical Research, Springfield, Illinois, 1993.
9. Dhir, R.K., Limbachiya, M.C., and Leelawat, T., “Suitability of Recycled Concrete
Aggregate for Use in BS 5328 Designated Mixes,” Proceedings of the Institution of Civil
Engineers: Structures and Buildings, Vol. 134, No. 3, 1999, pp. 257-274.
10. Ravindrarajha, R.S., “Effects of Using Recycled Concrete as Aggregate on the Engineering
Properties of Concrete,” National Symposium on the Use of Recycled Materials in
Engineering Construction, Sydney, Australia, 1996, pp. 147-152.
136
11. Hansen, T.C., Recycling of Demolished Concrete and Masonry, E & FN Spon, London,
United Kingdom, 1992.
12. Buck, A. D., “Recycled Concrete as a Source of Aggregate,” ACI Journal, Vol. 74, No. 5,
1977, pp. 212-219.
13. Rashwan, M., and AbouRizk, S., “Properties of Recycled Concrete,” Concrete
International, Vol. 19, No. 7, 1997, pp. 56-60.
14. Malhotra, V. M., “Recycled Concrete—A New Aggregate,” Canadian Journal of Civil
Engineering, Vol. 3, No. 1, 1978, pp. 42-52.
15. Texas Department of Transportation, Year of the Recycled Roadway,
<ftp://ftp.dot.state.tx.us/pub/txdot-info/gsd/pdf/yrr_jan.pdf>, Accessed 16 April 2001.
16. Rust, K., Texas Department of Transportation, Personal Communication, 29 June 2000.
17. Bazant, Z.P., and Wittmann, F.H., Creep and Shrinkage in Concrete Structures, John
Wiley & Sons, New York, 1982.
18. Bazant, Z.P., Mathematical Modeling of Creep and Shrinkage of Concrete, John Wiley &
Sons, New York, 1988.
19. Tazawa, E., Autogenous Shrinkage of Concrete, E & FN Spon, New York, 1998.
20. Bazant, Z.P., and Najjar, J., “Non-linear Water Diffusion in Non-saturated Concrete,”
Materials and Structures, Vol. 5, 1972, pp. 3-20.
21. Pretorius, P.C., Design Considerations for Pavements Containing Soil Cement Bases, Ph.D.
Dissertation, University of California, Berkeley, California, 1970.
22. Williams, R.I.T., Cement Treated Bases, Materials, Design and Construction, Elsevier
Publishers, London, UK, 1986.
23. Lantz, G., Texas Department of Transportation, Personal Communication day, January
2001.
24. Bloshock, M., Texas Department of Transportation, Personal Communication day, January
2001.
25. Texas Department of Transportation, Special Specification 4438,
<http://www.dot.state.tx.us/business/specs.htm>, Accessed 16 April 2001.
26. Crouch, K.L., and Gamble, R., “High-Fines Limestone Screenings Provide Viable
Aggregate for Excavatable Controlled Low-Strength Material,” Rock Products, July 1997,
p 32.

137
27. Standard Specifications for Construction of Highways and Bridges: Items 400 and 132,
Texas Department of Transportation, 1993.
28. McClelland, M., Texas Department of Transportation, Personal Communication day, 5
December 2000.
29. Rodgers, R., Williams Brothers Construction, Personal Communication, 15 February 2000.
30. Brown, M., Big City Crushed Concrete, Personal Communication, October 2000.
31. Whaling, B., City Engineer, University Park, Personal Communication, October 2000.
32. Forsahgie, E., Frontera Materials, Personal Communication day, October 2000.
33. Wright, M., Linn Materials, Personal Communication, October 2000.
34. Young, G., Ballenger Construction, Personal Communication, October 2000.
35. Transportation Research Board, New Test Method of Methylene Blue, NCHRP, Report 405,
National Cooperative Highway Research Program, National Academy Press, Washington,
D.C., 1998.
36. Ahn, N., An Experimental Study on the Guidelines for Using Higher Contents of Aggregate
Micro Fines in Portland Cement Concrete, Ph.D. Dissertation, The University of Texas at
Austin, 2000.
37. Scullion, T., and Saarenketo, T., “Using Suction and Dielectric Measurements as
Performance Indicators for Aggregate Base Materials,” Transportation Research Record,
No. 1577, Transportation Research Board, National Academy Press, Washington, D.C.,
1997, pp.37-44.
38. Saarenketo, T., Scullion, T., and Kolisoja, P., “Moisture Susceptibility and Electrical
Properties of Base Coarse Aggregates,” Proceedings of Fifth International Conference on
the Bearing Capacity of Roads and Airfields, Trondheim, Norway, 1998, pp. 1401-1410.
39. Scullion, T., Sebesta, S., and Harris, J.P., A Balanced Approach to Selecting the Optimal
Cement Content for Soil-Cement Bases, Research Report 404611-1, Texas Transportation
Institute, College Station, Texas, 2000.
40. Thompson, M.R., Mechanistic Design Concepts for Stabilized Base Pavements, Civil
Engineering Studies, Transportation Engineering Series No. 46, The University of Illinois,
Urbana, Illinois, 1986.
138
41. Krauss, P.D., and Rogalla, E.A., Transverse Cracking in Newly Constructed Bridge Decks,
NCHRP Report 380, National Cooperative Highway Research Program, Transportation
Research Board, National Academy Press, Washington, D.C., 1996.
42. Shah, S.P., et al., “A Method to Predict Shrinkage Cracking of Concrete,” ACI Materials
Journal, Vol. 95, No. 4, 1998, pp. 339-346.

139
APPENDIX A.
REVISED SPECIFICATIONS: PAVING APPLICATIONS

141
A. 1 ITEM 247 FLEXIBLE BASE
This revision is proposed to allow crushed concrete materials in Item 247, Flexible Base.
Requirements and guidance not included in this revision shall default to Item 247.
247.2 Materials.
(2) Physical Requirements.
(e) Type D. Type D material shall be crushed concrete produced for recycling
purposes. Crushed concrete shall have a minimum of 50 percent of the particles retained on the
No. 4 sieve. Crushed concrete shall be blended with other types of material in order to meet
Grade 1 criteria.
(f) Type E. As shown on the plans.
(3) Pilot Grading. When pilot grading is required on the plans, the flexible base with
Type A, B, C, and E materials shall not vary from the designated pilot grading of each sieve size
by more than five (5) percentage points. The flexible base with Type D material shall not vary
from the designated pilot grading of each sieve size by more than seven (7) percentage points.
However, the flexible base grading shall be within the master grading limits as shown in Table 1.
The pilot grading may be varied by the Engineer as necessary to insure that the base material
produced will meet the physical requirements shown in Table 1.
(5) Tolerances. Unless otherwise shown on the plans, the limits establishing
reasonably close conformity with the specified gradation and plasticity index are defined by the
following:
(a) Gradation. The Engineer may accept the material providing not more than one (1)
out of the most recent five (5) consecutive gradation tests performed are outside the specified
limits for master grading or pilot grading, as applicable, on any individual sieve by no more than

142
five (5) percentage points for Type A, B, C, and E materials and seven (7) percentage points for
Type D material.
(6) Material Sources. The flexible base ……… the exposed strata.
Unless otherwise shown on the plans, ……… through the entire depth of the stockpile.
When temporary stockpiles are ……… from the Contractor’s estimates.
Blending of materials from more than one (1) source to produce Type B, C, D or E
flexible base will be allowed when approved by the Engineer.
143
A. 2 ITEM 276 PORTLAND CEMENT TREATED BASE (PLANT MIXED)
This revision is proposed to allow crushed concrete materials in Item 276, “Portland
Cement Treated Base.” Requirements and guidance not included in this revision shall default to
Item 276.
276.2 Materials. Materials shall conform to the requirements shown on the plans and
to the following requirements.
(a) Flexible Base. New base material shall conform to the material requirements of
Item 247, “Flexible Base,” including revised Type D material, crushed concrete, and shall be of
the type and grade as shown on the plans.
276.4 Mix Design. Cement content will be selected by the Engineer ……… in
accordance with Test Method Tex-120-E.
When Type D flexible base or any blends with crushed concrete material is selected to
apply, cement content shall be determined by the following strength requirement:
Minimum Design Allowable Compressive Strength Cement Content (%)
400 psi 4–8 at 7 days of moist curing
When material properties or sources change, the Engineer may require the Contractor to
provide additional mix design tests and adjust the cement content as required.
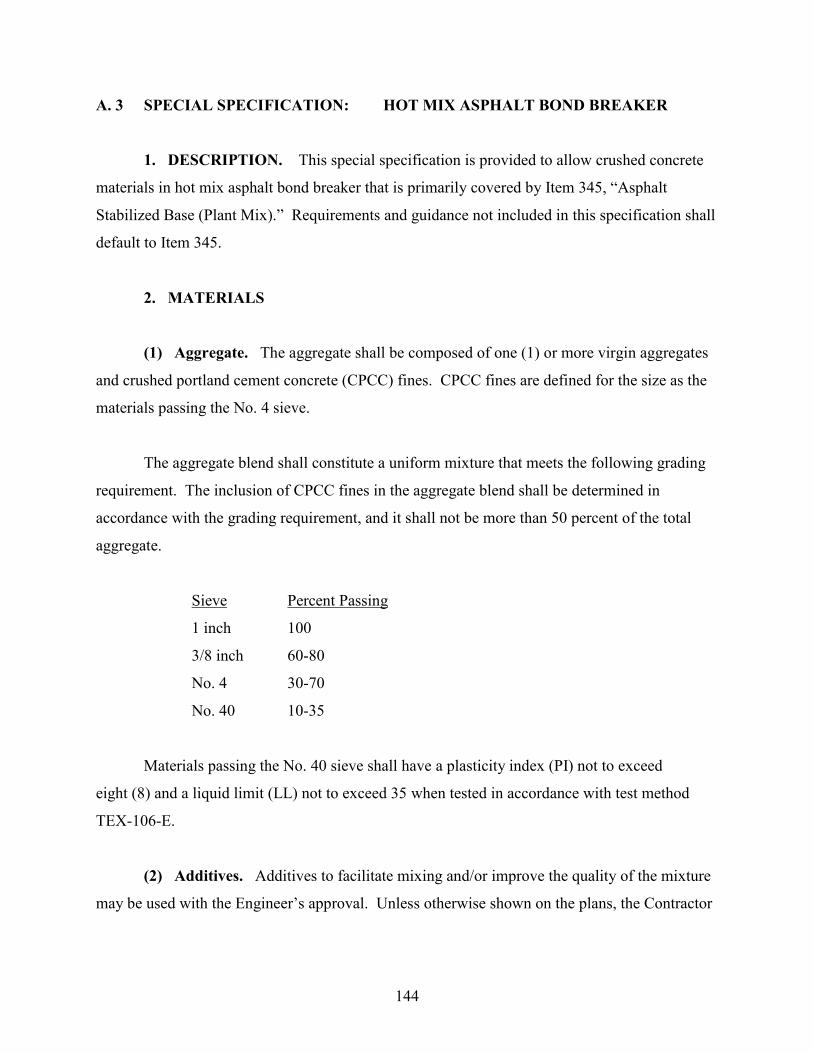
144
A. 3 SPECIAL SPECIFICATION: HOT MIX ASPHALT BOND BREAKER
1. DESCRIPTION. This special specification is provided to allow crushed concrete
materials in hot mix asphalt bond breaker that is primarily covered by Item 345, “Asphalt
Stabilized Base (Plant Mix).” Requirements and guidance not included in this specification shall
default to Item 345.
2. MATERIALS
(1) Aggregate. The aggregate shall be composed of one (1) or more virgin aggregates
and crushed portland cement concrete (CPCC) fines. CPCC fines are defined for the size as the
materials passing the No. 4 sieve.
The aggregate blend shall constitute a uniform mixture that meets the following grading
requirement. The inclusion of CPCC fines in the aggregate blend shall be determined in
accordance with the grading requirement, and it shall not be more than 50 percent of the total
aggregate.
Sieve Percent Passing
1 inch 100
3/8 inch 60-80
No. 4 30-70
No. 40 10-35
Materials passing the No. 40 sieve shall have a plasticity index (PI) not to exceed
eight (8) and a liquid limit (LL) not to exceed 35 when tested in accordance with test method
TEX-106-E.
(2) Additives. Additives to facilitate mixing and/or improve the quality of the mixture
may be used with the Engineer’s approval. Unless otherwise shown on the plans, the Contractor
145
may choose to use a limited amount of lime, no more than 1 percent of the total aggregate, to
reduce the moisture susceptibility of the mixture.
3. MIX DESIGN
Unless otherwise shown on the plans, the Contractor shall furnish an acceptable mix
meeting the following requirements.
The mixture shall contain between 3 to 9 percent asphalt when designed in accordance
with Test Method Tex-126-E. At optimum asphalt content, the design specimen shall have the
slow strength of 30 psi when tested in accordance with test method Tex-126-E, unless a higher
requirement is shown on the plans.
The HMA bond breaker shall have a laboratory molded density of 96 percent plus or
minus 1.5 percent. If the nominal aggregate size is less than 1/2 inch, test method Tex-204-F
shall be used for the design of the mixture.

147
APPENDIX B. REVISED SPECIFICATIONS: NON-PAVING APPLICATIONS

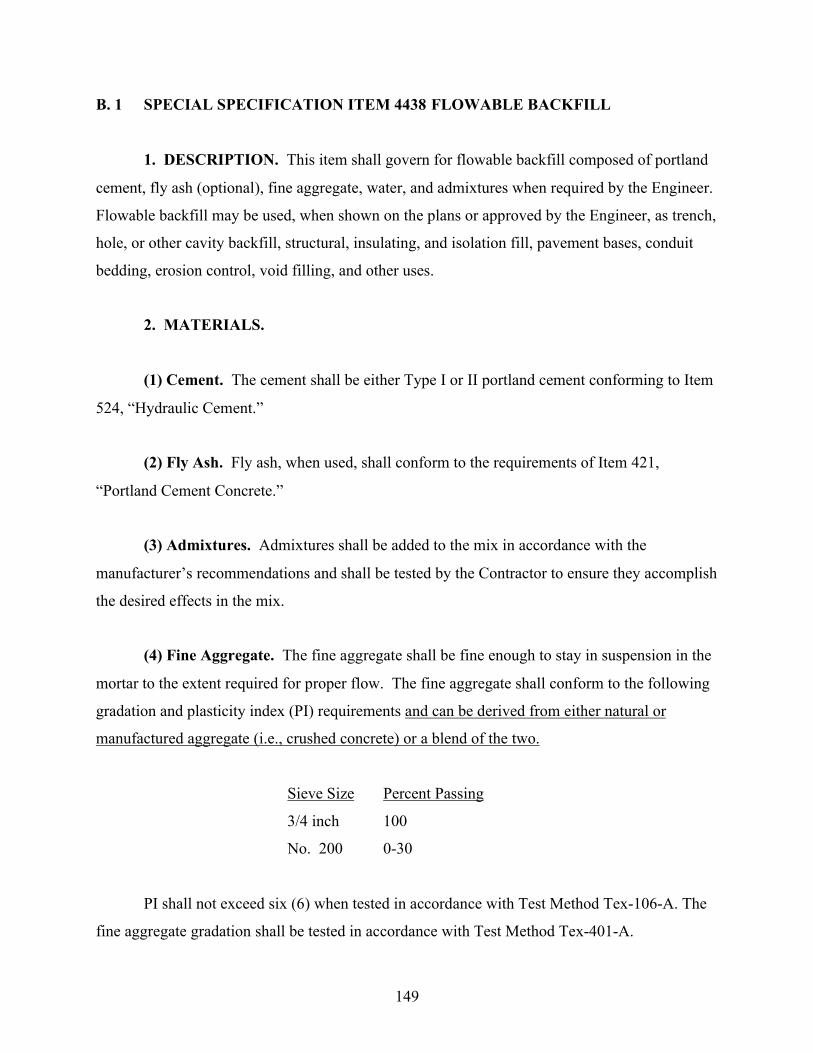
149
B. 1 SPECIAL SPECIFICATION ITEM 4438 FLOWABLE BACKFILL
1. DESCRIPTION. This item shall govern for flowable backfill composed of portland
cement, fly ash (optional), fine aggregate, water, and admixtures when required by the Engineer.
Flowable backfill may be used, when shown on the plans or approved by the Engineer, as trench,
hole, or other cavity backfill, structural, insulating, and isolation fill, pavement bases, conduit
bedding, erosion control, void filling, and other uses.
2. MATERIALS.
(1) Cement. The cement shall be either Type I or II portland cement conforming to Item
524, “Hydraulic Cement.”
(2) Fly Ash. Fly ash, when used, shall conform to the requirements of Item 421,
“Portland Cement Concrete.”
(3) Admixtures. Admixtures shall be added to the mix in accordance with the
manufacturer’s recommendations and shall be tested by the Contractor to ensure they accomplish
the desired effects in the mix.
(4) Fine Aggregate. The fine aggregate shall be fine enough to stay in suspension in the
mortar to the extent required for proper flow. The fine aggregate shall conform to the following
gradation and plasticity index (PI) requirements and can be derived from either natural or
manufactured aggregate (i.e., crushed concrete) or a blend of the two.
Sieve Size Percent Passing
3/4 inch 100
No. 200 0-30
PI shall not exceed six (6) when tested in accordance with Test Method Tex-106-A. The
fine aggregate gradation shall be tested in accordance with Test Method Tex-401-A.
150
(5) Mixing Water. Mixing water shall conform to the requirements of Item 421,
“Portland Cement Concrete.”
3. MIX DESIGN. Unless otherwise shown on the plans, the Contractor shall furnish an
acceptable mix meeting the following requirements:
(1) Strength. The 28 day compressive strength range, when tested in accordance with
Test Method Tex-418-A, shall be 80 psi to 150 psi, to ensure efficient future excavation.
Variations of the specified strength will be allowed as approved by the Engineer.
(2) Consistence. The mix shall be designated to be placed without consolidation and
shall fill all intended voids. The consistency shall be tested by filling an open-ended three
(3) inch diameter by six (6) inches high cylinder to the top with flowable fill. The cylinder shall
be immediately pulled straight up, and the correct consistency of the mix shall produce a
minimum of eight (8) inch diameter circular spread with no segregation.
The Contractor shall have the option of using specialty type admixtures to enhance the
flowability, reduce shrinkage, and reduce segregation by maintaining solids in suspension.
When shrinkage is a concern, the Engineer may require the flowable backfill to contain a
shrinkage compensator or other chemical admixtures to enhance the properties of the mix. All
admixtures shall be proportioned in accordance with the manufacturer’s recommendations.
The flowable fill shall be mixed by a central-mixed concrete plant, ready-mix concrete
truck, pugmill, or other method approved by the Engineer.
4. QUALITY FLOWABLE FILL. Unless otherwise shown on the plans, the
Contractor shall furnish and properly maintain all test molds. The test molds shall meet the
requirements of Test Method Tex-418-A and, in the opinion of the Engineer, must be satisfactory
for use at the time of use. In addition, the Contractor shall be responsible for furnishing
personnel to remove the test specimens from the molds and transport them to the proper curing
location at the schedule designated by the Engineer and in accordance with the governing
151
specification. For all concrete items, the Contractor shall have a wheelbarrow, or other container
acceptable to the Engineer, available to use in the sampling of the concrete. The Contractor is
responsible for disposing of used, broken test specimens. A strength test is defined as the
average of the breaking strength of two (2) cylinders. Each specimen will be tested in
accordance with Test Method Tex-418-A.
Curing of the specimen shall be in accordance with the following. Storage conditions
during the first 24 hours have an important influence on the strength developed in concrete.
During the first 24 hours, all test specimens shall be stored under conditions that prevent loss of
moisture and where the temperature range is 60 to 80 °F.
Immediately after forming the cylinders, cover them with cover plates or caps, then with
several thicknesses of wet burlap or wet cotton mats.
Keep the covering thoroughly saturated until the cylinders are removed from the molds.
For shipment to the laboratory for strength testing, wrap the cylinders carefully in wet paper,
secure in wet burlap or seal in a plastic bag.
5. CONSTRUCTION METHODS. The Contractor shall submit a construction method
and a plan for approval of the Engineer. The Contractor must provide a means of filling the
entire void area and be able to demonstrate that this has been accomplished. This must be done
without the use of a vibrator. Care shall be taken to prevent the movement of the insert structure
from its designated location. If voids are found in the fill or if any of the requirements are not
met as shown on the plans, it will be the Contractor’s responsibility to remove and replace or
correct the problem without additional cost to the State.
6. MEASUREMENT. This item will be measured by the cubic yard of material in
place. Cubic yards will be computed on the basis of the measured area to the lines and grades
shown on the plans or as directed by the Engineer. Measurement will not include additional
volume caused by slips, slides, or cave-ins resulting from the action of the elements or the
Contractor’s operations.
152
7. PAYMENT. The work performed and materials furnished in accordance with this
item and measured as provided under “Measurement” will be paid for at the unit price bid for
“Flowable Backfill.” This price shall be full compensation for furnishing, hauling, and placing
all materials and for all tools, labor, equipment, and incidentals necessary to complete the work.

153
B. 2 ITEM 400 BACKFILL
400.5 Backfill
(1) General. As soon as practical, all portions of the excavation not occupied by the
permanent structure shall be backfilled. Backfill material may be obtained from excavation or
from other sources. Backfill material shall be free from stones of such size as to interfere with
compaction; free from large lumps which will not break down readily under compaction; and free
from frozen lumps, wood, or other extraneous material.
Backfill which will not support any portion of the completed roadbed or embankment shall
be placed in layers not more than 10 inches in depth (loose measurement). Backfill which will
support any portion of the roadbed or embankment shall be placed in uniform layers not to exceed
eight (8) inches in depth (loose measurement). Each layer of backfill shall be compacted to a
density comparable with the adjacent undisturbed soil or as shown on the plans.
Each layer of backfill material, if dry, shall be wetted uniformly to the moisture content
required to obtain a density comparable with the adjacent undisturbed soil or as shown on the plans
and shall be compacted to that density by means of mechanical tamps or rammers. The use of
rolling equipment of the type generally used in compacting embankments will be permitted on
portions which are accessible to such equipment.
When tamping equipment is furnished which, when proven to the satisfaction of the
Engineer, will adequately compact the backfill material to the density required, the eight (8) inch
and 10 inch lifts (loose measurement) specified above may be increased to lifts not to exceed 12
inches.
Cohesionless materials, such as sand, gravel, or manufactured aggregate (i.e., crushed
concrete), may be used for general backfilling purposes. Compaction of cohesionless materials
shall be done with vibratory equipment, water ponding, or a combination thereof.
154
(2) Bridge Foundations, Retaining Walls, and Culverts. No backfill shall be placed
against any structure until the concrete has reached the minimum flexural strength required in Item
421, “Portland Cement Concrete.”……………..
(3) Pipe. After the bedding and pipes have been installed as required, the selected backfill
materials shall be brought to proper moisture condition, placed along both sides of the pipe
equally, in uniform layers not exceeding eight (8) inches in depth (loose measurement), and each
lift thoroughly compacted mechanically. Special care shall be taken to secure thorough
compaction of the materials placed under the haunches of the pipe and to prevent damage or
displacement of the pipe. Filling and/or backfilling shall be continued in this manner to the
elevation of the top of the pipe. Backfill above the top of the pipe by the Contractor during
construction shall be replaced at the Contractor’s expense or repaired to the satisfaction of the
Engineer.
The Engineer may reject any material containing more than 20 percent by weight of
material retained on a three (3) inch sieve, or material excavated in such a manner as to produce
large lumps not easily broken down or which cannot be spread in loose layers. In general, material
excavated by means of a trenching machine will meet the requirements above, provided large
stones are not present.
Where sewers extend beyond the toe of slope of the embankment and the depth of cover
provided by backfill to the original ground level is less than the minimum required by the
specifications for the type of pipe involved, additional material shall be placed and compacted, as
herein specified for backfill outside the limits of the roadbed, until this minimum cover has been
provided.
400.6. Cement Stabilized Backfill. When shown on the plans, the excavation shall be
backfilled to the elevations shown with cement stabilized backfill. Unless otherwise shown on the
plans, cement stabilized backfill shall contain aggregate, water, and a minimum of seven (7)
percent portland cement based on the dry weight of the aggregate, in accordance with Test Method
155
Tex-120-E. Aggregate shall be as shown on the plans and may be natural, manufactured (i.e.,
crushed concrete) or a blend of the two, or as approved by the Engineer.
Cement stabilized backfill below the top of sewers, manholes, inlets, or other structures
shall be placed equally along all sides of the structure so as to prevent strain on or displacement of
the structure. Cement stabilized backfill shall be placed in a manner that will completely fill all
voids in the trench. Should compaction be required to fill all voids, hand operated tampers may be
used.
400.7. Measurement. Excavation and backfill will be measured by the cubic yard.
Cutting and restoring of pavement will be measured by the square yard.
This is a plans quantity measurement item, and the quantity to be paid for will be that
quantity shown in the proposal and on the “Estimate and Quantity” sheet of the contract plans,
except as may be modified by Article 9.8. If no adjustment of quantities is required, additional
measurements or calculations will not be required.
156
B. 3 ITEM 132 EMBANKMENT
132.1. Description. This item shall govern for the placement and compaction of all
materials necessary for the construction of roadway embankments, levees and dykes, or any
designated section of the roadway where additional material is required.
132.2. Material. Materials may be furnished from required excavation in the areas shown
in the plans or from off right of way sources obtained by the Contractor and meeting the
requirements herein. All embankment shall conform to one of the following types as shown on the
plans, except that material which is in a retaining-wall-backfill area shall meet the requirements for
backfill material of the pertinent retaining-wall item:
Type A. This material shall consist of suitable granular material, free from vegetation or
other objectionable matter, and reasonably free from lumps of earth. This material shall be suitable
for forming a stable embankment and, when tested in accordance with Test Methods Tex-104-E,
Tex-105-E, Tex-106-E, and Tex-107-E, Part II shall meet the following requirements:
The liquid limit shall not exceed …………………. 45
The plasticity index shall not exceed …………………. 15
The bar linear shrinkage shall not be less than ………… 2
Type B. This material shall consist of suitable earth material such as rock, loam, clay, or
other such materials as approved by the Engineer that will form a stable embankment.
Type C. This material, which may include man-made aggregate (i.e., crushed concrete),
shall be suitable and shall conform to the specification requirements shown on the plans.
Type D. This material shall be that obtained from required excavation areas shown on the
plans and will be used in embankment.

157
APPENDIX C.
GRADING DATA FOR CPCC FINES

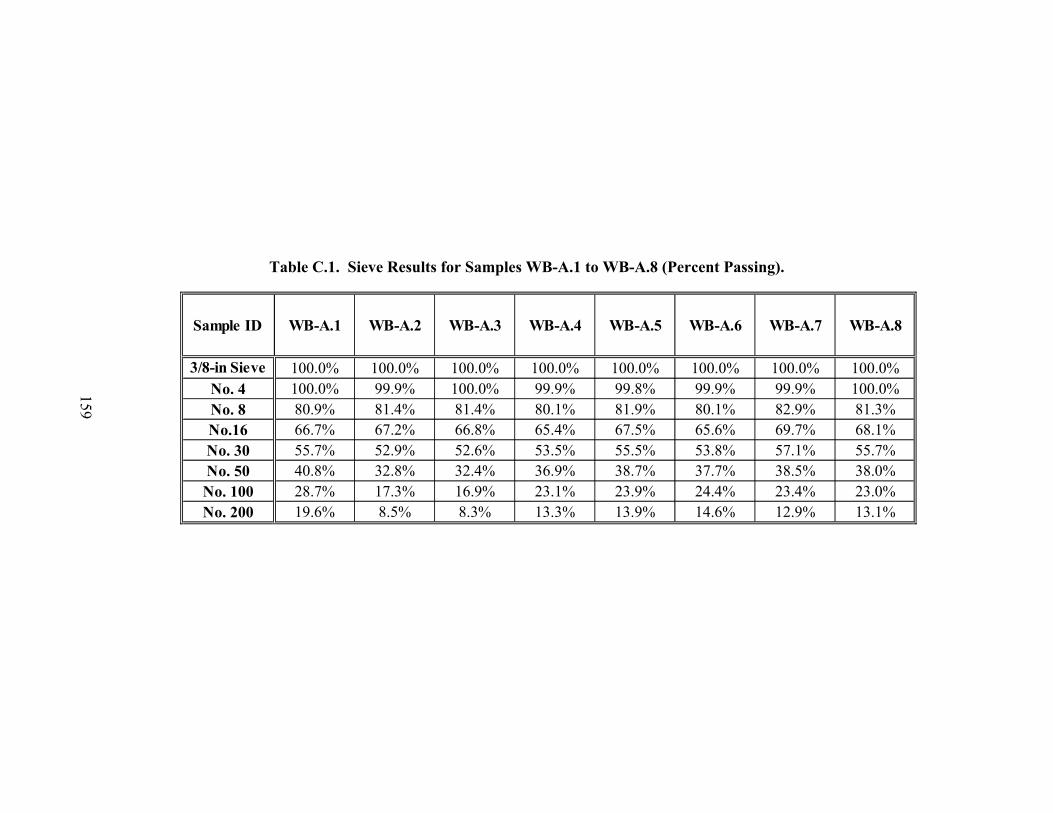
159
Table C.1. Sieve Results for Samples WB-A.1 to WB-A.8 (Percent Passing).
Sample ID WB-A.1 WB-A.2 WB-A.3 WB-A.4 WB-A.5 WB-A.6 WB-A.7 WB-A.8
3/8-in Sieve 100.0% 100.0% 100.0% 100.0% 100.0% 100.0% 100.0% 100.0%No. 4 100.0% 99.9% 100.0% 99.9% 99.8% 99.9% 99.9% 100.0%No. 8 80.9% 81.4% 81.4% 80.1% 81.9% 80.1% 82.9% 81.3%No.16 66.7% 67.2% 66.8% 65.4% 67.5% 65.6% 69.7% 68.1%No. 30 55.7% 52.9% 52.6% 53.5% 55.5% 53.8% 57.1% 55.7%No. 50 40.8% 32.8% 32.4% 36.9% 38.7% 37.7% 38.5% 38.0%No. 100 28.7% 17.3% 16.9% 23.1% 23.9% 24.4% 23.4% 23.0%No. 200 19.6% 8.5% 8.3% 13.3% 13.9% 14.6% 12.9% 13.1%

160
Table C.2. Sieve Results for Samples WB-B to WB-H (Percent Passing).
Sample ID WB-B WB-C WB-D WB-E WB-F WB-G WB-H
3/8-in Sieve 100.0% 100.0% 100.0% 100.0% 100.0% 100.0% 100.0%No. 4 100.0% 100.0% 100.0% 98.9% 100.0% 100.0% 99.9%No. 8 77.5% 80.1% 85.5% 78.9% 80.9% 90.3% 75.4%No.16 59.8% 64.0% 74.4% 65.6% 67.1% 83.2% 59.9%No. 30 45.4% 51.4% 63.1% 55.0% 57.5% 74.8% 47.8%No. 50 29.5% 37.4% 45.6% 41.9% 47.5% 59.0% 32.2%
No. 100 18.2% 26.0% 29.8% 29.1% 35.0% 41.2% 18.6%No. 200 10.3% 16.4% 18.6% 17.1% 20.7% 25.3% 10.8%
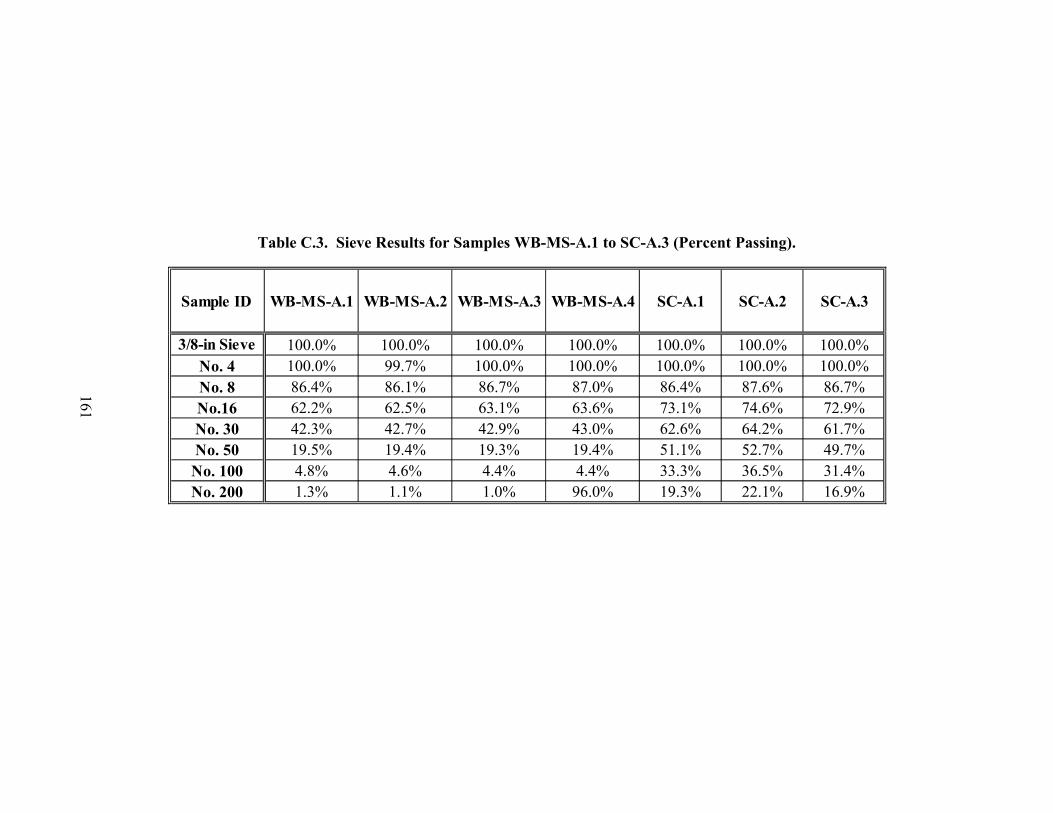
161
Table C.3. Sieve Results for Samples WB-MS-A.1 to SC-A.3 (Percent Passing).
Sample ID WB-MS-A.1 WB-MS-A.2 WB-MS-A.3 WB-MS-A.4 SC-A.1 SC-A.2 SC-A.3
3/8-in Sieve 100.0% 100.0% 100.0% 100.0% 100.0% 100.0% 100.0%No. 4 100.0% 99.7% 100.0% 100.0% 100.0% 100.0% 100.0%No. 8 86.4% 86.1% 86.7% 87.0% 86.4% 87.6% 86.7%No.16 62.2% 62.5% 63.1% 63.6% 73.1% 74.6% 72.9%No. 30 42.3% 42.7% 42.9% 43.0% 62.6% 64.2% 61.7%No. 50 19.5% 19.4% 19.3% 19.4% 51.1% 52.7% 49.7%
No. 100 4.8% 4.6% 4.4% 4.4% 33.3% 36.5% 31.4%No. 200 1.3% 1.1% 1.0% 96.0% 19.3% 22.1% 16.9%
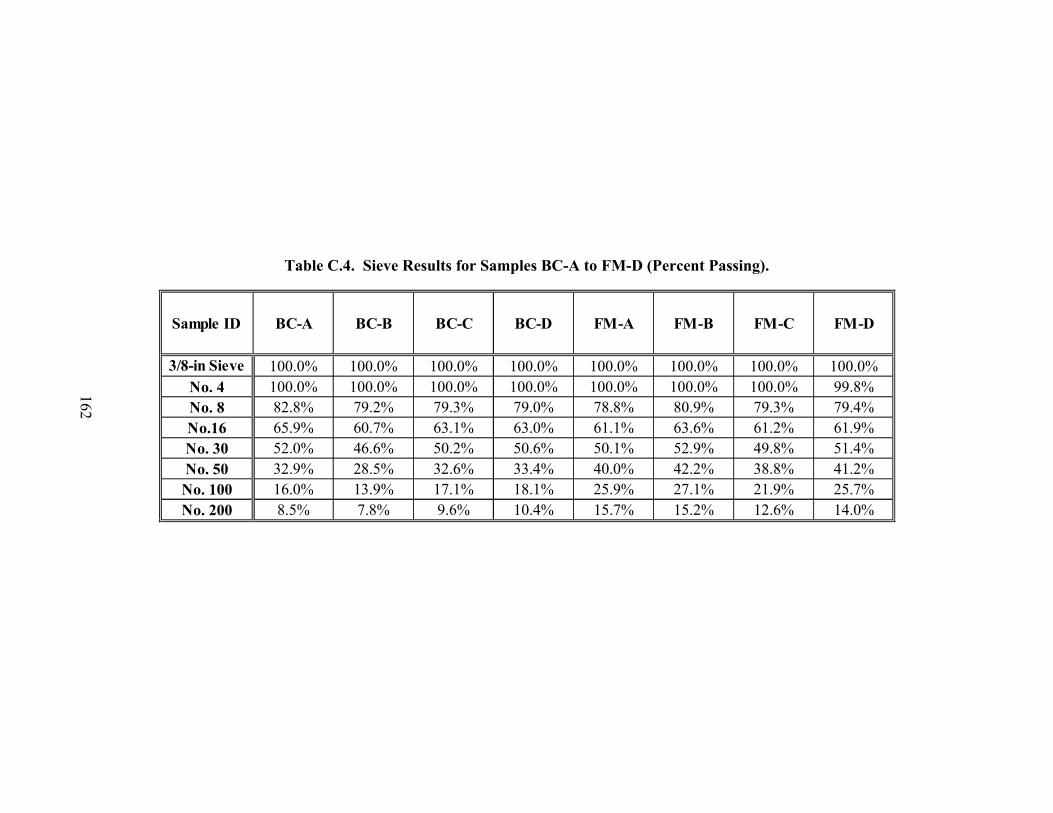
162
Table C.4. Sieve Results for Samples BC-A to FM-D (Percent Passing).
Sample ID BC-A BC-B BC-C BC-D FM-A FM-B FM-C FM-D
3/8-in Sieve 100.0% 100.0% 100.0% 100.0% 100.0% 100.0% 100.0% 100.0%No. 4 100.0% 100.0% 100.0% 100.0% 100.0% 100.0% 100.0% 99.8%No. 8 82.8% 79.2% 79.3% 79.0% 78.8% 80.9% 79.3% 79.4%No.16 65.9% 60.7% 63.1% 63.0% 61.1% 63.6% 61.2% 61.9%No. 30 52.0% 46.6% 50.2% 50.6% 50.1% 52.9% 49.8% 51.4%No. 50 32.9% 28.5% 32.6% 33.4% 40.0% 42.2% 38.8% 41.2%No. 100 16.0% 13.9% 17.1% 18.1% 25.9% 27.1% 21.9% 25.7%No. 200 8.5% 7.8% 9.6% 10.4% 15.7% 15.2% 12.6% 14.0%