Embed Size (px)
Citation preview

PAPER IDENTIFICATION NUMBER: 1570372914
1
Abstract —Light emitting diode (LED) lamps exhibit nonlinear
characteristic causing negative influences on power grid and on
public health. High harmonic contents injected by LEDs as well as
their sensitivity to voltage fluctuations in the network should be
further examined. This paper aims at a better understanding to
the characterization of commercial dimmable LED lamps and
their impact on power quality parameters. A testbed has been
implemented as a platform to investigate current and voltage
quality issues by conducting various experimental tests that
include power quality concerns such as harmonic analysis, voltage
flickering, voltage sag and swell. The experimental setup allows
execution of light intensity, harmonic current contents and voltage
measurements of commercial LED lamps. Data processing using
MATLAB software tool has been used to analyze the results. The
percent flicker is used to evaluate varying degrees of flickering
happening in LED lighting networks. The effect of changing the
light intensity for dimming purposes on the perceptibility of flicker
has been studied and discussed as well. The paper provides a solid
reference for researchers working on power quality improvement
of LED lamps.
Index Terms— Current harmonics, flickering, LED, percent
flicker, power quality, voltage sag, voltage swell.
I. INTRODUCTION
OLLOWING recent developments in the technology of solid
state lighting (SSL) and hence light emitting diode (LED)
lamps, high luminous, intensity and emission spectrum LEDs
are now taking a significant share of the lighting market [2].
Table I shows a comparison between the efficacies of different
types of lighting sources given their general efficacy range
measured in Lumen/Watt [3]. Manufactures are competing to
break through the predicted theoretical luminous efficacy limit
260-300 lm/W of white LEDs [4]. Besides, LED lamp is a high
reliability product with long lasting lifetime that ranges from
50000 up to 100000 hours. Moreover, it is considered an
ecologically friendly with no toxic substances or ultra-violet
emitted energy [3].
However, even though LEDs show the most efficient lighting
source, they do not offer the best choice when high power
quality (PQ) parameters are essential. Studies have been carried
TABLE I COMPARISON BETWEEN THE EFFICACY OF VARIOUS TYPES OF LIGHTING
SOURCES [3]
Type of lamp Lumen/Watt
Incandescent 10 to 35
Mercury Vapor 30 to 80
LED 40 to150
Fluorescent 40 to100
Metal Halide 50 to 115
High Pressure Sodium 85 to 150
Low Pressure Sodium 100 to 200
Induction 50 to 100
Plasma 70 to 150
out to evaluate the performance of LEDs compared to compact
fluorescent lamps (CFL), High Pressure Sodium (HPS) and
incandescent bulbs [5]-[7]. An impedance network model with
current sources that represent injected harmonic contents can be
used to model LED lamps [6]. LEDs show a better performance
in terms of total harmonic distortion (THD) and power factor
(PF) in contrast to CFL driven by an electronic ballast. While,
a CFL driven by an electromagnetic ballast show higher PQ
parameters [7].
A driving circuit is necessary to condition the voltage applied
to LEDs. Therefore, their actual characteristics as loads will
change according to the power electronic devices employed in
the driver. Power electronics introduce high harmonic contents
in the power network. Some low cost LED bulbs contain high
harmonic contents that exceed the requirements specified by the
standards IEC 61000-3-2 [9] and IEEE 519 [10]. Different
manufactures employ dissimilar filtering techniques that vary
between passive, valley-fill and active filters [11]. A frequency-
domain LED model to simulate a large-scale of LED lighting
network has been presented in [12]. The study shows that
despite the low power consumption of LEDs, a large number of
LEDs connected to the same bus would pollute the network
voltage, increasing the harmonic voltage distortion level. In
addition, dimmable LEDs will add additional reduction to the
PF with more harmonic contents reaching 360% using TRIAC-
based dimmer [13], [14].
To mitigate the injected harmonics, researchers are
proposing including a passive filter or a power factor correction
(PFC) circuit to the LED internal driver. This will be discussed
in details in subsection II.B. A PFC circuit adds complexity, and
increases the cost of an individual LED bulb. The authors in
[15] recommended connecting a combination of CFL, LED and
incandescent bulbs as an optimized solution to avoid their
Characterization of Commercial LED Lamps for
Power Quality Studies
Radwa M. Abdalaal, Student Member, IEEE, and Carl Ngai Man Ho, Senior Member, IEEE
F
This is an updated version of conference paper [1]. This new version
includes detailed analysis and updated experimental results. The work described in this paper was fully supported by a grant from the
Canada Research Chairs, Canada (Sponsor ID: 950-230361).
R. M. Abdalaal, and C.N.M. Ho (Corresponding author) are with the RIGA Lab, the Dept. of Electrical & Computer Engineering, University of
Manitoba, R3T5V6, Winnipeg, MB, Canada (Email:

PAPER IDENTIFICATION NUMBER: 1570372914
2
disadvantages if they were employed individually. This
solution is not practical to the user and does not follow the
advancements of SSL and power semiconductor devices.
LEDs are also subjected to flickering. Voltage flickering is
defined as variations of the voltage magnitude that are periodic
and systematic. The magnitude of the voltage does not normally
exceed the voltage ranges specified by EN 50160 [16]. The term
flicker is derived from the impact of a voltage fluctuation on
lighting sources such that the change in the light intensity is
perceived by a human eye [17]. Rapid heavy load changes are
typically the cause of system flickering. For example, large spot
welding machines often operate in or near 5-10 Hz. A human
eye/brain is most sensitive to low frequencies. There will be
random voltage variations over a wide frequency band when ac
electric arc furnaces are in operation that yield to a major source
of flickering [18]. Flickering has brought concerns to both
utility and end-users, due to human biological effects of light
flicker. Potential health risks caused by flickering in LEDs has
been addressed in IEEE standards PAR1789 [19]. The risk of
epileptic seizure is high when flicker occurs at frequencies
within the range of 3–70 Hz. Other less severe neurological
symptoms including malaise and migraine might happen due to
a visible or invisible flickering. Frequencies of 100 Hz for 50
Hz electric network in Europe or 120 Hz for 60Hz electric
network in North America cause distraction and headaches,
usually when there is a large variation in the light intensity [19].
Providing constant current to LEDs will reduce the flickering
phenomenon due to the correlate relation between the LED
forward current and its output light intensity. This approach is
not applicable with dimmable LEDs, as they are sensitive to
voltage variations in the network. This will be examined in this
paper in details. A smart bulb has been introduced as a flicker-
free LED in [20]. The dimming signal will be received by an
external transceiver to vary the PWM signal duty cycle.
However, this technique requires additional wireless
communication modules in each individual bulb to support this
technology, which adds complexity to the LED driver, and
increases the cost of a large lighting network. A unified power
quality conditioner has been proposed in [21] as a central
comprehensive solution for both flickering and harmonics
associated with commercial dimmable LEDs. This is achieved
by providing a stable sinusoidal voltage across the LEDs in the
occurrence of voltage fluctuations in the power grid.
The replacement of conventional lighting sources with LEDs
dictates the need to perform more studies to examine the
characteristics and behavior of commercial LED lamps. In this
paper, a broad analysis of the main PQ issues related to the use
of LEDs is presented. PQ problems can be classified into two
main groups including voltage quality and current quality [8].
The voltage quality can be further categorized into steady state
and disturbance as illustrated in Fig. 1. The steady-state
category is specified for continuous and periodic
characteristics, while disturbance appears randomly and occurs
for a short time. For the purpose of this study, the effects of
voltage flickering, voltage, current harmonics and the
interaction between them are studied as steady state PQ
problems. Voltage sag and voltage swell which happen for a
Power Quality
InteractionCurrent QualityVoltage Quality
Disturbance Steady State
Voltage Flicker HarmonicsVoltage Sag/Swell
Fig. 1. Power quality problems classification [8].
short period are studied as disturbance PQ problems. Rest of the
paper is organized as follows: Section II provides a review of
LED lamp structure, LED driver and international regulations
of LED lighting industry. Description of the methodology to
evaluate the performance of LEDs, and experimental results are
given in section III and section IV respectively.
II. LED LAMP TECHNOLOGY
Fig. 2 gives a sectional view diagram of the structure of a
commercial LED lamp. The main components for this study are
the LED string and the LED driver.
A. LED Semiconductor material
An LED lamp consists of a solid-state device that emits light
when electric current passes through it. LEDs are fabricated by
either inorganic semiconductor materials such as; indium
gallium nitride (InGaN), aluminum gallium arsenide (AlGa)
and gallium phosphide (GaP), or by organic (OLED) carbon
based semiconductors [22]. Inorganic LEDs produce
concentrated output light. They are mainly applied in
residential, commercial and outdoor lighting applications.
OLEDs allow for thinner, lightweight and larger surface area
displays that can be used in TV, cellphones and tablets [23].
Due to their diffuse output light, they are suitable for indoor and
decorative lighting applications. Both technologies continue to
advance and develop in different applications.
B. LED Drivers
In order to characterize the behavior of an LED light bulb, it
is important to study the operation of its internal driver circuit
first. An LED lamp is a dc voltage load. Therefore, LED
requires conditioning the input power and a current regulating
driving circuit that delivers constant current to the LED. The
LED driver is the main source of PQ problems. Various
techniques have been developed to improve the reliability as
well as the driving circuit of LEDs. LED drivers can be
categorized into passive, active and DC driver.
1) Passive Driver
Passive LED drivers comprise only of passive components
(e.g. resistors, inductors, capacitors and diodes). They are
preferred in outdoor applications due to their high reliability
and high efficiency. However, it becomes challenging to
achieve low THD and high PF on top of low output voltage
ripple. The valley-fill circuit has been proposed and modified
shown in Fig. 3 to eliminate the large electrolytic capacitors (E-
caps) that limit the life span of LEDs [24], [25]. Passive drivers

PAPER IDENTIFICATION NUMBER: 1570372914
3
LED String
LED Driver
Light
diffuser
Housing &
Heat sink
Base & Socket
Fig. 2. Sectional view diagram of an LED lamp.
require large inductors that make the driver bulky and heavy.
2) Active Driver
Active drivers contain active semiconductor devices
operating at high frequency that can achieve precise output
control. The Literature classifies active LED drivers according
to the number of power stages included [22], [26].
Single-Stage Topology
A single-stage topology has one controller where the ac input
voltage is rectified and applied directly to the LED string. A
typical single-stage topology is a rectifier bridge then a DC/DC
converter that can be either buck, boost or buck-boost. A buck
topology is shown in Fig. 4. The rectifying circuit draws current
when the instantaneous input voltage exceeds the capacitor
voltage as illustrated in the waveforms in Fig. 4. This will result
in a high-distorted input current with low PF. The authors in
[27] proposed a buck topology with current path control
switches for LED segments for improved PF. Another popular
single-stage topology is the flyback converter shown in Fig. 5
[28]. Flyback converter topology offers isolation and can
function as a PFC. Generally, single-stage topology offers high
power density with less number of switching devices.
Nevertheless, it suffers from meeting the requirements of both
high efficiency and long lifespan for LEDs due to the need of
large E-caps at the output to reduce the output ripples.
Multiple-Stage Topology
It is challenging to achieve high PF, low output ripple and
current control with one converter. For that reason, researchers
introduced adding another converter. A two-stage topology, as
given in Fig. 6, is typically used to offer a better performance
and a reduction of output ripple. The first stage includes a PFC
to shape the input current. The boost topology is mostly used
for this stage due to its easy implementation. The second stage
includes a DC/DC converter to maintain the voltage and the
driving power of the LED string. The two stages will work
independently. Having independent control loops and gate
drivers will add to the cost of the system. Besides the energy is
processed twice which will decrease the overall efficiency. For
higher LED lighting applications (>100W), LLC converter has
been introduced [29]. Fig. 7 shows a traditional topology for
high wattage LED applications. As the PFC DC output voltage
is high, an isolation is required. The DC/DC stage consists of a
half bridge LLC resonant converter that drives the LED strings.
Due to the increased number of switching devices, attention
should be given to the switching loss.
AC
Input Filter Valley-Fill
+
-
𝑉𝑜
𝐿𝑜 𝐿𝑠
𝐶𝑠
LED String
Fig. 3. Passive LED driver based on valley-fill circuit [24].
EMI Filter
𝑉𝐷𝐶 ,𝑝𝑒𝑎𝑘
𝑣𝑎𝑐
𝑖𝑎𝑐
𝑉𝐷𝐶
+
-
𝐼𝑜
𝑉𝑜
𝐼𝑜
𝑣𝑎𝑐
𝑖𝑎𝑐
+
-
𝑉𝑜
LED String
𝐿
𝐶2 𝐶1
Buck
Fig. 4. Single-stage LED driver based on buck converter.
𝐶𝑜 AC
Input Filter
𝐶𝑠
Flyback LED String
+
-
𝑉𝑜
𝐿𝑠
Fig. 5. Single-stage LED driver based on flyback converter.
𝐿1
𝐶2 𝐶1 ACEMI
Filter
𝐿2
+
-
𝑉𝑜
DC/DC
Converter
LED StringPFC
Fig. 6. Two-stage LED driver.
ACEMI
Filter
𝐿1
𝐶2 𝐶1
𝐿2
𝐿3
𝐶3 +
-
𝑉𝑜
LLC Resonant Converter LED StringPFC
Fig. 7. Conventional two-stage LED driver for high power applications.

PAPER IDENTIFICATION NUMBER: 1570372914
4
Integrated Single-Stage Topology
Integrated single-stage solutions have been introduced in the
literature [30], [31] in which the PFC stage and the DC/DC
stage are combined in one converter. This is attained by sharing
the power transistor to achieve low input current harmonics and
low output ripple. Integrated single-stage topology requires less
number of switches, control and gate driving circuits. However,
high voltage stress will be imposed across the switch.
Therefore, it is mostly used in low power application.
3) DC Driver
DC microgrid is now being introduced with the adoption of
recent technology of renewable energy sources. In a dc grid,
there will be no need for the ac-dc conversion stage increasing
the overall efficiency. Recent studies are proposing topologies
for LED drivers that are compatible with dc grid. A buck-boost
LED dc driver that allows battery operation has been presented
in [32], while the authors in [33] have proposed a half bridge
inverter with a variable inductor for current regulation. A dc
grid does not guarantee a flicker-free environment. The
immunity of LED lamps to flickering in low voltage dc
networks is still being investigated [34]. This means that
fluctuations in the voltage level in a dc grid might also cause
visible and invisible light flickering.
It is important to note that flickering levels and amount of
harmonics injected by LEDs are not constant and vary with the
type of the utilized driving methodology.
C. LED International Regulations
Efficiency, power density, cost and lifetime are the four main
criteria to design an LED lamp. However, manufactures must
take into consideration international standards and regulations
in their selection of an LED driver. The most adopted SSL
standards are the IEC standard [9] and the Energy Star program
[35]. In IEC 61000 3-2 standard, lighting equipment is under
class C for power ratings > 25W or class D for ≤ 25W, in which
harmonic contents of the input current, up to order 40, shall not
exceed maximum permissible limits. ANSI, IESNA, UL and
NEMA are the lighting standards referenced in the Energy Star
program that defines performance characteristics and
procedures to test SSL products. These criteria are applied for
residential and commercial lighting products that are connected
to the electric grid. Table II gives general requirements for
power supply adopted in LED.
TABLE II POWER SUPPLY REQUIREMENTS IN ENERGY STAR PROGRAM [35]
Power Factor Commercial ≥ 0.9, Residential ≥ 0.7
Minimum Operating
Temperature -20°C or below for outdoor applications
Operating Frequency ≥ 120 Hz
Electromagnetic and Radio
Frequency Interference
Commercial: Class A in FCC part 18
Residential: Class B in FCC part 18
Transient Protection IEEE C.62.41-1991, Class A operation.
III. EXPERIMENTAL SETUP
In order to characterize the LED light bulbs working under
different PQ conditions, an experimental setup has been
implemented, which is used to execute light intensity, harmonic
current contents and LED array driving voltage measurements.
A block diagram of the test setup, laboratory setup and the
LEDs under test are shown in Fig. 8, Fig. 9 and Fig. 10
respectively. An ac power supply (Keysight AC6801A) is used
to provide different ac voltage levels to the LED light bulbs.
Besides, the ac power supply output can be controlled by an
external reference signal from a function generator, thus it can
simulate different voltage quality issues, such as voltage dip,
swell and flickering. A 50MHz current probe, a 50MHz
differential probe and an oscilloscope (Tek MDS3204) have
been used to measure the current and voltage waveforms. A
Power Analyzer (Yokogawa WT1800) is used to measure the
current harmonics and PF.
Fig. 8. Experimental setup block diagram.
AC source
Power analyzer
Function generator
OscilloscopeLED lamps
Data analysis
Fig. 9. Laboratory Setup.
Fig. 10. Black box dimension.
Keysight
AC6803A
AC Power
Supply
LED
Drive𝑣𝐿𝐸𝐷 𝑣𝐴𝐶
Lamp Under Test
+
+
LUX
Meter
Yokogawa WT1800
Power Analyzer Tek Scope
𝑖𝐴𝐶
LED Array
33cm
15cm
27cm
4.5cm
Input Voltage Terminals
LUX Sensor
Black Box
PAPER IDENTIFICATION NUMBER: 1570372914
5
A LUX meter (Anaheim Scientific H100) is used to measure
the light intensity of the LED light bulbs when the ac power
supply changes across the LEDs. A black box covers the lamp
fixture. The detailed of the black box dimension is given in Fig.
10. The LUX meter is placed on the top of the box with 4.5 cm
distance from the top of the light bulbs. It is important to
mention that the purpose of using the black box is to have a
fixed environment for the LEDs setup to analyze the change of
the relative light intensity of the LEDs under various PQ
conditions. The maximum output light intensity is measured
under nominal voltage. Then, relative luminance values are
measured under different PQ problems.
The experimental measurements employed in this research
have been conducted on 9 LED bulbs (Sunbeam) with 12 W
power consumption each that is equivalent to a 60 W
incandescent lamp. The LED bulb is Energy Star certified. The
internal driver of the LED bulb is a single-stage topology that
consists of a bridge rectifier and a buck converter.
IV. RESULTS AND ANALYSIS
Since LED lamps mainly employ power electronic devices to
convert ac voltage to dc voltage and maintain the LED array
driving voltage. These devices bring nonlinear characteristics
to the LED lamps. Various tests have been conducted to analyze
and characterize the behavior of the LEDs under dynamic and
static changes.
A. Harmonic analysis
The first test is to evaluate the current quality of the LED
light bulbs. A pure sinusoidal input voltage has been applied
directly across LEDs under test. Table III lists the testing
conditions under nominal operating point. The internal driver
of the LED bulb under this test consists of a PFC topology using
buck converter. The maintained output voltage is set to a value
lower than the peak ac voltage. Input current will flow when the
instantaneous ac voltage is higher than the output voltage.
Otherwise, the bridge rectifier is reverse biased. Therefore,
there is a zero current zone at the grid voltage zero crossings.
Fig. 11 shows the input current drawn by the LEDs with a
nominal input voltage of 120V root mean square (rms). Lower
bus voltage level is required in a PFC buck topology compared
to a PFC boost topology. Nevertheless, achieving high PF and
low THD is limited [36]. The input PF, the total harmonic
distortion of the voltage (𝑇𝐻𝐷𝑉) and the current (𝑇𝐻𝐷𝑖) have
been measured using the power analyzer and given in Table III
under nominal operating condition. The results show that the
PF of the LEDs under test is acceptable, however 𝑇𝐻𝐷𝑖is high
since it cannot provide a sinusoidal current at the input.
High harmonics injected to the network will lead to
overheating in cables and equipment, high core and copper
losses in motors and transformers, and electromagnetic
interference with communication systems. Moreover, the
interference of two or more nonlinear loads will result in a
distorted bus voltage, which in return influences all the loads
connected to the same bus. Hence, more harmonic contents will
be injected back to the network. The second test is to observe
the interaction between voltage and current harmonics. In this
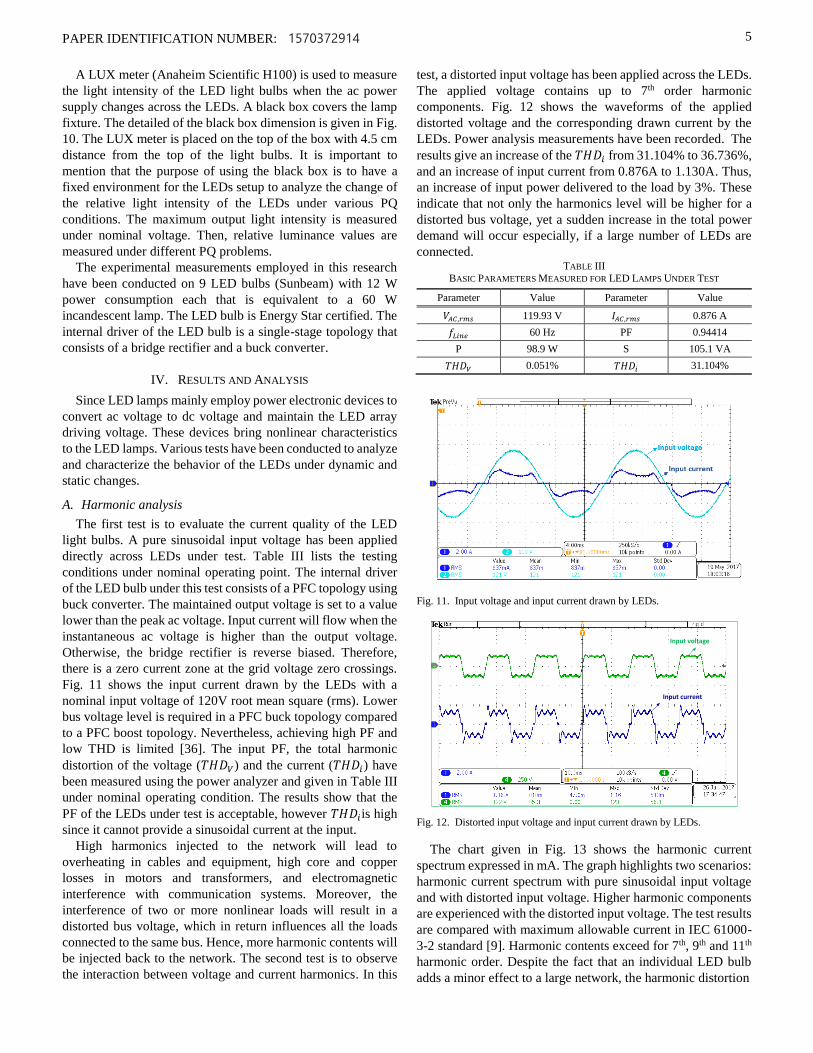
test, a distorted input voltage has been applied across the LEDs.
The applied voltage contains up to 7th order harmonic
components. Fig. 12 shows the waveforms of the applied
distorted voltage and the corresponding drawn current by the
LEDs. Power analysis measurements have been recorded. The
results give an increase of the 𝑇𝐻𝐷𝑖 from 31.104% to 36.736%,
and an increase of input current from 0.876A to 1.130A. Thus,
an increase of input power delivered to the load by 3%. These
indicate that not only the harmonics level will be higher for a
distorted bus voltage, yet a sudden increase in the total power
demand will occur especially, if a large number of LEDs are
connected. TABLE III
BASIC PARAMETERS MEASURED FOR LED LAMPS UNDER TEST
Parameter Value Parameter Value
𝑉𝐴𝐶,𝑟𝑚𝑠 119.93 V 𝐼𝐴𝐶,𝑟𝑚𝑠 0.876 A
𝑓𝐿𝑖𝑛𝑒 60 Hz PF 0.94414
P 98.9 W S 105.1 VA
𝑇𝐻𝐷𝑉 0.051% 𝑇𝐻𝐷𝑖 31.104%
Fig. 11. Input voltage and input current drawn by LEDs.
Input voltage
Input current
Fig. 12. Distorted input voltage and input current drawn by LEDs.
The chart given in Fig. 13 shows the harmonic current
spectrum expressed in mA. The graph highlights two scenarios:
harmonic current spectrum with pure sinusoidal input voltage
and with distorted input voltage. Higher harmonic components
are experienced with the distorted input voltage. The test results
are compared with maximum allowable current in IEC 61000-
3-2 standard [9]. Harmonic contents exceed for 7th, 9th and 11th
harmonic order. Despite the fact that an individual LED bulb
adds a minor effect to a large network, the harmonic distortion

PAPER IDENTIFICATION NUMBER: 1570372914
6
Fig. 13. Harmonic spectrum of the current drawn by the LEDs.
level will be high when several LEDs are connected to the same
feeder e.g. street lighting or parking lot lighting.
B. Static relationship between light intensity, LED array
voltage and input voltage
It is well known that one of the advantages of using LED
bulbs is the compatibility with TRIAC dimmer. The amount of
light intensity provided by an LED is proportional to the
average current passing through it [38]. The dimming capability
is achieved by sensing the input voltage level to adjust the
average current fed to the LED string [39]. Subsequently, the
output light intensity can be controlled.
A test has been conducted to study the change in the output
light intensity by varying the ac-applied voltage across the LED
lamps. The ac voltage across the LEDs has been gradually
decreased from 120V rms to zero. Below 30V rms, the voltage
cannot sustain the LED array and the lamps turn off completely.
At 120V the total luminous flux incident on a surface per
unit area (illuminance) is found to be 12800 LUX. This value
has been taken as the maximum output light intensity of the
LEDs under the test condition. As the black box has been used
to cover the LEDs in this test, all other measurements are given
relative to the maximum output illuminance expressed in
percentages. The results in Fig. 14 show that if the applied
voltage is reduced, the voltage across the LED will be changed
and hence the output light intensity will be decreased
accordingly, until it reaches 30V. This means that the LED
driver will translate the reduction of the applied voltage into a
request of dimming. The reason of light intensity dropping is
the LED array driving voltage drops as well. This directly
affects the power consumption of the LED devices as well.
20
25
30
35
40
45
30 40 50 60 70 80 90 100 110 120
LE
D v
olt
ag
e [
V]
Applied voltage [V]
LED voltage vs applied voltage
0
10
20
30
40
50
60
70
80
90
100
30 40 50 60 70 80 90 100 110 120
Illu
min
anc
e [%
]
Applied voltage [V]
Light intensity vs applied voltage
Fig. 14. Input voltage vs LED voltage and light intensity.
C. Dimming with amplitude variation technique
From the discussion in the previous subsection, dimming an
LED can be achieved by varying the amplitude of the voltage
applied, therefore controlling the LED forward current, hence
its light intensity. Table IV shows PQ parameters for a reduced
sinusoidal rms voltage across the LEDs under test. The change
in the harmonic components is not linear due to the non-
linearity of the LEDs. Harmonic contents depend mainly on the
PFC circuit implemented in the LED driver. The results depict
that the distortion level is still within the permissible limits
given that dimming has been achieved by reducing the
sinusoidal voltage amplitude. On the other hand, violation of
maximum allowable harmonic contents has been observed
using TRIAC dimmer [37], as the input voltage will be
chopped. Therefore, the voltage applied across the LEDs will
be distorted. Moreover, high inrush current will be drawn by
LEDs to charge the input filter capacitor. TABLE IV
POWER QUALITY PARAMETERS WITH VARYING VOLTAGE AMPLITUDE
Applied rms
voltage
Fundamental
current
[mA]
3rd harmonic
[mA]
5th
harmonic
[mA]
7th
harmonic
[mA]
𝑇𝐻𝐷𝑖
[%]
110 843.1 145 125.5 98.5 25.64
100 846.7 65 138.9 72.2 20.31
90 829.2 54.9 118.5 52.4 17.35
80 749.8 101.9 93.6 41.6 19.37
70 630.8 117.8 82.4 24 22.98
60 504.7 128.6 63 5 27.86
50 369.7 129.4 33.7 15.2 34.71
40 226.4 108.4 2.4 18.3 44.19
30 106.8 74.1 29.4 3.1 60.59
< 30 LEDs turn off
D. Flickering and sensitivity to voltage fluctuations
Flickering is a rapid change in the intensity of light bulbs,
which causes a visual change in the light intensity. The effects
caused by voltage flickering depend mainly on the amplitude
and the frequency range of voltage variations. In this paper, the
percent flicker will be calculated as a measure of flickering as
follows [40],
𝑃𝑒𝑟𝑐𝑒𝑛𝑡 𝑓𝑙𝑖𝑐𝑘𝑒𝑟 =max 𝐿𝑈𝑋 − min 𝐿𝑈𝑋
max 𝐿𝑈𝑋 + min 𝐿𝑈𝑋
Amplitude modulation (AM) technique is used to emulate
flickering. A programmable ac-source with a modulated
amplitude signal is applied to the LEDs. The amplitude-
modulated signal is expressed by:
𝑠(𝑡) = [𝐴𝑐 + 𝐴𝑚sin (2𝜋𝑓𝑚𝑡)] sin (2𝜋𝑓𝑐𝑡) (1)
where:
Carrier signal: 𝑐(𝑡) = 𝐴𝑐sin (2𝜋𝑓𝑐𝑡) (2)
Modulation signal: 𝑚(𝑡) = 𝐴𝑚sin (2𝜋𝑓𝑚𝑡) (3)
and, Modulation index: 𝑚 =𝐴𝑚
𝐴𝑐 (4)
The modulation index is a measure of how much a modulated
signal is varied with respect to its unmodulated level. The effect
of changing the modulation frequency and the modulation
index (m) on the output light intensity has been investigated.
Fig. 15 shows an amplitude-modulated signal with 60 Hz
carrier frequency, 4 Hz modulation frequency waveforms and

PAPER IDENTIFICATION NUMBER: 1570372914
7
8% modulation index. It can be seen that the LED voltage is
fluctuating with the same frequency as the input voltage.
A string of LED has I-V characteristics similar to a diode. An
LED is a p-n junction with a dynamic resistance that shifts as
the forward current changes. A slight change of an LED voltage
will result in a large change in LED current. The LED string
can be modeled as a threshold voltage in series with a dynamic
resistance [30]. Therefore, an assumption has been made in the
measurements; the dynamic response of the LED array is very
quick for changing the array voltage to the light intensity and
cannot be recorded using the LUX meter. Hence, curve fitting
has been done using Fig. 14 measured results to map the light
intensity to the scope measured LED array voltage. Fig. 16
shows a steady state input voltage of 120 V rms without voltage
flickering, which results in high frequency changes (including
the double line frequency and the switching frequency) in the
light intensity that are not observable by human eyes. Yet, there
is no low frequency variation in the light intensity. In contrast,
a further experiment by inputting a modulated ac signal to
represent voltage flickering that has frequencies of 60±15 Hz,
shown in Fig. 17. In order to have a better observation of low
frequency components, high frequency signals, which are not
observed by human eyes, are removed by using data processing
in the light intensity data with MATLAB software tool. A
waveform with a low frequency variation of light intensity can
be seen at the bottom row of Fig. 17. The low frequency
variation in the LED voltage caused a visible rapid change in
the illuminance of the LEDs. It is the reason to have observable
flickers from LED light bulbs. Fig. 18 shows that for slower
flickering frequencies less than 5 Hz, the variation of light
intensity is very slow to be observed by a human eye. However,
these invisible variations might cause a health risk as addressed
by the PAR1789 standards, as the sensitivity of a human eye to
flickering differs from one person to another.
The effect of varying the modulation index (m) on the percent
flicker is shown in Table V. The percent flicker is calculated for
input voltage flickering with a 2% step change in m. The results
verify that, lower m meaning lower voltage peaks variations
will result in lower flickering.
The observed light intensity by a human eye is dissimilar
from the light intensity measured by a lux meter. The relation
between the measured and the perceived light intensity is
nonlinear and governed by the following [40],
𝑃𝑖 (%) = 100 ∗ √𝑀𝑖 (%)/100 (5)
where: 𝑃𝑖 is the perceived light intensity, and 𝑀𝑖 is the measured
light intensity.
For instant, a bulb that is dimmed to 5% of its full intensity
will be perceived by 22.4%, while 80% dimming level will be
perceived as 89.4%. Fig. 19 shows the measured and the
perceived light for LEDs under test under different applied
voltage levels. It can be noted that at low dimming levels the
perceived light intensity will be higher than the desired one. The
reason is at low light levels, the human eye enlarges the pupil
to permit a greater amount of light to enter the eye [40]. In order
to examine if this difference would improve the percent flicker
for the end-user, various light intensities have been considered.
Dimming has been achieved by varying the amplitude of the
sinusoidal voltage across the LEDs. Fig. 20 and Fig. 21 show
measured and perceived light intensity with input voltage
flickering at 100% and 16% light intensity respectively.
Perceived illuminance for 16% dimming level is found to be
40%. The percent flicker has been calculated when the lamps
are dimmed.
Measured and perceived percent flicker under various
dimming levels applying same modulation index and same
frequency flickering input voltage are given in Table VI. The
results indicate that dimming LEDs would increase the amount
of flicker produced even though the perceived percent flicker is
improved compared to the measured one. In other words, LEDs
are more sensitive to flickering in the presence of dimming. TABLE V
PERCENT FLICKER FOR 2% STEP CHANGE IN MODULATION INDEX
m 2% 4% 6% 8% 10%
Percent flicker 38.01% 41.26% 41.26% 43.17% 43.17%
TABLE VI
PERCENT FLICKER UNDER DIFFERENT DIMMING LEVELS
Applied voltage 40V 60V 80V 100V 120V
Light intensity 7% 34% 66.5% 89.5% 100%
PF (measured) 66.28% 43.17% 25.02% 8.44% 4.4%
PF (perceived) 37.9% 22.7% 12.71% 4.23% 2.2%
LED voltage
Input voltage
Fig. 15. Applied voltage flickering to LED.
Fig. 16. LED voltage and light intensity with no flickering input voltage.

PAPER IDENTIFICATION NUMBER: 1570372914
8
Fig. 17. LED voltage and light intensity with 15 Hz voltage flickering.
Fig. 18. LED voltage and light intensity with 4 Hz voltage flickering.
Fig. 19. Measured and perceived light intensity under different voltage levels.
Fig. 20. Measured and perceived illuminance for 100% light intensity with
voltage flickering.
Fig. 21. Measured and perceived illuminance for 16% light intensity with
voltage flickering.
E. Voltage sag and swell
This test aims to examine how LEDs would react in the
presence of a voltage sage Fig. 22 or a voltage swell Fig. 23.
Different levels of voltage sag have been applied across the
LEDs as shown in Fig. 22. The voltage sag levels are 90%, 70%
and 50% of nominal voltage respectively. The figure shows that
at the event of a voltage sag, the LED voltage, which is the dc
voltage applied to the LED string, will be affected and reduced
as well. This happened because the LED driver interpreted this
voltage reduction as a request to dim the LEDs. Hence, the
controller will react to achieve a new operating point driving
the LED string at a lower voltage and a lower forward current.
Since the light intensity of the LED changes linearly with its
forward current, this reduction in the LED voltage, even if it is
for a short time, will result in a corresponding decrease in the
bulb output illuminance. This disturbance will cause a visible
light flickering that might disrupt the end-user.
Furthermore, it has been observed that the lamps will
malfunction and turn off for a voltage sag less than 25% of rated
voltage as shown in Fig. 24. The figure shows that the LED
voltage reaches the new operating point quickly however the

PAPER IDENTIFICATION NUMBER: 1570372914
9
controller fails to maintain the new voltage level. As a result,
the capacitor starts to discharge through the internal sensing
resistors. The controller starts to react again to charge up the
capacitor but the energy provided by the input source was not
large enough, therefore the controller fails again. During this
period, the LEDs completely turn off until the voltage sag is
over. The input current starts to increase charging up the
capacitor until the operation reaches steady state.
Fig. 22. Voltage across the LED for different applied voltage sag levels.
Input voltage
LED voltage
Voltage swell
Fig. 23. Voltage swell at 132V.
LED voltage
Input voltage
Voltage sag
Input current
LED turn off
Fig. 24. LED voltage at 23% voltage sag.
This can be dangerous especially in street light applications,
where it might distract the drivers and cause unexpected
response that possibly lead to road accidents. The sensitivity of
LEDs to a voltage swell is similar to their sensitivity to a voltage
sag. A voltage swell of 110% of nominal rated voltage has been
applied to the LEDs as shown in Fig. 23. As a result, the voltage
across the LEDs has increased respectively. The input power
consumed by the 9 LEDs under test has also been increased to
112 W, which means for a large-scale of LEDs, a voltage swell
might cause a sudden increase in the total network power
demand.
V. CONCLUSION
Characterization and evaluation of commercial dimmable
LEDs have been done through an experimental platform. Light
intensity measurements, current and voltage waveforms were
collected under numerous power quality conditions. The
collected data had been processed using MATLAB software
tool. The key findings of the conducted tests can be concluded
into two main power quality issues associated with the
utilization of LED lighting technology; harmonics injection
affecting the utility side and flickering phenomena affecting the
end-users. The results showed that the LEDs under test inject
harmonic contents to the network that should not be ignored
especially for applications that require a large number of
connected LEDs. To achieve dimming, amplitude voltage
variation had been applied across the LEDs. It is recommended
varying the amplitude of the applied sinusoidal voltage across
the LEDs, rather than using conventional dimming technique
such as TRIAC-dimmer system to achieve dimming. This will
limit the injected harmonics to the level designed by the
manufacture. The results also indicate that the performance of
LEDs is significantly affected by the quality of the grid.
Flickering in LEDs light intensity had been observed in
response to various grid events. The amount of flicker produced
by an LED lamp was found to be dependent on the amplitude
and the frequency of which the voltage variations occur. This
stresses the need to develop a comprehensive power quality
improvement technique for such an application.
REFERENCES
[1] R. M. Abdalaal and C. Ho, "Characterization of commercial LED lamps for power quality studies," in Proc. IEEE Elect. Power Energy Conf. (EPEC), 2017, pp. 1-6.
[2] M. S. Shur and R. Zukauskas, "Solid-State Lighting: Toward Superior Illumination," in Proc. IEEE, vol. 93, no. 10, pp. 1691-1703, Oct. 2005.
[3] CEATI International Inc., "Lighting Energy Efficiency Reference Guide," 2014. [Online]. Available:https://www.ceati.com/projects/public-reports/
[4] S. T. Tan, X. W. Sun, H. V. Demir and S. P. DenBaars, "Advances in the LED Materials and Architectures for Energy-Saving Solid-State Lighting Toward “Lighting Revolution”," IEEE Photon. J., vol. 4, no. 2, pp. 613-619, Apr. 2012.
[5] M. M. A. S. Mahmoud, "Typical economic model for calculating the saving norm of replacement HPS street lighting by LED fixtures in access road of gas production company at GCC," in Proc. Int. Conf. Elect. Electron. Eng. (ICEEE), 2018, pp. 189-192.
[6] V. George, A. Bagaria, P. Singh, S. R. Pampattiwar and S. Periwal, "Comparison of CFL and LED lamp - harmonic disturbances, economics (cost and power quality) and maximum possible loading in a power

PAPER IDENTIFICATION NUMBER: 1570372914
10
system," in Proc. Int. Con. Utility Exhib. Power Energy Syst. (ICUE), 2011, pp. 1-5.
[7] R. V. A. Monteiro, B. C. Carvalho, A. B. de Vasconcelos, F. N. de Lima, A. L. A. da Fonseca and T. I. R. de Carvalho Malheiro, "LED tubular lamps and tubular fluorescent: Power quality," in Proc. Int. Con. Harmonics Qual. Power (ICHQP), 2014, pp. 400-404.
[8] D. B. Vannoy, M. F. McGranaghan, S. M. Halpin, W. A. Moncrief and D. D. Sabin, "Roadmap for Power-Quality Standards Development," IEEE Trans. Ind. Appl., vol. 43, no. 2, pp. 412-421, Mar.-Apr., 2007.
[9] Electromagnetic Compatibility (EMC) – Part 3-2: Limits – Limits for Harmonic Current Emissions (equipment input current ≤16 A per phase), IEC Standard 61000-3-2, 2000.
[10] IEEE Recommended Practices and Requirements for Harmonic Control in Electrical Power Systems, IEEE Std 519-2014.
[11] S. Uddin, H. Shareef and A. Mohamed, "Power quality performances of energy-efficient low-wattage LED lamps," Measurement, vol. 46, no. 10, pp. 3783-3795, Dec. 2013.
[12] J. Molina, J. J. Mesas, N. Mesbahi and L. Sainz, "LED lamp modelling for harmonic studies in distribution systems," IET Gener., Transm. & Dis., vol. 11, no. 4, pp. 1063-1071, 9 3 2017.
[13] S. Di Mauro, S. Musumeci, A. Raciti and G. Vasta, "Analysis of the current harmonics injected into the power grid by dimmable LED lamps," in Proc. AEIT Int., Ann. Conf., 2016, pp. 1-6.
[14] S. Uddin, H. Shareef, A. Mohamed and M. A. Hannan, "An analysis of harmonics from dimmable LED lamps," in Proc. IEEE Int. Power Eng. Optim. Conf., 2012, pp. 182-186.
[15] M. S. Islam, N. A. Chowdhury, A. K. Sakil, A. Khandakar, A. Iqbal and H. Abu-Rub, "Power quality effect of using incandescent, fluorescent, CFL and LED lamps on utility grid," in Workshop Smart Grid Renewable Energy (SGRE), 2015, pp. 1-5.
[16] Voltage Characteristics of Electricity Supplied by Public Distribution Systems, EN50160, 2000.
[17] R. C. Dugan, M. F. McGranaghan, S. Santoso and H. W. Beaty, Electrical Power Systems Quality, 2nd ed., New York, McGraw-Hill Professional, 2002.
[18] P. Ashmole and P. Amante, "System flicker disturbances from industrial loads and their compensation," Power Eng. J., vol. 11, no. 5, pp. 213-218, Oct. 1997.
[19] A. Wilkins, J. Veitch and B. Lehman, "LED lighting flicker and potential health concerns: IEEE standard PAR1789 update," in Proc. IEEE Energy Convers. Congr. Expo. (ECCE), 2010, pp. 171-178.
[20] Y. Ko, H. Cho, S. Lee, S. Shin, Y. Song and S. Lee, "A Compact Flicker-Free Transformer-Less LED Driver With an Enhanced Power Factor for Omnidirectional Multichannel Smart Bulb Applications," IEEE Trans. Power Electron., vol. 31, no. 8, pp. 5851-5862, Aug. 2016.
[21] R. M. Abdalaal and C. N. M. Ho, "Transformerless single-phase UPQC for large scale LED lighting networks," in Proc. IECON Ann. Conf. IEEE, Ind. Electron. Soc., 2017, pp. 1629-1634.
[22] P. S. Almeida, D. Camponogara, M. Dalla Costa, H. Braga and J. M. Alonso, "Matching LED and Driver Life Spans: A Review of Different Techniques," IEEE Ind. Electron. Mag., vol. 9, no. 2, pp. 36-47, June 2015.
[23] V. C. Bender, T. B. Marchesan and J. M. Alonso, "Solid-State Lighting: A Concise Review of the State of the Art on LED and OLED Modeling," IEEE Ind. Electron. Mag., vol. 9, no. 2, pp. 6-16, June 2015.
[24] S. Y. Hui, S. N. Li, X. H. Tao, W. Chen and W. M. Ng, "A Novel Passive Offline LED Driver With Long Lifetime," IEEE Trans. Power Electron., vol. 25, no. 10, pp. 2665-2672, Oct. 2010.
[25] L. C. da Motta, E. Agostini and C. B. Nascimento, "Single-Stage Converter Based on the Charge-Pump and Valley-Fill Concepts to Drive Power LEDs," IEEE J. Emerg. Sel. Topics Power Electron., vol. 6, no. 3, pp. 1131-1142, Sept. 2018.
[26] I. Castro, A. Vazquez, M. Arias, D. G. Lamar, M. M. Hernando and J. Sebastian, "A review on flicker-free ac-dc LED drivers for single-phase and three-phase ac power grids," IEEE Trans. Power Electron., Jan. 2019, early access.
[27] J. Baek and S. Chae, "Single-Stage Buck-Derived LED Driver With Improved Efficiency and Power Factor Using Current Path Control
Switches," IEEE Trans. Ind. Electron., vol. 64, no. 10, pp. 7852-7861, Oct. 2017.
[28] X. Xie, J. Li, K. Peng, C. Zhao and Q. Lu, "Study on the Single-Stage Forward-Flyback PFC Converter With QR Control," IEEE Trans. Power Electron., vol. 31, no. 1, pp. 430-442, Jan. 2016.
[29] P. Ma and J. Liu, "A New Off-line LED Lighting Driver Solution with Multi-Transformer LLC Control," Texas Instruments, 2011.
[30] D. Gacio, J. M. Alonso, A. J. Calleja, J. Garcia and M. Rico-Secades, "A Universal-Input Single-Stage High-Power-Factor Power Supply for HB-LEDs Based on Integrated Buck–Flyback Converter," IEEE Trans. Ind. Electron., vol. 58, no. 2, pp. 589-599, Feb. 2011.
[31] H. Ma, Y. Li, Q. Chen, L. Zhang and J. Xu, "A Single-Stage Integrated Boost-LLC AC–DC Converter With Quasi-Constant Bus Voltage for Multichannel LED Street-Lighting Applications," IEEE J. Emerg. Sel. Topics Power Electron., vol. 6, no. 3, pp. 1143-1153, Sept. 2018.
[32] F. Pouladi, H. Farzanehfard and E. Adib, "Battery Operated Soft Switching Resonant Buck–Boost LED Driver With Single Magnetic Element," IEEE Trans. Power Electron., vol. 34, no. 3, pp. 2704-2711, Mar. 2019.
[33] J. M. Alonso, M. S. Perdigão, M. A. Dalla Costa, G. Martínez and R. Osorio, "Analysis and Experiments on a Single-Inductor Half-Bridge LED Driver With Magnetic Control," IEEE Trans. Power Electron. vol. 32, no. 12, pp. 9179-9190, Dec. 2017.
[34] L. Kukačka, P. Dupuis, G. Zissis, M. Kolář and J. Kraus, "LED Drivers: The Role of the Rectifier on Flicker Immunity in ELV DC Environment," in Proc. IEEE Ind. Appl. Soc. Ann. Meeting (IAS), 2018, pp. 1-6.
[35] Energy Star Program Requirement for Solid State Lighting Luminaires, Eligibility Criteria - Version 1.2, Feb. 2009. [Online]. Available: https://www.energystar.gov/ia/partners/product_specs/program_reqs/SSL_prog_req.pdf?d519-671a
[36] B. Keogh, “Power Factor Correction Using Buck Topology-Efficeincy Benefits and Practical Design Considerations,” Texas Instruments Power Supply Design Seminar, 2010.
[37] R. M. Abdalaal, C. Ho, C. Leung and H. Chung, "A Remotely Central Dimming System for a Large-Scale LED Lighting Network Providing High Quality Voltage and Current," IEEE Trans. Ind. Appl., June, 2019, early access.
[38] H. Han, F. Zhang and M. Liu, "PWM Dimming Method for Capacitor-Clamped Current-Sharing Circuit in LED Backlight System," IEEE J. Emerg. Sel. Topics Power Electron., vol. 6, no. 3, pp. 1190-1197, Sept. 2018.
[39] S. Moon, G. B. Koo and G. W. Moon, "Dimming-Feedback Control Method for TRIAC Dimmable LED Drivers," IEEE Trans. Ind. Electron, vol. 62, no. 2, pp. 960-965, Feb. 2015.
[40] The IESNA Lighting Handbook: Reference & Application, 9th ed., Illuminating Engineering Society of North America, New York, 2000.
Radwa M. Abdalaal (S’16) received the B.Sc. and
M.Sc. degrees in electrical engineering from Ain
Shams University, Cairo, Egypt, in 2008 and 2014, respectively. Currently she is working towards the
Ph.D. degree in electrical and computer engineering
at the University of Manitoba, Winnipeg, MB, Canada.
Before starting her Ph.D, she was a Research and
Teaching Assistant at German University in Cairo,
Egypt and German University in Berlin, Germany.
She also worked as a Research Assistant at Hochschule für Technik
undWirtschaft, Berlin, Germany. Her research interests include power quality,
control systems for power electronics applications, LEDs, renewable energy,
and real-time digital simulation technologies.
Ms. Abdalaal is the Founder and currently the Chair of IEEE Student Branch
Industry Application Society Chapter at the University of Manitoba and the
Vice-Chair of IEEE Women in Engineering, Winnipeg section.

PAPER IDENTIFICATION NUMBER: 1570372914
11
Carl Ngai Man Ho (M’07, SM’12) received the B.Eng. and M.Eng. double degrees and the Ph.D.
degree in electronic engineering from the City
University of Hong Kong in 2002 and 2007, respectively.
From 2002 to 2003, he was a Research Assistant
at the City University of Hong Kong. From 2003 to
2005, he was an Engineer at e.Energy Technology
Ltd., Hong Kong. In 2007, he joined ABB
Switzerland. He has been appointed as Principal
Scientist and he has led a research project team at ABB to develop Solar
Inverter technologies. In October 2014, he joined the University of Manitoba in
Canada, where he is currently an Associate Professor and Canada Research
Chair in Efficient Utilization of Electric Power. He established the Renewable-
energy Interface and Grid Automation (RIGA) Lab, the University of Manitoba,
to research on Microgrid technologies, Renewable Energy interfaces, Real
Time Digital Simulation technologies and demand-side control methodologies.
Dr. Ho is currently an Associate Editor of the IEEE Transactions on Power
Electronics (TPEL) and the IEEE Journal of Emerging and Selected Topics in
Power Electronics (JESTPE). He was the recipient of the Best Associate Editor
Award of JESTPE in 2018.