Embed Size (px)
Citation preview

DIVISION OF PACKAGING LOGISTICS | DEPARTMENT OF DESIGN SCIENCES FACULTY OF ENGINEERING LTH | LUND UNIVERSITY 2016
MASTER THESIS
Andrew Vasina
Characterization of casein micelles and sodium caseinate in dense suspensions
Characterization of casein micelles and sodium caseinate in dense
suspensions
Andrew Vasina

Characterization of casein micelles and sodium caseinate in dense suspensions Copyright © 2016 Andrew Vasina
Published by
Division of Packaging Logistics
Department of Design Sciences Faculty of Engineering LTH, Lund University P.O. Box 118, SE-221 00 Lund, Sweden Subject: Food Packaging Design (MTTM01) Division: Packaging Logistics Supervisor: Bjorn Bergenstahl Co-Supervisor: Taco Nicolai (Université du Maine) Examiner: Erik Andersson This Master´s thesis has been done within the Erasmus Mundus Master Course FIPDes, Food Innovation and Product Design. www.fipdes.eu ISBN: 978-91-7623-892-9

Abstract
This thesis describes the characterization of the rheological properties of dense suspensions of sodium caseinate and micellar casein with respect to changes in concentration (100-200g/L), pH (7.0-5.3), charge density (∆α), and temperature (5-40°C). The relationship between pH and charge density and how this relationship is affected by changes in temperature and concentration were also addressed. It has been shown that the pH of sodium caseinate and micellar casein suspensions is affected by concentration with the effect being stronger for dispersions of casein micelles. Changes in pH due to temperature were also observed for casein micelles dispersions, but not for those of sodium caseinate. The differences in the effects for sodium caseinate and casein micelles have been attributed to the presence of calcium phosphate. By measuring and comparing the changes in zero shear viscosity (η0) over the studied range of variables, new insights as to the dynamic interactions of sodium caseinate and casein micelles were observed. Both sodium caseinate and casein micelle suspensions demonstrate a sharp increase of viscosity as temperature is decreased or as the concentration is increased. When observing changes as a function of charge density or pH, sodium caseinate showed a progressive increase in η0, as the suspension was acidified toward the isoionic point, near which gelation occurs. When the ∆α or pH was varied in casein micelles, gelation was observed as the suspension neared the isoionic point due to acidification, but also due to alkalinization. Between these critical gelation points, rheological behavior was observed to be dependent on both concentration and charge density due to counteracting interactions caused by changes in charge density and close packing.
Keywords: casein micelles, sodium caseinate, dense suspensions, charge density, rheology

Acknowledgments
Special recognition must go to professor Taco Nicolai, the main supervisor of the thesis, Erix Schokker, Arno Alting, Hans Nieuwenhijse, and Hesther Jellema and the rest of the FrieslandCampina project team, professor Björn Bergenståhl, the Lund university supervisor, Dr. Erik Andersson, the examiner, and Anya Kim, the opponent of the thesis, for their support, valuable feedback and guidance.
In addition, the author would like to thank all the others who have helped make this thesis possible including the administrative staff of both Lund University and the FIPDes program.
Lund, June 2016
Andrew Vasina
Executive Summary
Introduction Casein is the most abundant protein found in milk making up around 80% of the total milk content. Casein is a key functional and nutritional component in a wide variety of dairy products both within milk as well as an additional ingredient in an isolated form such as micellar casein isolate or sodium caseinate. In milk, the majority of the casein proteins are found in large aggregates called micelles. It is this micellar structure that makes casein such an important component or ingredient in dairy products. Decades of research have been dedicated to understanding the structure of the casein micelle and how this structure interacts and reacts to its environment; however, the exact nature of the structure is still unknown. This thesis is part of an ongoing research project between Professor Taco Nicolai, director of research of the Polyméres, Colloïds, and Interfaces (PCI) lab within the Institut des Molécules et des Matériaux du Mans (IMMM) and the Dutch dairy cooperative, FrieslandCampina. Proposed by FrieslandCampina, this project aims to improve the knowledge base concerning the rheological behavior of dense suspensions of three casein ingredients produced by FrieslandCampina in relations to changes in concentration, temperature and pH. Due to confidentiality issues, this thesis will only discuss the work done on two of those ingredients, micellar casein isolate and sodium caseinate. By improving the knowledge base concerning the rheological behavior of their ingredients and how this behavior changes in response to certain variables, FrieslandCampina will be able to improve a wide variety of products and processes within their business and allow for the continued innovation needed to grow and expand. Objectives In order to enhance the knowledge concerning the behavioral properties of casein-based ingredients and enable FrieslandCampina to better produce, process and control these ingredients, the following goals were set:

· The primary objective of this thesis is to characterize the rheological properties of dense suspensions of sodium caseinate and micellar casein with respect to changes in concentration, pH and temperature in order to better control/manipulate them in an industrial setting.
· In order to complete this primary objective, it is also necessary to determine the effects of temperature and concentration on the pH and the relationship between pH and charge density (α). Methods It was determined early on that using pH as a variable did not best represent changes in rheological behavior when other parameters such as temperature and concentration are varied due to the pH being affected by these parameters. Instead, it is more relevant to observe changes based on changes in charge density or α expressed in charges per protein. This ratio is not affected by changes in temperature or concentration and is more closely connected to changes in the protein structure or behavior then pH. This relationship and the importance of using α when looking at dynamic systems like casein has been previously reported on by Kharlamova et al. (2016). In order to better understand the relationship between pH and charge density, a series of titrations was performed. Second, another series of tests was performed to demonstrate the difference between pH and charge density and how each of these is affected by changes in concentration and temperature. Once this relationship was established and explained, it was decided that all of the rheological measurements would be observed as a function of ∆α with the reference ∆α=0 point being the unaltered α of the powder. The rheological behavior and the changes in this behavior due to temperature, pH and concentration were observed primarily through looking at the zero shear viscosity (h0). This was measured using a rheometer over a range of ∆α=-3-20 and concentrations from 200g/L-100g/L were observed at 5°C 20°C and 40°C for both sodium caseinate and micellar casein suspensions. These results were plotted using sigmaplot to allow for the visualization of any behavioral trends. Results
Relationship between pH and α
The results of the titration curves performed allowed for the relationship between pH and α to be determined at 10g/l. Comparisons between sodium caseinate and
casein micelles in terms of the number of charges needed to adjust the pH was also done and suggests the difference is due to the presence of the calcium phosphate nanoclusters. When observing the changes in pH due to concentration, it was determined that the pH decreased with increased concentration for both sodium caseinate and micellar casein with the effect being greater for micellar casein. Changes in pH due to temperature were also observed for casein micelles dispersions, but not for those of sodium caseinate. The differences in the effects for sodium caseinate and casein micelles have been attributed to the presence of calcium phosphate.
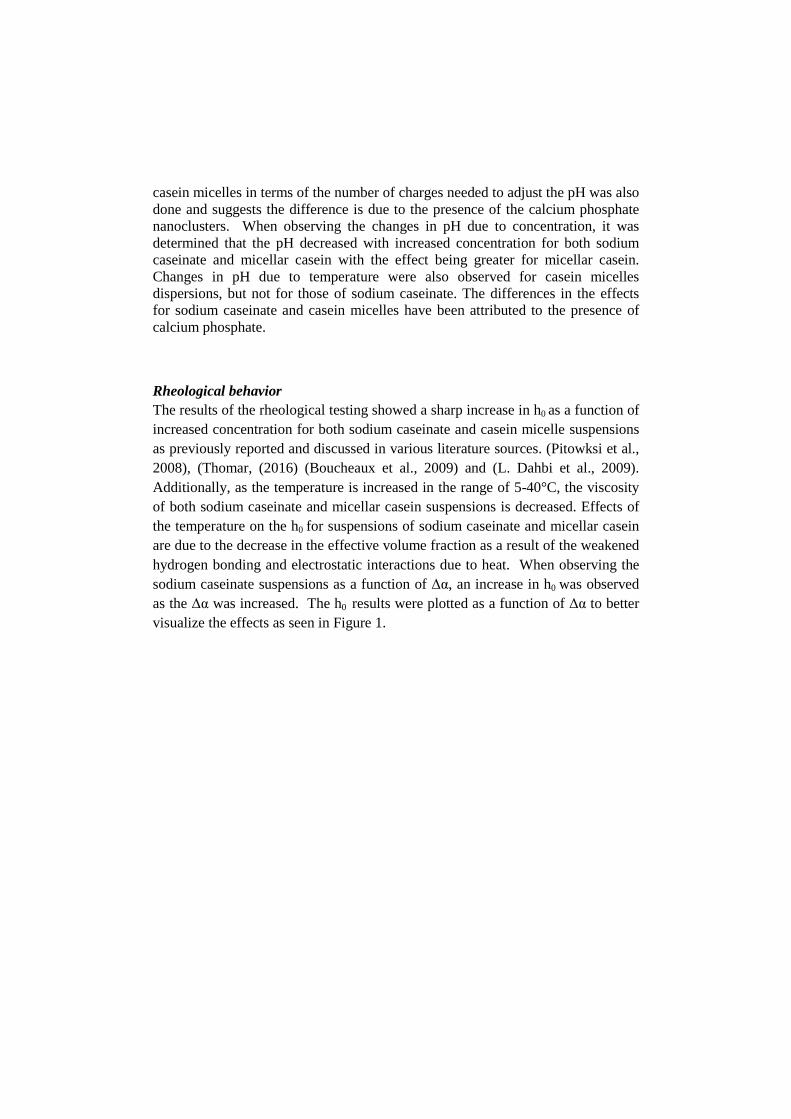
Rheological behavior The results of the rheological testing showed a sharp increase in h0 as a function of increased concentration for both sodium caseinate and casein micelle suspensions as previously reported and discussed in various literature sources. (Pitowksi et al., 2008), (Thomar, (2016) (Boucheaux et al., 2009) and (L. Dahbi et al., 2009). Additionally, as the temperature is increased in the range of 5-40°C, the viscosity of both sodium caseinate and micellar casein suspensions is decreased. Effects of the temperature on the h0 for suspensions of sodium caseinate and micellar casein are due to the decrease in the effective volume fraction as a result of the weakened hydrogen bonding and electrostatic interactions due to heat. When observing the sodium caseinate suspensions as a function of ∆α, an increase in h0 was observed as the ∆α was increased. The h0 results were plotted as a function of ∆α to better visualize the effects as seen in Figure 1.

Figure 1: Zero Shear Viscosity (η0) of casein micelles as a function of ∆α at 20°C with differing
concentrations with vertical lines denoting the critical ∆α
This is due to a decrease in the net charge density of the micelles and the progressive dissociation of calcium phosphate leading to micellar instability and aggregation with gelation close to the critical ∆α. The impact of the changes in ∆α for casein micelle suspension is more complex with a number of factors likely playing a role. The forced close packing of the micelles due to concentration along with the steric repulsion and the shifting electrostatic repulsion and charge density all play a role in the stability and structure of the suspension. Taking all of these different elements into account it can be hypothesized that at 140g/L, the micelles have been forced into close contact due to the concentration, with the relative distance between particles counteracting the effects of local densification due to an increase in attractive forces between micelles. At concentrations below 140g/L, there is a decrease of viscosity when the density locally increases due to attraction between micelles. At concentrations above 140g/L, local densification is no longer sufficient and the micelles remain close packed with the attractive forces leading to aggregation. A visual representation of this behavior can see in Figure 2.
∆α
-10 0 10 20 30
η 0 (P
a.s)
10-3
10-2
10-1
100
101
102
103
100g/l120g/l140g/l 160g/l180g/l
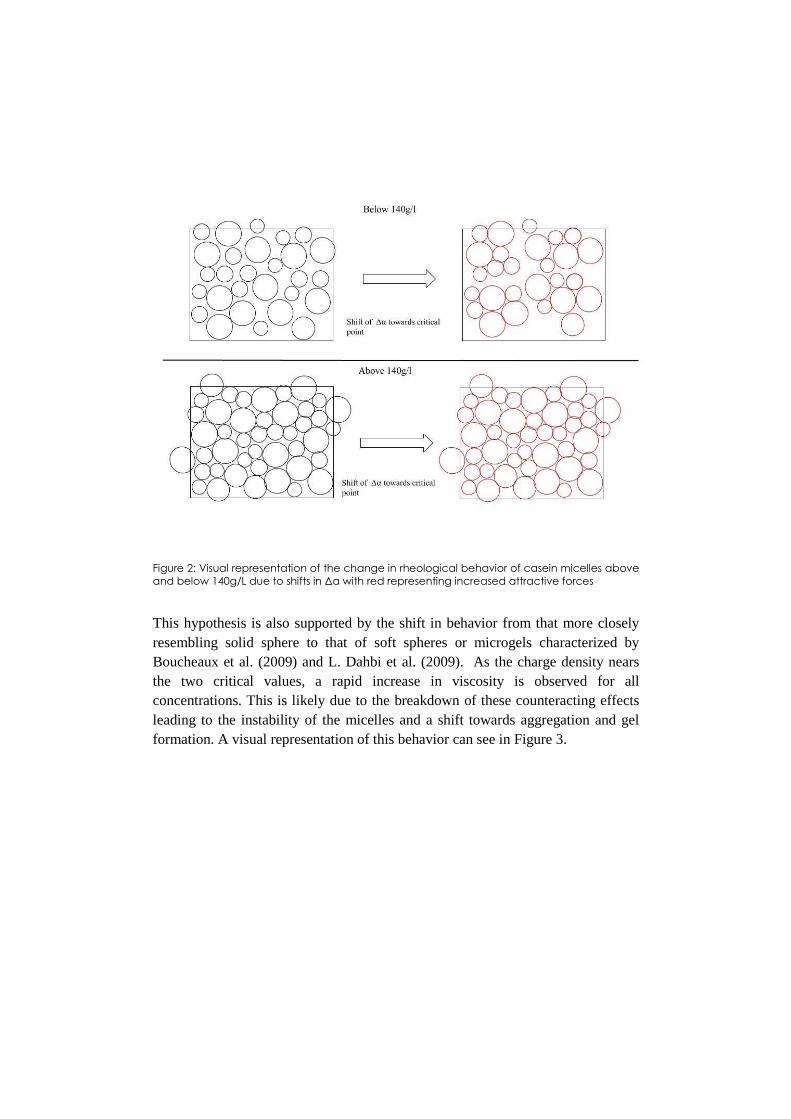
Figure 2: Visual representation of the change in rheological behavior of casein micelles above
and below 140g/L due to shifts in ∆α with red representing increased attractive forces
This hypothesis is also supported by the shift in behavior from that more closely resembling solid sphere to that of soft spheres or microgels characterized by Boucheaux et al. (2009) and L. Dahbi et al. (2009). As the charge density nears the two critical values, a rapid increase in viscosity is observed for all concentrations. This is likely due to the breakdown of these counteracting effects leading to the instability of the micelles and a shift towards aggregation and gel formation. A visual representation of this behavior can see in Figure 3.
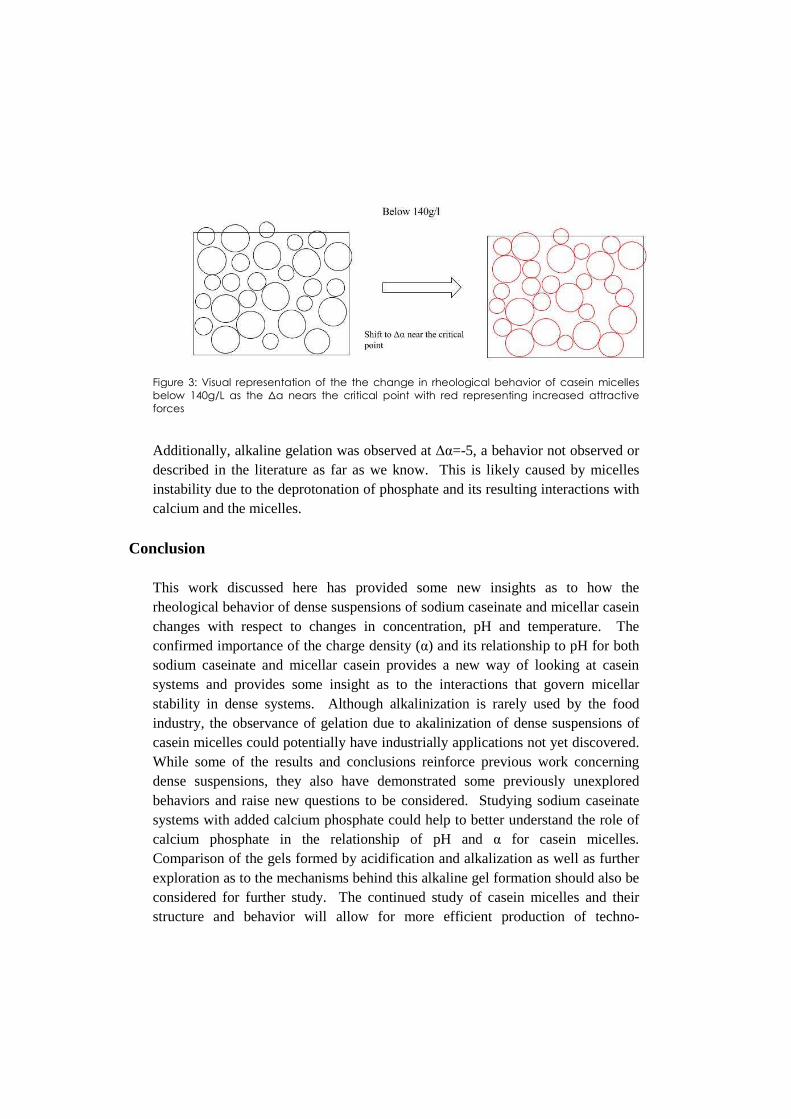
Figure 3: Visual representation of the the change in rheological behavior of casein micelles
below 140g/L as the ∆α nears the critical point with red representing increased attractive
forces
Additionally, alkaline gelation was observed at ∆α=-5, a behavior not observed or described in the literature as far as we know. This is likely caused by micelles instability due to the deprotonation of phosphate and its resulting interactions with calcium and the micelles.
Conclusion
This work discussed here has provided some new insights as to how the rheological behavior of dense suspensions of sodium caseinate and micellar casein changes with respect to changes in concentration, pH and temperature. The confirmed importance of the charge density (α) and its relationship to pH for both sodium caseinate and micellar casein provides a new way of looking at casein systems and provides some insight as to the interactions that govern micellar stability in dense systems. Although alkalinization is rarely used by the food industry, the observance of gelation due to akalinization of dense suspensions of casein micelles could potentially have industrially applications not yet discovered. While some of the results and conclusions reinforce previous work concerning dense suspensions, they also have demonstrated some previously unexplored behaviors and raise new questions to be considered. Studying sodium caseinate systems with added calcium phosphate could help to better understand the role of calcium phosphate in the relationship of pH and α for casein micelles. Comparison of the gels formed by acidification and alkalization as well as further exploration as to the mechanisms behind this alkaline gel formation should also be considered for further study. The continued study of casein micelles and their structure and behavior will allow for more efficient production of techno-

functionally specific ingredients and products allowing the food industry to continue to innovate and improve.

Table of contents
1 Introduction 1
1.1 Overview 1
1.2 Background 1
1.2.1 Overview of Caseins 2
1.2.2 Casein System Properties and Modification 3
1.2.3 Behavior in dense suspensions 5
2 Objectives 8
3 Delimitations 9
4 Methods and Materials 10
4.1 Sodium caseinate sample preparation 10
4.1.1 Materials 10
4.1.2 Methods 10
4.2 UV concentration testing 11
4.2.1 Materials 11
4.2.2 Methods 12
4.3 UV Kinetics Test (Turbidity) 13
4.3.1 Materials 13
4.3.2 Methods 13
4.4 Titration Curve Analysis 13
4.4.1 Materials 13
4.4.2 Methods 14
4.5 Rheology - Sodium Caseinate 15
4.5.1 Materials 15
4.5.2 Methods 15
4.5.3 Modifications for Micellar Casein 17
4.6 Confocal Microscopy 17
4.6.1 Materials 17
4.6.2 Methods 18
5 Results and Discussion 19
5.1 Titration Curves 19
5.2 pH vs Charge Density 22
5.2.1 Impact of concentration of pH 22
5.2.2 Critical ∆α determination for casein micelles 25
5.2.3 Critical ∆α determination for sodium caseinate 27
5.2.4 Temperature effect on pH 28
5.2.5 Conclusions for Section 5.2 30
5.3 Rheology 31
5.3.1 Sodium Caseinate Rheology 31
5.3.2 Micellar Casein Rheology 33
5.3.3 Conclusions for Section 5.3 38
6 Conclusions and future work 39
7 Bibliography 41
Appendix A : Methods and Materials 45
A.1 ∆α Calculator 45
A.2 Confocal Microscopy 46
A.2.1 Sodium Caseinate Erreur ! Signet non défini.
1
1 Introduction
1.1 Overview
FrieslandCampina is the world’s largest dairy cooperative and one of the top dairy companies in the world. With a broad catalog of products, FrieslandCampina is continuously looking to improve upon their process and products. This thesis is a part of an ongoing project concerning dense suspensions of casein-based ingredients for one of their research teams and in conjunction with Professor Taco Nicolai and the Polyméres, Colloïds and Interfaces lab within the Institut des Molécules et des Matériaux du Mans of which he is the director of research. It is in the hopes that by combining the knowledge of the FrieslandCampina team with the expertise of Professor Nicholai and his lab at the Université du Maine, valuable insights will be gathered in order to better understand the rheological behavior of dense casein systems and improve FrieslandCampina’s ability to process and manipulate these systems and casein-based systems in general. This ongoing collaborative project started with the analysis and characterization of sodium caseinate and micellar casein ingredients, for which the methods and results will be discussed here.
1.2 Background
Caseins are the major protein components of bovine milk, making up around 80% of the total protein content. They play an important role in natural milk and well as in a wide variety of dairy products. Casein is naturally a key functional component in the production of a variety of dairy products such as in the formation of the curds in cheese making, or in the formation of gels in dairy products such as in yogurts. It is also used in an isolated form, such as MCI, or as a salt, such as sodium caseinate, as an additional ingredient for an even broader range of products for both techno-functional and nutritional purposes. Due to the dynamic nature of its structure, casein has a wide range of techno-functionalities such as its ability to impact the texture, viscosity and stability of gels, as well as the foaming and emulsifying properties of other food products. It is also one of the most heavily studied food proteins to date. However, despite its wide use and the decades of research having been dedicated to it, our knowledge of its internal

structure and interactions is still incomplete. of the casein micelle’s structure and how its structure and function is impacted by various external factors such as pH, temperature, time or the addition of other ingredients could provide key insights that allow for the improvement of their products. This knowledge could help reduce cost by improving processing, improve the texture or structure of their products by allowing more controlled manipulation of the micelles, or even allow for the creation of new products through the use of modified or tech
1.2.1 Overview of Caseins
Caseins are part of a group of phosphoproteins found in bovine milk, usually found associated together into seemingly spherical micelles with a radius of approximately 100-200nm. to form the micelle allowing the proteins to be suspended in the aqueous milk environment. There are 4 major casein proteins that make up the casein micelles in bovine milk (⍺s1-, (4:1:3.5:1.5). (Dalgleishamount of defined secondary or tertiary structure and are considered natively disordered, which allows them to adapt their structure based on their (Dalgleish, 2011) While the exact structure of the micelle is still unknown, there are elements of the structure that most researchers agree on. simplified drawing of a casein micelle to help visualize its structure.
Figure 1: Simplified depicti
phosphate clusters
The outer layer of the casein micelle structure is covered with determine and ultimately limit the size of the micelle due to stabilizing its surface. compared to the other caseins and contain a glycosylated region of the protein called the caseinomacropeptide or CMP. relatively highly hydrophilic allowing it to extend into the surrounding aqueous environment of milk and stabilize the micelle.
2
eractions is still incomplete. For the industry, further knowleof the casein micelle’s structure and how its structure and function is impacted by various external factors such as pH, temperature, time or the addition of other ingredients could provide key insights that allow for the improvement of their
This knowledge could help reduce cost by improving processing, improve the texture or structure of their products by allowing more controlled manipulation of the micelles, or even allow for the creation of new products through the use of modified or techno-specific caseins/caseinates.
Overview of Caseins
Caseins are part of a group of phosphoproteins found in bovine milk, usually found associated together into seemingly spherical micelles with a radius of
200nm. Thousands of casein proteins are aggregated together to form the micelle allowing the proteins to be suspended in the aqueous milk
There are 4 major casein proteins that make up the casein micelles , ⍺s2-, β- and κ-caseins, found in an approximat
(Dalgleish, 2011) None of the caseins contain any significant amount of defined secondary or tertiary structure and are considered natively disordered, which allows them to adapt their structure based on their environment
While the exact structure of the micelle is still unknown, there are elements of the structure that most researchers agree on. Figure 1 is a simplified drawing of a casein micelle to help visualize its structure.
piction of the casein micelle structure with red dots representing calcium
The outer layer of the casein micelle structure is covered with κ-caseins, which determine and ultimately limit the size of the micelle due to Κ-caseins’ role in
lizing its surface. Κ-caseins contain relatively low levels of phosphorylation compared to the other caseins and contain a glycosylated region on the Cregion of the protein called the caseinomacropeptide or CMP. This region is
hydrophilic allowing it to extend into the surrounding aqueous environment of milk and stabilize the micelle. Κ-caseins also contains, like all the
For the industry, further knowledge of the casein micelle’s structure and how its structure and function is impacted by various external factors such as pH, temperature, time or the addition of other ingredients could provide key insights that allow for the improvement of their
This knowledge could help reduce cost by improving processing, improve the texture or structure of their products by allowing more controlled manipulation of the micelles, or even allow for the creation of new products
Caseins are part of a group of phosphoproteins found in bovine milk, usually found associated together into seemingly spherical micelles with a radius of
eins are aggregated together to form the micelle allowing the proteins to be suspended in the aqueous milk
There are 4 major casein proteins that make up the casein micelles nd in an approximate ratio of
None of the caseins contain any significant amount of defined secondary or tertiary structure and are considered natively
environment. While the exact structure of the micelle is still unknown, there
Figure 1 is a
on of the casein micelle structure with red dots representing calcium
caseins, which caseins’ role in
caseins contain relatively low levels of phosphorylation the C-terminus This region is
hydrophilic allowing it to extend into the surrounding aqueous caseins also contains, like all the

3
other caseins, a region of hydrophobicity as well. This amphiphilic nature as well as the low level of phosphorylation allow Κ-caseins to remain primarily on the surface of the micelle in a stabilizer role. They also serve to prevent the aggregation of casein micelles in milk due to steric hindrance and electrostatic repulsion. (Dalgleish, 2011) Within the micelle, the structure is less well understood, but most agree that the micelle’s internal structure consists of calcium orthophosphate nanoclusters, also called colloidal calcium phosphate (CCP), bound to or incorporated into the highly phosphorylated regions of the ⍺s2 and β- caseins. (Holt et al., 2013) Hydrophobic interactions and hydrogen bonding between caseins are also responsible for the internal stability, with a fraction of water inside the micelle. The amount of each of these different types of interactions and their importance to the stability is thought to be partially dependent on the environment surrounding the micelles. That is to say, the structure of the casein micelle is dynamic, allowing it to adapt to changes in its environment. (Broyard, & Gaucheron, 2015) Understanding and observing micelles in different and changing environments are some of the key ways researchers have determined or theorized what we know about micelles today.
1.2.2 Casein System Properties and Modification
Casein is naturally found primarily in its micellar form in bovine milk. Bovine milk composition varies based on a variety of factors including the climate, diet, season, age, breed or lactation stage, but is generally fairly consistent, with industrially produced milks being standardized and mixed together. Milk is primarily composed of water, around 87%, with the other key components being on average: 4.6% lactose, 3.6% fats, 3.4% proteins and 0.7% minerals. (Boland, 2009) Of the 0.7% minerals, calcium is a key component as discussed earlier due to its role in stabilizing the micelle and is primarily found as calcium phosphate. Casein only makes up approximately 2.5% of the total weight of milk, but around 10% of the volume. This is due to the micelles being highly hydrated, holding around 3.5kg of water per kg of protein. (Holt et al., 2013) Casein micelles are in a dynamic equilibrium when in an aqueous suspension. This equilibrium can be affected by changes in protein concentration, salt contents, pH or temperature and can cause the exchange of caseins, calcium, phosphate, and water between the micelles and the aqueous environment as well as some structural changes.
1.2.2.1 Effect of Sodium Chloride
The presence of sodium chloride (NaCl) within a suspension of casein micelles has been shown to impact its solubility and stability. NaCl reduces the net-negative charge on the micelles reducing the electrostatic repulsion between casein micelles. In has been previously demonstrated by Famelart et al. (1999) that the presence of NaCl causes an increase in viscosity and delays rennet gelation. This is likely due to the increased stability towards heat induced dissociation of the κ-

4
caseins. (Huppertz & Fox, 2006) The addition of NaCl also increases the solubility of casein powders in water, which has been suggested to be due to structural modifications of the micelles caused by the addition of salts (Broyard, C., & Gaucheron, F. 2015) The addition of NaCl has also been shown to decrease the molar mass and hydrodynamic radius of sodium caseinate suspensions when the NaCl concentration is less than 0.1M. Above this, the molar mass and hydrodynamic radius remains constant at least up to 0.8M as shown by HadjSadok et al., (2008).
1.2.2.2 Effect of Temperature
The native temperature of bovine milk is 37°C, but it is often heated to 72°C-140°C for pasteurization/sterilization and cooled to below 3-7°C for storage to prevent microbial growth. During processing, milk is frequently heated and cooled, sometimes multiple times and often rapidly via heat exchangers. While this cooling and heating can often lead to changes in the milk system as a whole, casein micelles are relatively heat stable due to the lack of tertiary structure of the caseins. With temperatures < 90°C, the main effect of temperature is primarily on the mineral and β-caseins equilibria and is mostly reversible. In previous work by Liu, D. Z. et al., (2013) which focused on the effects of temperature in the range between 10°C-40°C, it has been shown that calcium phosphate and β-caseins are exchanged between the micelles and the milk serum as a function of temperature. Increased temperature leads to the increased amount of calcium phosphate within the micelles, likely due to the decreased solubility of calcium phosphate at higher temperatures. Increased temperature impacts protein interactions, leading to the decreases the amount of β-caseins in the serum phase. (Liu, D. Z. et al., 2013). There is also a decrease in the hydration and apparent voluminosity of the micelles as temperature is increased. These exchanges are reversible with changes being observed immediately during heating, but more slowly during cooling. In the case of β-caseins, while the majority of the β-caseins are recovered by the micelles, they can no longer be considered to be native as the β-caseins are not recovered to the exact same location. (Holt, C., & Fox, P. F.,1995)
1.2.2.3 Effect of pH
The impact of pH has also been highly explored, although primarily focused on acidification due to its role in dairy products such as cheese and yogurt. At the native pH of milk, approximately 6.7, caseins are negatively charged. As the pH is decreased, caseins become less and less negatively charged until the isoionic point, generally considered to be around pH 4.8, at which they are overall neutral. (Dalgleish, 2011) This leads to the aggregation of the micelles due to the lack of the electrostatic repulsion between the κ-caseins, which shrinks to the point of eventual collapse. Additionally, there is a progressive dissociation of calcium phosphate from the aqueous phase and as a consequence, a release of the calcium phosphate from inside the micelles with nearly all the inorganic phosphate being solubilized at around pH 5.2 and all the calcium at around pH 3.5. (Broyard, C., &

5
Gaucheron, F. 2015) Very little work on caseins in alkaline system has been done due to alkalinization being an uncommon practice in the dairy industry. In work by Ahmad et al. (2009) concerning milk, it was observed that under alkaline conditions there are changes in mineral equilibria and protein ionization. Alkalinization causes the deprotonation of HPO4
2- to PO43-, which is a much
stronger chelating agent for calcium. This along with the increase of the negative charge of the casein proteins led to the dissociation of the micelles. This also led to an increase in viscosity of the system, but as the study was on milk, there are a variety of factors that could have had an impact. (Ahmad et al., 2009) As far as we know, there has been no work done specifically on the functional properties of caseinates or casein micelles in alkaline system.
1.2.2.4 Charge density (α) vs. pH
As far as we know, no previous research has been done specifically concerning the impact of concentration or temperature on the pH, but much is known about these interrelations based on other studies. It was observed that pH does not provide an adequate representation of a dynamic system, such as casein suspensions, when other parameters such as temperature or concentration are also varied. (Kharlamova et al., 2016) For these systems, it is more relevant to look at the charge density (α) expressed in charges per protein. This ratio does not change when other parameters such as concentration or temperature change and remains constant in a system unless an acid or base is added to the system. α is considered to be equal to zero at the isoionic point, however it can also be expressed relatively as ∆α, with ∆α=0 being a chosen reference point for the system. The distinction between pH and α is important because when a system is varied in concentration or temperature as well as pH, the pH can be affected by the other variable, while the value of α cannot. Despite the close relation, the changes in the structure or behavior of a system are often not directly linked to the pH of the system, but to the changes in alpha. This distinction is important because when the changes in pH due to the effects of other variables in the system are corrected for, the charge density is changed which could result in misleading results. This relationship and its importance have been previously discussed by Kharlamova et al. (2016).
1.2.3 Behavior in dense suspensions
While an abundance of work has been done concerning the behavior of both sodium caseinate and casein micelles, very few studies have focused on dense suspensions. FrieslqndCampina produces a wide variety of products, including some consumer products that can be considered dense suspensions as well as some ingredients that can be used in dense suspension products, making this an area of interest for the company. In addition, most authors have chosen to work at a set pH or set concentration, but as far as we have seen have not varied both.
6
1.2.3.1 Sodium Caseinate
Work done by Pitowksi et al. (2008) concerning the rheology of sodium caseinate demonstrated a strong increase of viscosity due to jamming caused by the close packing at concentrations above 100g/L as well as showed that these close-packed caseinates were viscoelastic, behaving like liquids at low frequency and solids at high frequency. Increases in temperature also were shown to cause a decrease in viscosity due to a decrease of the effective volume fraction. Work by Thomar et al. (2014), showed an effect on the viscosity due to the addition of NaCl or potassium chloride (KCl), with the more pronounced effects being at salt concentrations higher than 0.2M.
1.2.3.2 Casein Micelles
The study of the rheological behavior of casein micelles over a wide concentration range serves as a method to better understand the structure of casein micelles by comparing its behavior to that of known particles. Boucheaux et al. (2009) and L. Dahbi et al. (2009) both suggest in their work concerning the impacts of concentration on casein micelles, that in low concentration solutions (~130g/L), casein micelles appear to behave like solid spheres, while in more concentrated system they behave more closely to microgels. This behavior was hypothesized to be linked to deformation and expulsion of water due to osmotic stress on the system at these higher concentrations. (Boucheaux et al., 2009) Further support for these conclusions can be found in work done by Olivares et al. (2013) who, using a viscosity model in which casein micelles were considered as microgels, was able to predict the rheological behavior as found in previous works concerning dense suspensions. It was concluded that casein micelles at high concentration act as soft sphere that deform in the direction of shear stress. (Olivares et al., 2013) These works looks to help explain the behavior of casein micelles and in turn gain more insight into the internal structure of the casein micelles. In all the cases discussed above however, the pH and temperature of the system are kept constant.

7

8
2 Objectives
In order to enhance the knowledge concerning the behavioral properties of casein-based ingredients and enable FrieslandCampina to better produce, process and control these ingredients, the following goals were set:
• The primary objective of this thesis is to characterize the rheological properties of dense suspensions of sodium caseinate and micellar casein with respect to changes in concentration, pH and temperature in order to better control/manipulate them in an industrial setting.
• In order to complete this primary objective, it is also necessary to determine the effects of temperature and concentration on the pH and the relationship between pH and charge density (α).
9
3 Delimitations
This thesis is part of a joint ongoing project between FrieslandCampina and the PCI lab at Université du Maine which will last until the end of July 2016 aimed at increasing the knowledge concerning the behavior of dense suspensions of casein using 3 different casein based ingredients. Due to confidentiality concerning one of the three ingredients, the results and discussion presented here will be limited to the first two ingredients analyzed, sodium caseinate and micellar casein isolate (MCI). Both samples were produced and provided by FrieslandCampina. This thesis will look primarily at the rheological behavior of dense suspensions, with concentrations between 100g/L and 200g/L, as impacted by changes in pH between 7.0 and 5.3 and temperature at 40°C, 20°C and 5°C. In addition, the correlation of pH and charge will also be discussed.

10
4 Methods and Materials
Experiments were performed on both sodium caseinate and micellar casein with many of the protocols overlapping. For experimental protocols with no or very little modification for the use for casein micelles versus sodium caseinate, experimental methods and materials will be explained in detail first concerning sodium caseinate then any changes made for the testing on micellar casein will be noted in a small section entitled ”Modifications for casein micelles” afterwards.
4.1 Sodium caseinate sample preparation
4.1.1 Materials
Sodium caseinate was provided by FrieslandCampina, Amersfoort, The Netherlands. The batch for testing was measured to contain 91.6% protein as analyzed by FrieslandCampina. All water used was Type 1 ultra-pure water from a MilliQ system. This water was used in the preparation of a 200ppm sodium azide solution which was used in preparation of suspension intended for long term storage and used. The sodium chloride (NaCl) powder used was purchased Sigma-Aldrich and is ACS reagent grade.
4.1.2 Methods
For preparation of sodium caseinate suspensions, the amount of sodium caseinate powder was calculated based on the given protein content of the powder. The powder is 91.8% protein as measured by the company. The formula C1M1=C2M2
was used to calculate the amount of powder needed to make the desired concentration suspension with C=concentration (%) and M=mass (g). This meant
91.8%*X=(desired concentration (%))*mass desired (g)
Stock solutions of 220g/L were generally prepared to allow for pH adjustments to be made for concentrations between 200-100g/L. A total of 100g suspensions

11
were generally prepared meaning 24.017g of sodium caseinate powder and 75.892g of a 0.1M NaCl 200ppm sodium azide solution. This solution was prepared by adding 0.584g of NaCl powder to 100ml of a stock 200ppm sodium azide solution and swirling until the salt had completely dissolved. The sodium caseinate powder was weighed carefully measured using a Precisa 210AM Floating Point scale by first zeroing the plastic test tube to be used for the stock suspension then adding the powder to the desired amount. The solvent solution was prepared in a separate container with the NaCl being measured using an aluminum weigh boat and the sodium azide solution being measured in a plastic test tube. All measured values were recorded to be able to calculate the precise concentration based on the amounts used and make any adjustments needed. The liquid solution was heated to approximately 60°C to assist in the solubilization and mixing process then added into the plastic test tube with the sodium caseinate powder and was manually stirred with a metal spatula. It was then sealed with a lid and placed into a water bath at 60°C. It was manually mixed every 5-10 minutes until it appears visually homogenous. It was then moved to a water bath at 50°C for storage overnight. The homogeneity of the preparation can be observed by visually using confocal microscopy (see section 4.6) or by doing multiple UV concentration tests as described in section 4.2.
4.1.2.1 Modifications for Casein Micelles
Micellar Casein in the form of Refit MCI80 was provided by FrieslandCampina, Amersfoort, the Netherlands. The batch for testing was measured to contain 78.6% protein as analyzed by FrieslandCampina. The preparation method was the same as described in section 4.1.2 with the following adjustments:
• Pure water was used instead of the stock sodium azide solution. Due to known time effects on the properties of micellar casein suspensions in water, all samples were prepared the day before experimentation took place removing the need for the use of sodium azide.
• In the formula C1M1=C2M2 , the percentage of protein in the powder was 78.6%.
• Casein micelle suspensions were more easily solubilized and mixed and were only placed in a 50°C water baths during the mixing.
4.2 UV concentration testing
4.2.1 Materials
• Cary 50 UV-Vis Spectrophotometer • Hellma Analytics Quartz cuvette with a 10mm light path
12
• Sigma Aldrich ASC grade 0.1M Sodium Hydroxide (NaOH) • Sigma Aldrich ReagantPlus grade sodium phosphate monobasic
(NaH2PO4)
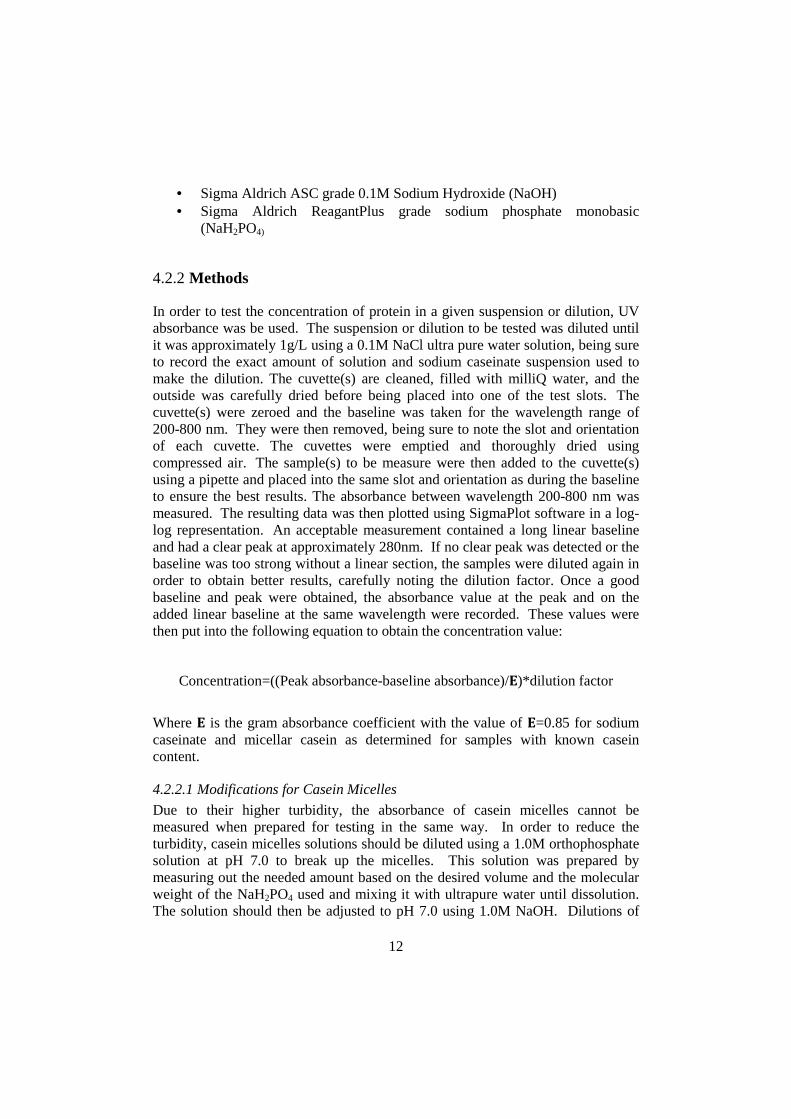
4.2.2 Methods
In order to test the concentration of protein in a given suspension or dilution, UV absorbance was be used. The suspension or dilution to be tested was diluted until it was approximately 1g/L using a 0.1M NaCl ultra pure water solution, being sure to record the exact amount of solution and sodium caseinate suspension used to make the dilution. The cuvette(s) are cleaned, filled with milliQ water, and the outside was carefully dried before being placed into one of the test slots. The cuvette(s) were zeroed and the baseline was taken for the wavelength range of 200-800 nm. They were then removed, being sure to note the slot and orientation of each cuvette. The cuvettes were emptied and thoroughly dried using compressed air. The sample(s) to be measure were then added to the cuvette(s) using a pipette and placed into the same slot and orientation as during the baseline to ensure the best results. The absorbance between wavelength 200-800 nm was measured. The resulting data was then plotted using SigmaPlot software in a log-log representation. An acceptable measurement contained a long linear baseline and had a clear peak at approximately 280nm. If no clear peak was detected or the baseline was too strong without a linear section, the samples were diluted again in order to obtain better results, carefully noting the dilution factor. Once a good baseline and peak were obtained, the absorbance value at the peak and on the added linear baseline at the same wavelength were recorded. These values were then put into the following equation to obtain the concentration value:
Concentration=((Peak absorbance-baseline absorbance)/�)*dilution factor
Where � is the gram absorbance coefficient with the value of �=0.85 for sodium caseinate and micellar casein as determined for samples with known casein content.
4.2.2.1 Modifications for Casein Micelles
Due to their higher turbidity, the absorbance of casein micelles cannot be measured when prepared for testing in the same way. In order to reduce the turbidity, casein micelles solutions should be diluted using a 1.0M orthophosphate solution at pH 7.0 to break up the micelles. This solution was prepared by measuring out the needed amount based on the desired volume and the molecular weight of the NaH2PO4 used and mixing it with ultrapure water until dissolution. The solution should then be adjusted to pH 7.0 using 1.0M NaOH. Dilutions of
13
casein micelles prepared in this manner will have a greatly reduced turbidity due to the breakup of the micelles’, allowing for the UV absorption measure and proceeding concentration calculations to be performed using the same protocol as with sodium caseinate.
4.3 UV Kinetics Test (Turbidity)
4.3.1 Materials
• Cary 50 UV-Vis Spectrophotometer • Hellma Analytics Quartz cuvette with a 1.0mm light path
4.3.2 Methods
In order to test the effects of charge density on the stability of casein micelles, a UV kinetics test was run to observe the turbidity over time. Each suspension to be tested was first prepared at 100g/L. Using a quartz cuvette with a 1.0mm light path, the UV spectrophotometer was zeroed using ultra pure water, but no baseline was taken. Each of the cuvettes was cleaned and dried, being sure to note the slot and orientation of each cuvette. Then the suspensions were diluted down to 5g/L and each of the cuvettes was filled being sure to dilute each sample only right before testing in order to have the starting measuring as close to time zero as possible. Wavelengths of 800,750,700,650, and 600 were selected and measurements are taken every 1 minute for 120mins. This allows for the observation of the casein stability over time.
4.4 Titration Curve Analysis
4.4.1 Materials
• Titralab TIM856 titrator with the Titramaster85 software • Sigma Aldrich ASC grade 0.1M NaOH • Sigma Aldrich ASC grade 0.1M hydrochloric acid (HCl)
14
4.4.2 Methods
A 50ml sodium caseinate suspension of 40g/L was prepared using the same preparation method as described in Section 4.1 with the following modifications:
• No NaCl was used • Only pure water, not the sodium azide solution so as to avoid any
influence of the sodium azide on the measurement
A 100ml 1.0M NaCl solution was prepared using NaCl powder and milliQ water. First, a 100ml volumetric flask was partially filled with milliQ water. Then based on the molecular weight of the NaCl powder, 5.84g was weighed out onto a weigh boat and added to a volumetric flask. The solution was swirled until the powder dissolved. The volumetric flask was then completely filled until the meniscus rested on the 100ml line.
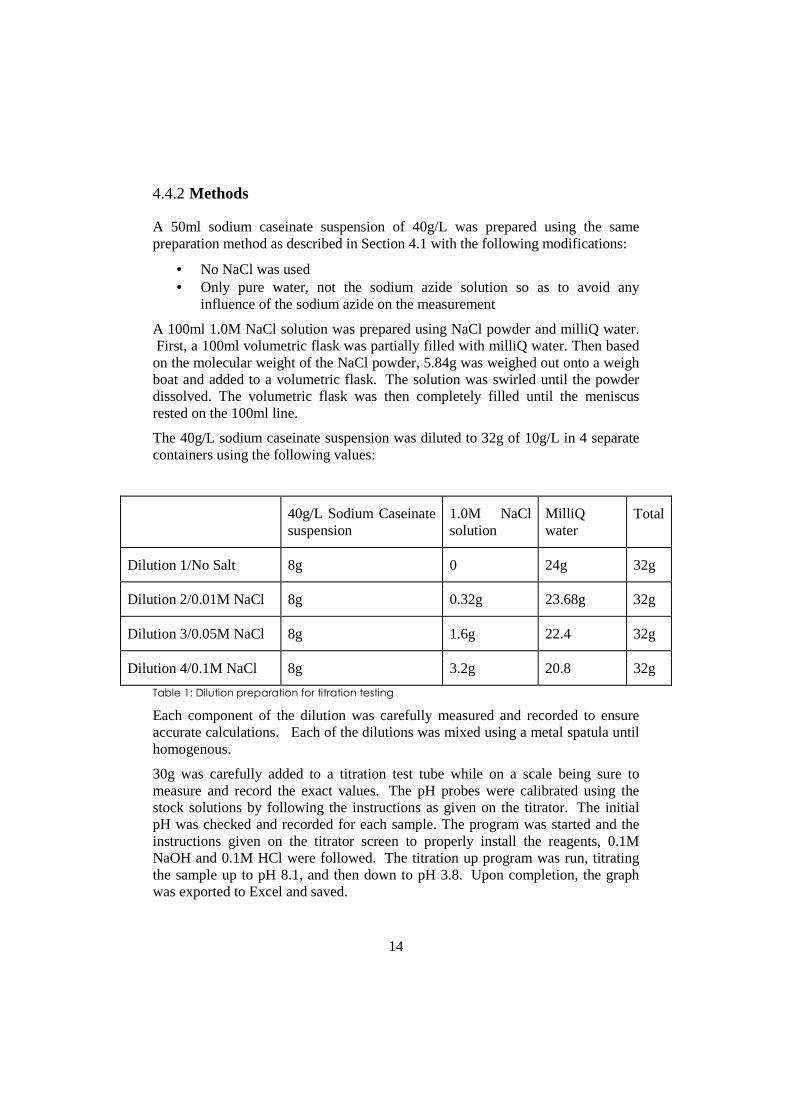
The 40g/L sodium caseinate suspension was diluted to 32g of 10g/L in 4 separate containers using the following values:
40g/L Sodium Caseinate suspension
1.0M NaCl solution
MilliQ water
Total
Dilution 1/No Salt 8g 0 24g 32g
Dilution 2/0.01M NaCl 8g 0.32g 23.68g 32g
Dilution 3/0.05M NaCl 8g 1.6g 22.4 32g
Dilution 4/0.1M NaCl 8g 3.2g 20.8 32g
Table 1: Dilution preparation for titration testing
Each component of the dilution was carefully measured and recorded to ensure accurate calculations. Each of the dilutions was mixed using a metal spatula until homogenous.
30g was carefully added to a titration test tube while on a scale being sure to measure and record the exact values. The pH probes were calibrated using the stock solutions by following the instructions as given on the titrator. The initial pH was checked and recorded for each sample. The program was started and the instructions given on the titrator screen to properly install the reagents, 0.1M NaOH and 0.1M HCl were followed. The titration up program was run, titrating the sample up to pH 8.1, and then down to pH 3.8. Upon completion, the graph was exported to Excel and saved.

15
The volume (ml) of HCl was used to calculate the charge density value for each pH value. This was done by calculating the number of moles of HCl and dividing it by the number of moles of sodium caseinate in the test vessel:
α = moles of HCl added at given pH /moles of sodium caseinate in test vessel
The moles of sodium caseinate were calculated using the equation:
Moles of Sodium Caseinate(mol)=(Concentration Sodium Caseinate (g/L) * mass of suspension added to test vessel (g))/23000g/mol
23000g/mol is the value used in the lab for sodium caseinate for consistency. The alpha=0 point was then shifted to the starting pH of the suspension in the test vessel by subtracting the α value at the starting pH from all the alpha values. The resulting shifted α value was then plotted vs. pH.
4.5 Rheology - Sodium Caseinate
All rheological measurements are single measurements; however, the methods used for casein micelles and sodium caseinate were first determined to be repeatable by repeating the method in triplicates for one sample. Samples were also tested using other methods to ensure they did not evolve over time to prevent this having an impact on the results.
4.5.1 Materials
• Anton Paar MCR 301 rheometer with Rheoplus software • CP25-2/TG cone plate geometry with the P-PTD200/TG measuring
system and a water bath for temperature control • 0.1M NaCl solution
4.5.2 Methods
A stock suspension of 220g/L as described in Section 4.1 was prepared and the starting pH was measured. The suspensions were prepared at 220g/L in order to be able to make ∆α adjusted suspensions at 200g/L. For measurements at adjusted ∆α values, the needed amount of HCl or NaOH was calculated based on the number of moles in the prepared dilutions. In order to do this, the suspension to

16
be adjusted was carefully weighed and the number of moles of sodium caseinate was calculated using the following equation:
Moles of SC=(Mass of SC suspension used for dilution (g) * starting suspension
concentration (%)/(1000*23000)
Using the calculated number of moles in the prepared dilution, the number of grams of HCl or NaOH was calculated using the following equation:
Mass of 1.0M HCl (g) = Moles of SC * α * 1000 Mass of 0.1M HCl (g) = Moles of SC * α * 10000
The use of a 1.0M or a 0.1M solution was determined based on the allowed amount of solvent to make the dilutions. If possible, the use of a 0.1M solution was preferred to prevent the aggregation of sodium caseinate due to the rapid, localized changes in charge. The calculated and measured amount of NaOH or HCl solution was then mixed with the appropriate amount of 0.1M NaCl solution in order to make the suspension 200g/L. This mixture was then slowly added to the sodium caseinate suspension while stirring until homogeneous. All of these calculations were organized into an easy to use excel formula as seen in appendix A1. After adjusting the ∆α, the pH was measured and recorded.
Using the prepared stock suspension, a series of dilutions was made in order to have suspensions at 200g/L, 180g/L, 160 g/L, 140 g/L, 120 g/L and 100g/L, being sure to record all values. Despite only needing ~0.6g for testing, suspensions of 15g were usually prepared in order to allow for pH testing and in case measurements needed to be performed again. For every dilution, the suspensions were mixed using a spatula and kept in a water bath at 50°C, stirring until it appears homogeneous. Prior to any day of measurements or after any changes were made to the system, the rheometer had its motor calibrated for the selected geometry and the system was zero gapped to ensure accurate results. Approximately 0.58g of each sample was placed in the center of the platform and the cone lower to the measuring position. The software displayed a message when the trimming point was reached, at which point the edges around the sample were carefully trimmed if excess remains. After trimming, mineral oil was added in order to prevent drying or evaporating. A shear sweep between 1000 1/s and 0.001 1/s was performed at 5°C, 20°C, and 40°C in order to determine the zero shear viscosity for each dilution at each temperature, concentration, and pH combination. 19 total points were taken for each temperature with ≈1min for each point. The shear sweep was plotted on a log-log graph with viscosity on the y-axis and shear rate on the x-axis in order to visualize the plateau at which point the 0
17
is determined. These 0 values were recorded and then plotted on a graph of 0 vs. concentration to better visualize the impacts on the system’s viscosity.
4.5.3 Modifications for Micellar Casein
Rheology of casein micelles needed to be performed using the CC27T200 couette geometry and C-PTD200 measuring system due to issues concerning the formation of a layer when using the cone-plate geometry. This phenomenon is thought to be due to colloidal particles aligning with shear force at lower shear rates, creating a layer and preventing accurate measurements. When using the couette geometry, a minimum of approximately 23ml of sample is needed to fill the couette. In addition, the presence of bubbles in a sample can prevent accurate measurement as well so the samples needed to have the bubble removed by placing them in a vacuum chamber with a needle is the cap of the plastic tube. These changes meant a larger quantity of each dilution was prepared; however, the same method of calculation applied. The same Excel calculator was used for these calculations as seen in appendix A1. For micellar casein, viscosity measurements at 200g/L were not performed for ∆α=15 or ∆α=20. This is the results of the calculated grams of 1.0M HCl needed to make the adjustments being higher than the total amount of liquid that was needed to dilute the sample from 220g/L to 200g/L. In order to prepare ∆α=15 or 20 at 200g/L, the starting concentration would need to be greater than 240g/L which is not feasible using our current preparation method.
4.6 Confocal Microscopy
4.6.1 Materials
• Rhodamine b (500ppm stock) • Labtek Chambered #1 borosilicate Coverglass system • Leica DMIRE2 microscopy system with HCX PL APO CS 63x objective
• Leica Cofocal Software • ImageJ software

18
4.6.2 Methods
Confocal microscopy is an optical imaging technique which increases the optical resolution and contrast of a microscopy image by eliminating out-of-focus light by adding a spatial pinhole placed at the confocal plane of the lens. Using this technique, one can visualize the homogeneity of a suspension as well as gain some insight as to the structure of any networks or sources of heterogeneity within the suspension. For the analysis, rhodamine b dye was used to tag proteins. The stock preparation used by the lab of rhodamine b was 500ppm. For each sample to be observed, the amount of rhodamine b to be added to the sample was calculated so that there is approximately 5ppm in the sample. The sample were mixed and let to sit in order for the rhodamine b to diffuse through the sample completely. After rhodamine b had diffused through the samples, the samples were placed into the cells of the borosilicate coverglass system and observed using the HCX PL APO CS x63 objective. The confocal software was used to observe the samples and take the images. Images were produced using 6 scans to reduce the noise. After the images were taken and saved, they were edited using the imagej software. Images were converted to black and white and the relative intensity was normalized for better comparison. This method was used primarily to confirm the homogeneity of the prepared suspension as seen in images in Appendix A2.
19
5 Results and Discussion
Results and discussion have been divided into two main sections, pH vs. charge density (α) and Rheology. Before these two sections are discussed the results of the titrations curves used for experimental preparation and as further evidence for other results will be presented and discussed.
5.1 Titration Curves
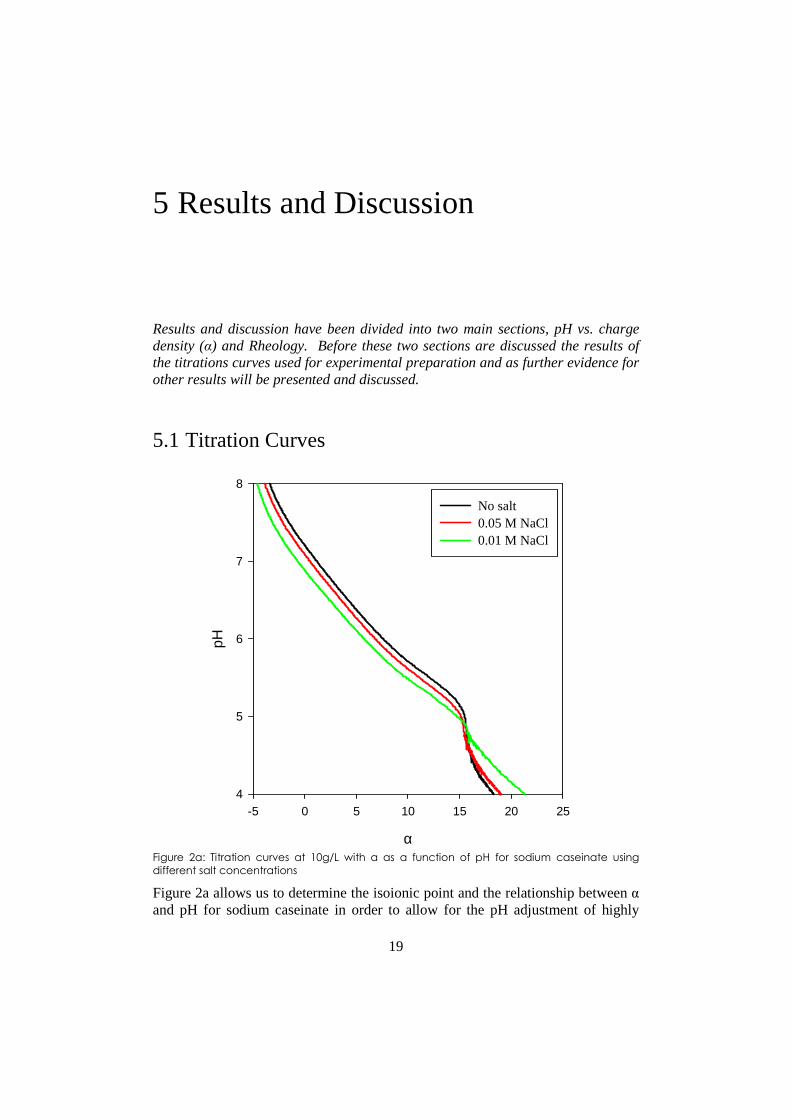
Figure 2a: Titration curves at 10g/L with α as a function of pH for sodium caseinate using
different salt concentrations
Figure 2a allows us to determine the isoionic point and the relationship between α and pH for sodium caseinate in order to allow for the pH adjustment of highly
α
-5 0 5 10 15 20 25
pH
4
5
6
7
8
No salt0.05 M NaCl0.01 M NaCl

20
viscous samples. The addition of salt causes the reduction of electrostatic repulsion due to screening effects, which in turn increases the pH. At the isoionic point, the net charge of the proteins is zero so that there is no effect of salt. In the case of sodium caseinate, the isoionic point at 10g/L was determined to be around pH 4.8, a value consistent with values proposed in the literature (Dalgleish, 2011).
Figure 2b: Titration curves at 10g/L with alpha as a function of pH for micellar casein using
different salt concentrations
Figure 2b shows there is no influence of salt for micellar casein in the range between 0-0.1M; therefore, no isoionic point can be determined using this method. This lack of influence by salt in the micellar casein system is likely due to the structure of the casein micelles. In casein micelles, the calcium phosphate clusters are bound to the caseins due to electrostatic attraction. This region would be a strong location for the screening effects of salt; however, due to the micellar structure, very little salt is able to interact with this region leading to any screening effects. This is due to the calcium phosphate clusters being located within the micelles, which are mostly covered by κ-caseins. Although the isoionic point cannot be determined using this method, it is generally considered to be at the same point, pH 4.8, as with sodium caseinate as the same proteins are in both systems.
α
0 10 20 30
pH
4
5
6
7
8
No Salt0.01M NaCl0.05M NaCl0.1M NaCl

21
Figure 3: Titration curve comparison between sodium caseinate (SC) and micellar casein (MC)
at 0.1M NaCl.
From Figure 3, it can be determined that the number of charges needed to shift the pH from the native pH at around 6.7 to the point where the precipitation of calcium phosphate begins, pH 5.3, is increased by approximately 10 for casein micelles versus sodium caseinate. This shift can be explained by the presence of calcium phosphate in the micellar casein suspension, which is present in a ratio of around 9 phosphates per casein according to Famelart et al. (1996), since these phosphates are also being titrated.
5.1.1 Conclusions for Section 5.1
• The isoionic point for sodium caseinate is at around pH 4.8 as proposed in the literature (Dalgleish, 2011).
• There is no influence of salt within the range of 0-0.1M on micellar casein • The difference in the number of charges needed to shift to a particular pH
is increased for casein micelle suspensions due to the presence of phosphate, which is titrated along with the casein proteins.
α
0 10 20 30
pH
4
5
6
7
8
0.1M NaCl MC0.1M NaCl SC
22
5.2 pH vs. Charge Density
During the preparation and testing of the casein micelle samples, it was observed that there was a broad range of pH values for a series of dilutions based on the same, controlled starting pH suspension. Some abnormal rheological behavior was also observed for the system at the starting pH 7.0, the results of which will be discussed later. These observations lead to more in depth analysis of the effects of concentration and temperature on the pH of the suspension as well as the comparison between pH and α. When discussing α, α=0 is generally considered to be the isoionic point determined via titration at various salt concentrations; however, for casein micelles no influence of salt was found and therefore could not determine the isoionic point. As previously discussed, the isoionic point for casein micelles is generally considered to be the same as with sodium caseinates at around 4.8. (Dalgleish, 2011) However, after discussion with our partners at FrieslandCampina, it was decided that all of the results would be expressed in terms of ∆α, with the ∆α=0 reference point being the unaltered charge density of our MCI powder.
5.2.1 Impact of concentration of pH
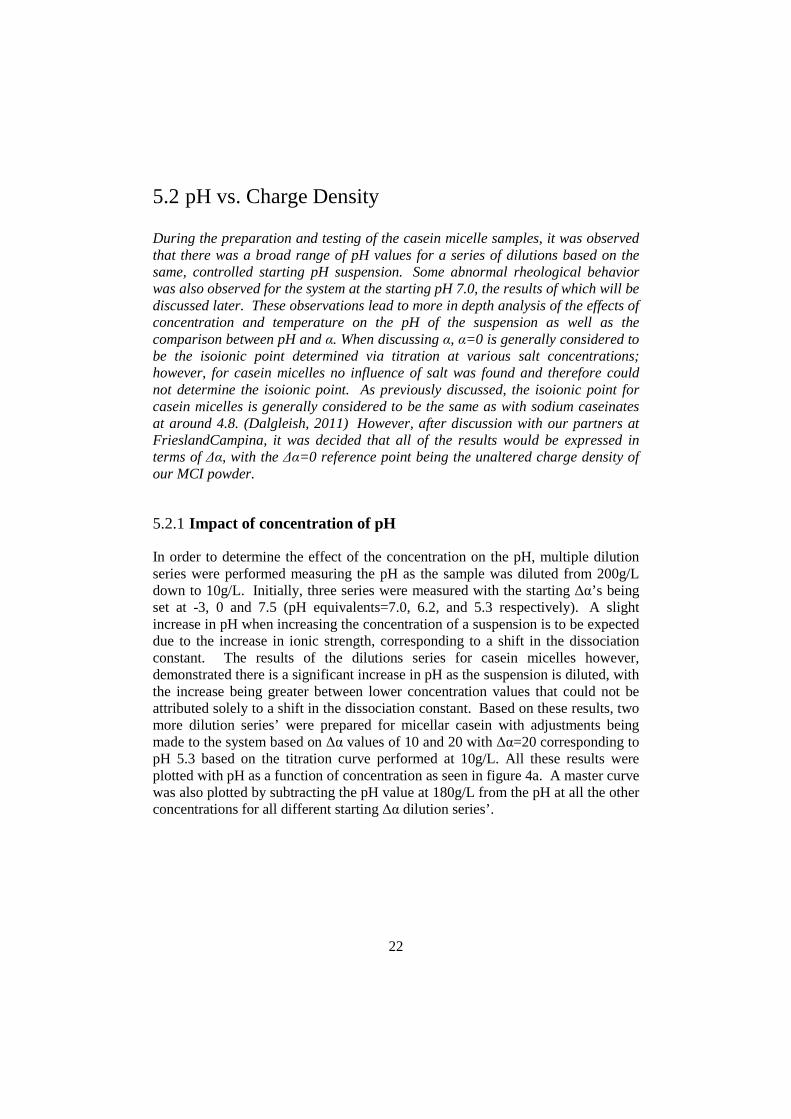
In order to determine the effect of the concentration on the pH, multiple dilution series were performed measuring the pH as the sample was diluted from 200g/L down to 10g/L. Initially, three series were measured with the starting ∆α’s being set at -3, 0 and 7.5 (pH equivalents=7.0, 6.2, and 5.3 respectively). A slight increase in pH when increasing the concentration of a suspension is to be expected due to the increase in ionic strength, corresponding to a shift in the dissociation constant. The results of the dilutions series for casein micelles however, demonstrated there is a significant increase in pH as the suspension is diluted, with the increase being greater between lower concentration values that could not be attributed solely to a shift in the dissociation constant. Based on these results, two more dilution series’ were prepared for micellar casein with adjustments being made to the system based on ∆α values of 10 and 20 with ∆α=20 corresponding to pH 5.3 based on the titration curve performed at 10g/L. All these results were plotted with pH as a function of concentration as seen in figure 4a. A master curve was also plotted by subtracting the pH value at 180g/L from the pH at all the other concentrations for all different starting ∆α dilution series’.
23
Figure 4a: pH as a function of concentration for different starting ∆α values for casein micelles
Figure 4b: Master Curve of ∆pH vs. concentration for different starting ∆α values for casein
micelles (MC) and sodium caseinate (SC)
These graphs allowed any effects of the starting α on the change in pH due to dilution to be better visualize. A series of dilutions was also made for sodium
Concentration (g/L)
10 100
pH
4.0
4.5
5.0
5.5
6.0
6.5
7.0
7.5
∆α=0
∆α=7.5
∆α=-3
∆α=0
∆α=10
∆α=20
Concentration (g/l)
10 100
∆ pH
0.0
0.2
0.4
0.6
0.8
MC ∆α=0MC ∆α=7.5MC ∆α=−3MC ∆α=0MC ∆α=10MC ∆α=20SC ∆α=0
24
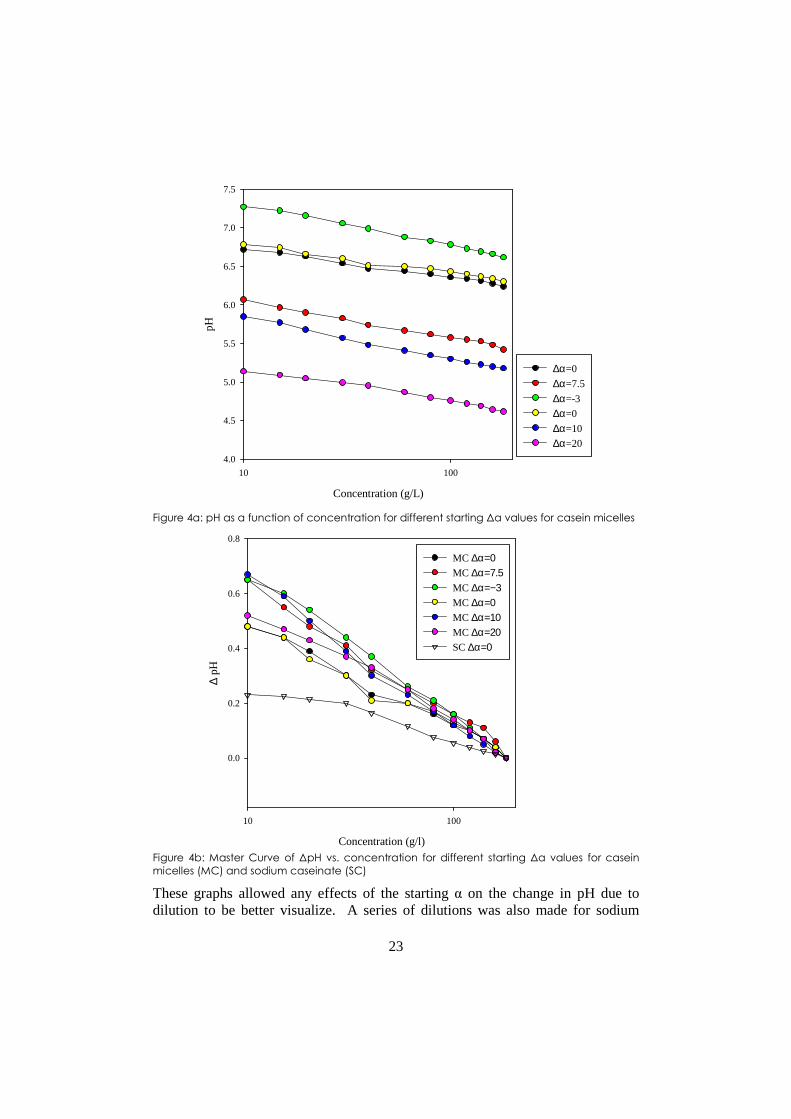
caseinate at ∆α=0 to compare the effects, however little impact was found in comparison to micellar casein as seen Figure 4b. This larger shift in pH due to concentration is likely due to the presence of calcium phosphate. It can be hypothesized that when the micelles dissociate they release calcium phosphate clusters which also increase the ionic strength, shifting the pH more significantly than sodium caseinate. Based on this graph, it can also be observed that the change in pH by dilution is affected by starting pH value with the effects being more significant at lower concentrations. It can be hypothesized that this was due to differences in the instability of the micelles at low concentrations and ran a UV turbidity test as described in section 4.3 with suspensions at ∆α=-3, 0, 10, and 20 at 5g/L. The results at 750nm were plotted with ∆absorbance as a function of time (s) as seen in Figure 5.
Figure 5: Absorbance at 750nm over time of casein micelles suspensions at differing ∆α at
C=5g/L
While the preparation was done quickly to have the test start as close to time zero as possible, some initial decrease in stability likely occurred for the preparation at ∆α=20, where the first measured point is at time 4.2 mins. Based on these results, it is clear that there is an impact on the stability of casein micelles at low concentrations due to ∆α. It is known that changes in the ∆α affect the net charge of the micelles and therefore any electrostatic interactions between or within them. The results show a much more rapid decrease in micellar stability as the ∆α
Time (mins)
0 20 40 60 80 100 120 140
Abs
orba
nce
0.02
0.04
0.06
0.08
0.10
0.12
0.14
∆α=-3
∆α=0
∆α=20
∆α=10
moves closer to the isoionic point as expected. cannot provide an explanation fowas a greater ∆pH in the system starting at artifact of experimental error and would be better explained if multiple dilutions for each starting ∆α were performed to deteaccuracy of the results.
5.2.2 Critical ∆α determination
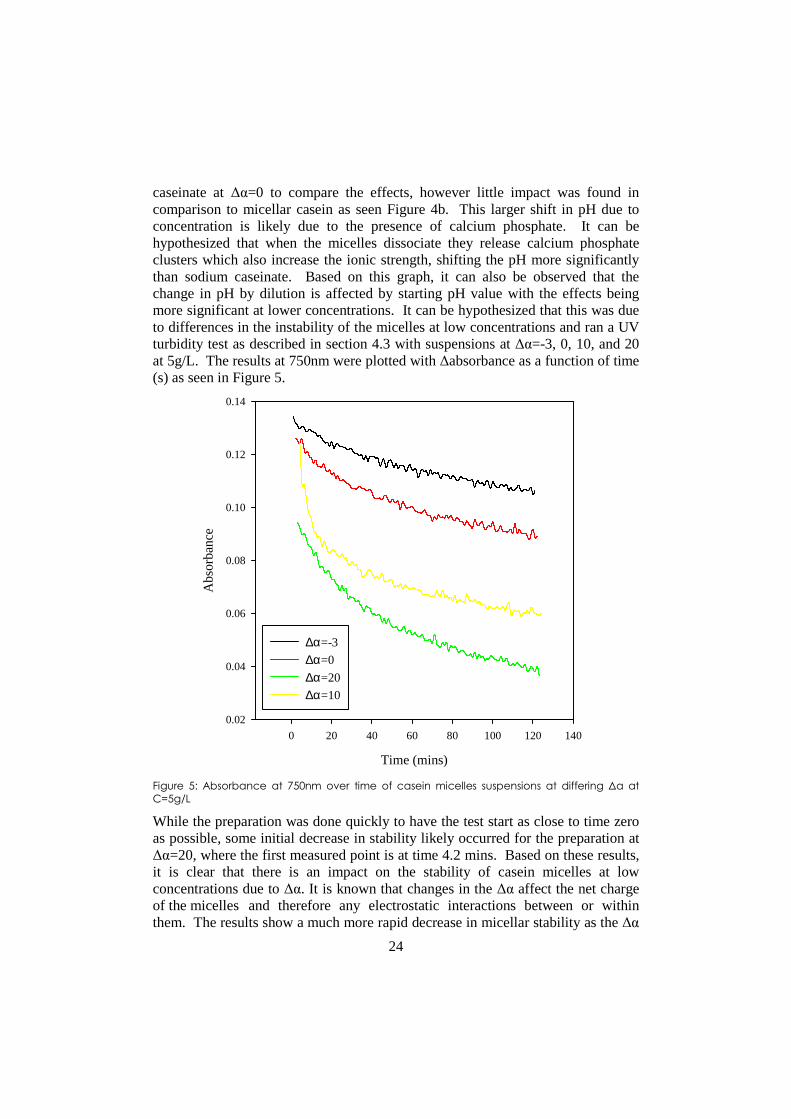
During acidification, mprecipitates towards the isoionic pointsystem is acidified. Based on the results of the previous section, the pH at which the isoionic point occurs shifts done to determine the ∆αof suspensions were prepared at 100dilution at 10g/L with ∆αmeasured and the samples were kept overnight to determine the stability. 24hrs, the series’ were at 10g/L some of the supernatant was extracted for concentration testing in order to determine the loss.
Figure 6: Casein micelle suspensions prepared at 100 and 10g/l (top to bottom) with
ranging from 28-20 (left to right) after 24hrs to determine the point of instability as seen in the
far right samples
Due to the higher concentration, it was not possible to extrasamples at 100g/L. Determination the supernatant
25
moves closer to the isoionic point as expected. However, these results alone cannot provide an explanation for the differences in ∆pH upon dilution
pH in the system starting at ∆α=10 then ∆α=20. This could be an artifact of experimental error and would be better explained if multiple dilutions
were performed to determine the error bar and improve the .
determination for casein micelles
During acidification, micellar casein becomes unstable and either forms a gel or precipitates towards the isoionic point, based on the method and rate at wh
Based on the results of the previous section, the pH at which the isoionic point occurs shifts depends on the concentration. Further testing wasdone to determine the ∆α value where the micelles started to aggregate.
ensions were prepared at 100g/L with a portion being used to make a with ∆α ranging from 20-28. The pH of these suspensions was
measured and the samples were kept overnight to determine the stability. photographed as seen below in figure 6 and for the samples
some of the supernatant was extracted for concentration testing in order
Casein micelle suspensions prepared at 100 and 10g/l (top to bottom) with
(left to right) after 24hrs to determine the point of instability as seen in the
Due to the higher concentration, it was not possible to extract a supernatant for Determination the supernatant concentration was done via UV
owever, these results alone pH upon dilution as there
This could be an artifact of experimental error and would be better explained if multiple dilutions
rmine the error bar and improve the
ecomes unstable and either forms a gel or te at which the
Based on the results of the previous section, the pH at which Further testing was
. A series with a portion being used to make a
The pH of these suspensions was measured and the samples were kept overnight to determine the stability. After
and for the samples some of the supernatant was extracted for concentration testing in order
Casein micelle suspensions prepared at 100 and 10g/l (top to bottom) with ∆α
(left to right) after 24hrs to determine the point of instability as seen in the
ct a supernatant for was done via UV
26
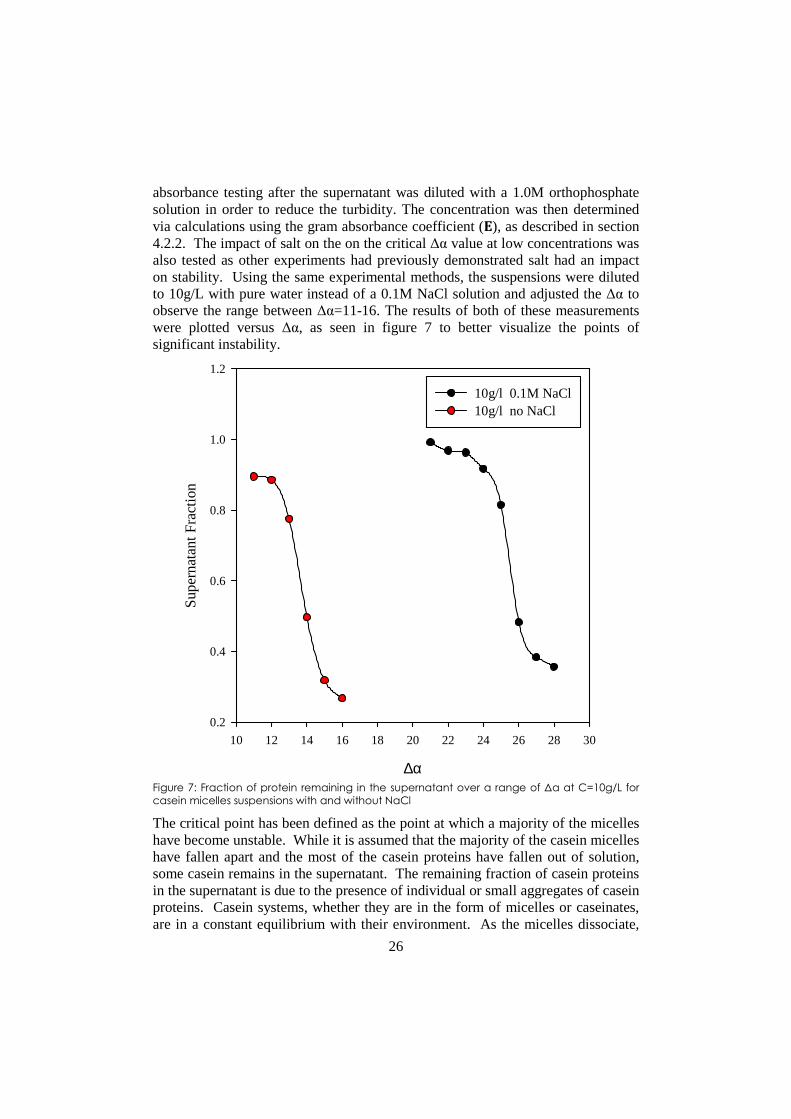
absorbance testing after the supernatant was diluted with a 1.0M orthophosphate solution in order to reduce the turbidity. The concentration was then determined via calculations using the gram absorbance coefficient (�), as described in section 4.2.2. The impact of salt on the on the critical ∆α value at low concentrations was also tested as other experiments had previously demonstrated salt had an impact on stability. Using the same experimental methods, the suspensions were diluted to 10g/L with pure water instead of a 0.1M NaCl solution and adjusted the ∆α to observe the range between ∆α=11-16. The results of both of these measurements were plotted versus ∆α, as seen in figure 7 to better visualize the points of significant instability.
Figure 7: Fraction of protein remaining in the supernatant over a range of ∆α at C=10g/L for
casein micelles suspensions with and without NaCl
The critical point has been defined as the point at which a majority of the micelles have become unstable. While it is assumed that the majority of the casein micelles have fallen apart and the most of the casein proteins have fallen out of solution, some casein remains in the supernatant. The remaining fraction of casein proteins in the supernatant is due to the presence of individual or small aggregates of casein proteins. Casein systems, whether they are in the form of micelles or caseinates, are in a constant equilibrium with their environment. As the micelles dissociate,
∆α
10 12 14 16 18 20 22 24 26 28 30
Sup
erna
tant
Fra
ctio
n
0.2
0.4
0.6
0.8
1.0
1.2
10g/l 0.1M NaCl10g/l no NaCl

27
some of the caseins are able to remain suspended. While specific testing was not done, it is likely a large percentage of these caseins are β casein as these proteins are amphiphatic and have been shown to move in and out of the micelles in response to changes in temperature. Based on these results, it was determined that the critical ∆α value for the system with salt was between ∆α=25-26 and ∆α=13-14 for the system without salt. It is also important to note that the solutions diluted with 0.1M NaCl had a higher degree of stability previous to the determined critical ∆α, reinforcing the theory that salt plays a role in micellar stability at low concentrations. In order to see if the effect of salt was reversible, a 10g/L suspension was prepared using pure water at ∆α and left overnight. The instability of the micelles in this system was clear, as a visible portion of the micelles fell out of suspension within an hour. The next day, salt was added to the suspension to make it 0.1M and the suspension was mixed until it appeared homogeneous and left to sit overnight. The instability of the micelles could not be observed as visually quickly as with the system without salt; however, the after 24hrs there was significantly less micelles in suspension then in a suspension initially prepared with 0.1M NaCl. Based on these results, it can be concluded that while electrostatic interactions plays a strong role in the stability of casein micelles in water at low concentration, there is likely some structural modifications induced when the suspension is solubilized in the salt that increase the stability as well. This conclusion also reinforces the hypothesis made by Broyard, C., & Gaucheron, F. (2015) that the presence salt increases the solubility in water due to some structural modifications. Furthermore, work done by HadjSadok et al. (2008) demonstrates that there is a change in molar mass and hydrodynamic radius induced by the presence of salt, suggesting some form of aggregation and/or structural modification.
5.2.3 Critical ∆α determination for sodium caseinate
The same tests were performed for sodium caseinate in 0.1M NaCl observing the test range of ∆α=12-16. The dilutions of the suspension from 100g/L to 10g/L were not possible as the suspensions adjusted to ∆α=15&16 nearly instantaneous formed gels as they were mixed as seen in Figure 8 below.

28
Figure 8: Sodium caseinate suspensions at 100g/L with ∆α ranging from 11-16 (right to left)
showing the increase in turbidity and eventual gel formation as the system nears the isoionic
point
The critical point of sodium caseinate was determined to be around ∆α=15. The pH of the suspension at ∆α=15 was measured to be 4.8 coinciding with the isoionic point of sodium caseinate determined by the titration curves. It is also important to the note the increase in turbidity as the ∆α values gets closer to ∆α=15. This is likely due to the increased level of aggregation of the sodium caseinate as it nears the isoionic point. This aggregation can be explained by the reduction of the electrostatic repulsion between sodium caseinate particles as their net charge nears zero.
5.2.4 Temperature effect on pH
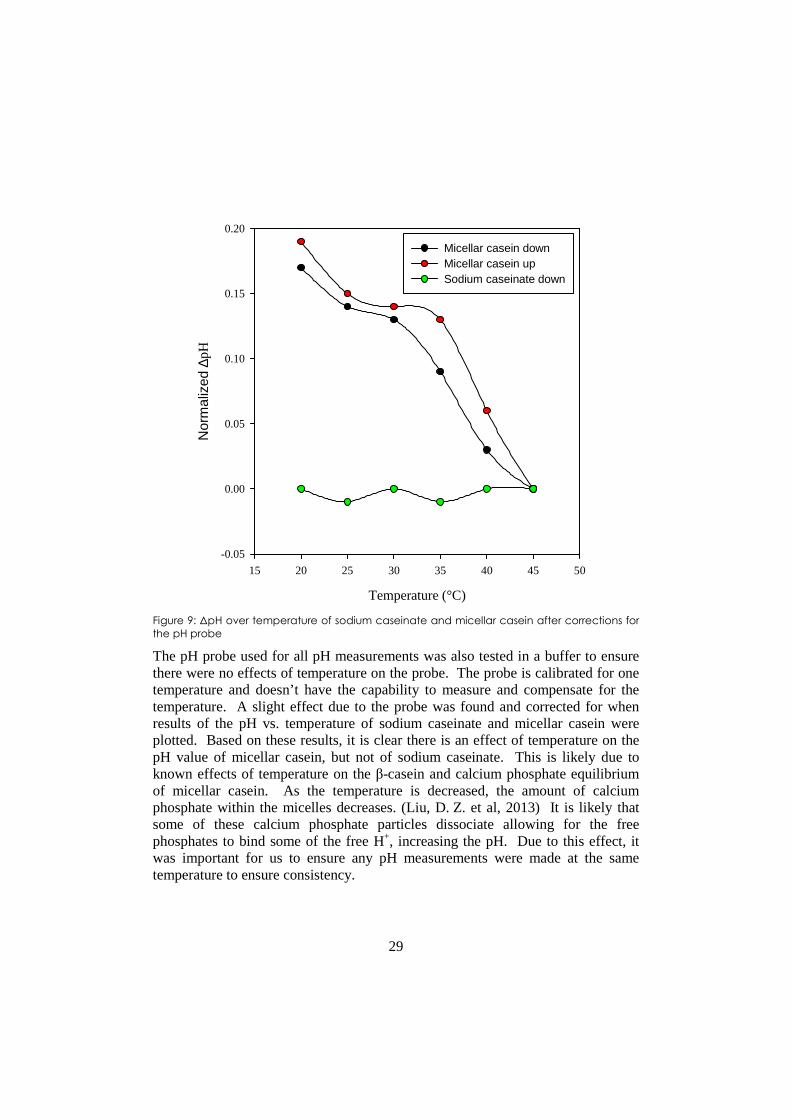
Along with the impact of concentration of pH, whether or not temperature had an impact on the measured value of pH was also explored. The temperature range tested was 45°C-20°C with 5°C intervals, with both sodium caseinate and micellar casein being tested. Each suspension was brought to 45°C and held at this temperature for 10mins to allow for the system to stabilize before the pH value was recorded. This process was repeated in intervals of 5°C until 20°C was reached. The results, after corrections for the probe were made can be seen in Figure 9.
29
Figure 9: ∆pH over temperature of sodium caseinate and micellar casein after corrections for
the pH probe
The pH probe used for all pH measurements was also tested in a buffer to ensure there were no effects of temperature on the probe. The probe is calibrated for one temperature and doesn’t have the capability to measure and compensate for the temperature. A slight effect due to the probe was found and corrected for when results of the pH vs. temperature of sodium caseinate and micellar casein were plotted. Based on these results, it is clear there is an effect of temperature on the pH value of micellar casein, but not of sodium caseinate. This is likely due to known effects of temperature on the β-casein and calcium phosphate equilibrium of micellar casein. As the temperature is decreased, the amount of calcium phosphate within the micelles decreases. (Liu, D. Z. et al, 2013) It is likely that some of these calcium phosphate particles dissociate allowing for the free phosphates to bind some of the free H+, increasing the pH. Due to this effect, it was important for us to ensure any pH measurements were made at the same temperature to ensure consistency.
Temperature (°C)
15 20 25 30 35 40 45 50
Nor
mal
ized
∆pH
-0.05
0.00
0.05
0.10
0.15
0.20
Micellar casein downMicellar casein upSodium caseinate down
30
5.2.5 Conclusions for Section 5.2
Conclusions for section 5.2 can be summarized into 3 main points:
• The pH of sodium caseinate systems is affected by concentration, but not by temperature. A small change in pH over a wide concentration range can be observed and explained by the shift in the dissociation constant of sodium caseinate.
• The pH of micellar casein is significantly impacted by both concentration and temperature. This is likely due to the dynamic nature of the micellar structure and the presence of calcium phosphate. For changes in concentration, the significant shift in pH is due to the shift in the dissociation constant of calcium phosphate in addition to the shift in dissociation constant of the casein micelles. For changes in temperature, the shift is again due to the presence of calcium phosphate and its dissociation as a result of increase in temperature.
• The presence of 0.1M NaCl has a significant impact on the stability of micellar casein at low concentrations. This effect is likely due to structural modifications of the micelles caused by the presence of salt as suggested by Broyard, C., & Gaucheron, F. (2015).

31
5.3 Rheology
The comparison of the zero shear viscosity (η0) over a range of ∆α=-3-20 and concentrations from 200g/L-100g/L were observed at 5°C 20°C and 40°C for both sodium caseinate and micellar casein suspensions.
5.3.1 Sodium Caseinate Rheology
The effects of temperature on the η0 over our concentration range will be discussed first.
Figure 10: Zero Shear Viscosity (η0) of sodium caseinates as a function of concentration (g/L)
with differing ∆α and temperatures
Figure 10 shows viscosity as a function of concentration at 5°, 20°C, and 40°C for the two values of ∆α. All intermediate values of ∆α showed intermediate behavior in terms of the effect of temperature on the viscosity. As the temperature is increased, there is a decrease in the η0 due to the decrease of the effective volume fraction as demonstrated in the previous work by Pitkowski (2008). This decrease is likely caused by the weakening of both the hydrogen bonds and electrostatic interactions caused by heat. This is consistent with the results previously found in
Concentration (g/L)
80 100 120 140 160 180 200 220
η 0 (P
a.s)
10-3
10-2
10-1
100
101
102
103
104
105
106
107
108
109
1010
5°C ∆α=10
20°C ∆α=10
40°C ∆α=10
5°C ∆α=-3
20°C ∆α=-3
40°C ∆α=-3
32
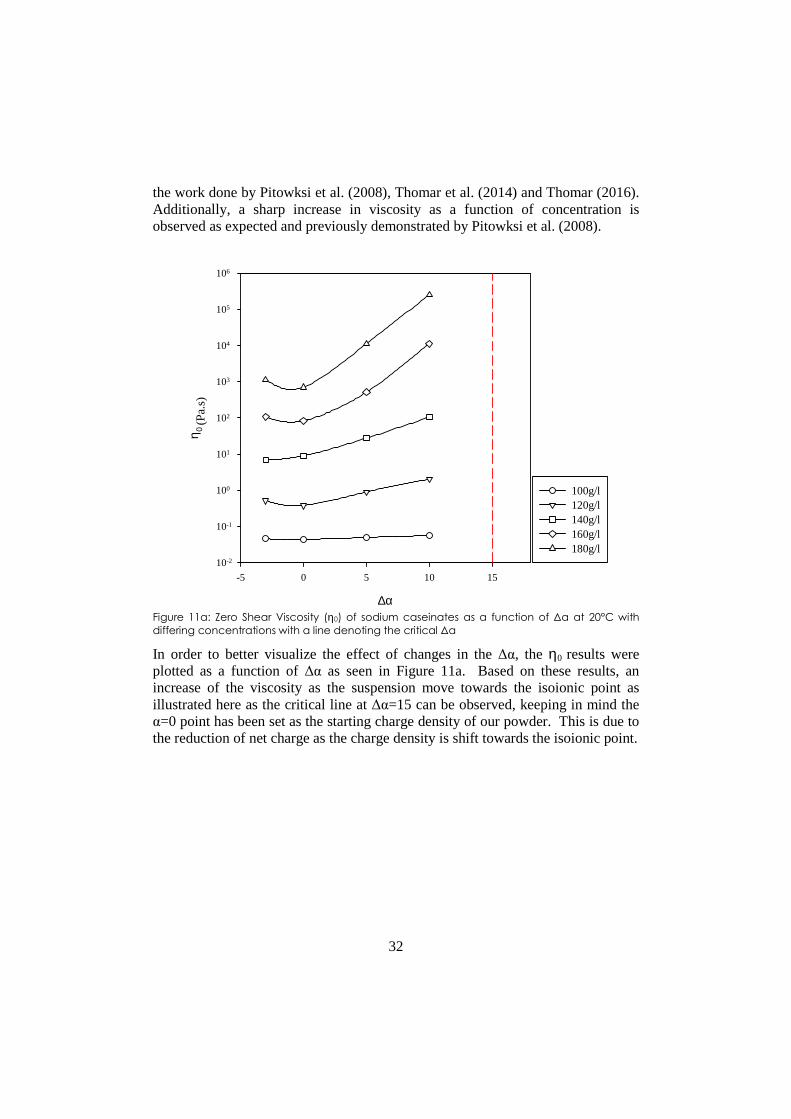
the work done by Pitowksi et al. (2008), Thomar et al. (2014) and Thomar (2016). Additionally, a sharp increase in viscosity as a function of concentration is observed as expected and previously demonstrated by Pitowksi et al. (2008).
Figure 11a: Zero Shear Viscosity (η0) of sodium caseinates as a function of ∆α at 20°C with
differing concentrations with a line denoting the critical ∆α
In order to better visualize the effect of changes in the ∆α, the η0 results were plotted as a function of ∆α as seen in Figure 11a. Based on these results, an increase of the viscosity as the suspension move towards the isoionic point as illustrated here as the critical line at ∆α=15 can be observed, keeping in mind the α=0 point has been set as the starting charge density of our powder. This is due to the reduction of net charge as the charge density is shift towards the isoionic point.
∆α
-5 0 5 10 15
η 0 (P
a.s)
10-2
10-1
100
101
102
103
104
105
106
100g/l120g/l140g/l160g/l180g/l

33
Figure 11b: Zero Shear Viscosity (η0) of sodium caseinates as a function of pH at 20°C with
differing concentrations with a line denoting the critical pH
It is also interesting to look at this as a function of pH to visualize the difference between pH and ∆α (Figure 11b) and how they are affected by the concentration. In the case of sodium caseinate, the difference is not significant, but will serve as a comparison when results for casein micelles are discussed.
5.3.2 Micellar Casein Rheology
The results for micellar casein will be presented in a similar manner to those in section 5.3.1. Figure 12 shows the η0 vs. concentration for two extreme values of ∆α in which 3 temperatures could be measured. For the system at ∆α=20, the η0
could not be measured at 40°C because of heat induced gelation. This lower temperature for heat induced gelation when nearing the isoionic point is consistent with the previous findings by Thomar (2016).
pH
4.55.05.56.06.57.07.5
η 0 (P
a.s)
10-2
10-1
100
101
102
103
104
105
106
100g/l120g/l140g/l160g/l180g/l

34
Figure 12: Zero Shear Viscosity (η0) of casein micelles as a function of concentration (g/L) with
differing ∆α and temperatures
As with the sodium caseinate system, there is a decrease in viscosity as the temperature decreases. This decrease is likely due to the same mechanisms acting upon the micelles, decreasing the effective volume fraction via the reduction of electrostatic interaction and hydrogen bonds. There is also a sharp increase in viscosity as the concentration is increases as previously shown by Boucheaux et al. (2009) and Thomar (2016).
As with sodium caseinate, the η0 results were plotted as a function of ∆α to better visualize the effects as seen in Figure 13a. Two distinct phenomena are observed, with the first being the critical point observed at ∆α=-5 (pH≈8) in addition to the critical point at ∆α=25 previously discussed. It was observed that at ∆α=-5 gelation occurs. As far as we know, gelation due to alkalization has not yet been described in any previous work. As previously discussed, Ahmad et al. (2009) hypothesized that the alkalization of the milk system caused the deprotonation of phosphate, increased the chelating potential of calcium, and destabilized the micelles. This destabilization of the micelles in addition to the changes in the ionization of proteins caused the formation of small aggregates and large self assembling aggregates. It is possible that in high concentration systems this self assembling aggregation behavior is dominant and leads to gel network formation.
Concentration (g/L)
80 100 120 140 160 180 200 220
η 0 (P
a.s)
10-3
10-2
10-1
100
101
102
103
∆α=0 5°C∆α=0 20°C∆α=0 40°C∆α=15 5°C∆α=15 20°C∆α=15 40°C
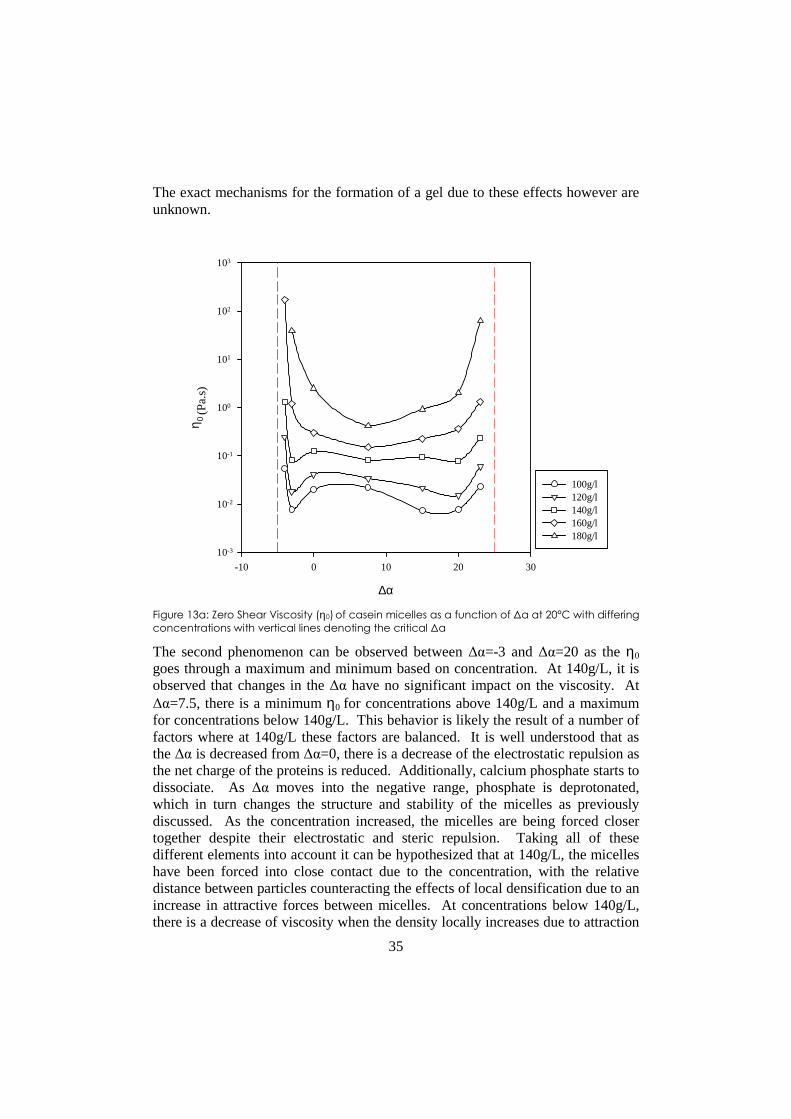
35
The exact mechanisms for the formation of a gel due to these effects however are unknown.
Figure 13a: Zero Shear Viscosity (η0) of casein micelles as a function of ∆α at 20°C with differing
concentrations with vertical lines denoting the critical ∆α
The second phenomenon can be observed between ∆α=-3 and ∆α=20 as the η0
goes through a maximum and minimum based on concentration. At 140g/L, it is observed that changes in the ∆α have no significant impact on the viscosity. At ∆α=7.5, there is a minimum η0 for concentrations above 140g/L and a maximum for concentrations below 140g/L. This behavior is likely the result of a number of factors where at 140g/L these factors are balanced. It is well understood that as the ∆α is decreased from ∆α=0, there is a decrease of the electrostatic repulsion as the net charge of the proteins is reduced. Additionally, calcium phosphate starts to dissociate. As ∆α moves into the negative range, phosphate is deprotonated, which in turn changes the structure and stability of the micelles as previously discussed. As the concentration increased, the micelles are being forced closer together despite their electrostatic and steric repulsion. Taking all of these different elements into account it can be hypothesized that at 140g/L, the micelles have been forced into close contact due to the concentration, with the relative distance between particles counteracting the effects of local densification due to an increase in attractive forces between micelles. At concentrations below 140g/L, there is a decrease of viscosity when the density locally increases due to attraction
∆α
-10 0 10 20 30
η 0 (P
a.s)
10-3
10-2
10-1
100
101
102
103
100g/l120g/l140g/l 160g/l180g/l

36
between micelles. At concentrations above 140g/L, local densification is no longer sufficient and the micelles remain close packed with the attractive forces leading to aggregation. A visual representation of this behavior can see in Figure 14a.
Figure 14a: Visual representation of the change in rheological behavior of casein micelles
above and below 140g/L due to shifts in ∆α with red representing increased attractive forces
This hypothesis is also supported by the shift in behavior from that more closely resembling solid sphere to that of soft spheres or microgels characterized by Boucheaux et al. (2009) and L. Dahbi et al. (2009). As the charge density nears the two critical values, a rapid increase in viscosity is observed for all concentrations. This is likely due to the breakdown of these counteracting effects leading to the instability of the micelles and a shift towards aggregation and gel formation. A visual representation of this behavior can see in Figure 14b.
Figure 14b: Visual representation of the the change in rheological behavior of casein micelles
below 140g/L as the ∆α nears the critical point with red representing increased attractive
forces
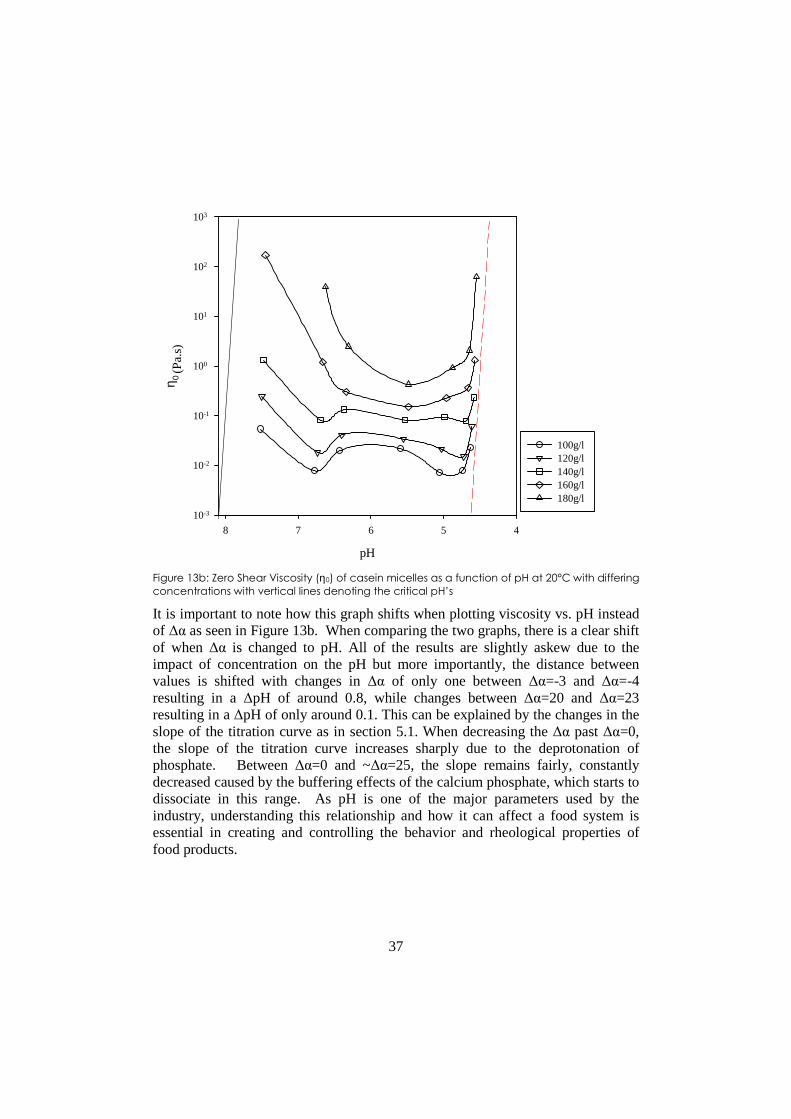
37
Figure 13b: Zero Shear Viscosity (η0) of casein micelles as a function of pH at 20°C with differing
concentrations with vertical lines denoting the critical pH’s
It is important to note how this graph shifts when plotting viscosity vs. pH instead of ∆α as seen in Figure 13b. When comparing the two graphs, there is a clear shift of when ∆α is changed to pH. All of the results are slightly askew due to the impact of concentration on the pH but more importantly, the distance between values is shifted with changes in ∆α of only one between ∆α=-3 and ∆α=-4 resulting in a ∆pH of around 0.8, while changes between ∆α=20 and ∆α=23 resulting in a ∆pH of only around 0.1. This can be explained by the changes in the slope of the titration curve as in section 5.1. When decreasing the ∆α past ∆α=0, the slope of the titration curve increases sharply due to the deprotonation of phosphate. Between ∆α=0 and ~∆α=25, the slope remains fairly, constantly decreased caused by the buffering effects of the calcium phosphate, which starts to dissociate in this range. As pH is one of the major parameters used by the industry, understanding this relationship and how it can affect a food system is essential in creating and controlling the behavior and rheological properties of food products.
pH
45678
η 0 (P
a.s)
10-3
10-2
10-1
100
101
102
103
100g/l 120g/l140g/l160g/l180g/l

38
5.3.3 Conclusions for Section 5.3
Conclusions for section 5.3 can be summarized into the following points:
• Both sodium caseinate and casein micelle suspensions showed a sharp increase in η0 as a function of increased concentration as previously reported and discussed in various literature sources. (Pitowksi et al., 2008), (Thomar, (2016) (Boucheaux et al., 2009) and (L. Dahbi et al., 2009).
• As the temperature is increased in the range of 5-40°C, the viscosity of both sodium caseinate and micellar casein suspensions is decreased. Effects of the temperature on the η0 for suspensions of sodium caseinate and micellar casein are due to the decrease in the effective volume fraction as a result of the weakened hydrogen bonding and electrostatic interactions due to heat.
• Sodium caseinate suspensions demonstrate an increase in η0 as the ∆α was increased. This is due to a decrease in the net charge density of the micelles and the progressive dissociation of calcium phosphate leading to micellar instability and aggregation with gelation occurring at a critical ∆α.
• The impact of the changes in ∆α for casein micelle suspension is more complex with a number of factors likely playing a role. The forced close packing of the micelles due to concentration along with the steric repulsion and the shifting electrostatic repulsion and charge density all play a role in the stability and structure of the suspension. It is the results of this dynamic interaction that cause the shifts in the rheological behavior of the casein micelles.
• Alkaline gelation was observed at ∆α=-5. This is likely caused by micelles instability due to the deprotonation of phosphate and its resulting interactions with calcium and the micelles.
• The changes in pH in relations to ∆α are further proved to be important with the changes being seen in correlation to the titration curve.
39
6 Concluding remarks
This work discussed here has provided some new insights as to how the rheological behavior of dense suspensions of sodium caseinate and micellar casein changes with respect to changes in concentration, pH and temperature. The confirmed importance of the charge density (α) and its relationship to pH for both sodium caseinate and micellar casein provides a new way of looking at casein systems and provides some insight as to the interactions that govern micellar stability in dense systems. Although alkalinization is rarely used by the food industry, the observance of gelation due to akalinization of dense suspensions of casein micelles could potentially have industrially applications not yet discovered. While some of the results and conclusions reinforce previous work concerning dense suspensions, they also have demonstrated some previously unexplored behaviors and raise new questions to be considered. Studying sodium caseinate systems with added calcium phosphate could help to better understand the role of calcium phosphate in the relationship of pH and α for casein micelles. Comparison of the gels formed by acidification and alkalization as well as further exploration as to the mechanisms behind this alkaline gel formation should also be considered for further study. The continued study of casein micelles and their structure and behavior will allow for more efficient production of techno-functionally specific ingredients and products allowing the food industry to continue to innovate and improve.
Impact on Packaging Development
By gaining a deeper understanding of how pH, temperature and concentration affect the rheological behavior of suspensions of casein micelles and sodium caseinate, we also gain insights that allow for the improvement of packaging for products with compositions within these categories. Based on the results of this thesis, we can better predict and control the rheological behavior of products like some soft, spreadable cheeses or condensed milk. This allows us to develop new and innovative packaging solutions for these products that take advantage of or prevent changes in rheological behavior due to the changes in pH, or temperature. Additionally, this work could allow for the improvement of the filling and packaging process by favorably altering the rheological behavior during the packaging process without destroying the final product.

40
41
7 Bibliography
Ahmad, S., Piot, M., Rousseau, F., Grongnet, J.F. and Gaucheron, F., 2009. Physico-chemical changes in casein micelles of buffalo and cow milks as a function of alkalinisation. Dairy Science and Technology, 89(3-4), pp.387-403.
Bouchoux, A., Debbou, B., Gesan-Guiziou, G., Famelart, M.H., Doublier, J.L. and Cabane, B., 2009. Rheology and phase behavior of dense casein micelle dispersions. The Journal of Chemical Physics, 131(16), p.165106.
Broyard, C. and Gaucheron, F., 2015. Modifications of structures and functions of caseins: a scientific and technological challenge. Dairy Science & Technology, 95(6), pp.831-862.
Chen, N., Zhao, M., Chassenieux, C. and Nicolai, T., 2016. Structure of self-assembled native soy globulin in aqueous solution as a function of the concentration and the pH. Food Hydrocolloids, 56, pp.417-424.
Dahbi, L., Alexander, M., Trappe, V., Dhont, J.K.G. and Schurtenberger, P., 2010. Rheology and structural arrest of casein suspensions. Journal of Colloid and Interface Science, 342(2), pp.564-570.
Dalgleish, D.G., 2011. On the structural models of bovine casein micelles—review and possible improvements. Soft Matter, 7(6), pp.2265-2272.
David S. Horne., 2014. Casein micelle structure and stability, Boland, M., Singh, H. and Thompson, A. eds., Milk proteins: from expression to food. (s. 133-162) Cambridge, MA USA. Academic Press.
De Kruif, C.G., Huppertz, T., Urban, V.S. and Petukhov, A.V., 2012. Casein micelles and their internal structure. Advances in Colloid and Interface Science, 171, pp.36-52.
de Kruif, C.G., Bhatt, H., Anema, S.G. and Coker, C., 2015. Rheology of caseinate fractions in relation to their water holding capacity. Food Hydrocolloids, 51, pp.503-511.
Famelart, M.H., Le Graet, Y. and Raulot, K., 1999. Casein micelle dispersions into water, NaCl and CaCl 2: physicochemical characteristics of micelles and rennet coagulation. International Dairy Journal, 9(3), pp.293-297.
42
Famelart, M.H., Lepesant, F., Gaucheron, F., Le Graet, Y. and Schuck, P., 1996. pH-Induced physicochemical modifications of native phosphocaseinate suspensions: Influence of aqueous phase. Le lait, 76(5), pp.445-460.
Gonzalez-Jordan, A., Thomar, P., Nicolai, T. and Dittmer, J., 2015. The effect of pH on the structure and phosphate mobility of casein micelles in aqueous solution. Food Hydrocolloids, 51, pp.88-94.
HadjSadok, A., Pitkowski, A., Nicolai, T., Benyahia, L. and Moulai-Mostefa, N., 2008. Characterisation of sodium caseinate as a function of ionic strength, pH and temperature using static and dynamic light scattering. Food Hydrocolloids, 22(8), pp.1460-1466.
Holt, C., 1995. Effect of heating and cooling on the milk salts and their interaction with casein, Fox, P.F., Heat-induced changes in milk., (Ed. 2), (s. 105-133) Brussels. International Dairy Federation
Holt, C., Carver, J.A., Ecroyd, H. and Thorn, D.C., 2013. Invited review: Caseins and the casein micelle: Their biological functions, structures, and behavior in foods. Journal of dairy science, 96(10), pp.6127-6146.
Huppertz, T. and Fox, P.F., 2006. Effect of NaCl on some physico-chemical properties of concentrated bovine milk. International dairy journal, 16(10), pp.1142-1148.
Kharlamova, A., Inthavong, W., Nicolai, T. and Chassenieux, C., 2016. The effect of aggregation into fractals or microgels on the charge density and the isoionic point of globular proteins. Food Hydrocolloids, 60, pp.470-475.
Loveday, S.M., Rao, M.A., Creamer, L.K. and Singh, H., 2010. Rheological Behavior of High‐Concentration Sodium Caseinate Dispersions. Journal of food science, 75(2), pp.N30-N35.
Nöbel, S., Weidendorfer, K., & Hinrichs, J. (2012). Apparent voluminosity of casein micelles determined by rheometry. Journal of colloid and interface science, 386(1), 174-180.
Olivares, M.L., Berli, C.L.A. and Zorrilla, S.E., 2013. Rheological modelling of dispersions of casein micelles considered as microgel particles. Colloids and Surfaces A: Physicochemical and Engineering Aspects, 436, pp.337-342.
Pitkowski, A., Durand, D. and Nicolai, T., 2008. Structure and dynamical mechanical properties of suspensions of sodium caseinate. Journal of Colloid and Interface Science, 326(1), pp.96-102.
Qu, P., Bouchoux, A. and Gésan-Guiziou, G., 2015. On the cohesive properties of casein micelles in dense systems. Food Hydrocolloids, 43, pp.753-762.
Thomar, P., Benyahia, L., Durand, D. and Nicolai, T., 2014. The influence of adding monovalent salt on the rheology of concentrated sodium caseinate suspensions

43
and the solubility of calcium caseinate. International Dairy Journal, 37(1), pp.48-54.
Thomar, P., Nicolai, T., Benyahia, L. and Durand, D., 2013. Comparative study of the rheology and the structure of sodium and calcium caseinate solutions. International Dairy Journal, 31(2), pp.100-106.

44
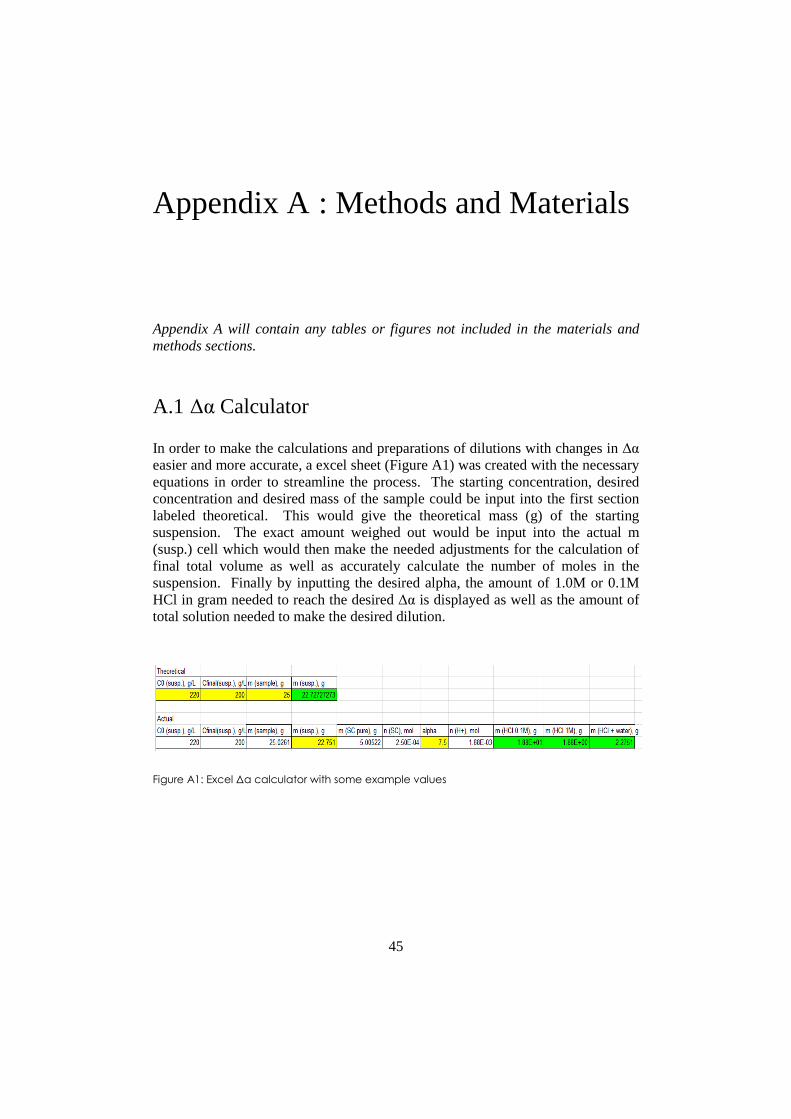
45
Appendix A : Methods and Materials
Appendix A will contain any tables or figures not included in the materials and methods sections.
A.1 ∆α Calculator
In order to make the calculations and preparations of dilutions with changes in ∆α easier and more accurate, a excel sheet (Figure A1) was created with the necessary equations in order to streamline the process. The starting concentration, desired concentration and desired mass of the sample could be input into the first section labeled theoretical. This would give the theoretical mass (g) of the starting suspension. The exact amount weighed out would be input into the actual m (susp.) cell which would then make the needed adjustments for the calculation of final total volume as well as accurately calculate the number of moles in the suspension. Finally by inputting the desired alpha, the amount of 1.0M or 0.1M HCl in gram needed to reach the desired ∆α is displayed as well as the amount of total solution needed to make the desired dilution.
Figure A1: Excel ∆α calculator with some example values

46
A.2 Confocal Microscopy
Confocal microscopy images were taken for both sodium caseinate and micellar casein as one of the ways to confirm the homogeneity of suspension preparations and dilutions. Some sample results are shown here.
Figure A2a : Sodium caseinate at 200g/L at ∆α=0, 5, and 10 (left to right) taken to determine
homogeneity of the preparation
Figure A2b: Micellar casein at 180g/L at ∆α=0, 5, 10, 15, 20 taken to determine homogeneity of
the preparation


![Casein micelles in milk revisited · Casein micelles per 17liter - N cm 1.14 10 [L 1] Calculated Nanocluster r nc 1.72 to 2.27 [nm] SANS/SAXS Nanoclusters/ Casein micelle N nc 285](https://img.pdfslide.us/doc/110x75/5fd572d92d5adf1c9e637683/casein-micelles-in-milk-revisited-casein-micelles-per-17liter-n-cm-114-10-l.jpg)