Embed Size (px)
Citation preview
Energies 2014, 7, 548-567; doi:10.3390/en7020548
energies ISSN 1996-1073
www.mdpi.com/journal/energies
Article
Characterization of Biochar from Switchgrass Carbonization
Samy Sadaka 1,*, Mahmoud A. Sharara 1, Amanda Ashworth 2, Patrick Keyser 2, Fred Allen 3
and Andrew Wright 1
1 Department of Biological and Agricultural Engineering, University of Arkansas Division of Agriculture,
Little Rock, AR 72204, USA; E-Mails: [email protected] (M.A.S.); [email protected] (A.W.) 2 Center for Native Grasslands Management, University of Tennessee, Knoxville, TN 37996, USA;
E-Mails: [email protected] (A.A.); [email protected] (P.K) 3 Department of Plant Sciences, University of Tennessee, Knoxville, TN 37996, USA;
E-Mail: [email protected]
* Author to whom correspondence should be addressed; E-Mail: [email protected];
Tel.: +1-501-671-2298; Fax: +1-501-671-2303.
Received: 17 November 2013; in revised form: 24 December 2013 / Accepted: 14 January 2014 /
Published: 24 January 2014
Abstract: Switchgrass is a high yielding, low-input intensive, native perennial grass that
has been promoted as a major second-generation bioenergy crop. Raw switchgrass is not a
readily acceptable feedstock in existing power plants that were built to accommodate coal
and peat. The objective of this research was to elucidate some of the characteristics of
switchgrass biochar produced via carbonization and to explore its potential use as a solid
fuel. Samples were carbonized in a batch reactor under reactor temperatures of 300, 350 and
400 °C for 1, 2 and 3 h residence times. Biochar mass yield and volatile solids decreased
from 82.6% to 35.2% and from 72.1% to 43.9%, respectively, by increasing carbonization
temperatures from 300 °C to 400 °C and residence times from 1 h to 3 h. Conversely,
biochar heating value (HV) and fixed carbon content increased from 17.6 MJ kg−1 to
21.9 MJ kg−1 and from 22.5% to 44.9%, respectively, under the same conditions. A biomass
discoloration index (BDI) was created to quantify changes in biochar colors as affected by
the two tested parameters. The maximum BDI of 77% was achieved at a carbonization
temperature of 400 °C and a residence time of 3 h. The use of this index could be expanded
to quantify biochar characteristics as affected by thermochemical treatments.
Carbonized biochar could be considered a high quality solid fuel based on its energy content.
OPEN ACCESS
Energies 2014, 7 549
Keywords: switchgrass; carbonization; biochar; BDI; co-firing
1. Introduction
Switchgrass (Panicum virgatum L.) is a North American native grass that has been promoted as a
model bioenergy crop because of its high-yield potential, low input requirements on marginal soils,
and potential for soil carbon sequestration [1]. Typical yields range between 10 and 13 metric tons per
hectare in the Midwest, while in Southwestern states (Texas, Arkansas and Louisiana) yields average
between 12 and 22 metric tons per hectare [2,3]. As a bioenergy feedstock, switchgrass has a gross
calorific value between 18 MJ kg−1 and 19 MJ kg−1 [4,5], an energy content comparable to that of
hardwoods (19–21 MJ kg−1) [6]. Several barriers faced the utilization of switchgrass as the sole source
of fuel in combustors including the high moisture and ash contents in biomass, which cause ignition
and combustion problems. In addition, the low melting point of the ash, which causes fouling and
slagging problems [7]. Sami et al. [8] reported that blending biomass with coal would reduce flame
stability problems, as well as lead to a significant reductions in pollutant emissions. Consequently,
a multitude of studies has investigated switchgrass conversion, particularly thermochemical conversion
to liquid or solid biofuels and bioenergy.
During the thermal conversion of switchgrass, the main constituents, i.e., cellulose, hemicellulose,
and lignin undergo structural transformations. These transformations depend on the severity of the
treatment (temperature and duration) and on the environment in which the treatment occurs. In processes
less severe than combustion, such as torrefaction, pyrolysis, and gasification, the biomass is converted
to a dark, carbon-rich solid fraction (biochar) in addition to volatile products that contain both
condensable and non-condensable organic compounds. Yield of solids, volatiles, and the exact
characteristics of each product depend on thermal parameters and resident time. For instance,
gasification and fast pyrolysis processes produce about 10% and 25% biochar [9].
Various studies investigated biochar production from herbaceous crops, particularly from
switchgrass feedstock. Imam and Capareda [10] reported increases in switchgrass biochar heating
value (HV), carbon content, and surface area and decreases in biochar yield, hydrogen, and nitrogen
contents with increasing pyrolysis temperatures (400, 500 and 600 °C). Boateng et al. [4] discussed the
potential use of pyrolysis biochar as fuel to supply part of the thermal energy necessary during
switchgrass pyrolysis. However, they noted that the high ash content of the char (25% by mass) would
be problematic in further thermal conversion, i.e., combustion. Agblevor and Besler [11] showed that
under pyrolysis conditions, ash minerals such as calcium, potassium and phosphorous are entirely
sequestrated in the biochar fraction whereas sulfur, nitrogen, and chlorine are partially converted to
gaseous and condensable products. The high ash content of biochar and the low-melting point of char
minerals have prompted the investigation of the thermal and the non-thermal uses for the biochar.
Recently, focuses have shifted towards investigating technologies such as torrefaction and
carbonization, which produce more biochar than gaseous or liquid biofuels. Torrefaction is a mild
thermal upgrading process (200–300 °C) in a non-oxidative environment used to improve physical and
chemical characteristics of the biomass to aid in further conversion to biofuels [12]. This is achievable
Energies 2014, 7 550
by facilitating decomposition of easily degraded volatile matter (hemicellulose) and repolymarization
of cellulose and lignin [13]. The torrefied biomass resembles the original material in shape and size but
is darker, friable, and hydrophobic with a higher calorific content [14]. Carbonization, a more severe
treatment compared to torrefaction, focuses mainly on the production of biochar by slowly heating
the biomass to temperatures above 300 °C in an oxygen-free environment. Biochar produced from
carbonization process is carbon-rich solid with favorable solid fuel qualities comparable to low
quality coal. Carbonized biomass has closely related properties to coal, i.e., easy to crush, grind or
pulverize as compared with torrefied biomass. Therefore, carbonized biomass gains much higher
energy density than the raw biomass and torrefied biomass, which makes it more acceptable for
co-firing [15]. The carbonization process has been in practice for centuries, but only still practiced in
developing countries [16]. In this process, wood is converted to coal-like feedstock that is useful as
cooking and heating fuel. Typical solid product yields obtained by carbonization of dry wood, i.e., 37% are
significantly lower as compared to the solid product yields by torrefaction of the same feedstock,
i.e., 84% [9]. Brewer et al. [17] compared biochar produced from fast pyrolysis and gasification of
switchgrass. They reported that fast pyrolysis produced biochar with contain 16.4% volatile solids and
16.3 MJ kg−1 calorific value whereas, gasification produced biochar contain only 10.3% volatile solids
and comparable calorific value of 15.9 MJ kg−1. Biochar production techniques have been developed
mainly for woody feedstocks. However, during the last few decades, perennial herbaceous species
such as switchgrass, and miscanthus (Miscanthus giganteus) started to gain attention as potential
feedstocks for both energy and biochar production. Generally, studies have been carried out on
pyrolysis biochar, with few investigations on torrefaction and carbonization biochars, which may hold
superior characteristics as an energy source [9,18]. Therefore, the objective of this research was to
study the physical, chemical, and thermochemical characteristics of switchgrass biochar produced
under different carbonization temperatures and residence times in a batch system and explore its
potential use as a solid biofuel.
2. Experimental Section
2.1. Feedstock Collection and Preparation
The feedstock used in this study was a lowland switchgrass variety (cv. Alamo) grown near Vonore,
Tennessee. It was harvested in November 2011, field cured to <25% moisture, and ground to 2.5 cm
particle size prior to storage in silos. The chopped switchgrass was then transported to the Rice Research
and Extension Center, University of Arkansas, Stuttgart, Arkansas, where this study was conducted.
2.2. Carbonization Procedure
The carbonization experiments were carried out in 3.78-L cylindrical metal containers filled with
switchgrass samples and placed in a controllable muffle furnace (Neytech Vulcan furnace, Model 3-1750,
Bloomfield, CT, USA). Each container was loaded with 400 g of chopped switchgrass before tightly
securing the lid allowing only the evolved volatiles to escape through small vents on the lid, five openings
of 3 mm in diameter each. In this study, the evolved volatiles were not collected nor quantified.
Three temperature levels (300, 350 and 400 °C) and three residence times (1, 2 and 3 h) were tested in
Energies 2014, 7 551
triplicates to explore their influence on quantity and quality of biochar. Raw samples were placed in
the heated furnace once the desired temperature level was achieved. After retrieval from heated furnace,
containers were immediately covered with aluminum foil in order to prevent char oxidation and
allowed to cool down.
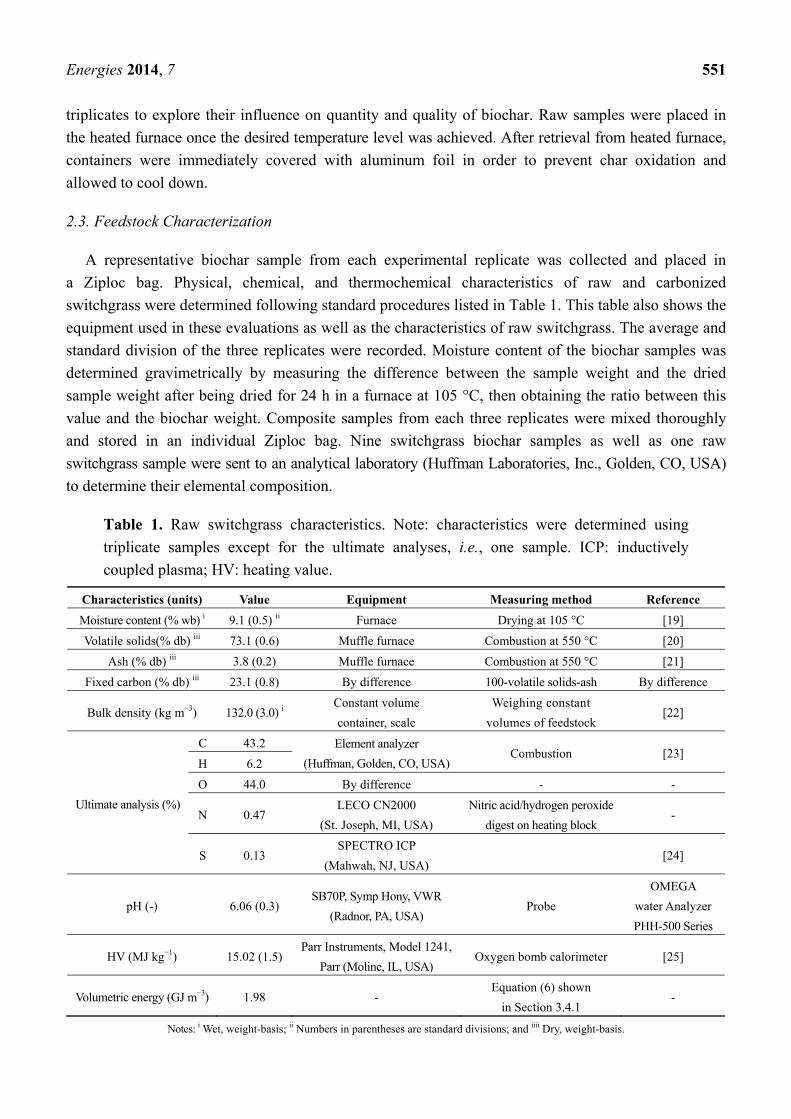
2.3. Feedstock Characterization
A representative biochar sample from each experimental replicate was collected and placed in
a Ziploc bag. Physical, chemical, and thermochemical characteristics of raw and carbonized
switchgrass were determined following standard procedures listed in Table 1. This table also shows the
equipment used in these evaluations as well as the characteristics of raw switchgrass. The average and
standard division of the three replicates were recorded. Moisture content of the biochar samples was
determined gravimetrically by measuring the difference between the sample weight and the dried
sample weight after being dried for 24 h in a furnace at 105 °C, then obtaining the ratio between this
value and the biochar weight. Composite samples from each three replicates were mixed thoroughly
and stored in an individual Ziploc bag. Nine switchgrass biochar samples as well as one raw
switchgrass sample were sent to an analytical laboratory (Huffman Laboratories, Inc., Golden, CO, USA)
to determine their elemental composition.
Table 1. Raw switchgrass characteristics. Note: characteristics were determined using
triplicate samples except for the ultimate analyses, i.e., one sample. ICP: inductively
coupled plasma; HV: heating value.
Characteristics (units) Value Equipment Measuring method Reference
Moisture content (% wb) i 9.1 (0.5) ii Furnace Drying at 105 °C [19]
Volatile solids(% db) iii 73.1 (0.6) Muffle furnace Combustion at 550 °C [20]
Ash (% db) iii 3.8 (0.2) Muffle furnace Combustion at 550 °C [21]
Fixed carbon (% db) iii 23.1 (0.8) By difference 100-volatile solids-ash By difference
Bulk density (kg m−3) 132.0 (3.0) i Constant volume
container, scale
Weighing constant
volumes of feedstock [22]
Ultimate analysis (%)
C 43.2 Element analyzer
(Huffman, Golden, CO, USA) Combustion [23]
H 6.2
O 44.0 By difference - -
N 0.47 LECO CN2000
(St. Joseph, MI, USA)
Nitric acid/hydrogen peroxide
digest on heating block -
S 0.13 SPECTRO ICP
(Mahwah, NJ, USA) [24]
pH (-) 6.06 (0.3) SB70P, Symp Hony, VWR
(Radnor, PA, USA) Probe
OMEGA
water Analyzer
PHH-500 Series
HV (MJ kg−1) 15.02 (1.5) Parr Instruments, Model 1241,
Parr (Moline, IL, USA) Oxygen bomb calorimeter [25]
Volumetric energy (GJ m−3) 1.98 - Equation (6) shown
in Section 3.4.1 -
Notes: i Wet, weight-basis; ii Numbers in parentheses are standard divisions; and iiii Dry, weight-basis.
Energies 2014, 7 552
2.4. Biochar Mass Yield
The biochar mass yield was calculated using Equation (1) below:
= × 100% (1)
where Yieldbiochar = mass yield of biochar, %; mbiochar = mass of biochar, kg; mraw = mass of raw
switchgrass, kg.
2.5. Biomass Discoloration Index (BDI)
A series of images of the raw and carbonized samples (2 g of material per treatment combination)
were captured. One composite sample was analyzed for each experimental unit. Samples were spread
in a monolayer over a 10-cm diameter filter paper prior to imaging. Care was taken to spread each
sample over that area to eliminate any background reflective interference. Images were captured using
a Nikon® digital camera (Model D90, Tokyo, Japan) with a Nikkor® lens. All images were captured
using the same camera settings: 60 mm focal length, 1/20 s shutter speed, and f/9.5 aperture setting. All
images were captured under the same lighting conditions. Images were uniformly framed to capture a
real-area of 6.0 cm × 6.0 cm containing only biochar samples. The image processing package included
in MATLAB® R2012b software platform (Mathworks, Inc., Natick, MA, USA) was used to convert
the captured images from real-color photographs, i.e., red-green-blue (RGB) scale to greyscale images
(pixel value 0 = black, and pixel value 255 = white). The same software was then used to generate a
greyscale histogram for the image pixel values as well as the mean, and the standard deviation for each
image matrix. In order to measure the extent of the biomass color change, the mean value for each
image matrix was related to the mean value for the greyscale image of the raw switchgrass to develop
an index, BDI, as shown in the formula below:
BDI= 1 - Mean pixel value of carbonized biochar image
Mean pixel value of raw switchgrass image ×100% (2)
2.6. Biochar Thermal Degradation
In order to closely observe the devolatilization rate and the biochar formation in both raw and
carbonized switchgrass, thermogravimetric tests were carried out on finely-ground switchgrass
samples (dp < 63 μm) (raw and carbonized) in a thermogravimetric analyzer (TGA 4000-PerkinElmer,
Waltham, MA, USA). These tests studied the weight loss profile in an inert environment (i.e., nitrogen)
using a 20 °C min−1 heating rate. The weight loss rate can be expressed as follows: − = k × (3)
where W = sample weight, mg; t = reaction time, s; n = reaction order; and k = rate constant.
The rate constant, k can be expressed using the Arrhenius equation, as a function of the pre-exponential
factor (A), the activation energy (Ea), and temperature (T): − = × × (4)
Energies 2014, 7 553
This equation can be then linearized [26] as follows: −1− × = − R + × −− (5)
where Wo = initial sample weight, mg; Wf = final sample weight, mg.
Multiple linear regression (using Microsoft® Excel 2010) was used to extract the values of
activation energy, reaction order and pre-exponential factor for the raw, and the carbonized samples
during the major weight loss stage, i.e., 220–400 °C [27].
3. Results and Discussion
3.1. Biochar Mass Yield as Influenced by Carbonization Temperature and Residence Time
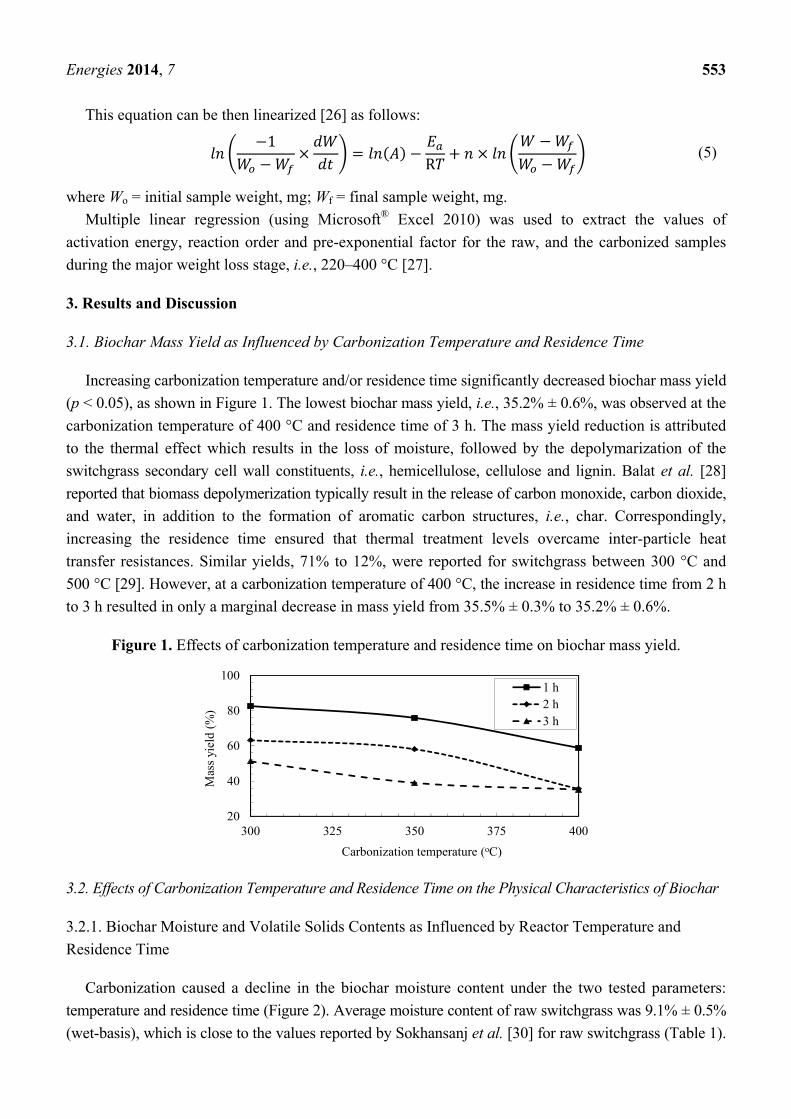
Increasing carbonization temperature and/or residence time significantly decreased biochar mass yield
(p < 0.05), as shown in Figure 1. The lowest biochar mass yield, i.e., 35.2% ± 0.6%, was observed at the
carbonization temperature of 400 °C and residence time of 3 h. The mass yield reduction is attributed
to the thermal effect which results in the loss of moisture, followed by the depolymarization of the
switchgrass secondary cell wall constituents, i.e., hemicellulose, cellulose and lignin. Balat et al. [28]
reported that biomass depolymerization typically result in the release of carbon monoxide, carbon dioxide,
and water, in addition to the formation of aromatic carbon structures, i.e., char. Correspondingly,
increasing the residence time ensured that thermal treatment levels overcame inter-particle heat
transfer resistances. Similar yields, 71% to 12%, were reported for switchgrass between 300 °C and
500 °C [29]. However, at a carbonization temperature of 400 °C, the increase in residence time from 2 h
to 3 h resulted in only a marginal decrease in mass yield from 35.5% ± 0.3% to 35.2% ± 0.6%.
Figure 1. Effects of carbonization temperature and residence time on biochar mass yield.
3.2. Effects of Carbonization Temperature and Residence Time on the Physical Characteristics of Biochar
3.2.1. Biochar Moisture and Volatile Solids Contents as Influenced by Reactor Temperature and
Residence Time
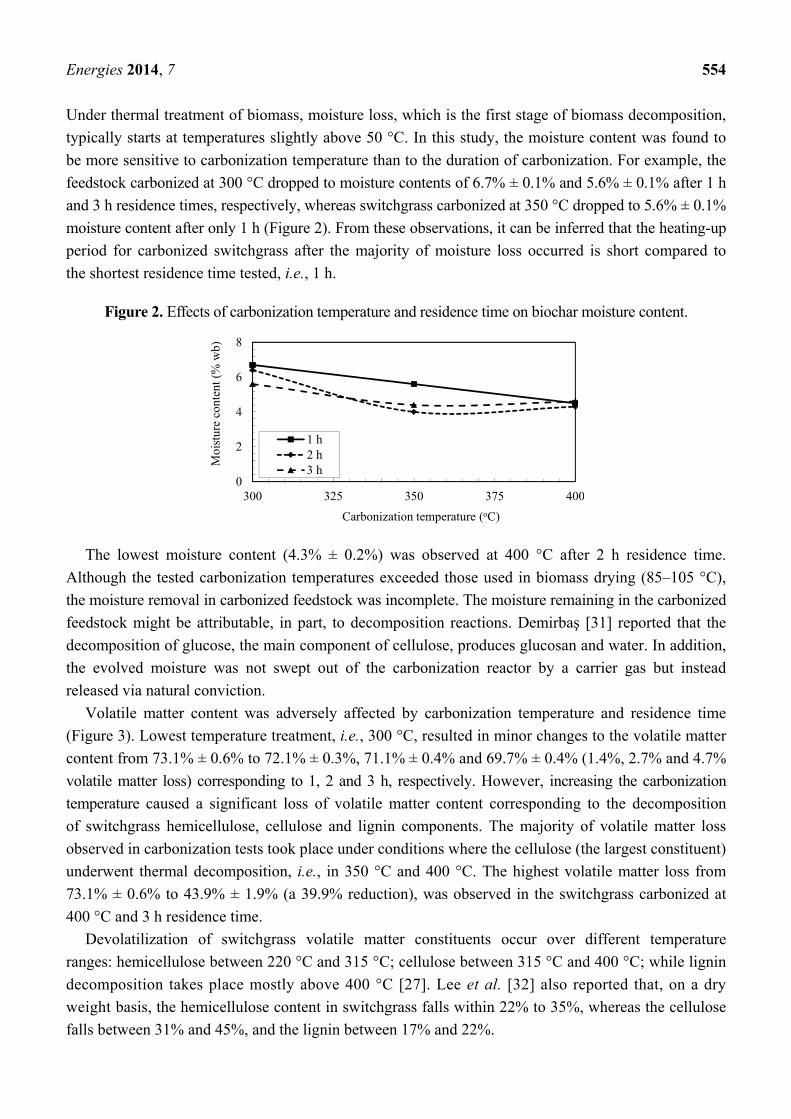
Carbonization caused a decline in the biochar moisture content under the two tested parameters:
temperature and residence time (Figure 2). Average moisture content of raw switchgrass was 9.1% ± 0.5%
(wet-basis), which is close to the values reported by Sokhansanj et al. [30] for raw switchgrass (Table 1).
20
40
60
80
100
300 325 350 375 400
Mas
s yi
eld
(%)
Carbonization temperature (oC)
1 h2 h3 h
Energies 2014, 7 554
Under thermal treatment of biomass, moisture loss, which is the first stage of biomass decomposition,
typically starts at temperatures slightly above 50 °C. In this study, the moisture content was found to
be more sensitive to carbonization temperature than to the duration of carbonization. For example, the
feedstock carbonized at 300 °C dropped to moisture contents of 6.7% ± 0.1% and 5.6% ± 0.1% after 1 h
and 3 h residence times, respectively, whereas switchgrass carbonized at 350 °C dropped to 5.6% ± 0.1%
moisture content after only 1 h (Figure 2). From these observations, it can be inferred that the heating-up
period for carbonized switchgrass after the majority of moisture loss occurred is short compared to
the shortest residence time tested, i.e., 1 h.
Figure 2. Effects of carbonization temperature and residence time on biochar moisture content.
The lowest moisture content (4.3% ± 0.2%) was observed at 400 °C after 2 h residence time.
Although the tested carbonization temperatures exceeded those used in biomass drying (85–105 °C),
the moisture removal in carbonized feedstock was incomplete. The moisture remaining in the carbonized
feedstock might be attributable, in part, to decomposition reactions. Demirbaş [31] reported that the
decomposition of glucose, the main component of cellulose, produces glucosan and water. In addition,
the evolved moisture was not swept out of the carbonization reactor by a carrier gas but instead
released via natural conviction.
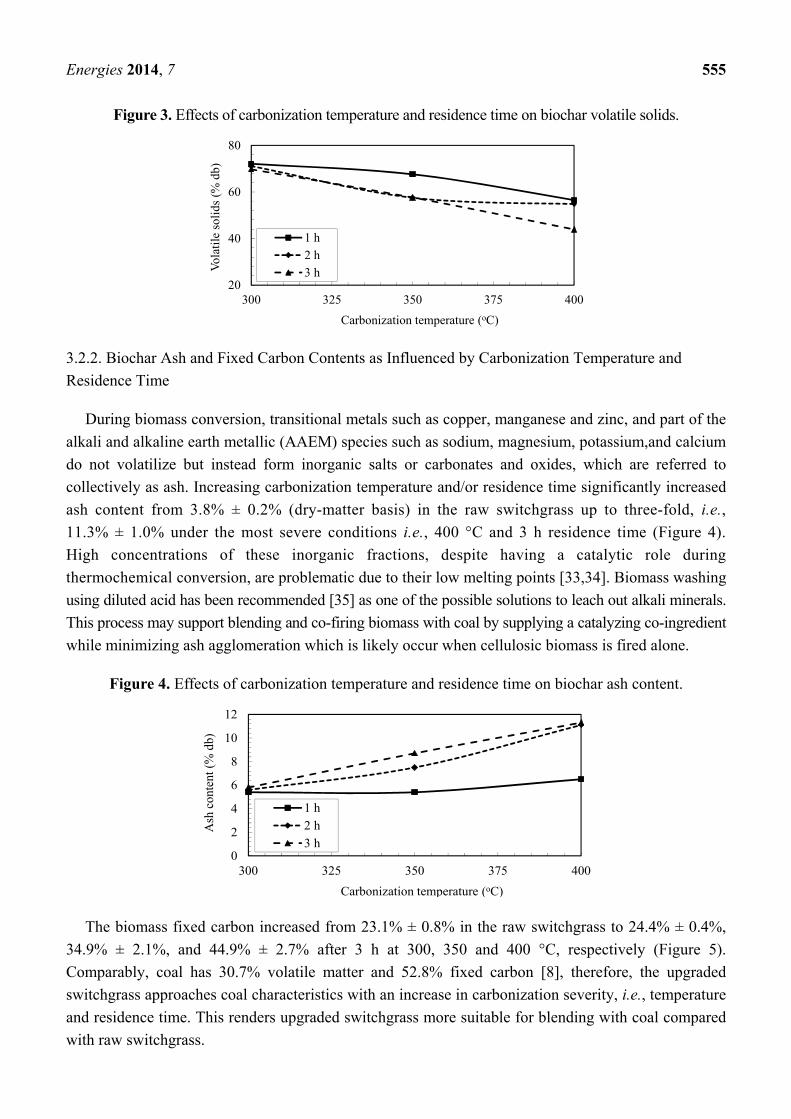
Volatile matter content was adversely affected by carbonization temperature and residence time
(Figure 3). Lowest temperature treatment, i.e., 300 °C, resulted in minor changes to the volatile matter
content from 73.1% ± 0.6% to 72.1% ± 0.3%, 71.1% ± 0.4% and 69.7% ± 0.4% (1.4%, 2.7% and 4.7%
volatile matter loss) corresponding to 1, 2 and 3 h, respectively. However, increasing the carbonization
temperature caused a significant loss of volatile matter content corresponding to the decomposition
of switchgrass hemicellulose, cellulose and lignin components. The majority of volatile matter loss
observed in carbonization tests took place under conditions where the cellulose (the largest constituent)
underwent thermal decomposition, i.e., in 350 °C and 400 °C. The highest volatile matter loss from
73.1% ± 0.6% to 43.9% ± 1.9% (a 39.9% reduction), was observed in the switchgrass carbonized at
400 °C and 3 h residence time.
Devolatilization of switchgrass volatile matter constituents occur over different temperature
ranges: hemicellulose between 220 °C and 315 °C; cellulose between 315 °C and 400 °C; while lignin
decomposition takes place mostly above 400 °C [27]. Lee et al. [32] also reported that, on a dry
weight basis, the hemicellulose content in switchgrass falls within 22% to 35%, whereas the cellulose
falls between 31% and 45%, and the lignin between 17% and 22%.
0
2
4
6
8
300 325 350 375 400
Moi
stur
e co
nten
t (%
wb)
Carbonization temperature (oC)
1 h2 h3 h
Energies 2014, 7 555
Figure 3. Effects of carbonization temperature and residence time on biochar volatile solids.
3.2.2. Biochar Ash and Fixed Carbon Contents as Influenced by Carbonization Temperature and
Residence Time
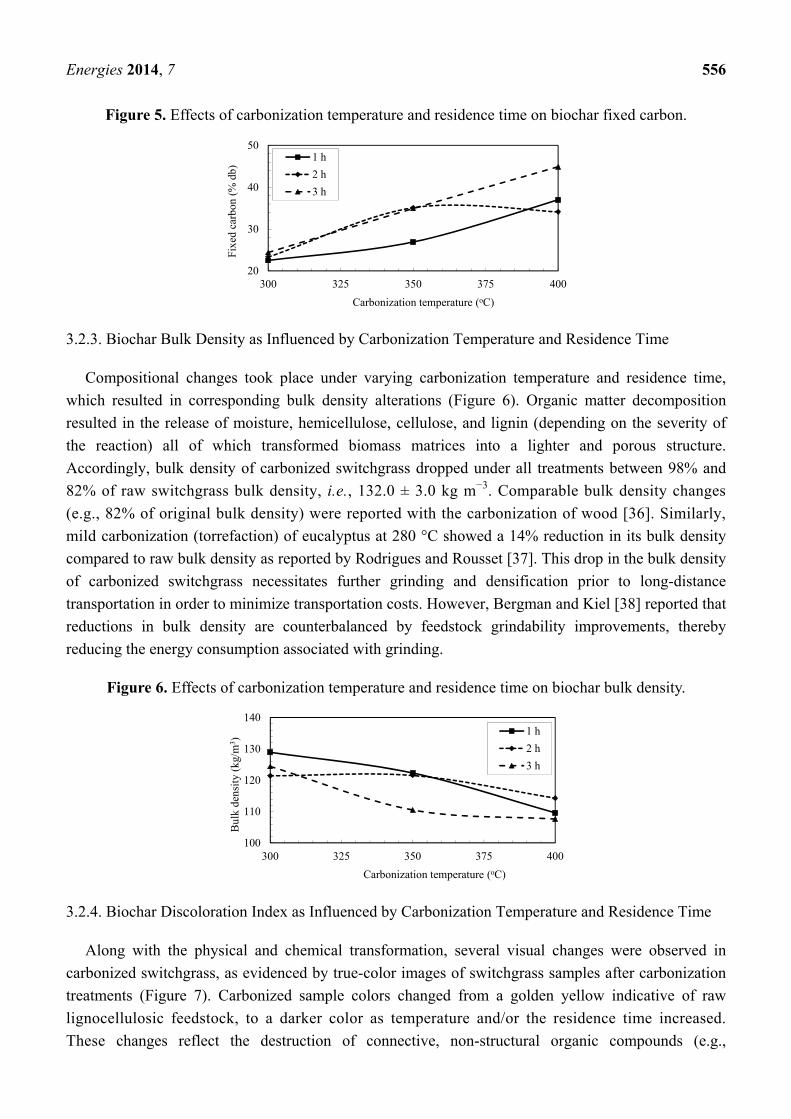
During biomass conversion, transitional metals such as copper, manganese and zinc, and part of the
alkali and alkaline earth metallic (AAEM) species such as sodium, magnesium, potassium,and calcium
do not volatilize but instead form inorganic salts or carbonates and oxides, which are referred to
collectively as ash. Increasing carbonization temperature and/or residence time significantly increased
ash content from 3.8% ± 0.2% (dry-matter basis) in the raw switchgrass up to three-fold, i.e.,
11.3% ± 1.0% under the most severe conditions i.e., 400 °C and 3 h residence time (Figure 4).
High concentrations of these inorganic fractions, despite having a catalytic role during
thermochemical conversion, are problematic due to their low melting points [33,34]. Biomass washing
using diluted acid has been recommended [35] as one of the possible solutions to leach out alkali minerals.
This process may support blending and co-firing biomass with coal by supplying a catalyzing co-ingredient
while minimizing ash agglomeration which is likely occur when cellulosic biomass is fired alone.
Figure 4. Effects of carbonization temperature and residence time on biochar ash content.
The biomass fixed carbon increased from 23.1% ± 0.8% in the raw switchgrass to 24.4% ± 0.4%,
34.9% ± 2.1%, and 44.9% ± 2.7% after 3 h at 300, 350 and 400 °C, respectively (Figure 5).
Comparably, coal has 30.7% volatile matter and 52.8% fixed carbon [8], therefore, the upgraded
switchgrass approaches coal characteristics with an increase in carbonization severity, i.e., temperature
and residence time. This renders upgraded switchgrass more suitable for blending with coal compared
with raw switchgrass.
20
40
60
80
300 325 350 375 400
Vol
atil
e so
lids
(%
db)
Carbonization temperature (oC)
1 h
2 h
3 h
0
2
4
6
8
10
12
300 325 350 375 400
Ash
con
tent
(%
db)
Carbonization temperature (oC)
1 h
2 h
3 h
Energies 2014, 7 556
Figure 5. Effects of carbonization temperature and residence time on biochar fixed carbon.
3.2.3. Biochar Bulk Density as Influenced by Carbonization Temperature and Residence Time
Compositional changes took place under varying carbonization temperature and residence time,
which resulted in corresponding bulk density alterations (Figure 6). Organic matter decomposition
resulted in the release of moisture, hemicellulose, cellulose, and lignin (depending on the severity of
the reaction) all of which transformed biomass matrices into a lighter and porous structure.
Accordingly, bulk density of carbonized switchgrass dropped under all treatments between 98% and
82% of raw switchgrass bulk density, i.e., 132.0 ± 3.0 kg m−3. Comparable bulk density changes
(e.g., 82% of original bulk density) were reported with the carbonization of wood [36]. Similarly,
mild carbonization (torrefaction) of eucalyptus at 280 °C showed a 14% reduction in its bulk density
compared to raw bulk density as reported by Rodrigues and Rousset [37]. This drop in the bulk density
of carbonized switchgrass necessitates further grinding and densification prior to long-distance
transportation in order to minimize transportation costs. However, Bergman and Kiel [38] reported that
reductions in bulk density are counterbalanced by feedstock grindability improvements, thereby
reducing the energy consumption associated with grinding.
Figure 6. Effects of carbonization temperature and residence time on biochar bulk density.
3.2.4. Biochar Discoloration Index as Influenced by Carbonization Temperature and Residence Time
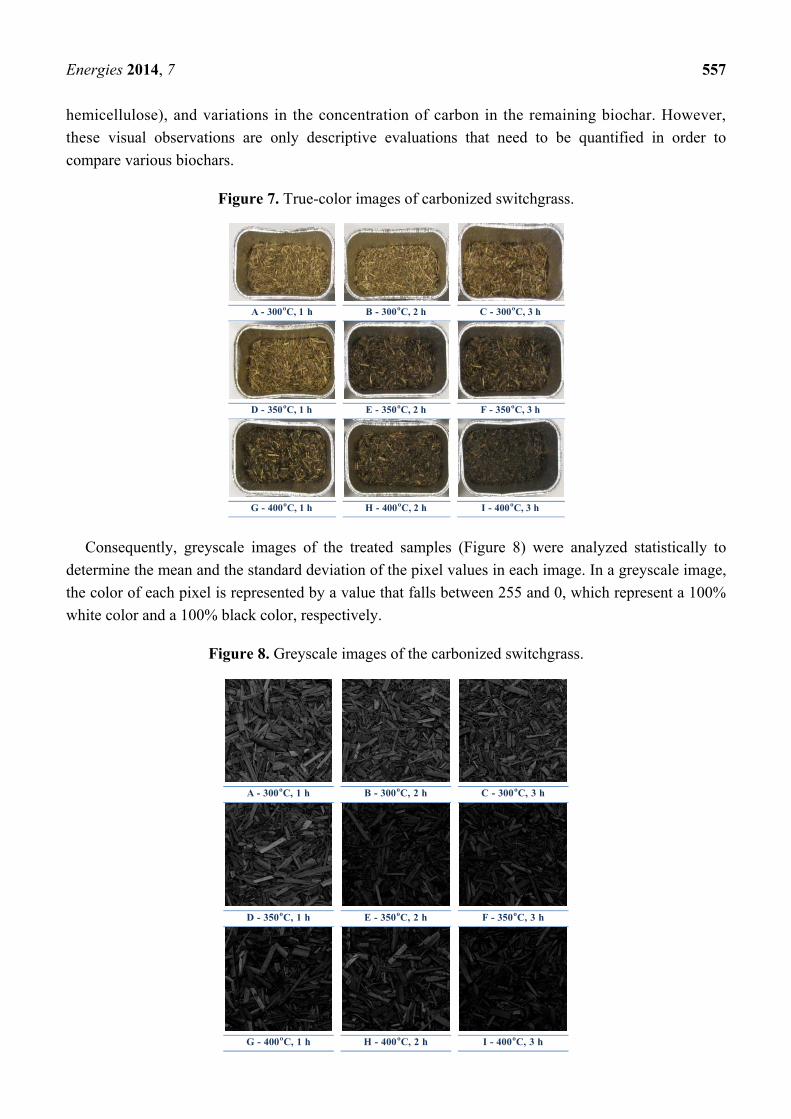
Along with the physical and chemical transformation, several visual changes were observed in
carbonized switchgrass, as evidenced by true-color images of switchgrass samples after carbonization
treatments (Figure 7). Carbonized sample colors changed from a golden yellow indicative of raw
lignocellulosic feedstock, to a darker color as temperature and/or the residence time increased.
These changes reflect the destruction of connective, non-structural organic compounds (e.g.,
20
30
40
50
300 325 350 375 400
Fixe
d ca
rbon
(%
db)
Carbonization temperature (oC)
1 h
2 h
3 h
100
110
120
130
140
300 325 350 375 400
Bul
k de
nsit
y (k
g/m
3 )
Carbonization temperature (oC)
1 h
2 h
3 h
Energies 2014, 7 557
hemicellulose), and variations in the concentration of carbon in the remaining biochar. However,
these visual observations are only descriptive evaluations that need to be quantified in order to
compare various biochars.
Figure 7. True-color images of carbonized switchgrass.
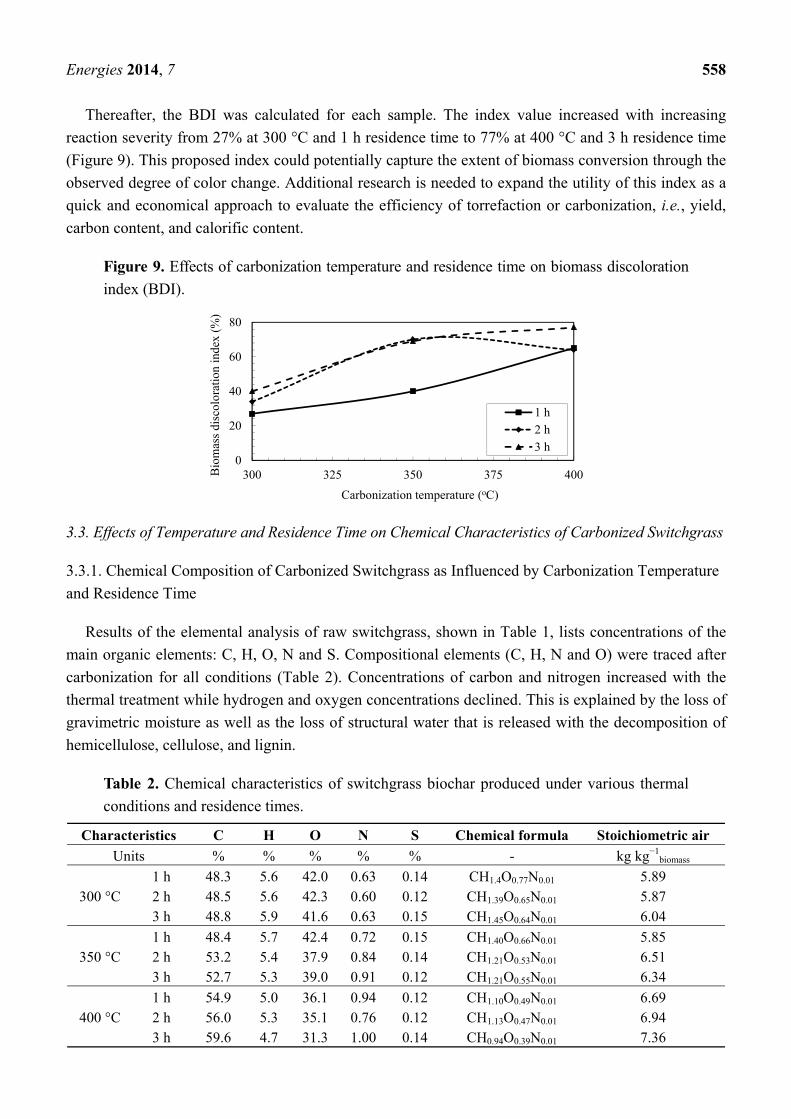
Consequently, greyscale images of the treated samples (Figure 8) were analyzed statistically to
determine the mean and the standard deviation of the pixel values in each image. In a greyscale image,
the color of each pixel is represented by a value that falls between 255 and 0, which represent a 100%
white color and a 100% black color, respectively.
Figure 8. Greyscale images of the carbonized switchgrass.
A - 300oC, 1 h B - 300oC, 2 h C - 300oC, 3 h
D - 350oC, 1 h E - 350oC, 2 h F - 350oC, 3 h
G - 400oC, 1 h H - 400oC, 2 h I - 400oC, 3 h
A - 300oC, 1 h B - 300oC, 2 h C - 300oC, 3 h
D - 350oC, 1 h E - 350oC, 2 h F - 350oC, 3 h
G - 400oC, 1 h H - 400oC, 2 h I - 400oC, 3 h
Energies 2014, 7 558
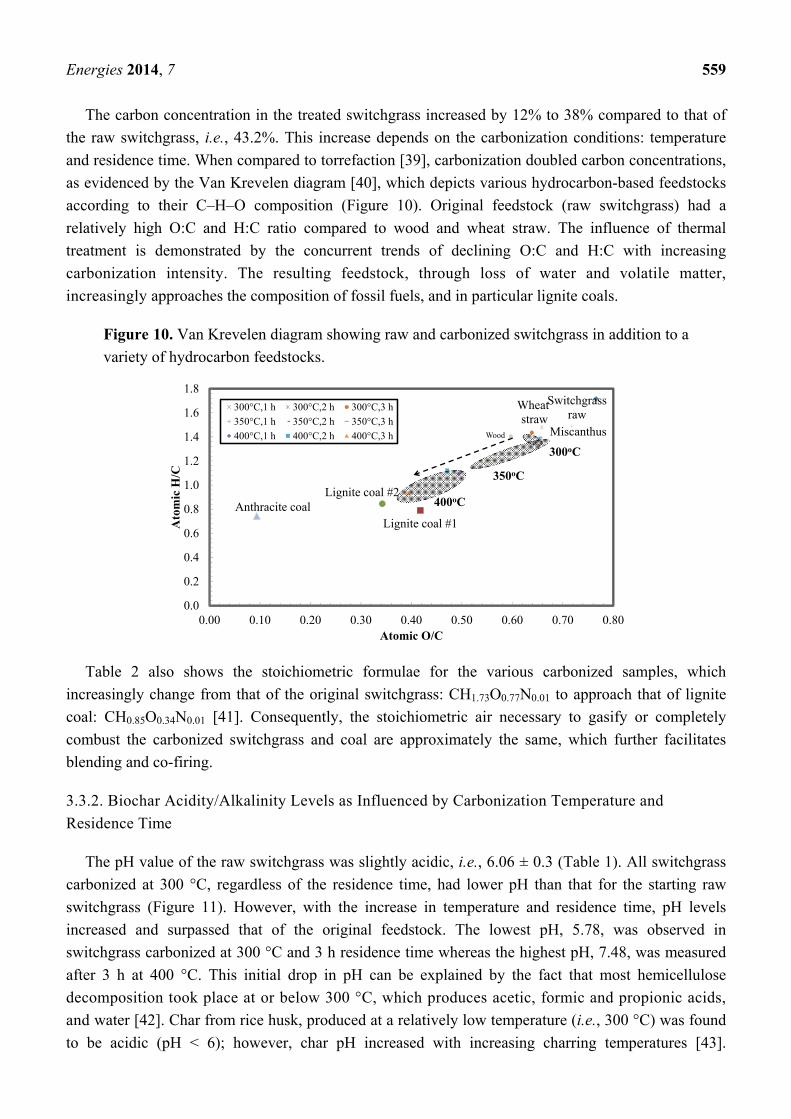
Thereafter, the BDI was calculated for each sample. The index value increased with increasing
reaction severity from 27% at 300 °C and 1 h residence time to 77% at 400 °C and 3 h residence time
(Figure 9). This proposed index could potentially capture the extent of biomass conversion through the
observed degree of color change. Additional research is needed to expand the utility of this index as a
quick and economical approach to evaluate the efficiency of torrefaction or carbonization, i.e., yield,
carbon content, and calorific content.
Figure 9. Effects of carbonization temperature and residence time on biomass discoloration
index (BDI).
3.3. Effects of Temperature and Residence Time on Chemical Characteristics of Carbonized Switchgrass
3.3.1. Chemical Composition of Carbonized Switchgrass as Influenced by Carbonization Temperature
and Residence Time
Results of the elemental analysis of raw switchgrass, shown in Table 1, lists concentrations of the
main organic elements: C, H, O, N and S. Compositional elements (C, H, N and O) were traced after
carbonization for all conditions (Table 2). Concentrations of carbon and nitrogen increased with the
thermal treatment while hydrogen and oxygen concentrations declined. This is explained by the loss of
gravimetric moisture as well as the loss of structural water that is released with the decomposition of
hemicellulose, cellulose, and lignin.
Table 2. Chemical characteristics of switchgrass biochar produced under various thermal
conditions and residence times.
Characteristics C H O N S Chemical formula Stoichiometric air
Units % % % % % - kg kg−1biomass
300 °C 1 h 48.3 5.6 42.0 0.63 0.14 CH1.4O0.77N0.01 5.89 2 h 48.5 5.6 42.3 0.60 0.12 CH1.39O0.65N0.01 5.87 3 h 48.8 5.9 41.6 0.63 0.15 CH1.45O0.64N0.01 6.04
350 °C 1 h 48.4 5.7 42.4 0.72 0.15 CH1.40O0.66N0.01 5.85 2 h 53.2 5.4 37.9 0.84 0.14 CH1.21O0.53N0.01 6.51 3 h 52.7 5.3 39.0 0.91 0.12 CH1.21O0.55N0.01 6.34
400 °C 1 h 54.9 5.0 36.1 0.94 0.12 CH1.10O0.49N0.01 6.69 2 h 56.0 5.3 35.1 0.76 0.12 CH1.13O0.47N0.01 6.94 3 h 59.6 4.7 31.3 1.00 0.14 CH0.94O0.39N0.01 7.36
0
20
40
60
80
300 325 350 375 400Bio
mas
s di
scol
orat
ion
inde
x (%
)
Carbonization temperature (oC)
1 h
2 h
3 h
Energies 2014, 7 559
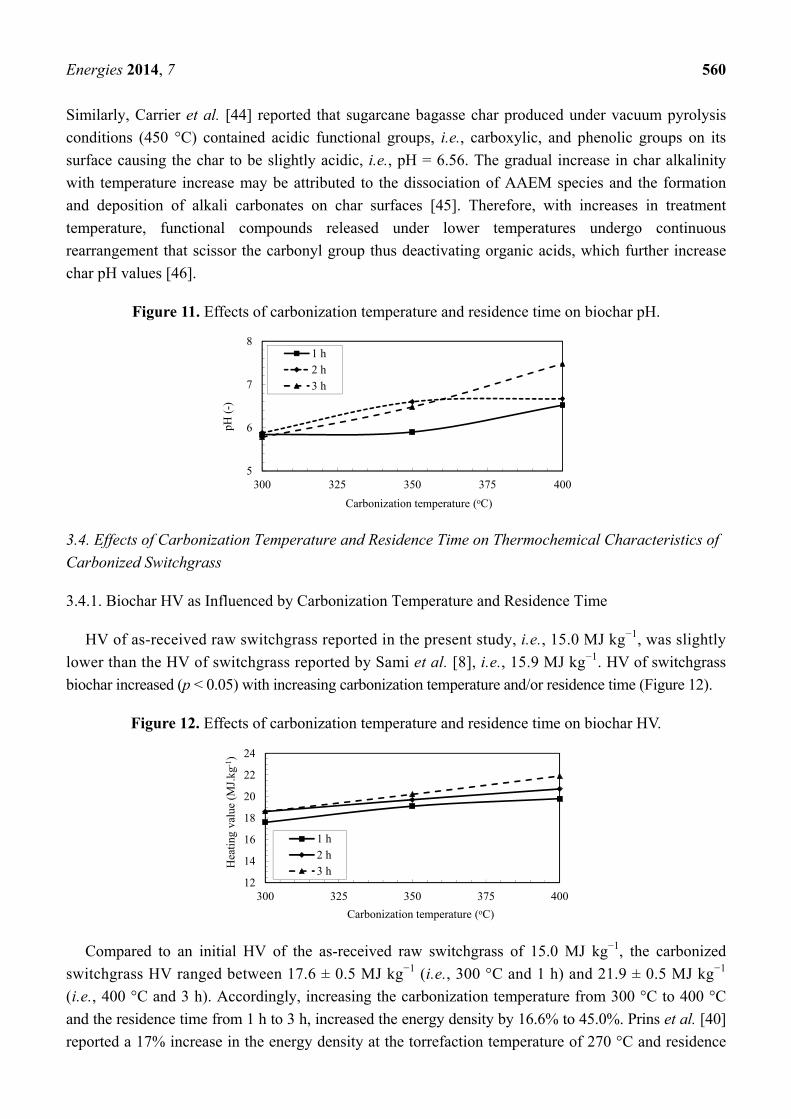
The carbon concentration in the treated switchgrass increased by 12% to 38% compared to that of
the raw switchgrass, i.e., 43.2%. This increase depends on the carbonization conditions: temperature
and residence time. When compared to torrefaction [39], carbonization doubled carbon concentrations,
as evidenced by the Van Krevelen diagram [40], which depicts various hydrocarbon-based feedstocks
according to their C–H–O composition (Figure 10). Original feedstock (raw switchgrass) had a
relatively high O:C and H:C ratio compared to wood and wheat straw. The influence of thermal
treatment is demonstrated by the concurrent trends of declining O:C and H:C with increasing
carbonization intensity. The resulting feedstock, through loss of water and volatile matter,
increasingly approaches the composition of fossil fuels, and in particular lignite coals.
Figure 10. Van Krevelen diagram showing raw and carbonized switchgrass in addition to a
variety of hydrocarbon feedstocks.
Table 2 also shows the stoichiometric formulae for the various carbonized samples, which
increasingly change from that of the original switchgrass: CH1.73O0.77N0.01 to approach that of lignite
coal: CH0.85O0.34N0.01 [41]. Consequently, the stoichiometric air necessary to gasify or completely
combust the carbonized switchgrass and coal are approximately the same, which further facilitates
blending and co-firing.
3.3.2. Biochar Acidity/Alkalinity Levels as Influenced by Carbonization Temperature and
Residence Time
The pH value of the raw switchgrass was slightly acidic, i.e., 6.06 ± 0.3 (Table 1). All switchgrass
carbonized at 300 °C, regardless of the residence time, had lower pH than that for the starting raw
switchgrass (Figure 11). However, with the increase in temperature and residence time, pH levels
increased and surpassed that of the original feedstock. The lowest pH, 5.78, was observed in
switchgrass carbonized at 300 °C and 3 h residence time whereas the highest pH, 7.48, was measured
after 3 h at 400 °C. This initial drop in pH can be explained by the fact that most hemicellulose
decomposition took place at or below 300 °C, which produces acetic, formic and propionic acids,
and water [42]. Char from rice husk, produced at a relatively low temperature (i.e., 300 °C) was found
to be acidic (pH < 6); however, char pH increased with increasing charring temperatures [43].
Switchgrassraw
Lignite coal #1
Lignite coal #2Anthracite coal
Wheatstraw
Wood Miscanthus
0.0
0.2
0.4
0.6
0.8
1.0
1.2
1.4
1.6
1.8
0.00 0.10 0.20 0.30 0.40 0.50 0.60 0.70 0.80
Ato
mic
H/C
Atomic O/C
300°C,1 h 300°C,2 h 300°C,3 h
350°C,1 h 350°C,2 h 350°C,3 h
400°C,1 h 400°C,2 h 400°C,3 h
350oC
400oC
300oC
Energies 2014, 7 560
Similarly, Carrier et al. [44] reported that sugarcane bagasse char produced under vacuum pyrolysis
conditions (450 °C) contained acidic functional groups, i.e., carboxylic, and phenolic groups on its
surface causing the char to be slightly acidic, i.e., pH = 6.56. The gradual increase in char alkalinity
with temperature increase may be attributed to the dissociation of AAEM species and the formation
and deposition of alkali carbonates on char surfaces [45]. Therefore, with increases in treatment
temperature, functional compounds released under lower temperatures undergo continuous
rearrangement that scissor the carbonyl group thus deactivating organic acids, which further increase
char pH values [46].
Figure 11. Effects of carbonization temperature and residence time on biochar pH.
3.4. Effects of Carbonization Temperature and Residence Time on Thermochemical Characteristics of
Carbonized Switchgrass
3.4.1. Biochar HV as Influenced by Carbonization Temperature and Residence Time
HV of as-received raw switchgrass reported in the present study, i.e., 15.0 MJ kg−1, was slightly
lower than the HV of switchgrass reported by Sami et al. [8], i.e., 15.9 MJ kg−1. HV of switchgrass
biochar increased (p < 0.05) with increasing carbonization temperature and/or residence time (Figure 12).
Figure 12. Effects of carbonization temperature and residence time on biochar HV.
Compared to an initial HV of the as-received raw switchgrass of 15.0 MJ kg−1, the carbonized
switchgrass HV ranged between 17.6 ± 0.5 MJ kg−1 (i.e., 300 °C and 1 h) and 21.9 ± 0.5 MJ kg−1
(i.e., 400 °C and 3 h). Accordingly, increasing the carbonization temperature from 300 °C to 400 °C
and the residence time from 1 h to 3 h, increased the energy density by 16.6% to 45.0%. Prins et al. [40]
reported a 17% increase in the energy density at the torrefaction temperature of 270 °C and residence
5
6
7
8
300 325 350 375 400
pH (
-)
Carbonization temperature (oC)
1 h
2 h
3 h
12
14
16
18
20
22
24
300 325 350 375 400
Hea
ting
val
ue (
MJ.
kg-1
)
Carbonization temperature (oC)
1 h
2 h3 h
Energies 2014, 7 561
time of 15 min. Increases in the calorific value of biochars may be attributed to the decomposition of
hemicellulose and cellulose. Reportedly, based on calorific values, lignin possess the highest energy
content per unit mass of switchgrass (23.3–27.0 MJ kg−1), followed by cellulose (18.6 MJ kg−1),
then hemicellulose (13.6 MJ kg−1) [47,48]. Therefore, the carbonization process is, in essence, an energy
densification step in which the low energy density components are volatized, with the remaining
material containing more energy per unit mass.
Dissimilar to most pyrolysis studies, volatilized species were not readily purged from the
carbonization chamber, therefore, these species might have acted here as oxygen-donors causing
partial oxidation to the solid fraction. The biochar HV reported herein were lower than those reported
in previous studies, i.e., 300 °C via pyrolysis, which had a HHV of 24.5 MJ kg−1 [49]. The lower
energy content range observed in this study may be in part due to the low HV of raw switchgrass
compared to the one in the cited study (20.7 MJ kg−1), likely due to the great phenotypic variation in
this species. In addition, the HV determined in the present study for the raw switchgrass and the
produced biochar were reported for as-received and as-produced feedstock, respectively. Raw switchgrass
contain 9.1% moisture content. On the other hand, carbonized switchgrass contain between 6.7% and
4.0% moisture content.
Considering that carbonization entails losing a fraction of the energy embedded in volatiles,
i.e., hemicellulose, and cellulose, these losses must be accounted for when evaluating the carbonization
process. This is typically calculated by incorporating mass yield into the energy yield concept [50].
Consequently, the HV was converted to volumetric energy density by multiplying the net HV by the
biochar bulk density (Figure 13): = × ρ (6)
where HVvolumetric = volumetric heating value, MJ m−3; HVmass = heating value, MJ kg−3;
ρB = bulk density, kg m−3.
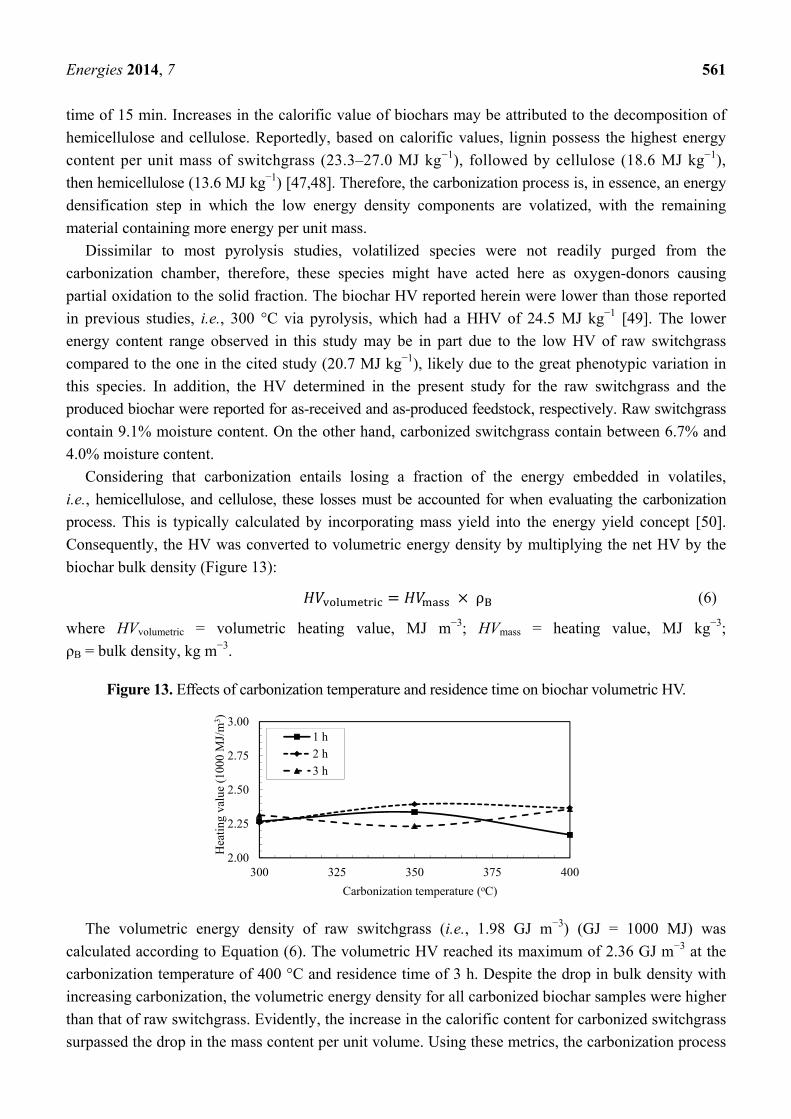
Figure 13. Effects of carbonization temperature and residence time on biochar volumetric HV.
The volumetric energy density of raw switchgrass (i.e., 1.98 GJ m−3) (GJ = 1000 MJ) was
calculated according to Equation (6). The volumetric HV reached its maximum of 2.36 GJ m−3 at the
carbonization temperature of 400 °C and residence time of 3 h. Despite the drop in bulk density with
increasing carbonization, the volumetric energy density for all carbonized biochar samples were higher
than that of raw switchgrass. Evidently, the increase in the calorific content for carbonized switchgrass
surpassed the drop in the mass content per unit volume. Using these metrics, the carbonization process
2.00
2.25
2.50
2.75
3.00
300 325 350 375 400
Hea
ting
val
ue (
1000
MJ/
m3 )
Carbonization temperature (oC)
1 h
2 h
3 h
Energies 2014, 7 562
can be considered a trade-off between an energy-dense feedstock and the energy sacrificed to obtain it.
Given that most lignocellulosic biomass has to be transported from field to a conversion facility,
the low energy density of the raw feedstock becomes a hurdle to economically feasible transportation.
However, the carbonization process followed by grinding and pelletization may help overcome this
challenge. Also, the fact that carbonization increases the biomass friability, which saves energy during
grinding thereby compensating for energy loss associated with carbonization.
3.4.2. Thermogravimetric Analysis of Raw and Carbonized Switchgrass
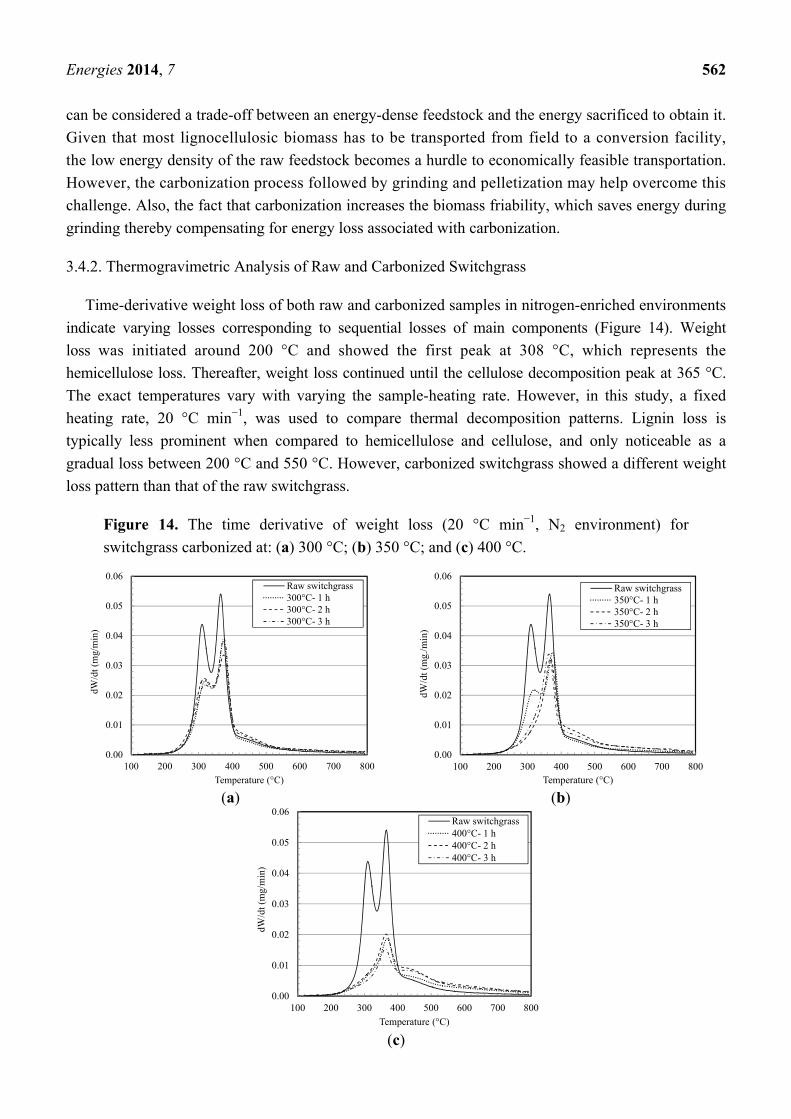
Time-derivative weight loss of both raw and carbonized samples in nitrogen-enriched environments
indicate varying losses corresponding to sequential losses of main components (Figure 14). Weight
loss was initiated around 200 °C and showed the first peak at 308 °C, which represents the
hemicellulose loss. Thereafter, weight loss continued until the cellulose decomposition peak at 365 °C.
The exact temperatures vary with varying the sample-heating rate. However, in this study, a fixed
heating rate, 20 °C min−1, was used to compare thermal decomposition patterns. Lignin loss is
typically less prominent when compared to hemicellulose and cellulose, and only noticeable as a
gradual loss between 200 °C and 550 °C. However, carbonized switchgrass showed a different weight
loss pattern than that of the raw switchgrass.
Figure 14. The time derivative of weight loss (20 °C min−1, N2 environment) for
switchgrass carbonized at: (a) 300 °C; (b) 350 °C; and (c) 400 °C.
(a) (b)
(c)
0.00
0.01
0.02
0.03
0.04
0.05
0.06
100 200 300 400 500 600 700 800
dW/d
t (m
g/m
in)
Temperature (°C)
Raw switchgrass300°C- 1 h300°C- 2 h300°C- 3 h
0.00
0.01
0.02
0.03
0.04
0.05
0.06
100 200 300 400 500 600 700 800
dW/d
t (m
g./m
in)
Temperature (°C)
Raw switchgrass350°C- 1 h350°C- 2 h350°C- 3 h
0.00
0.01
0.02
0.03
0.04
0.05
0.06
100 200 300 400 500 600 700 800
dW/d
t (m
g/m
in)
Temperature (°C)
Raw switchgrass400°C- 1 h400°C- 2 h400°C- 3 h
Energies 2014, 7 563
At the lowest carbonization temperature, i.e., 300 °C, weight loss rates dropped noticeably,
signaling losses in hemicellulose and cellulose fractions with carbonization. The loss of hemicellulose
was noticeably higher than the cellulose, as evidenced by differences in peak heights. With the
increase in carbonization temperature and residence time, hemicellulose completely disappeared
(under 350 °C and 2 h residence time), followed by a large fraction of the cellulose content. Under the
400 °C, the lignin weight loss in carbonized feedstock became noticeable in comparison to lignin loss
from the raw switchgrass. The carbonization did not result in any shift in decomposition temperatures
of the main components as evidenced by the alignment of weight loss peaks in raw and the
carbonized biomass.
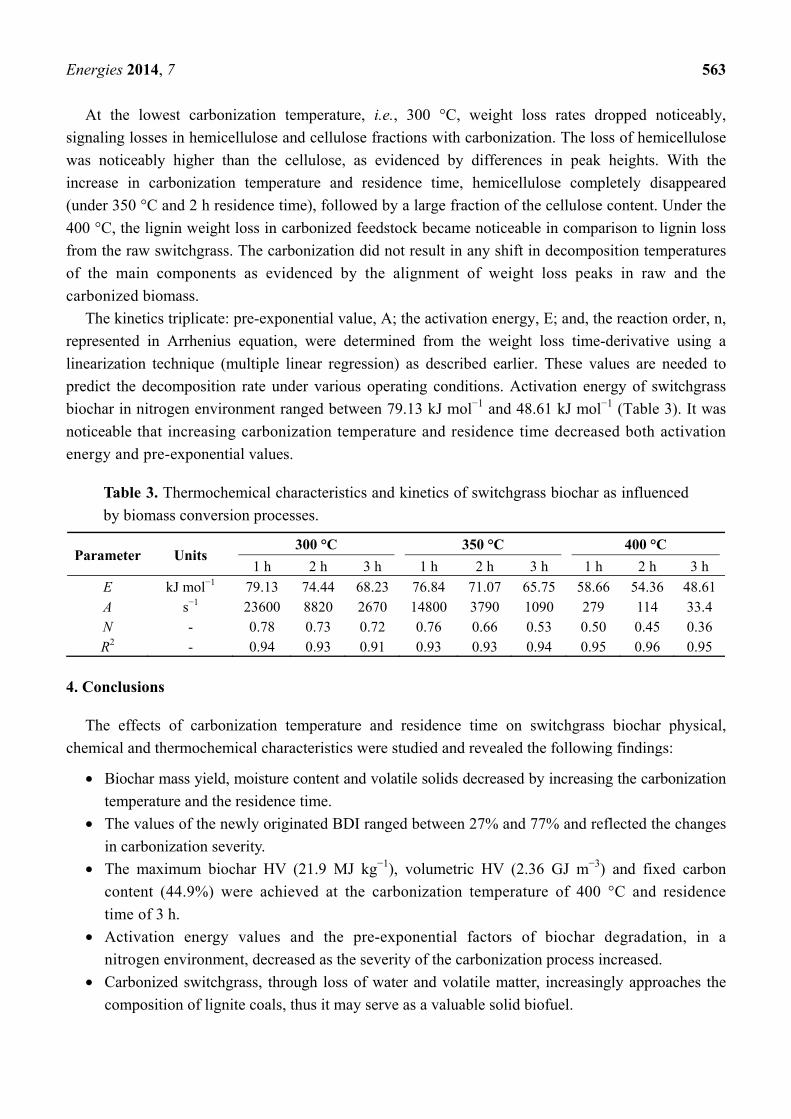
The kinetics triplicate: pre-exponential value, A; the activation energy, E; and, the reaction order, n,
represented in Arrhenius equation, were determined from the weight loss time-derivative using a
linearization technique (multiple linear regression) as described earlier. These values are needed to
predict the decomposition rate under various operating conditions. Activation energy of switchgrass
biochar in nitrogen environment ranged between 79.13 kJ mol−1 and 48.61 kJ mol−1 (Table 3). It was
noticeable that increasing carbonization temperature and residence time decreased both activation
energy and pre-exponential values.
Table 3. Thermochemical characteristics and kinetics of switchgrass biochar as influenced
by biomass conversion processes.
Parameter Units 300 °C 350 °C 400 °C
1 h 2 h 3 h 1 h 2 h 3 h 1 h 2 h 3 h
E kJ mol−1 79.13 74.44 68.23 76.84 71.07 65.75 58.66 54.36 48.61 A s−1 23600 8820 2670 14800 3790 1090 279 114 33.4 N - 0.78 0.73 0.72 0.76 0.66 0.53 0.50 0.45 0.36 R2 - 0.94 0.93 0.91 0.93 0.93 0.94 0.95 0.96 0.95
4. Conclusions
The effects of carbonization temperature and residence time on switchgrass biochar physical,
chemical and thermochemical characteristics were studied and revealed the following findings:
• Biochar mass yield, moisture content and volatile solids decreased by increasing the carbonization
temperature and the residence time.
• The values of the newly originated BDI ranged between 27% and 77% and reflected the changes
in carbonization severity.
• The maximum biochar HV (21.9 MJ kg−1), volumetric HV (2.36 GJ m−3) and fixed carbon
content (44.9%) were achieved at the carbonization temperature of 400 °C and residence
time of 3 h.
• Activation energy values and the pre-exponential factors of biochar degradation, in a
nitrogen environment, decreased as the severity of the carbonization process increased.
• Carbonized switchgrass, through loss of water and volatile matter, increasingly approaches the
composition of lignite coals, thus it may serve as a valuable solid biofuel.
Energies 2014, 7 564
Acknowledgments
Authors of this paper would like to express gratitude to the United States Department of
Agriculture (USDA), Sun Grant for partial funding for this research.
Conflicts of Interest
The authors declare no conflict of interest.
References
1. McLaughlin, S.; Walsh, M. Evaluating environmental consequences of producing herbaceous
crops for bioenergy. Biomass Bioenergy 1998, 14, 317–324.
2. Kiniry, J.; Cassida, K.; Hussey, M.; Muir, J.; Ocumpaugh, W.; Read, J.; Reed, R.; Sanderson, M.;
Venuto, B.; Williams, J. Switchgrass simulation by the ALMANAC model at diverse sites in the
southern US. Biomass Bioenergy 2005, 29, 419–425.
3. Lemus, R.; Brummer, E.C.; Moore, K.J.; Molstad, N.E.; Burras, C.L.; Barker, M.F. Biomass yield
and quality of 20 switchgrass populations in southern Iowa, USA. Biomass Bioenergy 2002, 23,
433–442.
4. Boateng, A.A.; Daugaard, D.E.; Goldberg, N.M.; Hicks, K.B. Bench-scale fluidized-bed pyrolysis
of switchgrass for bio-oil production. Ind. Eng. Chem. Res. 2007, 46, 1891–1897.
5. He, R.; Ye, X.P.; English, B.C.; Satrio, J.A. Influence of pyrolysis condition on switchgrass
bio-oil yield and physicochemical properties. Bioresour. Technol. 2009, 100, 5305–5311.
6. Ragland, K.; Aerts, D.; Baker, A. Properties of wood for combustion analysis. Bioresour. Technol.
1991, 37, 161–168.
7. Sweeten, J.; Heflin, K.; Auvermann, B.; Annamalai, K.; McCollum, F. Combustion fuel
properties of manure and compost from paved and unpaved cattle feedlots as modified by
annual precipitation. Trans. ASABE 2013, 56, 279–294.
8. Sami, M.; Annamalai, K.; Wooldridge, M. Co-firing of coal and biomass fuel blends. Prog. Energy
Combust. Sci. 2001, 27, 171–214.
9. Meyer, S.; Glaser, B.; Quicker, P. Technical, economical, and climate-related aspects of biochar
production technologies: A literature review. Environ. Sci. Technol. 2011, 45, 9473–9483.
10. Imam, T.; Capareda, S. Characterization of bio-oil, syn-gas and bio-char from switchgrass
pyrolysis at various temperatures. J. Anal. Appl. Pyrolysis 2012, 93, 170–177.
11. Agblevor, F.A.; Besler, S. Inorganic compounds in biomass feedstocks. 1. Effect on the quality of
fast pyrolysis oils. Energy Fuels 1996, 10, 293–298.
12. Sadaka, S.; Negi, S. Improvements of biomass physical and thermochemical characteristics via
torrefaction process. Environ. Prog. Sustain. Energy 2009, 28, 427–434.
13. Hill, S.J.; Grigsby, W.J.; Hall, P.W. Chemical and cellulose crystallite changes in Pinus radiata
during torrefaction. Biomass Bioenergy 2013, 56, 92–98.
14. Lipinsky, E.S.; Arcate, J.R.; Reed, T.B. Enhanced wood fuels via torrefaction. Fuel Chem. Div. Prepr.
2002, 47, 408–410.
Energies 2014, 7 565
15. Verma, M.; Godbout, S.; Brar, S.K.; Solomatnikova, O.; Lemay, S.P.; Larouche, J.P. Biofuels
production frombiomass by thermochemical conversion technologies. Int. J. Chem. Eng. 2012,
2012, doi:10.1155/2012/542426.
16. Toole, A.W.; Lane, P.H.; Arbogast, C., Jr.; Smith, W.R.; Peter, R. Charcoal: Production, Marketing,
and Use; Forest Products Laboratory: Madison, WI, USA, 1961.
17. Brewer, C.; Schmidt-Rohr, K.; Satrio, J.; Brown, R. Characterization of biochar from fast
pyrolysis and gasification systems. Environ. Prog. Sustain. Energy 2009, 28, 386–396.
18. Malghani, S.; Gleixner, G.; Trumbore, S.E. Chars produced by slow pyrolysis and hydrothermal
carbonization vary in carbon sequestration potential and greenhouse gases emissions. Soil Biol.
Biochem. 2013, 62, 137–146.
19. American Society for Testing and Materials (ASTM). Standard Test Methods for Moisture, Ash,
and Organic Matter of Peat and Other Organic Soils; ASTM D2974-07a; ASTM International:
West Conshohocken, PA, USA, 2007.
20. U.S. Environmental Protection Agency (USEPA). Total, Fixed and Volatile Solids in Water,
Solids and Biosolids; EPA-821-R-01-015; Water Resource Center: Washington, DC, USA, 2001.
21. American Society for Testing and Materials (ASTM). Standard Test Method for Ash in the
Analysis Sample of Coal and Coke from Coal; ASTM D3174-12; ASTM International: West
Conshohocken, PA, USA, 2012.
22. American Society for Testing and Materials (ASTM). Standard Test Method for Bulk Density of
Densified Particulate Biomass Fuels; ASTM E873-82; ASTM International: West Conshohocken,
PA, USA, 1998.
23. American Society for Testing and Materials (ASTM). Standard Test Methods for Instrumental
Determination of Carbon, Hydrogen, and Nitrogen in Laboratory Samples of Coal; ASTM
D5373-08; ASTM International: West Conshohocken, PA, USA, 2008.
24. American Society for Testing and Materials (ASTM). Standard Test Method for Determination of
Major and Minor Elements in Coal, Coke, and Solid Residues from Combustion of Coal and
Coke by Inductively Coupled Plasma—Atomic Emission Spectrometry; ASTM D6349-09;
ASTM International: West Conshohocken, PA, USA, 2009.
25. American Society for Testing and Materials (ASTM). Standard Test Method for Gross Calorific
Value of Coal and Coke; ASTM D5865-12; ASTM International: West Conshohocken, PA,
USA, 2012.
26. Kumar, A.; Wang, L.; Dzenis, Y.A.; Jones, D.D.; Hanna, M.A. Thermogravimetric characterization
of corn stover as gasification and pyrolysis feedstock. Biomass Bioenergy 2008, 32, 460–467.
27. Yang, H.; Yan, R.; Chen, H.; Zheng, C.; Lee, D.H.; Liang, D.T. In-depth investigation of biomass
pyrolysis based on three major components: Hemicellulose, cellulose and lignin. Energy Fuels
2006, 20, 388–393.
28. Balat, M.; Balat, M.; Kırtay, E.; Balat, H. Main routes for the thermo-conversion of biomass into
fuels and chemicals. Part 1: Pyrolysis systems. Energy Convers. Manag. 2009, 50, 3147–3157.
29. Pilon, G.; Lavoie, J. Characterization of switchgrass char produced in torrefaction and pyrolysis
conditions. BioResources 2011, 6, 4824–4839.
Energies 2014, 7 566
30. Sokhansanj, S.; Mani, S.; Turhollow, A.; Kumar, A.; Bransby, D.; Lynd, L.; Laser, M. Large-scale
production, harvest and logistics of switchgrass (Panicum virgatum L.)—Current technology and
envisioning a mature technology. Biofuels Bioprod. Biorefin. 2009, 3, 124–141.
31. Demirbaş, A. Mechanisms of liquefaction and pyrolysis reactions of biomass. Energy Convers.
Manag. 2000, 41, 633–646.
32. Lee, D.; Owens, V.N.; Boe, A.; Jeranyama, P. Composition of Herbaceous Biomass Feedstocks;
North Central Sun Grant Center, South Dakota State University: Brookings, SD, USA, 2007.
33. Jenkins, B.; Baxter, L.; Miles, T., Jr.; Miles, T. Combustion properties of biomass. Fuel Process.
Technol. 1998, 54, 17–46.
34. Wang, J.; Zhang, M.; Chen, M.; Min, F.; Zhang, S.; Ren, Z.; Yan, Y. Catalytic effects of six
inorganic compounds on pyrolysis of three kinds of biomass. Thermochim. Acta 2006, 444, 110–114.
35. Thompson, D.N.; Shaw, P.G.; Lacey, J.A. Post-harvest processing methods for reduction of silica
and alkali metals in wheat straw. Appl. Biochem. Biotechnol. 2003, 105, 205–218.
36. Byrne, C.E.; Nagle, D.C. Carbonization of wood for advanced materials applications. Carbon
1997, 35, 259–266.
37. Rodrigues, T.O.; Rousset, P.L.A. Effects of torrefaction on energy properties of Eucalyptus
grandis wood. Cerne 2009, 15, 446–452.
38. Bergman, P.C.; Kiel, J.H. Torrefaction for Biomass Upgrading. In Proceedings of the 14th
European Biomass Conference and Exhibition, Paris, France, 17–21 October 2005.
39. Bridgeman, T.; Jones, J.; Shield, I.; Williams, P. Torrefaction of reed canary grass, wheat straw
and willow to enhance solid fuel qualities and combustion properties. Fuel 2008, 87, 844–856.
40. Prins, M.J.; Ptasinski, K.J.; Janssen, F.J. More efficient biomass gasification via torrefaction.
Energy 2006, 31, 3458–3470.
41. Energy Research Center of the Netherlands (ECN). Phyllis2, Database for Biomass and Waste;
ECN: Petten, The Netherlands, 2012.
42. Demirbas, A. The influence of temperature on the yields of compounds existing in bio-oils
obtained from biomass samples via pyrolysis. Fuel Process. Technol. 2007, 88, 591–597.
43. Maiti, S.; Dey, S.; Purakayastha, S.; Ghosh, B. Physical and thermochemical characterization of
rice husk char as a potential biomass energy source. Bioresour. Technol. 2006, 97, 2065–2070.
44. Carrier, M.; Hardie, A.G.; Uras, Ü.; Görgens, J.; Knoetze, J.H. Production of char from vacuum
pyrolysis of South-African sugar cane bagasse and its characterization as activated carbon and
biochar. J. Anal. Appl. Pyrolysis 2012, 96, 24–32.
45. Yuan, J.; Xu, R.; Zhang, H. The forms of alkalis in the biochar produced from crop residues at
different temperatures. Bioresour. Technol. 2011, 102, 3488–3497.
46. Pastorova, I.; Botto, R.E.; Arisz, P.W.; Boon, J.J. Cellulose char structure: A combined analytical
Py-GC-MS, FTIR, and NMR study. Carbohydr. Res. 1994, 262, 27–47.
47. Sheng, C.; Azevedo, J. Estimating the higher heating value of biomass fuels from basic analysis data.
Biomass Bioenergy 2005, 28, 499–507.
48. Van Heiningen, A. Converting a kraft pulp mill into an integrated forest biorefinery. Pulp Pap. Can.
2006, 107, 38–43.
49. Pilon, G.; Lavoie, J. Pyrolysis of switchgrass (Panicum virgatum L.) at low temperatures within
N2 and CO2 environments: Product yield study. ACS Sustain. Chem. Eng. 2012, 1, 198–204.

Energies 2014, 7 567
50. Bridgeman, T.; Jones, J.; Williams, A.; Waldron, D. An investigation of the grindability of two
torrefied energy crops. Fuel 2010, 89, 3911–3918.
© 2014 by the authors; licensee MDPI, Basel, Switzerland. This article is an open access article
distributed under the terms and conditions of the Creative Commons Attribution license
(http://creativecommons.org/licenses/by/3.0/).