Embed Size (px)
Citation preview
Characterization of aroma and flavor compounds present in lambic (gueuze) beer
Katherine A Thompson Witrick
Dissertation submitted to the faculty of the Virginia Polytechnic Institute and State
University in partial fulfillment of the requirements for the degree of
Doctor of Philosophy
In
Food Science and Technology
Sean F. O'Keefe, Chairman
Susan E. Duncan
William N. Eigel
James M. Tanko
October 29, 2012
Blacksburg, VA
Keywords: lambic beer, guezue, volatile compounds, semi-volatile compounds, acetic
acid, lactic acid, 4-ethylphenol, 4-ethylguaiacol
Copyright 2012, Katherine A Thompson Witrick
Characterization of aroma and flavor compounds present in lambic (gueuze) beer
Katherine A Thompson Witrick
ABSTRACT
Lambic beer is one of the oldest beer styles still being brewed in the western world today
and the only beer that is still brewed through spontaneous fermentation. Lambic beers are only
produced within a 500 km radius of Brussels because of the natural microflora found within the
air in that region. Little is known about the chemical composition of lambic beers. The objective
of this research were (1) to compare SPME and SAFE for the isolation of flavor and aroma
compounds, (2) determine the volatile composition and acids of commercially available lambic
gueuze using SPME/GC-MS and HPLC, and (3) determine the major aroma compounds of aging
lambic beer using GC-O. In comparing the two extraction methods, both SPME and SAFE were
able to identify a similar number of chemical compounds, however SAFE identified a greater
number of acid compounds. A total of 50 compounds were identified within the nine commercial
brands of lambic beer. HPLC was used in the identification and quantification of acetic and lactic
acid. The concentration of acetic acid for the commercial brands ranged from 723 mg/L – 1624
mg/L while lactic acid ranged 995 – 2557 mg/L. GC-O was used in the analysis of aged (3, 6, 9,
12, and 28 month) lambic beer samples. As the samples increased in age, the number of aroma
compounds detected by the panelists increased as well. Panelists were only able to detect nine
aroma compounds in the three month old sample, while seventeen compounds were detected in
the twenty eight month old sample. The research conduct increased the number of volatile and
semi-volatile compounds previously identified in lambic beer from twenty-seven up to fifty
compounds.

iii
In memory of my grandfathers
Daniel Max Thompson MD,
And
Frances John Crump
Always encouraging me to pursue my dreams and never let anything get in your way. I
know they would be very proud of me in all that I have done and will do in the future.
iv
ACKNOWLEDGEMENTS
I would like to thank my major professor, Sean O’Keefe, for all of his guidance
and patience throughout my time here at Virginia Tech. Thank you for everything. I
would also like to thank my graduate committee members, Susan Duncan, William Eigel,
and James Tanko, who have graciously provided me with their expertise and time.
Dr Russ Rouseff for allowing me the opportunity to come and use his equipment
at the University of Florida’s Citrus Research Facility in Lake Alfred.
A very special thank you to the Food Science staff, Harriet Williams and Ken
Hurly who have gladly given their time to help and advice. I would like to thank my
fellow graduate students Kevin Holland, Paul Sarnoski, Matt Boiling, and Margo
Duckson and undergraduate students Angelique Danielle and Matt Burgas who all have
been great sources of advice, encouragement, and willing to help me throughout my
research.
I would like to thank Greet Lindemans for allowing me to come into the
Lindemans Brewery and provide me with different aging samples.
A warm thanks to my family. I would like to thank my wonderful parents, Dr.
Sidney and Sharron Thompson who have helped support me throughout all my endeavors
in and outside of the classroom. I also want to thank my parents for helping me edit my
dissertation. I know they both learned more about gueuze beer and the analytical chemist
that they ever wanted to know. I would also like to thank Sandra Hamilton in helping to
provide financial support to go to Brussels to meet with several commercial brewers.
I am deeply indebted to my wonderful husband Justin Witrick who not only has
provided me with the love and support to pursue my degree, but encouraged me to pursue
my degree.
v
Table of Contents
ABSTRACT ii
DEDICATION iii
ACKNOWLEDGEMENTS iv
TABLE OF CONTENTS v
LIST OF TABLES vii
LIST OF FIGURES viii
ABBREVIATIONS ix
CHAPTER 1: INTRODUCTION 9
Research Objectives 14
Literature Cited 15
CHAPTER 2: REVIEW OF THE LITERATURE 17
History of Lambic Beer 17
Characteristics of Lambic beer 20
Manufacturing of Lambic beer 26
Microorganisms in Beer 29
Gas Chromatograpy-Olfactometry 36
Gas Chromatography-Olfactometry Methodology 38
Literature Cited 48
CHAPTER 3: COMPARISON OF TWO EXTRACTION TECHNIQUES, SPME
AND SDE SAFE FOR THE ANALYSIS OF LAMBIC BEER 57
Abstract 57
Introduction 59
Materials and Methods 60
Results and Discussion 67
Literature Cited 75
CHAPTER 4: ANALYSIS OF THE VOLATILE AND SEMI-VOLATILE
COMPOUNDS PRESENT IN COMMERCIAL AVAILABLE BEER USING GC-
MS AND HPLC
93
Abstract 93
Introduction 94
Materials and Methods 95
Results and Discussion 99
Literature Cited 107
CHAPTER 5: ANALYSIS OF THE DEVELOPMENT OF FLAVOR AND
AROMA COMPOUNDS OF LAMBIC BEER THROUGHOUT THE
FERMENTATION PROCESS
131
Abstract 131
Introduction 132
Materials and Methods 134
Results and Discussion 137
Literature Cited 146
CHAPTER 6: CONCLUSION 156
vi
LIST OF TABLES
Table 2.1 Description of all the styles of lambic beer currently available
on the commercial market 56
Table 3.1 Identification of flavor compounds present in lambic (gueuze)
beer using SPME and SAFE-SDE as extraction methods 84
Table 3.2 Identification of gueuze beer sulfur volatiles from photometric
flame pulse detector (PFPD) data 87
Table 3.3 Tentative identification of aroma-active compounds in
commercial available Gueuze beer based upon FD factors
using SDE-SAFE extraction
90
Table 3.4 Flavor Dilution values of volatile compounds in lambic beer 92
Table 4.1 Comparison of pH levels for commercial lambic (gueuze)
beers 110
Table 4.2 Color Comparison for commercial lambic (gueuze) beer 112
Table 4.3 Data Collected by the Enology Service Laboratory 117
Table 4.4 Comparison of chemical compounds found in commercially
available lambic beer 118
Table 4.5 Quantification of compounds for commercial lambic beers 122
Table 4.6 Comparison of means for 4-ethylguaiacol 123
Table 4.7 Comparison of means for 4-ethylphenol for commercial brands 124
Table 4.8 Comparison of means for ethyl octanoate 125
Table 4.9 Comparison of means for octanol for commercial brands 126
Table 4.10 Comparison of means for ethyl undecanoate 127
Table 4.11 Comparison of means for ethyl acetate 128
Table 4.12 Comparison of acids within commercial brands of lambic Beer 129
Table 4.13 Comparison of means for lactic acid 130
Table 5.1 Chemical compounds Identified in aging lambic beer using
GC-MS 148
Table 5.2 Aroma compounds identified for aging lambic beer using GC-
O 150
Table 5.3 Odor profile and ranking for 3 month old lambic beer 151
Table 5.4 Odor profile and ranking for 6 month old lambic beer 152
Table 5.5 Odor profile and ranking for 9 month old lambic beer 153
Table 5.6 Odor profile and ranking for 12 month old lambic beer 154
Table 5.7 Odor profile and ranking for 28 month old lambic beer 155
vii
LIST OF FIGURES Figure 3.1 GC-MS Chromatograph of lambic beer using SPME 81
Figure 3.2 GC-MS Chromatography of Lambic Beer using SDE/SAFE
Extraction (Acidic Fraction) 82
Figure 3.3 GC-MS Chromatography of Lambic Beer using SDE/SAFE
Extraction (Neutral Basic Fraction) 83
Figure 3.4 GC-O aromagraph for lambic beer using SPME as extraction
technique 89
Figure 3.5 GC-O Chromatogram of Commercial Available Gueuze Beer using
OSME 91
Figure 4.1 Comparison of Means for pH based upon different commercial
brands 111
Figure 4.2 Graphical representation of all the pH values for the commercial
gueuze beers 112
Figure 4.3 Comparison of means for color of commercial lambic (gueuze)
beer 114
Figure 4.4 All color values for the commercial beer 115
Figure 4.5 SRM color graph with corresponding values 116
viii
ABBREVIATIONS
AEDA aroma extraction dilution analysis
CHARM Combined hedonic aroma response measurement
DMS dimethyl sulfide
DVB/CAR/PDMS Divinylbenzene/Carboxen/Polydimethylsiloxane
4-EG 4-ethylguaiacol
4-EG 4-ethylphenol
FD Flavor dilution
FID Flame ionization detector
GC-MS gas chromatography-mass spectrometry
GC-O gas chromatography – olfactometry
HPLC high performance liquid chromatography
IVA Isovaleric acid
LRI linear retention index
MS Mass spectrometry
OAV odor active value
PA polyacrylate
PDMS polydimethylsiloxane
PEG Polyethylene glycol
PFPD Pulse flame photometric detector
SAFE solvent-assisted flavor evaporation
SDE simultaneous distillation extraction
SMM S-methyl methionine
SPME solid phase microextraction
9
Chapter 1: Introduction
“The lambic family of beer is not everyone’s glass of beer, but no one with a keen
interest in alcoholic drink would find them anything less than fascinating. In their “wildness” and
unpredictability, these are exciting brews. At their worst, they offer a taste of history” (1).
Lambic beer is one of the oldest styles of beer still being produced by spontaneous
fermentation in the Western world today (2). This style of beer is mainly produced within 500
square kilometers of Brussels and the Payottenland, a valley on the Senne River located on the
western side of Brussels. This region seems to have the perfect combination of airborne
microorganisms that can create a consistent beer through spontaneous fermentation (3).
Traditional beers, regardless of whether they are ales or lagers, normally take anywhere from
several days to several months to ferment, while lambic beers can take anywhere from one to
two years before the fermentation process has been completed (4, 5). The lambic brewing
industry is in jeopardy because of the very product they produce. The long fermentation period
requires breweries to store approximately $100,000 – $300,000 worth of product resulting in
thousands of dollars in taxes owed before the beer even has time to reach maturity (2, 3).
Alcoholic beverages are a complex mixture of volatile, semi-volatile and nonvolatile
compounds belonging to several different chemical families including higher alcohols, ethyl
esters, fatty acids, ketones, isoamyl esters, aldehydes and ketones, furanic compounds,
terpenoids, C13-norisoprenoids, and volatile phenols (6). The complex combination of chemical
compounds found in alcoholic beverages plays a vital role in their appearance, aroma, flavor, and
mouth feel. The combination of taste and olfactory properties are often responsible for the
quality, character, and consumer acceptability of alcoholic beverages. Similar to other alcoholic
beverages, a beer’s aroma is made up of hundreds of different chemical compounds with
10
different polarities and varying concentrations. The quality of the raw ingredients and the
fermentation process play major roles in the chemical composition of a product (7).
Alcoholic beverages contain over 800 volatile compounds, however only ten to thirty are
generally aroma active (8-10). A number of these compounds are found in several different
alcoholic products including beer, wine and distilled liquors, however the concentration tends to
vary between these beverages. Compounds present in different alcoholic beverages have the
ability to affect the aroma and flavor in individual, synergistic, or antagonistic ways. Some
volatile compounds contribute to the aroma and flavor of the alcoholic beverage while others just
enhance the background profile of the product (11). The aliphatic alcohol, n-propanol,
amylalcohol (n-pentanol) and aromatic alcohols β-phenyl ethanol, and benzyl alcohol are
examples of higher alcohols also known as fusel alcohols, which are found in alcoholic
beverages. Fusel alcohols can have either positive or negative effects on both the aroma and
flavor of the beverage. Fusel alcohols, at their optimal concentration, can impart a fruity note,
however when the concentration exceeds 300 mgL-1, this results in a strong pungent smell and
taste. Fatty acids are usually produced in the early stages of the fermentation process. Fatty acids
also play an important role in the aroma profile of alcoholic beverages. Acetic acid smells like
vinegar, propanoic acid has a goaty smell, butanoic acid (spoiled butter), and lactic acid are
short chain fatty acids that are by-products of microorganisms during fermentation.
Ethyl esters ( which produce fruity flavors) are produced closer to the end of the
fermentation process and are another group of chemical compounds found in beer, wine, and
whiskey. Ethyl esters play a huge role in the sensory profile of the overall product. The ethyl
esters that typically dominate in beer, wine and whiskey are straight chain fatty acids and
acetates which are produced by an enzymatic catalyzed condensation reaction between aycl-CoA
11
and a higher alcohol (12). The rate of ester formation in an alcoholic beverage related to the
concentrations of acyl-CoA and fusel alcohols and the overall enzymatic activity affecting the
formation and breakdown of the esters. Ethyl acetate (fruity, solvent-like), isoamyl acetate
(banana, pear), isobutyl acetate (banana, fruity) ethyl hexanoate (green apple), ethyl octanoate
(fruity, soapy), ethyl decanoate (floral, soap), and 2-phenylethyl acetate (honey, fruity, flowery)
are all esters that have a significant impact on the aroma profile of an alcoholic beverage
compared to less volatile longer chain esters. Based upon the combinations and concentration of
esters present, they can have a synergistic effect on the aroma profile of the beer (6). Since most
esters are present in alcoholic beverages around their odor-detection threshold levels, small
changes in their concentration can have a huge impact on the beverages flavor and aroma (12).
The overall chemical composition of an alcoholic product such as beer is complex and
beer contains many compounds at different of concentrations. These chemical compounds can
have different degrees of polarity, and volatility and the wide range of concentrations found
within beer or any other alcoholic beverage can be at concentrations of as little as ng/L (ppb) to
mg/L (ppm). The overall influence that a compound has on the aromatic profile of a product can
vary. Often, compounds present at trace amounts have a greater influence on the aroma profile
than those found at higher concentrations (7). The key factor is the concentration present relative
to the odor detection threshold. Aroma research typically begins with isolating and identifying
aroma active compounds in a food sample (9). In order to characterize aroma active
compounds, volatile compounds must first be separated from nonvolatile compounds (13).
Trace amounts of aroma compounds are located throughout the food matrix, making
these compounds difficult to extract and concentrate. It can be extremely difficult to isolate trace
compounds in foods that contain lipids, proteins, complex carbohydrates, sugars, and water.
12
Water is one of the most abundant volatile compounds in food, so any procedure that involves
placing a vacuum or a distillation process extracts water along with the other volatile compounds
within the sample. Most isolation techniques are based upon solubility and volatility of aroma
compounds. While solvent extraction is a useful technique, it does have its downfalls. A
weakness with this method is that compounds have different partition coefficients and will be
extracted at different times and concentrations throughout the process. Another weakness of
solvent extraction is that this method will co-extract lipids from the sample which would require
further separation prior to analysis (9).
The hardest part in determining the volatile compounds responsible for the aroma profile
of a food product is finding a suitable method for isolating the odor active compounds (14). The
method selected for extraction should be able to successfully isolate the compounds that
contribute to the overall flavor of the product without altering or causing the formation of
artificial compounds. Volatile and semi-volatile compounds in alcoholic beverages have been
previously analyzed using a number of different methods: liquid-liquid extraction, solid phase
microextraction (SPME) (15), simultaneous distillation extraction (SDE) (16), and SAFE
(solvent-assisted flavor evaporation) (17). All of these methods have their disadvantages and
advantages.
Simulatneous distillation and extraction (SDE) is one of the oldest and most widely used
techniques for separating volatile compounds from nonvolatile components (16). SDE is often
used in research to isolate volatile compounds because of its versatility and simplicity (18, 19).
SDE has been used to isolate volatile compounds in beer, spices, fruits and wine (16, 20-22).
While SDE is a simple and fast aroma extraction technique, because of the elevated temperatures
applied during distillation, this may cause the formation of artificial compounds (19).
13
Solid phase microextraction (SPME) is a simple, fast, and solvent-free extraction
technique that utilizes a small 1-2 cm piece of fused silica (23). SPME was first developed by
Pawlisyn in 1997 to analyze environmental samples like air, soil, and water (15, 24). Since then,
it has been used to analyze volatiles compounds found in foods (25). The fused silica fiber can be
coated with either a liquid or solid phase to extract and concentrate these compounds. This
method is based upon an equilibrium being reached between the volatile compounds present in
the headspace above the sample and the concentration on the coated fiber (23). Once the fiber
has reached equilibrium within the sample, the fiber is then thermally desorbed into a GC carrier
gas releasing the volatile compounds to be analyzed. The volatile profile obtained during
analysis is based upon the profile of the sample and by sampling parameters. While this method
can provide excellent results, the fibers used with this method possess a limited linear range and
competition between volatile compounds for binding sites, which could potentially cause errors
(25).
Direct solvent extraction is a simple and efficient technique used for aroma isolation. A
major limitation of this method is that it should not be used with foods that contain lipids,
because the aroma compounds as well as the lipids will be extracted. Lipids must be separated
from the flavor compounds prior to analysis. Molecular distillation, steam distillation, and
dynamic headspace are three techniques currently used to separate aroma compounds from
lipids. Solvent extraction can be as simple as placing a food sample into a separatory funnel with
a solvent and shaking, or as costly and complicated as using pressure chambers and supercritical
CO2. Supercritical CO2 has a low boiling point, leaves no residues to interfere with sensory
analysis, and has the ability to penetrate food samples. Some of the drawbacks of this method are
14
the pressure and cost requirements to perform, small sample size, and the nonpolar nature of
carbon dioxide.
Research Objectives
The purpose of this research was to study the aroma and flavor profile of commercially
available lambic beer. The overall objective of this research was to help brewers have a greater
understanding of what makes up this particular style of beer flavor and aroma. The continual
growth of the craft brewing industry within the United States has people looking for unique good
quality beer. A number of brewers are fascinated by lambic beers because of its ability to bridge
the gap between beer and wine. By unlocking the mystery of what makes a lambic beer unique,
hopefully future brewers will be able to successfully make a copy of this particular style of beer
without having to wait two years to maturate.
The project has three aims:
I. Compare two extractions methods: SPME (solid phase microextraction) and SDE-SAFE
(solvent-assisted flavor evaporation) for the isolation of flavor and aroma compounds in
lambic beer.
II. To determine the volatile composition of commercially available lambic gueuze using
SPME/GC-MS, and HPLC.
III. Determine the major aroma-impacting compounds of aging lambic beer using GC-O.
15
Literature Cited
1. Jackson, M., The Simon and Schuster Pocket Guide to Beer. New York City, 1988; p
176.
2. Guinard, J. X., Lambic. Brewers Publications: Boulder, 1990; p 159.
3. De Keersmaecker, J., The mystery of lambic beer. Scientific American 1996, 275, 74.
4. Kumara, H. M. C. S. Microbiology and Biochemistry. Katholieke Universit te Leuven,
Leuven, 1990.
5. Hardwick, W. A., Handbook of Brewing. 1st ed.; Marcel Dekker Inc: New York, 1995; p
713.
6. Rodrigues, F.; Caldeira, M.; Camara, J. S., Development of a dynamic headspace solid-
phase microextraction procedure coupled to GC-qMSD for evaluation the chemical profile in
alcoholic beverages. Analytica Chimica Acta 2008, 609, 82-104.
7. Plutowska, B.; Wardencki, W., Application of gas chromatography-olfactometry (GC-O)
in analysis and quality assessment of alcoholic beverages - A review. Food Chem. 2008, 107,
449-463.
8. Ferreira, V.; Lopez, R.; Cacho, J. F., Quantitative determination of the odorants of young
red wines from different grape varieties. J. Sci. Food Agric. 2000, 80, 1659-1667.
9. Reineccius, G., Flavor Chemistry and Technology. 2nd ed.; CRC Press: Boca Raton,
2006.
10. Taylor, A. J., Food Flavour Technology. Sheffield Academic Press: Boca Raton, FL,
2002; p 302.
11. Romano, P.; Fiore, C.; Paraggio, M.; Caruso, M.; Capece, A., Function of yeast species
and strains in wine flavour. International Journal of Food Microbiology 2003, 86, 169-180.
12. Verstrepen, K. J.; Derdelinckx, G.; Dufour, J.-P.; Winderickx, J.; Thevelein, J. M.;
Pretorius, I. S.; Delvaux, F. R., Flavor-active esters: Adding fruitiness to beer. Journal of
Bioscience and Bioengineering 2003, 96, 110-118.
13. Acree, T. E.; Teranishi, R., Flavor Science: Sensible Principles and Techniques.
American Chemical Society: Salem, 1993; p 351.
14. Majcher, M. J., H.H., Comparison of suitability of SPME, SAFE, and SDE methods for
isolation of flavor compounds from extruded potato snacks. Journal of Food Composition and
Anaysis 2009, 2009, 606-612.
16
15. Pawliszyn, J., Solid Phase Microextraction. Theory and Practice. Wiley-VCH: New
York, 1997.
16. Nickerson, G. B.; Likens, S. T., Gas chromatographic evidence for the occurrence of hop
oil components in beer. Journal of Chromatography 1966, 2, 677-678.
17. Engel, W.; Bahr, W.; Schieberle, P., Solvent assisted flavour evaporation - a new and
versatile technique for the careful and direct isolation of aroma compounds from complex food
matrices. Eur. Food Res. Technol. 1999, 209, 237-241.
18. Acree, T. E.; Teranishi, R., Flavor Science: Sensible Principles and Techniques.
American Chemical Society: Washington, DC, 1993; p 351.
19. Schieberle, P., Quantitation of important roast-smelling odorants in popcorn by stable
isotope dilution assays and model studies on flavor formation during popping. Journal of
Agricultural and Food Chemistry 1995, 43, 2442-2448.
20. a -Maroto, M. C.; Pérez-Coello, M. S.; Cabezudo, M. D., Supercritical carbon dioxide
extraction of volatiles from spices: Comparison with simultaneous distillation–extraction.
Journal of Chromatography A 2002, 947, 23-29.
21. Bosch-Fuste, J.; Riu-Aumatell, M.; Guadayol, J. M.; Calxach, J.; Lopez-Tamamaes, E.;
Buxaderas, S., Volatile profiles of sparkling wines obtained by three extraction methods and gas
chromatography mass spectrometry (GC-MS) analysis. Food Chem. 2007, 105, 428-435.
22. Maia, J. G. S.; Andrade, E. H. A.; da Silva, M. H. L., Aroma volatiles of pequi fruit
(Caryocar brasiliense Camb.). Journal of Food Composition and Analysis 2008, 21, 574-576.
23. Riu-Aumatell, M.; Vargas, L.; Vichi, S.; Guadayol, J. M.; López-Tamames, E.;
Buxaderas, S., Characterisation of volatile composition of white salsify (Tragopogon porrifolius
L.) by headspace solid-phase microextraction (HS-SPME) and simultaneous distillation–
extraction (SDE) coupled to GC–MS. Food Chem. 2011, 129, 557-564.
24. Gorecki, T.; Pawliszyn, J., Field-portable solid-phase microextraction fast GC system for
trace analysis. Field Analytical Chemistry and Technology 1997, 1, 277-284.
25. Taylor, A. J., Food Flavour Technology. Sheffield Academic Press: Boca Raton, 2002; p
302.
17
Chapter 2: REVIEW OF THE LITERATURE
History of Lambic Beer
Lambic beer is one of the oldest styles of beer still being brewed in the western world
today (1, 2). Over the past 2000 years, Belgium has been a major thoroughfare in Europe.
Belgium has seen its share of foreign rulers from the Romans, Germans, Dutch, Burundians,
Austrians, Spanish, and French with each one contributing something to the Belgian culture
including brewing. Some historians believe that the Romans brought with them an ancient
brewing techniques. Beer, in ancient times was almost certainly fermented through spontaneous
fermentation. Brewers who used this process would expose the wort to the air, allowing it to be
inoculated with whatever wild-born yeast and other microorganisms that were present in the air.
Only a 500 square kilometer area around Brussels and the Payottenland, a valley on the Senne
River on the western side of the city, has the right combination of airborne microorganisms
necessary to create a consistent lambic beer through spontaneous fermentation (3). Sikaru is an
example of a spontaneously fermented beer. It was produced 5000 years ago by Sumerians in
Mesopotamia. An ancient Sumerian tablet was found to contain the composition of sikaru on it,
which is virtually identical to that of a lambic beer today. A Sumerian brewer would use sixty
“silas” of barley malt and thirty six “silas” of a Sumerian wheat variety called épeature. This
would equate to 62.5 percent malt and 37.5 percent raw grain. Cantillon, a lambic brewery in
Brussels, uses a similar recipe consisting of 830 kg (1,830 pounds) of barley malt and 460 kg
(1,014 pounds) of unmalted wheat per 52 HL, which would equate to 65 percent malt and 35
percent raw grain (1). One difference that is apparent between a lambic beer and a sikaru beer is
that lambic beer utilizes aged hops for flavoring, while ancient Sumerians used spices such as
cinnamon to flavor sikaru. Spontaneous fermentation of the sikaru would have most likely been
18
caused by the yeast Saccharomyces and Schizosaccharomyces. Similar to a lambic beer, sikaru
beer was a luxury product and was often used as payment for workers during ancient times (1,
3).
A Beer is Born
Little is known about the origin of the word lambic since there are a number of different
theories on how the word came to be. One theory suggests that the word came from one of four
Belgian villages: Lembeek, Borcht-Lombeek, Onze-Lieve-Vrouw-Lombeek or Sint-Katelijne-
Lombeek. Another possibility is that it came from the Spanish word lambicado, which means
“carefully prepared.” The creation of lambic beer has been attributed to uke Jean IV of Brabant
who in 1428 decided to experiment with brewing beer. He was tired of drinking the same style of
beer so he decided to macerate and boil the barley with hops in a still, known as an alambic. The
uke’s experiment was deemed a success and the resulting beer is known today as a lambic.
Old unblended lambic beers are probably similar to the lambics served centuries ago.
Unblended lambics are unheard of outside of Brussels and Payottenland. The more common
lambics served today are gueuze, faro, and other various lambics sweetened and flavored with
fruits.
Gueuze is result of the careful blending of different aged and different tasting gueuze
beers (4, 5). Gueuze is similar to champagne in that they both undergo a secondary fermentation
period in the bottle. The Method Champenoise often is attributed to in the 18th
century by the
Benedictine monk Dom Pérignon. A century later the mayor of Lembecq, who was a brewer and
an engineer by the name of Cayaerts, decided to utilize this method to referment their lambic
beer in a bottle using this process. Thus, gueuze was born.
19
Faro comes from the Spanish word for barley wine. Faro is a of young lambic beer
sweetened with candy sugar. Fruit lambic are traditionally made with cherries (kriek the Flemish
word for cherries) and raspberries (framboise from the French). Peaches, grapes, plums,
pineapples and black currants have also been used with some success in lambic beers (1, 3).
Lambic Brewing Industry
Similar to other countries, in Belgium beer is only produced by a few large breweries.
The two largest breweries in Belgium are Stella Artois and Maes. The success of these two
breweries has not prevented the growth of smaller, artisan breweries from arising. The recent
increase in small artisan breweries can be attributed to the increase in specialty beer drinkers.
This new trend has caused a number of medium-sized lager breweries to start brewing specialty
beers, while the larger breweries continue to take over existing smaller breweries (1, 3).
The most well-known lambic brewery in Belgium is Cantillon. Cantillon is not only a
working brewery, but a museum as well. The brewery was opened in 1937 by Paul Cantillon
with the help of his two sons Robert and Marcel. The brewery, however, is no longer run by the
Cantillon family but by Jean Pierce Van Roy, a former school teacher turned brew master. Jean
with his wife Claude, turned the brewery into a working museum in 1978.
Another well-known lambic brewery is Lindemans. This brewery began producing
lambic beer in 1809 on the Lindeman’s farm in Sint-Pieters-Leeuw and is currently the leading
exporter of lambic beer to the United States. René Lindemans, the brew-master for Lindemans,
combines old world tradition with modern brewing techniques. Lindemans still uses traditional
mashing and wort cooling in swallow open air tank.
Lambic brewers are currently jeopardized by the very products they produce because of
the time-consuming process required to produce their beer. Lambic beers spend anywhere from a
20
a year to three years in casks or barrels before they are ready for consumption. Therefore,
breweries can have anywhere from $100,000 to over $300,000 in product ageing in a barrel at
any one time. The current tax system in Belgium is also very harsh on lambic breweries
requiring these breweries to pay taxes on their beer within a year after brewing. This is difficult
for breweries because true lambics are required to be aged a minimum of a least one year prior to
saling. In the end, brewers owe money to the Belgium government often before the product is
sold. Another problem is that lambic brewers are beginning to retire and they do not have anyone
to take over the old and artful craft of lambic brewing (1, 3).
Characteristics of Lambic Beer
Sensory
Before a person can take their first sip of a lambic or gueuze beer he/she must first
recognize that this is no ordinary beer and what constitutes as a defect (volatile acidity, lactic
acid, Brettanomyces character) in other styles of beer is considered desirable for this particular
beer. Gueuze can range in color from golden yellow for young gueuze to light amber for older
ones. Similar to bottle fermentation for champagne, gueuze undergoes a similar process to
produce its high level of carbonation and “gassy” mouth feel like champagne. Once the bottle is
open, beer gushes out due to the high levels of carbonation resulting in foam whose color falls
between the white foam of normal beer and the yellowish foam of sparkling wine. Bulk
fermented and filtered lambic beer typically has a lower CO2 amount (2.0 to 2.4 volumes) than
that of commercial ales and lagers (2.4 to 2.8 volumes). Once a glass of gueuze is poured, the
higher volatile acidity, which is particular high in this style of beer, gives off a vinegar, goaty,
and rancid aroma. The fruity aromas that often come through can be described as apple, melon,
and even apricot. Brettanomyces plays a role in the aroma composition of the beer with its horse
21
and barnyard smells (1). The overall concentration of 4-ethylphenol and 4-ethylguiacol, two
products of Brettanomyces growth, have a low enough concentration that does not seem to cause
the drinker to be disgusted (6, 7). The aroma profile of gueuze is balanced by fruity esters plus
the woody, vanilla aroma coming from the wooden casks used for fermentation. The wort also
provides some key aroma notes to the beer like caramel and/or nutty flavors (1).
Upon drinking the very first sip of lambic beer, the drinker often experiences sour, acidic,
and at times astringent tastes that surprise people because of the lack of bitterness associated
with hops. Because old hops are used, little to no bitterness is found in the finished product.
Depending on the age of the beer, sweetness can range from very dry to fairly sweet for a bulk
fermented filtered gueuze. Due to the high level of carbonation, lambic beer will normally foam
in one’s mouth causing a stinging sensation on the tongue and palate. In traditionally made
gueuze, the gueuze contains more tannins from the wheat and wood, giving it a thinner taste,
while bulk fermented gueuze is thicker and tends to have a smoother mouthfeel. Once the drinker
finishes a glass of gueuze, a warming sensation caused by the higher ethanol content will linger,
along with the fruity and horse aromas, but a puckering effect caused by the acid and astringency
of the beer often occurs (1).
Flavor
Flavor plays an important role in the acceptability of a food product. Flavor is a
combination of two sensations--odor and taste (8). The sensation of taste is made up of sweet,
salty, bitter, umami and sour as well as the chemical feelings of cooling, astringency, spicy, bite,
metallic, and flavor (9). The most important flavor compounds in both lambic and other beers are
the higher alcohols and esters, organic acids, dimethyl sulfide, and diacetyl; this is very similar to
that of American lagers (10, 11).
22
Fusel Alcohol and Esters.
Ethanol is just one of several alcohols that can be found in beers along with higher
alcohols, fusel alcohols, which are considered important by products of fermentation. Esters are
also important flavor and aroma compounds in beer. These compounds provided strong and
oftentimes penetrating fruity flavors to the beer. Similar to ethanol and fusel alcohols, these
compounds are also produced during the main fermentation stage (12). Based upon a study by
Harrison, it was determined that a number of different alcohols contributed to the flavor of beer:
iso-amyl, phenethyl, propyl, and iso-amyl alcohol (2-methylbutanal) (8).
The concentration of higher alcohols in lambic beers and other styles of beer are similar,
however the concentration of esters are very different (13). Ethyl acetate can be found in much
higher concentrations in lambic beers than any other styles (14). Ethyl acetate has a solvent-like
fruity aroma with an odor detection threshold level of 30 ppm (14, 15). The average
concentration of ethyl acetate is between 8 – 48 ppm for traditional beers, while it is 33.4 – 67.6
ppm for filtered gueuze and 60.9 – 167 ppm in unfiltered gueuze (14). Isoamyl acetate is another
compound found in lambic beer in levels that differ from traditional beers. In lambic beers,
isoamyl acetate is found in much lower concentrations then in traditional beers. In traditional
beers isoamyl acetate can range anywhere from 1.2 – 2.8 ppm in lagers and 0.7 – 3.3 in ales (14,
15). Ethyl lactate is a compound normally found in whiskey (16), wine, sherry (17), and cider
(18), but is not traditionally found in beer. The few times that ethyl lactate has been reported in
beer, the overall concentration has been so low that it was assumed that it had no effect on the
overall aroma of the beer. That is not the case in lambic beers where the concentration of ethyl
lactate has been determined to be 483 ppm, well above the taste threshold of 50 ppm and the
odor threshold of 14 ppm (8, 13).
23
The ethyl esters of higher fatty acids, ethyl caprylate, and ethyl caprate, are traditionally
found in lambic and gueuze beers. These ethyl esters are normally absent in lagers and present in
only small concentrations in ales (19, 20). Both ethyl caprylate and ethyl caprate are considered
to be typical aroma and flavor compounds of lambic and gueuze beer. The ethyl esters of
caproic, caprylic, and capric acids give lambic and gueuze beer its wine and fruity flavor. The
threshold values for these compounds are as such 0.2, 0.8 and 1.1 ppm respectively for cproic,
caprylic, and capric acids (14, 18).
Organic Acids. Pyruvic acid, L-malic acid, acetic acid, and L-lactic acid are found in
different concentrations in different styles of beer (21). Lambic and gueuze are well known for
their high levels of acid. It has been reported that gueuze has a lactic acid concentration of l500
- 3400 ppm and acetic acid had a concentration of approximately 700 - 1200 ppm (13).
Propionic, isobutryic, and butyric acids are also found in somewhat higher concentrations than in
other styles of beer. Ales and lagers have much lower acetic and lactic acid concentrations then
gueuze beer. The concentration of acetic acid in ales and lagers tends to range anywhere from
60 – 140 ppm, while lactic acid in gueuze beer ranges between 70 – 200 ppm (8, 20). Most
people have a flavor threshold of acetic acid at 200 ppm while the flavor detection threshold for
lactic acid is 400 ppm (8, 22). The taste threshold levels of butyric, propionic, and isobutyric acid
are approximately 1, 100, and 200 ppm respectively. Butyric acid is one of the few acids in
gueuze beer that is usually found over its threshold concentration (13). Butyric acid can be
described as having a cheesy or rancid aroma (14). Lambic and gueuze beers are known for
containing high levels of caprylic (C8) and capric (C10) acids. Capric acid concentration in
gueuze beer usually exceeds 2 ppm, which is slightly higher than the concentration found in
lagers or ales (19).
24
Methyl Sulfunyl Methane.
Dimethyl sulfide (DMS) is thioether which plays an important role in the flavor of beer
and is also the main volatile sulfur compound in beer (23). Malt, hops and water can all be
possible sources of sulfur. While the primary sources of volatile and semi-volatile compounds do
not always come from the raw materials themselves, they can be generated during malting and
fermentation (24, 25). DMS has an odor detection concentration threshold of approximately 30 –
50 µg/L, and once the concentration reaches between 50 – 100 ppb it starts to affect the taste.
DMS becomes very detrimental to the beer when its overall concentration is greater than 100
µg/L because of the cooked vegetable, corn or cabbage like smell it produces (26, 27).
DMS can arise three different ways in beer: (1) breakdown of compounds during wort
boil and malting (28); (2) yeast metabolizing compounds produced during boiling or kilning
(29); and/or (3) bacterial contamination (30, 31). S-methyl methionine (SMM) is a major
precursor for DMS. This compound is produced during barley germination, but is later largely
destroyed during kilning and boiling (32). Enterobacteria have been found to possess the ability
to produce DMS along with several other sulfur compounds (33, 34). Some Enterobacteria may
also enzymatically produce the precursor SMM, resulting in the spoilage of the wort through
excess accumulation of DMS in both lager and ale brews (10). White and Parson determined that
all yeast that they analyzed were capable of producing DMS and were able to produce larger
quantities then microorganisms during the fermentation of lager wort (35). Still, yeast have the
ability to produce small amounts of DMS even when all the precursors are removed prior to the
start of the main fermentation (10).
DMS in lambic and gueuze beer most likely comes from the metabolism of
Enterobacteria found in the wort (2). The maximum concentration of DMS was reported by Van
25
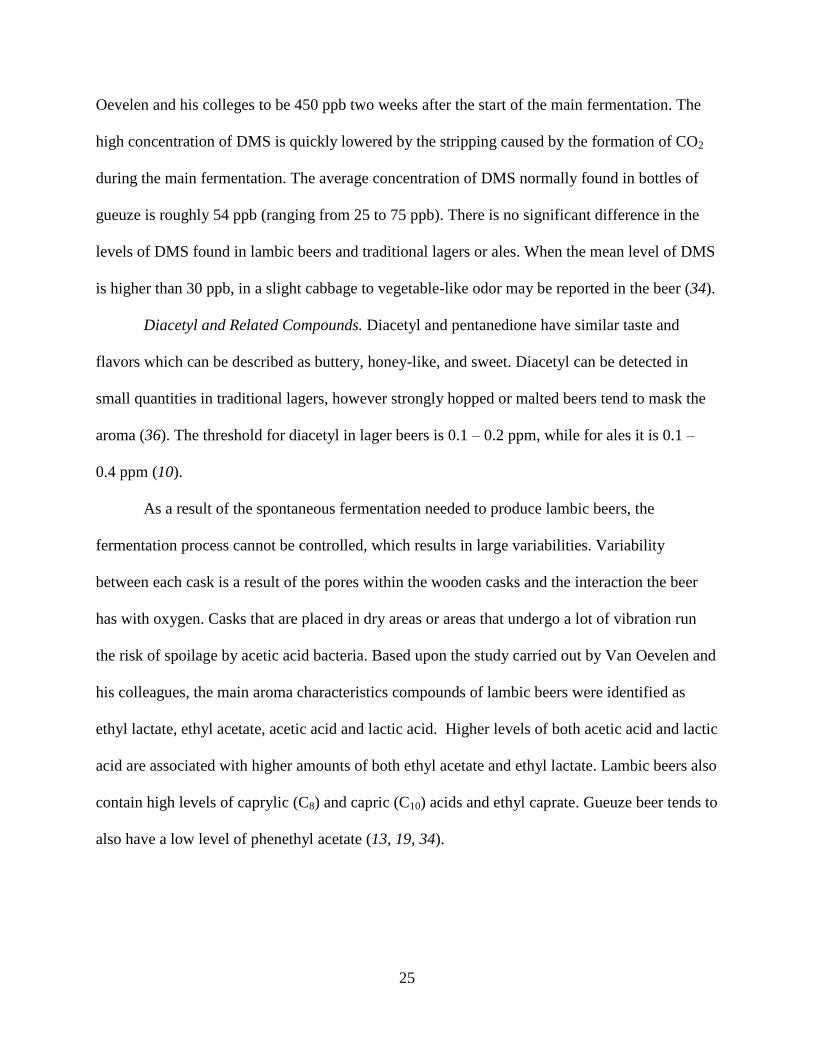
Oevelen and his colleges to be 450 ppb two weeks after the start of the main fermentation. The
high concentration of DMS is quickly lowered by the stripping caused by the formation of CO2
during the main fermentation. The average concentration of DMS normally found in bottles of
gueuze is roughly 54 ppb (ranging from 25 to 75 ppb). There is no significant difference in the
levels of DMS found in lambic beers and traditional lagers or ales. When the mean level of DMS
is higher than 30 ppb, in a slight cabbage to vegetable-like odor may be reported in the beer (34).
Diacetyl and Related Compounds. Diacetyl and pentanedione have similar taste and
flavors which can be described as buttery, honey-like, and sweet. Diacetyl can be detected in
small quantities in traditional lagers, however strongly hopped or malted beers tend to mask the
aroma (36). The threshold for diacetyl in lager beers is 0.1 – 0.2 ppm, while for ales it is 0.1 –
0.4 ppm (10).
As a result of the spontaneous fermentation needed to produce lambic beers, the
fermentation process cannot be controlled, which results in large variabilities. Variability
between each cask is a result of the pores within the wooden casks and the interaction the beer
has with oxygen. Casks that are placed in dry areas or areas that undergo a lot of vibration run
the risk of spoilage by acetic acid bacteria. Based upon the study carried out by Van Oevelen and
his colleagues, the main aroma characteristics compounds of lambic beers were identified as
ethyl lactate, ethyl acetate, acetic acid and lactic acid. Higher levels of both acetic acid and lactic
acid are associated with higher amounts of both ethyl acetate and ethyl lactate. Lambic beers also
contain high levels of caprylic (C8) and capric (C10) acids and ethyl caprate. Gueuze beer tends to
also have a low level of phenethyl acetate (13, 19, 34).
26
Manufacturing of Lambic Beer
Spontaneous fermentation has been used in the production of beer, wine, and cider for
many centuries. However, spontaneous fermentation has been recently replaced in many cases
with a mixture of known microorganisms, allowing the producer to maintain more control over
the fermentation process. Lambic and gueuze are two types of beer that are still produced today
using spontaneous fermentation of wort (2, 13). A Belgium royal decree prohibits the use of
transferable cultures requiring brewers to continue to allow the natural microfloral to inoculate
the wort (37). This particular style of beer is mainly produced within fifteen kilometers of
Brussels. (2, 13).
Lambic, gueuze, and other similar styles of beer are complex beers made from a few key
components including malted barley, unmalted wheat, aged hops, and fruits. While the
ingredients play a vital role in the brewing process, the fermentation process plays a key role in
the uniqueness of this style of beer. When comparing American ales and lagers to lambic beer,
the key differences between these beers are that lambics are produced by cooling of the wort in
open air and utilizing a spontaneous fermentation in wooden barrels.
A major difference between gueuze/lambic beers and American ales and lagers is the
final specific gravity. American ales and lagers range between 1.015 – 1.019 (3.7 – 4.8 degrees
Plato), while gueuze and fruit lambics range between 1.008 – 1.048 (2.2 - 12 degrees Plato)
which is half that of traditional ales and lagers. Unlike American beers only 50 - 68% of the
fermentable sugars are metabolized by the yeast, the real degrees of fermentation (RDF) for
lambics and gueuzes varies between 63 – 82%. Reducing sugars (such as maltose) are found in
trace amounts to 0.8% in gueuzes, while in fruit reducing sugars can range from trace amounts to
27
two percent. Fruit lambics tend to have higher amounts of reducing sugars because a few
breweries will sweeten the beer with sucrose syrups instead of using real fruit.
Lambic beers contain a wide range of alcohol concentrations. The average ethanol
concentrate for Faro is 3.5 percent (2.8 percent w/w), while gueuze varies from 5.3 – 6.2% v/v
(4.2 – 5 w/w). Fruit lambics have the highest ethanol average at 6.5 percent v/v (5.2 percent
w/w) (1).
Traditionally lambic beer is brewed during the colder months of the year, because of
potential spoiling of the wort during the warmer summer months. The actual brewing season for
the beers normally starts sometime in September and goes to sometime in April (5). The wort is
cooled overnight in open shallow vessels where yeast and other microorganisms from the
environment are able to inoculate the wort. Once the wort has cooled, it is then pumped into
either wooden or metal casks that are placed into non air-conditioned warehouses. Temperature
variations within these warehouses can vary from 0°C to 25°C (2, 13).
Fermentation
Lambic beer is unique in that fermentation is caused by wild yeast and other
microorganisms. The fermentation process itself is broken down into four distinct stages with
different microorganisms playing a crucial role in each stage, which ultimately complete
contributes characteristics to the beer flavor or aroma. The first stage is dominated by the wild
yeast Klacekera apiculata and enteric bacteria. The second stage is dominated by
Saccharomyces followed by lactic acid bacteria in the third stage. The fourth and final stage is
dominated by Brettanomyces. Figure 2.3 Shows a graphical representation of the flavor
development that occurs during the spontaneous production of lambic beer (2, 3).
28
The first stage of fermentation for lambic beer is dominated by enteric bacteria and K.
apiculata. Fermentation begins three to seven days after the wort has become inoculated with the
wild yeast K. apiculata and enteric bacteria. K. apiculata, reaches a maximum concentration of
105 cells/mL within the first week of fermentation, but is quickly out-competed by the
Saccharomyces species and K. apiculata dies off (10). K. apiculata will only ferment glucose
and not maltose. K. apiculata and Enterobacteriacea are both fast growing microorganisms and
cause the pH of the wort to drop from 5.1 to 4.6 because of the acetic and lactic acids being
produced. The diacetyl content during this stage is close to 1 g/L while the dimethylsulfide
(DMS) is approximately 500 mg/L. K. apiculata has the ability to secrete protease into the wort,
which can then break down the protein that did not precipitate during the boil. The amount of
protein still left in the wort is higher than for an all barley malt wort, because of the raw wheat
used in the mash which has higher protein than barley malt (1).
The third stage of fermentation actually overlaps the second stage. This stage starts
approximately three to four months after the beer has been brewed. Stage three is dominated by
the proliferation of lactic and acetic acid bacteria, with both peaking in cell numbers around six
to eight months, which is usually in late spring to early summer when the early morning
temperature begins to get warmer. Warmer temperatures are required for the growth of these
microorganisms (1).
The characteristic sourness of lambic beer can be attributed to the presence of the lactic
acid. The majority of the lactic acid bacteria fall within the Pediococcus genus. These bacteria
can convert sugars into lactic acid. While some strains of Pediococcus are beneficial in beer,
others have the ability to produce a slime layer that will leave a permanent haziness to the beer
that cannot be removed with filtration. Unlike lactic acid bacteria, acetic acid bacteria are
29
undesirable in this style of beer, because of their ability to convert ethanol into acetic acid
causing the beer to become acidic or hard (high volatile acidity). This only becomes a problem if
the cask or barrel that the beer is stored in has been damaged or has a leak allowing oxygen to
come in contact with the beer. The increase in oxygen nurtures the aerobic Acetomonas bacteria
allowing it to grow in this once low oxygenated environment.
After about eight months, an increase in the number of yeast cells occurs signifying the
start to the four and final stage of the fermentation process. Brettanomyces plays a crucial role in
the development of the aromatic profile and even the flavor profile of this beer. A large portion
of the aromatic profile of this beer is composed of esters which are by-product of this
microorganism’s metabolism. Brettanomyces produces an enzyme that can convert acids into
esters and conversely. The two most influential compounds that are produced are ethyl lactate
and ethyl acetate. These two compounds were converted into ester from lactic and acetic acids
produced in stage three (1, 3).
Microorganisms in Beer
Microorganisms have the ability to produce a wide array of by products which can play
an important role in the flavor composition within a food or beverage. In a number of different
foods and beverages, the presence of microorganisms can cause off-flavors. However, a number
of different foods require the presence of these microorganisms for the development of pleasant,
attractive and required flavors. Traditional alcoholic beverages rely on a number of different
microorganisms to obtain their flavor profiles (38). Belgian’s gueu e is one of these products. It
is an unique style of beer in that it is not produced from a single pure culture but from a mixture
of a number of different microorganisms (39). Although microorganisms (other than
Saccharomyces) regarded as spoilage microorganisms in most beers, this is not the case for
30
lambics because these microorganisms play an important role in the overall flavor of this
particular style of beer (10).
Yeast
The strain of yeast present for the main fermentation plays an important role in
determining the level of flavor compounds present in the beer (20). In lambic beer,
Saccharomyces species are the yeast responsible for the main alcoholic fermentation and are
responsible for most of the attenuation in the wort. For the first seven months of the brewing
process, these microorganisms dominate the microflora of the wort, reaching a population
density of 5*106 cells/mL after only three to four weeks. The overall yeast cell population,
however, is still significantly lower than that normally found in most commercial top or bottom
fermenting beer at 108 cells/mL. The two main species of Saccharomyces yeast found in lambic
wort are S. cerevisiae and S. bayanus. Both species of saccharomyces can metabolize glucose,
maltose, and to some extent maltotriose, the main sugars found in lambic wort (1).
The fermentation of lambic wort using traditional brewer’s yeast, Saccharomyces
cerevisiae, reaches an attenuation of approximately 60 – 64% (3.0 – 3.5 plato) which is the
normally called the attenuation limit. Unlike other beers, lambic beers go through a secondary
fermentation step which increases the attenuation beyond the normal range to what is called the
overattenuation or superattenuation stage of 63 – 83%. This is the result of yeast such as
Brettanomyces lambicus converting the remaining sugars left in the wort (1, 40).
31
Enterobacteriaceae
Enteric bacteria, or enterobacteriacea, are gram negative bacteria (1). There are a number
of different species of bacteria that make up the enterobacteriaceae family, many of which can be
isolated from a number of different ecological niches. Some of these bacterium are harmless
while others can be pathogenic to humans, animals, and/or insects. A few of the following genera
are included in this family and they are: Escherichia, Shigella, Yersinia, Morganella, and
Samonella (41).
While in other beer styles enterobacteria are considered to be potential spoilage
microorganisms, that is not the case in lambic beers. Once the wort has had time to cool down,
the enteric bacteria present in the wort reach a very high cell density. The enteric bacteria will
reach a maximums concentration of 108 cells/mL within two weeks of the wort cooling down (1,
42-44). The enterobacteria population decreases once the pH of the wort drops below 4.4 and the
ethanol concentration rises above 2% (45).
Enterobacteria have the ability to impart a variety of flavors into the wort such as sweet,
honey, fruity, vegetables and even fecal. Similar to other brewing microorganisms,
enterobacteria have the ability to metabolize the available glucose in the wort not only for
growth, but into lactic acid, acetic acid, ethanol, and carbon dioxide. While enterobacteria can
metabolize glucose, they are unable to metabolize maltose or maltotriose. The enterobacteria
present in the wort have the ability to consume a number of different amino acids and peptides
that can temporarily impact the flavor of the beer. One possible reason for the slow start to the
main fermentation is because of the depletion of the amino acids in the wort by the
enterobacteria (39).
32
Enterobacteria have the ability to produce not only several sulfur compounds, but
carbonyls and phenols which all play a role in the aromatic and flavor profile of beer although
some of these compounds will disappear during later phases of fermentation. The compounds
become entrapped by the CO2 produced during the main fermentation. DMS is a good example
of this phenomenon. Within the first two weeks, the concentration of DMS produced by the
enterobacteria exceeds 450 ppb. The concentration of DMS drops to 100 ppb because most of it
is stripped away by fermentation gases (1, 13).
Lactic Acid Bacteria
Lactic acid bacteria are gram-positive nonsporulating rods or cocci (41). These
microorganisms are potentially one of the most dangerous spoilage microorganisms in beer
because of their microaerophillic nature, ability to tolerate the antiseptic properties of hops, and
their ability to survive in 0.5 – 14% ethanol and low pH environments (10). The major division
that separates Lactobacillus sp. from each other is based upon how they metabolize glucose (46).
Lactic acid bacteria are broken down into four genera: (1) Lactobacillus for the rod shaped
organisms; (2) Streptococcus for the homofermentative facultatively anaerobic cocci; (3)
Leuconostoc for the heterofermentative cocci that occur in pairs or short chains; and (4)
Pedioccus contains the homofermentative cocci that divide into pairs and tetrads (41).
Once the main fermentation is complete, an increase in the overall bacterial population,
specifically lactic acid producing bacteria from the genus Pediococcus and some Lactobacillus is
observed (1). After about three to four months, lactic acid starts to develop within the beer. The
bacteria reach their maximum numbers at the seven month mark which usually coincides with
the beginning of summer (2). The warmer temperatures present during aging in the cellars during
the summer appears to be essential for the growth of these bacteria. This phenomenon can be
33
seen again in the second year of fermentation when the summer months come around again. It
has been hypothesized that one way to speed up the fermentation process of lambic/gueuze beer
would be to increase the ambient temperature in the aging cellar once the main fermentation
stage has been completed. Unfortunately, creating temperature controlled aging cellars would be
costly for breweries because of the age of the buildings and the overall renovation cost (1).
Nevertheless, different species of lactobacilli have different tolerances for the antiseptic
properties of hops (41). P. damnous is impervious to the antiseptic properties of hops which is
why this species has the ability to grow in hopped beer. Lactic acid bacteria take glucose and
convert it into lactic acid without producing carbon dioxide as a by-product. Lactic acid is the
primary component that gives lambic beer its sour taste. Lactic acid bacteria are slow growing
microorganisms that have complex nutritional requirements, which is partly why lactic acid
bacteria will not reach a very high cell density in the wort. P. damnous not only has the ability to
produce lactic acid but acetoin and diacetyl which both contribute to the aroma present in this
beer (1, 2, 34).
Brettanomyces
Brettanomyces, more commonly known as bret, is an asexual, nonsporulating wild form
of yeast associated with the spoilage of red wines, beer, and ciders (47). Bret is slow growing
and it can take several months after the initial fermentation step to be complete before bret is
detected (40). Brettanomyces was first isolated in 1904 from the stock of a late fermenting
English beer (48). N. Hjelte Claussen of New Carlsberg Brewery was the first to introduce the
name brettanomyces to describe the yeast required to make the English stock ale. It was not until
1920 that Brettanomyces/Dekkera was recognized as its own genus (49). There are five species
34
of Brettanomuces/Dekkera and they are B. custersianus, B. naardenensis, B. nanus, B. anomalus,
and B. bruxellensis (50).
Bret is a fairly common species of yeast that can be found in a number of different
locations and products like wine, beer, cider, wineries, breweries, both wine and brewing
equipment, and oak barrels used for aging (51). Once bret gets into a brewery, especially an
older one, it is extremely difficult to remove, especially since they can be found in the air and
within the wood barrels used for fermenting lambics (1). Some forms of wild yeast like
brettanomyces are typically considered ‘niche’ contaminates because they come into play only
under certain circumstances (52).
Brettanomyces is not detected in lambic beer until after about eight months of
fermentation. The two strains that dominate lambic and gueuze beer are B. bruxellensis and B.
lambicus. These two strains are present in the beer for another eight months and are the main
contributors of the aroma profile for lambic beer (13). B. bruxellensis is the predominant species
found in the breweries that are located within the city limits, while B. lambicus is the main yeast
for the breweries located in the country (1). Lambic beers are both produced from a mixture of
yeast cultures, saccharomyces and brettanomyces (42). Bret, unlike other yeast, has the ability to
ferment much more effectively under aerobic conditions then anaerobic conditions. This property
is consistent with this particular yeast’s ability to form films or pellicle which can be found on
the surface of the beer within the fermentation tank or cask. Brewers will not allow anyone to
disturb either the film or the pellicle during the aging process due to the increase risk of
oxidation (1).
The secondary by products produced by bret have the ability to accumulate to a much
greater extent than those of other yeast. The secondary products play a critical role in the sensory
35
profile of lambic beer. While the secondary products produced by bret account for a small
percentage of the total fermented sugars, they still play a critical role in the aroma of this beer
regardless of their low concentrations. The main compounds produced are the esters ethyl acetate
and ethyl lactate. These esters can be formed enzymatically or chemically. Esterase is the name
of the enzyme that can cause the formation of the esters by causing a chemical reaction between
ethanol and an organic acid. Brettanomyces displays a higher esterase activity then other yeasts
(Sacchromyces or Kloeckera) (53).
In lambic beer bret’s ability to synthesis ethylphenols (4-ethylphenol and 4-
ethylguaiacol) and vinylphenols are important to the unique characteristics of this particular style
(54). Bret is the only microorganism that is known to produce ethylphenols. While there are
some species of lactic acid bacteria and yeast that can produce ethylphenols in cultured media,
none of them have been found to be able to produce them in an actual beverage system (55).
Brettanomyces is a key player in the flavor profile of lambic and gueuze beer (2, 52). The
‘bretty’ character produces a wide array of different aromas and flavors such as mineral, tobacco,
barnyard, leathery, pharmaceutical and smoky (43, 53). The aroma compounds produced by bret
also have the ability to suppress desirable fruity notes (56). The horsy smell produced by bret can
vary from slight to very strong. The overall strength of the horsy smell is dependent upon the
fermentation conditions. Tetrahydropyridines are the compounds responsible for the horsy smell
(1). Tetrahydropyridines are produced when the enzyme esterase breaks down ethanol and the
amino acid lysine. Lysine is present in the wort and ethanol is formed after the initial
fermentation begins, creating an ideal environment for the production of tetrahydropyridines
formed by brettanomyces. A small quantity of the horsy flavor is desirable for this particular
style of beer (1, 57).
36
Gas Chromatography-Olfactometry
GC-O is a commonly used technique to analyze complex food flavors because of its
ability to provide information immediately regarding the presence of a certain aromatic
compound within a sample. Researchers have successfully identified over 8,000 volatile
compounds present in foods and beverages but typically only a few of these compounds actually
make up the characteristic aroma of a food or beverage. Separating the “active” from the
“inactive” volatile compounds is possible by combining the human olfactory system with
analytical techniques like gas chromatography-olfactometry (GC-O), aroma extraction dilution
analysis (AEDA), or CHARM (58, 59). Meilgaard was the first to study the effect that the
sensory contributions volatile compounds had on beer flavor. Meilgaard’s research focused on
calculating the odor active value (OAV: ratio of concentration to odor threshold) for over 239
compounds based upon quantitative data. In some GC-O configurations, the effluent is divided
between a FID and the sniffing port (60). This is because the effluent coming from the GC may
be too low in concentration to be detected by the FID. GC-O has been used in characterizing
how trace amounts of a compound can impact the aroma of a product (61).
The primary reason researchers use GC-O is so they can arrange their list of identified
aromatic compounds based upon their importance in the sample. This list can be arranged in a
number of different ways (62).
Similar to other alcoholic beverages, a beer’s particular aroma is made up of a number of
different chemical compounds with different polarities and with varying concentrations. The
composition of the raw ingredients and the fermentation process play large roles in the chemical
composition of a product. Alcoholic fermentation produces a number of chemical by-products
besides ethanol, such as esters, carbonyls, alcohols, and acids all of which are influenced by the
37
quality of the raw ingredients. Some chemical compounds can be present in levels as high as
mg/L while others in quantities as low as ng/L. The overall influence a compound has on the
aromatic profile of a product can vary. Typically, compounds present in trace amounts have a
greater influence over the aroma profile than those found at higher concentrations (63).
The human nose is one of the most valuable and sensitive tools currently available to
researchers conducting aroma analysis. The theoretical detection limit of the human nose is
around 10-19
moles, a much lower detection limit then the flame ionization detector (FID) present
on the GC. Aroma research begins with isolating and identifying aroma active compounds in a
food sample (64). For the characterization of aroma active compounds to occur, volatile
compounds must first be separated from nonvolatile compounds. Several methods used for
separation include solvent extraction, headspace concentration and distillation (65).
Gas chromatography-olfactometry (GC-O), also known as gc-sniffing, is an analytical
technique that utilizes a human being as the detector to smell the effluents coming from a gas
chromatography (GC) to characterize the volatile compounds present in the sample (63, 66, 67).
It is believed that GC-O developed shortly after James and Martin published their
description of a GC (66, 68). It was not until the mid-1960s that Fuller and Guadagni both
published papers on the use of gc-sniffing as a viable analytical technique (69, 70). The first use
of the name “gas chromatography-olfactometry” was not used until 1980 when Takeuchi and his
colleagues published their paper linking all experiments that utilized panelists sniffing effluents
from a gas chromatograph under a common name (66, 71).
A GC is a useful tool in its ability to separate volatile compounds within a sample.
However, it is unable to provide any information on the sensory intensity of a desired compound
within a sample. It is well accepted that not every single volatile detected by the GC plays a role
38
in the sensory profile of the sample. Research thus far has shown that generally only 10 – 30
compounds make up the aroma profile of a food sample and determining which of these
compounds are aroma active from several hundred can be difficult (64, 72). There are a few
compounds like sulfur compounds that have a low sensory threshold which are easily detectable
by the nose, but may or may not be detected by a GC due to the low quantities present in a
sample, indicating further concentration of the compound is needed (72).
A combination of both qualitative and quantitative analysis is conducted on every
compound that leaves the GC column to determine (1) if the compound is present in the sample
is above its sensory threshold; (2) what it smells like; (3) when it is being eluted from the
column; and (4) the overall intensity of the odor (63).
Gas Chromatography-Olfactometry Methodology
The earliest known work regarding flavor analysis was conducted over 50 years ago by
Patton and Josephson (73). The purpose of Patton and Josephson’s research was to estimate the
importance of certain flavor compounds based upon the ratio of the compound to its threshold
concentration. The ratio is based upon how much the compound is over its sensory threshold
level.
Modern day aroma research begins with selecting isolation and identification techniques
that will allow the researcher to identify the compounds present in a food sample (64). There are
two different sensory techniques used for determining the odor activity of compounds present in
foods. These two techniques were developed by two separate research groups, one in the United
States and one in Germany: (1) CHARM analysis by Acree and coworkers (74) and (2) aroma
extraction dilution analysis (AEDA) by Grosch and his coworkers (75, 76). These two methods
are based upon the detection of the odors present instead of estimating the intensity based upon a
39
stimulus at super threshold levels (77). In both procedures an extract of the food sample is
obtained and is diluted either 1:1 or 1:2. Each dilution is then analyzed using a GC-O (58).
CHARM
CHARM is an acronym for Combined Hedonic Aroma Response Measurement (61).
CHARM analysis is similar to AEDA in that they are both GC-O methods that look at odor
activity. A big difference between these two techniques is that charm looks at measuring the
dilution value throughout the entire time compounds are being eluted from the gas
chromatography while AEDA just looks at the maximum dilution value (60). When an odor is
detected by the panelists, he/she presses a computer mouse for the entire duration that the odor is
being detected. Once the odor is no longer detected, the mouse is released. The panelists are then
asked to pick a descriptor from a predetermined list. Having trained panelists is essential for this
type of analysis since an extended knowledge of different aromas and their descriptors are
necessary. With any type of psychophysical experiment, human error or bias can occur when
sniffers know too much information about the sample. To limit bias, samples should be
randomized. Error can also result due to fatigue, which is why sniffing sessions should last no
longer than twenty-five minutes. Since internal standards are not traditionally used with this
type of measurement, the chromatography must be precisely reproduced to ensure accuracy.
CHARM analysis requires special software and a computer. The software combines the time and
duration of each individual sniffer’s chromatogram into one final one to create an aromograph
with peaks and integrated peaks (CHARM values) (77), which are relative to the amount of the
chemical compound in the extract (60). The CHARM value can be calculated using the
following equation c=dn-1
, where n is equal to the number of times an aroma is smelled by all the
panelists and d is the dilution factor (77). CHARM analysis has been utilized to determine the
40
odor active compounds present in a number of different foods, beverages, and spices such as
beer (78), coffee (79, 80), citrus peel (81), coriander (82), as well as boiled potatoes (83).
Dilution Analysis
When using dilution analysis, an extract is diluted in a series of 1:2 or 1:3 dilutions. Each
dilution is then sniffed by a panelist until no significant odor is detected (66). A sniffer will begin
with the most concentrated sample and proceed down to the most diluted (77). When using
AEDA, the results are expressed using a flavor dilution (FD) factor (84), which is the ratio of the
concentration of the effluent in the initial extract to the concentration of the effluent in the most
diluted extract in which the effluent in detected by the GC-O. When using AEDA, the FD factor
is a relative measurement and is relative to the odor active value of the compound present in air.
An advantage of AEDA over CHARM analysis is that no computer or special software is
needed--only a pen and paper to write down retention times and odor descriptions, and this is one
reason why AEDA is more widely used then charm analysis. To create an AEDA aromagram,
the retention time is plotted (retention index or Kovats number) on the x-axis with the maximum
dilution value on the y-axis. AEDA has been utilized to identify the odor active compounds in a
number of different food products such as cheese (85), grapefruit juice (86), green and black tea
(87), popcorn (88), wines (89, 90), tequila (91), and coffee (84).
Time Intensity
McDaniel and co-workers developed another GC-O technique called OSME (92-94). A
major difference between OSME and AEDA is that OSME, while still depending on the
evaluation of a group of panelists, utilizes only a single concentration of the extract detected by
the GC-O. AEDA is based upon odor detection threshold while OSME is based upon perceived
intensity. OSME, or time intensity, looks at the estimated odor intensity of a compound based
41
upon time. Panelists move a resistor bar based upon the intensity of the effluent coming off the
GC as well as write a descriptor pertaining to the effluent. A trained sniffer will rate the intensity
of the effluent coming off the GC using an electronic time-intensity scaling device based on a
scale of 15 cm where 0 = none, 7 = moderate, 15 = extreme. The actual scaling device is coupled
with a computer data handling software that has the ability to produce FID-style aromagrams
known as osmegrams.
Time intensity GC-O is not as popular a technique as dilution analysis because of the
additional hardware (intensity transponder) and software requirements necessary to receive the
additional data from the transponder and GC. ChromPerfect is a type of chromatographic
software currently available and can rapidly provide a visualization of the FID chromatogram
and the sniffer’s GC/O response (58, 77). Time intensity has been used in the analysis of a
number of different food products such as blackberries (95), hop oil (96), wines (92), and citrus
products (97-99).
Solid Phase Microextraction (SPME)
Solid phase microextraction (SPME) is a relatively new extraction technique for the
rapid, solventless extraction of volatile and semi-volatile organic compounds present in the
headspace above a solid or liquid sample (100, 101). This technique utilizes a small 1-2 cm
piece of fused silica (102). SPME was first developed by Pawlisyn in 1997 to analyze
environmental samples like air, soil, and water (103, 104). Since then it has been used to analyze
volatiles compounds found in a variety of foods (105).
SPME is based on reaching an equilibrium between the volatile compounds present in the
headspace above the sample and the concentration on the coated fiber (102). Once the fiber has
reached equilibrium with the sample, the fiber is then thermally desorbed into a GC carrier gas
42
releasing the volatile compounds to be analyzed. The volatile profile obtained during analysis is
based upon the profile of the sample and how the sampling parameters are controlled. While
quantification is possible with this technique, every step in the process must be carefully
controlled to ensure consistent results. Incorporating internal standards into the sample matrix
and always adhering to specific extraction times will ensure proper quantification of the sample.
Every organic compound will behave differently with the SPME fiber based upon its volatility,
polarity, organic/water partition coefficient, volume of the sample or headspace volume,
agitation speed, pH of the solution and the extraction temperature (100).
SPME Process. Samples are placed into a vial or similar container and sealed with a
septum type cap. Fibers should be conditioned prior to their initial use because the polymer
phase has the ability to absorb chemical compounds from the laboratory air potentially resulting
in large background noise on the chromatogram. Regardless whether the sample is liquid or
solid, the needle must first penetrate the septum of the sampling vial before extraction can begin.
For liquid sampling, the fiber is extended into the sample during extraction. For headspace
sampling, the fiber is extended into the vapor phase above the solid or liquid sample. When
penetrating the septum of the vial, care needs to be taken not to bend the needle. Using a clean
needle to puncture the septa of the sampling vial and the GC injection port is one way to reduce
the risk of bending needles.
Placing a small stir bar into the sampling vial could potentially help the sample reach
equilibrium faster. After the fiber has been exposed to the sample for a predetermined amount of
time (1 – 20 minutes), the fiber is retracted back into the needle before being removed from the
septum. Once removed from the septum, the needle is then inserted into the GC port for 1 – 8
minutes. The analytes that were absorbed to the fiber are thermally desorbed. The penetration
43
depth of the needle into the GC injection port is not critical as long as the exposed fiber is
extended into the heated zone of the injection system. When trying to analyze samples with trace
amounts of a particular analyte, using a preconcentration step can help ensure proper
identification of compounds present in a sample. To ensure that the preconcentration step is not
wasted, the researcher should use as small as possible a split ratio (10:1) the split/splitless
capillary injection port. The injection port liner should be no greater than 1 mm in diameter to
help provide sharper peaks for some of the higher boiling volatile compounds. Although a
standard split liner packed with glass wool can provided satisfactory chromatography results,
care must be taken to ensure that the SPME fiber does not come into contact with the glass wool
when exposed during the thermal heating process. Extending the fiber into the glass wool could
lead to a broken or damaged fiber (100).
SPME Fiber.
The original fiber used by Pawliszyn was coated with polydimethylsiloxane (PDMS) to
extract the volatile and semi-volatile compounds present in water samples. A number of different
coatings are available that can add to extraction capabilities including carboxen, divinyl benzene,
polyacrylate, and carbowax (polyethylene glycol; PEG). Commercially available SPME fibers
can be coatedwith one type of coating or combined with multiple coatings (77). The fused silca
fiber can be coated with either a liquid or solid phase to extract and concentrate these compounds
(102). For general use, using a nonpolar thick film fiber can provide high sensitivity for most
compounds (100). If the compounds of interest in a sample have a molecular weight less than
125, the manufacturer recommends using the 85 µm Carbowax/PDMS fiber. Polarity plays a
critical role in the efficiency of extraction for compounds with a molecular weight greater than
125. When the compounds of interest in a sample have molecular weights greater than 125, it is
44
recommended that polyethylene glycol (PEG), polyacrylate (PA), and DVB/Carboxen fibers
should be used for extraction (106). Along with different polarities, fibers can have different
thickness. Using a fiber with a thicker coating has the advantage of allowing for more analyte to
be loaded onto the liquid coating, thus allowing more analyte to be used for analysis and
detection. There are three different thickness commercially available at this time 100 µm, 30
µm, and 7 µm. The larger 100 µm fiber has the ability to absorb a greater number of analytes
then any other thickness however it may not release the analytes as easily as other fibers would.
This can be seen when you have subsequent carryover from one sample to the next. The intended
use for the 30 µm thick fiber is to analyze semi-volatile compounds while the 7 µm thick fiber is
intended to be used for immersing and extracting semi-volatile compounds with a molecular
weight greater than 250 (77). If one is interested in extracting higher boiling compounds like
polyaromatic hydrocarbons, higher temperatures are required to thermal desorb the analytes from
the fiber into the GC injection port. In general, the thicker the fiber, the longer it will take before
equilibrium can be reached; however, an increase in sensitivity is possible due to the amount of
analyte that can adhere to the fiber (100).
As more and more researchers move towards using automated sampling systems similar
to the CTC robotic auto sampler, new metal alloy fibers are being developed. The reason for this
is that the CTC auto sampler has the ability to agitate samples while exposing the fiber located
either in the sample or above the headspace. The advantage of using this new fiber is that the
core material allows for more durability due to the consistent agitation of the fiber during
exposure when using the CTC auto sampler (CTC, Zwingen, Switzerland) (77).
Fibers also have the ability to come in different needle gauge sizes. The smaller 24 gauge
needle is typically used for the extraction and injection using a manual holder and silicon
45
polymer septum GC inlet port. The purpose of using a smaller gauge needle is to decrease the
septum coring that can occur with larger gauge needles. The 23 gauge needle is recommended
when using the Merlin Microseal (Merlin Instruments, Half Moon Bay, CA USA). An advantage
the Merlin Microseal has over the silicon polymer spetum GC inlet port is that it has a longer
shelf life (1 year or 25,000 injections) and does not contaminate the GC with shaved silica
particles. This size needle prevents leakage when the needle is being desorbed while inserted into
the injection port (77).
Prior to their initial use, SPME fibers should first be conditioned as described by the
manufacturer. The purpose of this is to remove any chemical compounds that could have adhered
to the fiber during manufacturing or from the environment itself, because these compounds can
obscure chromatographic peaks. Additional bake out sessions are recommended to remove
chemical compounds that could have adhered to the fiber during consistent use. In addition to
brief daily bake out sessions, it is suggested that blanks be used during sampling to ensure that
there is no carryover effect from one sample to the next when using an auto sampler.
One advantage of using SPME over traditional static headspace extraction is that SPME
is not limited by the volatile compounds partitioning into the headspace. SPME results are
dependent upon two partitioning coefficients not like the one for static headspace. The first
partition coefficient is the same as that of static headspace. This is based upon the partition
between the sample and the sample headspace. This partitioning main application is to determine
the amount of time required to go from either a solid or liquid sample phase into the headspace.
It is also used to determine how long the sample should be allowed to reach equilibrium before
penetrating the seal of the septum to start the extraction process. If the time and temperature is
46
not kept consistent from sample to sample, the headspace concentration values will vary from
sample to sample thus decreasing overall accuracy and precision.
It is essential that equilibrium be reached between the samples and headspace because the
concentration of the analyte will be lowered. Unfortunately, most procedures do not allow for the
sample to reach equilibrium, requiring precise control over temperature and time for
reproducibility. There are ways to increase headspace analyte concentration by increasing the
sampling temperature or by adding salt to the aqueous sample to cause a change in the ionic
strength. However salt does not always work (107).
The second partition is based upon the amount of time the fiber is exposed to the sample.
Another important factor is the competition between the different chemical compounds present
in the headspace and their ability to adhere to the fiber (77).
One advantage of using SPME over other sampling techniques is that no solvent is
required and extraction of the compounds can occur without heating the sample. This can greatly
reduce the chance of creating chemical artifacts (100).
Simultaneous Distillation Extraction (SDE)
Simultaneous distillation extraction is one of the oldest separation techniques used today
to separate volatile compounds from non-volatile compounds (110). The development of
sophisticated extraction and distillation methods to separate volatile compounds present in a food
matrix from non-volatile ones has baffled researchers for centuries. Finding a viable separation
technique is always the challenge for researchers who are interested in identifying and
quantifying food compounds. Separation techniques should meet certain requirements: (1)
extraction techniques should not exclude compounds that play a vital role in the overall flavor of
the food; (2) extraction technique should not alter key compounds; and (3) separating non-
47
volatile compounds that could potentially interfere with chromatograph techniques is also
essential.
SDE is widely used by a number of flavor researchers because of its versatility. SDE is a
simple fast aroma extraction technique, however because of the elevated temperature
experienced during distillation, it can potentially lead to the formation of artificial compounds
(110). Water is a major volatile found in food which makes distillation a reasonable choice for
isolation. The presence of carbohydrates, lipids, and proteins could potentially interfere with the
distillation process because of the formation of foam and sticky gel. Antifoaming agents can be
used to prevent foaming or by keeping the temperature below 50ºC, because starches began to
gelatinize around 65 ºC. Proteins can denature, but they tend not to do so below 50 ºC (60).
Solvent Assisted Flavor Evaporation (SAFE)
In a 1999 paper written by Engel and his co-workers, he describes a method that couples
vacuum distillation, cold trapping and solvent extraction for solid samples (110). Solvent
extraction is required for sold samples like popcorn (111), coffee, and bread (75). This particular
method has been proven to be superior to the traditional SDE method because of its better
temperature control and speed. Solvent extraction is safer than other methods that utilize high
vacuum distillation or cold trapping techniques. Unlike SDE, which can lead to the formation of
artificial compounds, SAFE products an extract that is a close approximation of the original
flavor (77, 112).
48
Literature Cited
1. Guinard, J. X., Lambic. Brewers Publications: Boulder, 1990; p 159.
2. Van Oevelen, D.; Spaepen, M.; Timmermans, P.; Verachtert, H., Microbiological
Aspects of Spontaneous Wort Fermentation in Production of Lambic and Gueuze. J. Inst. Brew.
1977, 83, 356-360.
3. De Keersmaecker, J., The mystery of lambic beer. Scientific American 1996, 275, 74.
4. Cantillon. http://www.cantillon.be/br/3_101 (August 24),
5. Steen, J. v. d., Geuze & kriek : the secret of lambic. Lannoo: Tielt, Belgium, 2011.
6. Arvik, T., Henick-Kling, T., Brettanomyces bruxellensis occurrence, growth, and effect
on wine flavor. Practical Winery and Vineyard 2002, May/June, 117-123
7. Chatonner, P.; Dubourdieu, D.; Boidron, J. N., The Origin of Ethylphenols in Wines.
Food Agric. 1992, 60, 165 - 178.
8. Harrison, G. A., Flavour of Beer - Review. J. Inst. Brew. 1970, 76, 486-&.
9. Meilgaard, M.; Civille, G. V.; Carr, B. T., Sensory evaluation techniques. Taylor &
Francis: Boca Raton, 2007.
10. Dawoud, E. Characteristics of Enterocateriaceae involved in Lambic Brewing.
Katholieke Universiteit te Leuven, Fakulteit der Landbouwwetenschappen, Leuven, Belgium,
1987.
11. Meilgaard, M. C., Prediction of flavor differences between beers from their chemical-
composition. Journal of Agricultural and Food Chemistry 1982, 30, 1009-1017.
12. Engan, S., Beer composition: volatile substances. Academic Press: London; New York,
1981; Vol. 2.
13. Van Oevelen, D.; Delescaille, F.; Verachtert, H., Synthesis of Aroma Components during
Spontaneous Fermentation of Lambic and Gueueze. J. Inst. Brew. 1976, 82, 322-326.
14. Meilgaard, M. C., Flavor Chemistry of beer: Part I: Flavor Interaction between principal
volatiles. Tech. Quart. Master Brewers Ass. Am. 1975, 12, 107.
15. Picket, J. A.; Coates, J.; Peppard, T. L.; Sharpe, F. R., Chemical characterization of
differences between ales and lagers. J. Inst. Brew 1976, 82, 233.
16. NykÄNen, L.; Puputti, E.; Suomalainen, H., Volatile Fatty Acids in Some Brands of
Whisky, Cognac and Rum. Journal of Food Science 1968, 33, 88-92.
17. Suomalai.H, Yeast and its effect on flavour of alcoholic beverages. J. Inst. Brew. 1971,
77, 164-&.
49
18. Williams, A. A., Flavour Research and the cider industry. J. Inst. Brew 1974, 80, 455.
19. Spaepen, M.; Vanoevelen, D.; Verachtert, H., Fatty-Acids and Esters produced during
Spontaneous Fermentation of Lambic and Gueuze. J. Inst. Brew. 1978, 84, 278-282.
20. Thorne, R. S. W., The Contribution of Yeast to Beer Flavor. Tech. Quart. Master
Brewers Ass. Am. 1966, 3, 160.
21. Cook, A. H.; Kirsop, B. H., The content of some organic acids in beer and other
fermentation media. J. Inst. Brew 1974, 80, 474.
22. Engan, S., Organoleptic Threshold Values of Some Organic-Acids in Beer. J. Inst. Brew.
1974, 80, 162-163.
23. Anderson, R. J.; Clapperton, J. F.; Crabb, D.; Hudson, J. R., Dimethyl sulfide as a feature
of lager flavor. J. Inst. Brew. 1975, 81, 208-213.
24. Hill, P. G.; Smith, R. M., Determination of sulphur compounds in beer using hedspace
solid-phase microextraction and gas chromatographic analysis with pulsed flame photometric
detection. J. Chrom. A. 2000, 872, 203.
25. Walker, M. D.; Simpson, W. J., Production of volatile sulphur compounds by ale and
lager brewing strains of Saccharomyces cerevisiae. Lett. App. Microbiol. 1992, 16, 40.
26. Anderson, R. J.; Howard, G. A., Origin and occurrence fo volatile sulfur-compounds in
british ales and lagers. J. Inst. Brew. 1974, 80, 357-370.
27. Stafisso, A.; Marconi, O.; Perretti, G.; Fantozzi, P., Determination of dimethyl sulphide
in brewery samples by headspace gas chromatography mass spectrometry (HS-GC/MS). Ital. J.
Food Sci. 2011, 23, 19-27.
28. Kavanagh, T. E.; Steward, S. R.; Hilderband, R. P.; Clarke, B. J.; Meeker, F. J., Trace
volatile constituents of beer. Dimethyl Sulphide formation in Malt. J. Inst. Brew 1975, 81, 322.
29. White, F. H.; Wainwright, T., Presence of 2 Dimethyl sulfide precursors in malt, their
control by malt kilning conditions, and their effect on beer DMS levels. J. Inst. Brew. 1977, 83,
224-230.
30. Anderson, R. J.; Howard, G. A., Production of hydrogen-sulfide by yeast and by
zymomonas-anaerobia. J. Inst. Brew. 1974, 80, 245-251.
31. Ingledew, W. M., Effect of bacterial contaminants on beer. A review. J. Amer. Soc. Brew.
Chem 1979, 37, 145.
32. White, F. H.; Wainwright, T., Isolation and partial characterization of dimethyl sulfide
precursor in green malt, and its effect on beer dimethyl sulfide levels. J. Inst. Brew. 1976, 82,
292-296.
50
33. Anderson, R. G.; Howard, G. A., The origin and occurance of volatile sulphur
compounds in British ale and lagers. J. Inst. Brew 1974, 80, 357.
34. Van Oevelen, D.; Verachtert, H., Slim Prouction by Brewery Strains of Pediococccus
Journal of American Society of Brewing Chemistry 1979, 34-37.
35. White, F. H.; Parsons, R., The development of dimethyl sulphide in malting brewing and
fermention. In Eur. Brew. Conv. Proc. Congr. , Nice, 1975; Vol. 15, p 721.
36. Branen, A. L.; Keenan, T. W., Biosynthesis of alpha-acetolactate and its conversion to
diacetyl and acetoin in cell-free extracts of Lactobaccilus casei. . Can. J. Microbiol 1972, 18,
479.
37. EBlinger, H. M., Handbook of Brewing Processes, Technology, Markets. Wiley-VCH:
Betz-Druck 2009; p 746.
38. Vanderhaegen, B.; Neven, H.; Coghe, S.; Verstrepen, K. J.; Derdelinckx, G.; Verachtert,
H., Bioflavoring and beer refermentation. Appl. Microbiol. Biotechnol. 2003, 62, 140-150.
39. Verachtert, H.; Dawoud, E., Microbiology of lambic-type beers. Journal of Applied
Bacteriology 1984, 57, R11-R12.
40. Shantha Kumara, H. M. C. Microbiology and biochemistry of lambic beer
overattenuation. Katholieke Universiteit te Leuven, Fakulteit der Landbouwwetenschappen,
[Leuven, Belgium], 1990.
41. Priest, F. G.; Campbell, I., Brewing microbiology. Elsevier Applied Science: London;
New York, 1987.
42. Shantha Kumara, H. M. C. Microbiology and biochemistry of lambic beer
overattenuation. Katholieke Universiteit te Leuven, Fakulteit der Landbouwwetenschappen,
Leuven, Belgium, 1990.
43. Etievant, P., Wine. In Volatile Compounds in Foods and Beverages, Maarse, H., Ed.
Marcel Dekker: New York, 1991; pp 483 - 546.
44. Verachtert, H.; Dawoud, E.; Kumara, H., Interactions Between Enterobacteriaceae and
Saccharomyces-Cerevisiae during wort fermentation. Yeast 1989, 5, 67-72.
45. Priest, F. G., The Classification and nomenclature of Brewing Bacteria: A Review. J. Inst
Brew 1981, 61, 122-.
46. Skinner, F. A.; Lovelock, D. W.; Gibbs, B. M., Identification methods for
microbiologists. Academic Press: London; New York, 1979.
47. Rayne S. and Eggers, N., 4-Ethylphenol and 4-Ethylguaiacol concentrations in barreled
red wines from the Okanagan Valley Appellation, British Columbia. Am. J. Enol. Vitic. 2008, 59,
92-97.
51
48. Jimenez, J.; Fidalgo, M.; Alguacil, M., Brettanomyces. 1999; p 302 - 308.
49. Henschke, P., Curtin, C., & Grbin, P., Molecular characterization of the wine
spoilage yeast Dekkera (Brettanomyces) bruxellensis. Microbiology Australia 2007, 28, 76 - 78.
50. Wedral, D.; Shewfelt, R.; Frank, J., The challenge of Brettanomyces in wine. LWT-Food
Sci. Technol. 2010, 43, 1474-1479.
51. Loureiro, V.; Malfeito-Ferreira, M., Spoilage yeasts in the wine industry. Int. J. Food
Microbiol. 2003, 86, 23-50.
52. Boulton, C.; Quain, D., Brewing yeast and fermentation. Blackwell Science ; Iowa State
University Press [distributor]: Oxford; Malden, MA; Ames, Iowa, 2001.
53. Boulton, R. B., Principles and practices of winemaking. Aspen: Gaithersburg, Md., 1998.
54. Heresztyn, T., Metabolism of Volatile Phenolic-Compounds from Hydroxycinnamic
Acids by Brettanomyces Yeast. Arch. Microbiol. 1986, 146, 96-98.
55. Romano, A.; Perello, M. C.; Lonvaud-Funel, A.; Sicard, G.; de Revel, G., Sensory and
analytical re-evaluation of “Brett character”. Food Chem. 2009, 114, 15-19.
56. Gerbaux, V.; Vincent, B., Effects of volatile phenols on sensory quality of red wines
from different cultivars. Revue des Enologues 2001, 99, 15 - 18.
57. Daenen, L.; Sterckx, F.; Delvaux, F. R.; Verachtert, H.; Derdelinckx, G., Evaluation of
the glycoside hydrolase activity of a Brettanomyces strain on glycosides from sour cherry
(Prunus cerasus L.) used in the production of special fruit beers. FEMS Yeast Res. 2008, 8,
1103-1114.
58. Grosch, W., Evaluation of the Key Odorants of Foods by Dilution Experiments, Aroma
Models and Omission. Chem. Senses 2001, 26, 533-545.
59. Fritsch, H. T.; Schieberle, P., Identification Based on Quantitative Measurements and
Aroma Recombination of the Character Impact Odorants in a Bavarian Pilsner-type Beer.
Journal of Agricultural and Food Chemistry 2005, 53, 7544-7551.
60. Acree, T. E.; Teranishi, R., Flavor Science: Sensible Principles and Techniques.
American Chemical Society: Washington, DC, 1993; p 351.
61. Mistry, B. S.; Reineccius, T.; Olson, L. K., Gas Chromatography - Olfactometry for the
determination of key odorants in foods. In Techniques for Analyzing Food Aroma, Marsili, R.,
Ed. Marcel Dekker, Inc.: New York, 1997; pp 265 - 292.
62. Ho, C.-T.; Manley, C. H. In Flavor measurement, New York, 1993, M. Dekker: New
York.
52
63. Plutowska, B.; Wardencki, W., Application of gas chromatography-olfactometry (GC-O)
in analysis and quality assessment of alcoholic beverages - A review. Food Chem. 2008, 107,
449-463.
64. Reineccius, G., Flavor Chemistry and Technology. 2nd ed.; CRC Press: Boca Raton,
2006.
65. Acree, T. E.; Teranishi, R., Flavor Science: Sensible Principles and Techniques.
American Chemical Society: Salem, 1993; p 351.
66. Ho, C.-T.; Manley, C. H., Flavor Measurement. Marcel Dekker, Inc: Chichago, 1993; p
379.
67. Plotto, A.; McDaniel, M. R.; Mattheis, J. P., Characterization of changes in 'Gala' apple
aroma during storage using osme analysis, a gas chromatography-olfactometry technique.
Journal of the American Society for Horticultural Science 2000, 125, 714-722.
68. James, A. T.; Martin, A. J. P.; Smith, G. H., Gas-liquid partititon chromatography - The
separation and micro-estimation of ammonia and the methylamines. Biochemical Journal 1952,
52, 238-242.
69. Flath, R. A.; Black, D. R.; Guadagni, D. G.; McFadden, W. H.; Schultz, T. H.,
Identification and organoleptic evaluation of compounds in Delicious apple essence. Journal of
Agricultural and Food Chemistry 1967, 15, 29-35.
70. Fuller, G. H.; Tisserand, G. A.; Steltenk.R, Gas Chromatography with Human Sensor -
Perfumer Model. Annals of the New York Academy of Sciences 1964, 116, 711-&.
71. Takeuchi, T.; Nagata, Y.; Nakayama, N.; Shigeta, Y., Determination of odor components
by gas chromatography-olfactometry. Akushu no Kenkyu 1980, 44, 20 - 27.
72. Taylor, A. J., Food Flavour Technology. Sheffield Academic Press: Boca Raton, FL,
2002; p 302.
73. Patton, S.; Josephson, D. V., A Method for Determining significance of volatile flavor
compounds in Foods Journal of Food Science 1957, 22, 316-318.
74. Acree, T. E.; Barnard, J.; Cunningham, D. G., A procedure for the sensory analysis of gas
chromatographic effluents. Food Chem. 1984, 14, 273 - 286.
75. Schieberle, P.; Grosch, W., Evaluation of the flavour of wheat and rye bread crusts by
aroma extract dilution analysis. Zeitschrift für Lebensmitteluntersuchung und -Forschung A
1987, 185, 111-113.
76. Grosch, W.; Ullrich, F., Identification of important volatile flavor compounds formed
during antioxidantion of linoleic and linolenic acids. J. Am. Oil Chem. Soc. 1987, 64, 624-624.
53
77. Goodner, K.; Rousseff, R., Practical analysis of flavor and fragrance materials. Wiley:
Hoboken, N.J., 2011.
78. Murakami, A. A.; Goldstein, H.; Navarro, A.; Seabrooks, J. R.; Ryder, D. S.,
Investigation of beer flavor by gas chromatography-olfactometry. J. Am. Soc. Brew. Chem. 2003,
61, 23-32.
79. Sagara, Y.; Kaminishi, K.; Goto, E.; Watanabe, T.; Imayoshi, Y.; Iwabuchi, H.,
Characteristic evaluation for volatile components of soluble coffee depending on freeze-drying
conditions. Dry. Technol. 2005, 23, 2185-2196.
80. Deibler, K. D.; Acree, T. E.; Lavin, E. H., Aroma analysis of coffee brew by gas
chromatography-olfactometry. In Food flavors : formation, analysis, and packaging influences
Contis, E. T., Ed. Elsevier: Amsterdam; New York, 1998; pp 69 - 78.
81. Gaffney, B. M.; Haverkotte, M.; Jacobs, B.; Costa, L., Charm analysis of two citrus
sinensis peel oil volatiles. Perfumer & Flavorist 1996, 21, 4 - 5.
82. Eyres, G.; Dufour, J. P.; Hallifax, G.; Sotheeswaran, S.; Marriott, P. J., Identification of
character-impact odorants in coriander and wild coriander leaves using gas chromatography-
olfactometry (GCO) and comprehensive two-dimensional gas chromatography-time-of-flight
mass spectrometry (GC x GC-TOFMS). J. Sep. Sci. 2005, 28, 1061-1074.
83. Jensen, K.; Acree, T. E.; Poll, L., Identification of odour-active aroma compounds in
stored boiled potatoes. In Frontiers of Flavour Science, Schieberle, P.; Engel, K. H., Eds.
Deutsche Forschugsanstalt für Lebensmittelschemie: Munich, 2000; pp 65 - 68.
84. Grosch, W., Detection of potent odorants in foods by aroma extract dilution analysis.
Trends in Food Science & Technology 1993, 4, 68-73.
85. Qian, M.; Reineccius, G., Potent aroma compounds in Parmigiano Reggiano cheese
studied using a dynamic headspace (purge-trap) method. Flavour and Fragrance Journal 2003,
18, 252-259.
86. Buettner, A.; Schieberle, P., Characterization of the most odor-active volatiles in fresh,
hand-squeezed juice of grapefruit (Citrus paradisi Macfayden). Journal of Agricultural and
Food Chemistry 1999, 47, 5189-5193.
87. Guth, H.; Grosch, W., Identification of potent odorants in static headspace samples of
green and black tea powders on the basis of aroma extract dilution anlysis (AEDA). Flav. Fragr.
J. 1993, 8, 173 - 178.
88. Schieberle, P., Primary odorants in popcorn. J. Agric. Food Chem 1991, 39, 1141 - 1144.
89. Fang, Y.; Qian, M., Aroma compounds in Oregon Pinot Noir wine determined by aroma
extract dilution analysis (AEDA). Flavour and Fragrance Journal 2005, 20, 22-29.
54
90. Ferreira, V.; Ortin, N.; Escudero, A.; Lopez, R.; Cacho, J., Chemical characterization of
the aroma of Grenache rose wines: Aroma extract dilution analysis, quantitative determination,
and sensory reconstitution studies. Journal of Agricultural and Food Chemistry 2002, 50, 4048-
4054.
91. Benn, S. M.; Peppard, T. L., Characterization of tequila flavor by instrumental and
sensory analysis. Journal of Agricultural and Food Chemistry 1996, 44, 557-566.
92. Miranda-Lopez, R.; Libbey, L. M.; Watson, B. T.; McDaniel, M. R., Odor analysis of
pinot-noir wines from grapes of different maturities by a gas chromatography of olfactometry
technique (OSME). Journal of Food Science 1992, 57, 985-&.
93. McDaniel, M. R.; Miranda-lopez, R.; Watson, B. T.; Micheals, N. J.; Libbey, L. M.,
Pinot noir aroma: a sensory/gas chromatographic approach. Developments in food science 1990,
24.
94. da Silva, M. A. A. P.; Lundahl, D. S.; McDaniel, M. R., The capability and
psychophysics of Osme: a new GC-olfactometry tecynique. In Trends in flavour research,
Weurman Flavour Research, S.; Maarse, H.; Heij, D. G. v. d., Eds. Elsevier: Amsterdam; New
York, 1994; Vol. 35, pp 191 - 209.
95. Klesk, K.; Qian, M., Preliminary aroma comparison of Marion (Rubus spp. hyb) and
Evergree (R-laciniatus L) blackberries by dynamic headspace/OSME technique. Journal of Food
Science 2003, 68, 697 - 700.
96. Sanchez, N. B.; Lederer, C. L.; Nickerson, G. B.; Libbey, L. M.; McDaniel, M. R.,
Sensory and analytical evaluation of hop oil oxygenated fractions. . In Developments in food
science, Charalambous, G., Ed. Food Science and Human Nutrition: 1992; Vol. 29.
97. Lin, J. M.; Rouseff, R. L.; Barros, S.; Haim, M., Aroma composition changes in early
season grapefruit juice produced from thermal concentration. Journal of Agricultural and Food
Chemistry 2002, 50, 813-819.
98. Rouseff, R.; Bazemore, R.; Goodner, K.; Naim, M., GC-olfactometry with solid phase
microextraction of aroma volatiles from heated and unheated orange juice. In Headspace
Analysis of Foods and Flavors: Theory and Practice, Rouseff, R. L.; Cadwallader, K. R., Eds.
Kluwer Academic / Plenum Publ: New York, 2001; Vol. 488, pp 101-112.
99. Bazemore, R.; Goodner, K.; Rouseff, R., Volatiles from unpasteurized and excessively
heated orange juice analyzed with solid phase microextraction and GC-olfactometry. Journal of
Food Science 1999, 64, 800-803.
100. Harmon, A. D., Solid-Phase Microextraction for the analysis of flavors. In Techniques for
Analyzing Food Aroma, Marsili, R., Ed. Marcel Dekker: New York, 1997; pp 81-122.
101. Self, R.; Royal Society of, C., Extraction of organic analytes from foods : a manual of
methods. Royal Society of Chemistry: Cambridge, 2005.
55
102. Riu-Aumatell, M.; Vargas, L.; Vichi, S.; Guadayol, J. M.; López-Tamames, E.;
Buxaderas, S., Characterisation of volatile composition of white salsify (Tragopogon porrifolius
L.) by headspace solid-phase microextraction (HS-SPME) and simultaneous distillation–
extraction (SDE) coupled to GC–MS. Food Chem. 2011, 129, 557-564.
103. Pawliszyn, J., Solid Phase Microextraction. Theory and Practice. Wiley-VCH: New
York, 1997.
104. Gorecki, T.; Pawliszyn, J., Field-portable solid-phase microextraction fast GC system for
trace analysis. Field Analytical Chemistry and Technology 1997, 1, 277-284.
105. Taylor, A. J., Food Flavour Technology. Sheffield Academic Press: Boca Raton, 2002; p
302.
106. Shirey, R., Sample prep made easy. SPME Newsletter 1999, Winter 1999/2000.
107. Solid phase microextraction: theory and optimization of of conditions. In Supleco
Bulletin: 1998; Vol. 923, pp 1-8.
108. Supelco, Solid phase microextraction: Theory and optimization of conditions. Bulletin
923A 1999.
109. Ormsby, M., Analysis of Laminated Documents Using Solid-Phase Microextraction.
Journal of the American Institute for Conservation 2005, 44, 13 - 26.
110. Engel, W.; Bahr, W.; Schieberle, P., Solvent assisted flavour evaporation - a new and
versatile technique for the careful and direct isolation of aroma compounds from complex food
matrices. Eur. Food Res. Technol. 1999, 209, 237-241.
111. Schieberle, P., Quantitation of Important Roast-Smelling Odorants in Popcorn by Stable
Isotope dilution assays and model studies on flavor formation during popping. Journal of
Agricultural and Food Chemistry 1995, 43, 2442-2448.
112. Werkhoff, P.; Brennecke, S.; Bretschneider, W.; Betram, H.-J., Modern Methods for
isolating and quantifying volatile flavor and fragrance compounds. In Flavor, Fragrance and
Odor Analysis, Marsili, R., Ed. Marcel Dekker Inc.: New York, NY, 2002; pp 139 - 204.
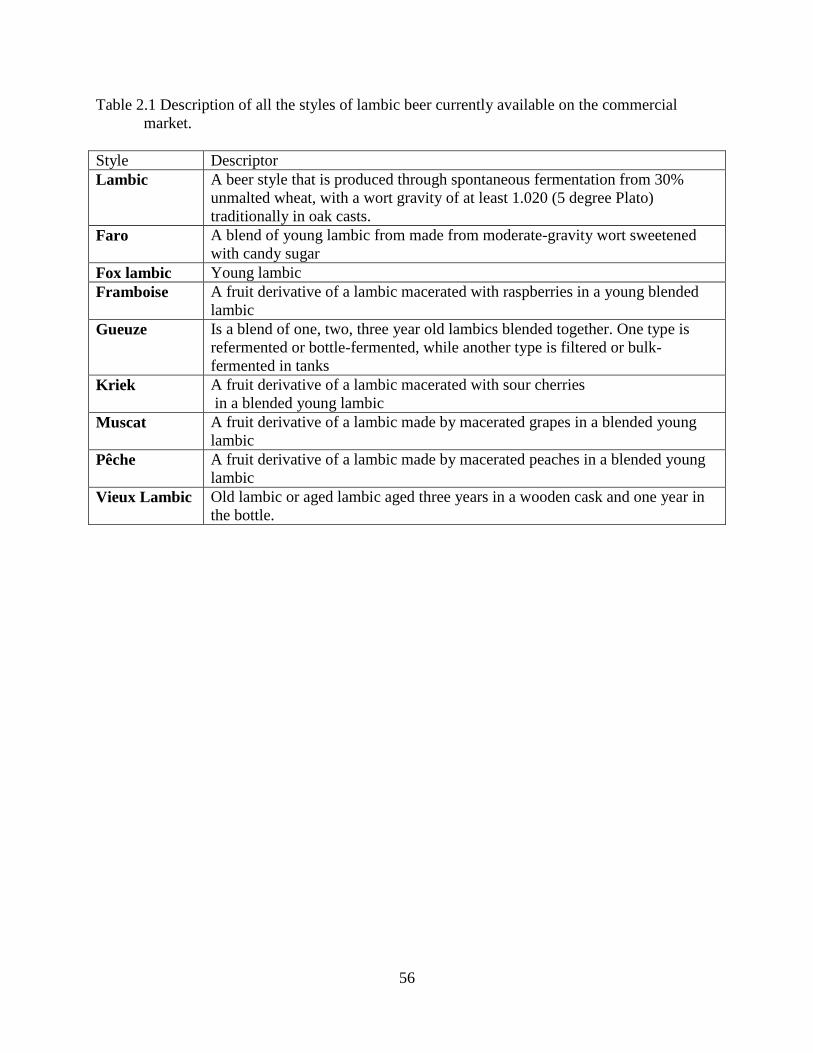
56
Table 2.1 Description of all the styles of lambic beer currently available on the commercial
market.
Style Descriptor
Lambic A beer style that is produced through spontaneous fermentation from 30%
unmalted wheat, with a wort gravity of at least 1.020 (5 degree Plato)
traditionally in oak casts.
Faro A blend of young lambic from made from moderate-gravity wort sweetened
with candy sugar
Fox lambic Young lambic
Framboise A fruit derivative of a lambic macerated with raspberries in a young blended
lambic
Gueuze Is a blend of one, two, three year old lambics blended together. One type is
refermented or bottle-fermented, while another type is filtered or bulk-
fermented in tanks
Kriek A fruit derivative of a lambic macerated with sour cherries
in a blended young lambic
Muscat A fruit derivative of a lambic made by macerated grapes in a blended young
lambic
Pêche A fruit derivative of a lambic made by macerated peaches in a blended young
lambic
Vieux Lambic Old lambic or aged lambic aged three years in a wooden cask and one year in
the bottle.
57
CHAPTER 3: COMPARISON OF TWO EXTRACTION TECHNIQUES, SPME AND
SDE SAFE FOR THE ANALYSIS OF LAMBIC BEER
Abstract
Lambic beers are the only beers currently being brewed that undergo a natural
fermentation process. Lambic beers are only produced within 500 square kilometers of Brussels
and Payottenland, a valley on the Senne River located on the western side of Brussels. This
particular region appears to have the perfect combination of airborne microorganisms required to
make a consistent beer through spontaneous fermentation (1). Limited research is currently
available describing the volatile and semi-volatile compounds present in lambic beers. The
purpose of this study was to compare two extraction techniques: SPME (solid-phase
microextraction) and SDE (simultaneous distillation and extraction), coupled with SAFE
(solvent assisted flavor evaporation), for the isolation of flavor compounds present in
commercial available lambic gueuze beer using GC-MS, SPME-PHPD (photometric pulse flame
detector) and GC-O (OSME or AEDA) techniques. A total of 101 compounds were identified
using two different extraction techniques (63 volatile compounds and 38 sulfur compounds).
SPME was able to identify 45 of the 63 volatile compounds, while SDE/SAFE was able to
identify 46 of the 63 volatile compounds. The major volatile chemical classes were alcohols,
acids, phenols, ketones, and esters. Each method was able to identify compounds that the other
one could not. In comparing the two extraction methods for GC-O using SPME, 28 volatile
compounds were identified. SDE/SAFE was able to identify 32 volatile compounds, six of which
were found using both extraction methods. Ethanol was found to be the highest ranking odor
active compound using SPME, followed by 1-(furan-2-yl)-ethanone, unknown sulfur, ethyl
isobutyrate, and 3-methylbutanoic acid. Phenyl methanol and 2-methyl-butanoic acid both had
58
flavor dilution (FD) factors of 729, followed by 3,5-dimethyl-1,2,4-trithiolane and 4-ethylphenol
with FD factors of 243.
59
Introduction
Alcoholic beverages are a complex mixture of volatile and semi-volatile compounds
belonging to several different chemical families including higher alcohols, ethyl esters, fatty
acids, higher alcohol, isoamyl esters, carbonyl compounds, furanic compounds, terpenoids, C13-
norisoprenoids, and volatile phenols (2). The complex combination of chemical compounds
found in alcoholic beverages plays a vital role in the appearance, aroma, flavor, and mouthfeel.
The combination of taste and olfactory properties are often responsible for the quality, character,
and consumer acceptability of alcoholic beverages. Similar to other alcoholic beverages, a beer’s
aroma is made up of hundreds of different chemical compounds having different polarities and
concentrations (3).
Alcohol beverages contain over 800 volatile compounds, but only ten to thirty of them
are generally aroma active (4-6). Compounds present in different alcoholic beverages have the
ability to affect the aroma and flavor individually, synergistically, or antagonistically. Some
volatile compounds contribute to the aroma and flavor of the alcoholic beverage while others
enhance the background profile of the product (7). Typically, compounds present in trace
amounts have a greater influence on the aroma profile then those found at higher concentrations
(3).
The most critical step in determining which flavor compounds contribute to the aroma of
a food product is selecting an extraction method that has the ability to isolate all aroma active
compounds. The extraction technique selected should ensure the isolation of all characteristic
compounds that play vital roles in the aroma of the product without resulting in the formation of
artifacts (8). SDE (simultaneous distillation and extraction) (9), SPME (solid-phase
microextraction) (10), and SAFE (solvent-assisted flavor evaporation) (11) are three different
60
extraction techniques currently used by researchers. SDE is one of the oldest extraction
techniques and is still used because of its simplicity and versatility; however, because of the
elevated temperature applied during extraction this technique can potentially lead to the creation
of artificial compounds not normally present (12). SPME utilizes a 2 cm piece of fused silica
that has either a liquid or solid coating to extract and concentrate compounds. Because of the
ease of use and ease of automation, SPME is commonly used for the isolation of aroma
compounds as well as monitoring quality changes during storage (8). When using SPME precise
control over time and temperature is essential for this extraction technique to ensure proper
quantification of volatile and semi-volatile compounds (13). SAFE, another isolation technique
that can be coupled with SDE, utilizes low pressure to extract volatiles at low temperatures to
prevent the formation of artificial compounds (14).
The purpose of this study was to compare two extraction techniques, SPME (solid-phase
microextraction) and SDE (Simultaneous distillation and extraction) coupled with SAFE (solvent
assisted flavor evaporation), for the isolation of flavor compounds present in commercial
samples of gueuze beer using GC-MS and GC-O (OSME or AEDA) techniques.
Materials and Methods
Simultaneous Distillation Extraction and Solvent-Assisted Flavor Evaporation
Materials. Lambic gueuze beer samples were purchased from a local wine and beer store
in Blacksburg, VA. The brands were Cuvee Reneé ( LK23JGC 2975 23 Nov 2012),
Chemicals. Diethyl ether (anhydrous, 99.8%), sodium chloride (99%), n-alkane
standards (C6-C30), 2-methyl-3-heptanone (internal standard for neutral fraction), and 2-
ethylbutric acid (internal standard for acidic fraction was purchased from Aldrich Chemical Co.
(St. Louis, MO). Sodium sulfate (99%) and hydrochloric acid (36.5%) was obtained from Fisher
61
Scientific (Pittsburg, PA). Deodorized distilled water was prepared by boiling glass-distilled
water down to two-thirds of its original volume.
Simultaneous Distillation Extraction.
SDE-SAFE extraction method was conducted at the Agricultural Bioprocess Laboratory
of Dr. Keith Cadwallader at the University of Illinois Champaign-Urbana.
Lambic beer (375 mL) sample was poured into the sample side of the continuous solvent
extraction apparatus. Diethyl ether (150 mL) was used as the extraction solvent. Continuous
extraction was conducted over a twenty-four hour period at 45ºC. The extract was then
transferred into the solvent flask and concentrated to 100 mL on a Vigreux column at 45ºC.
Solvent Assisted Flavor Evaporation (SAFE)
Volatile compounds were separated from the lambic beer extract using solvent-assisted
flavor evaporation (SAFE). The SAFE system was composed of two liquid nitrogen-cooled traps
(receiving and waste), transfer head and a 1 L round bottom flask. This system was operated
under high vacuum (approximately 10-5
Torr) when extracting volatile compounds from the
sample. The lambic beer extract (100 mL) was slowly fed into upper portion of the transfer head.
Separation of the lambic beer extract occurred when aliquots of the sample were dropped
into the round bottom flask that was partially submerged in a warm (50ºC) water bath. The
extraction process took approximately 2 hours. Separated volatiles passed through the separation
head into the receiving tube where they condensed and froze because of the sudden drop in
temperature. Once the separation was completed, the receiving tube was removed and allowed to
thaw out at room temperature for 30 minutes before proceeding with the fractionation of the
lambic beer.
62
Before separating the extract into the acidic, neutral and basic fraction, the SAFE extract
was concentrated to 30 mL using a Vigreux column attached to a 125 mL separatory funnel
submerged in a 40ºC water bath. After concentrating the extract, it was washed with aqueous
Na2CO3 (0.5 mol/L, 3 x 20 mL), and the ether layer containing the neutral and basic volatile
compounds was collected. The aqueous layer was washed with diethyl ether (2 x 10 mL) and
then acidified to pH 2 using 10% (w/v) aqueous HCl solution saturated with NaCl. The aqueous
layer was then washed with diethyl ether (3 x 20 mL). The diethyl ether layer was collected and
the aqueous layer discarded. The ether layer containing the acidic volatiles was washed with
saturated NaCl (2 x 15 mL) and collected in a 50 mL separatory funnel. The diethyl ether layer
was concentrated to 10 mL using a Vigreux column attached to the 50 mL separatory funnel
submerged in a 43ºC water bath. The diethyl ether layer was then dried over anhydrous Na2SO4
and further concentrated to 2 mL. The 2 mL acidic fraction was then transferred into a 200 µL
vial and concentrated to 150 µL using a gentle stream of nitrogen gas.
The original diethyl ether layer from above that contained the neutral base fraction was
washed with saturated NaCl (2 x 10 mL) and the diethyl ether layer collected while the saturated
NaCl layer was discarded. The diethyl ether layer was concentrated to 10 mL using a Vigreux
column attached to a 50 mL separatory funnel submerged in a warm (43ºC) water bath. The
diethyl ether layer was then dried over anhydrous Na2SO4 and concentrated again to 2 mL in the
warm water bath. The 2 mL neutral basic fraction was then transferred into a 200 µL vial and
concentrated down to 150 µL using a gentle stream of nitrogen gas. The acidic and neutral basic
fractions were stored at -70 ºC until analysis.
Aroma Extract Dilution Analysis (AEDA)
63
The acidic and neutral basic aroma extracts were diluted using diethyl ether at a 1:3 ratio
as previously described (15). Each dilution was kept in 1.5 mL clear glass vial with PTFE-lined
screw cap and kept at -70ºC until analyzed. Flavor dilution (FD) factors were used to identify the
most intense odorants in the flavor extracts. The FD factor of an odorant is based upon the ratio
of the initial concentration within the highest dilution at which a panelists is able to detect the
odorant by GC-O (16).
The GC-O system was the same as previously described (17).
Gas Chromatography-Mass Spectrometry (GC-MS)
GC-MS was utilized to separate the acidic and neutral base fractions obtained by SAFE.
Both extractions were injected using a cool on column method (+3 temperature tracking method)
using a 6890 GC/5973 mass selective detector (MSD) (Agilent Technologies Inc.) (14). Extracts
were separated using both a polar capillary column (Stabilwax-DA 30 m x 0.25 mm id 0.5 µm
film; Restek, Bellefonte, PA) and a nonpolar column (RTX-5MS, 30 m x 0.25 mm id.; 0.5 µm
film; Restek, Bellefonte, PA). Helium was used as the carrier gas at a flow rate of 1 mL/min. The
GC oven had an initial temperature of 35º C, which was held there for 5 minutes and then
increased to 225º C at a rate of 6º C/min. Once the final temperature of 225º C was reached, it
was maintained for 10 minutes. The mass spectrum detector conditions have been previously
described (14).
Identification
Retention Index (RI) and Odor quality. Volatile compounds were identified based upon
their odor descriptions and RI values on both polar and nonpolar columns. Values were
compared to those previously report in the literature. Solutions of alkane standards were
analyzed in the same manner on both the DB-5 and the RTX-S to calculate the RI:
64
RI = 100N + 100n(tRa – tRn)/(tR(N+n) – tRN)
N is the carbon number of the lowest alkane and n is the difference between the carbon number
of the two n-alkanes that are bracketed between the compound; tRa, tRn, and tR(N+n) are the
retention times of the unknown compound, the lower alkane, and the upper alkane.
Volatile Extraction by Solid Phase Microextraction (SPME)
This procedure was conducted at the Citrus Research and Education Center of the
University of Florida in the laboratory of Dr. Russell L. Rouseff located in Lake Alfred, FL.
Volatile compounds were extracted using solid phase microextraction (SPME) from
Lindeman's Cuveé Rene lambic (gueuze) beer. Compounds were identified using gas
chromatography-mass spectrometry (GC-MS) and gas chromatography-olfactometry (GC-O).
Each aliquots (10 mL) of lambic beer sample was analyzed in triplicate and placed into 40 mL
glass vials with plastic screw caps and Teflon coated septa. Samples were equilibrated for 30
minutes in a 40°C water bath. A SPME fiber (50/30 um DVM/Carboxen/PDMS; 2 cm; (Supelco,
Bellefonte, Pa., U.S.A.) was exposed to the beer headspace for 30 minutes at 40°C then inserted
into Agilent 7890H GC injection port for 8 minutes in splitless mode at 220°C to desorb the
volatiles. A nonpolar (XP-5) 60m x 0.25mm id 0.5µm column was used with He as the carrier
gas at a flow rate of 2.0 mL/min. The effluent coming off the column was split 1:2 into an FID
and a sniffing port (Datu, Geneva, NY). The odor and the intensity of the compounds were
analyzed using a time-intensity approach with a single assessor. The assessor smelled each
sample twice. The aroma intensity for each compound was continuously recorded using a
potentiometer. Chrom Perfect version 5.0.0, Justice Laboratory Software (Justice Innovations,
Inc., Palo Alto, CA) was used to record and integrate both the olfactory data and FID. A
compound was deemed aroma active if it is picked up by the assessor in two out four of the GC-
O runs. The intensity of each compound was normalized so that the peak with the highest
65
intensity received a score of 100. The normalized intensities of all the runs pertaining to all the
compounds were then averaged. If a compound was detected by the assessor, they were then
asked to rate the compound on an intensity scale of 1 to 5 as a way to estimate the intensity, with
1 meaning “slightly” and 5 meaning “very potent” aroma. Compounds were identified using
linear retention indices (LRI) calculated using the retention time and data of alkane standards ran
under similar conditions.
GC-MS was used to confirm the identity of the aroma active volatiles identified during
the GC-O experiment. The volatile compounds was desorbed by inserting the fiber directly into
the injection port of the GC, which was maintained at 220° C, for eight minutes. Volatiles were
separated and analyzed using a 60m x 0.25mm id 0.5µm wax column with helium carrier gas
flow rate of 2.0 mL/min. The GC oven had an initial temperature of 40°C, held there for 2
minutes, and then increased to 240° C at a rate of 7° C/min and held for 9.50 minutes. The MS
was maintained at 240° C and the sample mass was set to scan between 40-300 m/z in the
positive ion mode. Chromatographic peaks were identified using both standardized retention
time (LRI values) and fragmentation spectra of standards and compared to NIST 2005 spectral
library (18).
GC-PFPD Identification of Sulfur Compounds
SPME was used as the extraction technique to analyze the volatile sulfur compounds
within Lindeman's Cuveé Renee. An Agilent 7890A gas chromatograph equipped with sulfur-
specific 5380 pulsed flame photometric detector (PFPD) (model 5380 pulsed flame photometric
detector (PFPD), OI Analytical Co., College Station, TX) was used in the analysis of the sulfur
compounds within the lambic beer. Compounds were separated using a Stable Wax column (30
m x 0.32 mm id. cross-linked polyethyleneglycol, 0.50 µm film thickness, Restek, Bellefonte,
66
PA). Helium was the carrier gas at a flow rate of 1.5 mL/min. The initial oven temperature was
set to 35ºC, held there for one minute, then increased at a rate of 3ºC/min to 65ºC, then increased
at a rate of 6ºC/min to 170ºC, and finally increased at 10ºC/min to a final temperature of 240ºC
with a hold time of five minutes. The GC injector temperature was set to 200ºC and the detector
temperature was 250ºC. The sulfur gate was set to 6 - 24.9 ms, and the pulse frequency was 3
pulses/s. Retention indices were calculated using standard alkanes C5 - C25.
Time-Intensity Olfactometry Data Acquisition and Analysis, Identification
The assessor was asked to indicate aroma intensity continuously throughout the entire
chromatographic run using a linear potentiometer. The potentiometer has a pointer that has the
ability to move across 10-cm to indicate aroma intensity. The device has an output of 0 – 1.0 V
connected to the Chrom Perfect A/D board, the software digitally recorded the time and
intensity. The chromatographic software used the information collected to create an aromagrams
and to calculate olfactometry peak area, peak height, peak duration, and kovats index (KI or LRI)
for each individual compound. The assessor was asked to analyze two commercial gueuze
samples from the same brewery, each sample in duplicate. Each bottle of beer was analyzed
twice by the assessor. Mean aroma intensities for each odorant were calculated by averaging the
peak height for four runs. Aroma-active compounds were defined as ones that were detected by
the assessor fifty percent of the time, shared similar descriptions, as well as similar retention
times.
RI and Odor quality. Volatile compounds were identified based upon their odor
descriptions and RI values on both a polar and nonpolar column. Values were also compared to
those previously reported. Solutions of hydrocarbons were analyzed in the same manner on both
the DB-5 and the RTX-S to calculate RI:
67
RI = 100N + 100n(tRa – tRn)/(tR(N+n) – tRN)
N is the carbon number of the lowest alkane and n is the difference between the carbon number
of the two n-alkanes that are bracketed between the compound; tRa, tRn, and tR(N+n) are the
retention times of the unknown compound, the lower alkane, and the upper alkane.
Results and Discussion
Identification of Aroma Compounds from Gueuze Beer using SPME/GC-MS and
SDE/SAFE
The use of SPME to extract volatile and semi-volatile compounds from beer has been
used for years (19). Rodriques et al. (2) reported that DVB/CAR/PDMS was able to provide a
more complete profile due to the wider range of chemical compounds detected and higher signal
intensities. SAFE/SDE has been used for the extraction and identification for a number of
different fermented products such as rum (20), Chinese Sinkiang fermented camel milk (21), and
rice wine (22).
In this work, aroma compounds were identified using two common extraction techniques:
SPME and SAFE and both were coupled with GC-MS using Carbowax columns. A total of 64
aroma compounds were identified using a combination of retention index and mass spectral
matching against library standards (Table 3.1). Compounds that could not be identified by
comparing retention index values and mass spectra library were marked as tentatively identified.
Compounds identified belonged to several different chemical classes (ketones, acids, alcohols,
benzene, and phenols). Of the 65 compounds, 17 esters, 15 acids, 12 alcohols, 5 aldehyde, 2
ketones, 2 phenols, 1 thiol, 1 furan, and 1 alkane were identified by GC-MS.
Forty-three of the 62 aroma compounds identified have not been previously reported in
lambic beer. Van Oevelen et al. (23) reported finding acetic acid, lactic acid, butyric acid,
propionic acid, isobutyric acid, propanol, butanol, isobutanol, isoamyl alcohol, n-amyl alcohol,
68
phenethyl alcohol, ethyl acetate, and ethyl lactate. Spaepen et al. (24) reported finding hexanoic
acid, octanoic acid, decanoic acid, isoamyl acetate, ethyl hexanoate, ethyl octanoate, ethyl
decanoate, and phenethyl acetate.
When comparing the two extraction methods to each other, each extraction method was
unable to identify 17 volatile compounds. SPME was unable to extraction seven acids (lactic,
propanoic, isobutyric, butyric, valeric, heptanoic, and hexadecanoic), six alcohols (propanol,
butanol, isoamyl alcohol, 2-heptanol, hexanol, 4-methyl-3-pentenol), two furans (1-(furan-2-yl)-
ethanone, 2-furanmethanol), one thiol (3-methylthio-1-propanol), and one aldehyde
(benzeneacetaldehyde) that SDE-SAFE was able to extract. Engel et al (11) reported that SAFE
is a much more efficient extraction technique for isolating less volatile and polar compounds like
acids and alcohols. SPME was able to extract 16 compounds that SAFE was unable to identify.
SPME was able to identify nine esters (ethyl 4-methylpentanoate, ethyl nananoate, ethyl 9-
decenoate, ethyl undecanoate, ethyl dodecanoate, ethyl tetradecanoate, ethyl hexadecanoate)
compounds, three alcohols (octanol, decanol, 2-nonanol), one ketone (4-methyl-2-pentanone),
one aldehyde (decanal), ketone (α-ionone), acid (isobutanoic), phenol (4-vinylguaiacol), and
calamenene.
Alcohols (36.2% of the total volatiles), acids (7.3%), and esters (48%) account for the
majority 91% of the volatile compounds identified in gueuze beer. Alcohols are produced as a
by-product of yeast metabolism (25). Ethanol (27.9% of the total alcohols), phenethyl alcohol
(4.3%), and isoamyl alcohol (3.5%) were the three major alcohols identified. Esters were the
dominant class in terms of total amount for SPME for gueuze beer. Among the 17 detected
esters, ethyl octanoate (23.0% of the proportion percentage to esters), ethyl decanoate (14.1%),
ethyl dodecanoate (2.3%), and ethyl hexanoate (2.1%), were the major ester compounds
69
identified. The concentration of esters are dependent upon several factors: fermentable sugars,
fermenting temperature, and yeast strains (25). Esters are an important group of volatile
compounds produced during yeast fermentation. Ethyl lactate, one of the ester compounds
detected by both isolation techniques, is a byproduct of Lactobacillus sp and related to lactic acid
fermentation (26).
After alcohols and esters, acids are another major group of compounds present in gueuze
beer. A total of 15 acids were detected. Among them were acetic acid (0.2% of the total acids
identified), decanoic acid (1.5%), butyric acid and hexanoic acid (0.2%), and octanoic acids
(5.0%).
GC-PFPD Identification of Sulfur Compounds
Sulfur compounds contribute to the aroma and flavor of a number of different food
products including beer (27). However, because of their low sensory thresholds, sulfur
compounds can easily become unpleasant and cause off-flavors and aromas (28). Malt, hops and
water are three possible sources of sulfur compounds. However the majority of the volatile and
semi-volatile compounds do not traditionally come from the raw materials, but are produced
during fermentation (25). A number of sulfur compounds have been reported in beer, and the two
main volatile sulfur compounds are dimethyl sulfide (DMS) (29) and methiol (27). Several other
sulfur compounds are only found in trace amounts (30).
A pulse flame photometric detector (PFPD) utilizes a flame source and a gas flowing at a
rate that is unable to maintain a continuous flame, in contrast to that of a flame ionization
detector (FID). The cycle is repeated between 2 - 4 times a second. Selectivity is based upon the
appropriate filter (31).
70
The PFPD is currently the most popular commercially available detector for the selective
measurement of sulfur compounds. SPME can be used in the extraction of sulfur compounds
varying across a wide range of boiling points and polarities. Identification of sulfur compounds
using SPME-GC-PFPD is extremely difficult due to the low concentration of sulfur compounds
typically present and the relatively higher concentration of non-sulfur compounds (27).
Compounds were tentatively identified using their retention times to calculate their linear
retention index (LRI), also known as the Kovats Index.
Currently, there is limited research available describing the entire range of sulfur
compounds present in gueuze beer. Van Oevelen et al. (23) reported finding dimethyl sulfide;
however, no other sulfur compounds were identified in gueuze beer. Hill et al. (27) reported
finding over thirteen sulfur compounds in European pilsner and lagers.
In this study, the PFPD detected thirty-eight sulfur peaks in Lindeman's Cuveé Rene, a
commercially available gueuze beer. The retention time and LRI value obtained for unknown
peaks were compared to values previously reported in the literature coming from Dr Rouseff
laboratory pertaining to sulfur compounds. Of the thirty-eight compounds detected, five of them
have been previously reported in beer (27), one in wine (32), twenty-nine were identified for the
first time in gueuze beer, and three could not be identified. The use of MS for identification is
extremely difficult for sulfur compounds because of their low concentrations found in beer. The
PFPD detected sulfur compounds were tentatively identified using their LRI values. The thirty
eight compounds are shown in Table 3.2. Two peaks in Table 1 were reported as unknown, but
did produce a sulfur detector response. Based upon the retention times, these two compounds
were tentatively identified as 2-methylthiacylopentane and 3-(methylthio)-pyridine. Further
research is required to confirm the identification of all the compounds listed in Table 3.2.
71
SPME/GC-O
Table 3.3 contains the information on the 28 aroma-active compounds present in a
commercially available (gueuze) lambic beer. Compounds that were detected in fifty percent of
all GC-O samples at the same retention time with similar aroma descriptors were considered to
play a role in the aroma of lambic (gueuze) beer. Tentative identification was made comparing
similar LRI values for known aroma compounds with similar descriptors. Compounds were
ranked based upon the average of the intensity perceived by the panelist per each chemical.
The five highest ranking chemical groups for aroma intensities were: alcohol, acid, ester,
thiol, and furan. The most intense odorants perceived was ethanol, followed by 1-(furan-2-yl)-
ethanone. While this is the first time that 1-(furan-2-yl)-ethanone has been identified in beer, it
has been identified in sweet corn products (33), guava fruits and canned puree (34), and
Castanopsis flower (35). It should be noted that 1-(furan-2-yl)-ethanone was identified based on
the mass spectrum and LRI, value which were obtained using the SAFE/SDE method. A peak at
the same LRI was seen when using SPME as the extraction technique, however not enough of
the compound was present for MS identification. An unknown sulfur compound had the third
highest aroma intensity. This compound was identified as a sulfur compound based upon its
aroma descriptors (musty, moldy/decay) and comparing the LRI values and the peaks detected
when using the GC-PFPD. Ethyl isobutyrate was the fourth highest ranking aroma compound
perceived with an odor description of bubble gum or sweet. This compound has been identified
in Jamaican rum (36) and Bavarian Pilsner style beer (37). This is the first time, however, that
this compound has been identified in lambic beer. The fifth highest odorant perceived was
isovaleric (3-methylbutanoic) acid. The odor descriptor for isovaleric acid is rancid or acidic.
72
This compound has also been identified as being one of several compounds produced by the wild
yeast species, Brettanomyces (38).
A single expert assessor of lambic beer was used in the sensory analysis of the lambic
beer due to the inherent variation between multiple assessors. Acree et al determined that the
variation between individual assessors was greater than the variation between either the age or
the sex of the panelists (39).
AEDA
The major volatiles that eluted with an odor are shown in Table 3.4 sweaty, fruity, and
spicy odors. Sniffing of serial dilutions (AEDA) resulted in 32 odor-active compounds, which
ranged in FD factor range of 1 - 729. The highest FD factors were found for 2-methyl-butanoic
acid (sweaty) and phenylmethanol (solvent/aromatic). Isovaleric acid (rancid, sweaty) and 4-
ethylphenol (must) both had the next highest ranking FD factors of 243. The volatile acidity
present in this particular style is usually high and produces a vinegar-like and cheesy aroma.
The odor active compounds were separated into acidic and neutral basic volatile
compound fractions. Within the acidic fraction a total of 18 compounds were detected by using
the AEDA method. The highest odor active compound for the acidic fraction (AF) was 2-
methylbutanoic acid (sweaty) with a FD factor of 729, followed by isovaleric acid (rancid) with
an FD value of 243. A few of the odor descriptors for compounds in the AF were sweat, rancid,
Odor active compounds acetic acid (vinegar) (40), decanoic acid (rancid, fat) (24), furaneol
(carmel) (41), hexanoic acid (sweat) (40), butyric acid (40) (rancid, cheese), propanoic acid
(pungent) (23), and 2-methylbutanoic acid (sweaty) (42) have all been identified in beer and
were previously identified in lambic beer. Decanoic, hexanoic, butyric and propanoic acids have
73
also been identified in lambic beer (23, 24, 43). The concentration of organic acids in lambic
beer can range from three to eight times higher than for a typically American Lager (44).
The Neutral/Basic fraction (NBF) accounted for 22 of the 40 volatile compounds
identified within the NBF fraction using AEDA method. Phenylmethanol (FD - 729) and 3,5-
dimethyl-1,2,4-trithiolane (FD - 243) were identified as having the highest FD factor within the
NBF. Some of the odor descriptors for the identified compounds were fruity, malty, honey, and
spice. Isoamyl acetate (23), ethyl octanoate (24), and ethyl dodecanoate (24) had lower FD
values for the NBF and have all been identified previously in lambic beer. Prior to 2005, ethyl 4-
methylpentanoate had never been identified as playing a role in the odor activity of beer. Using
SDE/SAFE, Fritsch et al (37) was able to determine the presence of ethyl 4-methylpentanoate
while others had not been able to do so.
4-Ethylphenol and 4-ethylguaiacol, two compounds commonly associated with the wild
yeast Brettanomyces sp. that can cause wine, beer, and ciders to spoil (45), was shown to play a
role in the odor activity of this particular style of beer. The FD factor for 4-ethylphenol was 243,
tied for the second highest FD factor in the NBF, and 4-ethylguaiacol had an FD factor of 81.
Van Oevelen et al (43) and Boulton and Quain (46) all have indicated that these two compounds
play a vital role in the aroma of lambic beer. Our results support the role of these two
compounds in the overall aroma of lambic beer.
SPME vs. SDE/SAFE with GC-O
When using SPME as the extraction technique for GC-O, 28 volatile compounds where
identified, while when using SDE/SAFE, 32 volatile compounds were found. In comparing the
two methods, 4-guaiacol, ethyl 4-methylpentanoate, ethyl octanoate, hexanoic acid, ethyl
dodecanoate, and nonanoic acid were detected by the three panelists for SDE-SAFE and the
74
single assessor for the SPME procedure. SDE/SAFE was able to identify nine organic acids,
while SPME was only able to identify four. In comparing the two extraction methods, SPME
was able to identify seven esters, while SDE/SAFE was able to identify five esters. Three
alcohols were extracted using SPME, while eight alcohols were extracted using SDE/SAFE.
Conclusion
In this study, the volatile compounds of commercially available gueuze beer were
extracted using SPME and SAFE and analyzed using a GC-MS. A total of 101 compounds, 63
volatile compounds and 38 sulfur compounds were identified. Further studies are needed to
confirm the identification of the proposed volatile and sulfur compounds identified in this study.
The two extraction techniques provided similar numbers regarding the quantity of compounds
identified using GC-MS and GC-O.
75
Literature Cited
1. De Keersmaecker, J., The mystery of lambic beer. Scientific American 1996, 275, 74.
2. Rodrigues, F.; Caldeira, M.; Camara, J. S., Development of a dynamic headspace solid-
phase microextraction procedure coupled to GC-qMSD for evaluation the chemical profile in
alcoholic beverages. Analytica Chimica Acta 2008, 609, 82-104.
3. Plutowska, B.; Wardencki, W., Application of gas chromatography-olfactometry (GC-O)
in analysis and quality assessment of alcoholic beverages - A review. Food Chem. 2008, 107,
449-463.
4. Ferreira, V.; Lopez, R.; Cacho, J. F., Quantitative determination of the odorants of young
red wines from different grape varieties. J. Sci. Food Agric. 2000, 80, 1659-1667.
5. Reineccius, G., Flavor Chemistry and Technology. 2nd ed.; CRC Press: Boca Raton,
2006.
6. Taylor, A. J., Food Flavour Technology. Sheffield Academic Press: Boca Raton, FL,
2002; p 302.
7. Romano, P.; Fiore, C.; Paraggio, M.; Caruso, M.; Capece, A., Function of yeast species
and strains in wine flavour. International Journal of Food Microbiology 2003, 86, 169-180.
8. Majcher, M., Jelen, H.H., Comparison of suitability of SPME, SAFE, and SDE methods
for isolation of flavor compounds from extruded potato snacks. Journal of Food Composition
and Anaysis 2009, 606-612.
9. Nickerson, G. B.; Likens, S. T., Gas chromatographic evidence for the occurrence of hop
oil components in beer. Journal of Chromatography 1966, 2, 677-678.
10. Pawliszyn, J., Solid Phase Microextraction. Theory and Practice. Wiley-VCH: New
York, 1997.
11. Engel, W.; Bahr, W.; Schieberle, P., Solvent assisted flavour evaporation - a new and
versatile technique for the careful and direct isolation of aroma compounds from complex food
matrices. Eur. Food Res. Technol. 1999, 209, 237-241.
12. Schieberle, P., Quantitation of important roast-smelling odorants in popcorn by stable
isotope dilution sssays and model studies on flavor formation during popping. Journal of
Agricultural and Food Chemistry 1995, 43, 2442-2448.
13. Supelco, Solid phase microextraction: Theory and optimization of conditions. Bulletin
923A 1999.
14. Rotsatchakul, P.; Chaiseri, S.; Cadwallader, K. R., Identification of characteristic aroma
components of Thai fried chili paste. Journal of Agricultural and Food Chemistry 2008, 56, 528-
536.
76
15. Grosch, W., Detection of potent odorants in foods by aroma extract dilution analysis.
Trends in Food Science & Technology 1993, 4, 68-73.
16. Lindsay, R., Flavors. In Food Chem., Fennema, O. R., Ed. Marcel Dekker, Inc. : New
York, 1996; Vol. 3, pp 724 - 725.
17. Rotsatchakul, P.; Chaiseri, S.; Cadwallader, K., Identification of Characterisitics Aroma
Components of Thai Fried Chili Paste. Journal of Agricultural and Food Chemistry 2008, 2008,
528 - 536.
18. Du, X. F., Baldwin, E., Rouseff, R, Evaluation of volatiles from two subtropical
strawberry cultivars using gc-olfactometry, GC-MS odor activity values, and sensory analysis. J.
Agric. Food Chem 2011, 59, 12569 - 12577.
19. Constant, M.; Collier, J., Headspace gas chromatography profiles of fruit-flavored malt
beverages using solid-phase microextraction. J. Am. Soc. Brew. Chem. 1997, 55, 112-118.
20. Pino, J. A.; Tolle, S.; Gök, R.; Winterhalter, P., Characterisation of odour-active
compounds in aged rum. Food Chem. 2012, 132, 1436-1441.
21. Li, N.; Zheng, F. P.; Chen, H. T.; Liu, S. Y.; Gu, C.; Song, Z. Y.; Sun, B. G.,
Identification of volatile components in Chinese Sinkiang fermented camel milk using SAFE,
SDE, and HS-SPME-GC/MS. Food Chem. 2011, 129, 1242-1252.
22. Mo, X. L.; Xu, Y.; Fan, W. L., Characterization of aroma compounds in chinese rice
wine qu by solvent-assisted flavor evaporation and headspace solid-phase microextraction.
Journal of Agricultural and Food Chemistry 2010, 58, 2462-2469.
23. Van Oevelen, D.; Delescaille, F.; Verachtert, H., Synthesis of aroma components during
spontaneous fermentation of lambic and gueueze. J. Inst. Brew. 1976, 82, 322-326.
24. Spaepen, M.; Vanoevelen, D.; Verachtert, H., Fatty-acids and esters produced during
spontaneous fermentation of lambic and Gueuze. J. Inst. Brew. 1978, 84, 278-282.
25. Nykänen, L.; Suomalainen, H., Aroma of beer, wine, and distilled alcoholic beverages.
D. Reidel ; Distributors for the U.S.A. and Canada, Kluwer Boston: Dordrecht, Holland; Boston,
U.S.A.; Hingham, MA, 1983.
26. Nascimento, E. S. P., Cardoso, D.R., Franco, D. W., Quantitative ester analysis in cachac
and distilled spirts by gas chromatography-mass spectrometry (GC-MS). J. Agric. Food Chem
2008, 56, 5488 - 5493.
27. Hill, P. G.; Smith, R. M., Determination of sulphur compounds in beer using hedspace
solid-phase microextraction and gas chromatographic analysis with pulsed flame photometric
detection. J. Chrom. A. 2000, 872, 203.
77
28. Boelens, M.; Vanderli.Lm; Devalois, P. J.; Vandort, H. M.; Takken, H. J., Organic sulfur-
compounds from fatty aldehydes, hydrogen-sulfide, thiols, and ammonia as flavor constituents.
Journal of Agricultural and Food Chemistry 1974, 22, 1071-1076.
29. Anness, B. J.; Bamforth, C. W., Dimethyl sulfide - A Review. J. Inst. Brew. 1982, 88,
244-252.
30. Burmeister, M. S., Drummond,C.J., Pfisterer,E.A. ,Basel,D.W. ; Hysert, Y., Sin, O,
Sime,K.J., Hawthorne,D.B., Measurement of volatile sulfur compounds in beer using gas
chromatography with a sulfur chemiluminescence detector. Journal of American Society of
Brewing Chemists 1992, 50, 53-58.
31. Cheskis, S.; Atar, E.; Amirav, A., Pulsed-Flame Photometer - A Novel Gas-
Chromatography Detector. Anal. Chem. 1993, 65, 539-555.
32. Ferreira, V., Aznar, M., Lopez, R., and Cacho, J, Quantitative gas chromatography-
olfactometry carried out at different dilutions of an extract. Key differences in the odor profiles
of four high-quality Spanish aged red wines. J. Agric. Food Chem 2001, 49, 4818 - 4824.
33. Buttery, R. G., Stern, D.J., and Ling, L.C, Studies on flavor volatiles of some sweet corn
products. J. Agric. Food Chem 1994, 42, 791 - 795.
34. Nishimura, O., Yamaguchi, K., Mihara, S., and Shibamoto, T, Volatile constituents of
guava fruits (Psidium guajava L.) and canned puree. J. Agric. Food Chem 1989, 37, 139 - 142.
35. Yamaguchi, K., and Shibamoto, T, Volatile constituents of Castanopsis flower. J. Agric.
Food Chem 1979, 27, 847 - 850.
36. Liebich, H. M., Koenig, W. A., Bayer, E., Analysis of the flavor of rum by gas-liqued
chromatography and mass spectrometry. J. chromatogr. Sci 1970, 8, 527 - 533.
37. Fritsch, H. T.; Schieberle, P., Identification based on quantitative measurements and
aroma recombination of the character impact odorants in a Bavarian Pilsner-type beer. Journal of
Agricultural and Food Chemistry 2005, 53, 7544-7551.
38. Kling, T. H., Egli, C., Licker, J., Mitrakul, C. Acree, T. In Brettanomyces in Wine, 5th
International Symposium on Cool Climate Viticulture and Oenology, Melbourne, Australia, 16 -
20 January, 2000; Melbourne, Australia, 2000.
39. Marin, A. B.; Acree, T. E.; Barnard, J., Variation in odor detection thresholds determined
by CHARM analysis. Chem. Senses 1988, 13, 435-444.
40. Strating, J., Venema, A., Gas-chromatographic study of an aroma concentrate from beer.
J. Inst. Brew 1961, 37, 525 - 528.
41. Tressl, R. K., T.; Renner, R., Studies on the volatile components of hops, wort and beer
and their formation (in German). Proc. Eur. Brew. Conv. 1975, 737 - 756.
78
42. Narziss, L. M., H.; Scho¨ndorfer, H., GC analysis of beer aroma compounds (in German).
Brauwissenschaft 1982, 35, 109 - 113.
43. Van Oevelen, D.; Spaepen, M.; Timmermans, P.; Verachtert, H., Microbiological
Aspects of Spontaneous Wort Fermentation in Production of Lambic and Gueuze. J. Inst. Brew.
1977, 83, 356-360.
44. Guinard, J. X., Lambic. Brewers Publications: Boulder, 1990; p 159.
45. Rayne S. and Eggers, N., 4-Ethylphenol and 4-Ethylguaiacol Concentrations in barreled
red wines from the Okanagan Valley Appellation, British Columbia. Am. J. Enol. Vitic. 2008, 59,
92-97.
46. Boulton, C.; Quain, D., Brewing yeast and fermentation. Blackwell Science ; Iowa State
University Press [distributor]: Oxford; Malden, MA; Ames, Iowa, 2001.
47. Ong, P. K. C., and Acree, T.E, Similarities in the aroma chemistry of Gewürztraminer
variety wines and Lychee (Litchi chinesis Sonn.) fruit. J. Agric. Food Chem 1999, 47, 665 - 670.
48. Cullere, L., Escudero, A., Cacho, J., and Ferreira, V, Gas chromatography-olfactometry
and chemical quantitative study of the aroma of six premium quality Spanish aged red wines. J.
Agric. Food Chem 2004, 52, 1653 - 1660.
49. Valim, M. F., Rouseff, R.L., and Lin, J., Gas chromatographic-olfactometric
aharacterization of aroma compounds in two types of cashew apple nectar. J. Agric. Food Chem
2003, 51, 1010 - 1015.
50. Ferreira, V.; Ortin, N.; Escudero, A.; Lopez, R.; Cacho, J., Chemical characterization of
the aroma of Grenache rose wines: Aroma extract dilution analysis, quantitative determination,
and sensory reconstitution studies. Journal of Agricultural and Food Chemistry 2002, 50, 4048-
4054.
51. Sanz, C., Ansorena, D., Bello, J., and Cid, C.C, Optimizing headspace temperature and
time sampling for identification of volatile compounds in ground roasted Arabica coffee. J.
Agric. Food Chem 2001, 49, 1364 - 1369.
52. Wang, Y., Finn, C., and Quian, M.C, Impact of growing environment on chickasaw
blackberry (Rubus L.) aroma evaluated by gas chromatography olfactometry dilution analysis. J.
Agric. Food Chem 2005, 53, 3563 - 3571.
53. Ruther, J., Retention index database for identification of general green leaf volatiles in
plants by coupled capillary gas chromatography-mass spectrometry. J. Chrom. A. 2000, 890, 313
- 319.
54. Choi, H.-S., Character impact odorants of citrus hallabong [(C. unshiu Marcov x C.
sinensis Osbeck) x C. reticulata Blanco] cold-pressed peel oil. J. Agric. Food Chem 2003, 51,
2687 - 2692.
79
55. Le Guen, S., Prost, C., and Demaimay, M., Characterization of odorant compounds of
mussels (Mytilus edulis) according to their origin using gas chromatography - olfactometry and
gas chromatography - mass spectrometry. J. Chromatogr. A 2000, 896, 361 - 371.
56. Bianchi, F., Careri, M., Mangia, A., and Musci, M, Retention indices in the analysis of
food aroma volatile compounds in temperature-programmed gas chromatography: database
creation and evaluation of precision and robustness. J. Sep. Sci 2007, 30, 563 - 572.
57. Lee, S.-J., Noble, A.C, Characterization of odor-active compounds in Californian
Chardonnay wines using GC-olfactometry and GC-mass spectrometry. J. Agric. Food Chem
2003, 51, 8036 - 8044.
58. Chung, T. Y., Eiserich, J.P., and Shibamoto, T, Volatile compounds produced from
peanut oil heated with different amounts of cysteine. J. Agric. Food Chem 1994, 42, 1743 - 1746.
59. Wong, J. M., and Bernhard, R.A, Effect of Nitrogen source on pyrazine formation. J.
Agric. Food Chem 1998, 36, 123 - 129.
60. Selli, S., Cabaroglu, T., Canbas, A., Erten, H.,Nurgel, C., Lepoutre, J.P., and Gunata, Z,
Volatile composition of red wine from cv. Kalecik Karasi grown in central Anatolia. Food
Chem. 2004, 85, 207 - 213.
61. Brunton, N. P., Cronin, D.A., and Monahan, F.J, Volatile components associated with
freshly cooked and oxidized off-flavours in turkey breast meat. Flav. Fragr. J. 2002, 17, 327 -
334.
62. Hwan, C.-H., and Chou, C.-C, Volatile components of the Chinese fermented soya bean
curd as affected by the addition of ethanol in ageing solution. J. Sci. Food Agric. 1999, 79, 243 -
248.
63. Buttery, R. G., Ling, L.C., and Stern, D.J, Studies on popcorn aroma and flavor volatiles.
J. Agric. Food Chem 1997, 45, 837 - 843.
64. Priestap, H. A., Van Baren, C.M., Di Leo Lira, P., Coussio, J.D., and Bandoni, A.L,
Volatile constituents of Aristolochia argentina. Phytochem 2003, 63, 221 - 225.
65. Mahattanatawee, K.; Perez-Cacho, P. R.; Davenport, T.; Rouseff, R., Comparison of
three lychee cultivar odor profiles using gas chromatography-olfactometry and gas
chromatography-sulfur detection. Journal of Agricultural and Food Chemistry 2007, 55, 1939-
1944.
66. Jabalpurwala, F., Gurbuz, O., Rouseff, R, Analysis of grapefruit sulfur volatiles using
SPME and pulsed flame photometric detection. Food Chem. 2010, 120, 296 - 303.
67. Du, X. F.; Plotto, A.; Song, M.; Olmstead, J.; Rouseff, R., Volatile Composition of Four
Southern Highbush Blueberry Cultivars and Effect of Growing Location and Harvest Date.
Journal of Agricultural and Food Chemistry 2011, 59, 8347-8357.
80
68. Aubert, C., and Bourger, N, Investigation of volatiles in charentais cantaloupe melons
(Cucumis melo var. cantalupensis). Characterization of aroma constituents in some cultivars. J.
Agric. Food Chem 2004, 52, 4522 - 4528.
69. Kubec, R., Drhova, V., and Velisek, J, Thermal degradation of S-methylcysteine and its
sulfoxides - important flavor precursors of brassica and allium vegetables. J. Agric. Food Chem
1998, 46, 4334 - 4340.
70. Akiyama, M., Murakami, K., Ohtani, N., Iwatsuki, K., Sotoyama, K., Wada, A., Tokuno,
K., Iwabuchi, H., and Tanaka,K, Analysis of volatile compounds released during the grinding of
roasted coffee beans using solid-phase microextraction. J. Agric. Food Chem 2003, 51.
71. Güntert, M., Bruning, J., Emberger, R., Kopsel, M., Kuhn, W., Thielmann, T., and
Werkhoff, P, Identification and formation of some selected sulfur-containing flavor compounds
in various meat model systems. J. Agric. Food Chem 1990, 38, 2027 - 2041.
72. Varming, C., Petersen, M.A., and Poll, L., Comparison of isolation methods for the
determination of important aroma compounds in blackcurrant (Ribes nigrum L.) juice, using
nasal impact frequency profiling. J. Agric. Food Chem 1658, 52, 1647 - 1652.
73. Binder, R. G., Turner, C.E., and Flath, R.A, Volatile components of purple starthistle. J.
Agric. Food Chem 1990, 38.
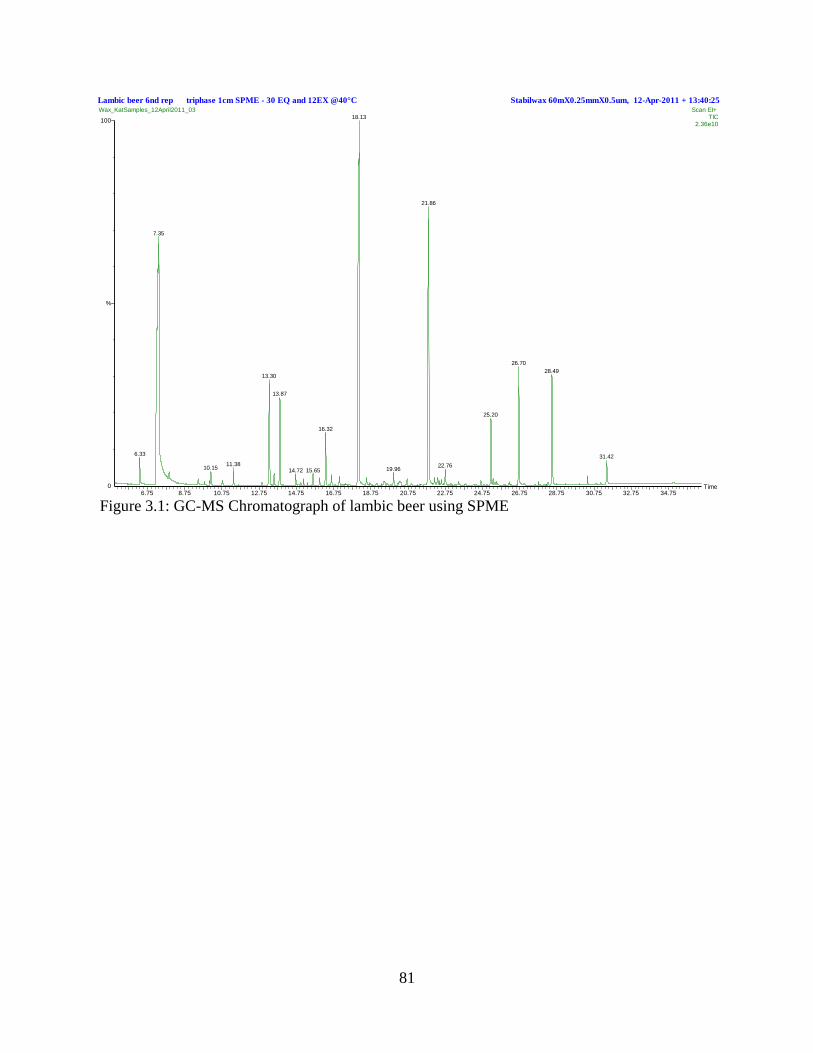
81
Figure 3.1: GC-MS Chromatograph of lambic beer using SPME
Stabilwax 60mX0.25mmX0.5um, 12-Apr-2011 + 13:40:25Lambic beer 6nd rep triphase 1cm SPME - 30 EQ and 12EX @40°C
6.75 8.75 10.75 12.75 14.75 16.75 18.75 20.75 22.75 24.75 26.75 28.75 30.75 32.75 34.75Time0
100
%
Wax_KatSamples_12April2011_03 Scan EI+ TIC
2.36e1018.13
7.35
6.33
13.30
11.3810.15
13.87
16.32
15.6514.72
21.86
19.96
26.70
25.20
22.76
28.49
31.42
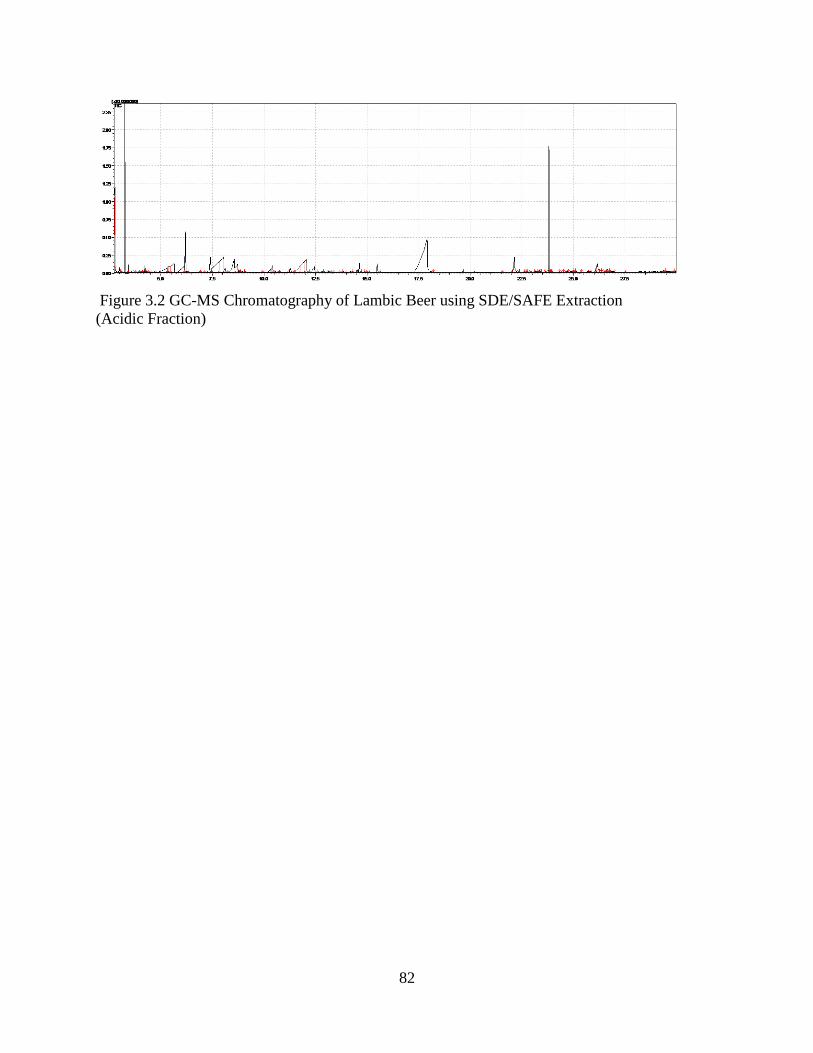
82
Figure 3.2 GC-MS Chromatography of Lambic Beer using SDE/SAFE Extraction
(Acidic Fraction)
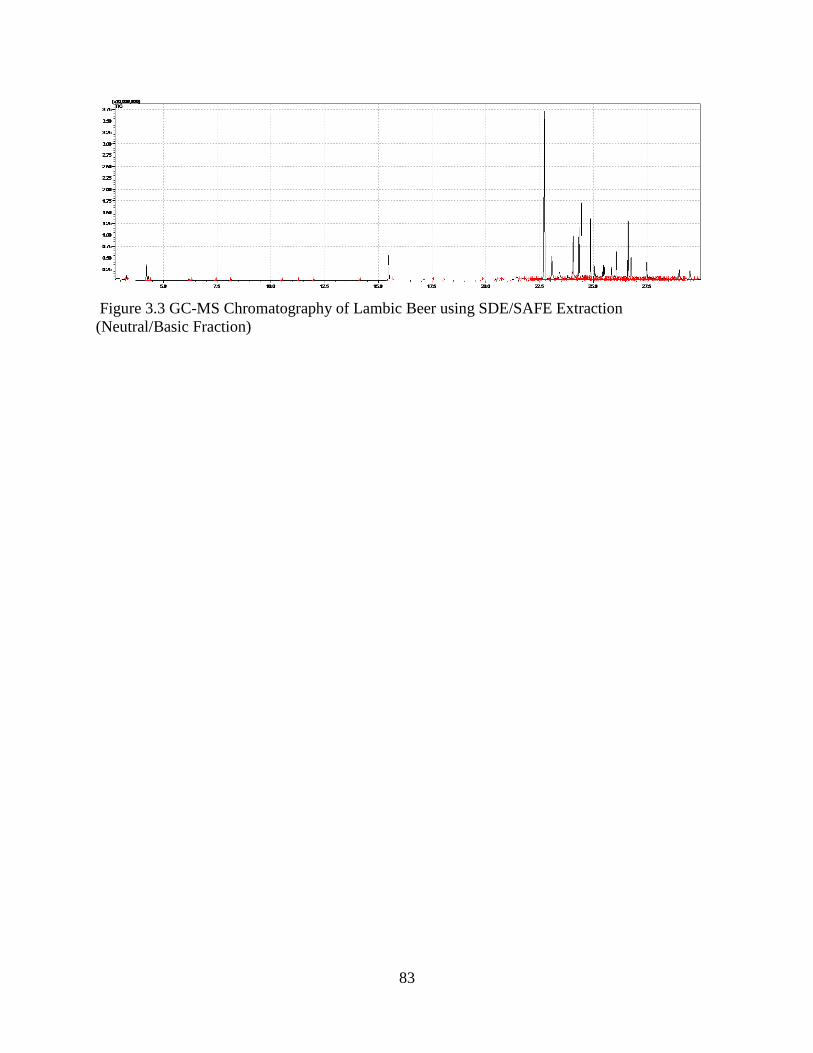
83
Figure 3.3 GC-MS Chromatography of Lambic Beer using SDE/SAFE Extraction
(Neutral/Basic Fraction)
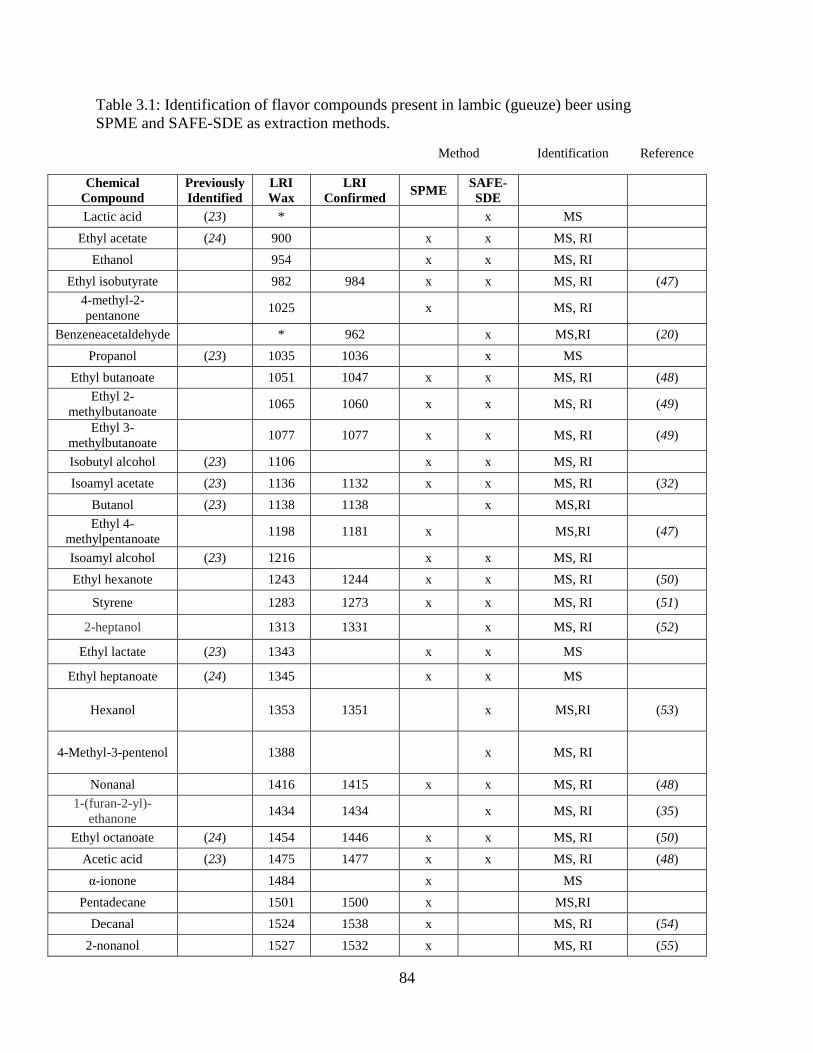
84
Table 3.1: Identification of flavor compounds present in lambic (gueuze) beer using
SPME and SAFE-SDE as extraction methods.
Method Identification Reference
Chemical
Compound
Previously
Identified
LRI
Wax
LRI
Confirmed SPME
SAFE-
SDE
Lactic acid (23) *
x MS
Ethyl acetate (24) 900
x x MS, RI
Ethanol 954
x x MS, RI
Ethyl isobutyrate 982 984 x x MS, RI (47)
4-methyl-2-
pentanone 1025
x
MS, RI
Benzeneacetaldehyde * 962
x MS,RI (20)
Propanol (23) 1035 1036
x MS
Ethyl butanoate 1051 1047 x x MS, RI (48)
Ethyl 2-
methylbutanoate 1065 1060 x x MS, RI (49)
Ethyl 3-
methylbutanoate 1077 1077 x x MS, RI (49)
Isobutyl alcohol (23) 1106
x x MS, RI
Isoamyl acetate (23) 1136 1132 x x MS, RI (32)
Butanol (23) 1138 1138
x MS,RI
Ethyl 4-
methylpentanoate 1198 1181 x
MS,RI (47)
Isoamyl alcohol (23) 1216
x x MS, RI
Ethyl hexanote 1243 1244 x x MS, RI (50)
Styrene 1283 1273 x x MS, RI (51)
2-heptanol 1313 1331
x MS, RI (52)
Ethyl lactate (23) 1343
x x MS
Ethyl heptanoate (24) 1345
x x MS
Hexanol 1353 1351
x MS,RI (53)
4-Methyl-3-pentenol 1388
x MS, RI
Nonanal 1416 1415 x x MS, RI (48)
1-(furan-2-yl)-
ethanone 1434 1434
x MS, RI (35)
Ethyl octanoate (24) 1454 1446 x x MS, RI (50)
Acetic acid (23) 1475 1477 x x MS, RI (48)
α-ionone 1484
x
MS
Pentadecane 1501 1500 x
MS,RI
Decanal 1524 1538 x
MS, RI (54)
2-nonanol 1527 1532 x
MS, RI (55)
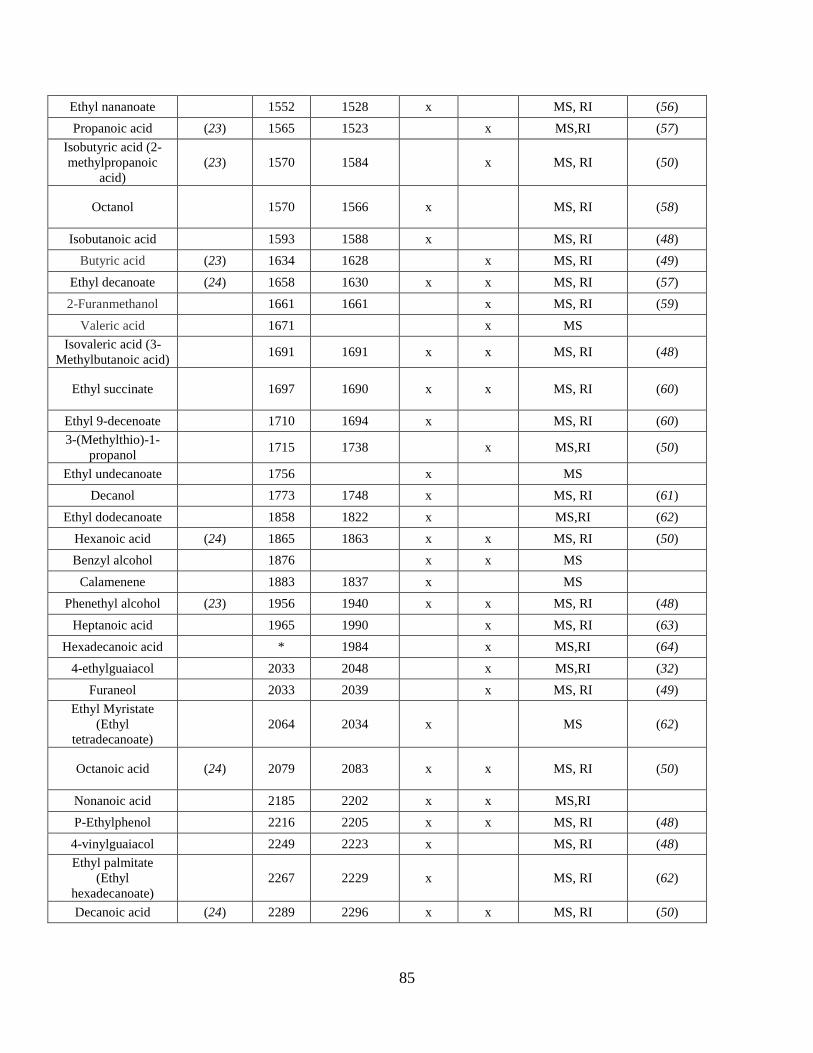
85
Ethyl nananoate 1552 1528 x
MS, RI (56)
Propanoic acid (23) 1565 1523
x MS,RI (57)
Isobutyric acid (2-
methylpropanoic
acid)
(23) 1570 1584
x MS, RI (50)
Octanol 1570 1566 x
MS, RI (58)
Isobutanoic acid 1593 1588 x
MS, RI (48)
Butyric acid (23) 1634 1628
x MS, RI (49)
Ethyl decanoate (24) 1658 1630 x x MS, RI (57)
2-Furanmethanol 1661 1661
x MS, RI (59)
Valeric acid 1671
x MS
Isovaleric acid (3-
Methylbutanoic acid) 1691 1691 x x MS, RI (48)
Ethyl succinate 1697 1690 x x MS, RI (60)
Ethyl 9-decenoate 1710 1694 x
MS, RI (60)
3-(Methylthio)-1-
propanol 1715 1738
x MS,RI (50)
Ethyl undecanoate 1756
x
MS
Decanol 1773 1748 x
MS, RI (61)
Ethyl dodecanoate 1858 1822 x
MS,RI (62)
Hexanoic acid (24) 1865 1863 x x MS, RI (50)
Benzyl alcohol 1876
x x MS
Calamenene 1883 1837 x
MS
Phenethyl alcohol (23) 1956 1940 x x MS, RI (48)
Heptanoic acid 1965 1990
x MS, RI (63)
Hexadecanoic acid * 1984
x MS,RI (64)
4-ethylguaiacol 2033 2048
x MS,RI (32)
Furaneol 2033 2039
x MS, RI (49)
Ethyl Myristate
(Ethyl
tetradecanoate)
2064 2034 x
MS (62)
Octanoic acid (24) 2079 2083 x x MS, RI (50)
Nonanoic acid 2185 2202 x x MS,RI
P-Ethylphenol 2216 2205 x x MS, RI (48)
4-vinylguaiacol 2249 2223 x
MS, RI (48)
Ethyl palmitate
(Ethyl
hexadecanoate)
2267 2229 x
MS, RI (62)
Decanoic acid (24) 2289 2296 x x MS, RI (50)
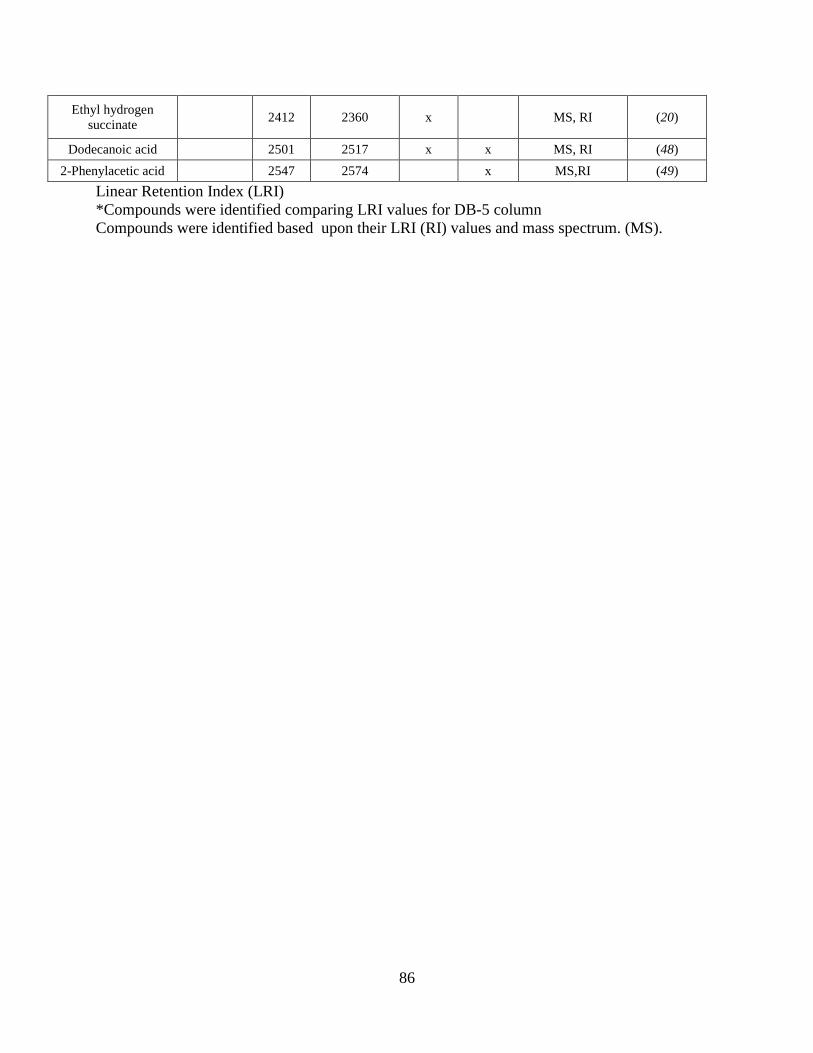
86
Ethyl hydrogen
succinate 2412 2360 x
MS, RI (20)
Dodecanoic acid 2501 2517 x x MS, RI (48)
2-Phenylacetic acid 2547 2574
x MS,RI (49)
Linear Retention Index (LRI)
*Compounds were identified comparing LRI values for DB-5 column
Compounds were identified based upon their LRI (RI) values and mass spectrum. (MS).
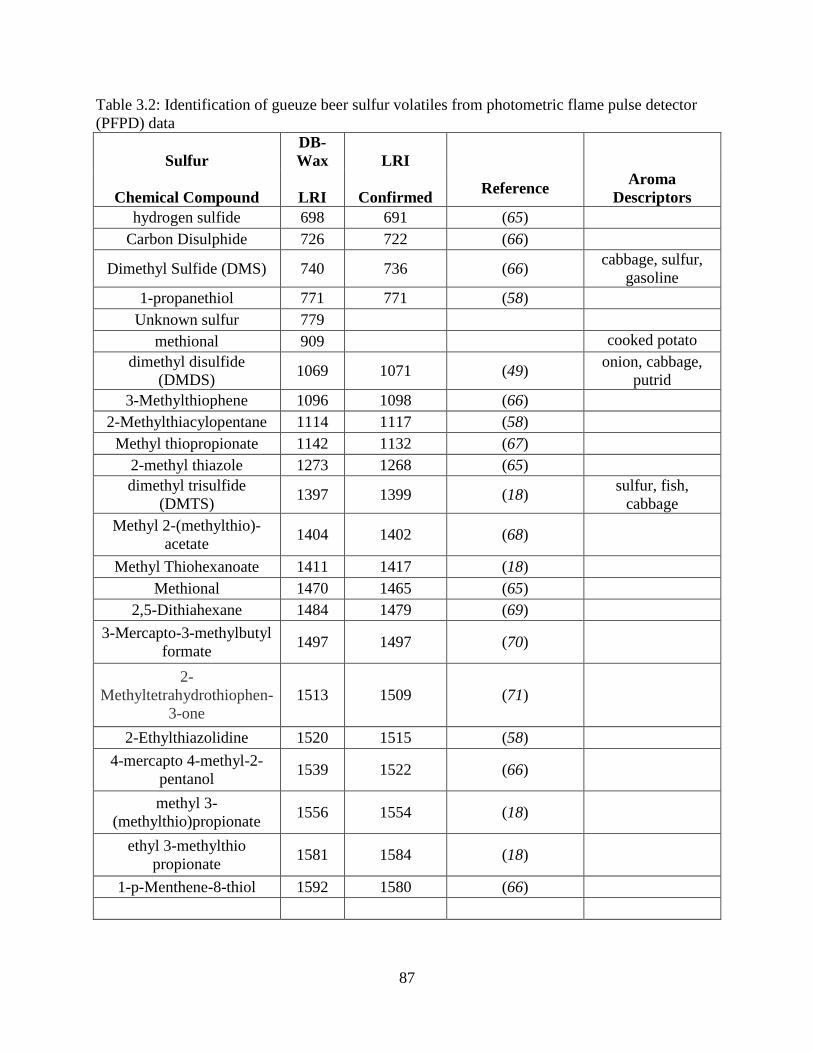
87
Table 3.2: Identification of gueuze beer sulfur volatiles from photometric flame pulse detector
(PFPD) data
Sulfur
DB-
Wax LRI
Chemical Compound LRI Confirmed Reference
Aroma
Descriptors
hydrogen sulfide 698 691 (65)
Carbon Disulphide 726 722 (66)
Dimethyl Sulfide (DMS) 740 736 (66) cabbage, sulfur,
gasoline
1-propanethiol 771 771 (58)
Unknown sulfur 779
methional 909
cooked potato
dimethyl disulfide
(DMDS) 1069 1071 (49)
onion, cabbage,
putrid
3-Methylthiophene 1096 1098 (66)
2-Methylthiacylopentane 1114 1117 (58)
Methyl thiopropionate 1142 1132 (67)
2-methyl thiazole 1273 1268 (65)
dimethyl trisulfide
(DMTS) 1397 1399 (18)
sulfur, fish,
cabbage
Methyl 2-(methylthio)-
acetate 1404 1402 (68)
Methyl Thiohexanoate 1411 1417 (18)
Methional 1470 1465 (65)
2,5-Dithiahexane 1484 1479 (69)
3-Mercapto-3-methylbutyl
formate 1497 1497 (70)
2-
Methyltetrahydrothiophen-
3-one
1513 1509 (71)
2-Ethylthiazolidine 1520 1515 (58)
4-mercapto 4-methyl-2-
pentanol 1539 1522 (66)
methyl 3-
(methylthio)propionate 1556 1554 (18)
ethyl 3-methylthio
propionate 1581 1584 (18)
1-p-Menthene-8-thiol 1592 1580 (66)
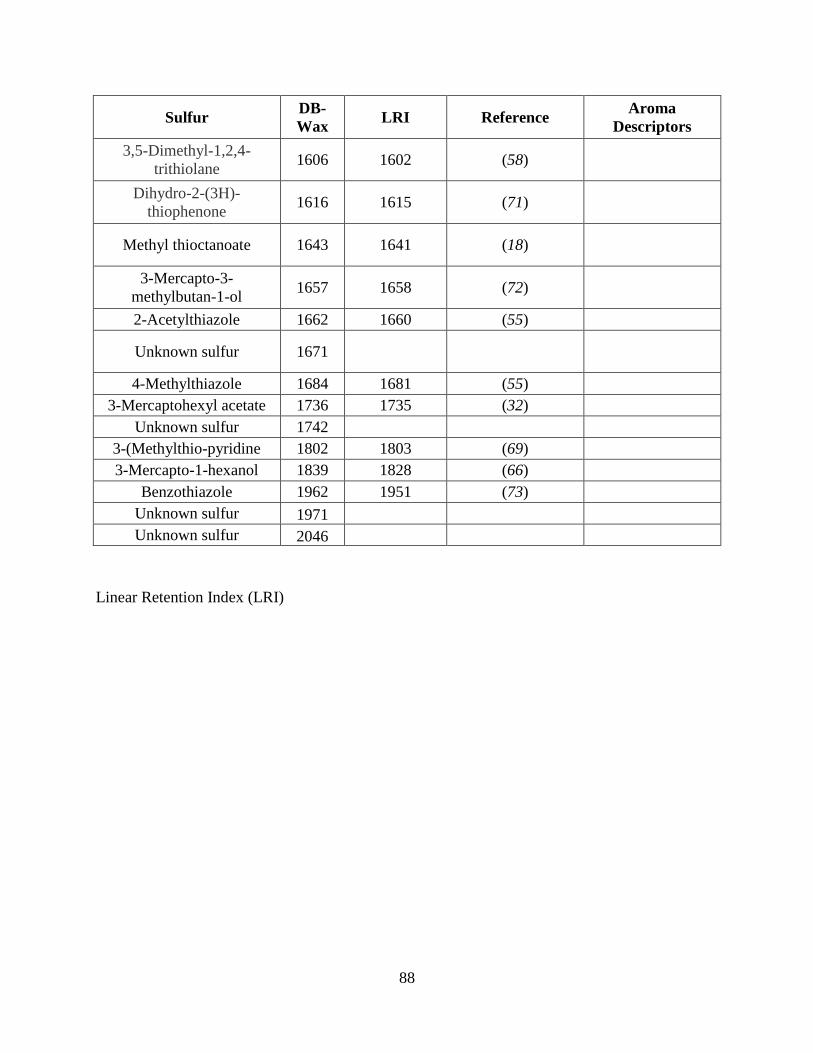
88
Sulfur DB-
Wax LRI Reference
Aroma
Descriptors
3,5-Dimethyl-1,2,4-
trithiolane 1606 1602 (58)
Dihydro-2-(3H)-
thiophenone 1616 1615 (71)
Methyl thioctanoate 1643 1641 (18)
3-Mercapto-3-
methylbutan-1-ol 1657 1658 (72)
2-Acetylthiazole 1662 1660 (55)
Unknown sulfur 1671
4-Methylthiazole 1684 1681 (55)
3-Mercaptohexyl acetate 1736 1735 (32)
Unknown sulfur 1742
3-(Methylthio-pyridine 1802 1803 (69)
3-Mercapto-1-hexanol 1839 1828 (66)
Benzothiazole 1962 1951 (73)
Unknown sulfur 1971
Unknown sulfur 2046
Linear Retention Index (LRI)
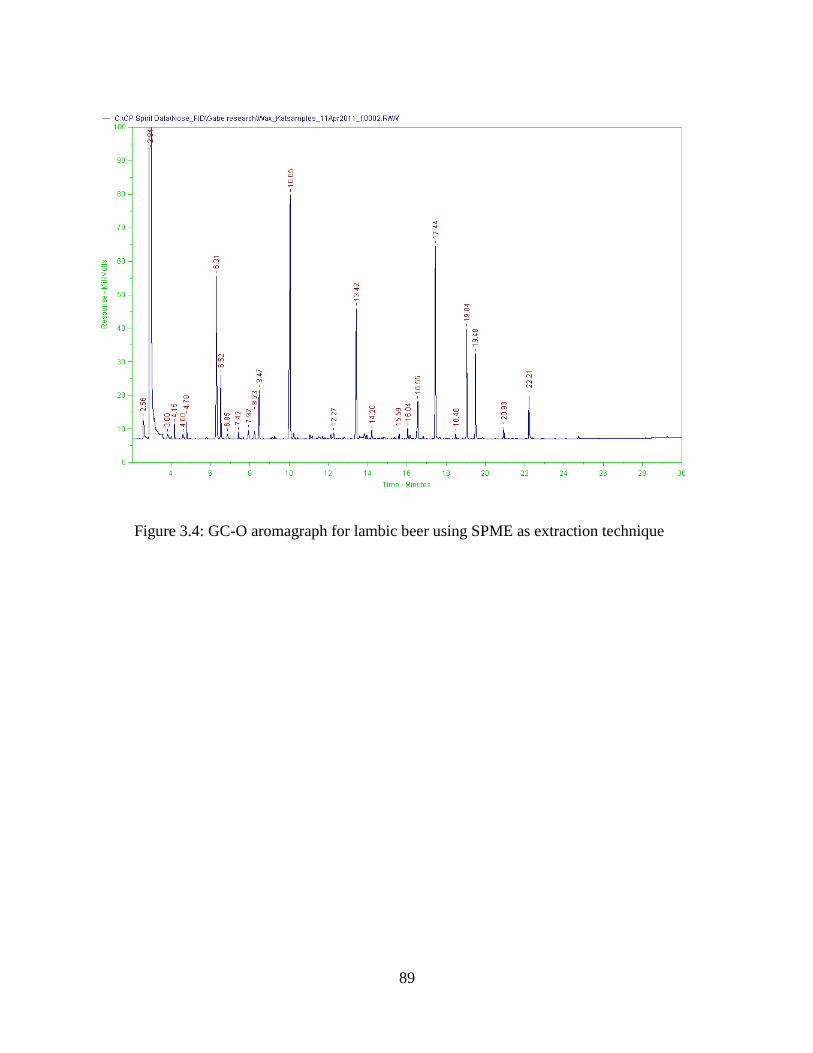
89
Figure 3.4: GC-O aromagraph for lambic beer using SPME as extraction technique
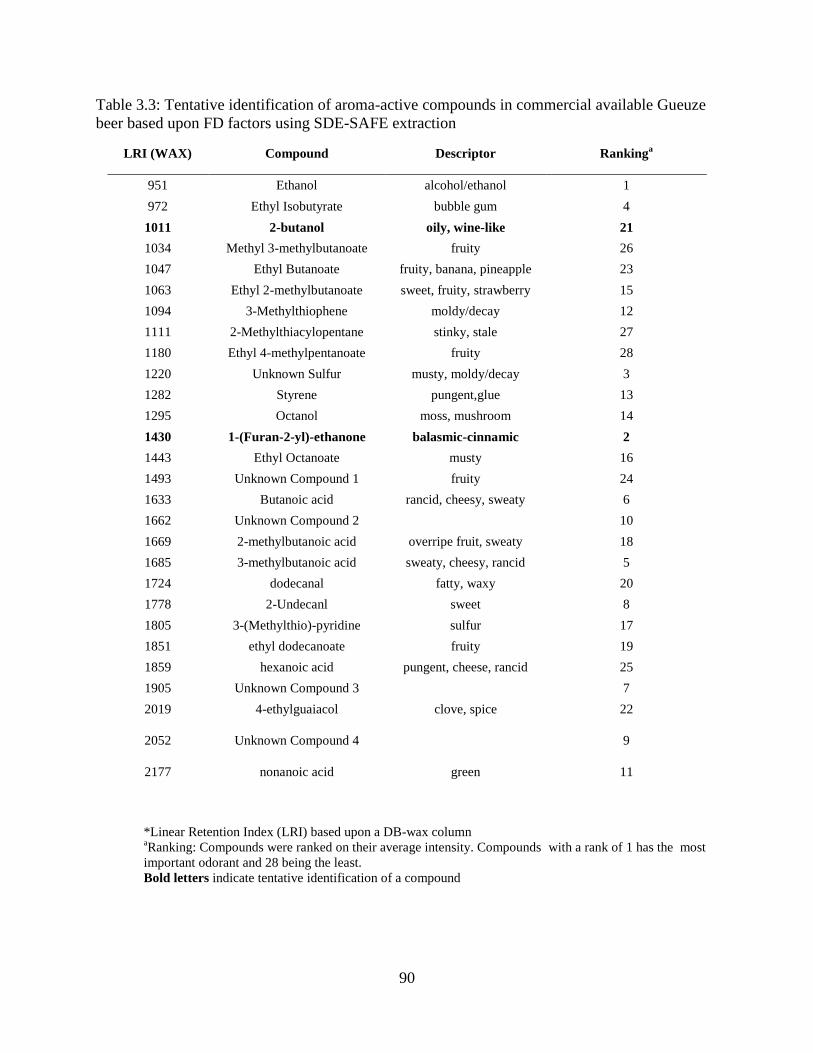
90
Table 3.3: Tentative identification of aroma-active compounds in commercial available Gueuze
beer based upon FD factors using SDE-SAFE extraction
LRI (WAX) Compound Descriptor Rankinga
951 Ethanol alcohol/ethanol 1
972 Ethyl Isobutyrate bubble gum 4
1011 2-butanol oily, wine-like 21
1034 Methyl 3-methylbutanoate fruity 26
1047 Ethyl Butanoate fruity, banana, pineapple 23
1063 Ethyl 2-methylbutanoate sweet, fruity, strawberry 15
1094 3-Methylthiophene moldy/decay 12
1111 2-Methylthiacylopentane stinky, stale 27
1180 Ethyl 4-methylpentanoate fruity 28
1220 Unknown Sulfur musty, moldy/decay 3
1282 Styrene pungent,glue 13
1295 Octanol moss, mushroom 14
1430 1-(Furan-2-yl)-ethanone balasmic-cinnamic 2
1443 Ethyl Octanoate musty 16
1493 Unknown Compound 1 fruity 24
1633 Butanoic acid rancid, cheesy, sweaty 6
1662 Unknown Compound 2
10
1669 2-methylbutanoic acid overripe fruit, sweaty 18
1685 3-methylbutanoic acid sweaty, cheesy, rancid 5
1724 dodecanal fatty, waxy 20
1778 2-Undecanl sweet 8
1805 3-(Methylthio)-pyridine sulfur 17
1851 ethyl dodecanoate fruity 19
1859 hexanoic acid pungent, cheese, rancid 25
1905 Unknown Compound 3
7
2019 4-ethylguaiacol clove, spice 22
2052 Unknown Compound 4
9
2177 nonanoic acid green 11
*Linear Retention Index (LRI) based upon a DB-wax column aRanking: Compounds were ranked on their average intensity. Compounds with a rank of 1 has the most
important odorant and 28 being the least.
Bold letters indicate tentative identification of a compound
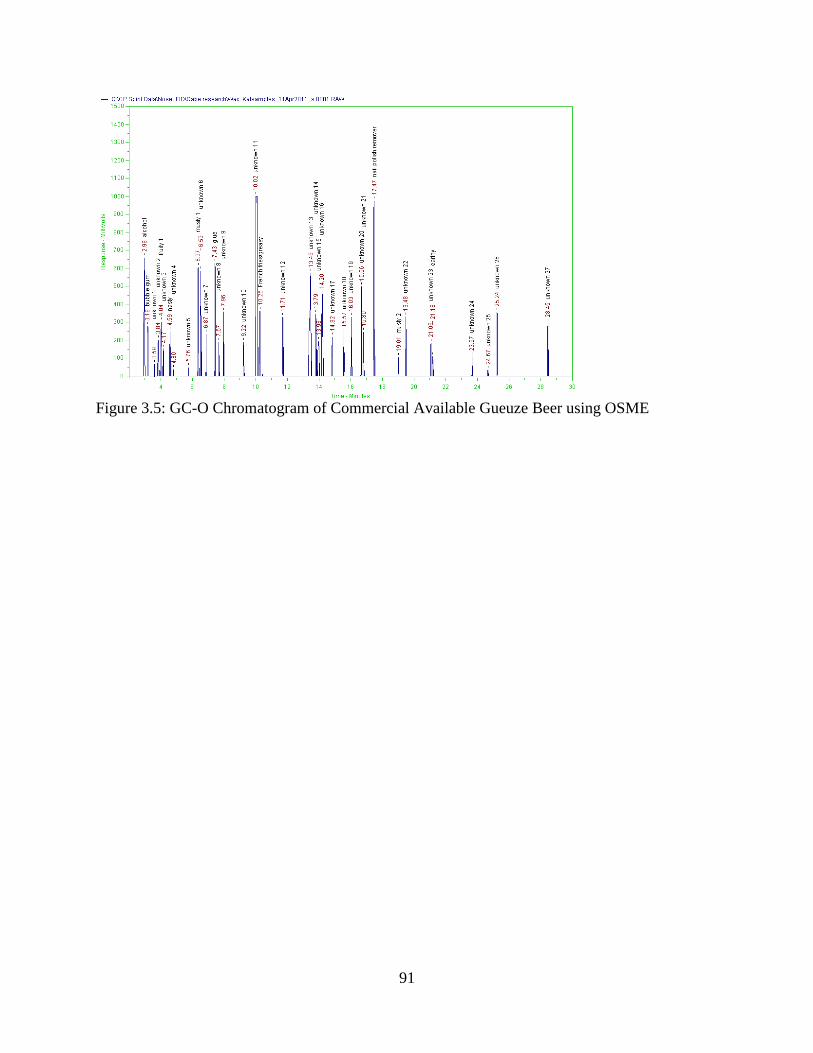
91
Figure 3.5: GC-O Chromatogram of Commercial Available Gueuze Beer using OSME
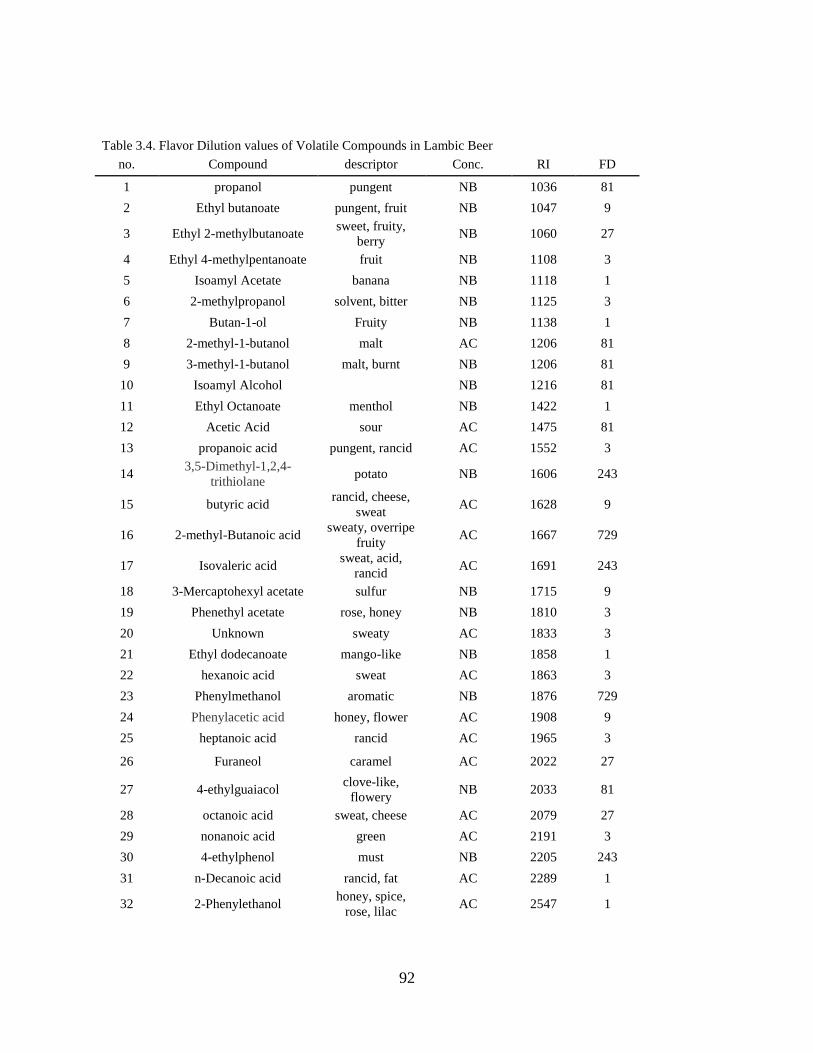
92
Table 3.4. Flavor Dilution values of Volatile Compounds in Lambic Beer
no. Compound descriptor Conc. RI FD
1 propanol pungent NB 1036 81
2 Ethyl butanoate pungent, fruit NB 1047 9
3 Ethyl 2-methylbutanoate sweet, fruity,
berry NB 1060 27
4 Ethyl 4-methylpentanoate fruit NB 1108 3
5 Isoamyl Acetate banana NB 1118 1
6 2-methylpropanol solvent, bitter NB 1125 3
7 Butan-1-ol Fruity NB 1138 1
8 2-methyl-1-butanol malt AC 1206 81
9 3-methyl-1-butanol malt, burnt NB 1206 81
10 Isoamyl Alcohol
NB 1216 81
11 Ethyl Octanoate menthol NB 1422 1
12 Acetic Acid sour AC 1475 81
13 propanoic acid pungent, rancid AC 1552 3
14 3,5-Dimethyl-1,2,4-
trithiolane potato NB 1606 243
15 butyric acid rancid, cheese,
sweat AC 1628 9
16 2-methyl-Butanoic acid sweaty, overripe
fruity AC 1667 729
17 Isovaleric acid sweat, acid,
rancid AC 1691 243
18 3-Mercaptohexyl acetate sulfur NB 1715 9
19 Phenethyl acetate rose, honey NB 1810 3
20 Unknown sweaty AC 1833 3
21 Ethyl dodecanoate mango-like NB 1858 1
22 hexanoic acid sweat AC 1863 3
23 Phenylmethanol aromatic NB 1876 729
24 Phenylacetic acid honey, flower AC 1908 9
25 heptanoic acid rancid AC 1965 3
26 Furaneol caramel AC 2022 27
27 4-ethylguaiacol clove-like,
flowery NB 2033 81
28 octanoic acid sweat, cheese AC 2079 27
29 nonanoic acid green AC 2191 3
30 4-ethylphenol must NB 2205 243
31 n-Decanoic acid rancid, fat AC 2289 1
32 2-Phenylethanol honey, spice,
rose, lilac AC 2547 1
93
CHATPER 4: ANALYSIS OF THE VOLATILE AND SEMI-VOLATILE COMPOUNDS
PRESENT IN COMMERCIAL AVAILABLE BEER USING GC-MS AND HPLC
Abstract
Lambic beer is the oldest style of beer still being produced in the Western world using
spontaneous fermentation. Gueuze is a style of lambic beer prepared by mixing young (1 year)
with older beers. Little is known about the volatiles and semi-volatiles found in commercial
brands of lambic (gueuze) beers. SPME was used to extract the volatiles and semi-volatiles from
nine different brands of lambic beer. GC-MS was used for the separation and identification of the
compounds extracted with SPME. pH and color of the beers were measured using standard
procedures. A total of 50 compounds were identified within the nine brands. Seventeen of the 50
compounds identified have been previously identified. Compounds identified included a number
of different chemical groups such as acids, alcohols, phenols, ketones, aldehydes, and esters.
Ethyl acetate, 4-ethylphenol, and 4-ethylguaiacol are known by-products of the yeast
Brettanomyces, which is normally a spoilage microorganisms in beer and wine but important for
flavor characteristics of lambic beer. There were no differences in pH but there were differences
in color between the beer samples.
94
Introduction
Lambic beer is one of the oldest styles of beer still being brewed today (1). There are
currently eight lambic breweries (Belle Vue, Boon, Cantillon, De Troch, Girardin, Lindemans,
Mort Subite, Timmermans), five blenders (De Cam, Drie Fonteinen, Hanssens, Oud Beersel, and
Tilquin), and two lambic breweries located in West Flanders (Bockor, Van Honsebrouck) that
are currently producing and selling lambic beer. However distribution of this type of beer is very
limited within the United States (2). Many lambic brewers and blenders are in financial trouble
because the very products they make putting their business at risk because of the time required to
produce lambic beer. Lambic beers can spend anywhere from a few weeks to several years aging
in casks or fermentation tanks before they are ready to be sold. This can be an issue since
breweries are holding onto hundreds of thousands of dollars’ worth of inventory while the beer is
aging. Another issue that arises from aging lambic beer is the current tax system in place forces
brewers to pay taxes on their beer within a year of being produced. This is a problem since true
lambic beers are required to age a minimum of one year. Oftentimes, brewers are in debt to the
government before the beer is even sold. The art and craft of making lambic beer is also dying,
because few people are willing to take the place of retiring brewers (1, 3).
Beer is a complex beverage system made up of volatile and semi-volatile compounds
belonging to a number of different chemical classes such as fusel alcohols, ethyl esters, fatty
acids, higher alcohol acetates, isoamyl esters, carbonyl compounds, furanic compounds,
terpenoids, C13-norisoprenoids, and volatile phenols (4). Many chemical compounds play an
important role in the appearance, aroma, flavor, and mouthfeel of alcoholic beverages.
Consumers judge the quality, character, and acceptability of alcoholic beverage based upon
95
olfactory and taste properties. The aroma profile of beer is made up of a number of different
chemical compounds varying in concentration and polarity (5).
Similar to other alcoholic beverages, beer is made up of a large number (~800) of volatile
and semi-volatile compounds, however only ten to thirty are aroma active (6-8). Different flavor
compounds can affect the aroma and flavor individually, synergistically, or antagonistically and
not all compounds affect the aroma of a product equally. Some compounds enhance the
background profile, while others contribute to the aroma and flavor characteristics (9). It is not
always the case that compounds with the greatest concentration have the greatest influence on a
product. In actuality, it is the compounds with the lowest concentration often have the greatest
influence on the aroma of a product (10).
The aim of this study was to compare the chemical and volatile compositions of
commercially available lambic beers using GC-MS and HPLC. GC-MS was utilized to analyze
the volatiles while HPLC was used to look at the acid compounds.
Materials and Methods
Materials
Ethyl isobutyrate (99% purity), ethyl butyrate (99% purity), ethyl 2-
methylbutyrate (99% purity), ethyl isovalerate (99% purity), isobutyl alcohol certified by ACS,
iso-amyl alcohol, styrene, nonyl aldehyde (95% purity), ethyl caprylate (99% purity), n-
pentadecane (99% purity), decanal, ethyl nonanoate, 1-octanol (99% purity), isobutryic acid
(99% purity), mono-ethyl succinate (95% purity), ethyl undecanoate (97% purity), 1-decanol
(99% purity), ethyl dodecanoate (98% purity), hexanoic acid (99% purity), n-nonanoic acid
(97% purity), decanoic acid (99% purity), lauric acid (99.5% purity) and (-)-ethyl lactate were
96
purchased from Fisher Scientific (Pittsburg, PA, USA) and used as standards. Acetic acid with a
concentration of 0.150g/L and L-lactic acid with a concentration of .204g/L were purchased from
R-Biopharm AG (Darmstadt, Germany). Octanoic acid and hexanoic acid, both having a
concentration of 5mg/10mL, were purchased from Fluka Analytical (Sigma-Aldrich, St. Louis,
MO). Isobutyric acid with a concentration of 5mg/10mL was purchased from Acros Organics
(Geel, Belgium. Lambic beer samples were purchased from a local wine and beer store in
Blacksburg, VA and Athens,GA. The brands were Cuvee Reneé ( LK23JGC 2975 23 Nov 2012),
Oude Gueuze Vieille (30-10-2026 L8304), Hanssens Artisan, Cantillon Gueuze 100% Lambic
Bio (3-Dec 2010 Bottled), 3-Fonteinen (Bottled Feb 23, 2006), Gueuze Girardin (XO179), Oude
Gueuze Boon (Best before 26-1-2025), Gueuze Boon (02-12-2025), and Cantillon – Classic
Gueuze (13 – Nov 2009 bottled).
Sample Preparation
The purchased beer was stored at room temperature before analysis. Beer was degassed
using an ultrasonic bath (Model FS20, Fisher Scientific) for 10 minutes. After the beer was
sonicated, it was filtered using a 5 mL syringe with a 0.45 µm filter (Fisherbrand MCE, mixed
cellulose ester, Cat 09-719B).
pH Measurement
pH was measured in triplicate for all bottles of beer immediately after the bottles were
opened. pH measurements were conducted using an Accumet XL20 probe which was calibrated
before use (Fisher Scientific, Pittsburg, PA).
Color
Color was measured with the official AOAC 977.50 method using a scanning
spectrophotometer (Shimadzu model UV-2550, Columbia, MD) (11).
97
Solid Phase Microextraction (SPME)
Extraction and concentration of volatile compounds in commercially available gueuze
beer was performed by solid phase microextraction. A SPME fiber (50/30 um
DVM/Carboxen/PDMS, 2 cm, Supelco, Bellefonte, PA) was exposed to the headspace above 4
mL of gueuze beer in 10ml headspace vials with Teflon-lined silicone septa (Chromacol, Fisher
Scientific) for 30 minutes at 40°C with an agitation speed of 250 rpm. Samples were equilibrated
for two minutes prior to exposing the fiber. An AOC-5000 Plus (Shimadzu Scientific, Columbia,
MD) SPME autosampler was used for automation of extraction and injection. Volatile
compounds were desorbed for five minutes in the injection port of a QP2010 Ultra (Shimadzu,
Columbia, MD) gas chromatography equipped with a GCMS-QP2010 Ultra gas chromatograph -
mass spectrometer. The injection port was set to 250°C, and all injections were made in splitless
mode using a narrow bore, deactivated glass insert. Volatile compounds were separated using a
nonpolar (SHRXI-5MS) 30m * 0.25mm id * 0.25 μm film thickness column with He as the
carrier gas at a flow rate of 2.0 mL/min (linear velocity 53.8 cm/sec). The GC oven temperature
program was 35º C held for 5 minutes and then increased to 225º C at a rate of 6º C/min. Once
the final temperature of 225º C was reached, it was maintained for 10 minutes. The MS was
maintained at 200°C and sample mass was scanned in the range of 40 – 200 amu. GCMS was
performed to identify the volatile compounds present in commercial samples of gueuze. Peaks
were identified using standardized retention time (retention index values, RI) and fragmentation
spectra of standards and the Wiley 2010 mass spectral library.
Identification
RI and Odor quality. Volatile compounds were identified based upon their odor descriptions and
RI values using both polar (DB-Wax) and nonpolar (DB-5) columns. Values were compared to
98
literature values. Solutions of hydrocarbons were analyzed in the same manner on both the DB-5
and DB-Wax columns to calculate RI:
RI = 100N + 100n (tRa – tRn)/(tR(N+n) – tRN)
N is the carbon number of the lowest alkane and n is the difference between the carbon number
of the two n-alkanes that are bracketed between the compound; tRa, tRn, and tR(N+n) are the
retention times of the unknown compound, the lower alkane, and the upper alkane.
High Performance Liquid Chromatography (HPLC)
Analysis of acids was conducted using an Agilent 1100 Series LC (Agilent Technologies,
Santa Clara, CA) with micro degasser, quaternary pump, autosampler, thermostated column
oven, and a diode array detector (DAD). A 5 µm 250 mm * 4.6 mm (i.d.) nucleosil phenyl
(C6H5) column (Macherey-Nagel, Bethlehem PA) was used at 20°C. The mobile phase
consisted of 10 mM aqueous phosphate buffer at pH 2.5. The wavelength range of 200 – 400 nm
was recorded using the DAD and used for spectral analysis. The flow rate was 1.0 mL/min and
an injection volume was 5 µL. External standard curves for acetic and L-lactic acid were made at
200, 400, 800, 1000, and 1200 mg/L concentrations in beer.
Chemical Analysis of lambic beer
The Enology Service Laboratory at Virginia Polytechnic Institute and State University
(Virginia Tech) is a part of the Wine/Enology Grape Chemistry Group. This is a full service
laboratory that was able to aid in the chemical analysis of the commercial available lambic
beersamples. The Enology Service Laboratory analyzed the beer for reducing sugars, total
acidity, lactic acid, and volatile acidity using standard methods.
Statistical Analyses
99
Statistical analyses were performed with SPSS software for Windows (version 18.0;
SPSS Inc., Chicago, IL). Statistical analysis of the data for pH, color, and quantified compounds
was performed by one-way analysis of variance with the linear model. Tukey-Kramer HSD was
used to compare the least square means of separation. Brands were considered significant at p <
0.05. Data values were reported as means ± SD.
Results and Discussions
pH
All lambic beer styles contain high levels of organic acids. The pH of gueuze, kriek (sour
cherries), and framboise (raspberries) all have lower pH levels than typical American lagers. The
pH range previously reported for gueuze ranged from 3.20 – 3.51 (12). The pH of American
lagers tends to range anywhere from 3.7 - 4.8. Gueuze has a lower pH than other beer styles
because of the additional microbial activity resulting in the production of acetic and lactic acid
(1).The presence of acetic or lactic acid bacteria are common and accepted in lambic beers,
however in America beers these microorganisms are spoilage organisms. Lactic acid bacteria
produces off-flavors and aromas such as honey or sweet butterscotch provided by the chemical
compounds diacetyl and vicinal diketones. Acetic acid bacteria can be hop-insensitive similar to
lactic acid bacteria and can be responsible for the ropiness of beer (13). The pH range for the
nine commercial beers ranged from 3.23 – 3.62 (Figure 4.1). Hanssens Artisan and 3-Fonteine
had the lowest pH values of 3.23 and 3.24. These samples also had the highest total acidity
(Table 4.3). Hanssens Artisan, which had the lowest pH, also had the highest total acidity at 7.83
g/L, while 3-Fonteine had the second highest total acidity concentration at 5.71 g/L. A
significant difference in pH was found between all the beers (Figure 4.1).
100
Color
Lambic (gueuze) beer can exhibit a wide range of colors from golden yellow for young
gueuze to light amber for older (2-3 years) gueuze. Gueuze typically ranges in color from 8 - 13
degrees SRM (Standard Reference Method) (1, 13). Color was measured using the SRM. The
color range for the beer analyzed varied from 6.85 – 10.25 (Table 4.2). The table shows there
were significant differences in the sample color (p<.05) between samples. A significant
difference between the color of Oude Gueuze Villie and Girardin was observed. Oude Gueuze
Viellie has a color value of 6.85 while Girardin had a color value of 10.25. Figure 4.2 depicts the
color values of the individual experimental units. The Figure shows that most of the brands have
similar SRM color values with the exception of Girardin. American lagers tend to be lighter in
color than lambic beers; American lagers ranging between 2 - 5 degrees SRM (1). In lambic
beers, little color comes from the unmalted wheat used in the mash. The majority of the color
comes from the lengthy boiling of the wort producing Maillard reaction between amines and
sugars resulting in melanoidins and caramel. Additional color formation comes directly from the
wooden casks themselves either from the wood or from oxidation during the fermentation and
maturation process of lambic beer (1). It is not unusual for wort used in lambic beer to be boiled
4 or more hours while 60 minutes is typical for an American lager.
Titratable acidity, residual sugar, lactic acid, volatile acidity and ethanol
Table 4.3 is the data collected by the Enology Service Laboratory at Virginia Tech.
Because of the high attenuation rate found in lambic (gueuze) beer, small to trace amounts of
reducing sugars were found. In prior research, only trace amounts (0.8% w/v) (14) were reported.
The amount of reducing sugars in the eight commercial beers tested ranged from 0.7 - 1.8 % w/v.
Beers sweetened with syrups tend to contain a higher percentage of reducing sugars (2% w/v)
101
because these beers tend to undergo a limited secondary fermentation and are quickly filtered
and pasteurized once the fermentation process is complete (1). Cantillon and Boon both
contained the highest percentage of reducing sugars at 1.8%w/v, while Oude Artisan had the
lowest at 0.7% w/v. A gueuze that is called "Oude" is considered an old gueuze that has been
allowed to ferment for three years, unlike traditional gueuzes that are fermented for two years.
The lactic acid (g/L) measured for the lambic (gueuze) beers ranged between 3.67 - 17.47 g/L.
Oude Artisan contained the highest lactic acid at 17.47 g/L while Cantillon had the lowest at 3.67
g/L. The volatile acidity for the lambic (gueuze) beer ranged from 3.97 g/L to 17.27g/L, Oude
Artisan had the highest volatile acidity, while Boon had the lowest. Volatile acidity refers to the
organic acids that are more volatile or are easily vaporized than non-volatile or fixed acids. Total
acidity (g/L) for the lambic (gueuze) beer ranged from 2.62 - 7.83 g/L with Oude Boon being the
lowest and Oude Artisan having the highest. Ethanol ranged from 5.64 – 7.16%. Ethanol
concentration for gueuze beers have been previously reported to range between 4.25 – 5.20%
(14).
Solid Phase Microextraction Analysis of Volatiles
SPME has been used as an extraction technique for volatile and semi-volatile compounds
in beer (15). The DVB/CAR/PDMS SPME fiber was reported by Rodriques et al (4) as being
able to provide a more complete volatile profile, due to the wider range of volatile and semi-
volatile compounds detected.
A total of 50 aroma compounds were identified by SPME-GCMS using a combination of
retention index and mass spectral matching against library standards (Table 4.3). Compounds
that could not be identified by comparing their retention index values were marked as tentatively
102
identified. Compounds identified belonged to a number of different chemical groups (ketones,
acids, alcohols, and phenols).
Thirty-three of the 50 compounds identified have not been previously reported in gueuze
lambic. Seventeen compounds have been reported by both Van Oevelen et al. (12) and Spaepen
et al. (16). The compounds previously reported by Van Oevelen et al. (12) were acetic acid,
lactic acid, butyric acid, propionic acid, isobutyric acid, propanol, butanol, isobutanol, isoamyl
alcohol, amyl alcohol, phenethylalcohol, ethyl acetate, and ethyl lactate. Spaepen and his
colleagues (16) reported finding caproic (hexanoic) acid, caprylic (octanoic) acid, capric
(decanoic) acid, isoamyl acetate, ethyl caproate (hexanoate), ethyl caprylate (octanoate), ethyl
caprate (decanoate), and phenethyl acetate.
The major chemical classes that account for lambic (gueuze) beer are alcohols, acids,
esters, phenols, aldehydes, and sulfur compounds. The production of alcohols in beer are a result
of yeast metabolism (17). Of the fifty compounds identified, eight were alcohols. Phenethyl
alcohol, isoamyl alcohol, and isobutanol have been previously reported alcohol compounds (12)
in lambic beer. 2-methyl-1-butanol (18), 1-hexanol (19), heptyl alcohol (20), 1-octanol (20), 2-
nonanol (19), 1-decanol (20) are all chemical compounds that have been previously reported in
beer, but not lambics.
Twenty-three esters compounds were detected using SPME GC-MS. In prior research,
only seven have been previously reported and they are ethyl acetate, lactate, butyrate, caproate,
caprylate, caprate, and phenethyl acetate (12, 16, 21). An additional fifteen ethyl esters were
detected using SPME. These compounds can be found in Table 4.3.
Acids play a vital role in the aroma and flavor profile of lambic beer. A total of seven
acids were identified using SPME GC-MS. The acids identified were acetic, lactic, isovaleric
103
hexanoic, valeric, octanoic, and decanoic acid (12, 16). With the exception of isovaleric and
valeric acids, all have been previously reported in gueuze beer. Isovaleric and valeric acid,
however, have been reported in other styles of beer (17).
External standards were used to quantify isovaleric acid (IVA), ethyl octanoate, 4-
ethylphenol (4EP), 4-ethylguaiacol (4EG), ethyl caprylate, octanol, ethyl undecanoate, and ethyl
acetate (Table 4.5). Isovaleric acid has been previously reported in beer before, but never in
lambic beers (17). Isovaleric acid, 4-ethylphenol and 4-ethylguaiacol are key components in the
overall aroma of Brettanomyces (22). The concentration of isovaleric (3-methylbutyric acid)
acid for gueuze beer ranged from 1.92 mg/L for Oude Gueuze Vielle – 3.01 mg/L for Cuvee
Renée. Isovaleric acid was found in six of the nine commercial beers (Cuvee Renée, Oude
Gueuze Vielle, Cantillion, Cantillion Bio, Girardin, and Oude Boon). In comparing the means
for all the brands, no difference was found for IVA. 4-ethylphenol and 4-ethylguaiacol are
known by-products of the wild yeast species Brettanomyces. Both compounds have been
previously reported in the literature. Neither compound, however, has been quantified for lambic
beers. The concentration of 4-ethylphenol ranged from 0.28 mg/L to 1.13 mg/L. Cuvee Renée
had the highest concentration of 4-ethylphenol at 1.13 mg/L and 0.28 mg/L for both Girardin and
Oude Boon. Table 4.6 is a comparison of means for 4-ethylphenol for commercial brands. 4-
ethylphenol has a sensory threshold of 425 µg/L and 4-ethylguaiacol has a sensory threshold of
100 µg/L. 4-Ethylguaiacol concentration ranged from 0.52 mg/L to 5.77 mg/L. Oude Boon was
found to have the lowest concentration of 4EG within the commercial brands, while Cuvee
Renée had the highest concentration of 4EG at 5.77 mg/L. (Table 4.7). When 4-ethylphenol is in
the presence of 4-ethylguaiacol, the sensory threshold for 4-ethylphenol is lower. The ratio of
104
4EP to 4EG is most often reported as 10:1. The ratio, however, can vary between regions and
wines (5, 23). Little is known about the ratio of 4EP:4EG in lambic beers.
Ethyl octanoate (ethyl caprylate) was the fourth compound quantified. Ethyl octanoate
has been previously reported in the literature as being found within lambic beer. The
concentration of ethyl octanoate found within the literature was reported to be 0.16 – 0.59 mg/L
(21). Ethyl octanoate was found within all nine commercial brands tested. The concentration of
ethyl octanoate ranged from 1.36 mg/L for 3 Fonteinen – 5.72 mg/L for Cantillion. When
comparing the means, a difference was found between the different brands (Table 4.8).
Octanol has been previously reported in beer (20, 24, 25), but never specifically lambic
beers. The concentration of octanol ranged from 0.025 mg/L to 0.084 mg/L. Oude Boon, Boon,
and Cantillion Bio all had a concentration of 0.025 mg/L while, Hanssens Artisan had the highest
concentration of 0.084 mg/L (Table 4.9).
Ethyl undecanoate has been reported in wine (26), brandy (27), whiskey (28), cognac
(29), and rum (30), but not beer. Ethyl undecnaote was detected in four of the nine brands. The
range for ethyl undecnoate was 8.6 mg/L to 46.02 mg/L. Cantillion Bio had the lowest
concentration of ethyl undecanoate at 8.6 mg/L, Oude Gueuze Vielle was next at 16.72 mg/L,
Cantillion was third at 28.87 mg/L, and Cuvee Renée had the highest at 46.02 mg/L. (See Table
4.10).
Ethyl acetate is one of the twenty-seven compounds previously identified in lambic beer
(12, 21). Ethyl acetate was identified in all of the commercial brands of lambic beers. The
highest concentration of ethyl acetate previously reported in the literature for lambic beer was
539.8 mg/L. The average concentration for refermented gueuze was 60.9 – 167 mg/L, while
filtered gueuze ranged from 33.4 – 67.6 mg/L (12). The concentration of ethyl acetate in the
105
commercial lambic beers ranged from 11.82 – 66.89 mg/L. Boon had the lowest concentration of
ethyl acetate and Hanssens Artisan had the highest concentration. (Table 4.11).
Organic acids
The organic acids present in beer play important roles in aroma and taste. First, organic
acids are one of the primary groups of compounds that contribute sourness. All organic acids
have their own characteristic flavor, aroma, and taste (31-33). Citric acid possesses a fresh acid
flavor, which is very different from that of malic acid, while succinic has both a salty and bitter
flavor in addition to its sourness. Second, acids can help protect beer from harmful
microorganisms by decreasing the pH (32). Third, the organic acids present in beer can aid in
prolonging the shelf life by providing the beer with a strong buffering capability (32, 34). Acetic
acid has a flavor threshold of 200 ppm, while lactic acid has a flavor threshold of 400 ppm (35,
36).
Acetic and L-lactic acid were found in varying concentrations within different styles of
lambic beer (37). It has been reported that the concentration of lactic can be as high as 10,000
mg/L for lactic in ropy lambics and 1200 mg/L for acetic lambics (12).The comparison of acetic
and lactic acid found in commercial lambic beer can be found in Table 4.12. In comparison to
gueuzes, ales and lagers have a much lower concentration of acetic and lactic acid. Ales and
lagers normally contain anywhere from 60 – 140 ppm concentration of acetic acid. The
concentration of acetic acid in gueuze beer can range between 500 – 1500 mg/L. The
concentration of acetic acid in the commercial samples ranged from 723 mg/L for Oude Boon to
1642 mg/L for Hanssens Artisans. There was no difference in acetic acid concentration between
the different brands (p>.05).
106
The concentration of lactic acid in gueuze beer can range between 1,500 – 3,500 mg/L
while typical American lagers tend to have much lower concentrations, around 40 – 150 ppm (1).
Table 4.12 shows a comparison of means for lactic acid. The concentration of lactic acid ranged
from 1098 – 2979 mg/L. Cantillon Bio had the highest level of lactic acid at 2979 mg/L followed
by Cuvee Renée at 2563 mg/L. Oude Gueuze Villie had the lowest concentration of lactic acid at
1098 mg/L. Values with the same superscript are not significantly different (p>.05). Based upon
the comparison of means, Cantillon Bio is significantly different from Girardin, Cantillion,
Hanssens Artisans, 3-Fonteinen, Boon, Oude Boon, and Oude Gueuze Viellie. Cuvee Renée was
found not to be significantly different from any of the other brands.
Conclusion
In this study, the volatile and semi-volatile compounds of nine commercial brands of
lambic (gueuze) beer were identified using GC-MS and HPLC. A total of 50 volatile and semi-
volatile compounds were identified in the nine commercial brands. Of the 50 compounds
identified, seventeen of them have been previously identified in the literature. Acetic and lactic
acid were identified and quantified using HPLC.
107
Literature Cited
1. Guinard, J. X., Lambic. Brewers Publications: Boulder, 1990; p 159.
2. Van den Steen, J., Gueuze & Kriek: The secret of lambic. Lannoo Publishers: Tielt,
Belgium, 2011; p 224.
3. De Keersmaecker, J., The mystery of lambic beer. Scientific American 1996, 275, 74.
4. Rodrigues, F.; Caldeira, M.; Camara, J. S., Development of a dynamic headspace solid-
phase microextraction procedure coupled to GC-qMSD for evaluation the chemical profile in
alcoholic beverages. Analytica Chimica Acta 2008, 609, 82-104.
5. Ferreira, V.; Ortin, N.; Escudero, A.; Lopez, R.; Cacho, J., Chemical characterization of
the aroma of Grenache rose wines: Aroma extract dilution analysis, quantitative determination,
and sensory reconstitution studies. Journal of Agricultural and Food Chemistry 2002, 50, 4048-
4054.
6. Ferreira, V.; Lopez, R.; Cacho, J. F., Quantitative determination of the odorants of young
red wines from different grape varieties. J. Sci. Food Agric. 2000, 80, 1659-1667.
7. Reineccius, G., Flavor Chemistry and Technology. 2nd ed.; CRC Press: Boca Raton,
2006.
8. Taylor, A. J., Food Flavour Technology. Sheffield Academic Press: Boca Raton, FL,
2002; p 302.
9. Romano, P.; Fiore, C.; Paraggio, M.; Caruso, M.; Capece, A., Function of yeast species
and strains in wine flavour. International Journal of Food Microbiology 2003, 86, 169-180.
10. Plutowska, B.; Wardencki, W., Application of gas chromatography-olfactometry (GC-O)
in analysis and quality assessment of alcoholic beverages - A review. Food Chem. 2008, 107,
449-463.
11. Journal of AOAC International. Arlington, VA: AOAC International, 1992.
12. Van Oevelen, D.; Delescaille, F.; Verachtert, H., Synthesis of aroma components during
spontaneous fermentation of lambic and gueueze. J. Inst. Brew. 1976, 82, 322-326.
13. Goldammer, T., The Brewer's Handbook The Complete Book to Brewing Beer. 2 ed.;
Apex: Clifton, 2008; p 480.
14. Plevoets, C., Van Ginderachter, S., Pamphlet. In Gueuze, M. B. d. l., Ed. 1988; p 8.
15. Constant, M.; Collier, J., Headspace gas chromatography profiles of fruit-flavored malt
beverages using solid-phase microextraction. J. Am. Soc. Brew. Chem. 1997, 55, 112-118.
108
16. Spaepen, M.; Vanoevelen, D.; Verachtert, H., Fatty-acids and esters produced during
spontaneous fermentation of lambic and gueuze. J. Inst. Brew. 1978, 84, 278-282.
17. Nykänen, L.; Suomalainen, H., Aroma of beer, wine, and distilled alcoholic beverages.
D. Reidel ; Distributors for the U.S.A. and Canada, Kluwer Boston: Dordrecht, Holland; Boston,
U.S.A.; Hingham, MA, 1983.
18. Strating, J., Venema, A., Gas-chromatographic study of an aroma concentrate from beer.
J. Inst. Brew 1961, 37, 525 - 528.
19. Tressl, R. F., L.; Fendesack F.; Koppler H., Gas chromatographic mass spectrometric
investigation of hop aroma constitutents in beer. J. Agric. Food Chem 1978, 26, 1422 - 1426.
20. Drawert, F., Tressl, R., Beer aromatics and their origin. Tech. Quart. Master Brewers
Ass. Am. 1972, 9, 72 - 76.
21. Van Oevelen, D.; Spaepen, M.; Timmermans, P.; Verachtert, H., Microbiological aspects
of spontaneous wort fermentation in production of lambic and gueuze. J. Inst. Brew. 1977, 83,
356-360.
22. Goode, J., Brettanomyces. In The Science of Wine, From Vine to Glass, 2005; pp 136 -
143.
23. Ferreira, V., Aznar, M., Lopez, R., and Cacho, J, Quantitative gas chromatography-
olfactometry carried out at different dilutions of an extract. Key differences in the odor profiles
of four high-quality Spanish aged red wines. J. Agric. Food Chem 2001, 49, 4818 - 4824.
24. Buttery, R. G., Black, D.R., Lewis, M.J., Ling, L., A study of the fate of volatile hop
constitutes in beer. J. Food Sci. 1967, 32, 414 - 419.
25. Strating, J., van Eerde, P., The Staling of beer. J. Inst. Brewing 1973, 79, 414 - 415.
26. Chaudhary, S. S., Webb, A. D., Kepner, R. E., GLC investigation of the volatile
compounds in extracts from Sauvignon blanc wines from normal and botrytised grapes. Am. J.
Enol. Vitic. 1968, 19, 6 - 12.
27. Suomalai.H., N., L., The formation of aroma compounds by yeast in sugar fermentation.
Suomen Kemistilehti B 1964, 37, 230 - 232.
28. Williams, A. A., Tucknott, O.G., The volatile components of Scotch whisky. J. Sci. Food
Agric. 1972, 22, 1 - 7.
29. Schreier, P., Drawert, F., Winkler, F., Composition of neutral volatiles constitutes in
grape brandies. J. Agric. Food Chem 1979, 27, 365 - 372.
30. Liebich, H. M., Koenig, W. A., Bayer, E., Analysis of the flavor of rum by gas-liqued
chromatography and mass spectrometry. J. chromatogr. Sci 1970, 8, 527 - 533.
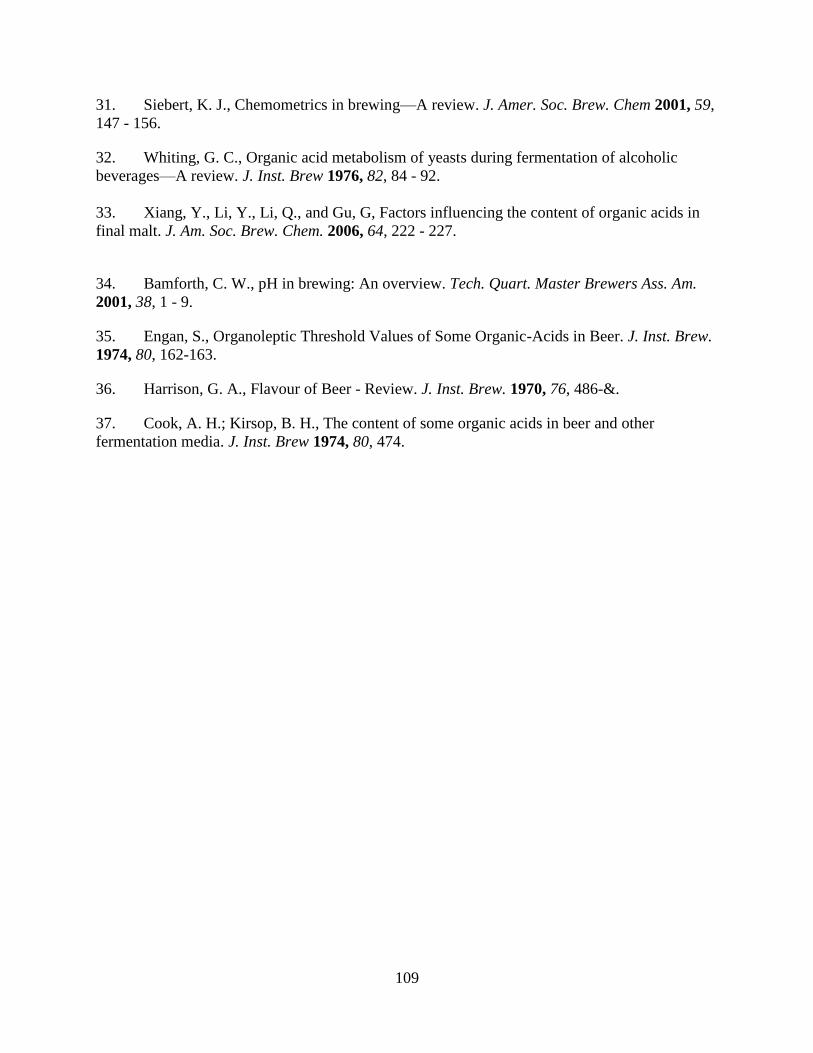
109
31. Siebert, K. J., Chemometrics in brewing—A review. J. Amer. Soc. Brew. Chem 2001, 59,
147 - 156.
32. Whiting, G. C., Organic acid metabolism of yeasts during fermentation of alcoholic
beverages—A review. J. Inst. Brew 1976, 82, 84 - 92.
33. Xiang, Y., Li, Y., Li, Q., and Gu, G, Factors influencing the content of organic acids in
final malt. J. Am. Soc. Brew. Chem. 2006, 64, 222 - 227.
34. Bamforth, C. W., pH in brewing: An overview. Tech. Quart. Master Brewers Ass. Am.
2001, 38, 1 - 9.
35. Engan, S., Organoleptic Threshold Values of Some Organic-Acids in Beer. J. Inst. Brew.
1974, 80, 162-163.
36. Harrison, G. A., Flavour of Beer - Review. J. Inst. Brew. 1970, 76, 486-&.
37. Cook, A. H.; Kirsop, B. H., The content of some organic acids in beer and other
fermentation media. J. Inst. Brew 1974, 80, 474.
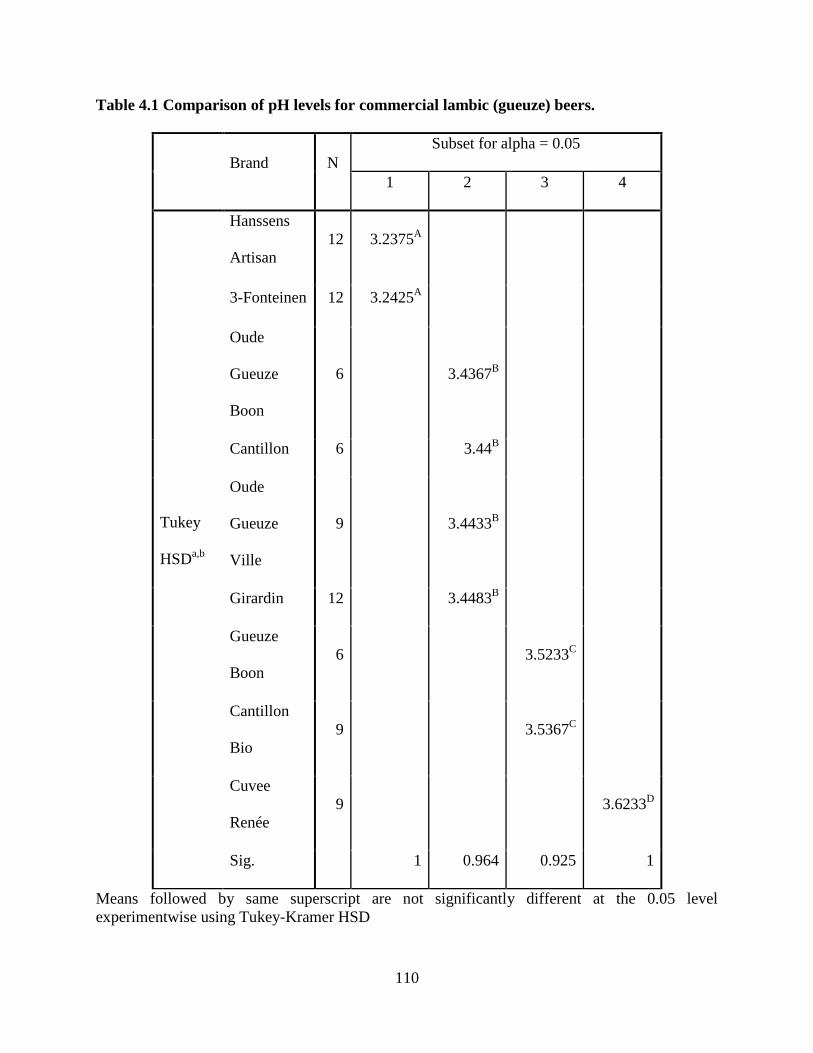
110
Table 4.1 Comparison of pH levels for commercial lambic (gueuze) beers.
Brand N
Subset for alpha = 0.05
1 2 3 4
Tukey
HSDa,b
Hanssens
Artisan
12 3.2375A
3-Fonteinen 12 3.2425A
Oude
Gueuze
Boon
6 3.4367B
Cantillon 6 3.44B
Oude
Gueuze
Ville
9 3.4433B
Girardin 12 3.4483B
Gueuze
Boon
6 3.5233C
Cantillon
Bio
9 3.5367C
Cuvee
Renée
9 3.6233D
Sig. 1 0.964 0.925 1
Means followed by same superscript are not significantly different at the 0.05 level
experimentwise using Tukey-Kramer HSD
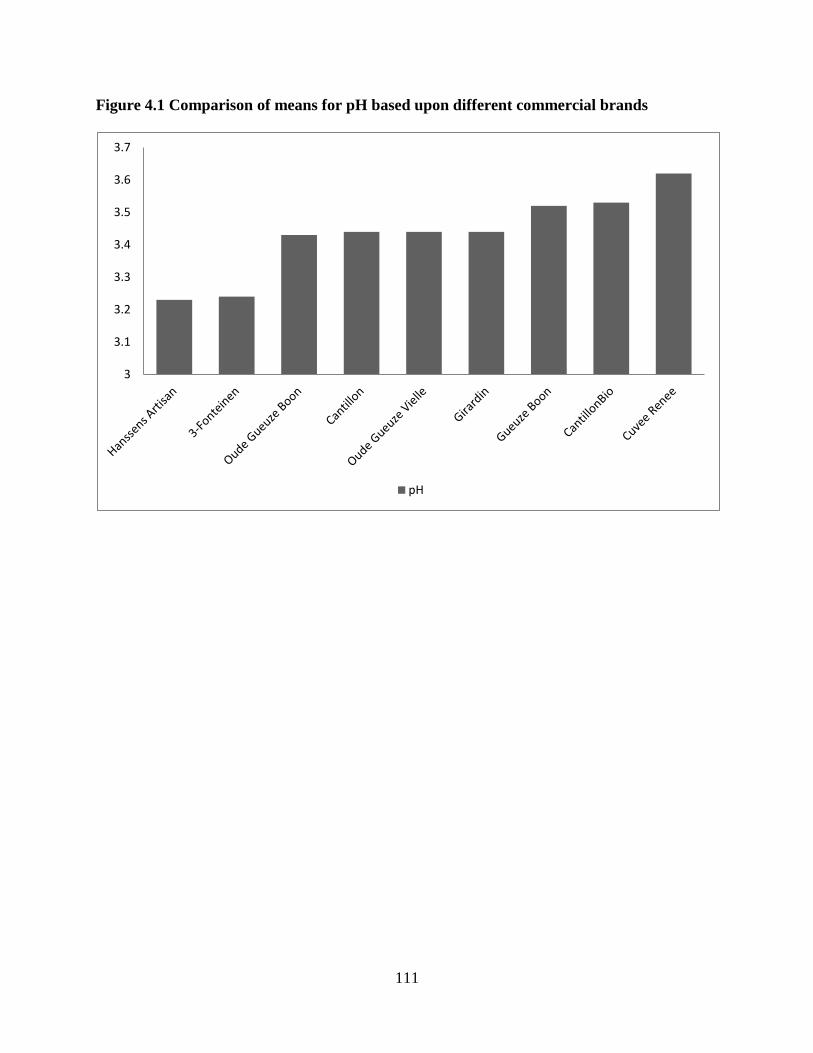
111
Figure 4.1 Comparison of means for pH based upon different commercial brands
3
3.1
3.2
3.3
3.4
3.5
3.6
3.7
pH
112
Figure: 4.2 Graphical representation of all the pH values for the commercial gueuze beers
Numbers represent different brands: 1. Cuvee Renée, 2. Cantillon 3. Oude Gueuze Viellie, 4.
Hanssens Artisan, 5. Cantillion Bio, 6. 3-Fonteinen, 7. Girardin, 8. Oude Gueuze Boon, 9. Boon
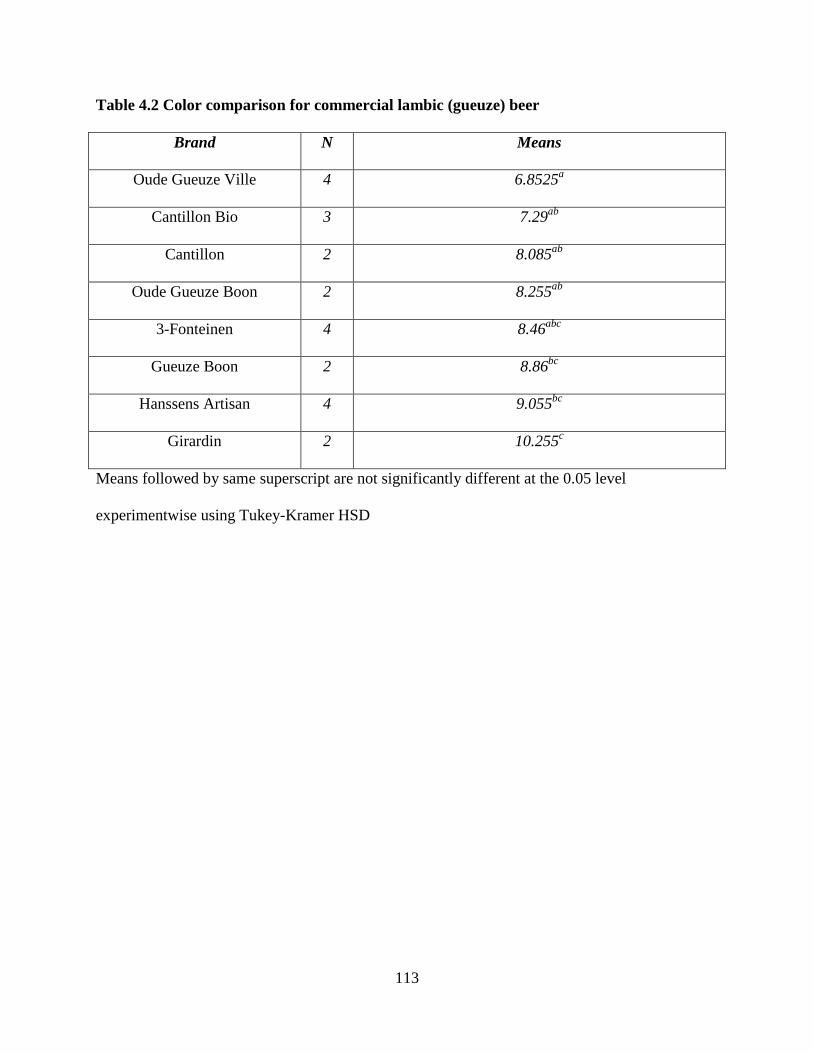
113
Table 4.2 Color comparison for commercial lambic (gueuze) beer
Brand N Means
Oude Gueuze Ville 4 6.8525a
Cantillon Bio 3 7.29ab
Cantillon 2 8.085ab
Oude Gueuze Boon 2 8.255ab
3-Fonteinen 4 8.46abc
Gueuze Boon 2 8.86bc
Hanssens Artisan 4 9.055bc
Girardin 2 10.255c
Means followed by same superscript are not significantly different at the 0.05 level
experimentwise using Tukey-Kramer HSD
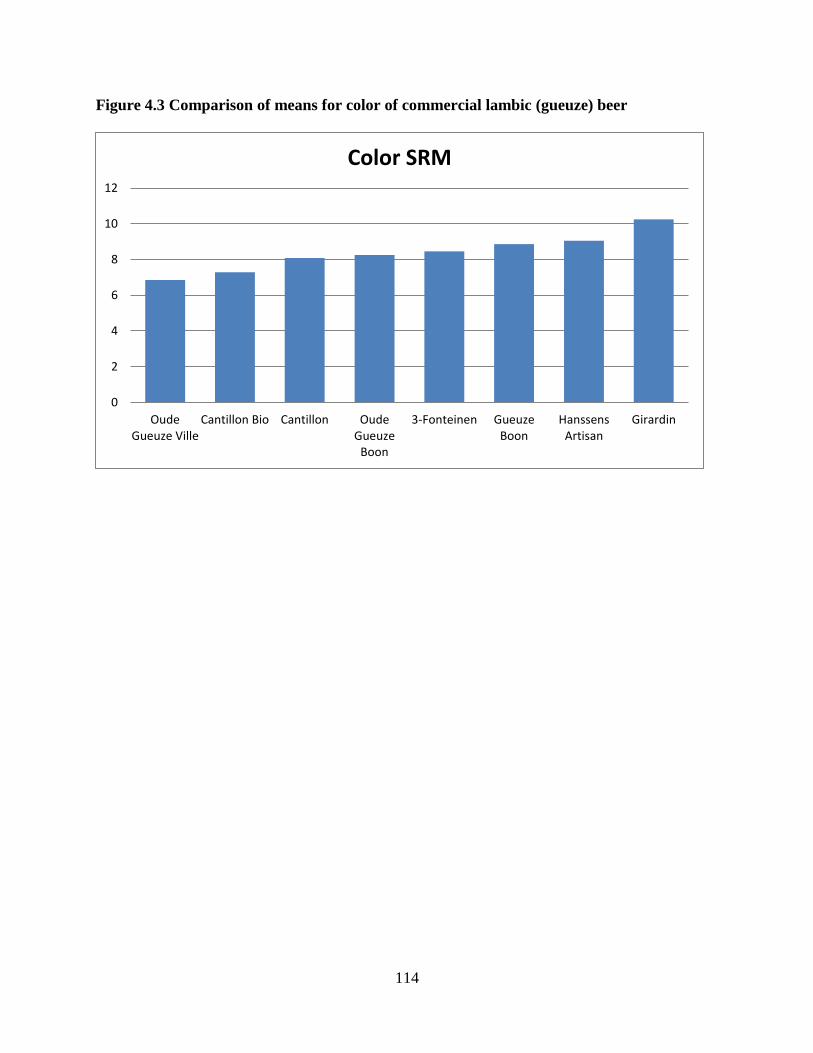
114
Figure 4.3 Comparison of means for color of commercial lambic (gueuze) beer
0
2
4
6
8
10
12
OudeGueuze Ville
Cantillon Bio Cantillon OudeGueuze
Boon
3-Fonteinen GueuzeBoon
HanssensArtisan
Girardin
Color SRM
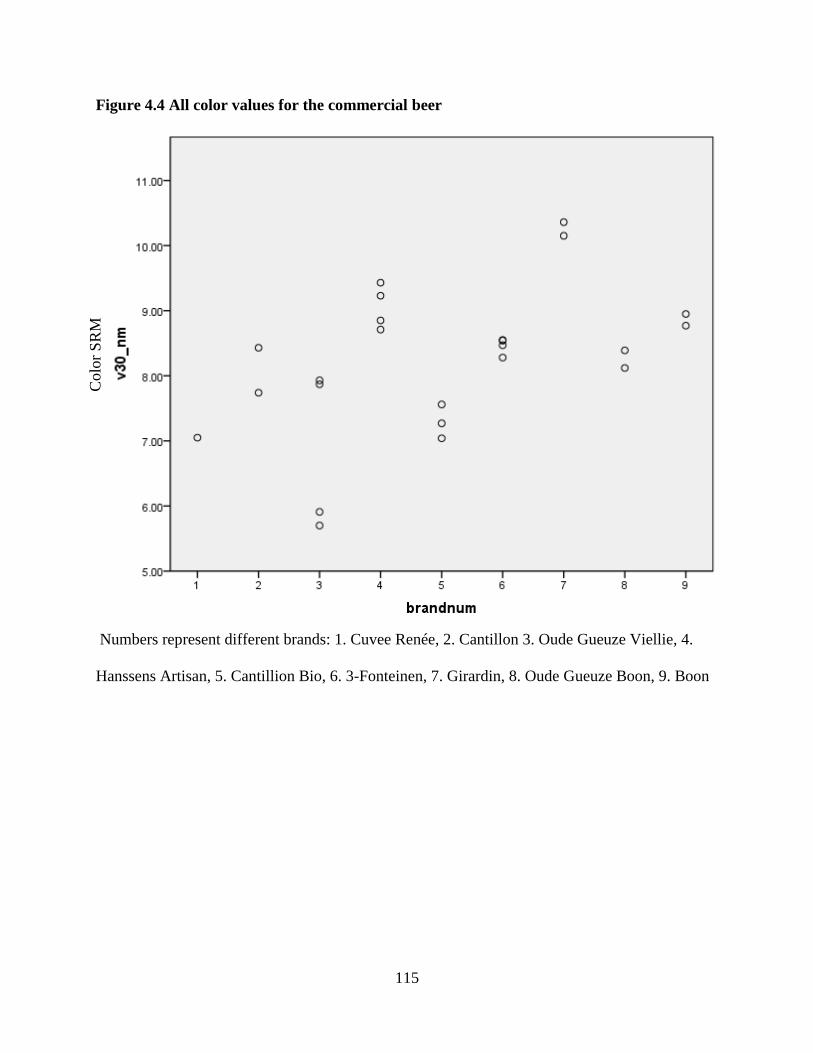
115
Figure 4.4 All color values for the commercial beer
Numbers represent different brands: 1. Cuvee Renée, 2. Cantillon 3. Oude Gueuze Viellie, 4.
Hanssens Artisan, 5. Cantillion Bio, 6. 3-Fonteinen, 7. Girardin, 8. Oude Gueuze Boon, 9. Boon
Colo
r S
RM
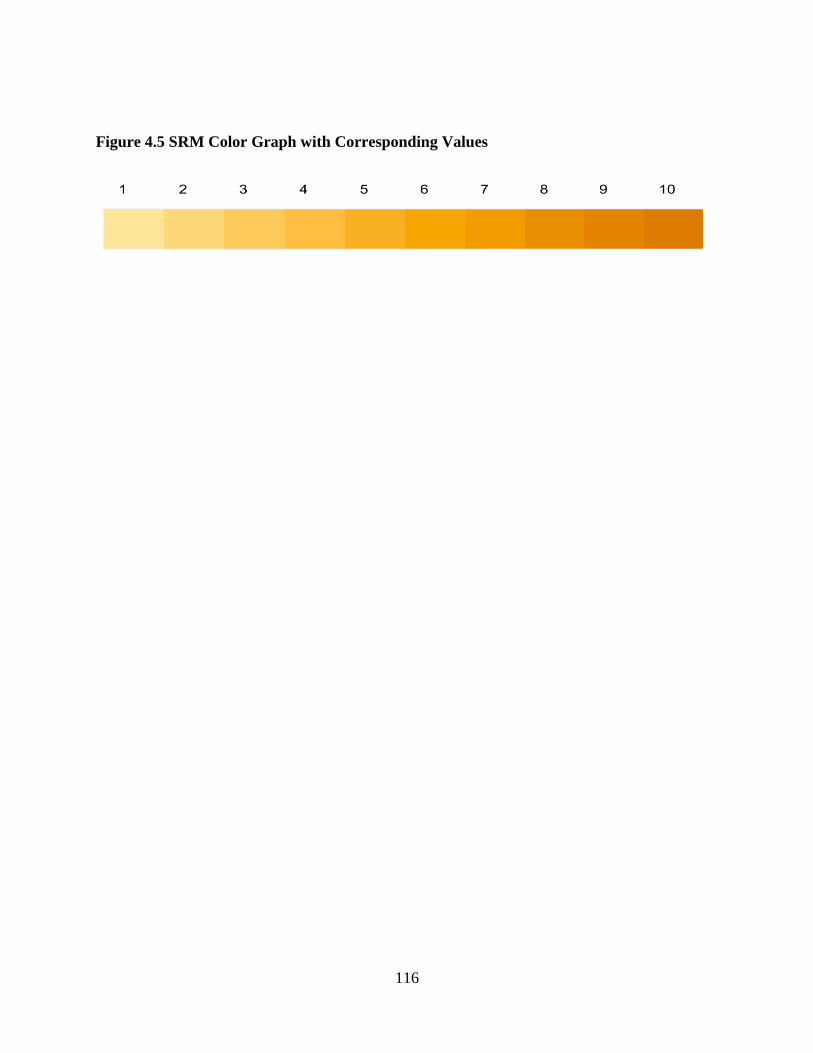
116
Figure 4.5 SRM Color Graph with Corresponding Values
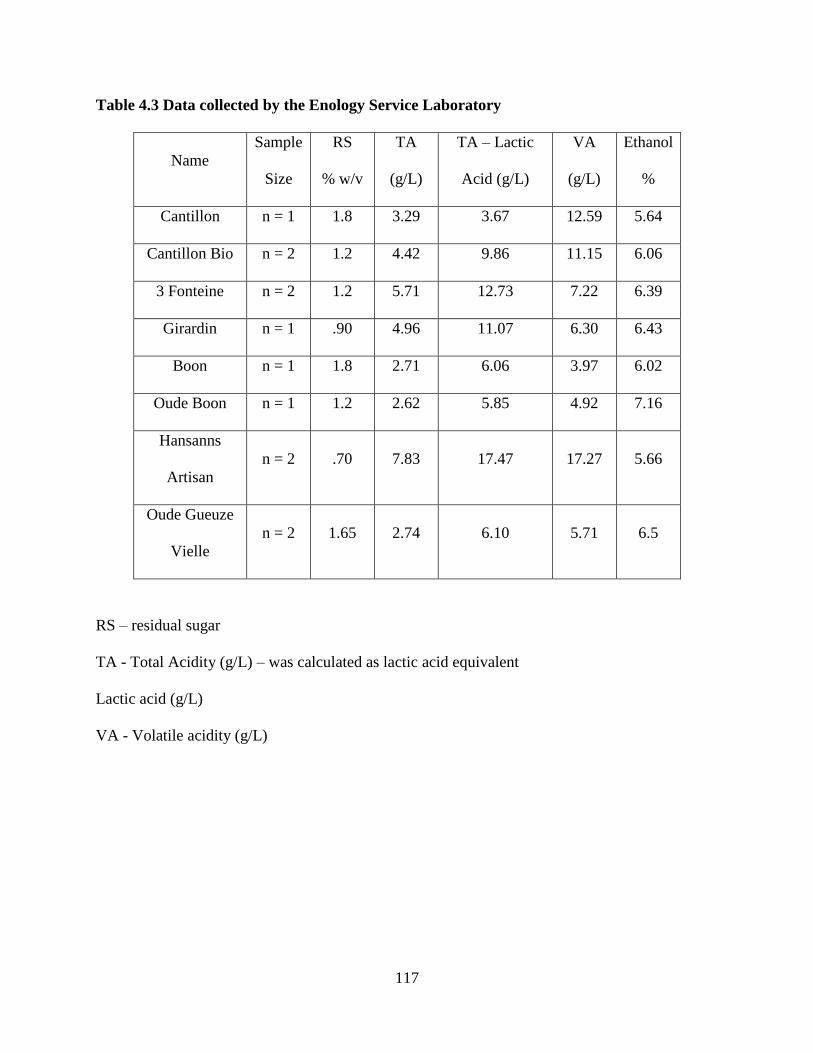
117
Table 4.3 Data collected by the Enology Service Laboratory
Name
Sample
Size
RS
% w/v
TA
(g/L)
TA – Lactic
Acid (g/L)
VA
(g/L)
Ethanol
%
Cantillon n = 1 1.8 3.29 3.67 12.59 5.64
Cantillon Bio n = 2 1.2 4.42 9.86 11.15 6.06
3 Fonteine n = 2 1.2 5.71 12.73 7.22 6.39
Girardin n = 1 .90 4.96 11.07 6.30 6.43
Boon n = 1 1.8 2.71 6.06 3.97 6.02
Oude Boon n = 1 1.2 2.62 5.85 4.92 7.16
Hansanns
Artisan
n = 2 .70 7.83 17.47 17.27 5.66
Oude Gueuze
Vielle
n = 2 1.65 2.74 6.10 5.71 6.5
RS – residual sugar
TA - Total Acidity (g/L) – was calculated as lactic acid equivalent
Lactic acid (g/L)
VA - Volatile acidity (g/L)
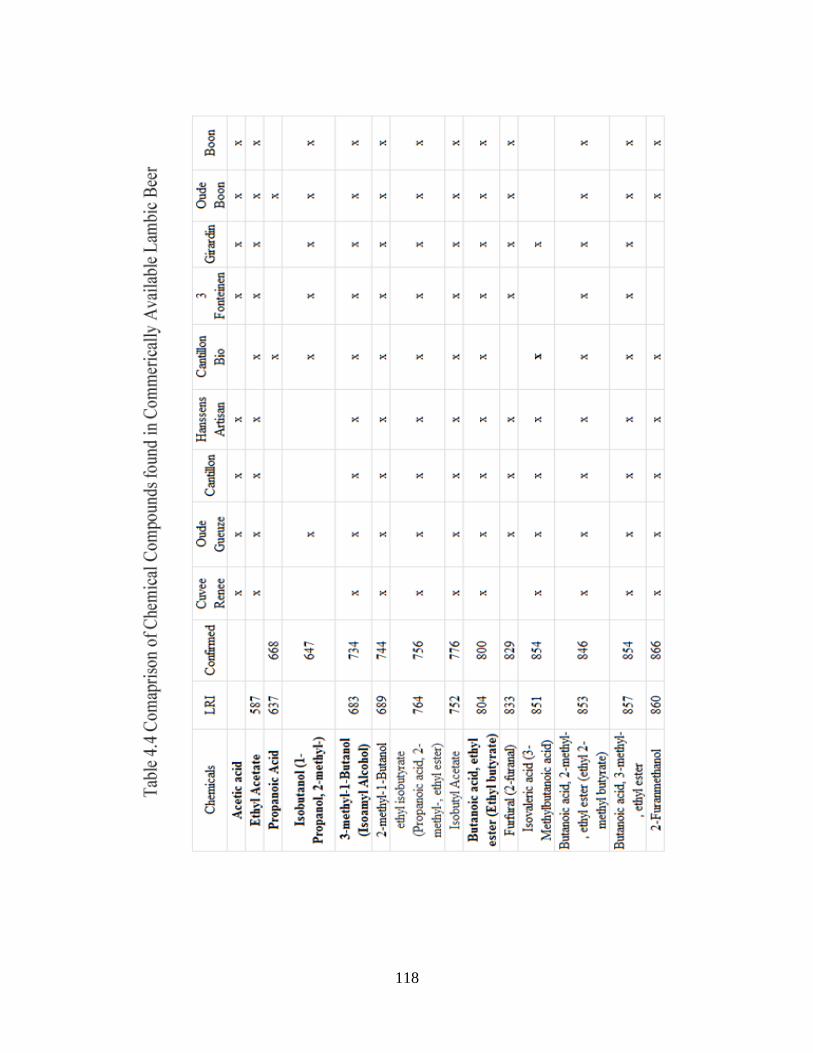
118
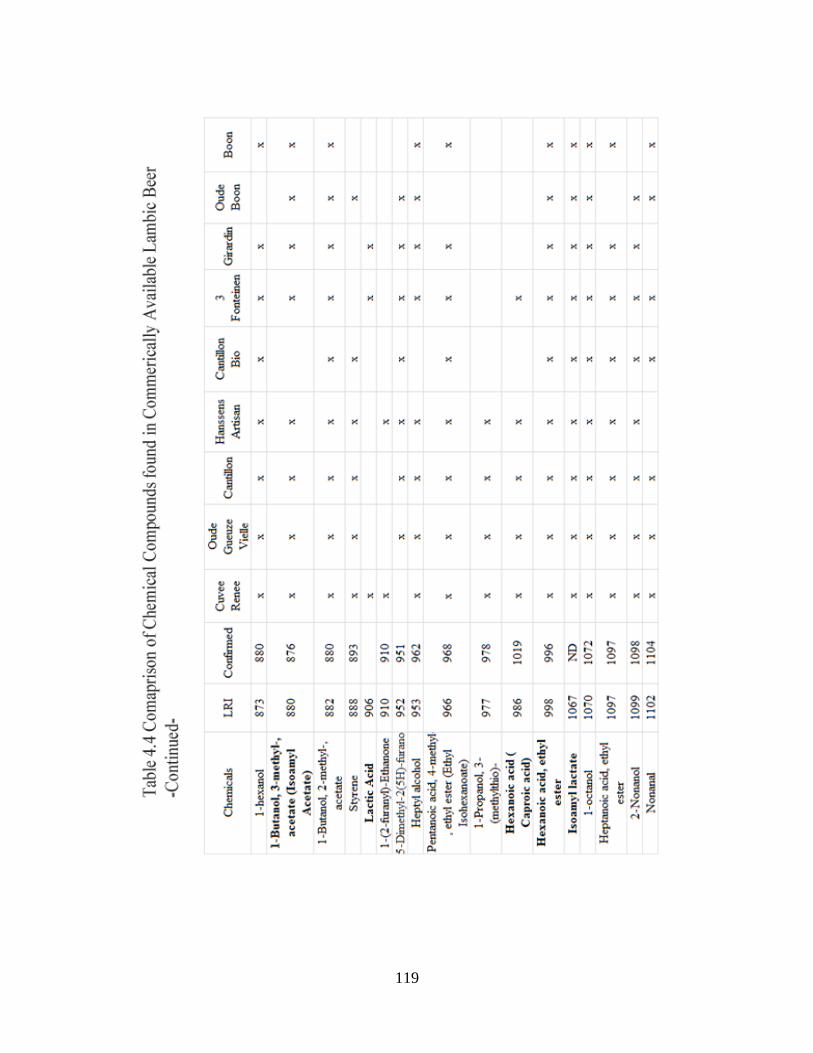
119
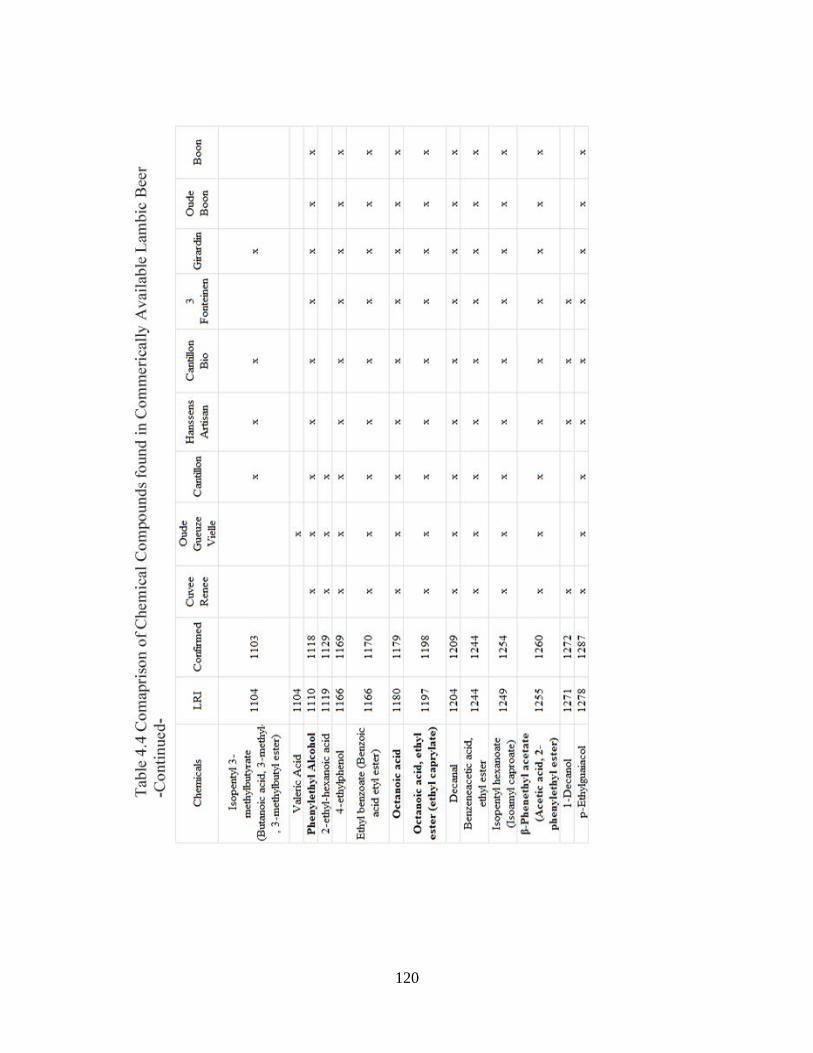
120
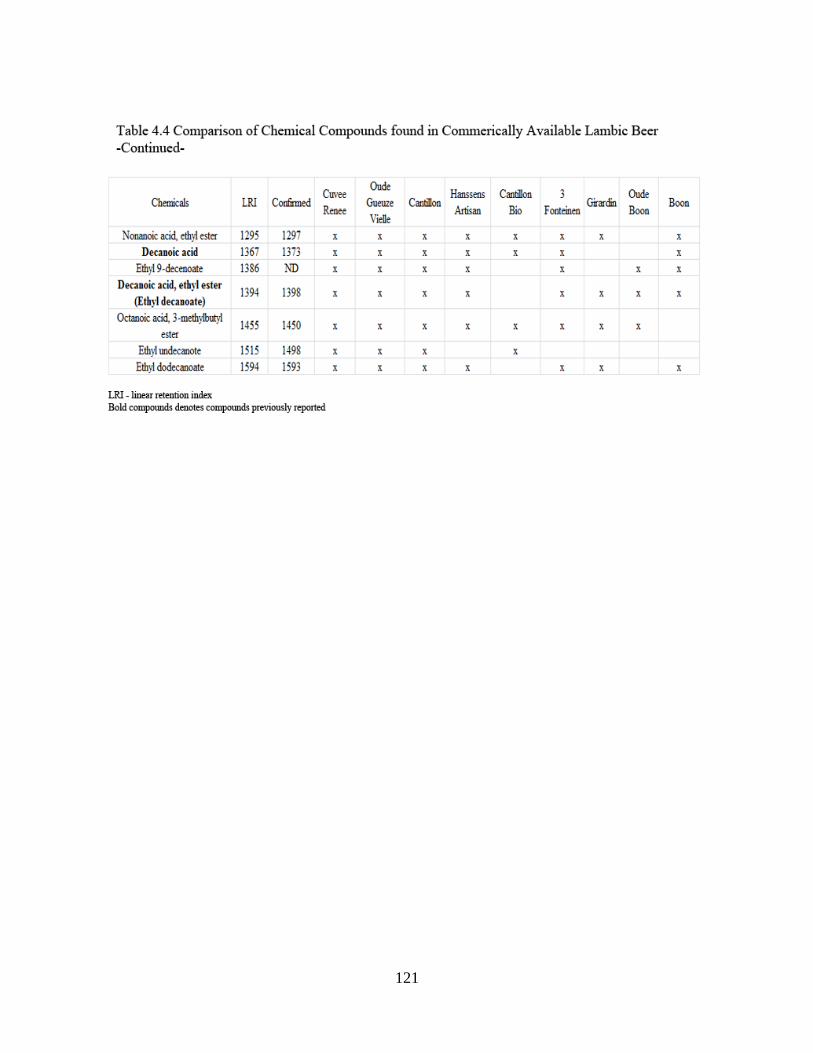
121
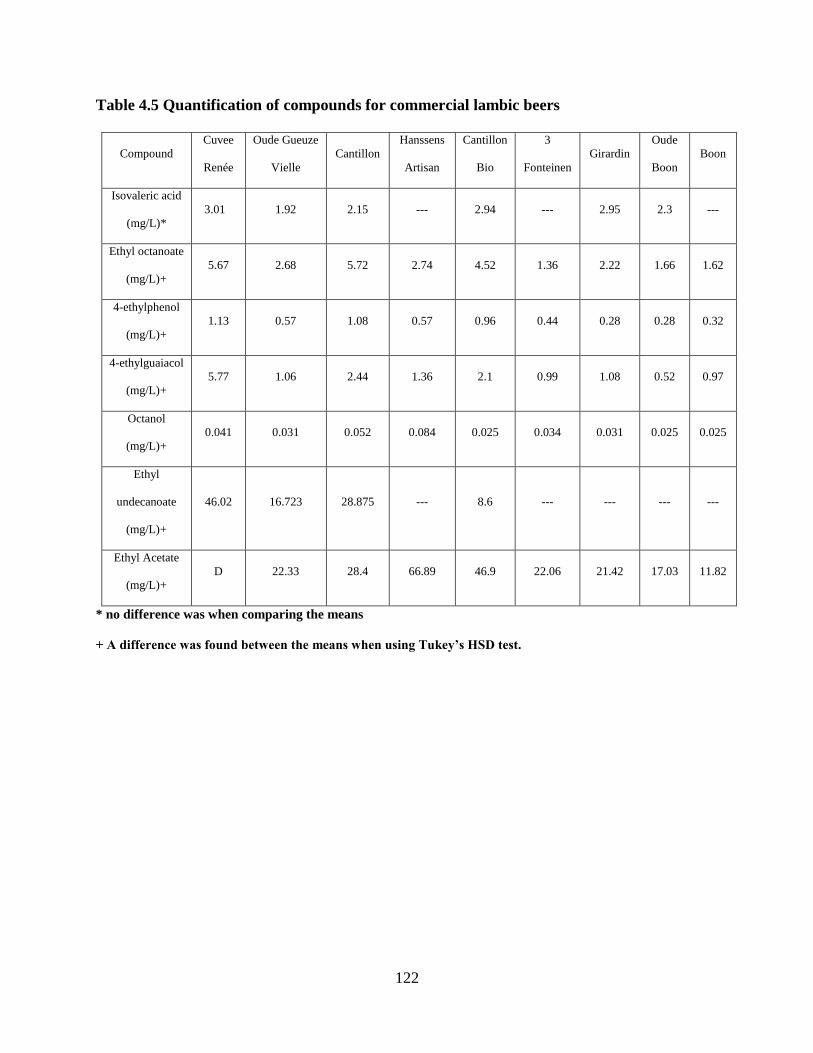
122
Table 4.5 Quantification of compounds for commercial lambic beers
Compound
Cuvee
Renée
Oude Gueuze
Vielle
Cantillon
Hanssens
Artisan
Cantillon
Bio
3
Fonteinen
Girardin
Oude
Boon
Boon
Isovaleric acid
(mg/L)*
3.01 1.92 2.15 --- 2.94 --- 2.95 2.3 ---
Ethyl octanoate
(mg/L)+
5.67 2.68 5.72 2.74 4.52 1.36 2.22 1.66 1.62
4-ethylphenol
(mg/L)+
1.13 0.57 1.08 0.57 0.96 0.44 0.28 0.28 0.32
4-ethylguaiacol
(mg/L)+
5.77 1.06 2.44 1.36 2.1 0.99 1.08 0.52 0.97
Octanol
(mg/L)+
0.041 0.031 0.052 0.084 0.025 0.034 0.031 0.025 0.025
Ethyl
undecanoate
(mg/L)+
46.02 16.723 28.875 --- 8.6 --- --- --- ---
Ethyl Acetate
(mg/L)+
D 22.33 28.4 66.89 46.9 22.06 21.42 17.03 11.82
* no difference was when comparing the means
+ A difference was found between the means when using Tukey’s HSD test.
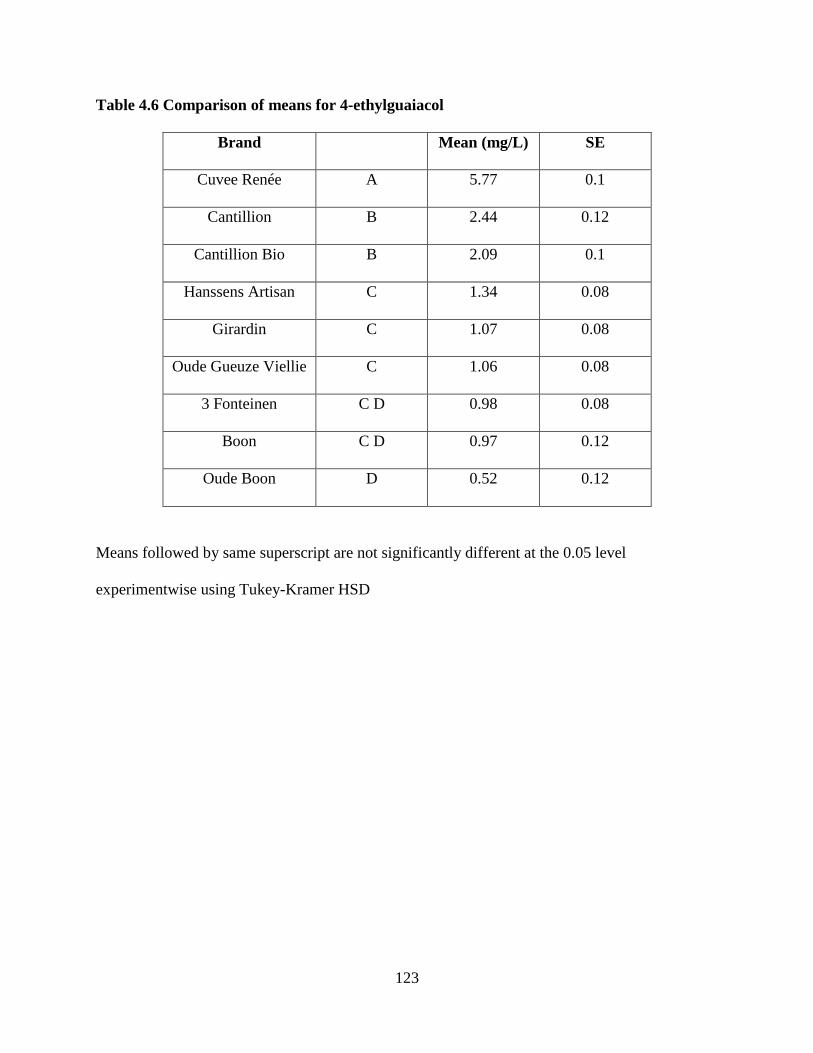
123
Table 4.6 Comparison of means for 4-ethylguaiacol
Brand
Mean (mg/L) SE
Cuvee Renée A 5.77 0.1
Cantillion B 2.44 0.12
Cantillion Bio B 2.09 0.1
Hanssens Artisan C 1.34 0.08
Girardin C 1.07 0.08
Oude Gueuze Viellie C 1.06 0.08
3 Fonteinen C D 0.98 0.08
Boon C D 0.97 0.12
Oude Boon D 0.52 0.12
Means followed by same superscript are not significantly different at the 0.05 level
experimentwise using Tukey-Kramer HSD
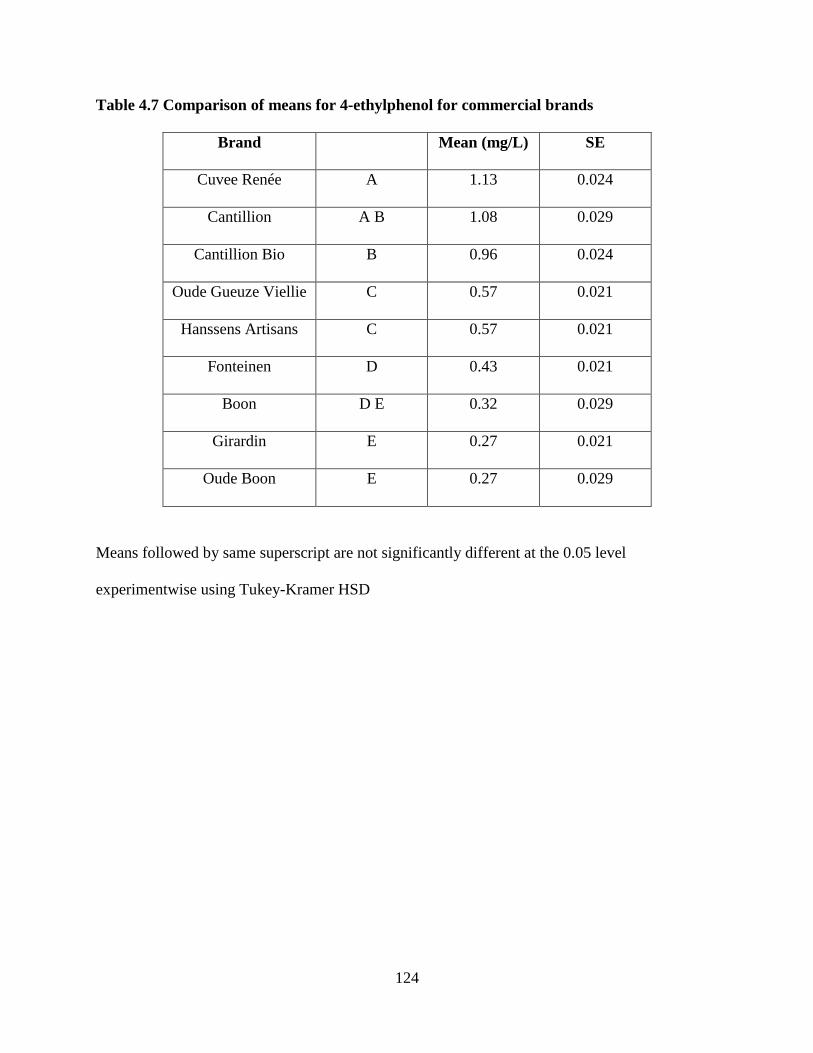
124
Table 4.7 Comparison of means for 4-ethylphenol for commercial brands
Brand
Mean (mg/L) SE
Cuvee Renée A 1.13 0.024
Cantillion A B 1.08 0.029
Cantillion Bio B 0.96 0.024
Oude Gueuze Viellie C 0.57 0.021
Hanssens Artisans C 0.57 0.021
Fonteinen D 0.43 0.021
Boon D E 0.32 0.029
Girardin E 0.27 0.021
Oude Boon E 0.27 0.029
Means followed by same superscript are not significantly different at the 0.05 level
experimentwise using Tukey-Kramer HSD
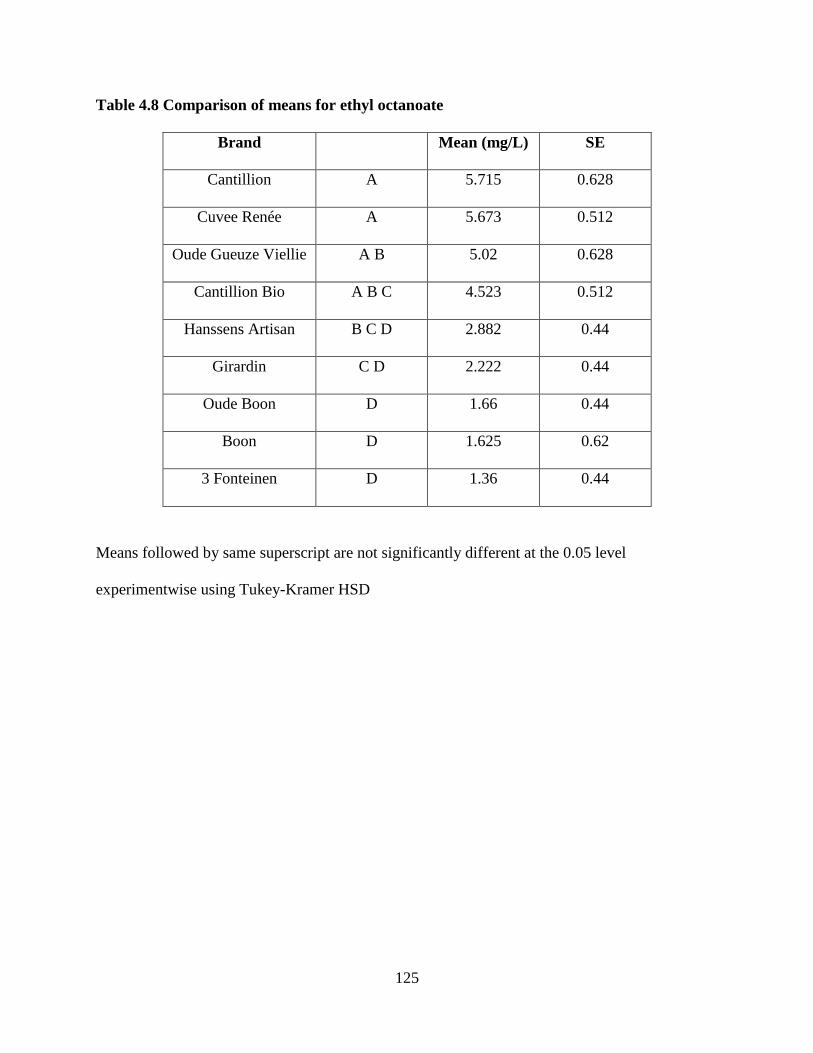
125
Table 4.8 Comparison of means for ethyl octanoate
Brand
Mean (mg/L) SE
Cantillion A 5.715 0.628
Cuvee Renée A 5.673 0.512
Oude Gueuze Viellie A B 5.02 0.628
Cantillion Bio A B C 4.523 0.512
Hanssens Artisan B C D 2.882 0.44
Girardin C D 2.222 0.44
Oude Boon D 1.66 0.44
Boon D 1.625 0.62
3 Fonteinen D 1.36 0.44
Means followed by same superscript are not significantly different at the 0.05 level
experimentwise using Tukey-Kramer HSD
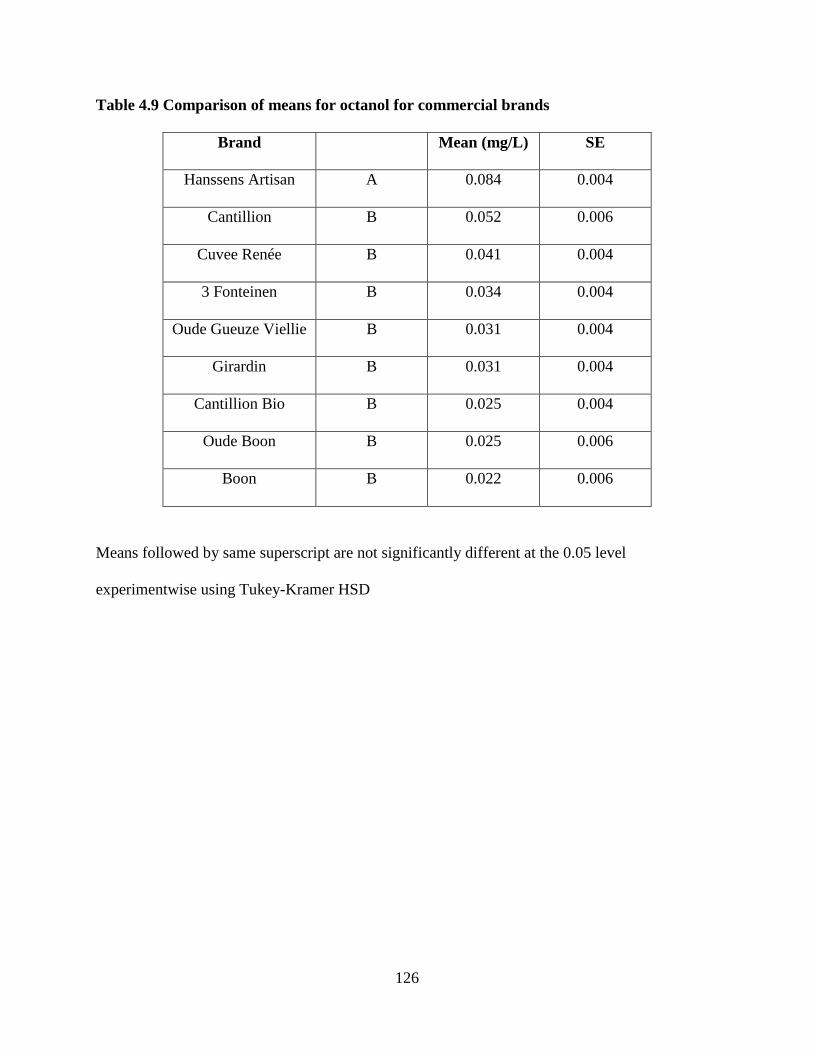
126
Table 4.9 Comparison of means for octanol for commercial brands
Brand
Mean (mg/L) SE
Hanssens Artisan A 0.084 0.004
Cantillion B 0.052 0.006
Cuvee Renée B 0.041 0.004
3 Fonteinen B 0.034 0.004
Oude Gueuze Viellie B 0.031 0.004
Girardin B 0.031 0.004
Cantillion Bio B 0.025 0.004
Oude Boon B 0.025 0.006
Boon B 0.022 0.006
Means followed by same superscript are not significantly different at the 0.05 level
experimentwise using Tukey-Kramer HSD
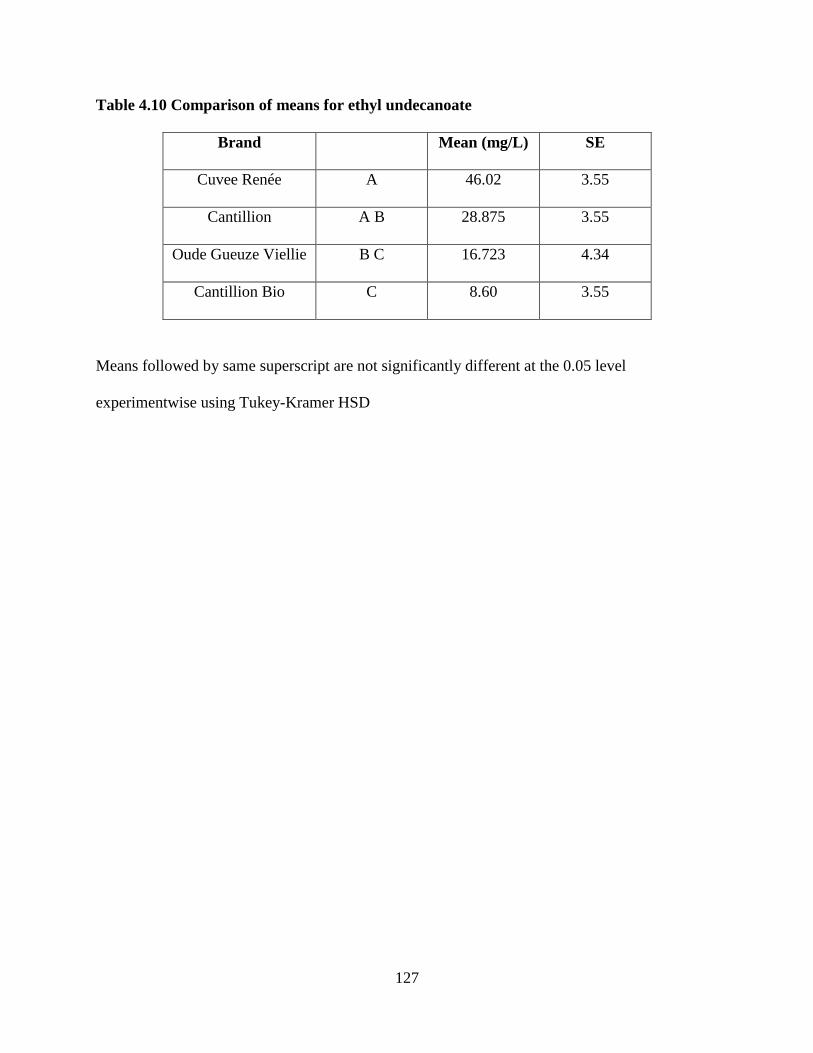
127
Table 4.10 Comparison of means for ethyl undecanoate
Brand
Mean (mg/L) SE
Cuvee Renée A 46.02 3.55
Cantillion A B 28.875 3.55
Oude Gueuze Viellie B C 16.723 4.34
Cantillion Bio C 8.60 3.55
Means followed by same superscript are not significantly different at the 0.05 level
experimentwise using Tukey-Kramer HSD
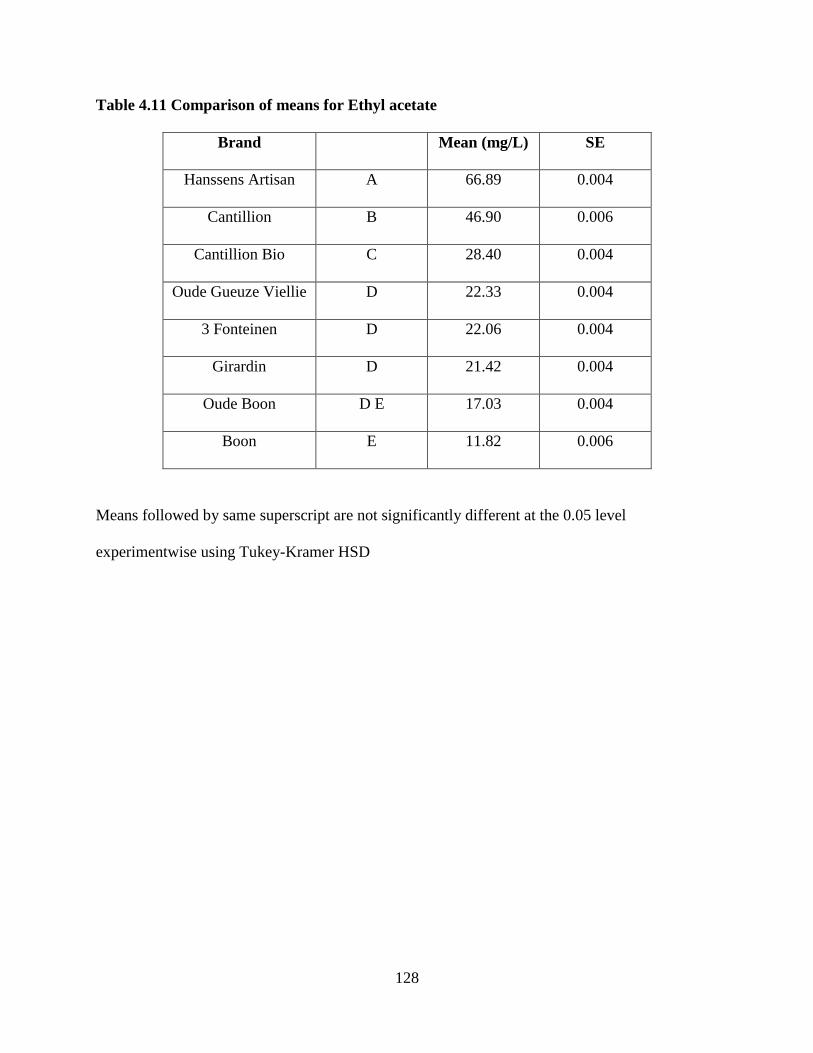
128
Table 4.11 Comparison of means for Ethyl acetate
Brand
Mean (mg/L) SE
Hanssens Artisan A 66.89 0.004
Cantillion B 46.90 0.006
Cantillion Bio C 28.40 0.004
Oude Gueuze Viellie D 22.33 0.004
3 Fonteinen D 22.06 0.004
Girardin D 21.42 0.004
Oude Boon D E 17.03 0.004
Boon E 11.82 0.006
Means followed by same superscript are not significantly different at the 0.05 level
experimentwise using Tukey-Kramer HSD
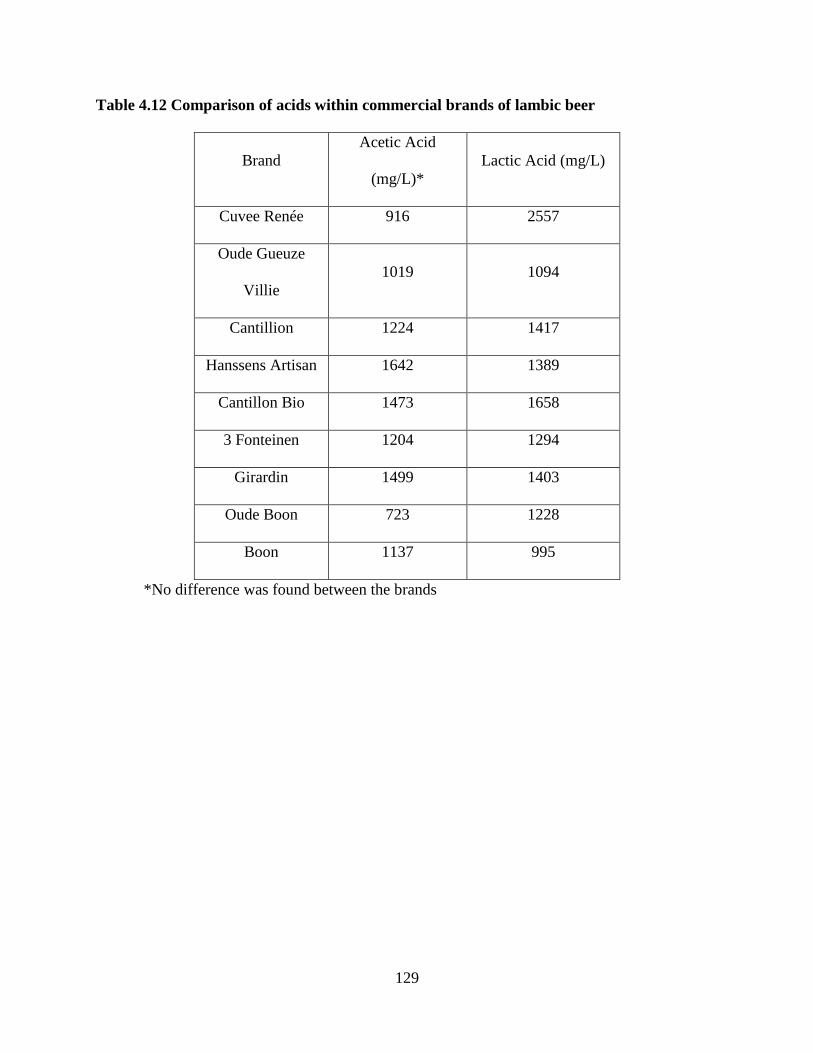
129
Table 4.12 Comparison of acids within commercial brands of lambic beer
Brand
Acetic Acid
(mg/L)*
Lactic Acid (mg/L)
Cuvee Renée 916 2557
Oude Gueuze
Villie
1019 1094
Cantillion 1224 1417
Hanssens Artisan 1642 1389
Cantillon Bio 1473 1658
3 Fonteinen 1204 1294
Girardin 1499 1403
Oude Boon 723 1228
Boon 1137 995
*No difference was found between the brands
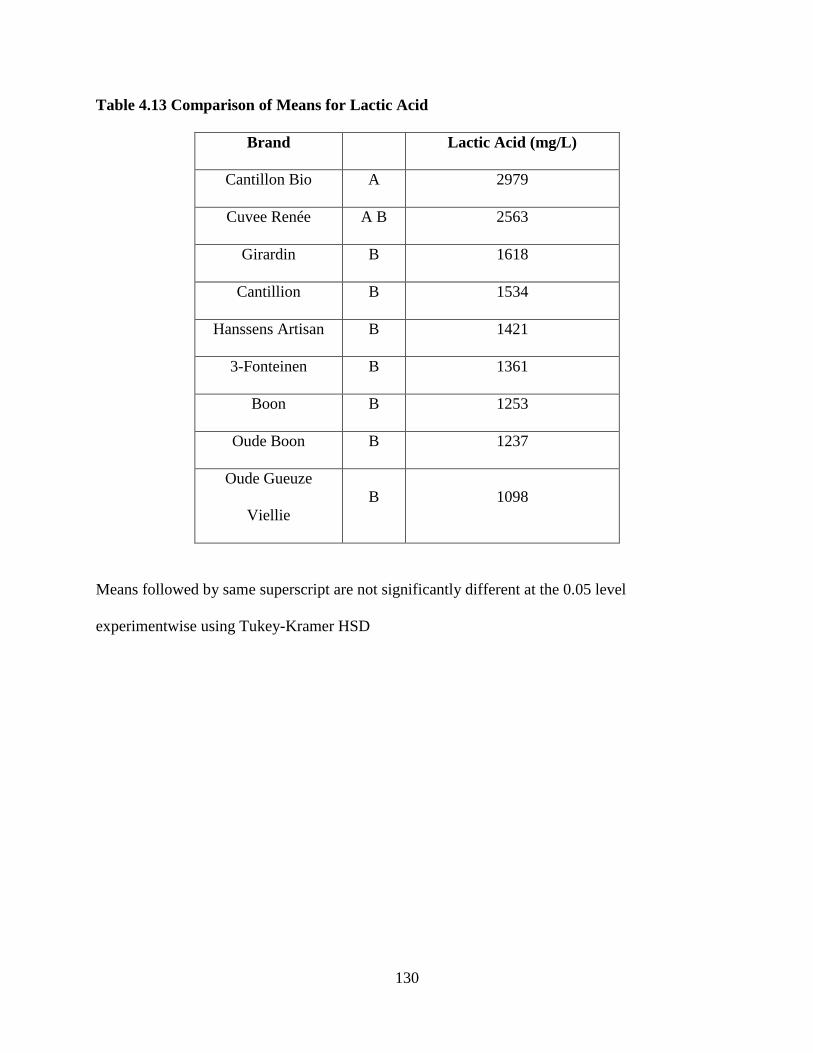
130
Table 4.13 Comparison of Means for Lactic Acid
Brand
Lactic Acid (mg/L)
Cantillon Bio A 2979
Cuvee Renée A B 2563
Girardin B 1618
Cantillion B 1534
Hanssens Artisan B 1421
3-Fonteinen B 1361
Boon B 1253
Oude Boon B 1237
Oude Gueuze
Viellie
B 1098
Means followed by same superscript are not significantly different at the 0.05 level
experimentwise using Tukey-Kramer HSD
131
CHAPTER 5: ANALYSIS OF THE DEVELOPMENT OF FLAVOR AND AROMA
COMPOUNDS OF LAMBIC BEER THROUGHOUT THE FERMENTATION PROCESS
Abstract
Lambic beer is one of the oldest styles of beer still being produced today using
spontaneous fermentation. Gueu e is a style of lambic beer that blends “young” (1 year old) and
aged (2+ years old) beers. Little is known about the development of the volatile and semi-
volatile compounds in lambic beer during aging. SPME with GCMS was used for extraction and
identification of volatile and semi-volatile compounds from 3, 6, 9, 12, and 28-month-old
samples of lambic beer. Compounds were identified using standardized retention time and mass
spectra of standards. GC-O was used to characterize the aroma profiles of the samples. A total of
42 compounds were identified using GC-MS. Seventeen of the 42 compounds identified in the
various aged samples have been previously reported in lambic beer. Ethyl lactate, ethyl acetate,
4-ethylphenol and 4-ethylguaiacol were identified in the 9, 12, and 28 month old samples. These
four compounds have been linked to the microorganism Brettanomyces. Twenty-one aroma
active compounds were identified using GC-O. As the age of the gueuze samples increased, a
larger number of aroma compounds were identified by the panelists; compounds identified
increased from seven for the 3 month old samples to nine for the 6 month old samples, and
eleven for both the nine and twelve month old samples, and seventeen for the twenty eight month
old samples.
132
Introduction
Spontaneous fermentation has been used in the traditional manufacturing of beer, wine
and apple cider. The use of spontaneous fermentation is currently rarely used for beer
manufacture because of the lack of control over the fermentation process; however, lambic beer
is still being produced through spontaneous fermentation. All lambic beers are traditionally
produced within fifteen kilometers of Brussels (1, 2).
The brewing season for lambics begins in September and continues until sometime in
April (3). The tradition is to brew lambic beers during the colder months of the year to prevent
the potential spoiling of the wort during the warmer summer months. The wort is allowed to cool
overnight in open shallow trays and is inoculated by the natural microfloral present in the
surrounding environment. Once the wort has finished cooling overnight, it is pumped into either
metal or wooden casks and stored in non-air-conditioned warehouses. The temperature in these
warehouses can vary from 0°C to 25°C (1, 2).
Lambic beers are unique in that they are still being produced today through spontaneous
fermentation. The fermentation process of lambics can be divided into four distinct stages, with
microorganisms contributing key flavor and aroma compounds within each stage. Klacekera
apiculata (a wild yeast) and enteric bacteria dominate the first stage of fermentation. The
secondary stage of the fermentation process is dominated by Sacchromyces sp. followed by lactic
acid bacteria (LAB) in the third stage. Brettanomyces, also known as bret, is a wild yeast often
associated with the spoilage of red wines and ciders. In lambic beers, bret imparts expected,
positive flavor characteristics and bret dominates the fourth and final stage of fermentation (4).
As noted earlier, the initial stage of fermentation for lambic beer is dominated by enteric
bacteria and the yeast K. apiculata. The actual fermentation process begins three to seven days
133
after the wort has been inoculated. K. apiculata quickly reaches its maximum concentration of
105 cells/mL within the first week of fermentation, but is quickly out-competed by
Saccharomyces. K. apiculata only has the ability to ferment glucose and not maltose or more
complex carbohydrates. Enterobacteriacea and K. apiculata are both fast growing
microorganisms and they cause the pH of the wort to drop from around 5.1 to 4.6. This pH drop
is due to the production of acetic and lactic acids (5).
The second and third stages of fermentation actually overlap one another. The third stage
of fermentation begins three to four months after the beer has been brewed. The third stage is
dominated by lactic and acetic acid bacteria both peaking around six to eight months which
usually correlates with the warmer summer months. Warmer temperatures are essential for the
growth of both lactic and acetic bacteria (5).
The sourness associated with lambic beers can be contributed to the presence of lactic
acid. The majority of the lactic acid present in lambic beer fall within the Pediococcus genus.
While some strains of Pediococcus have been found to be beneficial in beer, others have the
ability to produce a “ropy” surface layer that will leave the beer with a permanent ha iness.
While lactic acid is desirable, acetic acid bacteria are undesirable in this particular style of beer
because acetic acid bacteria have the ability to convert ethanol into acetic acid causing the beer
to become acidic or hard. This only becomes an issue if the casks or barrels being used to store
the beer are damaged or have leaks that allow oxygen to come in contact with the beer.
The fourth and final stage is marked by an increase in the number of yeast cells.
Brettanomyces plays an essential role in the development of the aromatic and flavor profile of
lambic beer. Esters play an important role in the aromatic profile of this particular style of beer
134
which are by-products of this microorganism. The two most influential esters produced are ethyl
lactate and ethyl acetate, which originate from lactic and acetic acids during stage three (5, 6).
Materials and Methods
Sample Acquisition and Storage. Different stages of gueuze beer were obtained from
the brewmaster at Lindemans, a traditional lambic brewery located in Vlezenbeek, near Brussels,
Belgium. Samples collected were 3, 6, 9, 12, and 28 months old. Samples were taken from
corresponding storage tanks within the brewery and placed into 120 mL sampling cups. Samples
were stored in a -3°C refrigerator prior to analysis.
Gas Chromatography Olfactometry. An experienced 3-person (1 female and 2 males)
sensory panel consisting of students at Virginia Tech was used to evaluate the different stages of
fermenting gueuze beer. The panelists were trained in eight, 15 minute sessions before the study
began. Thirteen pure aroma compounds associated with gueuze beer were selected and used to
train the panelists. The aromas selected were: medicinal/barnyard, spice, sweaty, fruity, green,
banana, brandy, banana-pineapple, citrus, vinegar, rancid, cheesy, and pineapple. The panel was
approved by the Virginia Tech Institutional Review Board (IRB #11-364).
Gas Chromatography Olfactometry. Extraction and concentration of the volatile and
semi-volatile compounds were conducted using a solid phase microextraction fiber (SPME). A
divinylbenzene, Carboxen, polydimethylsiloxane (DVB/CAR/PDMS, SKU 57348-U) coated
fiber (Supelco, Bellefonte, PA) was exposed approximately 1 cm above the headspace for 30
minutes at 40°C while a magnetic bar continued to stir the sample. Volatile and semi-volatile
compounds were desorbed in the injector port of the gas chromatograph with olfactometry
detector, which consisted of a HP 5890A GC (Hewlett-Packard Co., Palo Alto, CA) equipped
with a flame ionization detector (FID) and a sniffing port (ODOII; SGE Inc. Austin, TX). The
135
injector temperature was set to 250°C and all injections were made in the splitless mode.
Compounds were separated using a 30m x 0.25-mm i.d. (0.25 µm film thickness) capillary
column (DB-5ms; J&W Scientific, Folson, CA) using helium as the carrier gas with a flow rate
of 1.0 ml.min-1
(linear flow velocity ~ 25 cm/sec). The effluent coming from the column was
split 1:1 between the FID and the sniffing port using deactivated fused silica capillaries (1-m
length x 0.32 µm i.d.). Chromatograms were recorded using a HP 3396A integrator (Hewlett-
Packard Co., Palo Alto, CA).
Three panelists were asked to participate in assessing the odor profiles of lambic beer.
Five milliliters of beer was placed in a 15 mL glass vial fitted with a Teflon-lined cap. The
sample was heated to 40°C using an ‘RTC basic’ heater with an ETS D4 Fuzz Controller (IKA
Werke, Wilmington, NC) while being stirred using a 4 mm stir bar. An SPME fiber (50/30 μm
DVB/CAR/PDMS) on a 2 cm StableFlex fiber (Supelco Bellefonte, PA) was manually inserted
into the vial and exposed for 30 minutes. A DB-5 capillary column (30 m * 0.25 mm id * 0.25
μm film thickness) was used for separating the volatile compounds. The same time and
temperature methodology used for the GC-MS was also utilized here. The effluent coming from
the GC column was split 1:1 ratio between the FID and the sniffing port. Integration was done
using a HP 3396A Integrator (Hewlett-Packard, Palo Alto, CA USA).
Solid Phase Microextraction. Extraction and concentration of volatile compounds found
in commercially available gueuze beer (Cuvée René, Brouwerij Lindemans) was performed by
solid phase microextraction (SPME). A SPME fiber (50/30 um DVM/Carboxen/PDMS, Supelco,
Bellefonte, Pa., U.S.A.) was exposed to the headspace above 4 mL of gueuze beer for 30 minutes
at 40°C with an agitation speed of 250 rpm. Samples were equilibrated for two minutes prior to
exposing the fiber. An AOC-5000 plus autosampler (Shimadzu, Columbia, MD) was used for
136
automation of SPME extractions. Volatile compounds were desorbed for five minutes in the
injection port of a model QP2010 Ultra gas chromatograph - mass spectrometer (Shimadzu,
Columbia, MD). The injection port was set to 250°C and all injections were made in splitless
mode. Volatile compounds were separated on a nonpolar (SHRXI-5MS, Shimadzu, 30m *
0.25mm id * 0.25 μm film thickness) column with He as the carrier gas at a flow rate of 2.0
mL/min (linear velocity of 53.8 cm/sec). The GC oven temperature program was set to 35º C and
held for 5 minutes, and then increased to 225º C at a rate of 6º C/min. Once the final temperature
of 225º C was reached, it was maintained for 10 minutes. The MS was maintained at 200°C and
sample mass was scanned in the range of 40-200 amu. The SPME-GCMS was performed on the
different gueuze samples (3, 6, 9, 12, and 28 month old). Chromatographic peaks were identified
using both standardized retention time (Kovats values) and fragmentation spectra of standards
and the Wiley 2010 library.
Identification of Volatiles. Kovats Retention Index (KI) was used to help identify the
volatile compounds present in the beer samples. A mixture of n-parafins (C5 – C26) ASTM
D2287 Quantitative Calibration Solution in carbon disulfide (Suplico, Bellefonte, PA, USA) was
used in determining the KI values for the volatile compounds eluded by the GC-O. The
databases Flavornet (http://www.flavornet.org/flavornet.html) and Pherobase
(http://www.pherobase.com/) were used to aid in identifying the compounds based upon
standardized retention and aroma.
GCMS was used to aid in the identification of the volatile compounds a Shimadzu GC-
2010 Plus (Shimadzu, Columbia, MD, USA) with a GCMS-QP2010 Ultra mass selective
detector a SHRXI-5MS column composed of 5% phenyl/95% dimethyl polysiloxane (30m x
0.25 mm id x 0.25 µm film thickness) equipped with GCMSsolution.
137
Results and Discussion
SPME GC-MS
The use of SPME as a viable extraction technique for volatile and semi-volatile
compounds for food and alcoholic beverages and has been widely used for a number of years (7-
10). DVB/CAR/PDMS was reported as being able to produce a more complete profile of the
volatile and semi-volatile compounds detected (11).
SPME/GC-MS was used for the extraction of the volatile and semi-volatile compounds
found in the gueuze samples. A total of 42 compounds were identified using a combination of
retention index and mass spectral matching against library standards (Table 5.1). A number of
different chemical groups (ketones, acids, alcohols, aldehydes, thiols, furans, and phenols) were
identified within the samples.
Thirty-one of the 42 compounds identified have not been previously reported in lambic
beer. Eleven compounds identified have been reported by Van Oevelen et al. (1) and Spaepen et
al. (12). The compounds previously reported by Van Oevelen et al. (1) were isoamyl alcohol,
phenethyl alcohol, ethyl acetate, and ethyl lactate. Spaepen and his colleagues (12) reported
finding caproic (hexanoic) acid, caprylic (octanoic) acid, capric (decanoic) acid, ethyl caprylate
(octanoate), ethyl caprate (decanoate), and phenethyl acetate. The identified compounds
belonged to a number of different chemical classes, for example alcohols, acids, esters, and
phenols.
Alcohols are produced as a byproduct of yeast metabolism (13). Of the forty-two
compounds identified, eight were alcohols. Phenethyl alcohol has been previously reported (1) in
lambic beer. The other alcohols 2-methyl-1-butanol (14), 1-hexanol (15), heptyl alcohol (16), 1-
138
octanol (16), 2-nonanol (15), decanol (16), isopentyl alcohol, and nonanol (17) have been
previously reported in beer, but never in lambics or gueuze beers.
The secondary by products produced by the yeast Brettanomyces play a greater role in the
aroma and flavor profile of lambic beer than traditional brewer’s yeast, Saccharomyces. The
main chemical compounds produced by Brettanomyces are the esters, ethyl acetate and ethyl
lactate. Ethyl acetate and ethyl lactate can be formed enzymatically or chemically. Esterase is the
enzyme used in the chemical reaction between ethanol and an organic acid to produce these
esters. Brettanomyces displays a higher esterase activity then other yeasts (Sacchromyces or
Kloeckera) (18).
Brettanomyces has been linked to the synthesis of ethylphenols (4-ethylphenol and 4-
ethylguaiacol) and vinylphenols (19). Bret is currently the only known microorganism linked to
the development of ethylphenols. Some species of lactic acid have been known to produce
ethylphenols in media but not in actual beverage systems (20). Brettanomyces is a key player in
the sensory profile of lambic and gueuze beer (2, 21). The “bretty” character is associated with
number of different aromas and flavors such as mineral, tobacco, barnyard, leather,
pharmaceutical and smoky (18, 22). Compounds produced by Brettanomyces have the ability to
suppress a number of the desirable fruity ester aromas (23). The horsey aroma can vary from
slight to very strong. The strength of the horsey aroma is dependent upon the fermentation
conditions. Tetrahydropyridines are the compounds associated with the horsy smell.
Tetrahydropyridines are produced from ethanol and the amino acid lysine from the wort (5, 24).
GC-O
Gas chromatography-olfactometry was used to compare the volatile profiles of gueuze
beer of different ages (Table 5.2). Compounds that were detected in fifty percent of the GC-O
139
samples at the same retention time with similar aroma descriptors were considered to play a role
in the aroma of different (3, 6, 9, 12, 28 month) samples. Compounds were ranked based upon
their average intensity (very strong, strong, medium, weak, and very weak) perceived by the
three panelists for each compound.
3 Month Old Samples
Eight compounds were identified using GC-O (Table 5.3). The eight compounds
identified fell within three major chemical groups (acids, alcohols, and esters). The three acid
compounds identified were propionic acid, isovaleric acid, and hexanoic acid. Isovaleric acid
was the highest ranking acid identified for the 3 month sample. Isovaleric acid received an odor
intensity ranking of medium. Propanoic and hexanoic acid both received an odor ranking of
weak.
The next major chemical group identified was alcohols. The three compounds identified
were 3-methylbutanol, hexanol, and octanol. Similar to isovaleric acid, hexanol had an odor
intensity ranking of medium. 3-methylbutanol and octanol both received an odor intensity
ranking of weak.
Ethyl isohexanoate and ethyl butyrate were the two ester compounds identified by the
three trained panelists. Ethyl butyrate has been previously reported in lambic beer. While ethyl
isohexanoate has not been previously reported in lambics, it has been reported in other styles of
beer. Ethyl isohexanoate had the highest odor intensity ranking of the two compounds with a
ranking of weak/medium.
6 Month Old Sample
In the six month sample, only nine compounds were identified (Table 5. 4). Only one
more compound was identified in the six month old sample than in the three month old sample.
140
When comparing the two samples, five of the nine compounds identified were also found in the
three month old samples. Propionic acid, isovaleric acid, ethyl butyrate, hexanoic acid, and
octanol were identified in both the three and six month old samples. Unlike the three month old
sample, four chemical groups were identified: alcohols, acids, esters and aldehyde.
The same three acid compounds identified in the six month old sample were found in the
three month old sample. The acids identified were propionic, isovaleric, and hexanoic acid.
Hexanoic acid was not only the highest ranking acid, but one of the highest ranking compounds
overall. Hexanoic acid is described as having a sweaty aroma. The panelists ranked hexanoic
acid in the six month old sample as having an odor intensity ranking of medium, which was
higher in the six month sample then in the three month old sample. Propionic acid received the
same odor intensity ranking of weak for both the three and six month old samples. Isovaleric
acid received a lower ranking in the six month old sample than in the three month old sample.
However, in the three month old sample, isovaleric acid was tied with hexanol for having the
highest odor intensity ranking.
The next major chemical group identified was alcohols. A total of two alcohols were
identified as being odor active. The alcohol compounds identified were 2-methylbutanol and
octanol. 2-methylbutanol was the highest ranking odor active alcohol identified as well as the
highest ranking compound overall. 2-methylbutanol had an odor intensity ranking of strong.
Octanol, the only other alcohol identified, received an odor intensity ranking of very weak. This
is lower than the three month old sample, where the intensity was described as weak.
Three ester compounds play a role in the odor profile of the six month old samples. The
three esters identified were ethyl butyrate, ethyl heptanoate, and ethyl benzoate. Ethyl butyrate
has an aroma that can be described as bread. Ethyl butyrate was tied with hexanoic acid for the
141
second highest odor active compound for all the compounds identified, both of which received
an odor intensity ranking of medium. Ethyl heptanoate was the second highest ranking ester
compound with a ranking of weak. Ethyl benzoate was the lowest ranking ester compound as
well as the lowest ranking compound overall for the six month old sample with an odor intensity
ranking of very weak. Ethyl benzoate is described as having a fruity aroma.
Heptanal was the only aldehyde identified for this sample. Heptanal was one of three
compounds that received an odor intensity ranking of medium. 2-methylbutanol was the only
compound that was ranked higher in overall odor intensity. Heptanal is described as having a
fruity aroma.
Nine Month Old Sample
Eleven compounds were identified for the nine month old sample (Table 5.5). The eleven
compounds identified fell within seven chemical groups: acid, alcohol, vicinal diketone, phenol,
furan, aldehyde and ester. The three strongest odor active compounds came from the acid,
phenol, and aldehyde group and those compounds were isovaleric acid, 4-ethylphenol, and
decanal. These three compounds all received an odor intensity ranking of medium. Isovaleric
acid, hexanoic acid, and octanol were all found in both the nine month and six month old
samples. Similar to the six month old sample, isovaleric acid was one of the highest ranking odor
compounds. The descriptor used to identify the aroma of isovaleric acid is rancid. Hexanol was
found in the three month old sample but not the six month old sample.
Three alcohol compounds were identified to have aroma active properties. The three
alcohol compounds were 3-methylbutanol, hexanol, and octanol. Hexanol and octanol were the
highest ranking odor active alcohols identified with an odor intensity ranking of weak. 3-
methylbutanol had an odor intensity ranking of very weak.
142
Isovaleric acid and hexanoic acid are the two acid compounds identified in this sample.
Isovaleric acid was ranked as one of three compounds with the highest odor activity. Isovaleric
acid had an odor intensity ranking of medium, while hexanoic acid received an odor intensity
ranking of weak. Both isovaleric and hexanoic acid were identified in the 3, 6, and 9 month old
samples.
Two ester compounds were identified in the nine month old sample. Ethyl acetate and
ethyl lactate were the two ester compounds identified by the three trained panelists. Ethyl acetate
was ranked as very weak aroma odor intensity, while ethyl lactate was ranked slightly higher at
weak.
A single compound was identified in phenol, ketone, furan, and aldehyde classes. The
only phenolic compound identified was 4-ethylphenol. 4-ethylphenol was one of the highest
ranking odor active compounds for the nine month old sample with an odor intensity of medium.
Diacetyl is a vicinal diketone described as having a buttery aroma. Diacetyl was ranked as
having a weak odor intensity. Furfural is the only furan compound that exhibited aroma active
for the nine month old sample. Furfural is described as having a bread-like aroma with a weak
odor intensity ranking for this particular sample. Decanal was the only aldehyde identified for
this sample. Decanal is described as having an orange or citrus like aroma. Decanal was one of
three compounds with the highest ranking odor activity for this sample with an odor intensity of
medium.
Twelve Month Old Sample
Eleven compounds were identified for the twelve month old sample (Table 5.6). The
eleven compounds identified can be separated into one of the seven chemical groups identified:
acid, alcohol, vicinal diketone, phenol, furan, aldehyde and ester. The strongest odor active
143
compound was 4-ethylphenol with an odor active ranking of strong. Dimethyl sulfide, a thiol,
was one of four compounds that the panelists ranked as having an odor intensity ranking of
medium. Dimethyl sulfide has an odor descriptor of rotten and sulfury.
Three acid compounds were detected by the panelists and they were propionic, isovaleric,
and hexanoic acid. Hexanoic and isovaleric acid are the only two compounds detected in the
three, six, nine, and twelve month old samples. Propionic and isovaleric acid were both ranked as
having an odor intensity of weak. Hexanoic acid was one of four odor active compounds that had
an odor intensity ranking of medium.
Ethyl butyrate and ethyl heptanoate are the two ester compounds that were identified as
odor active. Ethyl heptanoate is described as having a fruity aroma. The odor active ranking of
ethyl heptanoate was medium. Ethyl butyrate the second ester compound identified by the
panelists had an odor intensity ranking of weak.
Hexanol and 2-methylbutanol were the two alcohol compounds identified in this
particular sample. 2-methylbutanol was the highest ranking alcohol. The odor intensity ranking
for 2-methylbutanol was medium, while hexanol was ranked as very weak.
Diacetyl, a vicinal diketone, was identified in both the nine and twelve month old
samples. Similar to the nine month old sample, both were ranked as having an odor intensity
ranking of weak. Decanal was the only aldehyde identified for this particular sample. Similar to
diacetyl, decanal was ranked as having a weak odor intensity
28 Month Old Sample
Seventeen aroma compounds were identified using GC-O (Table 5.7). The seventeen
aroma compounds identified by the three panelists can be broken down into eight chemical
groups: acid, alcohol, vicinal diketone, phenol, furan, aldehyde, and thiol. The strongest aroma
144
compound identified was 2-methylbutanol followed by 3-methylbutanol. These two compounds
contributed the malty and burnt aroma found in the beer. Both octanol and hexanol are also from
the chemical group alcohol. Octanol received the third highest ranking for the alcohol group.
Octanol had an odor intensity ranking of medium, while hexanol was ranked as weak. Phenethyl
alcohol was the lowest ranking alcohol compound identified. Phenethyl alcohol is used in the
perfume industry for its pleasant sweet and rose like aroma (25).
Isovaleric and hexanoic acid were the two acid compounds identified in the twenty eight
month old sample. Both isovaleric and hexanoic acid were identified in all five samples (3, 6, 9,
12 and 28 month old). Hexanoic acid was one of the highest ranking odor active compounds for
the 28 month old sample. The odor intensity ranking for hexanoic acid was very strong, followed
by isovaleric acid at strong.
Ethyl butyrate, ethyl isohexanoate, ethyl phenyl acetate, ethyl lactate, and ethyl
heptanoate were the five ester compounds identified. Ethyl lactate had an odor intensity ranking
of weak, while ethyl butyrate, ethyl isohexanoate, ethyl phenyl acetate, and ethyl heptanoate
were ranked as very weak.
Dimethyl sulfide (DMS) was the only thiol compound identified. Dimethyl sulfide was
perceived as having an odor intensity ranking of medium. Diacetyl is a vicinal diketone with an
odor intensity ranking of weak. Furural, a furan, was one of the higher ranking odor active
compounds with an odor intensity of medium.
Conclusion
In this study, the volatile and semi-volatile compounds of 3, 6, 9, 12, and 28 month old
gueuze samples were extracted using SPME and analyzed using GC-MS and GC-O. A total of 42
compounds were identified using GC-MS. GC-O was used to analyzed 3, 6, 9, 12, and 28 month
145
samples. Isovaleric acid, hexanoic acid, and propionic acid were identified in the 3, 6, 9, 12, and
28 month samples. As the age of the sample increased, so did the number of compounds detected
by the panelists.
146
Literature Cited
1. Van Oevelen, D.; Delescaille, F.; Verachtert, H., Synthesis of aroma components during
spontaneous fermentation of lambic and gueueze. J. Inst. Brew. 1976, 82, 322-326.
2. Van Oevelen, D.; Spaepen, M.; Timmermans, P.; Verachtert, H., Microbiological
Aspects of spontaneous wort fermentation in production of lambic and gueuze. J. Inst. Brew.
1977, 83, 356-360.
3. Steen, J. v. d., Geuze & kriek : the secret of lambic. Lannoo: Tielt, Belgium, 2011.
4. Rayne S. and Eggers, N., 4-Ethylphenol and 4-Ethylguaiacol concentrations in barreled
red wines from the Okanagan valley Appellation, British Columbia. Am. J. Enol. Vitic. 2008, 59,
92-97.
5. Guinard, J. X., Lambic. Brewers Publications: Boulder, 1990; p 159.
6. De Keersmaecker, J., The mystery of lambic beer. Scientific American 1996, 275, 74.
7. Bonino, M.; Schellino, R.; Rizzi, C.; Aigotti, R.; Delfini, C.; Baiocchi, C., Aroma
compounds of an Italian wine (Ruché) by HS-SPME analysis coupled with GC-ITMS. Food
Chem. 2003, 80, 125-133.
8. Constant, M.; Collier, J., Headspace gas chromatography profiles of fruit-flavored malt
beverages using solid-phase microextraction. J. Am. Soc. Brew. Chem. 1997, 55, 112-118.
9. Charry-Parra, G.; DeJesus-Echevarria, M.; Perez, F. J., Beer Volatile Analysis:
optimization of HS/SPME coupled to GC/MS/FID. Journal of Food Science 2011, 76, C205-
C211.
10. Mo, X. L.; Xu, Y.; Fan, W. L., Characterization of aroma compounds in Chinese rice
wine Qu by solvent-assisted flavor evaporation and headspace solid-phase microextraction.
Journal of Agricultural and Food Chemistry 2010, 58, 2462-2469.
11. Rodrigues, F.; Caldeira, M.; Camara, J. S., Development of a dynamic headspace solid-
phase microextraction procedure coupled to GC-qMSD for evaluation the chemical profile in
alcoholic beverages. Analytica Chimica Acta 2008, 609, 82-104.
12. Spaepen, M.; Vanoevelen, D.; Verachtert, H., Fatty-acids and esters produced during
spontaneous fermentation of lambic and gueuze. J. Inst. Brew. 1978, 84, 278-282.
13. Nykänen, L.; Suomalainen, H., Aroma of beer, wine, and distilled alcoholic beverages.
D. Reidel ; Distributors for the U.S.A. and Canada, Kluwer Boston: Dordrecht, Holland; Boston,
U.S.A.; Hingham, MA, 1983.
14. Strating, J., Venema, A., Gas-chromatographic study of an aroma concentrate from beer.
J. Inst. Brew 1961, 37, 525 - 528.
147
15. Tressl, R. F., L.; Fendesack F.; Koppler H., Gas chromatographic mass spectrometric
investigation of hop aroma constitutents in beer. J. Agric. Food Chem 1978, 26, 1422 - 1426.
16. Drawert, F. a. T., R., Beer aromatics and their origin. Tech. Quart. Master Brewers Ass.
Am. 1972, 9, 72 - 76.
17. Drawert, F. a. T., R., Aromastoffe des Bieres und ihre Entstehung. Brauwissenschaft
1969, 22, 169 - 175.
18. Boulton, R. B., Principles and practices of winemaking. Aspen: Gaithersburg, Md., 1998.
19. Heresztyn, T., Metabolism of volatile phenolic-compounds from hydroxycinnamic acids
by Brettanomyces yeast. Arch. Microbiol. 1986, 146, 96-98.
20. Romano, A.; Perello, M. C.; Lonvaud-Funel, A.; Sicard, G.; de Revel, G., Sensory and
analytical re-evaluation of “Brett character”. Food Chem. 2009, 114, 15-19.
21. Boulton, C.; Quain, D., Brewing yeast and fermentation. Blackwell Science ; Iowa State
University Press [distributor]: Oxford; Malden, MA; Ames, Iowa, 2001.
22. Etievant, P., Wine. In Volatile Compounds in Foods and Beverages, Maarse, H., Ed.
Marcel Dekker: New York, 1991; pp 483 - 546.
23. Gerbaux, V.; Vincent, B., Effects of volatile phenols on sensory quality of red wines
from different cultivars. Revue des Enologues 2001, 99, 15 - 18.
24. Daenen, L.; Sterckx, F.; Delvaux, F. R.; Verachtert, H.; Derdelinckx, G., Evaluation of
the glycoside hydrolase activity of a Brettanomyces strain on glycosides from sour cherry
(Prunus cerasus L.) used in the production of special fruit beers. FEMS Yeast Res. 2008, 8, 1103-
1114.
25. Harmon, A. D., Solid-Phase Microextraction for the Analysis of Flavors. In Techniques
for Analyzing Food Aroma, Marsili, R., Ed. Marcel Dekker: New York, 1997; pp 81-122.
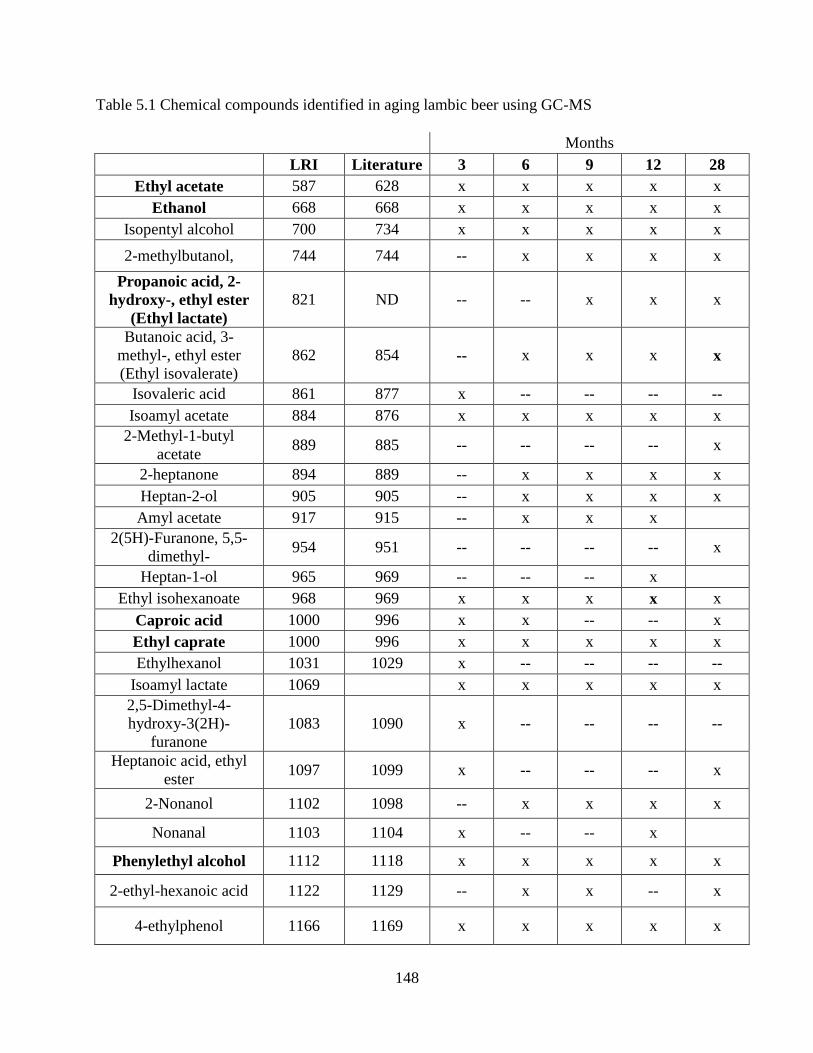
148
Table 5.1 Chemical compounds identified in aging lambic beer using GC-MS
Months
LRI Literature 3 6 9 12 28
Ethyl acetate 587 628 x x x x x
Ethanol 668 668 x x x x x
Isopentyl alcohol 700 734 x x x x x
2-methylbutanol, 744 744 -- x x x x
Propanoic acid, 2-
hydroxy-, ethyl ester
(Ethyl lactate)
821 ND -- -- x x x
Butanoic acid, 3-
methyl-, ethyl ester
(Ethyl isovalerate)
862 854 -- x x x x
Isovaleric acid 861 877 x -- -- -- --
Isoamyl acetate 884 876 x x x x x
2-Methyl-1-butyl
acetate 889 885 -- -- -- -- x
2-heptanone 894 889 -- x x x x
Heptan-2-ol 905 905 -- x x x x
Amyl acetate 917 915 -- x x x
2(5H)-Furanone, 5,5-
dimethyl- 954 951 -- -- -- -- x
Heptan-1-ol 965 969 -- -- -- x
Ethyl isohexanoate 968 969 x x x x x
Caproic acid 1000 996 x x -- -- x
Ethyl caprate 1000 996 x x x x x
Ethylhexanol 1031 1029 x -- -- -- --
Isoamyl lactate 1069
x x x x x
2,5-Dimethyl-4-
hydroxy-3(2H)-
furanone
1083 1090 x -- -- -- --
Heptanoic acid, ethyl
ester 1097 1099 x -- -- -- x
2-Nonanol 1102 1098 -- x x x x
Nonanal 1103 1104 x -- -- x
Phenylethyl alcohol 1112 1118 x x x x x
2-ethyl-hexanoic acid 1122 1129 -- x x -- x
4-ethylphenol 1166 1169 x x x x x
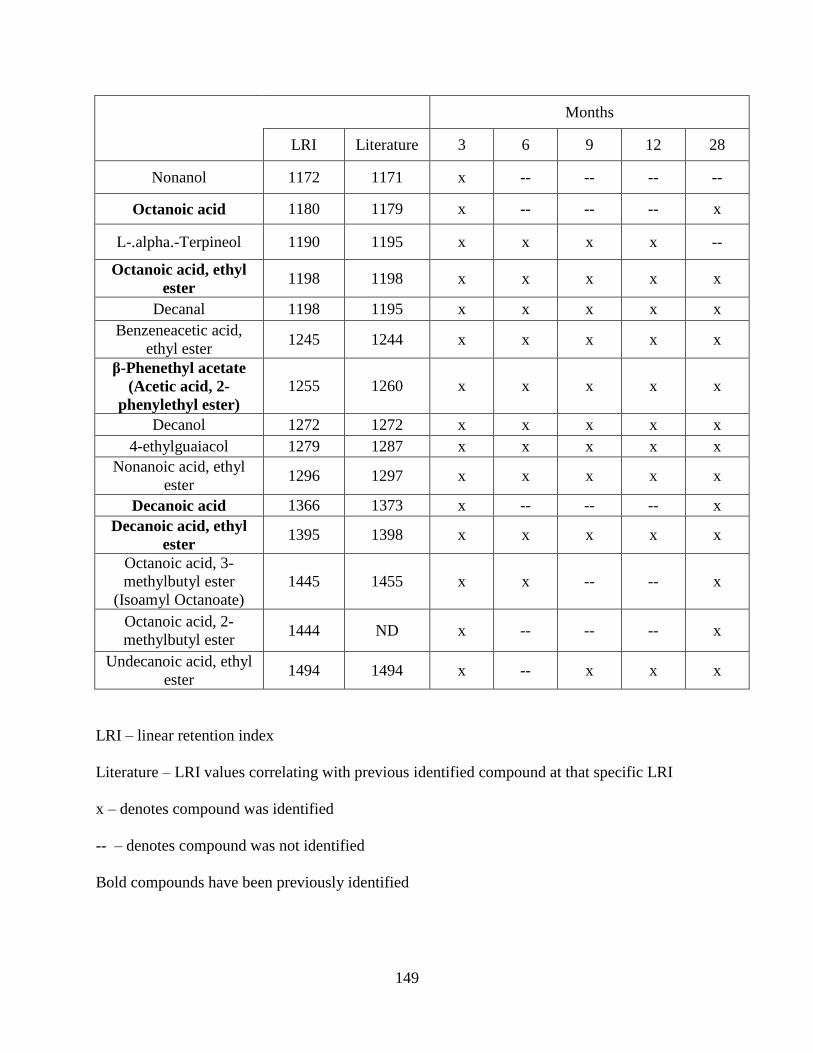
149
Months
LRI Literature 3 6 9 12 28
Nonanol 1172 1171 x -- -- -- --
Octanoic acid 1180 1179 x -- -- -- x
L-.alpha.-Terpineol 1190 1195 x x x x --
Octanoic acid, ethyl
ester 1198 1198 x x x x x
Decanal 1198 1195 x x x x x
Benzeneacetic acid,
ethyl ester 1245 1244 x x x x x
β-Phenethyl acetate
(Acetic acid, 2-
phenylethyl ester)
1255 1260 x x x x x
Decanol 1272 1272 x x x x x
4-ethylguaiacol 1279 1287 x x x x x
Nonanoic acid, ethyl
ester 1296 1297 x x x x x
Decanoic acid 1366 1373 x -- -- -- x
Decanoic acid, ethyl
ester 1395 1398 x x x x x
Octanoic acid, 3-
methylbutyl ester
(Isoamyl Octanoate)
1445 1455 x x -- -- x
Octanoic acid, 2-
methylbutyl ester 1444 ND x -- -- -- x
Undecanoic acid, ethyl
ester 1494 1494 x -- x x x
LRI – linear retention index
Literature – LRI values correlating with previous identified compound at that specific LRI
x – denotes compound was identified
-- – denotes compound was not identified
Bold compounds have been previously identified
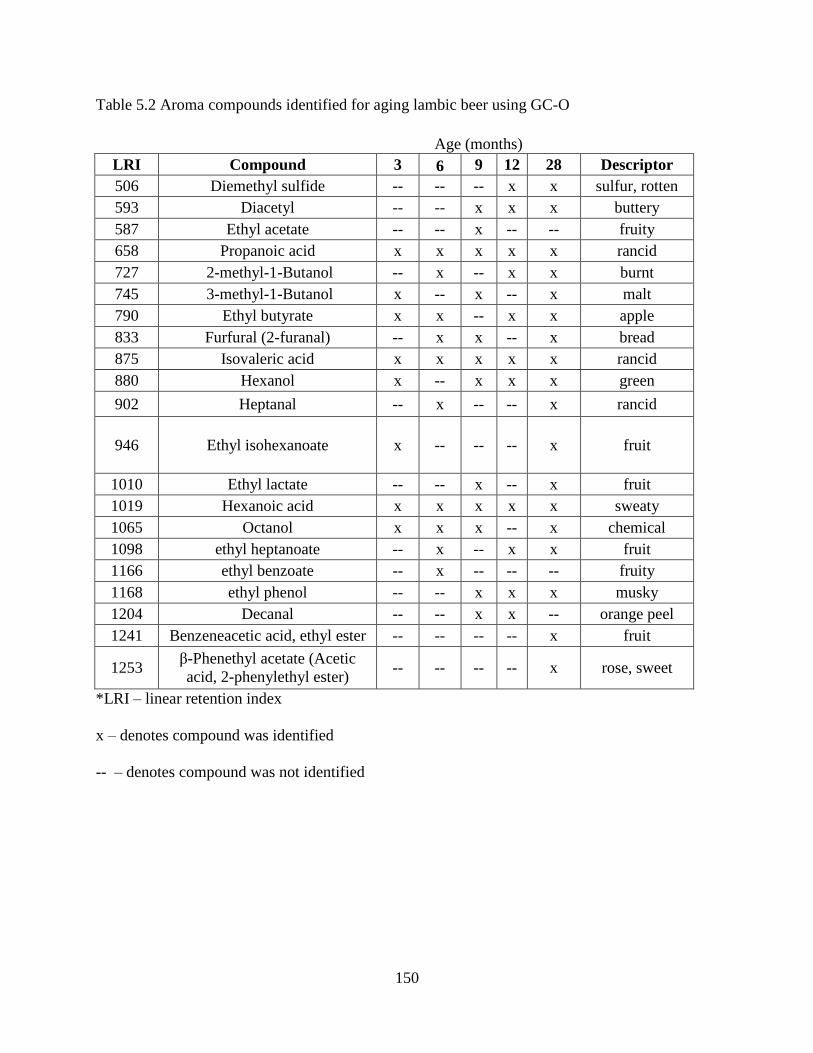
150
Table 5.2 Aroma compounds identified for aging lambic beer using GC-O
Age (months)
LRI Compound 3 6 9 12 28 Descriptor
506 Diemethyl sulfide -- -- -- x x sulfur, rotten
593 Diacetyl -- -- x x x buttery
587 Ethyl acetate -- -- x -- -- fruity
658 Propanoic acid x x x x x rancid
727 2-methyl-1-Butanol -- x -- x x burnt
745 3-methyl-1-Butanol x -- x -- x malt
790 Ethyl butyrate x x -- x x apple
833 Furfural (2-furanal) -- x x -- x bread
875 Isovaleric acid x x x x x rancid
880 Hexanol x -- x x x green
902 Heptanal -- x -- -- x rancid
946 Ethyl isohexanoate x -- -- -- x fruit
1010 Ethyl lactate -- -- x -- x fruit
1019 Hexanoic acid x x x x x sweaty
1065 Octanol x x x -- x chemical
1098 ethyl heptanoate -- x -- x x fruit
1166 ethyl benzoate -- x -- -- -- fruity
1168 ethyl phenol -- -- x x x musky
1204 Decanal -- -- x x -- orange peel
1241 Benzeneacetic acid, ethyl ester -- -- -- -- x fruit
1253 β-Phenethyl acetate (Acetic
acid, 2-phenylethyl ester) -- -- -- -- x rose, sweet
*LRI – linear retention index
x – denotes compound was identified
-- – denotes compound was not identified
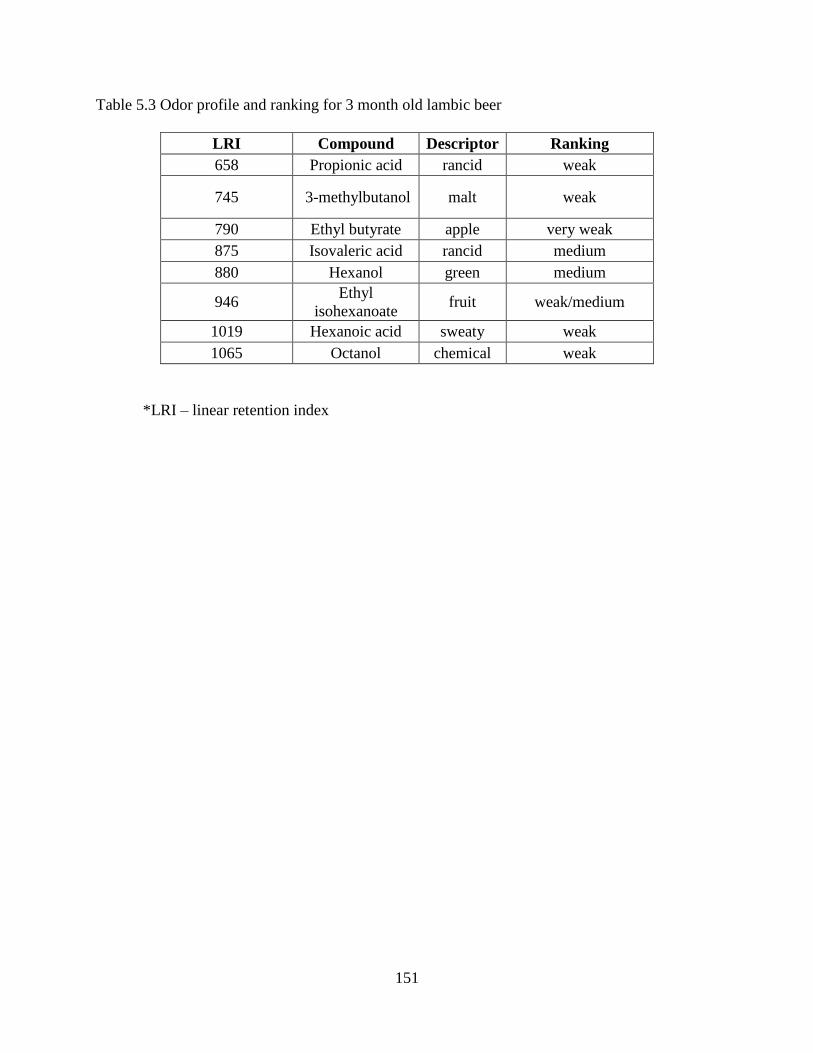
151
Table 5.3 Odor profile and ranking for 3 month old lambic beer
LRI Compound Descriptor Ranking
658 Propionic acid rancid weak
745 3-methylbutanol malt weak
790 Ethyl butyrate apple very weak
875 Isovaleric acid rancid medium
880 Hexanol green medium
946 Ethyl
isohexanoate fruit weak/medium
1019 Hexanoic acid sweaty weak
1065 Octanol chemical weak
*LRI – linear retention index
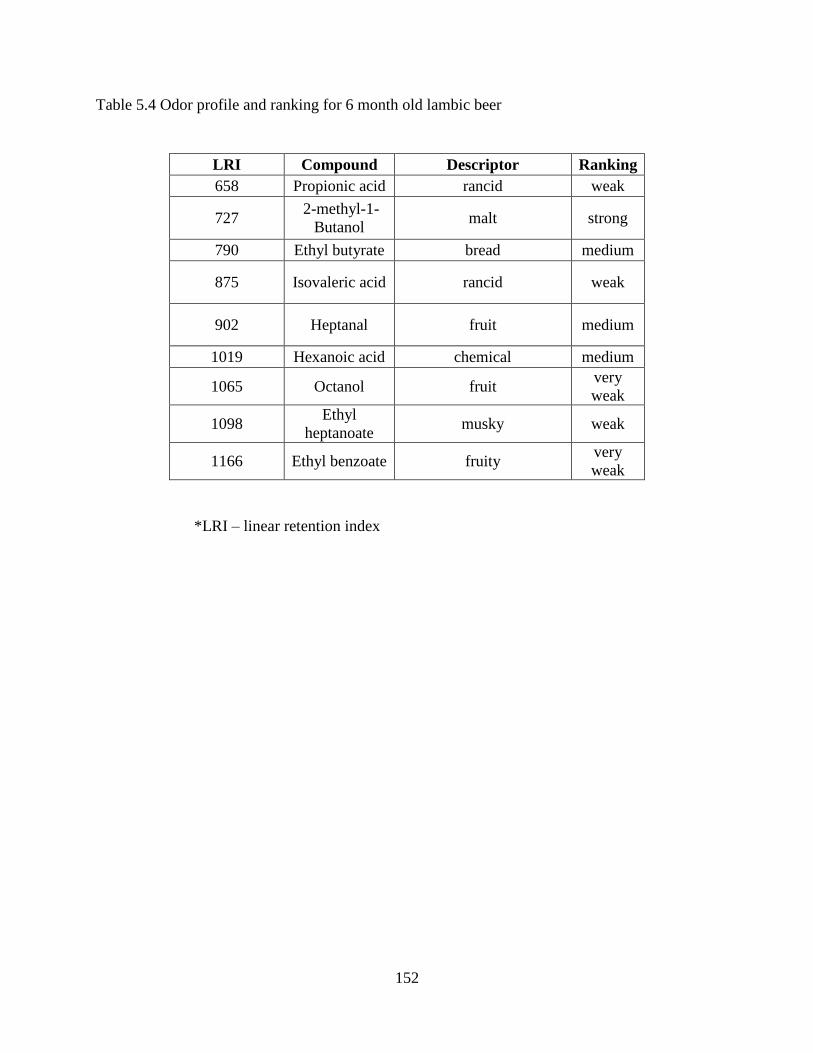
152
Table 5.4 Odor profile and ranking for 6 month old lambic beer
LRI Compound Descriptor Ranking
658 Propionic acid rancid weak
727 2-methyl-1-
Butanol malt strong
790 Ethyl butyrate bread medium
875 Isovaleric acid rancid weak
902 Heptanal fruit medium
1019 Hexanoic acid chemical medium
1065 Octanol fruit very
weak
1098 Ethyl
heptanoate musky weak
1166 Ethyl benzoate fruity very
weak
*LRI – linear retention index
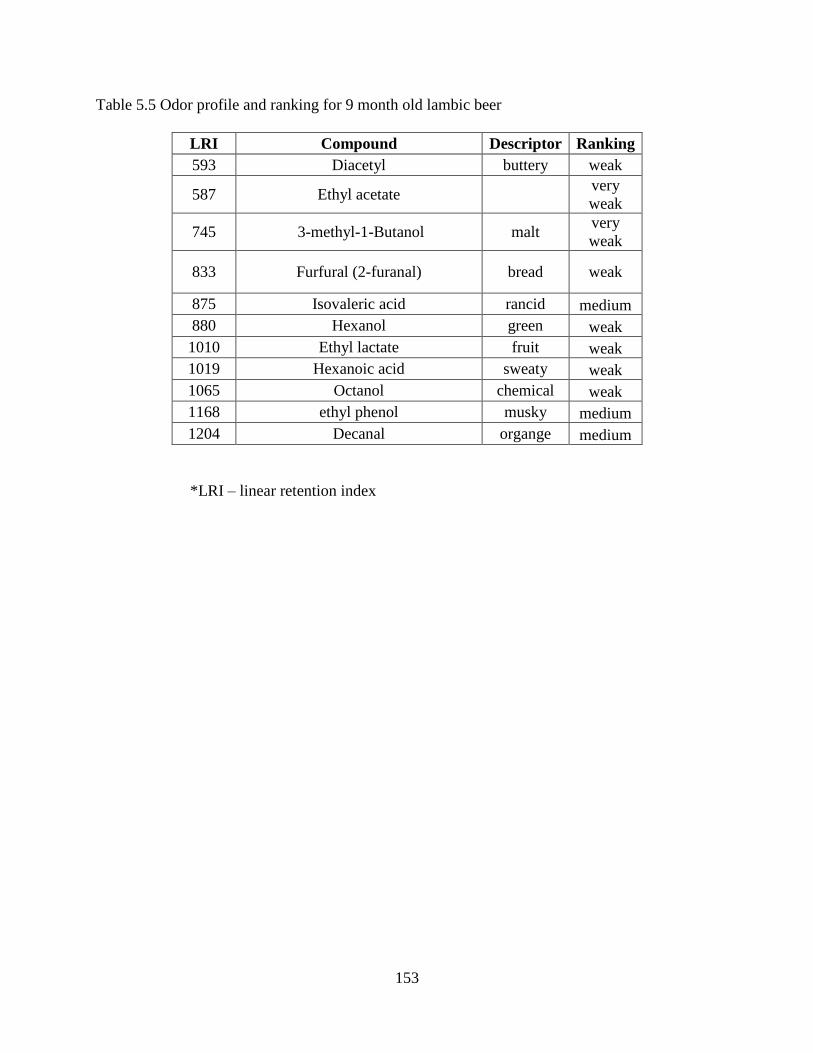
153
Table 5.5 Odor profile and ranking for 9 month old lambic beer
LRI Compound Descriptor Ranking
593 Diacetyl buttery weak
587 Ethyl acetate
very
weak
745 3-methyl-1-Butanol malt very
weak
833 Furfural (2-furanal) bread weak
875 Isovaleric acid rancid medium
880 Hexanol green weak
1010 Ethyl lactate fruit weak
1019 Hexanoic acid sweaty weak
1065 Octanol chemical weak
1168 ethyl phenol musky medium
1204 Decanal organge medium
*LRI – linear retention index
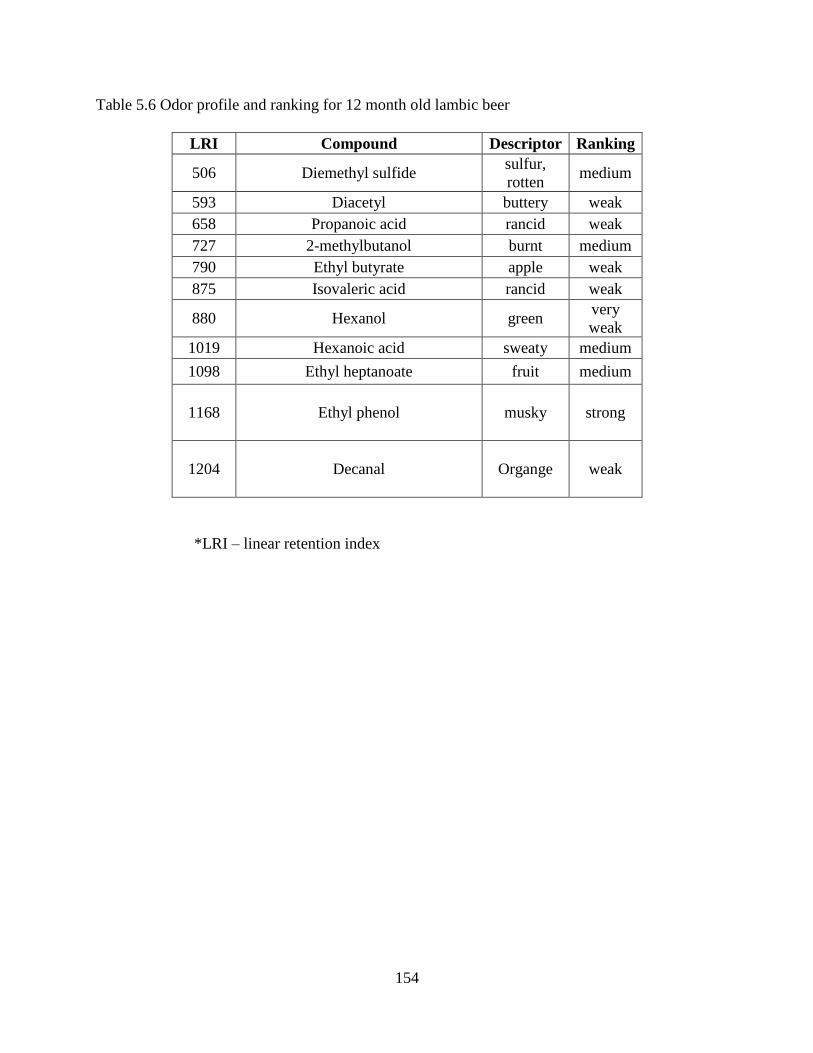
154
Table 5.6 Odor profile and ranking for 12 month old lambic beer
LRI Compound Descriptor Ranking
506 Diemethyl sulfide sulfur,
rotten medium
593 Diacetyl buttery weak
658 Propanoic acid rancid weak
727 2-methylbutanol burnt medium
790 Ethyl butyrate apple weak
875 Isovaleric acid rancid weak
880 Hexanol green very
weak
1019 Hexanoic acid sweaty medium
1098 Ethyl heptanoate fruit medium
1168 Ethyl phenol musky strong
1204 Decanal Organge weak
*LRI – linear retention index
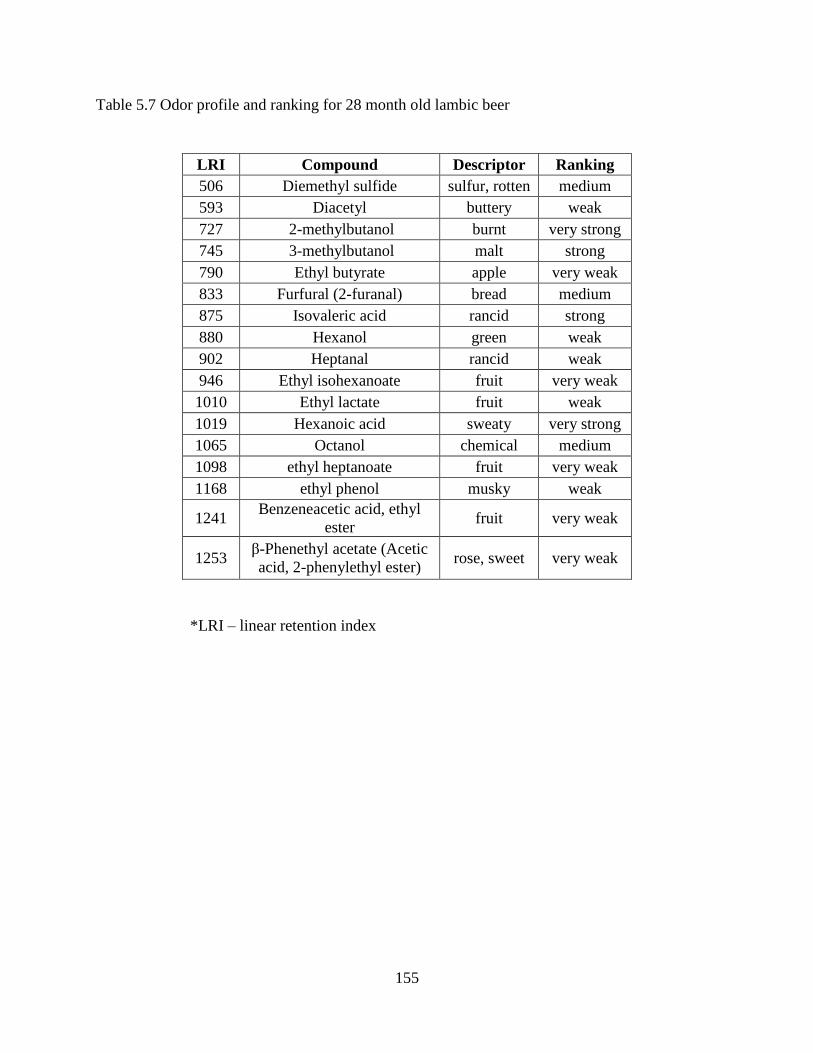
155
Table 5.7 Odor profile and ranking for 28 month old lambic beer
LRI Compound Descriptor Ranking
506 Diemethyl sulfide sulfur, rotten medium
593 Diacetyl buttery weak
727 2-methylbutanol burnt very strong
745 3-methylbutanol malt strong
790 Ethyl butyrate apple very weak
833 Furfural (2-furanal) bread medium
875 Isovaleric acid rancid strong
880 Hexanol green weak
902 Heptanal rancid weak
946 Ethyl isohexanoate fruit very weak
1010 Ethyl lactate fruit weak
1019 Hexanoic acid sweaty very strong
1065 Octanol chemical medium
1098 ethyl heptanoate fruit very weak
1168 ethyl phenol musky weak
1241 Benzeneacetic acid, ethyl
ester fruit very weak
1253 β-Phenethyl acetate (Acetic
acid, 2-phenylethyl ester) rose, sweet very weak
*LRI – linear retention index
156
CHAPTER 6: CONCLUSION
Lambic beer is the only beer still being produced today through spontaneous
fermentation. Prior research pertaining to this particular style of beer focuses mainly on the
development of the microorganisms involved in the fermentation process. Minimal prior research
has been conducted looking at the volatile and semi-volatile compounds present in lambic beers.
SPME and SDE-SAFE are common extraction techniques used in the analysis of volatile and
semi-volatile compounds. A total of 101 compounds were identified using SPME and SDE-
SAFE. Of the 101 compounds, 38 sulfur compounds and 63 compounds made up of other
chemical groups. In comparing the two techniques to each other SPME was able to identify a
greater number of ester compounds, while SDE-SAFE was able to identify a wider range of acid
compounds. OSME and AEDA were used in the analysis of the aroma compounds found in
Cuvee Renée. A total of twenty eight aroma compounds were identified using OSME. AEDA, a
dilution technique was used to identify thirty one aroma compounds.
SPME was selected as a viable extraction technique for the analysis of the volatile and
semi-volatile compounds present in nine commercial lambic beers. This extraction technique was
selected over others because of the ease of use and the ability to use an automatic sampling
system. Fifty compounds were identified using a GC-MS within the nine commercial beer
samples. HPLC was used in the identification and quantification of acetic and lactic acid found
within the commercial brands of lambic beer. The concentration of acetic acid ranged from 723 –
1624 mg/L whiles the concentration of lactic acid 995 – 2557 mg/L. The pH range for the nine
commercial beers was 3.23 – 3.62. Color was also analyzed using a scanning spectrophotometer.
Color was measured using the standard reference method. Color ranged from 6.85 – 10.25 which
correlates to the golden yellow for a younger lambic and a light amber for older gueuzes.
157
Gueuze is a style of lambic beer that is made up of young (1 year old) and aged (2+ years
old) beer. Little is known about the development of the volatile and semi-volatile compounds
during aging. SPME with GC-MS was used for the extraction and identification of volatile and
semi-volatile compounds within 3, 6, 9, 12, and 28-month-old samples. A total of 42 compounds
were identified using GC-MS within the aging samples. Seventeen of the 42 compounds
identified within the aging samples have been previous reported in the literature. GC-O was used
to identify the development of the aroma active compounds over the course of the fermentation
process. A total of twenty one compounds were identified overall, the fewest compounds were
identified in the 3 month with only nine compounds and the greatest number of compounds were
identified for the 28 month old sample.
Lambic brewers are still using the same techniques today to produce this particular style
of beer. Little is known regarding the development of the volatile and semi-volatile compounds
produced during the aging process. The analysis of the commercial brands was able to expand
upon the currently knowledge of the volatile and semi-volatile profile of lambic beer. Prior
research was only able to identify twenty-five compounds, while this research was able to
identify over 50 compounds. By knowing the chemical composition of lambic beer, brewers
would be better able to control the process and obtain the desired aroma and flavor compounds.
Due to the extensive aging process few brewers in the United States are willing to try to mimic
this particular style of beer. Further research is required to analysis the volatile and semi-volatile
compounds during the aging process to gather a greater understand of the development of these
compounds.