Embed Size (px)
Citation preview
Atmos. Chem. Phys., 19, 10883–10900, 2019https://doi.org/10.5194/acp-19-10883-2019© Author(s) 2019. This work is distributed underthe Creative Commons Attribution 4.0 License.
Characterization of aerosol properties at Cyprus, focusing on cloudcondensation nuclei and ice-nucleating particlesXianda Gong1, Heike Wex1, Thomas Müller1, Alfred Wiedensohler1, Kristina Höhler2, Konrad Kandler3, Nan Ma1,Barbara Dietel2, Thea Schiebel2, Ottmar Möhler2, and Frank Stratmann1
1Experimental Aerosol and Cloud Microphysics Department, Leibniz Institute for Tropospheric Research, Leipzig, Germany2Institute for Meteorology and Climate Research – Atmospheric Aerosol Research,Karlsruhe Institute of Technology, Karlsruhe, Germany3Institute for Applied Geosciences, Technical University Darmstadt, Darmstadt, Germany
Correspondence: Xianda Gong ([email protected])
Received: 28 February 2019 – Discussion started: 27 March 2019Revised: 30 July 2019 – Accepted: 31 July 2019 – Published: 29 August 2019
Abstract. As part of the A-LIFE (Absorbing aerosol lay-ers in a changing climate: aging, LIFEtime and dynamics)campaign, ground-based measurements were carried out inPaphos, Cyprus, to characterize the abundance, properties,and sources of aerosol particles in general and cloud con-densation nuclei (CCN) and ice-nucleating particles (INP) inparticular. New particle formation (NPF) events with subse-quent growth of the particles into the CCN size range wereobserved. Aitken mode particles featured κ values of 0.21to 0.29, indicating the presence of organic materials. Accu-mulation mode particles featured a higher hygroscopicity pa-rameter, with a median κ value of 0.57, suggesting the pres-ence of sulfate and maybe sea salt particles mixed with or-ganic carbon. A clear downward trend of κ with increasingsupersaturation and decreasing dcrit was found. Super-micronparticles originated mainly from sea-spray aerosol (SSA) andpartly from mineral dust.
INP concentrations (NINP) were measured in the tem-perature range from −6.5 to −26.5 ◦C, using two freezingarray-type instruments.NINP at a particular temperature spanaround 1 order of magnitude below −20 ◦C and about 2 or-ders of magnitude at warmer temperatures (T >−18 ◦C).Few samples showed elevated concentrations at tempera-tures >−15 ◦C, which suggests a significant contributionof biological particles to the INP population, which possi-bly could originate from Cyprus. Both measured tempera-ture spectra and NINP probability density functions (PDFs)indicate that the observed INP (ice active in the tempera-ture range between −15 and −20 ◦C) mainly originate from
long-range transport. There was no correlation betweenNINPand particle number concentration in the size range> 500 nm(N>500 nm). Parameterizations based onN>500 nm were foundto overestimate NINP by about 1 to 2 orders of magnitude.There was also no correlation between NINP and particlesurface area concentration. The ice active surface site den-sity (ns) for the polluted aerosol encountered in the easternMediterranean in this study is about 1 to 3 orders of magni-tude lower than the ns found for dust aerosol particles in pre-vious studies. This suggests that observed NINP PDFs suchas those derived here could be a better choice for modelingNINP if the aerosol particle composition is unknown or un-certain.
1 Introduction
The Mediterranean region is one of the hotspot areas of theglobe being severely threatened by climate change (Giorgiand Lionello, 2008), with the direct and indirect effects ofaerosol particles therein still remaining unclear. The Mediter-ranean region is rich in a variety of aerosols (fuel combus-tion, biomass burning, secondary biogenic, sea spray, andmineral dust aerosols) from both continental and marinesources (Chester et al., 1993; Piazzola and Despiau, 1997;Lelieveld et al., 2002). The sensitivity of this region, togetherwith the large number of influencing factors, makes it a dif-ficult task to understand all ongoing processes and their in-terconnections. This, however, is needed in order to better
Published by Copernicus Publications on behalf of the European Geosciences Union.
10884 X. Gong et al.: Cloud condensation nuclei and ice-nucleating particles in the eastern Mediterranean
be able to protect the region or mitigate upcoming changes.Our goal in this framework is to better understand the variedaerosol that occurs in this region. In the next paragraphs, wewill start by giving an overview of what is known about theMediterranean aerosol.
Regarding anthropogenic sources of aerosol particles,Sciare et al. (2003) found that the major contributions inthe eastern Mediterranean were from Turkey and central Eu-rope. Central Europe was identified as the major source ofblack carbon over the eastern Mediterranean. In the Po Val-ley, which is in the western Mediterranean, but which westill consider here, due to the comparable climatic condi-tions, Sandrini et al. (2016) found that particles in the sizerange from 50 to 140 nm were mainly from traffic emis-sions. The photochemical oxidation of inorganic and organicgaseous precursors was identified as the important mecha-nism of secondary aerosol formation, which caused the accu-mulation mode (420–1200 nm) aerosol particles to be consti-tuted mainly of ammonium nitrate, organic carbon, and sul-fate. Bougiatioti et al. (2013) found that organic carbon andelement carbon concentrations made up 2/3 of the PM1, withorganic carbon being mostly secondary and therefore highlyoxidized and water-soluble to a great extent.
Biomass burning is another important anthropogenicaerosol source over the Mediterranean, and it was mainly ob-served in the driest months of the year, July and August (Paceet al., 2005). Long-term observations of absorbing aerosolparticles have clearly shown that they originated from agri-culture waste burning (post-harvest wheat residual) in thecountries surrounding the Black Sea (Sciare et al., 2008).Bougiatioti et al. (2016) examined in the eastern Mediter-ranean potential cloud condensation nuclei (CCN) and hy-groscopicity properties and found that an increased organiccontent in the aerosol particles decreased the values of thehygroscopicity parameter κ for all particle sizes. Further-more, they observed CCN concentrations (NCCN) to be en-hanced by a factor from 1.6 to 2.5 during biomass burningplumes compared to background conditions.
Natural aerosol particles such as mineral dust and sea saltare however the major contributing factors to particle massin the Mediterranean (Rodríguez et al., 2002). Mineral dustparticles from the Sahara Desert were regularly observedat different locations across the Mediterranean. A record-breaking dust storm originating from desert regions in north-ern Syria and Iraq occurred over the eastern Mediterraneanin September 2015. The PM10 concentrations were close to8000 µgm−3 and the observed meteorological optical range(MOR) was reduced to 300–750 m (Mamouri et al., 2016).By using the Weather Research and Forecasting model in aSahara outflow region, Smoydzin et al. (2012) found that thepresence of mineral dust can enhance the CCN concentrationand formation of ice crystals.
Sea-spray aerosols (SSA) are another main natural aerosoltype observed in the Mediterranean. Claeys et al. (2017)found that primary marine aerosols mass concentration
reached up to 6.5 µgm−3, representing more than 40 % of thetotal PM10 mass in the western Mediterranean. Salameh et al.(2007) reported AOD around 0.15–0.20 (at 865 nm) within aSSA plume during strong wind events with wind speeds upto 18 ms−1.
Clouds in the atmosphere form when water vapor con-denses on aerosol particles that serve as CCN. Clouds inthe atmosphere glaciate at temperatures above −38 ◦C ifdroplet freezing is initiated by aerosol particles called ice-nucleating particles (INP) or at temperatures below −38 ◦C,also through homogeneous freezing (without INP) (Prup-pacher and Klett, 2010). Therefore, a change in atmosphericaerosol particles, especially CCN and INP, is bound to im-pact cloud properties, precipitation, and cloud radiative ef-fects (Fan et al., 2016). Even though clouds are omnipresentin the Earth’s atmosphere, and play an important role in reg-ulating the radiative budget of the planet, the response ofclouds to climate change remains highly uncertain, in partic-ular with regard to aerosol–cloud interactions and feedbackmechanisms.
In situ observations of CCN on Crete were reported byKalivitis et al. (2015), highlighting new particle formation(NPF) as a source of CCN. At Finokalia, Crete, Bougiati-oti et al. (2011) found that air masses originating from cen-tral eastern Europe tend to be associated with higher NCCN,and slightly lower hygroscopicity (κ = 0.18), than other airmasses.
Rarely have measurements of INP been carried out in theMediterranean. Excluding situations characterized by high-altitude transport of dust plumes, Rinaldi et al. (2017) foundthat at a measurement station in the Po Valley basin, INPnumber concentration (NINP) was roughly double that ofwhat they observed at the top of an Apennine mountain.Schrod et al. (2017) found that mineral dust, or a constituentrelated to dust, was a major contributor to INP on Cyprus.However, due to Sahara dust plumes travelling at severalkilometers in altitude, NINP at higher altitudes were 10 timeshigher than at ground level (height ∼ 700 m).
As outlined above, the aerosol in the Mediterranean re-gion represents a complex mixture of primary and sec-ondary aerosol particles from both natural and anthro-pogenic sources, with these sources being non-uniformly dis-tributed across the greater Mediterranean region. Most re-gional and global climate simulations have investigated im-pacts of global warming on the Mediterranean climate with-out detailed considerations of possible radiative influencesand climatic feedback from different types of Mediterraneanaerosols (Mallet et al., 2016). Besides, to the best of ourknowledge, seldom have studies paid attention to the CCNand INP simultaneously, which both have an effect on cli-mate. The aim of this study is to provide a quantitative un-derstanding concerning the abundance, properties and sourceof CCN and INP in the eastern Mediterranean.
Atmos. Chem. Phys., 19, 10883–10900, 2019 www.atmos-chem-phys.net/19/10883/2019/
X. Gong et al.: Cloud condensation nuclei and ice-nucleating particles in the eastern Mediterranean 10885
2 Experiment
2.1 Sampling site and campaign setup
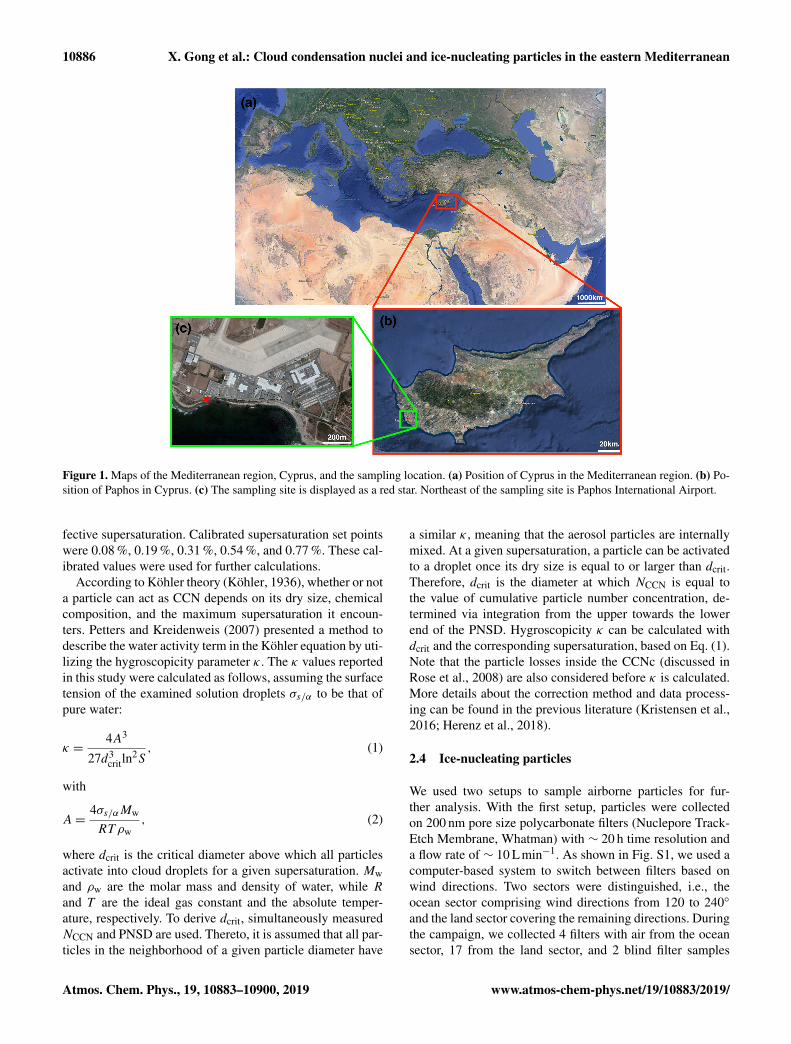
Measurements were performed from 2 to 30 April 2017,on the island of Cyprus, as part of the A-LIFE (Absorb-ing aerosol layers in a changing climate: aging, LIFEtimeand dynamics) project, which had the purpose of investi-gating properties of absorbing aerosols during their atmo-spheric lifetime, and their distribution throughout the tro-pospheric column. Cyprus, an island located in the east-ern Mediterranean region, is approximately 100 km south ofthe Turkish mainland, 100 km west of the Syrian coast, and300 km north of the Egyptian coast. This geographical lo-cation makes Cyprus an unique spot in the eastern Mediter-ranean Sea, where different and complex aerosol mixturesoccur. On the one hand, the Sahara Desert in the southwest,and the desert of the Arabian Peninsula in the southeast favora regular occurrence of mineral-dust-rich air masses. One theother hand, Cyprus is influenced by anthropogenic emissionsfrom southeastern Europe, as well as the Middle East, and, ofcourse, local pollution. This exposure to diverse air massesmakes Cyprus an ideal place for investigating the abundanceand properties of climate relevant aerosol particles in gen-eral, and CCN and INP in particular. As shown in Fig. 1, themeasurement site was located in Paphos, Cyprus (34◦43′ N,32◦29′ E). The measurements took place at the side of a fairlycalm coastal highway, facing the Mediterranean Sea. On thenortheastern side of the measurement site, 1 km away, is Pa-phos International Airport.
The instrumental setup used for these investigations isshown in Fig. S1 in the Supplement. An aerosol PM10 inlet,employed to remove particles larger than 10 µm in aerody-namic diameter, was installed on top of a measurement con-tainer. Downstream of the PM10 inlet, a vertical tube (innerdiameter of 1.65 cm) and a diffusion dryer (130 cm) were ar-ranged before the aerosol was led into the measurement con-tainer. The diffusion dryer was installed vertically to avoidgravitational losses of larger particles. Downstream of thedryer and inside the container, the sampled aerosol was splitto supply the aerosol to various instruments, measuring parti-cle number size distribution (PNSD), number concentration,as well as hygroscopic and optical (not discussed in this pa-per) properties.
For the measurement of NINP, two different filter-basedsampling systems were utilized. For one set of samples, to-tal suspended particles were collected with a flow rate of∼ 10 Lmin−1. For a second set of samples, a separate PM10inlet was used as the inlet, and an air flow of ∼ 15 Lmin−1
was sampled onto the filters. No dryer was arranged in thefilter sampling system.
The CCN hygroscopicity was derived from NCCN com-bined with the PNSD. INP freezing behavior and NINP weredetermined by filter sampling and off-line analysis usingfreezing array-type instruments. In the following, we will
briefly introduce the different measurement techniques ap-plied in this study, including calibrations, measurements, anddata processing.
And lastly, to get additional information on the presenceof super-micron particles, depositing aerosol particles werecollected at ambient conditions outside of the measurementcontainer.
2.2 Particle number size distribution
PNSDs were measured in the size range from 10 nm to 10 µmusing a TROPOS-type MPSS (Mobility Particle Size Spec-trometer) (Wiedensohler et al., 2012), and an APS (Aerody-namic Particle Sizer, model 3321, TSI Inc., St. Paul, MN,USA). For the multiple charge correction (Wiedensohler,1988) of the MPSS data, the APS data were accountedfor in the inversion of the measured PNSD (Pfeifer et al.,2016). The combined PNSD is then given on the basis of thevolume-equivalent particle diameter, where a dynamic shapefactor of 1.17 was used for particles> 1 µm, based on Schla-ditz et al. (2011). More details about the combined MPSSand APS PNSD can be found in Schladitz et al. (2011). Size-dependent particle losses due to diffusion, deposition, andsedimentation within the inlet were corrected for utilizingthe empirical particle loss calculator (von der Weiden et al.,2009), as shown in Fig. S2. Total particle number concen-trations (Ntotal) were calculated from the measured PNSDsand the size-dependent particle losses. The calibration of theMPSS before, during, and after the intensive field study wasdone following the recommendations given in Wiedensohleret al. (2018).
2.3 Cloud condensation nuclei
NCCN was measured using a Cloud Condensation Nucleicounter (CCNc, Droplet Measurement Technologies (DMT),Boulder, USA). The CCNc is a cylindrical continuous-flowthermal-gradient diffusion chamber, establishing a constantstreamwise temperature gradient to adjust a quasi-constantcenterline supersaturation. The sampled aerosol particles areguided within a sheath flow through this chamber and canbecome activated into droplets, depending on the supersatu-ration and the particles’ ability to act as CCN. The details ofthe CCNc are described in Roberts and Nenes (2005).
During our study, the supersaturation was varied from∼ 0.08 % to ∼ 0.77 % at a constant total flow rate of0.5 Lmin−1. To ensure stable column temperatures, the first5 min and the last 30 s of the 12 min long measurement ateach supersaturation were excluded from the data analysis.The remaining data points were averaged. A supersaturationcalibration (following the protocol by Gysel and Stratmann,2013) was done at the cloud laboratory of the Leibniz Insti-tute for Tropospheric Research (TROPOS) prior to and afterthe measurement campaign to determine the relationship be-tween the temperature gradient along the column and the ef-
www.atmos-chem-phys.net/19/10883/2019/ Atmos. Chem. Phys., 19, 10883–10900, 2019
10886 X. Gong et al.: Cloud condensation nuclei and ice-nucleating particles in the eastern Mediterranean
Figure 1. Maps of the Mediterranean region, Cyprus, and the sampling location. (a) Position of Cyprus in the Mediterranean region. (b) Po-sition of Paphos in Cyprus. (c) The sampling site is displayed as a red star. Northeast of the sampling site is Paphos International Airport.
fective supersaturation. Calibrated supersaturation set pointswere 0.08 %, 0.19 %, 0.31 %, 0.54 %, and 0.77 %. These cal-ibrated values were used for further calculations.
According to Köhler theory (Köhler, 1936), whether or nota particle can act as CCN depends on its dry size, chemicalcomposition, and the maximum supersaturation it encoun-ters. Petters and Kreidenweis (2007) presented a method todescribe the water activity term in the Köhler equation by uti-lizing the hygroscopicity parameter κ . The κ values reportedin this study were calculated as follows, assuming the surfacetension of the examined solution droplets σs/α to be that ofpure water:
κ =4A3
27d3critln
2S, (1)
with
A=4σs/αMw
RT ρw, (2)
where dcrit is the critical diameter above which all particlesactivate into cloud droplets for a given supersaturation. Mwand ρw are the molar mass and density of water, while Rand T are the ideal gas constant and the absolute temper-ature, respectively. To derive dcrit, simultaneously measuredNCCN and PNSD are used. Thereto, it is assumed that all par-ticles in the neighborhood of a given particle diameter have
a similar κ , meaning that the aerosol particles are internallymixed. At a given supersaturation, a particle can be activatedto a droplet once its dry size is equal to or larger than dcrit.Therefore, dcrit is the diameter at which NCCN is equal tothe value of cumulative particle number concentration, de-termined via integration from the upper towards the lowerend of the PNSD. Hygroscopicity κ can be calculated withdcrit and the corresponding supersaturation, based on Eq. (1).Note that the particle losses inside the CCNc (discussed inRose et al., 2008) are also considered before κ is calculated.More details about the correction method and data process-ing can be found in the previous literature (Kristensen et al.,2016; Herenz et al., 2018).
2.4 Ice-nucleating particles
We used two setups to sample airborne particles for fur-ther analysis. With the first setup, particles were collectedon 200 nm pore size polycarbonate filters (Nuclepore Track-Etch Membrane, Whatman) with ∼ 20 h time resolution anda flow rate of ∼ 10 Lmin−1. As shown in Fig. S1, we used acomputer-based system to switch between filters based onwind directions. Two sectors were distinguished, i.e., theocean sector comprising wind directions from 120 to 240◦
and the land sector covering the remaining directions. Duringthe campaign, we collected 4 filters with air from the oceansector, 17 from the land sector, and 2 blind filter samples
Atmos. Chem. Phys., 19, 10883–10900, 2019 www.atmos-chem-phys.net/19/10883/2019/
X. Gong et al.: Cloud condensation nuclei and ice-nucleating particles in the eastern Mediterranean 10887
in total. All of the filters were stored at −18 ◦C on Cyprusand cooled below 0 ◦C during transportation. The start andend times of sampling, flow rates, duration, and total samplevolumes are shown in Table S1 in the Supplement. These fil-ters were transported to TROPOS for analysis. At TROPOS,all filters were stored at −18 ◦C until they were preparedfor the measurement. Each filter was immersed into 1 mLultrapure water (Type 1, Millipore) and shaken for 25 minto wash off the particles. The resulting water samples werecharacterized with the Leipzig Ice Nucleation Array (LINA).It should be mentioned that results from separate tests us-ing 1 and 10 mL of washing water were well in agreement(see Fig. S3). LINA is based on the freezing array tech-nique and follows the design described in Budke and Koop(2015). Briefly, 90 droplets with a volume of 1 µL are pipet-ted from the water samples onto a thin hydrophobic glassslide, with the droplets being separated from each other in-side individual compartments. The compartments are sealedat the top with another glass slide to minimize evaporationof the droplets and to prevent ice seeding from neighboringdroplets. The bottom glass slide is cooled with a Peltier ele-ment with a cooling rate of 1 Kmin−1. A camera takes pic-tures every 6 s, corresponding to a temperature resolution of0.1 K. The number of frozen versus unfrozen droplets wasderived automatically. More details concerning the experi-mental parameters and temperature calibration of LINA canbe found in Chen et al. (2018).
For the second filter-based sampling system, 200 nmpore size polycarbonate filters (Nuclepore Track-Etch Mem-brane, Whatman) were pre-treated with 10 % H2O2 solu-tion, washed with particle free ultrapure water, and driedprior to insertion into the filter holder. Daily filter sampleswith an air flow rate of ∼ 15 Lmin−1 for ∼ 8 h were taken.In total 25 d time and two blind filter samples were col-lected. All of the filters were stored at −18 ◦C in Cyprusand cooled below 0 ◦C during transportation. The start andend times of sampling, flow rates, and duration are shownin Table S2. These filters were transported to the KarlsruheInstitute of Technology (KIT) for analysis with the Ice Nu-cleation SpEctrometer of the Karlsruhe Institute of Technol-ogy (INSEKT). INSEKT is a droplet freezing device, the de-sign of which was inspired by the Colorado State UniversityIce Spectrometer (Hiranuma et al., 2015). For the analysis,each filter was washed with 8 mL ultrapure water which hadbeen passed through a 0.1 µm filter (Nuclepore Track-EtchMembrane, Whatman); 50 µL samples of the resulting sus-pension/solution were pipetted into 24 to 36 sections of two96-well PCR trays. Other wells of the trays were filled with15- and 225-fold (and for some samples also 3375-fold) dilu-tions of the filter washing water. Also, in each experiment atleast 24 wells were filled with pure and particle-free water tobe able to account for impurities resulting from the washingwater and PCR tray surfaces. The PCR trays were then placedinto aluminum cooling blocks. Those blocks have been cus-tomized by drilling channels into the bulk aluminum, through
which the cooling agent thermostated by means of an exter-nal chiller (LAUDA PROLINE RP 855) is directed. The tem-perature of the cooling agent is then lowered by 0.33 Kmin−1
and monitored by eight calibrated temperature sensors in-serted into the aluminum blocks. The number of frozen ver-sus unfrozen wells was derived visually in 0.5 K steps.
For both measurement systems, the cumulative concentra-tion of INP per air volume as a function of temperature canbe calculated based on Vali (1971):
NINP(θ)=lnNt− lnN(θ)
V, (3)
where Nt is the number of droplets/wells and N(θ) isthe number of unfrozen droplets/wells at temperature θ . Vmeans the volume (at 0 ◦C and 1013 hPa) of air distributedinto each droplet/well.
The background freezing signal of ultrapure water and wa-ter samples resulting from washing of blind filters is deter-mined for the two sampling systems as well. Measured NINPis corrected by subtracting the background concentrationsdetermined for the blind filters and the ultrapure water.
Due to the usually small number (order of tens and lowerper examined droplet/well) of INP present in the washingwater and the limited number of droplets/wells consideredin our measurements, statical errors need to be considered inthe data evaluation. Therefore, confidence intervals for thefrozen fraction (fice) were determined using the method sug-gested by Agresti and Coull (1998). More details about thebackground subtraction and measurement uncertainties canbe found in the Supplement.
2.5 Chemical composition
Aerosol particle dry deposition was collected with a flat-plate-type sampler (Ott and Peters, 2008) on carbon adhe-sive mounted on standard electron microscopy stubs. Samplesubstrates were exposed for approximately 24 h, collectingparticles approximately between 1 and 100 µm particle di-ameter at ambient conditions. Samples were subject to auto-mated electron microscopy single-particle analysis, yieldingthe particle size (projected area diameter) and average ele-mental composition for each particle. Particles were classi-fied according to the composition in groups based on a staticrules set. For more information on sampling, analysis, anddata processing, refer to Kandler et al. (2018). In this study,we calculated the particle mass deposition rate in the sizerange from 1 to 8 µm.
3 Results and discussion
3.1 Overview of the meteorology and air quality
Time series of meteorological and air quality parameters asmeasured from 2 to 30 April are shown in Fig. 2. The rela-tive humidity (RH), temperature, wind speed, wind direction,
www.atmos-chem-phys.net/19/10883/2019/ Atmos. Chem. Phys., 19, 10883–10900, 2019
10888 X. Gong et al.: Cloud condensation nuclei and ice-nucleating particles in the eastern Mediterranean
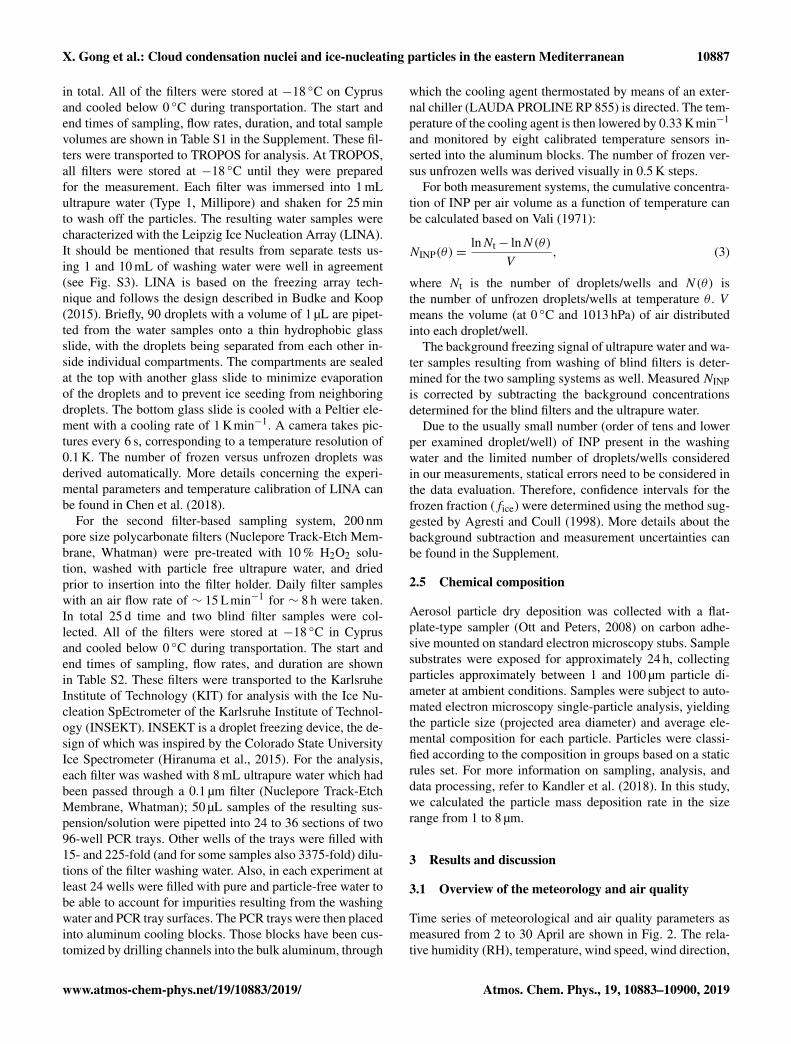
Figure 2. Time series of RH, temperature, wind speed, and wind direction with 10 min resolution, NOx , and Ntotal with 1 h resolution.
NOx , and Ntotal (retrieved from MPSS- and APS-measuredPNSD) were determined at the measurement site. Note thatall times presented here are in UTC (corresponding to localtime−3).
RH exhibited large variability throughout the campaign,varying from 22.6 % to 89.2 %, with a mean of 68.4 %. Tem-perature varied from 10.0 to 26.5 ◦C, with a mean of 17.5 ◦C.The local wind speeds ranged from 0.1 to 10.1 ms−1, with amean of 2.8 ms−1. Figure S4 shows the wind rose plot basedon a 10 min mean of wind speed and wind direction. It isclear that winds are mainly from northwest, west, and north-east. The winds from northwest and west featured higherwind speeds, while winds from northeast featured lower windspeeds.
NOx varied from 0.0027 to 25 ppbv, with a median of0.67 ppbv. Ntotal varied from 658 to 61 308 cm−3, with amedian of 3954 cm−3. The NOx and Ntotal were relativelylow during most of the campaign. However, sharp increasesin NOx and Ntotal were observed frequently, and extremelyhigh concentrations (NOx > 1.6 ppbv, Ntotal > 8000 cm−3)only occurred for a few hours. A good correlation (R2
=
0.62) was found between such extremely high concentrationsof NOx and Ntotal (Fig. S5), indicating a nearby pollutionsource. The extremely high concentrations of NOx and Ntotaltogether with the wind direction typically connected to theiroccurrences suggest the nearby airport as the source of thesepollutions, as will be discussed in more detail in Sect. 3.2.
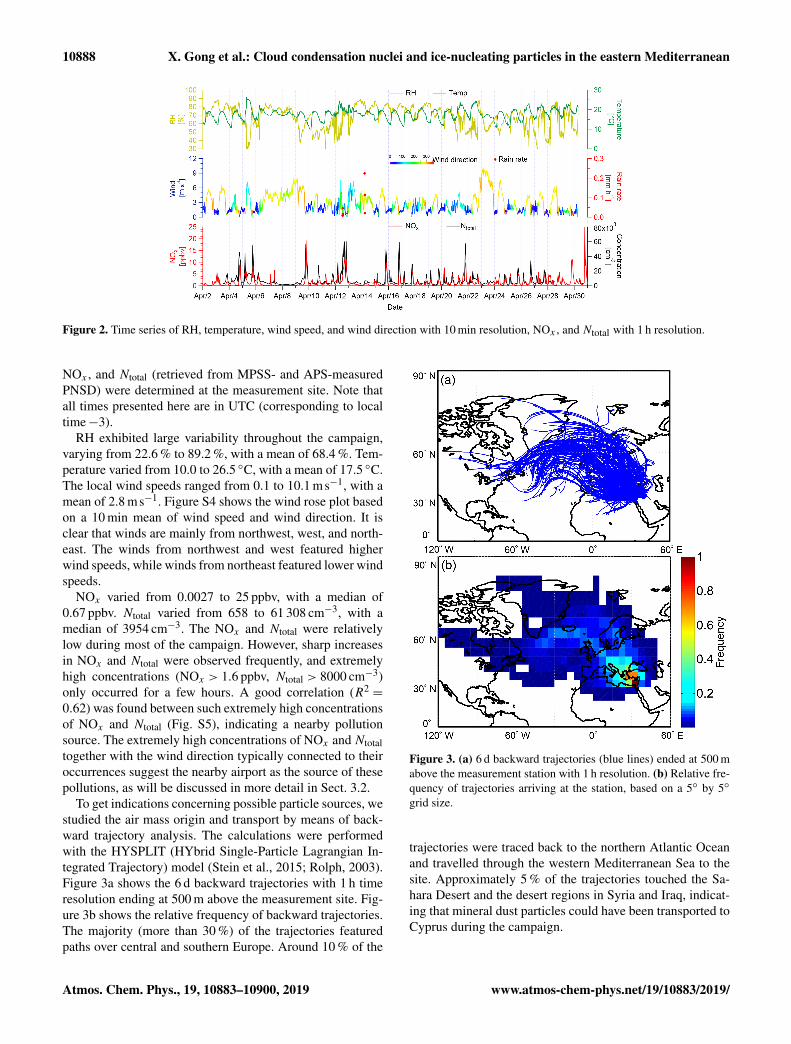
To get indications concerning possible particle sources, westudied the air mass origin and transport by means of back-ward trajectory analysis. The calculations were performedwith the HYSPLIT (HYbrid Single-Particle Lagrangian In-tegrated Trajectory) model (Stein et al., 2015; Rolph, 2003).Figure 3a shows the 6 d backward trajectories with 1 h timeresolution ending at 500 m above the measurement site. Fig-ure 3b shows the relative frequency of backward trajectories.The majority (more than 30 %) of the trajectories featuredpaths over central and southern Europe. Around 10 % of the
Figure 3. (a) 6 d backward trajectories (blue lines) ended at 500 mabove the measurement station with 1 h resolution. (b) Relative fre-quency of trajectories arriving at the station, based on a 5◦ by 5◦
grid size.
trajectories were traced back to the northern Atlantic Oceanand travelled through the western Mediterranean Sea to thesite. Approximately 5 % of the trajectories touched the Sa-hara Desert and the desert regions in Syria and Iraq, indicat-ing that mineral dust particles could have been transported toCyprus during the campaign.
Atmos. Chem. Phys., 19, 10883–10900, 2019 www.atmos-chem-phys.net/19/10883/2019/
X. Gong et al.: Cloud condensation nuclei and ice-nucleating particles in the eastern Mediterranean 10889
3.2 Particle number size distribution and sources
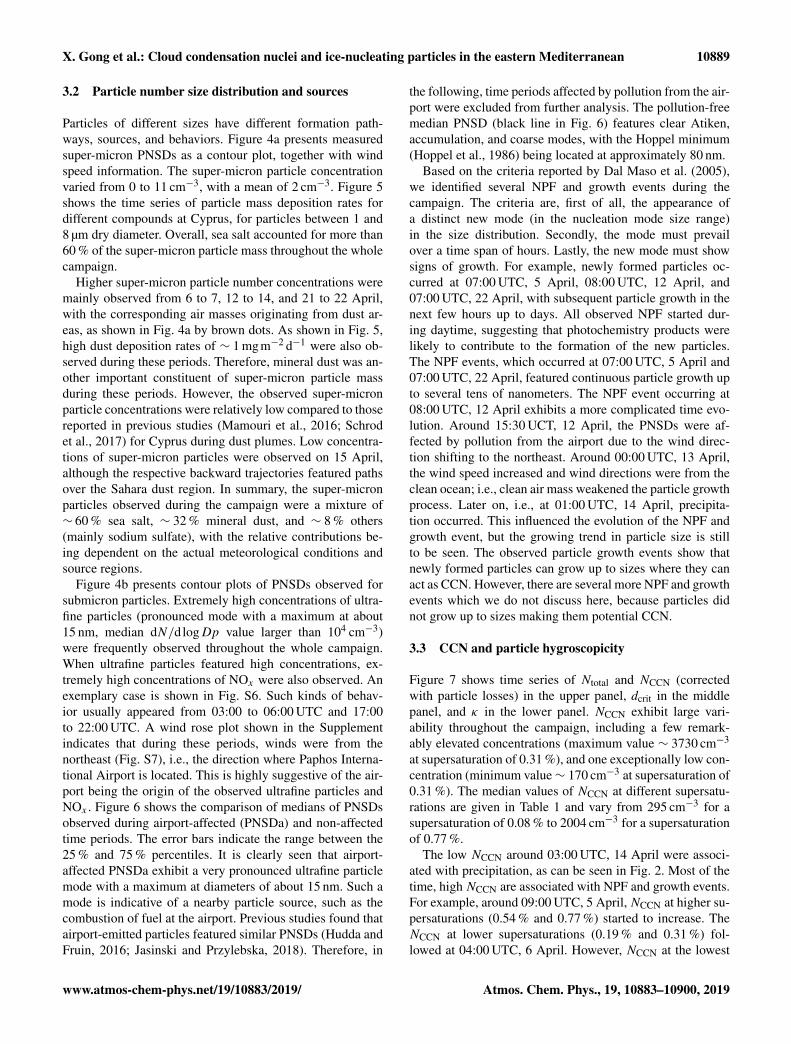
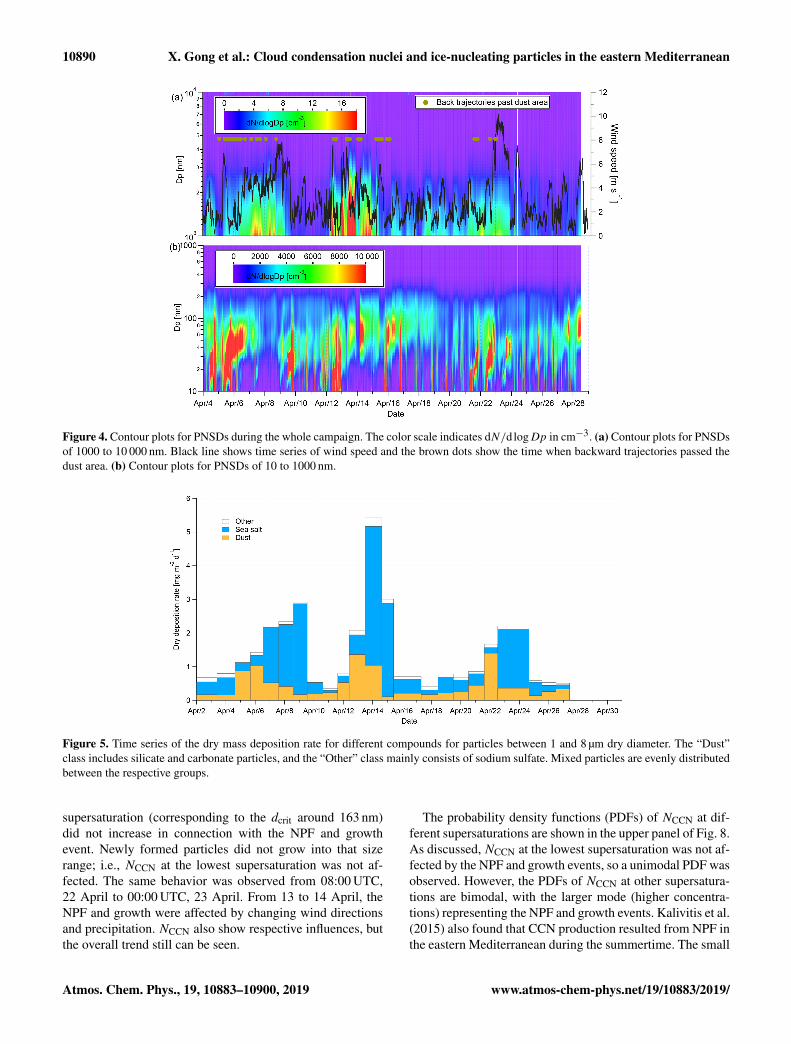
Particles of different sizes have different formation path-ways, sources, and behaviors. Figure 4a presents measuredsuper-micron PNSDs as a contour plot, together with windspeed information. The super-micron particle concentrationvaried from 0 to 11 cm−3, with a mean of 2 cm−3. Figure 5shows the time series of particle mass deposition rates fordifferent compounds at Cyprus, for particles between 1 and8 µm dry diameter. Overall, sea salt accounted for more than60 % of the super-micron particle mass throughout the wholecampaign.
Higher super-micron particle number concentrations weremainly observed from 6 to 7, 12 to 14, and 21 to 22 April,with the corresponding air masses originating from dust ar-eas, as shown in Fig. 4a by brown dots. As shown in Fig. 5,high dust deposition rates of ∼ 1 mgm−2 d−1 were also ob-served during these periods. Therefore, mineral dust was an-other important constituent of super-micron particle massduring these periods. However, the observed super-micronparticle concentrations were relatively low compared to thosereported in previous studies (Mamouri et al., 2016; Schrodet al., 2017) for Cyprus during dust plumes. Low concentra-tions of super-micron particles were observed on 15 April,although the respective backward trajectories featured pathsover the Sahara dust region. In summary, the super-micronparticles observed during the campaign were a mixture of∼ 60 % sea salt, ∼ 32 % mineral dust, and ∼ 8 % others(mainly sodium sulfate), with the relative contributions be-ing dependent on the actual meteorological conditions andsource regions.
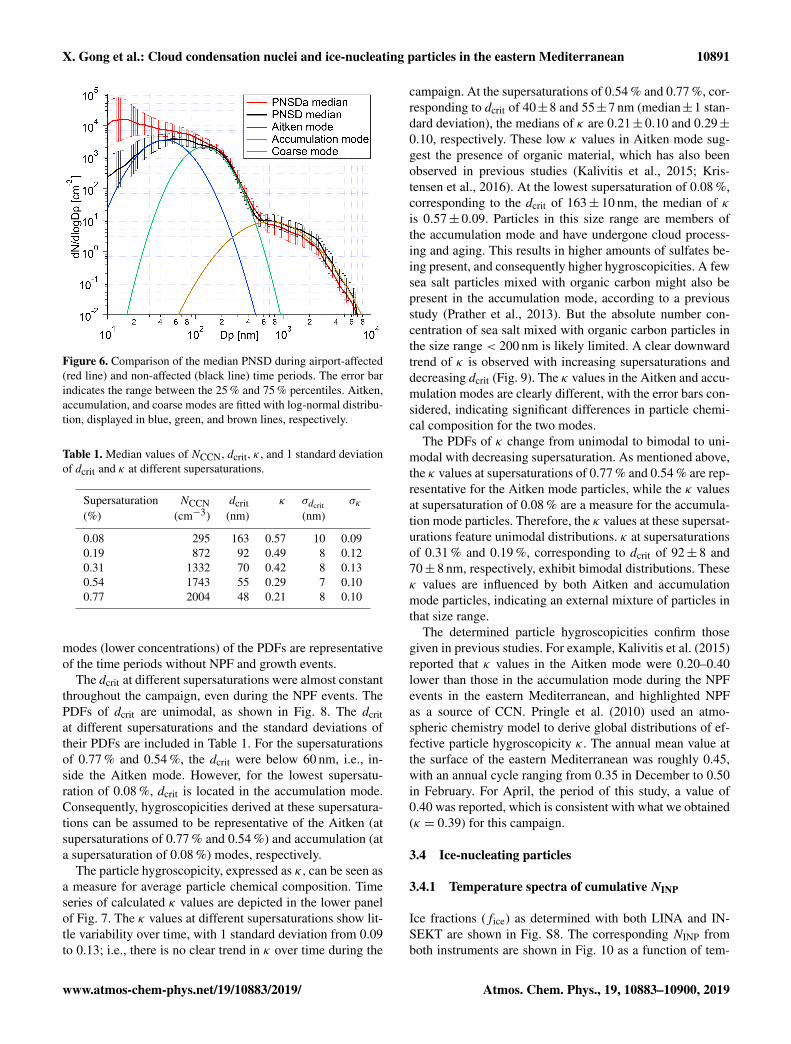
Figure 4b presents contour plots of PNSDs observed forsubmicron particles. Extremely high concentrations of ultra-fine particles (pronounced mode with a maximum at about15 nm, median dN/dlogDp value larger than 104 cm−3)were frequently observed throughout the whole campaign.When ultrafine particles featured high concentrations, ex-tremely high concentrations of NOx were also observed. Anexemplary case is shown in Fig. S6. Such kinds of behav-ior usually appeared from 03:00 to 06:00 UTC and 17:00to 22:00 UTC. A wind rose plot shown in the Supplementindicates that during these periods, winds were from thenortheast (Fig. S7), i.e., the direction where Paphos Interna-tional Airport is located. This is highly suggestive of the air-port being the origin of the observed ultrafine particles andNOx . Figure 6 shows the comparison of medians of PNSDsobserved during airport-affected (PNSDa) and non-affectedtime periods. The error bars indicate the range between the25 % and 75 % percentiles. It is clearly seen that airport-affected PNSDa exhibit a very pronounced ultrafine particlemode with a maximum at diameters of about 15 nm. Such amode is indicative of a nearby particle source, such as thecombustion of fuel at the airport. Previous studies found thatairport-emitted particles featured similar PNSDs (Hudda andFruin, 2016; Jasinski and Przylebska, 2018). Therefore, in
the following, time periods affected by pollution from the air-port were excluded from further analysis. The pollution-freemedian PNSD (black line in Fig. 6) features clear Atiken,accumulation, and coarse modes, with the Hoppel minimum(Hoppel et al., 1986) being located at approximately 80 nm.
Based on the criteria reported by Dal Maso et al. (2005),we identified several NPF and growth events during thecampaign. The criteria are, first of all, the appearance ofa distinct new mode (in the nucleation mode size range)in the size distribution. Secondly, the mode must prevailover a time span of hours. Lastly, the new mode must showsigns of growth. For example, newly formed particles oc-curred at 07:00 UTC, 5 April, 08:00 UTC, 12 April, and07:00 UTC, 22 April, with subsequent particle growth in thenext few hours up to days. All observed NPF started dur-ing daytime, suggesting that photochemistry products werelikely to contribute to the formation of the new particles.The NPF events, which occurred at 07:00 UTC, 5 April and07:00 UTC, 22 April, featured continuous particle growth upto several tens of nanometers. The NPF event occurring at08:00 UTC, 12 April exhibits a more complicated time evo-lution. Around 15:30 UCT, 12 April, the PNSDs were af-fected by pollution from the airport due to the wind direc-tion shifting to the northeast. Around 00:00 UTC, 13 April,the wind speed increased and wind directions were from theclean ocean; i.e., clean air mass weakened the particle growthprocess. Later on, i.e., at 01:00 UTC, 14 April, precipita-tion occurred. This influenced the evolution of the NPF andgrowth event, but the growing trend in particle size is stillto be seen. The observed particle growth events show thatnewly formed particles can grow up to sizes where they canact as CCN. However, there are several more NPF and growthevents which we do not discuss here, because particles didnot grow up to sizes making them potential CCN.
3.3 CCN and particle hygroscopicity
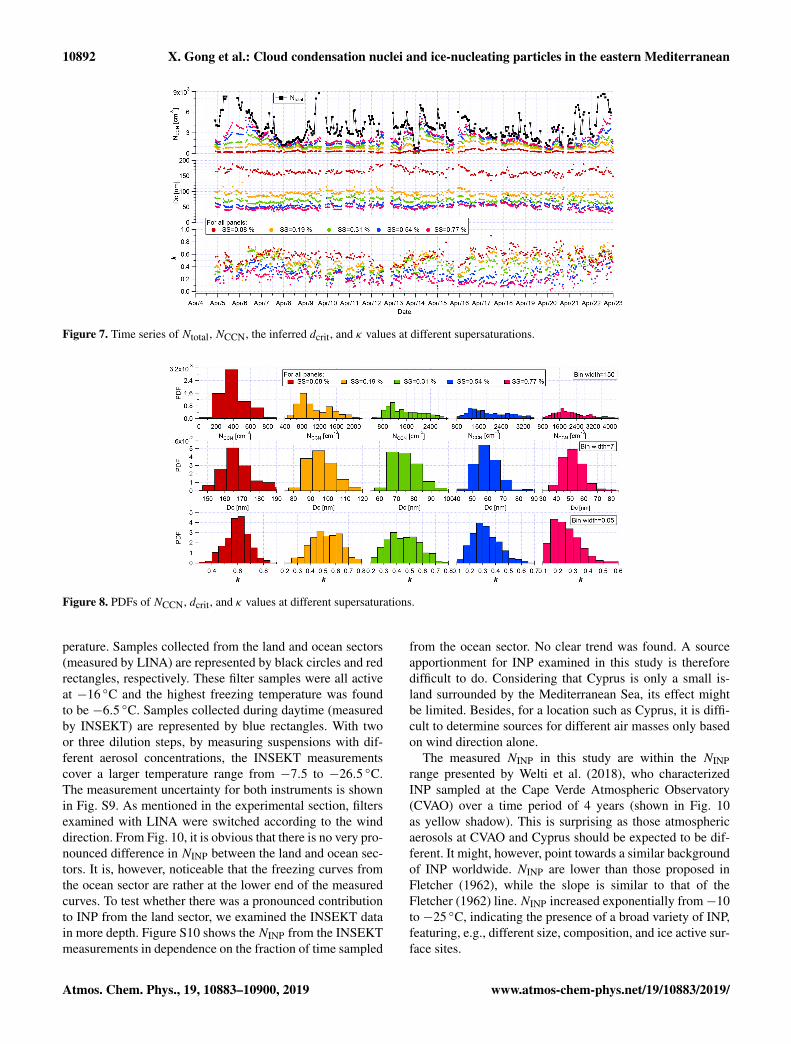
Figure 7 shows time series of Ntotal and NCCN (correctedwith particle losses) in the upper panel, dcrit in the middlepanel, and κ in the lower panel. NCCN exhibit large vari-ability throughout the campaign, including a few remark-ably elevated concentrations (maximum value ∼ 3730 cm−3
at supersaturation of 0.31 %), and one exceptionally low con-centration (minimum value∼ 170 cm−3 at supersaturation of0.31 %). The median values of NCCN at different supersatu-rations are given in Table 1 and vary from 295 cm−3 for asupersaturation of 0.08 % to 2004 cm−3 for a supersaturationof 0.77 %.
The low NCCN around 03:00 UTC, 14 April were associ-ated with precipitation, as can be seen in Fig. 2. Most of thetime, high NCCN are associated with NPF and growth events.For example, around 09:00 UTC, 5 April,NCCN at higher su-persaturations (0.54 % and 0.77 %) started to increase. TheNCCN at lower supersaturations (0.19 % and 0.31 %) fol-lowed at 04:00 UTC, 6 April. However, NCCN at the lowest
www.atmos-chem-phys.net/19/10883/2019/ Atmos. Chem. Phys., 19, 10883–10900, 2019
10890 X. Gong et al.: Cloud condensation nuclei and ice-nucleating particles in the eastern Mediterranean
Figure 4. Contour plots for PNSDs during the whole campaign. The color scale indicates dN/dlogDp in cm−3. (a) Contour plots for PNSDsof 1000 to 10 000 nm. Black line shows time series of wind speed and the brown dots show the time when backward trajectories passed thedust area. (b) Contour plots for PNSDs of 10 to 1000 nm.
Figure 5. Time series of the dry mass deposition rate for different compounds for particles between 1 and 8 µm dry diameter. The “Dust”class includes silicate and carbonate particles, and the “Other” class mainly consists of sodium sulfate. Mixed particles are evenly distributedbetween the respective groups.
supersaturation (corresponding to the dcrit around 163 nm)did not increase in connection with the NPF and growthevent. Newly formed particles did not grow into that sizerange; i.e., NCCN at the lowest supersaturation was not af-fected. The same behavior was observed from 08:00 UTC,22 April to 00:00 UTC, 23 April. From 13 to 14 April, theNPF and growth were affected by changing wind directionsand precipitation. NCCN also show respective influences, butthe overall trend still can be seen.
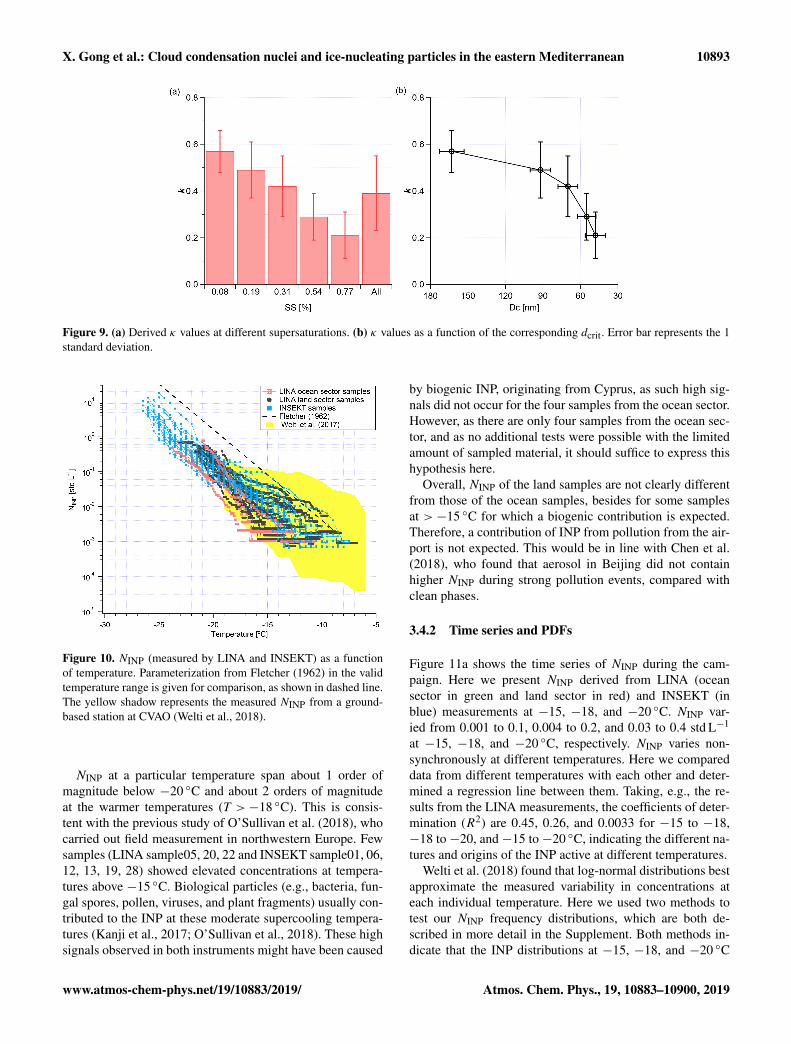
The probability density functions (PDFs) of NCCN at dif-ferent supersaturations are shown in the upper panel of Fig. 8.As discussed, NCCN at the lowest supersaturation was not af-fected by the NPF and growth events, so a unimodal PDF wasobserved. However, the PDFs of NCCN at other supersatura-tions are bimodal, with the larger mode (higher concentra-tions) representing the NPF and growth events. Kalivitis et al.(2015) also found that CCN production resulted from NPF inthe eastern Mediterranean during the summertime. The small
Atmos. Chem. Phys., 19, 10883–10900, 2019 www.atmos-chem-phys.net/19/10883/2019/
X. Gong et al.: Cloud condensation nuclei and ice-nucleating particles in the eastern Mediterranean 10891
Figure 6. Comparison of the median PNSD during airport-affected(red line) and non-affected (black line) time periods. The error barindicates the range between the 25 % and 75 % percentiles. Aitken,accumulation, and coarse modes are fitted with log-normal distribu-tion, displayed in blue, green, and brown lines, respectively.
Table 1. Median values of NCCN, dcrit, κ , and 1 standard deviationof dcrit and κ at different supersaturations.
Supersaturation NCCN dcrit κ σdcrit σκ
(%) (cm−3) (nm) (nm)
0.08 295 163 0.57 10 0.090.19 872 92 0.49 8 0.120.31 1332 70 0.42 8 0.130.54 1743 55 0.29 7 0.100.77 2004 48 0.21 8 0.10
modes (lower concentrations) of the PDFs are representativeof the time periods without NPF and growth events.
The dcrit at different supersaturations were almost constantthroughout the campaign, even during the NPF events. ThePDFs of dcrit are unimodal, as shown in Fig. 8. The dcritat different supersaturations and the standard deviations oftheir PDFs are included in Table 1. For the supersaturationsof 0.77 % and 0.54 %, the dcrit were below 60 nm, i.e., in-side the Aitken mode. However, for the lowest supersatu-ration of 0.08 %, dcrit is located in the accumulation mode.Consequently, hygroscopicities derived at these supersatura-tions can be assumed to be representative of the Aitken (atsupersaturations of 0.77 % and 0.54 %) and accumulation (ata supersaturation of 0.08 %) modes, respectively.
The particle hygroscopicity, expressed as κ , can be seen asa measure for average particle chemical composition. Timeseries of calculated κ values are depicted in the lower panelof Fig. 7. The κ values at different supersaturations show lit-tle variability over time, with 1 standard deviation from 0.09to 0.13; i.e., there is no clear trend in κ over time during the
campaign. At the supersaturations of 0.54 % and 0.77 %, cor-responding to dcrit of 40±8 and 55±7 nm (median±1 stan-dard deviation), the medians of κ are 0.21±0.10 and 0.29±0.10, respectively. These low κ values in Aitken mode sug-gest the presence of organic material, which has also beenobserved in previous studies (Kalivitis et al., 2015; Kris-tensen et al., 2016). At the lowest supersaturation of 0.08 %,corresponding to the dcrit of 163± 10 nm, the median of κis 0.57± 0.09. Particles in this size range are members ofthe accumulation mode and have undergone cloud process-ing and aging. This results in higher amounts of sulfates be-ing present, and consequently higher hygroscopicities. A fewsea salt particles mixed with organic carbon might also bepresent in the accumulation mode, according to a previousstudy (Prather et al., 2013). But the absolute number con-centration of sea salt mixed with organic carbon particles inthe size range < 200 nm is likely limited. A clear downwardtrend of κ is observed with increasing supersaturations anddecreasing dcrit (Fig. 9). The κ values in the Aitken and accu-mulation modes are clearly different, with the error bars con-sidered, indicating significant differences in particle chemi-cal composition for the two modes.
The PDFs of κ change from unimodal to bimodal to uni-modal with decreasing supersaturation. As mentioned above,the κ values at supersaturations of 0.77 % and 0.54 % are rep-resentative for the Aitken mode particles, while the κ valuesat supersaturation of 0.08 % are a measure for the accumula-tion mode particles. Therefore, the κ values at these supersat-urations feature unimodal distributions. κ at supersaturationsof 0.31 % and 0.19 %, corresponding to dcrit of 92± 8 and70± 8 nm, respectively, exhibit bimodal distributions. Theseκ values are influenced by both Aitken and accumulationmode particles, indicating an external mixture of particles inthat size range.
The determined particle hygroscopicities confirm thosegiven in previous studies. For example, Kalivitis et al. (2015)reported that κ values in the Aitken mode were 0.20–0.40lower than those in the accumulation mode during the NPFevents in the eastern Mediterranean, and highlighted NPFas a source of CCN. Pringle et al. (2010) used an atmo-spheric chemistry model to derive global distributions of ef-fective particle hygroscopicity κ . The annual mean value atthe surface of the eastern Mediterranean was roughly 0.45,with an annual cycle ranging from 0.35 in December to 0.50in February. For April, the period of this study, a value of0.40 was reported, which is consistent with what we obtained(κ = 0.39) for this campaign.
3.4 Ice-nucleating particles
3.4.1 Temperature spectra of cumulative NINP
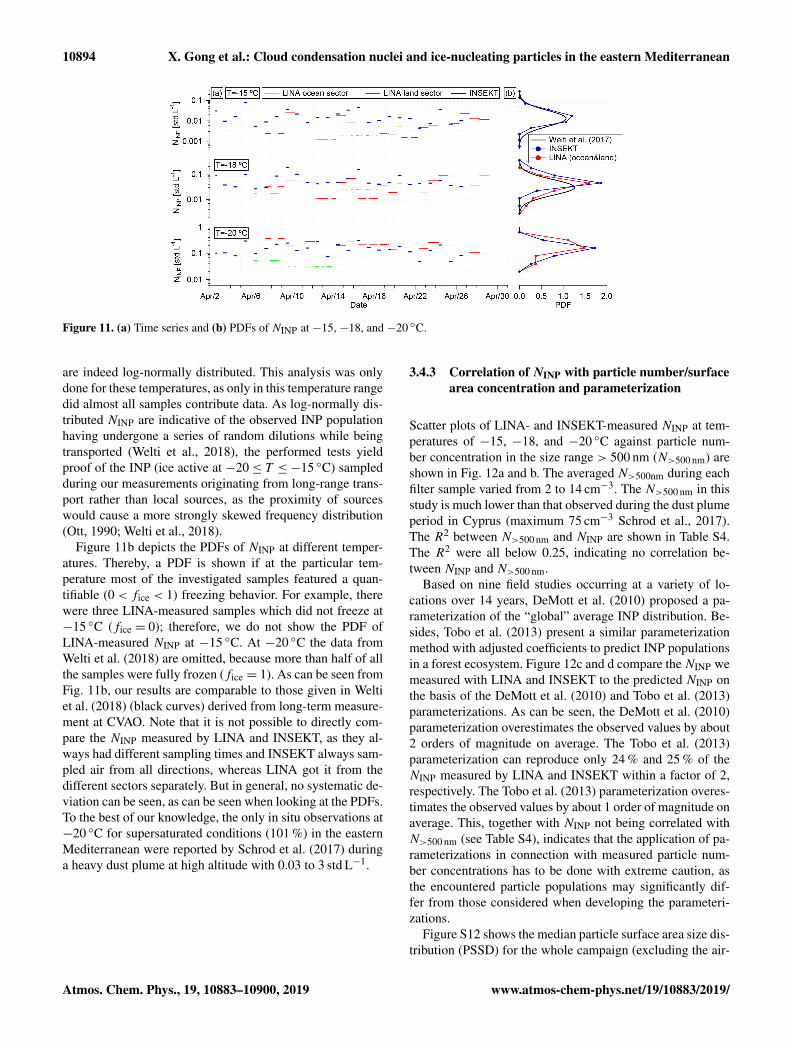
Ice fractions (fice) as determined with both LINA and IN-SEKT are shown in Fig. S8. The corresponding NINP fromboth instruments are shown in Fig. 10 as a function of tem-
www.atmos-chem-phys.net/19/10883/2019/ Atmos. Chem. Phys., 19, 10883–10900, 2019
10892 X. Gong et al.: Cloud condensation nuclei and ice-nucleating particles in the eastern Mediterranean
Figure 7. Time series of Ntotal, NCCN, the inferred dcrit, and κ values at different supersaturations.
Figure 8. PDFs of NCCN, dcrit, and κ values at different supersaturations.
perature. Samples collected from the land and ocean sectors(measured by LINA) are represented by black circles and redrectangles, respectively. These filter samples were all activeat −16 ◦C and the highest freezing temperature was foundto be −6.5 ◦C. Samples collected during daytime (measuredby INSEKT) are represented by blue rectangles. With twoor three dilution steps, by measuring suspensions with dif-ferent aerosol concentrations, the INSEKT measurementscover a larger temperature range from −7.5 to −26.5 ◦C.The measurement uncertainty for both instruments is shownin Fig. S9. As mentioned in the experimental section, filtersexamined with LINA were switched according to the winddirection. From Fig. 10, it is obvious that there is no very pro-nounced difference in NINP between the land and ocean sec-tors. It is, however, noticeable that the freezing curves fromthe ocean sector are rather at the lower end of the measuredcurves. To test whether there was a pronounced contributionto INP from the land sector, we examined the INSEKT datain more depth. Figure S10 shows the NINP from the INSEKTmeasurements in dependence on the fraction of time sampled
from the ocean sector. No clear trend was found. A sourceapportionment for INP examined in this study is thereforedifficult to do. Considering that Cyprus is only a small is-land surrounded by the Mediterranean Sea, its effect mightbe limited. Besides, for a location such as Cyprus, it is diffi-cult to determine sources for different air masses only basedon wind direction alone.
The measured NINP in this study are within the NINPrange presented by Welti et al. (2018), who characterizedINP sampled at the Cape Verde Atmospheric Observatory(CVAO) over a time period of 4 years (shown in Fig. 10as yellow shadow). This is surprising as those atmosphericaerosols at CVAO and Cyprus should be expected to be dif-ferent. It might, however, point towards a similar backgroundof INP worldwide. NINP are lower than those proposed inFletcher (1962), while the slope is similar to that of theFletcher (1962) line.NINP increased exponentially from−10to −25 ◦C, indicating the presence of a broad variety of INP,featuring, e.g., different size, composition, and ice active sur-face sites.
Atmos. Chem. Phys., 19, 10883–10900, 2019 www.atmos-chem-phys.net/19/10883/2019/
X. Gong et al.: Cloud condensation nuclei and ice-nucleating particles in the eastern Mediterranean 10893
Figure 9. (a) Derived κ values at different supersaturations. (b) κ values as a function of the corresponding dcrit. Error bar represents the 1standard deviation.
Figure 10. NINP (measured by LINA and INSEKT) as a functionof temperature. Parameterization from Fletcher (1962) in the validtemperature range is given for comparison, as shown in dashed line.The yellow shadow represents the measured NINP from a ground-based station at CVAO (Welti et al., 2018).
NINP at a particular temperature span about 1 order ofmagnitude below −20 ◦C and about 2 orders of magnitudeat the warmer temperatures (T >−18 ◦C). This is consis-tent with the previous study of O’Sullivan et al. (2018), whocarried out field measurement in northwestern Europe. Fewsamples (LINA sample05, 20, 22 and INSEKT sample01, 06,12, 13, 19, 28) showed elevated concentrations at tempera-tures above −15 ◦C. Biological particles (e.g., bacteria, fun-gal spores, pollen, viruses, and plant fragments) usually con-tributed to the INP at these moderate supercooling tempera-tures (Kanji et al., 2017; O’Sullivan et al., 2018). These highsignals observed in both instruments might have been caused
by biogenic INP, originating from Cyprus, as such high sig-nals did not occur for the four samples from the ocean sector.However, as there are only four samples from the ocean sec-tor, and as no additional tests were possible with the limitedamount of sampled material, it should suffice to express thishypothesis here.
Overall, NINP of the land samples are not clearly differentfrom those of the ocean samples, besides for some samplesat >−15 ◦C for which a biogenic contribution is expected.Therefore, a contribution of INP from pollution from the air-port is not expected. This would be in line with Chen et al.(2018), who found that aerosol in Beijing did not containhigher NINP during strong pollution events, compared withclean phases.
3.4.2 Time series and PDFs
Figure 11a shows the time series of NINP during the cam-paign. Here we present NINP derived from LINA (oceansector in green and land sector in red) and INSEKT (inblue) measurements at −15, −18, and −20 ◦C. NINP var-ied from 0.001 to 0.1, 0.004 to 0.2, and 0.03 to 0.4 std L−1
at −15, −18, and −20 ◦C, respectively. NINP varies non-synchronously at different temperatures. Here we compareddata from different temperatures with each other and deter-mined a regression line between them. Taking, e.g., the re-sults from the LINA measurements, the coefficients of deter-mination (R2) are 0.45, 0.26, and 0.0033 for −15 to −18,−18 to −20, and −15 to −20 ◦C, indicating the different na-tures and origins of the INP active at different temperatures.
Welti et al. (2018) found that log-normal distributions bestapproximate the measured variability in concentrations ateach individual temperature. Here we used two methods totest our NINP frequency distributions, which are both de-scribed in more detail in the Supplement. Both methods in-dicate that the INP distributions at −15, −18, and −20 ◦C
www.atmos-chem-phys.net/19/10883/2019/ Atmos. Chem. Phys., 19, 10883–10900, 2019
10894 X. Gong et al.: Cloud condensation nuclei and ice-nucleating particles in the eastern Mediterranean
Figure 11. (a) Time series and (b) PDFs of NINP at −15, −18, and −20 ◦C.
are indeed log-normally distributed. This analysis was onlydone for these temperatures, as only in this temperature rangedid almost all samples contribute data. As log-normally dis-tributed NINP are indicative of the observed INP populationhaving undergone a series of random dilutions while beingtransported (Welti et al., 2018), the performed tests yieldproof of the INP (ice active at −20≤ T ≤−15 ◦C) sampledduring our measurements originating from long-range trans-port rather than local sources, as the proximity of sourceswould cause a more strongly skewed frequency distribution(Ott, 1990; Welti et al., 2018).
Figure 11b depicts the PDFs of NINP at different temper-atures. Thereby, a PDF is shown if at the particular tem-perature most of the investigated samples featured a quan-tifiable (0< fice < 1) freezing behavior. For example, therewere three LINA-measured samples which did not freeze at−15 ◦C (fice = 0); therefore, we do not show the PDF ofLINA-measured NINP at −15 ◦C. At −20 ◦C the data fromWelti et al. (2018) are omitted, because more than half of allthe samples were fully frozen (fice = 1). As can be seen fromFig. 11b, our results are comparable to those given in Weltiet al. (2018) (black curves) derived from long-term measure-ment at CVAO. Note that it is not possible to directly com-pare the NINP measured by LINA and INSEKT, as they al-ways had different sampling times and INSEKT always sam-pled air from all directions, whereas LINA got it from thedifferent sectors separately. But in general, no systematic de-viation can be seen, as can be seen when looking at the PDFs.To the best of our knowledge, the only in situ observations at−20 ◦C for supersaturated conditions (101 %) in the easternMediterranean were reported by Schrod et al. (2017) duringa heavy dust plume at high altitude with 0.03 to 3 std L−1.
3.4.3 Correlation of NINP with particle number/surfacearea concentration and parameterization
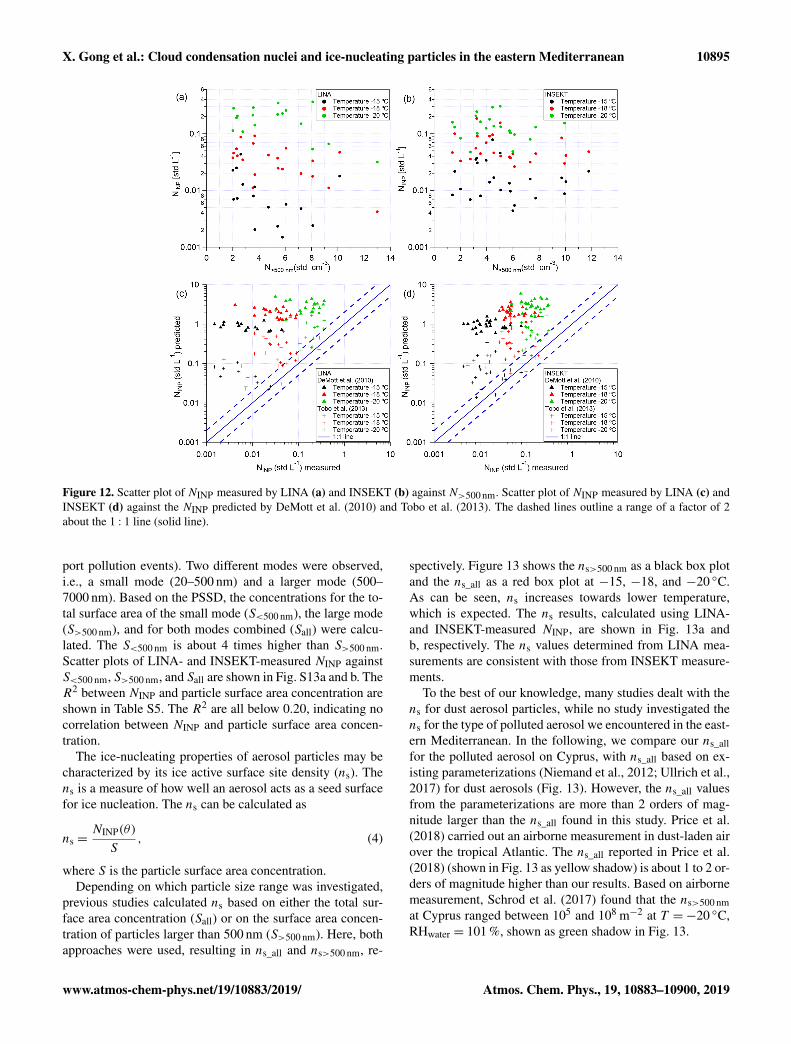
Scatter plots of LINA- and INSEKT-measured NINP at tem-peratures of −15, −18, and −20 ◦C against particle num-ber concentration in the size range > 500 nm (N>500 nm) areshown in Fig. 12a and b. The averaged N>500nm during eachfilter sample varied from 2 to 14 cm−3. The N>500 nm in thisstudy is much lower than that observed during the dust plumeperiod in Cyprus (maximum 75 cm−3 Schrod et al., 2017).The R2 between N>500 nm and NINP are shown in Table S4.The R2 were all below 0.25, indicating no correlation be-tween NINP and N>500 nm.
Based on nine field studies occurring at a variety of lo-cations over 14 years, DeMott et al. (2010) proposed a pa-rameterization of the “global” average INP distribution. Be-sides, Tobo et al. (2013) present a similar parameterizationmethod with adjusted coefficients to predict INP populationsin a forest ecosystem. Figure 12c and d compare theNINP wemeasured with LINA and INSEKT to the predicted NINP onthe basis of the DeMott et al. (2010) and Tobo et al. (2013)parameterizations. As can be seen, the DeMott et al. (2010)parameterization overestimates the observed values by about2 orders of magnitude on average. The Tobo et al. (2013)parameterization can reproduce only 24 % and 25 % of theNINP measured by LINA and INSEKT within a factor of 2,respectively. The Tobo et al. (2013) parameterization overes-timates the observed values by about 1 order of magnitude onaverage. This, together with NINP not being correlated withN>500 nm (see Table S4), indicates that the application of pa-rameterizations in connection with measured particle num-ber concentrations has to be done with extreme caution, asthe encountered particle populations may significantly dif-fer from those considered when developing the parameteri-zations.
Figure S12 shows the median particle surface area size dis-tribution (PSSD) for the whole campaign (excluding the air-
Atmos. Chem. Phys., 19, 10883–10900, 2019 www.atmos-chem-phys.net/19/10883/2019/
X. Gong et al.: Cloud condensation nuclei and ice-nucleating particles in the eastern Mediterranean 10895
Figure 12. Scatter plot of NINP measured by LINA (a) and INSEKT (b) against N>500 nm. Scatter plot of NINP measured by LINA (c) andINSEKT (d) against the NINP predicted by DeMott et al. (2010) and Tobo et al. (2013). The dashed lines outline a range of a factor of 2about the 1 : 1 line (solid line).
port pollution events). Two different modes were observed,i.e., a small mode (20–500 nm) and a larger mode (500–7000 nm). Based on the PSSD, the concentrations for the to-tal surface area of the small mode (S<500 nm), the large mode(S>500 nm), and for both modes combined (Sall) were calcu-lated. The S<500 nm is about 4 times higher than S>500 nm.Scatter plots of LINA- and INSEKT-measured NINP againstS<500 nm, S>500 nm, and Sall are shown in Fig. S13a and b. TheR2 between NINP and particle surface area concentration areshown in Table S5. The R2 are all below 0.20, indicating nocorrelation between NINP and particle surface area concen-tration.
The ice-nucleating properties of aerosol particles may becharacterized by its ice active surface site density (ns). Thens is a measure of how well an aerosol acts as a seed surfacefor ice nucleation. The ns can be calculated as
ns =NINP(θ)
S, (4)
where S is the particle surface area concentration.Depending on which particle size range was investigated,
previous studies calculated ns based on either the total sur-face area concentration (Sall) or on the surface area concen-tration of particles larger than 500 nm (S>500 nm). Here, bothapproaches were used, resulting in ns_all and ns>500 nm, re-
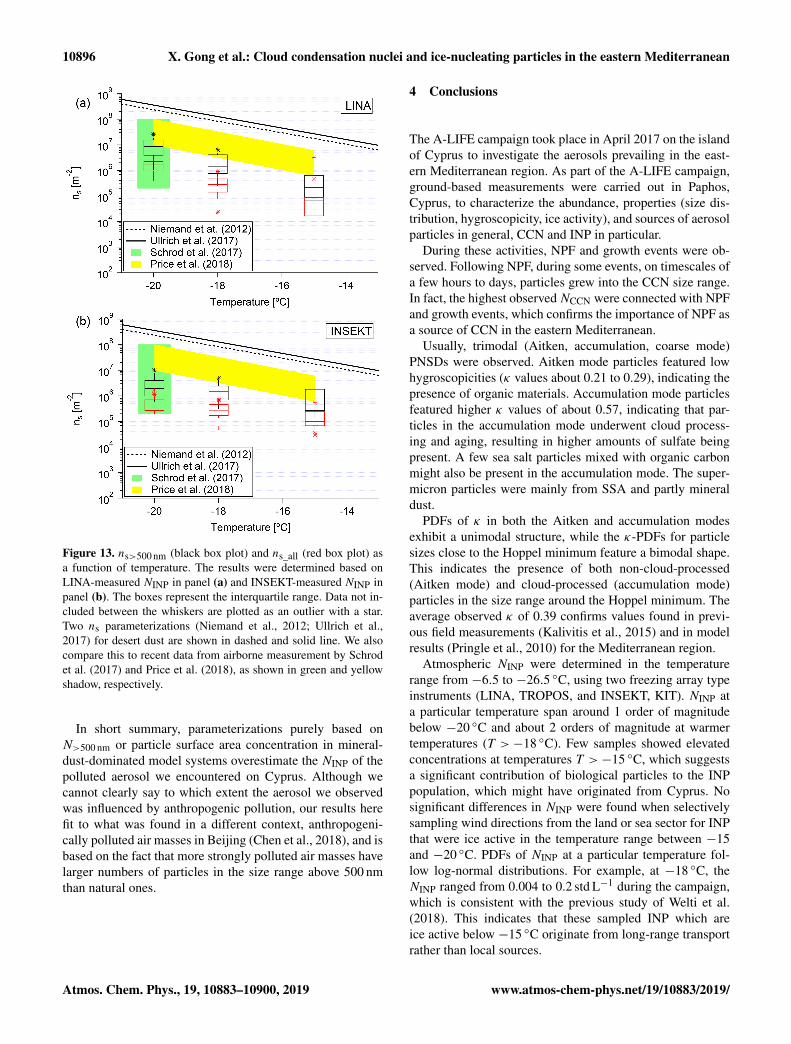
spectively. Figure 13 shows the ns>500 nm as a black box plotand the ns_all as a red box plot at −15, −18, and −20 ◦C.As can be seen, ns increases towards lower temperature,which is expected. The ns results, calculated using LINA-and INSEKT-measured NINP, are shown in Fig. 13a andb, respectively. The ns values determined from LINA mea-surements are consistent with those from INSEKT measure-ments.
To the best of our knowledge, many studies dealt with thens for dust aerosol particles, while no study investigated thens for the type of polluted aerosol we encountered in the east-ern Mediterranean. In the following, we compare our ns_allfor the polluted aerosol on Cyprus, with ns_all based on ex-isting parameterizations (Niemand et al., 2012; Ullrich et al.,2017) for dust aerosols (Fig. 13). However, the ns_all valuesfrom the parameterizations are more than 2 orders of mag-nitude larger than the ns_all found in this study. Price et al.(2018) carried out an airborne measurement in dust-laden airover the tropical Atlantic. The ns_all reported in Price et al.(2018) (shown in Fig. 13 as yellow shadow) is about 1 to 2 or-ders of magnitude higher than our results. Based on airbornemeasurement, Schrod et al. (2017) found that the ns>500 nmat Cyprus ranged between 105 and 108 m−2 at T =−20 ◦C,RHwater = 101 %, shown as green shadow in Fig. 13.
www.atmos-chem-phys.net/19/10883/2019/ Atmos. Chem. Phys., 19, 10883–10900, 2019
10896 X. Gong et al.: Cloud condensation nuclei and ice-nucleating particles in the eastern Mediterranean
Figure 13. ns>500 nm (black box plot) and ns_all (red box plot) asa function of temperature. The results were determined based onLINA-measured NINP in panel (a) and INSEKT-measured NINP inpanel (b). The boxes represent the interquartile range. Data not in-cluded between the whiskers are plotted as an outlier with a star.Two ns parameterizations (Niemand et al., 2012; Ullrich et al.,2017) for desert dust are shown in dashed and solid line. We alsocompare this to recent data from airborne measurement by Schrodet al. (2017) and Price et al. (2018), as shown in green and yellowshadow, respectively.
In short summary, parameterizations purely based onN>500 nm or particle surface area concentration in mineral-dust-dominated model systems overestimate the NINP of thepolluted aerosol we encountered on Cyprus. Although wecannot clearly say to which extent the aerosol we observedwas influenced by anthropogenic pollution, our results herefit to what was found in a different context, anthropogeni-cally polluted air masses in Beijing (Chen et al., 2018), and isbased on the fact that more strongly polluted air masses havelarger numbers of particles in the size range above 500 nmthan natural ones.
4 Conclusions
The A-LIFE campaign took place in April 2017 on the islandof Cyprus to investigate the aerosols prevailing in the east-ern Mediterranean region. As part of the A-LIFE campaign,ground-based measurements were carried out in Paphos,Cyprus, to characterize the abundance, properties (size dis-tribution, hygroscopicity, ice activity), and sources of aerosolparticles in general, CCN and INP in particular.
During these activities, NPF and growth events were ob-served. Following NPF, during some events, on timescales ofa few hours to days, particles grew into the CCN size range.In fact, the highest observedNCCN were connected with NPFand growth events, which confirms the importance of NPF asa source of CCN in the eastern Mediterranean.
Usually, trimodal (Aitken, accumulation, coarse mode)PNSDs were observed. Aitken mode particles featured lowhygroscopicities (κ values about 0.21 to 0.29), indicating thepresence of organic materials. Accumulation mode particlesfeatured higher κ values of about 0.57, indicating that par-ticles in the accumulation mode underwent cloud process-ing and aging, resulting in higher amounts of sulfate beingpresent. A few sea salt particles mixed with organic carbonmight also be present in the accumulation mode. The super-micron particles were mainly from SSA and partly mineraldust.
PDFs of κ in both the Aitken and accumulation modesexhibit a unimodal structure, while the κ-PDFs for particlesizes close to the Hoppel minimum feature a bimodal shape.This indicates the presence of both non-cloud-processed(Aitken mode) and cloud-processed (accumulation mode)particles in the size range around the Hoppel minimum. Theaverage observed κ of 0.39 confirms values found in previ-ous field measurements (Kalivitis et al., 2015) and in modelresults (Pringle et al., 2010) for the Mediterranean region.
Atmospheric NINP were determined in the temperaturerange from −6.5 to −26.5 ◦C, using two freezing array typeinstruments (LINA, TROPOS, and INSEKT, KIT). NINP ata particular temperature span around 1 order of magnitudebelow −20 ◦C and about 2 orders of magnitude at warmertemperatures (T >−18 ◦C). Few samples showed elevatedconcentrations at temperatures T >−15 ◦C, which suggestsa significant contribution of biological particles to the INPpopulation, which might have originated from Cyprus. Nosignificant differences in NINP were found when selectivelysampling wind directions from the land or sea sector for INPthat were ice active in the temperature range between −15and −20 ◦C. PDFs of NINP at a particular temperature fol-low log-normal distributions. For example, at −18 ◦C, theNINP ranged from 0.004 to 0.2 std L−1 during the campaign,which is consistent with the previous study of Welti et al.(2018). This indicates that these sampled INP which areice active below −15 ◦C originate from long-range transportrather than local sources.
Atmos. Chem. Phys., 19, 10883–10900, 2019 www.atmos-chem-phys.net/19/10883/2019/
X. Gong et al.: Cloud condensation nuclei and ice-nucleating particles in the eastern Mediterranean 10897
No correlations were found between NINP and N>500 nm.Parameterizations (DeMott et al., 2010; Tobo et al., 2013)based on N>500 nm were found to overestimate the NINP byabout 1 to 2 orders of magnitude. There was also no corre-lation between NINP and particle surface area concentration.The ns for the polluted aerosol we encountered on Cypruswas found to be 1 to 3 orders of magnitude lower than thens for dust aerosol particles resulting from previous studies(Niemand et al., 2012; Ullrich et al., 2017; Price et al., 2018).This clearly highlights that usage of such parameterizationsjust based on measured particle number or surface area sizedistributions is not always feasible for predictingNINP, as theparameterizations were derived for particular aerosol types.In other words, basing modeling efforts on, e.g., PDFs fromobserved NINP, rather than on parameterizations, might bethe method of choice if the aerosol particle and/or INP com-position are unknown.
Data availability. The data will be available through theWorld Data Center PANGAEA (https://doi.pangaea.de/10.1594/PANGAEA.904758, Gong et al., 2019) in the near future. A link tothe data can be found under this paper’s assets tab on ACP’s journalwebsite.
Supplement. The supplement related to this article is available on-line at: https://doi.org/10.5194/acp-19-10883-2019-supplement.
Author contributions. XG wrote the manuscript with contributionsfrom HW, FS, KH, KK, TM, and AW. NM and TM performed par-ticle number size distribution measurement and XG performed dataevaluation. Chemical composition measurements and data evalua-tion were performed by KK. CCN measurements and data analysiswere performed by XG. LINA measurements and data evaluationwere performed by XG. INSEKT measurements and data evalua-tion were performed by BD, TS, KH, and XG. XG, HW, and FSdiscussed the results and did further analysis after the campaign.All the co-authors proofread and commented on the manuscript.
Competing interests. The authors declare that they have no conflictof interest.
Acknowledgements. The works were carried out in the frameworkof the A-LIFE project. This project has received funding from theEuropean Research Council (ERC) under the European Union’sHorizon 2020 research and innovation program under grant agree-ment no. 640458. We would like to thank Umar Javed from the In-stitute of Energy and Climate Research, Troposphere (IEK-8), andAnywhere Tsokankunku from the Max Planck Institute for Chem-istry for providing the NOx data. Konrad Kandler is funded by theDeutsche Forschungsgemeinschaft (DFG, German Research Foun-dation) – 264907654, 264912134, 378741973, 416816480.
Financial support. The publication of this article was funded by theOpen Access Fund of the Leibniz Association.
Review statement. This paper was edited by Pedro Jimenez-Guerrero and reviewed by two anonymous referees.
References
Agresti, A. and Coull, B. A.: Approximate is Betterthan “Exact” for Interval Estimation of Binomial Pro-portions, The American Statistician, 52, 119–126,https://doi.org/10.1080/00031305.1998.10480550, 1998.
Bougiatioti, A., Nenes, A., Fountoukis, C., Kalivitis, N., Pandis, S.N., and Mihalopoulos, N.: Size-resolved CCN distributions andactivation kinetics of aged continental and marine aerosol, At-mos. Chem. Phys., 11, 8791–8808, https://doi.org/10.5194/acp-11-8791-2011, 2011.
Bougiatioti, A., Zarmpas, P., Koulouri, E., Antoniou, M., Theodosi,C., Kouvarakis, G., Saarikoski, S., Mäkelä, T., Hillamo, R., andMihalopoulos, N.: Organic, elemental and water-soluble organiccarbon in size segregated aerosols, in the marine boundary layerof the Eastern Mediterranean, Atmos. Environ., 64, 251–262,https://doi.org/10.1016/j.atmosenv.2012.09.071, 2013.
Bougiatioti, A., Bezantakos, S., Stavroulas, I., Kalivitis, N.,Kokkalis, P., Biskos, G., Mihalopoulos, N., Papayannis, A.,and Nenes, A.: Biomass-burning impact on CCN number, hy-groscopicity and cloud formation during summertime in theeastern Mediterranean, Atmos. Chem. Phys., 16, 7389–7409,https://doi.org/10.5194/acp-16-7389-2016, 2016.
Budke, C. and Koop, T.: BINARY: an optical freezing ar-ray for assessing temperature and time dependence of het-erogeneous ice nucleation, Atmos. Meas. Tech., 8, 689–703,https://doi.org/10.5194/amt-8-689-2015, 2015.
Chen, J., Wu, Z., Augustin-Bauditz, S., Grawe, S., Hart-mann, M., Pei, X., Liu, Z., Ji, D., and Wex, H.: Ice-nucleating particle concentrations unaffected by urban air pol-lution in Beijing, China, Atmos. Chem. Phys., 18, 3523–3539,https://doi.org/10.5194/acp-18-3523-2018, 2018.
Chester, R., Nimmo, M., Alarcon, M., Saydam, C., Murphy, K.,Sanders, G., and Corcoran, P.: Defining the chemical characterof aerosols from the atmosphere of the Mediterranean-Sea andsurrounding regions, Oceanol. Acta, 16, 231–246, 1993.
Claeys, M., Roberts, G., Mallet, M., Arndt, J., Sellegri, K., Sciare,J., Wenger, J., and Sauvage, B.: Optical, physical and chem-ical properties of aerosols transported to a coastal site in thewestern Mediterranean: a focus on primary marine aerosols, At-mos. Chem. Phys., 17, 7891–7915, https://doi.org/10.5194/acp-17-7891-2017, 2017.
Dal Maso, M., Kulmala, M., Riipinen, I., Wagner, R., Hussein, T.,Aalto, P. P., and Lehtinen, K. E.: Formation and growth of freshatmospheric aerosols: eight years of aerosol size distribution datafrom SMEAR II, Hyytiala, Finland, Boreal Environ. Res., 10,323–336, 2005.
DeMott, P. J., Prenni, A. J., Liu, X., Kreidenweis, S. M., Petters,M. D., Twohy, C. H., Richardson, M. S., Eidhammer, T., andRogers, D. C.: Predicting global atmospheric ice nuclei distribu-
www.atmos-chem-phys.net/19/10883/2019/ Atmos. Chem. Phys., 19, 10883–10900, 2019
10898 X. Gong et al.: Cloud condensation nuclei and ice-nucleating particles in the eastern Mediterranean
tions and their impacts on climate, P. Natl. Acad. Sci. USA, 107,11217–11222, https://doi.org/10.1073/pnas.0910818107, 2010.
Fan, J., Wang, Y., Rosenfeld, D., and Liu, X.: Review of Aerosol–Cloud Interactions: Mechanisms, Significance, and Challenges,J. Atmos. Sci., 73, 4221–4252, https://doi.org/10.1175/jas-d-16-0037.1, 2016.
Fletcher, N. H.: The physics of rainclouds, Cambridge UniversityPress, New York, 1962.
Giorgi, F. and Lionello, P.: Climate change projections for theMediterranean region, Global Planet. Change, 63, 90–104,https://doi.org/10.1016/j.gloplacha.2007.09.005, 2008.
Gong, X. Wex, H., Müller, T., Wiedensohler, A., Höhler, K., Kan-dler, K., Ma, N., Dietel, B., Schiebel, T., Möhler, O., Stratmann,F.: Ground-based measurements on aerosol particles at Paphos,Cyprus, in March–April 2017, PANGAEA, https://doi.pangaea.de/10.1594/PANGAEA.904758, last access: 16 August 2019.
Gysel, M. and Stratmann, F.: WP3 – NA3: In-situ chemi-cal, physical and optical properties of aerosols, DeliverableD3.11: Standardized protocol for CCN measurements,Tech. rep., available at: http://www.actris.net/Publications/ACTRISQualityStandards/tabid/11271/language/en-GB/Default.aspx (last access: 18 August 2019), 2013.
Herenz, P., Wex, H., Henning, S., Kristensen, T. B., Rubach, F.,Roth, A., Borrmann, S., Bozem, H., Schulz, H., and Strat-mann, F.: Measurements of aerosol and CCN properties in theMackenzie River delta (Canadian Arctic) during spring–summertransition in May 2014, Atmos. Chem. Phys., 18, 4477-4496,https://doi.org/10.5194/acp-18-4477-2018, 2018.
Hiranuma, N., Augustin-Bauditz, S., Bingemer, H., Budke, C., Cur-tius, J., Danielczok, A., Diehl, K., Dreischmeier, K., Ebert, M.,Frank, F., Hoffmann, N., Kandler, K., Kiselev, A., Koop, T., Leis-ner, T., Möhler, O., Nillius, B., Peckhaus, A., Rose, D., Wein-bruch, S., Wex, H., Boose, Y., DeMott, P. J., Hader, J. D., Hill,T. C. J., Kanji, Z. A., Kulkarni, G., Levin, E. J. T., McCluskey,C. S., Murakami, M., Murray, B. J., Niedermeier, D., Petters, M.D., O’Sullivan, D., Saito, A., Schill, G. P., Tajiri, T., Tolbert, M.A., Welti, A., Whale, T. F., Wright, T. P., and Yamashita, K.: Acomprehensive laboratory study on the immersion freezing be-havior of illite NX particles: a comparison of 17 ice nucleationmeasurement techniques, Atmos. Chem. Phys., 15, 2489–2518,https://doi.org/10.5194/acp-15-2489-2015, 2015.
Hoppel, W., Frick, G., and Larson, R.: Effect of nonprecip-itating clouds on the aerosol size distribution in the ma-rine boundary layer, Geophys. Res. Lett., 13, 125–128,https://doi.org/10.1029/GL013i002p00125, 1986.
Hudda, N. and Fruin, S. A.: International Airport Impacts to AirQuality: Size and Related Properties of Large Increases in Ultra-fine Particle Number Concentrations, Environ. Sci. Technol., 50,3362–3370, https://doi.org/10.1021/acs.est.5b05313, 2016.
Jasinski, R. and Przylebska, K.: Analysis of the particle sizedistribution near the civil airport runway, IOP ConferenceSeries: Materials Science and Engineering, 421, 042030,https://doi.org/10.1088/1757-899x/421/4/042030, 2018.
Kalivitis, N., Kerminen, V.-M., Kouvarakis, G., Stavroulas, I.,Bougiatioti, A., Nenes, A., Manninen, H. E., Petäjä, T., Kul-mala, M., and Mihalopoulos, N.: Atmospheric new particleformation as a source of CCN in the eastern Mediterraneanmarine boundary layer, Atmos. Chem. Phys., 15, 9203–9215,https://doi.org/10.5194/acp-15-9203-2015, 2015.
Kandler, K., Schneiders, K., Ebert, M., Hartmann, M., Wein-bruch, S., Prass, M., and Pöhlker, C.: Composition and mix-ing state of atmospheric aerosols determined by electron mi-croscopy: method development and application to aged Saharandust deposition in the Caribbean boundary layer, Atmos. Chem.Phys., 18, 13429–13455, https://doi.org/10.5194/acp-18-13429-2018, 2018.
Kanji, Z. A., Ladino, L. A., Wex, H., Boose, Y., Burkert-Kohn, M., Cziczo, D. J., and Krämer, M.: Overviewof Ice Nucleating Particles, Meteor. Mon., 58, 1.1–1.33,https://doi.org/10.1175/amsmonographs-d-16-0006.1, 2017.
Köhler, H.: The nucleus in and the growth of hygroscopic droplets,T. Faraday Soc., 32, 1152–1161, 1936.
Kristensen, T. B., Müller, T., Kandler, K., Benker, N., Hartmann,M., Prospero, J. M., Wiedensohler, A., and Stratmann, F.: Prop-erties of cloud condensation nuclei (CCN) in the trade windmarine boundary layer of the western North Atlantic, Atmos.Chem. Phys., 16, 2675–2688, https://doi.org/10.5194/acp-16-2675-2016, 2016.
Lelieveld, J., Berresheim, H., Borrmann, S., Crutzen, P. J., Den-tener, F. J., Fischer, H., Feichter, J., Flatau, P. J., Heland,J., Holzinger, R., Korrmann, R., Lawrence, M. G., Levin, Z.,Markowicz, K. M., Mihalopoulos, N., Minikin, A., Ramanathan,V., de Reus, M., Roelofs, G. J., Scheeren, H. A., Sciare, J.,Schlager, H., Schultz, M., Siegmund, P., Steil, B., Stephanou,E. G., Stier, P., Traub, M., Warneke, C., Williams, J., and Ziereis,H.: Global Air Pollution Crossroads over the Mediterranean, Sci-ence, 298, 794–799, https://doi.org/10.1126/science.1075457,2002.
Mallet, M., Dulac, F., Formenti, P., Nabat, P., Sciare, J., Roberts,G., Pelon, J., Ancellet, G., Tanré, D., Parol, F., Denjean, C.,Brogniez, G., di Sarra, A., Alados-Arboledas, L., Arndt, J., Au-riol, F., Blarel, L., Bourrianne, T., Chazette, P., Chevaillier, S.,Claeys, M., D’Anna, B., Derimian, Y., Desboeufs, K., Di Iorio,T., Doussin, J.-F., Durand, P., Féron, A., Freney, E., Gaimoz, C.,Goloub, P., Gómez-Amo, J. L., Granados-Muñoz, M. J., Grand,N., Hamonou, E., Jankowiak, I., Jeannot, M., Léon, J.-F., Maillé,M., Mailler, S., Meloni, D., Menut, L., Momboisse, G., Nico-las, J., Podvin, T., Pont, V., Rea, G., Renard, J.-B., Roblou,L., Schepanski, K., Schwarzenboeck, A., Sellegri, K., Sicard,M., Solmon, F., Somot, S., Torres, B., Totems, J., Triquet, S.,Verdier, N., Verwaerde, C., Waquet, F., Wenger, J., and Zapf,P.: Overview of the Chemistry-Aerosol Mediterranean Exper-iment/Aerosol Direct Radiative Forcing on the MediterraneanClimate (ChArMEx/ADRIMED) summer 2013 campaign, At-mos. Chem. Phys., 16, 455–504, https://doi.org/10.5194/acp-16-455-2016, 2016.
Mamouri, R.-E., Ansmann, A., Nisantzi, A., Solomos, S., Kallos,G., and Hadjimitsis, D. G.: Extreme dust storm over the easternMediterranean in September 2015: satellite, lidar, and surface ob-servations in the Cyprus region, Atmos. Chem. Phys., 16, 13711–13724, https://doi.org/10.5194/acp-16-13711-2016, 2016.
Niemand, M., Möhler, O., Vogel, B., Vogel, H., Hoose, C., Con-nolly, P., Klein, H., Bingemer, H., DeMott, P., Skrotzki, J., andLeisner, T.: A Particle-Surface-Area-Based Parameterization ofImmersion Freezing on Desert Dust Particles, J. Atmos. Sci., 69,3077–3092, https://doi.org/10.1175/jas-d-11-0249.1, 2012.
O’Sullivan, D., Adams, M. P., Tarn, M. D., Harrison, A. D.,Vergara-Temprado, J., Porter, G. C. E., Holden, M. A., Sanchez-
Atmos. Chem. Phys., 19, 10883–10900, 2019 www.atmos-chem-phys.net/19/10883/2019/
X. Gong et al.: Cloud condensation nuclei and ice-nucleating particles in the eastern Mediterranean 10899
Marroquin, A., Carotenuto, F., Whale, T. F., McQuaid, J. B.,Walshaw, R., Hedges, D. H. P., Burke, I. T., Cui, Z., and Mur-ray, B. J.: Contributions of biogenic material to the atmosphericice-nucleating particle population in North Western Europe, Sci.Rep.-UK, 8, 13821, https://doi.org/10.1038/s41598-018-31981-7, 2018.
Ott, D. K. and Peters, T. M.: A Shelter to Protect a Passive Sam-pler for Coarse Particulate Matter, PM10−2.5, Aerosol Sci. Tech-nol., 42, 299–309, https://doi.org/10.1080/02786820802054236,2008.
Ott, W. R.: A Physical Explanation of the Lognormality of PollutantConcentrations, J. Air Waste Manage. Assoc., 40, 1378–1383,https://doi.org/10.1080/10473289.1990.10466789, 1990.
Pace, G., Meloni, D., and Di Sarra, A.: Forest fire aerosol overthe Mediterranean basin during summer 2003, J. Geophys. Res.-Atmos., 110, https://doi.org/10.1029/2005JD005986, 2005.
Petters, M. D. and Kreidenweis, S. M.: A single parameterrepresentation of hygroscopic growth and cloud condensa-tion nucleus activity, Atmos. Chem. Phys., 7, 1961–1971,https://doi.org/10.5194/acp-7-1961-2007, 2007.
Pfeifer, S., Müller, T., Weinhold, K., Zikova, N., Martins dosSantos, S., Marinoni, A., Bischof, O. F., Kykal, C., Ries,L., Meinhardt, F., Aalto, P., Mihalopoulos, N., and Wieden-sohler, A.: Intercomparison of 15 aerodynamic particle sizespectrometers (APS 3321): uncertainties in particle sizing andnumber size distribution, Atmos. Meas. Tech., 9, 1545–1551,https://doi.org/10.5194/amt-9-1545-2016, 2016.
Piazzola, J. and Despiau, S.: Contribution of marine aerosolsin the particle size distributions observed in Mediter-ranean coastal zone, Atmos. Environ., 31, 2991–3009,https://doi.org/10.1016/S1352-2310(97)00088-5, 1997.
Prather, K. A., Bertram, T. H., Grassian, V. H., Deane, G. B.,Stokes, M. D., DeMott, P. J., Aluwihare, L. I., Palenik, B. P.,Azam, F., Seinfeld, J. H., Moffet, R. C., Molina, M. J., Cappa,C. D., Geiger, F. M., Roberts, G. C., Russell, L. M., Ault,A. P., Baltrusaitis, J., Collins, D. B., Corrigan, C. E., Cuadra-Rodriguez, L. A., Ebben, C. J., Forestieri, S. D., Guasco,T. L., Hersey, S. P., Kim, M. J., Lambert, W. F., Modini,R. L., Mui, W., Pedler, B. E., Ruppel, M. J., Ryder, O. S.,Schoepp, N. G., Sullivan, R. C., and Zhao, D.: Bringing theocean into the laboratory to probe the chemical complexity ofsea spray aerosol, P. Natl. Acad. Sci. USA, 110, 7550–7555,https://doi.org/10.1073/pnas.1300262110, 2013.
Price, H. C., Baustian, K. J., McQuaid, J. B., Blyth, A., Bower,K. N., Choularton, T., Cotton, R. J., Cui, Z., Field, P. R.,Gallagher, M., Hawker, R., Merrington, A., Miltenberger, A.,Neely III, R. R., Parker, S. T., Rosenberg, P. D., Taylor, J. W.,Trembath, J., Vergara-Temprado, J., Whale, T. F., Wilson, T. W.,Young, G., and Murray, B. J.: Atmospheric Ice-Nucleating Par-ticles in the Dusty Tropical Atlantic, J. Geophys. Res.-Atmos.,123, 2175–2193, https://doi.org/10.1002/2017JD027560, 2018.
Pringle, K. J., Tost, H., Pozzer, A., Pöschl, U., and Lelieveld, J.:Global distribution of the effective aerosol hygroscopicity pa-rameter for CCN activation, Atmos. Chem. Phys., 10, 5241–5255, https://doi.org/10.5194/acp-10-5241-2010, 2010.
Pruppacher, H. and Klett, J.: Microphysics of Clouds and Precipi-tation, vol. 18, Springer Science & Business Media, Dordrecht,2010.
Rinaldi, M., Santachiara, G., Nicosia, A., Piazza, M., Decesari,S., Gilardoni, S., Paglione, M., Cristofanelli, P., Marinoni, A.,Bonasoni, P., and Belosi, F.: Atmospheric Ice Nucleating Par-ticle measurements at the high mountain observatory Mt. Ci-mone (2165 m a.s.l., Italy), Atmos. Environ., 171, 173–180,https://doi.org/10.1016/j.atmosenv.2017.10.027, 2017.
Roberts, G. C. and Nenes, A.: A Continuous-Flow Stream-wise Thermal-Gradient CCN Chamber for AtmosphericMeasurements, Aerosol Sci. Technol., 39, 206–221,https://doi.org/10.1080/027868290913988, 2005.
Rodríguez, S., Querol, X., Alastuey, A., and Plana, F.:Sources and processes affecting levels and compositionof atmospheric aerosol in the western Mediterranean,J. Geophys. Res.-Atmos., 107, AAC 12-1–AAC 12-14,https://doi.org/10.1029/2001JD001488, 2002.
Rolph, G.: Real-time environmental applications and display sys-tem (READY) website, available at: https://www.ready.noaa.gov/index.php (last access: 15 August 2019), 2003.
Rose, D., Gunthe, S. S., Mikhailov, E., Frank, G. P., Dusek, U.,Andreae, M. O., and Pöschl, U.: Calibration and measurementuncertainties of a continuous-flow cloud condensation nucleicounter (DMT-CCNC): CCN activation of ammonium sulfateand sodium chloride aerosol particles in theory and experiment,Atmos. Chem. Phys., 8, 1153–1179, https://doi.org/10.5194/acp-8-1153-2008, 2008.
Salameh, T., Drobinski, P., Menut, L., Bessagnet, B., Flamant,C., Hodzic, A., and Vautard, R.: Aerosol distribution over thewestern Mediterranean basin during a Tramontane/Mistral event,Ann. Geophys., 25, 2271–2291, https://doi.org/10.5194/angeo-25-2271-2007, 2007.
Sandrini, S., van Pinxteren, D., Giulianelli, L., Herrmann, H.,Poulain, L., Facchini, M. C., Gilardoni, S., Rinaldi, M., Paglione,M., Turpin, B. J., Pollini, F., Bucci, S., Zanca, N., and Dece-sari, S.: Size-resolved aerosol composition at an urban and arural site in the Po Valley in summertime: implications forsecondary aerosol formation, Atmos. Chem. Phys., 16, 10879–10897, https://doi.org/10.5194/acp-16-10879-2016, 2016.
Schladitz, A., Müller, T., Nowak, A., Kandler, K., Lieke,K., Massling, A., and Wiedensohler, A.: In situ aerosolcharacterization at Cape Verde, Tellus B, 63, 531–548,https://doi.org/10.1111/j.1600-0889.2011.00569.x, 2011.
Schrod, J., Weber, D., Drücke, J., Keleshis, C., Pikridas, M., Ebert,M., Cvetkovic, B., Nickovic, S., Marinou, E., Baars, H., Ans-mann, A., Vrekoussis, M., Mihalopoulos, N., Sciare, J., Curtius,J., and Bingemer, H. G.: Ice nucleating particles over the East-ern Mediterranean measured by unmanned aircraft systems, At-mos. Chem. Phys., 17, 4817–4835, https://doi.org/10.5194/acp-17-4817-2017, 2017.
Sciare, J., Bardouki, H., Moulin, C., and Mihalopoulos, N.: Aerosolsources and their contribution to the chemical composition ofaerosols in the Eastern Mediterranean Sea during summertime,Atmos. Chem. Phys., 3, 291–302, https://doi.org/10.5194/acp-3-291-2003, 2003.
Sciare, J., Oikonomou, K., Favez, O., Liakakou, E., Markaki, Z.,Cachier, H., and Mihalopoulos, N.: Long-term measurements ofcarbonaceous aerosols in the Eastern Mediterranean: evidence oflong-range transport of biomass burning, Atmos. Chem. Phys.,8, 5551–5563, https://doi.org/10.5194/acp-8-5551-2008, 2008.
www.atmos-chem-phys.net/19/10883/2019/ Atmos. Chem. Phys., 19, 10883–10900, 2019
10900 X. Gong et al.: Cloud condensation nuclei and ice-nucleating particles in the eastern Mediterranean
Smoydzin, L., Teller, A., Tost, H., Fnais, M., and Lelieveld,J.: Impact of mineral dust on cloud formation in a Saha-ran outflow region, Atmos. Chem. Phys., 12, 11383–11393,https://doi.org/10.5194/acp-12-11383-2012, 2012.
Stein, A. F., Draxler, R. R., Rolph, G. D., Stunder, B. J. B., Cohen,M. D., and Ngan, F.: NOAA’s HYSPLIT Atmospheric Transportand Dispersion Modeling System, B. Am. Meteorol. Soc., 96,2059–2077, https://doi.org/10.1175/bams-d-14-00110.1, 2015.
Tobo, Y., Prenni, A. J., DeMott, P. J., Huffman, J. A., McCluskey,C. S., Tian, G., Pöhlker, C., Pöschl, U., and Kreidenweis, S. M.:Biological aerosol particles as a key determinant of ice nucleipopulations in a forest ecosystem, J. Geophys. Res.-Atmos., 118,10100–10110, https://doi.org/10.1002/jgrd.50801, 2013.
Ullrich, R., Hoose, C., Möhler, O., Niemand, M., Wagner, R., Höh-ler, K., Hiranuma, N., Saathoff, H., and Leisner, T.: A NewIce Nucleation Active Site Parameterization for Desert Dust andSoot, J. Atmos. Sci., 74, 699–717, https://doi.org/10.1175/jas-d-16-0074.1, 2017.
Vali, G.: Quantitative Evaluation of Experimental Results anthe Heterogeneous Freezing Nucleation of Supercooled Liq-uids, J. Atmos. Sci., 28, 402–409, https://doi.org/10.1175/1520-0469(1971)028<0402:qeoera>2.0.co;2, 1971.
von der Weiden, S.-L., Drewnick, F., and Borrmann, S.: ParticleLoss Calculator – a new software tool for the assessment of theperformance of aerosol inlet systems, Atmos. Meas. Tech., 2,479–494, https://doi.org/10.5194/amt-2-479-2009, 2009.
Welti, A., Müller, K., Fleming, Z. L., and Stratmann, F.: Con-centration and variability of ice nuclei in the subtropical mar-itime boundary layer, Atmos. Chem. Phys., 18, 5307–5320,https://doi.org/10.5194/acp-18-5307-2018, 2018.
Wiedensohler, A.: An approximation of the bipolar charge distribu-tion for particles in the submicron size range, J. Aerosol Sci., 19,387–389, https://doi.org/10.1016/0021-8502(88)90278-9, 1988.
Wiedensohler, A., Birmili, W., Nowak, A., Sonntag, A., Weinhold,K., Merkel, M., Wehner, B., Tuch, T., Pfeifer, S., Fiebig, M.,Fjäraa, A. M., Asmi, E., Sellegri, K., Depuy, R., Venzac, H., Vil-lani, P., Laj, P., Aalto, P., Ogren, J. A., Swietlicki, E., Williams,P., Roldin, P., Quincey, P., Hüglin, C., Fierz-Schmidhauser, R.,Gysel, M., Weingartner, E., Riccobono, F., Santos, S., Grün-ing, C., Faloon, K., Beddows, D., Harrison, R., Monahan, C.,Jennings, S. G., O’Dowd, C. D., Marinoni, A., Horn, H.-G.,Keck, L., Jiang, J., Scheckman, J., McMurry, P. H., Deng, Z.,Zhao, C. S., Moerman, M., Henzing, B., de Leeuw, G., Löschau,G., and Bastian, S.: Mobility particle size spectrometers: har-monization of technical standards and data structure to facili-tate high quality long-term observations of atmospheric parti-cle number size distributions, Atmos. Meas. Tech., 5, 657–685,https://doi.org/10.5194/amt-5-657-2012, 2012.
Wiedensohler, A., Wiesner, A., Weinhold, K., Birmili, W., Her-mann, M., Merkel, M., Müller, T., Pfeifer, S., Schmidt, A., Tuch,T., Velarde, F., Quincey, P., Seeger, S., and Nowak, A.: Mo-bility particle size spectrometers: Calibration procedures andmeasurement uncertainties, Aerosol Sci. Technol., 52, 146–164,https://doi.org/10.1080/02786826.2017.1387229, 2018.
Atmos. Chem. Phys., 19, 10883–10900, 2019 www.atmos-chem-phys.net/19/10883/2019/