Embed Size (px)
Citation preview
CHARACTERIZATION OF 1, 2-DCA DEGRADING Ancylobacter aquaticus STRAINS
ISOLATED IN SOUTH AFRICA
BY
Thiloshini Pillay
Submitted in fulfilment of the academic requirements for the degree of Master of Science (MSc) in
the Discipline of Microbiology, School of Biochemistry, Genetics and Microbiology, Faculty of
Science and Agriculture at the University of KwaZulu-Natal (Westville Campus).
As the candidate’s supervisor, I have approved this dissertation for submission.
Signed: Name: Date:
PREFACE
The experimental work described in this dissertation was carried out in the School of Biochemistry,
Genetics and Microbiology; University of KwaZulu-Natal (Westville Campus), Durban, South Africa
from May 2007 to April 2010, under the supervision of Professor B. Pillay and the co-supervision of Dr.
A. O. Olaniran.
These studies represent original work by the author and have not otherwise been submitted in any form
for any degree or diploma to any tertiary institution. Where use has been made of the work of others it is
duly acknowledged in the text.
FACULTY OF SCIENCE AND AGRICULTURE
DECLARATION 1 – PLAGIARISM
I, ……………………………………….……………………………………………………...., declare that
1. The research reported in this dissertation, except where otherwise indicated, is my original
research.
2. This dissertation has not been submitted for any degree or examination at any other university.
3. This dissertation does not contain other persons’ data, pictures, graphs or other information,
unless specifically acknowledged as being sourced from other persons.
4. This dissertation does not contain other persons' writing, unless specifically acknowledged as
being sourced from other researchers. Where other written sources have been quoted, then:
a. Their words have been re-written but the general information attributed to them has been
referenced
b. Where their exact words have been used, then their writing has been placed in italics and
inside quotation marks, and referenced.
5. This dissertation does not contain text, graphics or tables copied and pasted from the Internet,
unless specifically acknowledged, and the source being detailed in the thesis and in the
References sections.
Signed
……………………………………………………………………………
Declaration Plagiarism 22/05/08 FHDR Approved
FACULTY OF SCIENCE AND AGRICULTURE
DECLARATION 2 – PUBLICATIONS
DETAILS OF CONTRIBUTION TO PUBLICATIONS that form part and/or include research presented
in this dissertation (include publications in preparation, submitted, in press and published and give details
of the contributions of each author to the experimental work and writing of each publication)
Publication 1
NOT APPLICABLE
Publication 2
Publication 3
Etc.
Signed:
……………………………………………………………………………
Declaration Publications FHDR 22/05/08 Approved
i
ACKNOWLEDGEMENTS
The author records her appreciation to the following people:
Prof B. Pillay for his supervision during the course of this study;
Dr. A. Govender for his guidance and contribution throughout the study;
My dearest friends (Desiree Alvika Rajpal, Dr. R. Shaik, Charlene Singh) for their
assistance, guidance, constant support, words of encouragement and much appreciated
advice in times of despair;
Dr. A. O. Olaniran for his support and assistance;
The staff and postgraduate students at the Discipline of Microbiology, University of
KwaZulu-Natal (Westville Campus) for their support and assistance;
LIFElab and DAAD for financial assistance;
My cherished friends Ammeshnie Govender, Dhevashnee Pillay and their families for the
constant support and words of encouragement provided throughout the course of this
study;
Most importantly, my family for their immense patience, support and encouragement
throughout this study.
CHARACTERIZATION OF 1, 2-DCA DEGRADING
Ancylobacter aquaticus STRAINS ISOLATED IN
SOUTH AFRICA
THILOSHINI PILLAY
2011
TABLE OF CONTENTS
PAGE
ACKNOWLEDGEMENTS i
ABSTRACT ii
LIST OF FIGURES iv
LIST OF TABLES vi
CHAPTER ONE: INTRODUCTION AND LITERATURE REVIEW 1
1. 1 INTRODUCTION 1
1.2 CHLORINATED ALIPHATIC HYDROCARBONS (CAHS) 2
1.2.1 Properties and uses of CAHs 2
1.2.2 Presence and persistence of CAHs in the environment 2
1.2.3 Biodegradation of CAHs 4
1.3 DEHALOGENASES: TYPES AND MECHANISMS 6
1.3.1 Hydrolytic dehalogenation 6
1.3.2 Oxygenolytic dehalogenation 7
1.3.3 Thiolytic dehalogenation 7
1.3.4 Reductive dehalogenation 8
1.3.5 Haloalcohol dehalogenation 10
1.3.6 Dehydrohalogenation 10
1.3.7 Hydration 11
1.4 1, 2-DICHLOROETHANE (1,2-DCA) 12
1.4.1 Properties and uses of 1,2-dichloroethane 12
1.4.2 Impact of 1,2-DCA on the environment 12
1.4.3 Impact of 1,2-DCA on human health 13
1.4.4 Microbial degradation of 1,2-DCA 13
1.4.4.1 Anaerobic conditions 15
1.4.4.2 Aerobic conditions 15
1.5 ENZYMES INVOLVED IN THE 1,2-DCA DEGRADATION
PATHWAY 17
1.5.1 Haloalkane dehalogenases 17
1.5.1.1 Types of haloalkane dehalogenases 17
1.5.1.2 Mechanism and structure of haloalkane dehalogenases 20
1.5.2 Alcohol dehydrogenase 22
1.5.3 Chloroacetaldehyde (CAA) dehydrogenase 22
1.5.4 Haloacid (HA) dehalogenases 23
1.5.4.1 Types of 2-haloacid dehalogenases 23
1.5.4.2 Mechanism and structure of the 2-haloacid dehalogenase 23
1.6 BIOREMEDIATION 25
1.6.1 Advantages of bioremediation 25
1.6.2 Disadvantages of bioremediation 26
1.7 PURPOSE OF STUDY 26
1.8 HYPOTHESIS 28
1.9 OBJECTIVES 28
1.10 AIMS 29
CHAPTER TWO: MATERIALS AND METHODS 30
2.1 GROWTH AND MAINTENANCE OF BACTERIAL CULTURES 30
2.2 STANDARDIZATION OF BACTERIAL STRAINS FOR
INOCULATION INTO GROWTH MEDIA 30
2.3 GROWTH MEASUREMENT STUDIES OF Ancylobacter
aquaticus ISOLATES ON VARIOUS HALOGENATED
COMPOUNDS 31
2.4 DETERMINATION OF FREE HALIDE RELEASED
DURING DEGRADATION OF HALOGENATED COMPOUNDS 32
2.5 MEASUREMENT OF DEHALOGENASE ENZYME ACTIVITIES 32
2.5.1 Preparation of crude extracts 32
2.5.2 Dehalogenase enzyme assays 32
2.6 ISOLATION OF TOTAL DNA 34
2.7 RESTRICTION ENZYME DIGESTION 34
2.8 PCR AMPLIFICATION OF ALDEHYDE DEHYDROGENASE
(aldB) AND HALOACID DEHALOGENASE (dhlB) ENCODING
GENES PRESENT IN Xanthobacter autotrophicus GJ10 35
2.9 SOUTHERN HYBRIDIZATION 36
2.10 CLONING AND SEQUENCING OF THE aldB AND dhlB GENES 36
2.10.1 Purification of DNA fragments 36
2.10.2 Preparation of electrocompetent E.coli cells 37
2.10.3 Isolation and restriction of pBluescript II SK 36
2.10.4 Ligation of inserts to plasmid vector 38
2.10.5 Transformation of E. coli DH5α’F 38
2.10.6 Plasmid DNA isolation 38
CHAPTER THREE: RESULTS
3.1 DEGRADATION OF HALOGENATED ALIPHATIC
HYDROCARBONS 40
3.1.1 Aerobic utilization of 1,2-DCA 40
3.1.1.1 Growth pattern of Ancylobacter strains in minimal
media supplemented with either yeast extract or vitamins 40
3.1.1.2 Chloride release during growth of the bacterial isolates
in 1,2-DCA 43
3.1.2 Aerobic utilization of MCA by the bacterial isolates
monitored in minimal media supplemented with
vitamins 45
3.1.2.1 Growth pattern of bacterial isolates on MCA 45
3.1.2.2 Chloride release during growth in MCA 47
3.1.3 Growth of Ancylobacter aquaticus strains on other halogenated
aliphatic compounds 50
3.2 DEHALOGENASE ACTIVITY OF BACTERIAL ISOLATES 51
3.2.1 Effect of pH and temperature on dehalogenase activity 51
3.2.2 Dehalogenase activities of crude extract on various
halogenated compounds 54
3.3 DETECTION OF HALOACID DEHALOGENASE
AND CHLOROACETALDEHYDE DEHYDROGENASE ENCODING
GENES IN Ancylobacter ISOLATES 55
3.3.1 PCR amplification of aldB and dhlB encoding genes from
Xanthobacter autotrophicus GJ10 55
3.3.2 Detection of the haloacid dehalogenase (HA) encoding
genes in Ancylobacter species 55
3.3.3 Detection of CAA dehydrogenase encoding genes in
Ancylobacter strains 59
3.4 CLONING OF THE HA DEHALOGENASE AND
CAA DEHYDROGENASE GENES 62
CHAPTER FOUR: DISCUSSION 63
CHAPTER FIVE: CONCLUDING REMARKS 75
5.1 THE RESEARCH IN PERSPECTIVE 75
5.2 POTENTIAL FOR FUTURE DEVELOPMENT OF THE STUDY 79
REFERENCES 81
APPENDIX I 94
iv
LIST OF FIGURES
PAGE
Figure 1.1: Hydrolytic cleavage of the carbon-chlorine by hydrolytic dehalogenases (Van Pee and
Unversucht, 2003) 7
Figure 1.2: Thiolytic dehalogenation with glutathione S-transferase (van Pee and Unversucht, 2003) 8
Figure 1.3: Reductive dehalogenation of tetrachlorohydroquinone under aerobic conditions catalyzed by
a glutathione transferase (van Pee and Unversucht, 2003) 9
Figure 1.4: Reductive dehalogenation of PCE under anaerobic conditions (van Pee and Unversucht, 2003) 9
Figure 1.5: Thiolytic nucleophilic substitution of halogen catalyzed haloalcohol dehalogenase (Van Pee
and Unversucht, 2003) 10
Figure 1.6: Dehalogenation of lindane catalyzed by dehydrohalogenases (van Pee and Unversucht, 2003) 11
Figure 1.7: Dehalogenation by the addition of a water molecule (Van Pee and Unversucht, 2003) 11
Figure 1.8: Catabolic route for 1,2-dichloroethane of Xanthobacter autotrophicus GJ10 and some
Ancylobacter aquaticus species (Janssen et al., 1989) 16
Figure 1.9: Substrates of haloalkane dehalogenases from (a) Xanthobacter autotrophicus (DhlA), (b)
Rhodococcus erythropolis (DhaA), and (c) Spingomonas paucimobilis (LinB) (Negri et al.,
2007) 19
Figure 1.10: Mechanism of haloalkane dehalogenase (Copley, 1996) 20
Figure 1.11: General topology of the haloalkane dehalogenase (Janssen, 2004) 21
Figure 1.12: Reactions catalyzed by 2-haloacid dehalogenases. (A) L-2-Haloacid dehalogenase (B) D-2
haloacid dehalogenase. R indicates an alkyl group (Kurihara et al., 2000) 24
Figure 3.1: Growth pattern of bacterial isolates using 1,2-DCA as sole carbon source supplemented with
yeast extract 41
Figure 3.2: Growth pattern of bacterial isolates using 1,2-DCA as sole carbon source supplemented with
vitamins 42
Figure 3.3: Chloride concentration during growth with 1,2-DCA as sole carbon source supplemented with
yeast extract 44
Figure 3.4: Chloride concentration during growth with 1,2-DCA as sole carbon source supplemented with
vitamins 45
Figure 3.5: Growth pattern of bacterial isolates with MCA as sole carbon source in MSM containing
vitamins at pH 7 46
Figure 3.6: Growth pattern of isolates with MCA sole carbon source in MSM containing vitamins at pH 9 47
Figure 3.7: Concentration of chloride released during growth with MCA as sole carbon source in MSM
containing vitamins at pH7 49
Figure 3.8: Concentration of chloride released during growth on MCA in MSM containing vitamins at
v
pH 9 50
Figure 3.9: PCR amplification of dhlB and aldB gene probes. Lanes 1 and 2: aldB gene; lanes 3 and 4:
dhlB gene, M: GeneRuler Ladder Mix 55
Figure 3.10: A. ) EcoRI digested total genomic DNA of all isolates B. )Southern hybridization with
digoxygenin labeled dhlB probe and EcoRI digested total DNA (Lane 1-8: X. autotrophicus
GJ10, A. aquaticus AD25, A. aquaticus AD27, Ancylobacter strain DH12, Ancylobacter strain
DH5, Ancylobacter strain DH2, Ancylobacter strain UV6 and Ancylobacter strain UV5) 56
Figure 3.11: A.) BamHI digested total DNA of all isolates B.) Southern hybridization with digoxygenin
labeled dhlB probe and BamHI digested total DNA (Lane 1-8: X. autotrophicus GJ10, A.
aquaticus AD25, A. aquaticus AD27, Ancylobacter strain DH12, Ancylobacter strain DH5,
Ancylobacter strain DH2, Ancylobacter strain UV6 and Ancylobacter strain UV5) 57 Figure 3.12: A.) HindIII digested total DNA of all isolates. B.) Southern hybridization with digoxygenin
labeled dhlB probe and HindIII digested total DNA (Lane 1-8: X. autotrophicus GJ10, A.
aquaticus AD25, A. aquaticus AD27, Ancylobacter aquaticus DH12, Ancylobacter aquaticus
DH5, Ancylobacter aquaticus DH2, Ancylobacter aquaticus UV6 and Ancylobacter aquaticus
UV5) 58
Figure 3.13: A.) PstI digested total DNA of all isolates. B.) Southern hybridization with digoxygenin
labeled dhlB probe and PstI digested total DNA (Lane 1-8: X. autotrophicus GJ10, A.
aquaticus AD25, A. aquaticus AD27, Ancylobacter aquaticus DH12, Ancylobacter aquaticus
DH5, Ancylobacter aquaticus DH2, Ancylobacter aquaticus UV6 and Ancylobacter aquaticus
UV5) 59
Figure 3.14: A.) EcoRI digested total DNA B.) Southern Hybridization with digoxygenin labeled aldB
probe and EcoRI digested total DNA (Lane 1-8: X. autotrophicus GJ10, A. aquaticus AD25,
A. aquaticus AD27, Ancylobacter aquaticus DH12, Ancylobacter aquaticus DH5,
Ancylobacter aquaticus DH2, Ancylobacter aquaticus UV6 and Ancylobacter aquaticus
UV5) 60
Figure 3.15: A.) PstI digested total DNA B.) Southern hybridization with digoxygenin labeled aldB probe
and PstI digested total DNA (Lane 1-8: X. autotrophicus GJ10, A. aquaticus AD25, A.
aquaticus AD27, Ancylobacter aquaticus DH12, Ancylobacter aquaticus DH5, Ancylobacter
aquaticus DH2, Ancylobacter aquaticus UV6 and Ancylobacter aquaticus UV5) 61
Figure 3.16: A.) HindIII digested total DNA B.) Southern hybridization with digoxygenin labeled aldB
probe and HindIII digested total DNA (Lane 1-8: X. autotrophicus GJ10, A. aquaticus AD25,
A. aquaticus AD27, Ancylobacter aquaticus DH12, Ancylobacter aquaticus DH5,
Ancylobacter aquaticus DH2, Ancylobacter aquaticus UV6 and Ancylobacter aquaticus
UV5) 62
vi
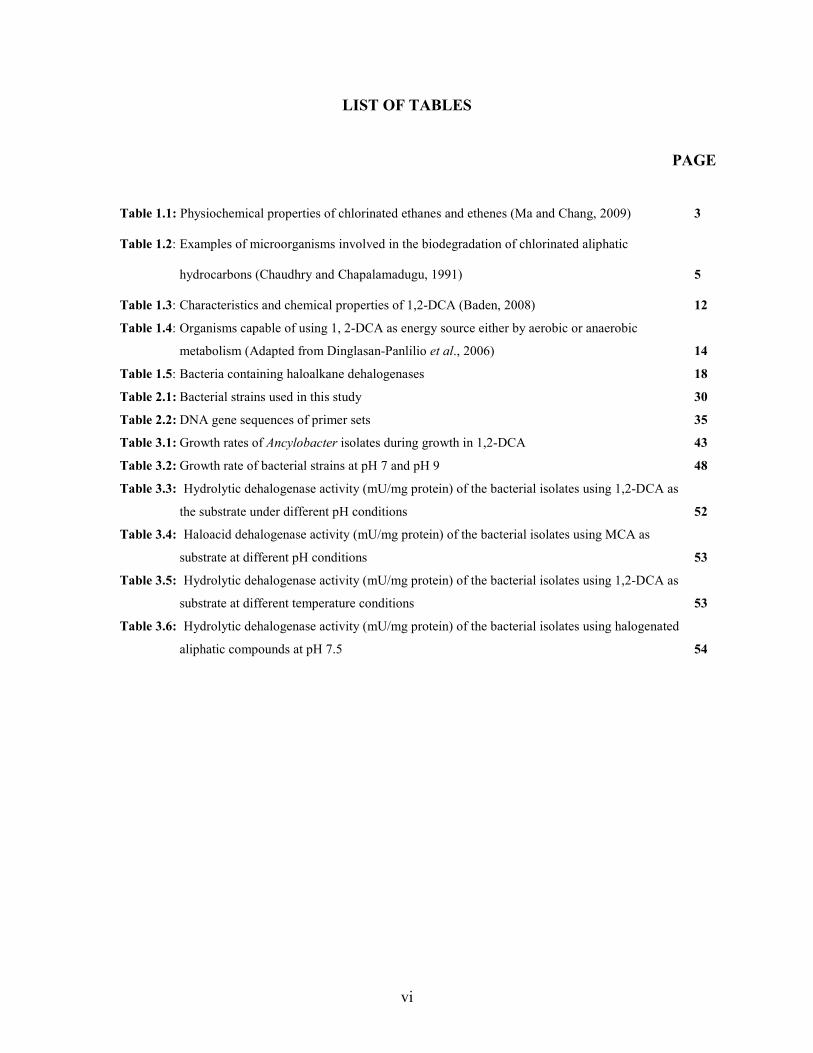
LIST OF TABLES
PAGE
Table 1.1: Physiochemical properties of chlorinated ethanes and ethenes (Ma and Chang, 2009) 3
Table 1.2: Examples of microorganisms involved in the biodegradation of chlorinated aliphatic
hydrocarbons (Chaudhry and Chapalamadugu, 1991) 5
Table 1.3: Characteristics and chemical properties of 1,2-DCA (Baden, 2008) 12
Table 1.4: Organisms capable of using 1, 2-DCA as energy source either by aerobic or anaerobic
metabolism (Adapted from Dinglasan-Panlilio et al., 2006) 14
Table 1.5: Bacteria containing haloalkane dehalogenases 18 Table 2.1: Bacterial strains used in this study 30
Table 2.2: DNA gene sequences of primer sets 35
Table 3.1: Growth rates of Ancylobacter isolates during growth in 1,2-DCA 43
Table 3.2: Growth rate of bacterial strains at pH 7 and pH 9 48
Table 3.3: Hydrolytic dehalogenase activity (mU/mg protein) of the bacterial isolates using 1,2-DCA as
the substrate under different pH conditions 52
Table 3.4: Haloacid dehalogenase activity (mU/mg protein) of the bacterial isolates using MCA as
substrate at different pH conditions 53
Table 3.5: Hydrolytic dehalogenase activity (mU/mg protein) of the bacterial isolates using 1,2-DCA as
substrate at different temperature conditions 53
Table 3.6: Hydrolytic dehalogenase activity (mU/mg protein) of the bacterial isolates using halogenated
aliphatic compounds at pH 7.5 54
ii
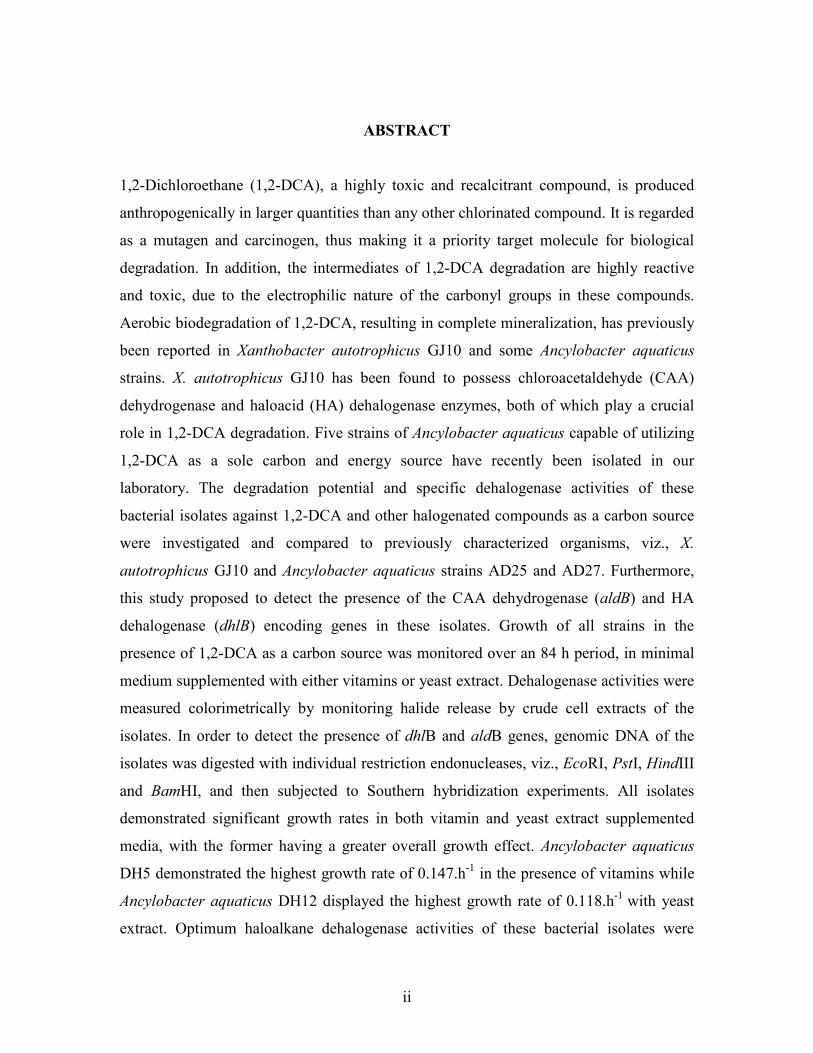
ABSTRACT
1,2-Dichloroethane (1,2-DCA), a highly toxic and recalcitrant compound, is produced
anthropogenically in larger quantities than any other chlorinated compound. It is regarded
as a mutagen and carcinogen, thus making it a priority target molecule for biological
degradation. In addition, the intermediates of 1,2-DCA degradation are highly reactive
and toxic, due to the electrophilic nature of the carbonyl groups in these compounds.
Aerobic biodegradation of 1,2-DCA, resulting in complete mineralization, has previously
been reported in Xanthobacter autotrophicus GJ10 and some Ancylobacter aquaticus
strains. X. autotrophicus GJ10 has been found to possess chloroacetaldehyde (CAA)
dehydrogenase and haloacid (HA) dehalogenase enzymes, both of which play a crucial
role in 1,2-DCA degradation. Five strains of Ancylobacter aquaticus capable of utilizing
1,2-DCA as a sole carbon and energy source have recently been isolated in our
laboratory. The degradation potential and specific dehalogenase activities of these
bacterial isolates against 1,2-DCA and other halogenated compounds as a carbon source
were investigated and compared to previously characterized organisms, viz., X.
autotrophicus GJ10 and Ancylobacter aquaticus strains AD25 and AD27. Furthermore,
this study proposed to detect the presence of the CAA dehydrogenase (aldB) and HA
dehalogenase (dhlB) encoding genes in these isolates. Growth of all strains in the
presence of 1,2-DCA as a carbon source was monitored over an 84 h period, in minimal
medium supplemented with either vitamins or yeast extract. Dehalogenase activities were
measured colorimetrically by monitoring halide release by crude cell extracts of the
isolates. In order to detect the presence of dhlB and aldB genes, genomic DNA of the
isolates was digested with individual restriction endonucleases, viz., EcoRI, PstI, HindIII
and BamHI, and then subjected to Southern hybridization experiments. All isolates
demonstrated significant growth rates in both vitamin and yeast extract supplemented
media, with the former having a greater overall growth effect. Ancylobacter aquaticus
DH5 demonstrated the highest growth rate of 0.147.h-1 in the presence of vitamins while
Ancylobacter aquaticus DH12 displayed the highest growth rate of 0.118.h-1 with yeast
extract. Optimum haloalkane dehalogenase activities of these bacterial isolates were
iii
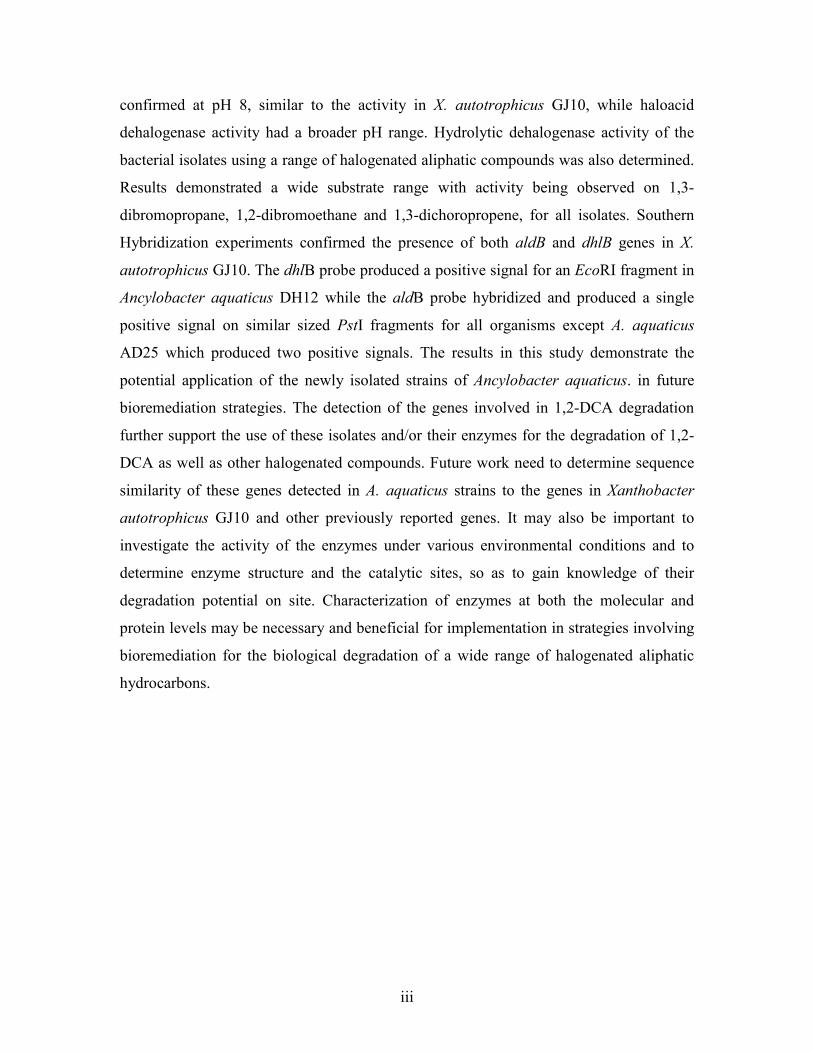
confirmed at pH 8, similar to the activity in X. autotrophicus GJ10, while haloacid
dehalogenase activity had a broader pH range. Hydrolytic dehalogenase activity of the
bacterial isolates using a range of halogenated aliphatic compounds was also determined.
Results demonstrated a wide substrate range with activity being observed on 1,3-
dibromopropane, 1,2-dibromoethane and 1,3-dichoropropene, for all isolates. Southern
Hybridization experiments confirmed the presence of both aldB and dhlB genes in X.
autotrophicus GJ10. The dhlB probe produced a positive signal for an EcoRI fragment in
Ancylobacter aquaticus DH12 while the aldB probe hybridized and produced a single
positive signal on similar sized PstI fragments for all organisms except A. aquaticus
AD25 which produced two positive signals. The results in this study demonstrate the
potential application of the newly isolated strains of Ancylobacter aquaticus. in future
bioremediation strategies. The detection of the genes involved in 1,2-DCA degradation
further support the use of these isolates and/or their enzymes for the degradation of 1,2-
DCA as well as other halogenated compounds. Future work need to determine sequence
similarity of these genes detected in A. aquaticus strains to the genes in Xanthobacter
autotrophicus GJ10 and other previously reported genes. It may also be important to
investigate the activity of the enzymes under various environmental conditions and to
determine enzyme structure and the catalytic sites, so as to gain knowledge of their
degradation potential on site. Characterization of enzymes at both the molecular and
protein levels may be necessary and beneficial for implementation in strategies involving
bioremediation for the biological degradation of a wide range of halogenated aliphatic
hydrocarbons.
1
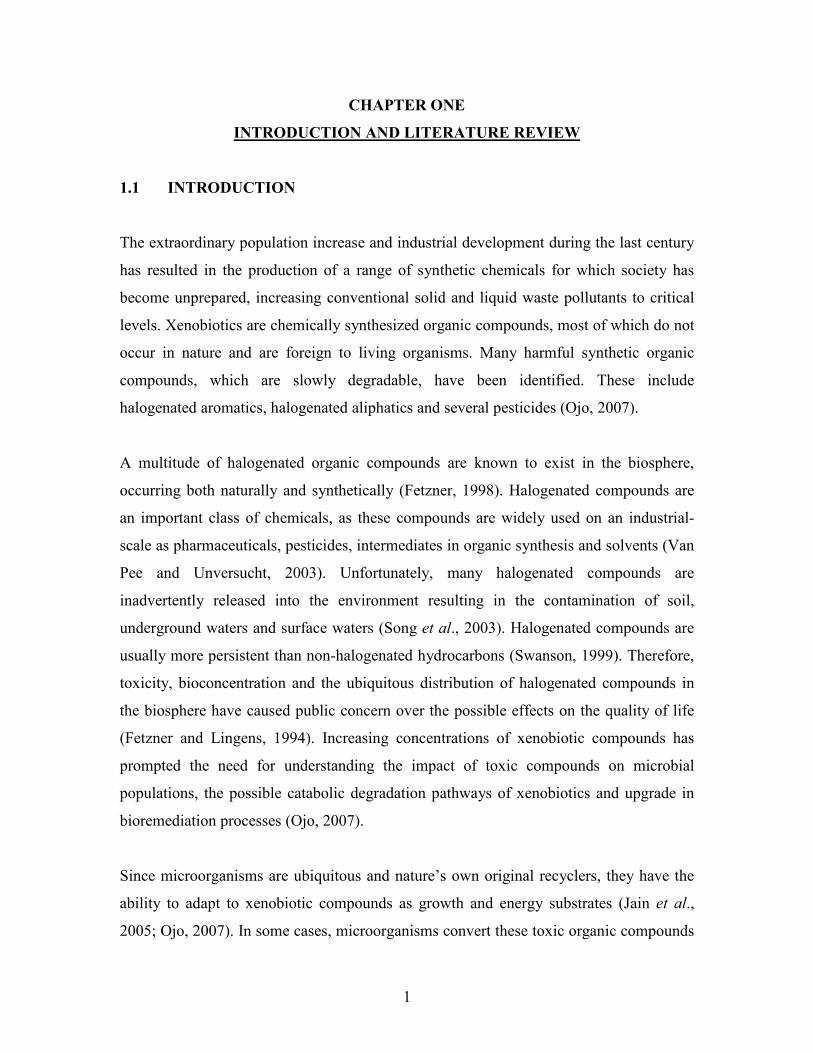
CHAPTER ONE
INTRODUCTION AND LITERATURE REVIEW
1.1 INTRODUCTION
The extraordinary population increase and industrial development during the last century
has resulted in the production of a range of synthetic chemicals for which society has
become unprepared, increasing conventional solid and liquid waste pollutants to critical
levels. Xenobiotics are chemically synthesized organic compounds, most of which do not
occur in nature and are foreign to living organisms. Many harmful synthetic organic
compounds, which are slowly degradable, have been identified. These include
halogenated aromatics, halogenated aliphatics and several pesticides (Ojo, 2007).
A multitude of halogenated organic compounds are known to exist in the biosphere,
occurring both naturally and synthetically (Fetzner, 1998). Halogenated compounds are
an important class of chemicals, as these compounds are widely used on an industrial-
scale as pharmaceuticals, pesticides, intermediates in organic synthesis and solvents (Van
Pee and Unversucht, 2003). Unfortunately, many halogenated compounds are
inadvertently released into the environment resulting in the contamination of soil,
underground waters and surface waters (Song et al., 2003). Halogenated compounds are
usually more persistent than non-halogenated hydrocarbons (Swanson, 1999). Therefore,
toxicity, bioconcentration and the ubiquitous distribution of halogenated compounds in
the biosphere have caused public concern over the possible effects on the quality of life
(Fetzner and Lingens, 1994). Increasing concentrations of xenobiotic compounds has
prompted the need for understanding the impact of toxic compounds on microbial
populations, the possible catabolic degradation pathways of xenobiotics and upgrade in
bioremediation processes (Ojo, 2007).
Since microorganisms are ubiquitous and nature’s own original recyclers, they have the
ability to adapt to xenobiotic compounds as growth and energy substrates (Jain et al.,
2005; Ojo, 2007). In some cases, microorganisms convert these toxic organic compounds
2
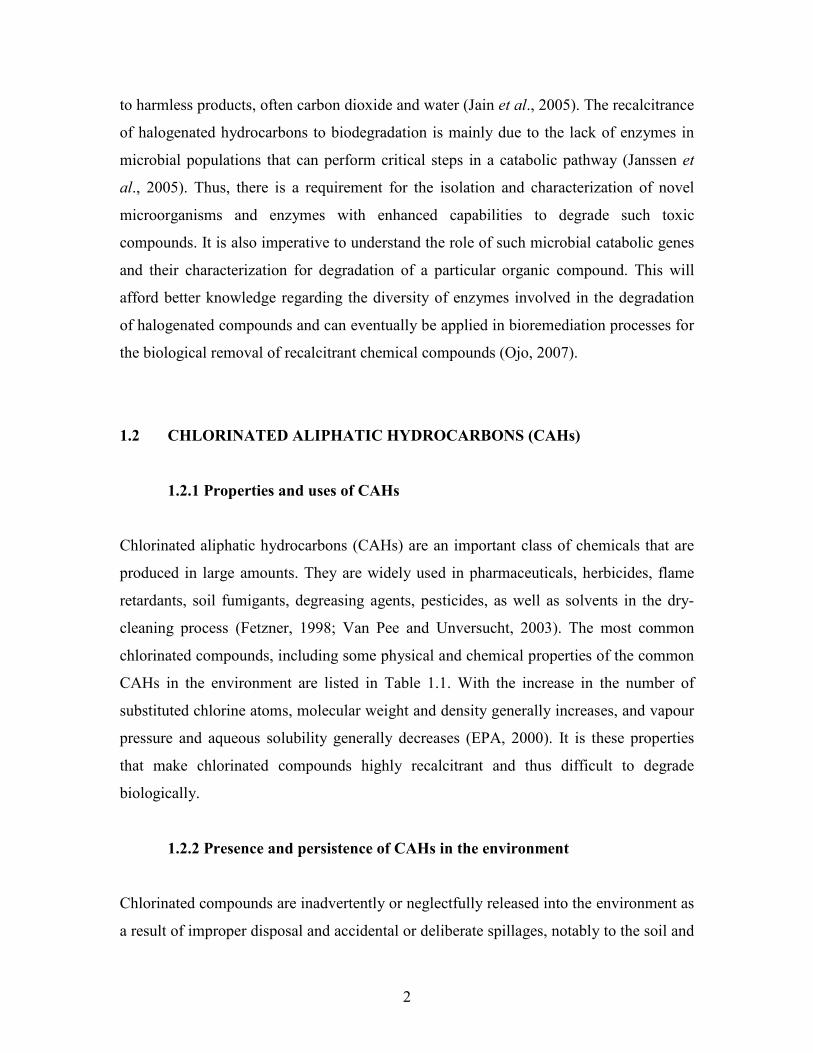
to harmless products, often carbon dioxide and water (Jain et al., 2005). The recalcitrance
of halogenated hydrocarbons to biodegradation is mainly due to the lack of enzymes in
microbial populations that can perform critical steps in a catabolic pathway (Janssen et
al., 2005). Thus, there is a requirement for the isolation and characterization of novel
microorganisms and enzymes with enhanced capabilities to degrade such toxic
compounds. It is also imperative to understand the role of such microbial catabolic genes
and their characterization for degradation of a particular organic compound. This will
afford better knowledge regarding the diversity of enzymes involved in the degradation
of halogenated compounds and can eventually be applied in bioremediation processes for
the biological removal of recalcitrant chemical compounds (Ojo, 2007).
1.2 CHLORINATED ALIPHATIC HYDROCARBONS (CAHs)
1.2.1 Properties and uses of CAHs
Chlorinated aliphatic hydrocarbons (CAHs) are an important class of chemicals that are
produced in large amounts. They are widely used in pharmaceuticals, herbicides, flame
retardants, soil fumigants, degreasing agents, pesticides, as well as solvents in the dry-
cleaning process (Fetzner, 1998; Van Pee and Unversucht, 2003). The most common
chlorinated compounds, including some physical and chemical properties of the common
CAHs in the environment are listed in Table 1.1. With the increase in the number of
substituted chlorine atoms, molecular weight and density generally increases, and vapour
pressure and aqueous solubility generally decreases (EPA, 2000). It is these properties
that make chlorinated compounds highly recalcitrant and thus difficult to degrade
biologically.
1.2.2 Presence and persistence of CAHs in the environment
Chlorinated compounds are inadvertently or neglectfully released into the environment as
a result of improper disposal and accidental or deliberate spillages, notably to the soil and
3
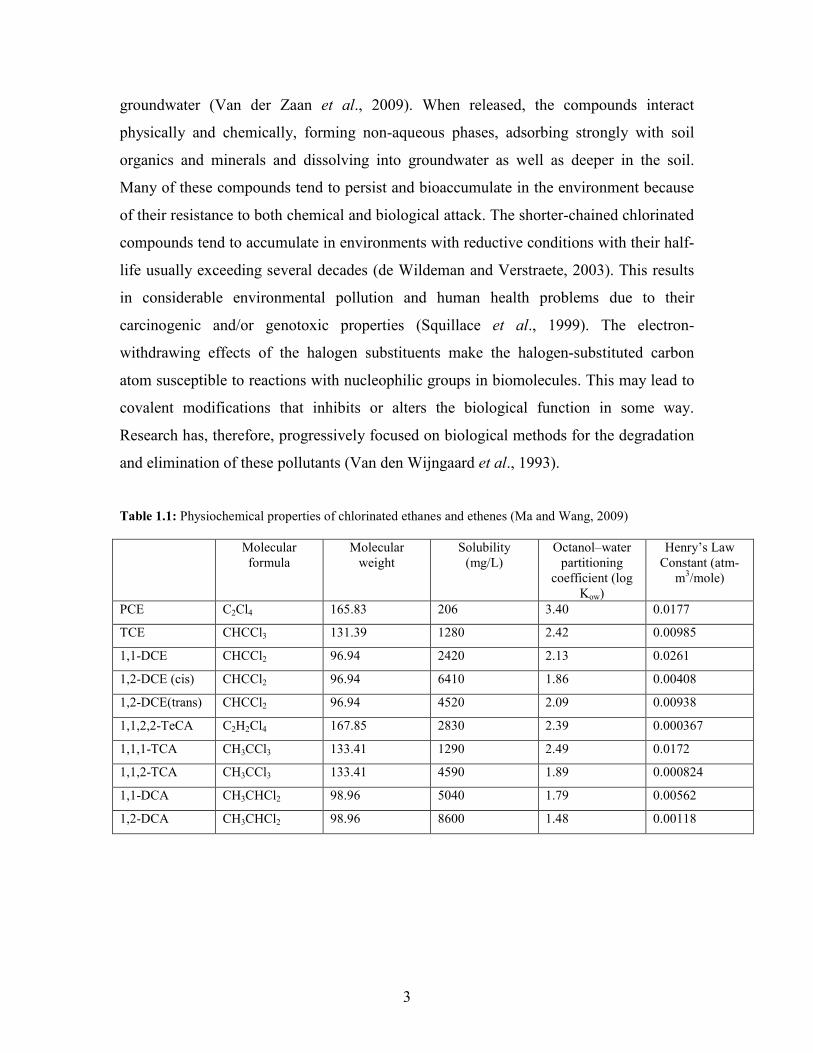
groundwater (Van der Zaan et al., 2009). When released, the compounds interact
physically and chemically, forming non-aqueous phases, adsorbing strongly with soil
organics and minerals and dissolving into groundwater as well as deeper in the soil.
Many of these compounds tend to persist and bioaccumulate in the environment because
of their resistance to both chemical and biological attack. The shorter-chained chlorinated
compounds tend to accumulate in environments with reductive conditions with their half-
life usually exceeding several decades (de Wildeman and Verstraete, 2003). This results
in considerable environmental pollution and human health problems due to their
carcinogenic and/or genotoxic properties (Squillace et al., 1999). The electron-
withdrawing effects of the halogen substituents make the halogen-substituted carbon
atom susceptible to reactions with nucleophilic groups in biomolecules. This may lead to
covalent modifications that inhibits or alters the biological function in some way.
Research has, therefore, progressively focused on biological methods for the degradation
and elimination of these pollutants (Van den Wijngaard et al., 1993).
Table 1.1: Physiochemical properties of chlorinated ethanes and ethenes (Ma and Wang, 2009)
Molecular formula
Molecular weight
Solubility (mg/L)
Octanol–water partitioning
coefficient (log Kow)
Henry’s Law Constant (atm-
m3/mole)
PCE C2Cl4 165.83 206 3.40 0.0177
TCE CHCCl3 131.39 1280 2.42 0.00985
1,1-DCE CHCCl2 96.94 2420 2.13 0.0261
1,2-DCE (cis) CHCCl2 96.94 6410 1.86 0.00408
1,2-DCE(trans) CHCCl2 96.94 4520 2.09 0.00938
1,1,2,2-TeCA C2H2Cl4 167.85 2830 2.39 0.000367
1,1,1-TCA CH3CCl3 133.41 1290 2.49 0.0172
1,1,2-TCA CH3CCl3 133.41 4590 1.89 0.000824
1,1-DCA CH3CHCl2 98.96 5040 1.79 0.00562
1,2-DCA CH3CHCl2 98.96 8600 1.48 0.00118
4
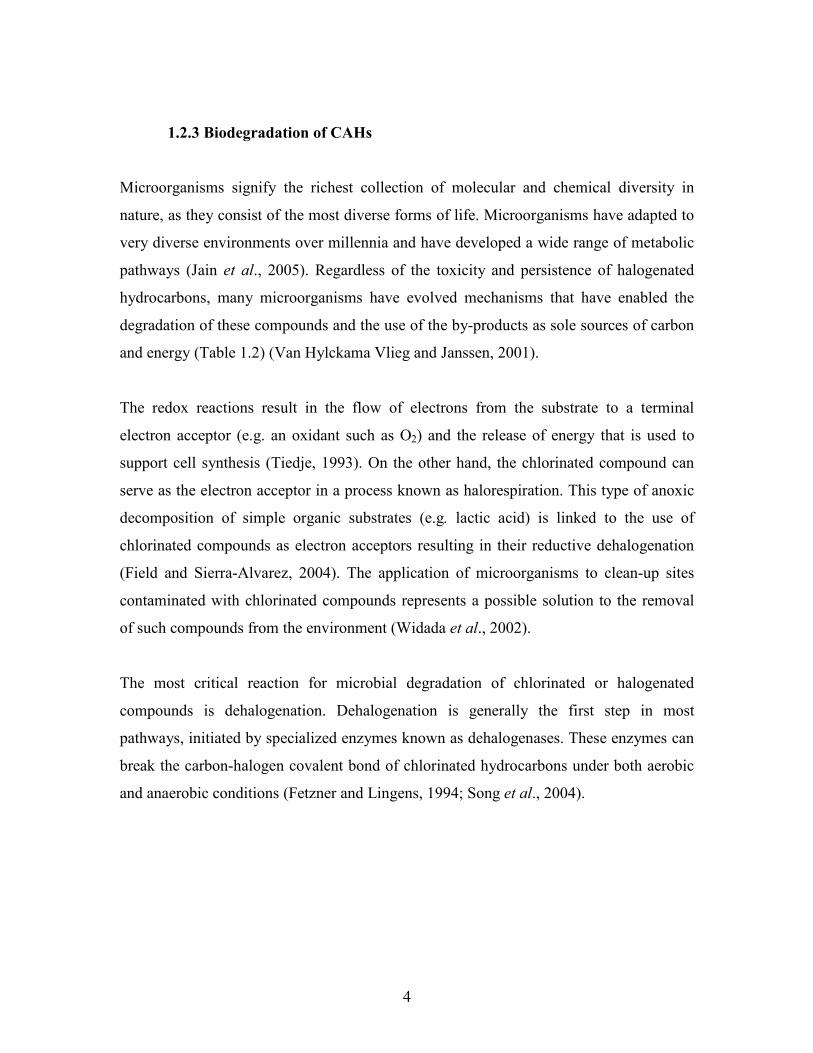
1.2.3 Biodegradation of CAHs
Microorganisms signify the richest collection of molecular and chemical diversity in
nature, as they consist of the most diverse forms of life. Microorganisms have adapted to
very diverse environments over millennia and have developed a wide range of metabolic
pathways (Jain et al., 2005). Regardless of the toxicity and persistence of halogenated
hydrocarbons, many microorganisms have evolved mechanisms that have enabled the
degradation of these compounds and the use of the by-products as sole sources of carbon
and energy (Table 1.2) (Van Hylckama Vlieg and Janssen, 2001).
The redox reactions result in the flow of electrons from the substrate to a terminal
electron acceptor (e.g. an oxidant such as O2) and the release of energy that is used to
support cell synthesis (Tiedje, 1993). On the other hand, the chlorinated compound can
serve as the electron acceptor in a process known as halorespiration. This type of anoxic
decomposition of simple organic substrates (e.g. lactic acid) is linked to the use of
chlorinated compounds as electron acceptors resulting in their reductive dehalogenation
(Field and Sierra-Alvarez, 2004). The application of microorganisms to clean-up sites
contaminated with chlorinated compounds represents a possible solution to the removal
of such compounds from the environment (Widada et al., 2002).
The most critical reaction for microbial degradation of chlorinated or halogenated
compounds is dehalogenation. Dehalogenation is generally the first step in most
pathways, initiated by specialized enzymes known as dehalogenases. These enzymes can
break the carbon-halogen covalent bond of chlorinated hydrocarbons under both aerobic
and anaerobic conditions (Fetzner and Lingens, 1994; Song et al., 2004).
5
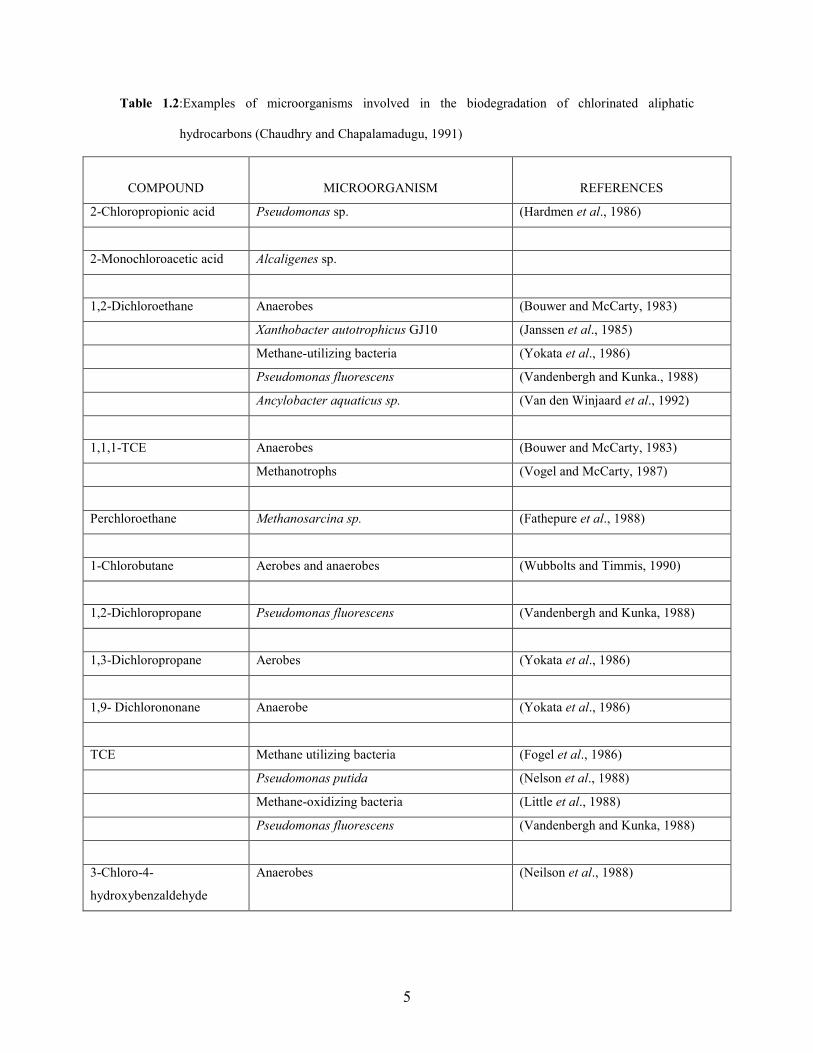
Table 1.2:Examples of microorganisms involved in the biodegradation of chlorinated aliphatic
hydrocarbons (Chaudhry and Chapalamadugu, 1991)
COMPOUND
MICROORGANISM
REFERENCES
2-Chloropropionic acid Pseudomonas sp. (Hardmen et al., 1986)
2-Monochloroacetic acid Alcaligenes sp.
1,2-Dichloroethane Anaerobes (Bouwer and McCarty, 1983)
Xanthobacter autotrophicus GJ10 (Janssen et al., 1985)
Methane-utilizing bacteria (Yokata et al., 1986)
Pseudomonas fluorescens (Vandenbergh and Kunka., 1988)
Ancylobacter aquaticus sp. (Van den Winjaard et al., 1992)
1,1,1-TCE Anaerobes (Bouwer and McCarty, 1983)
Methanotrophs (Vogel and McCarty, 1987)
Perchloroethane Methanosarcina sp. (Fathepure et al., 1988)
1-Chlorobutane Aerobes and anaerobes (Wubbolts and Timmis, 1990)
1,2-Dichloropropane Pseudomonas fluorescens (Vandenbergh and Kunka, 1988)
1,3-Dichloropropane Aerobes (Yokata et al., 1986)
1,9- Dichlorononane Anaerobe (Yokata et al., 1986)
TCE Methane utilizing bacteria (Fogel et al., 1986)
Pseudomonas putida (Nelson et al., 1988)
Methane-oxidizing bacteria (Little et al., 1988)
Pseudomonas fluorescens (Vandenbergh and Kunka, 1988)
3-Chloro-4-
hydroxybenzaldehyde
Anaerobes (Neilson et al., 1988)
6
1.3 DEHALOGENASES: TYPES AND MECHANISMS
Dehalogenation is the key reaction performed by dehalogenase enymes during microbial
degradation of halogenated compounds. During this step, the halogen substituent
responsible for the toxic and xenobiotic character of the compound is often replaced by
hydrogen or a hydroxyl group (Fetzner and Lingens, 1994).
Numerous factors dictate which of these enzyme systems are employed for degradation in
vivo. Some of these factors include the chemical features of the carbon-halogen bond
(e.g. aliphatic, olefinic, aromatic, and number of halogens per carbon) and the presence of
compatible metabolic pathways allowing the dehalogenated intermediates to be utilized
by the microorganism (Swanson, 1999). Seven mechanisms of dehalogenation proposed
by Fetzner and Lingens, (1994) are discussed below.
1.3.1 Hydrolytic dehalogenation
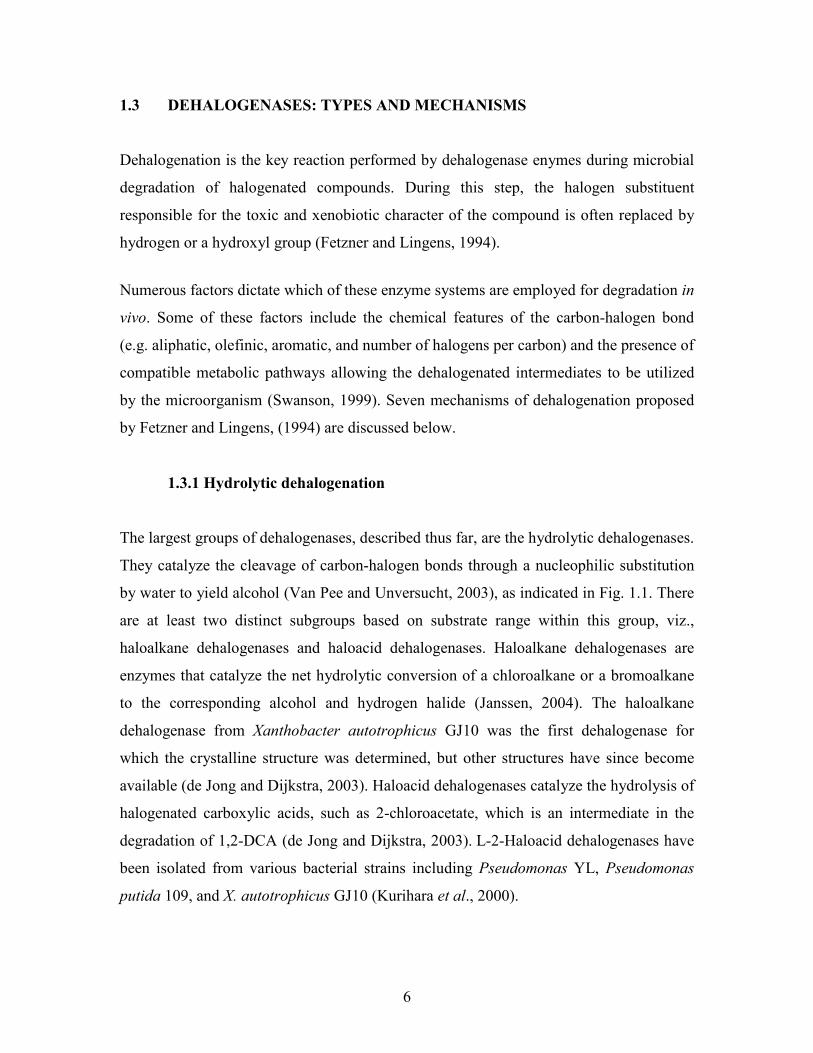
The largest groups of dehalogenases, described thus far, are the hydrolytic dehalogenases.
They catalyze the cleavage of carbon-halogen bonds through a nucleophilic substitution
by water to yield alcohol (Van Pee and Unversucht, 2003), as indicated in Fig. 1.1. There
are at least two distinct subgroups based on substrate range within this group, viz.,
haloalkane dehalogenases and haloacid dehalogenases. Haloalkane dehalogenases are
enzymes that catalyze the net hydrolytic conversion of a chloroalkane or a bromoalkane
to the corresponding alcohol and hydrogen halide (Janssen, 2004). The haloalkane
dehalogenase from Xanthobacter autotrophicus GJ10 was the first dehalogenase for
which the crystalline structure was determined, but other structures have since become
available (de Jong and Dijkstra, 2003). Haloacid dehalogenases catalyze the hydrolysis of
halogenated carboxylic acids, such as 2-chloroacetate, which is an intermediate in the
degradation of 1,2-DCA (de Jong and Dijkstra, 2003). L-2-Haloacid dehalogenases have
been isolated from various bacterial strains including Pseudomonas YL, Pseudomonas
putida 109, and X. autotrophicus GJ10 (Kurihara et al., 2000).
7
Figure 1.1: Hydrolytic cleavage of the carbon-chlorine by hydrolytic dehalogenases (Van Pee and
Unversucht, 2003)
1.3.2 Oxygenolytic dehalogenation
Oxidative dehalogenation reactions occur in the biodegradation of haloaliphatic and
haloaromatic compounds. The enzymes involved in these reactions are monooxygenases
and dioxygenases. Methane monooxygenase from Methylococcus capsulatus and
Methylococcus trichosporium have broad substrate specificity for oxygenolytic reactions
(Van Pee and Unversucht, 2003). Dioxygenases consist of a two-component system
found in various microorganisms such as the 4-chlorophenylacetate 3,4-dioxygenase
from Pseudomonas sp. CBS3, and 2-halobenzoate 1,2-dioxygenase from P. cepacia
2CBS. The 4-chlorophenylacetate 3,4-dioxygenase from Pseudomonas sp. CBS3 consists
of a monomeric flavin mononucleotide- and [2Fe-2S]-containing reductase component
(35 kDa), which transfers electrons from the co-substrate NADH to the terminal
oxygenase component (Fetzner and Lingens, 1994).
1.3.3 Thiolytic dehalogenation
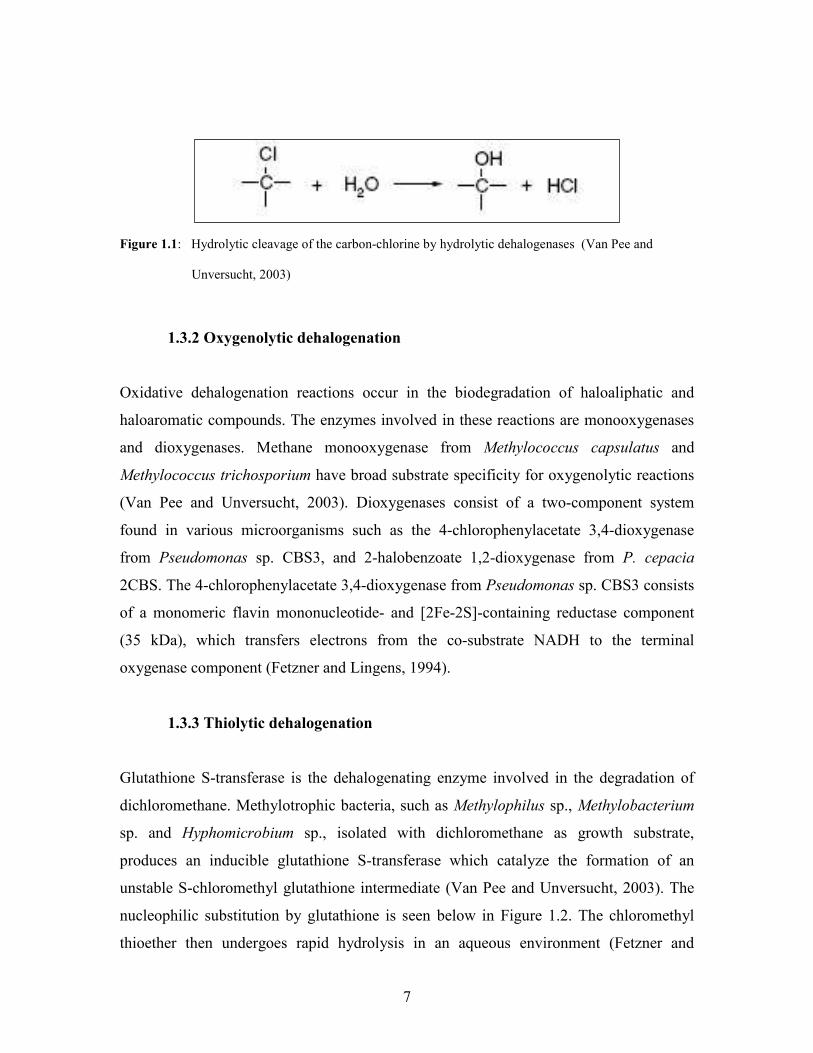
Glutathione S-transferase is the dehalogenating enzyme involved in the degradation of
dichloromethane. Methylotrophic bacteria, such as Methylophilus sp., Methylobacterium
sp. and Hyphomicrobium sp., isolated with dichloromethane as growth substrate,
produces an inducible glutathione S-transferase which catalyze the formation of an
unstable S-chloromethyl glutathione intermediate (Van Pee and Unversucht, 2003). The
nucleophilic substitution by glutathione is seen below in Figure 1.2. The chloromethyl
thioether then undergoes rapid hydrolysis in an aqueous environment (Fetzner and
8
Lingens, 1994). The final products are glutathione, chloride, and formaldehyde (Van Pee
and Unversucht, 2003).
Figure 1.2: Thiolytic dehalogenation with glutathione S-transferase (Van Pee and Unversucht, 2003)
1.3.4 Reductive dehalogenation
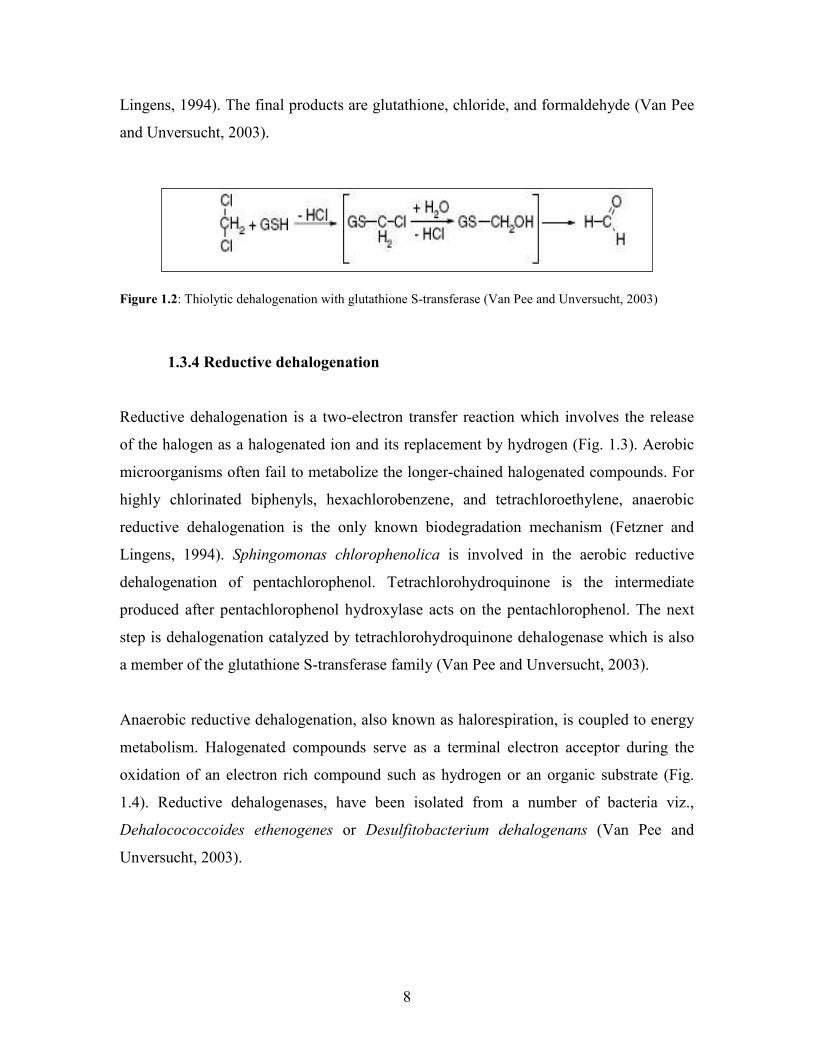
Reductive dehalogenation is a two-electron transfer reaction which involves the release
of the halogen as a halogenated ion and its replacement by hydrogen (Fig. 1.3). Aerobic
microorganisms often fail to metabolize the longer-chained halogenated compounds. For
highly chlorinated biphenyls, hexachlorobenzene, and tetrachloroethylene, anaerobic
reductive dehalogenation is the only known biodegradation mechanism (Fetzner and
Lingens, 1994). Sphingomonas chlorophenolica is involved in the aerobic reductive
dehalogenation of pentachlorophenol. Tetrachlorohydroquinone is the intermediate
produced after pentachlorophenol hydroxylase acts on the pentachlorophenol. The next
step is dehalogenation catalyzed by tetrachlorohydroquinone dehalogenase which is also
a member of the glutathione S-transferase family (Van Pee and Unversucht, 2003).
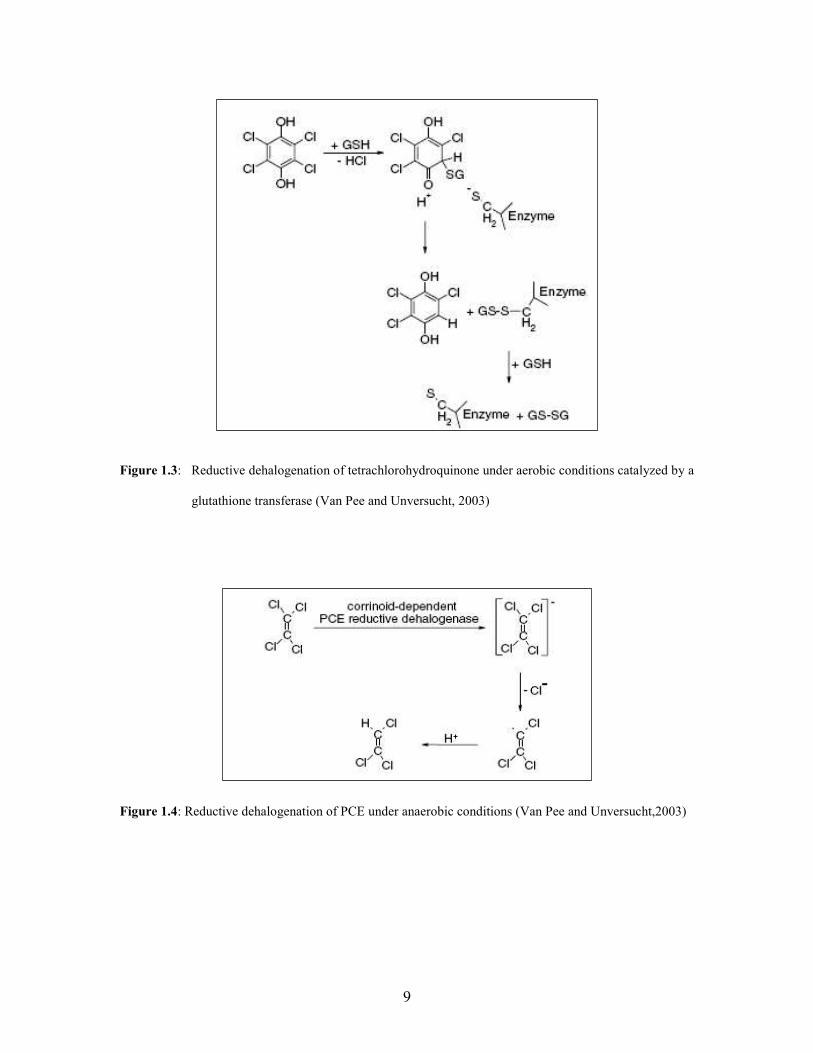
Anaerobic reductive dehalogenation, also known as halorespiration, is coupled to energy
metabolism. Halogenated compounds serve as a terminal electron acceptor during the
oxidation of an electron rich compound such as hydrogen or an organic substrate (Fig.
1.4). Reductive dehalogenases, have been isolated from a number of bacteria viz.,
Dehalocococcoides ethenogenes or Desulfitobacterium dehalogenans (Van Pee and
Unversucht, 2003).
9
Figure 1.3: Reductive dehalogenation of tetrachlorohydroquinone under aerobic conditions catalyzed by a
glutathione transferase (Van Pee and Unversucht, 2003)
Figure 1.4: Reductive dehalogenation of PCE under anaerobic conditions (Van Pee and Unversucht,2003)
10
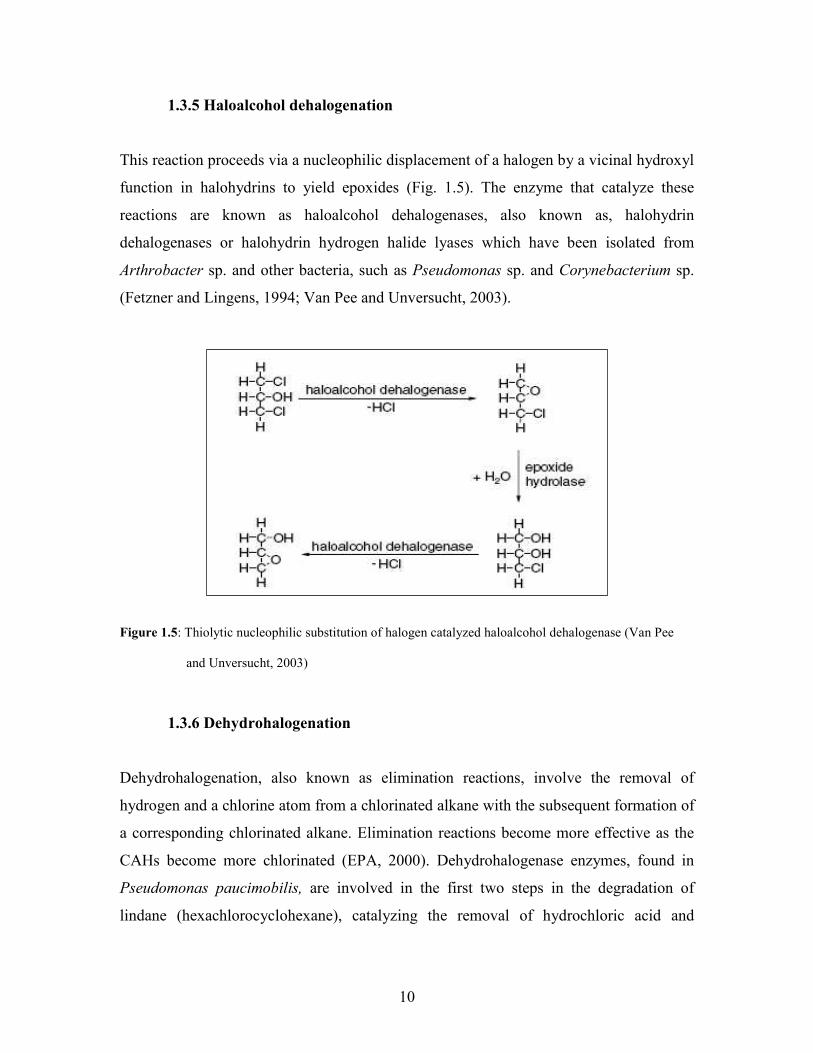
1.3.5 Haloalcohol dehalogenation
This reaction proceeds via a nucleophilic displacement of a halogen by a vicinal hydroxyl
function in halohydrins to yield epoxides (Fig. 1.5). The enzyme that catalyze these
reactions are known as haloalcohol dehalogenases, also known as, halohydrin
dehalogenases or halohydrin hydrogen halide lyases which have been isolated from
Arthrobacter sp. and other bacteria, such as Pseudomonas sp. and Corynebacterium sp.
(Fetzner and Lingens, 1994; Van Pee and Unversucht, 2003).
Figure 1.5: Thiolytic nucleophilic substitution of halogen catalyzed haloalcohol dehalogenase (Van Pee
and Unversucht, 2003)
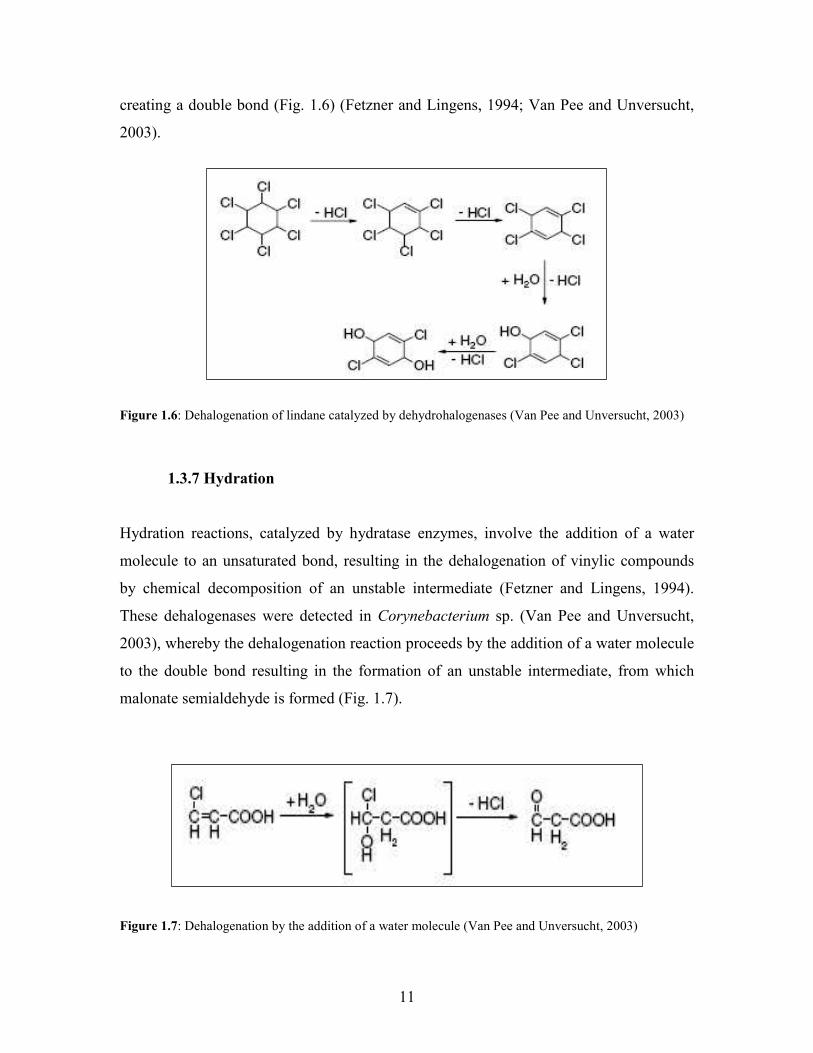
1.3.6 Dehydrohalogenation
Dehydrohalogenation, also known as elimination reactions, involve the removal of
hydrogen and a chlorine atom from a chlorinated alkane with the subsequent formation of
a corresponding chlorinated alkane. Elimination reactions become more effective as the
CAHs become more chlorinated (EPA, 2000). Dehydrohalogenase enzymes, found in
Pseudomonas paucimobilis, are involved in the first two steps in the degradation of
lindane (hexachlorocyclohexane), catalyzing the removal of hydrochloric acid and
11
creating a double bond (Fig. 1.6) (Fetzner and Lingens, 1994; Van Pee and Unversucht,
2003).
Figure 1.6: Dehalogenation of lindane catalyzed by dehydrohalogenases (Van Pee and Unversucht, 2003)
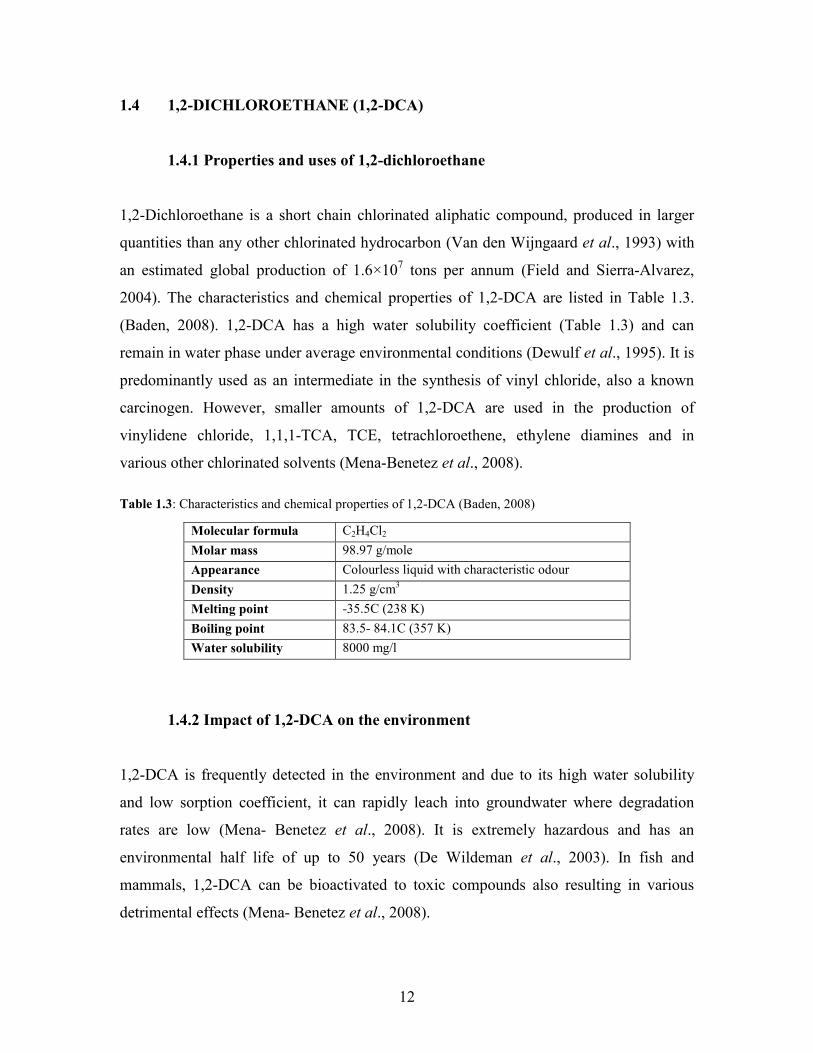
1.3.7 Hydration
Hydration reactions, catalyzed by hydratase enzymes, involve the addition of a water
molecule to an unsaturated bond, resulting in the dehalogenation of vinylic compounds
by chemical decomposition of an unstable intermediate (Fetzner and Lingens, 1994).
These dehalogenases were detected in Corynebacterium sp. (Van Pee and Unversucht,
2003), whereby the dehalogenation reaction proceeds by the addition of a water molecule
to the double bond resulting in the formation of an unstable intermediate, from which
malonate semialdehyde is formed (Fig. 1.7).
Figure 1.7: Dehalogenation by the addition of a water molecule (Van Pee and Unversucht, 2003)
12
1.4 1,2-DICHLOROETHANE (1,2-DCA)
1.4.1 Properties and uses of 1,2-dichloroethane
1,2-Dichloroethane is a short chain chlorinated aliphatic compound, produced in larger
quantities than any other chlorinated hydrocarbon (Van den Wijngaard et al., 1993) with
an estimated global production of 1.6×10⁷ tons per annum (Field and Sierra-Alvarez,
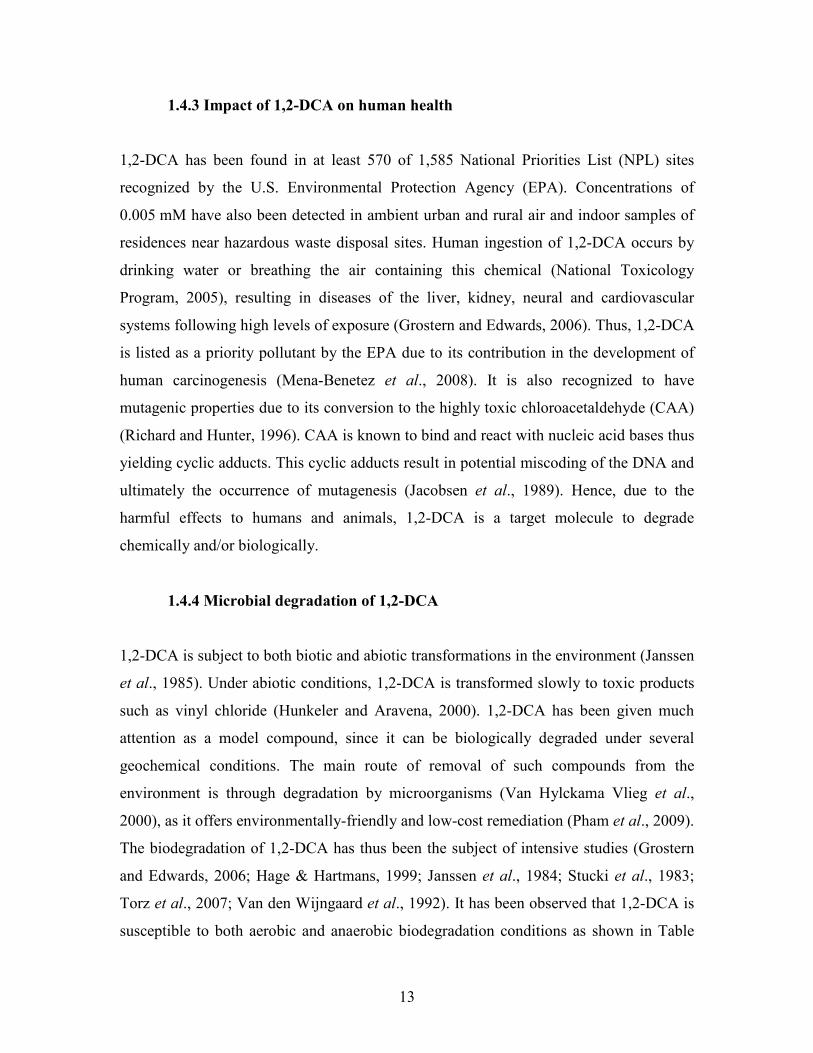
2004). The characteristics and chemical properties of 1,2-DCA are listed in Table 1.3.
(Baden, 2008). 1,2-DCA has a high water solubility coefficient (Table 1.3) and can
remain in water phase under average environmental conditions (Dewulf et al., 1995). It is
predominantly used as an intermediate in the synthesis of vinyl chloride, also a known
carcinogen. However, smaller amounts of 1,2-DCA are used in the production of
vinylidene chloride, 1,1,1-TCA, TCE, tetrachloroethene, ethylene diamines and in
various other chlorinated solvents (Mena-Benetez et al., 2008).
Table 1.3: Characteristics and chemical properties of 1,2-DCA (Baden, 2008)
1.4.2 Impact of 1,2-DCA on the environment
1,2-DCA is frequently detected in the environment and due to its high water solubility
and low sorption coefficient, it can rapidly leach into groundwater where degradation
rates are low (Mena- Benetez et al., 2008). It is extremely hazardous and has an
environmental half life of up to 50 years (De Wildeman et al., 2003). In fish and
mammals, 1,2-DCA can be bioactivated to toxic compounds also resulting in various
detrimental effects (Mena- Benetez et al., 2008).
Molecular formula C2H4Cl2
Molar mass 98.97 g/mole
Appearance Colourless liquid with characteristic odour
Density 1.25 g/cm3
Melting point -35.5C (238 K)
Boiling point 83.5- 84.1C (357 K)
Water solubility 8000 mg/l
13
1.4.3 Impact of 1,2-DCA on human health
1,2-DCA has been found in at least 570 of 1,585 National Priorities List (NPL) sites
recognized by the U.S. Environmental Protection Agency (EPA). Concentrations of
0.005 mM have also been detected in ambient urban and rural air and indoor samples of
residences near hazardous waste disposal sites. Human ingestion of 1,2-DCA occurs by
drinking water or breathing the air containing this chemical (National Toxicology
Program, 2005), resulting in diseases of the liver, kidney, neural and cardiovascular
systems following high levels of exposure (Grostern and Edwards, 2006). Thus, 1,2-DCA
is listed as a priority pollutant by the EPA due to its contribution in the development of
human carcinogenesis (Mena-Benetez et al., 2008). It is also recognized to have
mutagenic properties due to its conversion to the highly toxic chloroacetaldehyde (CAA)
(Richard and Hunter, 1996). CAA is known to bind and react with nucleic acid bases thus
yielding cyclic adducts. This cyclic adducts result in potential miscoding of the DNA and
ultimately the occurrence of mutagenesis (Jacobsen et al., 1989). Hence, due to the
harmful effects to humans and animals, 1,2-DCA is a target molecule to degrade
chemically and/or biologically.
1.4.4 Microbial degradation of 1,2-DCA
1,2-DCA is subject to both biotic and abiotic transformations in the environment (Janssen
et al., 1985). Under abiotic conditions, 1,2-DCA is transformed slowly to toxic products
such as vinyl chloride (Hunkeler and Aravena, 2000). 1,2-DCA has been given much
attention as a model compound, since it can be biologically degraded under several
geochemical conditions. The main route of removal of such compounds from the
environment is through degradation by microorganisms (Van Hylckama Vlieg et al.,
2000), as it offers environmentally-friendly and low-cost remediation (Pham et al., 2009).
The biodegradation of 1,2-DCA has thus been the subject of intensive studies (Grostern
and Edwards, 2006; Hage & Hartmans, 1999; Janssen et al., 1984; Stucki et al., 1983;
Torz et al., 2007; Van den Wijngaard et al., 1992). It has been observed that 1,2-DCA is
susceptible to both aerobic and anaerobic biodegradation conditions as shown in Table
14
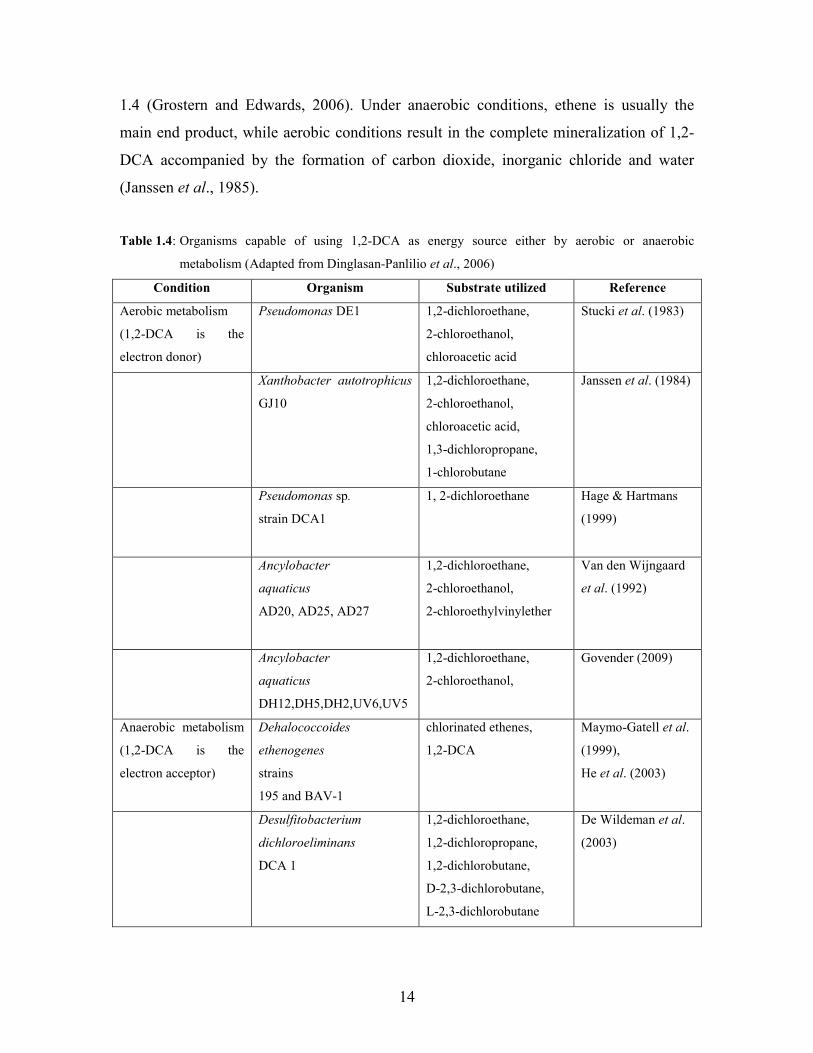
1.4 (Grostern and Edwards, 2006). Under anaerobic conditions, ethene is usually the
main end product, while aerobic conditions result in the complete mineralization of 1,2-
DCA accompanied by the formation of carbon dioxide, inorganic chloride and water
(Janssen et al., 1985).
Table 1.4: Organisms capable of using 1,2-DCA as energy source either by aerobic or anaerobic
metabolism (Adapted from Dinglasan-Panlilio et al., 2006)
Condition Organism Substrate utilized Reference
Aerobic metabolism
(1,2-DCA is the
electron donor)
Pseudomonas DE1 1,2-dichloroethane,
2-chloroethanol,
chloroacetic acid
Stucki et al. (1983)
Xanthobacter autotrophicus
GJ10
1,2-dichloroethane,
2-chloroethanol,
chloroacetic acid,
1,3-dichloropropane,
1-chlorobutane
Janssen et al. (1984)
Pseudomonas sp.
strain DCA1
1, 2-dichloroethane Hage & Hartmans
(1999)
Ancylobacter
aquaticus
AD20, AD25, AD27
1,2-dichloroethane,
2-chloroethanol,
2-chloroethylvinylether
Van den Wijngaard
et al. (1992)
Ancylobacter
aquaticus
DH12,DH5,DH2,UV6,UV5
1,2-dichloroethane,
2-chloroethanol,
Govender (2009)
Anaerobic metabolism
(1,2-DCA is the
electron acceptor)
Dehalococcoides
ethenogenes
strains
195 and BAV-1
chlorinated ethenes,
1,2-DCA
Maymo-Gatell et al.
(1999),
He et al. (2003)
Desulfitobacterium
dichloroeliminans
DCA 1
1,2-dichloroethane,
1,2-dichloropropane,
1,2-dichlorobutane,
D-2,3-dichlorobutane,
L-2,3-dichlorobutane
De Wildeman et al.
(2003)
15
1.4.4.1 Anaerobic conditions
Anaerobic biodegradation is an attractive alternative for in situ bioremediation as there is
no need for the introduction of oxygen into the subsurface. Studies on anaerobic
conditions during the last decade have focused on chlorinated ethenes, however, recent
work (Grostern and Edwards, 2006) have shown that microorganisms have the ability to
anaerobically degrade 1,2-DCA. Under these conditions, reductive dihaloelimination is
the mechanism by which the organisms utilize 1,2-DCA forming ethene.
Dehalococcoides sp. strains 195 and BAV1 and Desulfitobacterium dichloroeliminans
strain DCA1 can utilize 1,2-DCA (via dichloroelimination) as an electron acceptor
(Dinglasan-Panlilio et al., 2006; Grostern and Edwards, 2006).
1.4.4.2 Aerobic conditions
Aerobic biodegradation, in contrast to anaerobic conditions, of 1,2-DCA has been well
documented (Dinglasan-Panlilio et al., 2006; Hage & Hartmans, 1999; Janssen et al.,
1984; Stucki et al., 1983; Van den Wijngaard et al., 1992). These conditions result in its
complete mineralization to harmless substances, such as water and CO2. Aerobic
biodegradation could eliminate the need for potentially expensive and complex dual
treatment systems (Davis et al., 2009).
Stucki et al. (1983) was the first to demonstrate aerobic degradation of 1,2-DCA using
Pseudomonas sp. strain DE2. This bacterium was able to grow on 1,2-DCA as the sole
source of carbon and energy with a growth rate of 0.08 h−1 at 30°C. Subsequently, other
organisms were found to show activity on 1,2-DCA viz., Xanthobacter autotrophicus
GJ10 (Janssen et al., 1985), Ancylobacter aquaticus strains (Van den Wijngaard et al.,
1992), Xanthobacter flavus (Song et al., 2004) and certain strains of Mycobacterium sp.
(Jesenská et al., 2002).
Due to the increasing number of contaminated sites, the enzymes possessed by strains
that were capable of aerobically utilizing 1,2-DCA became of great interest (Copley,
16
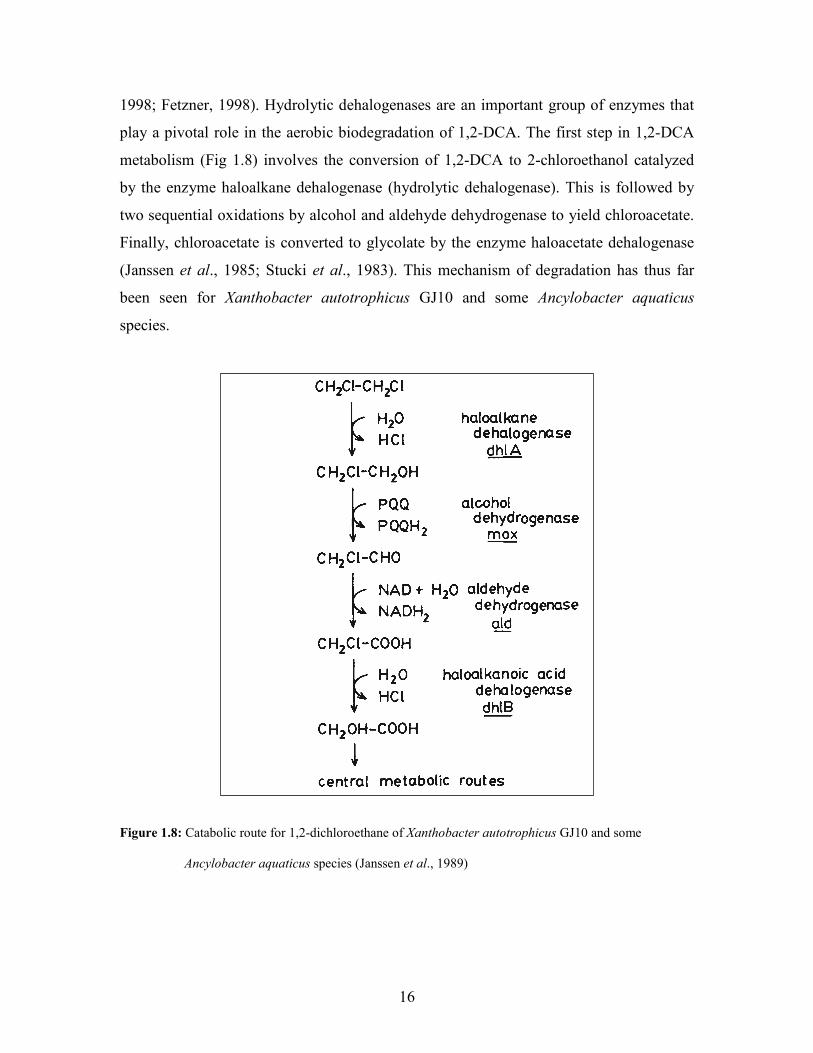
1998; Fetzner, 1998). Hydrolytic dehalogenases are an important group of enzymes that
play a pivotal role in the aerobic biodegradation of 1,2-DCA. The first step in 1,2-DCA
metabolism (Fig 1.8) involves the conversion of 1,2-DCA to 2-chloroethanol catalyzed
by the enzyme haloalkane dehalogenase (hydrolytic dehalogenase). This is followed by
two sequential oxidations by alcohol and aldehyde dehydrogenase to yield chloroacetate.
Finally, chloroacetate is converted to glycolate by the enzyme haloacetate dehalogenase
(Janssen et al., 1985; Stucki et al., 1983). This mechanism of degradation has thus far
been seen for Xanthobacter autotrophicus GJ10 and some Ancylobacter aquaticus
species.
Figure 1.8: Catabolic route for 1,2-dichloroethane of Xanthobacter autotrophicus GJ10 and some
Ancylobacter aquaticus species (Janssen et al., 1989)
17
1.5 ENZYMES INVOLVED IN THE 1,2-DCA DEGRADATION PATHWAY
1.5.1 Haloalkane dehalogenases
Haloalkane dehalogenases are microbial enzymes that can catalyze the net hydrolytic
conversion of a chloroalkane or a bromoalkane, yielding a primary alcohol, a proton and
a halide (Chovancova et al., 2007). The haloalkane dehalogenases belong to the α/β-
hydrolase fold family with cleavage of the carbon–halogen bond proceeding via a
covalent alkylenzyme intermediate. Haloalkane dehalogenases have a high activity across
a broad range of substrates which include chlorinated, brominated and some iodinated
primary and secondary haloalkanes (Janssen, 2004).
1.5.1.1 Types of haloalkane dehalogenases
Haloalkane dehalogenase activity has been experimentally confirmed in 12 diverse
proteins. Substrate specificities of these dehalogenases are very broad and differ with
individual members of the family (Chovancova et al., 2007). The crystal structures of
three different haloalkane dehalogenases viz., DhlA from X. autotrophicus GJ10, LinB
from Sphingobium japonicum UT26 (formerly Sphingomonas paucimobilis UT26) and
DhaA from Rhodococcus sp. have been determined (Pavlová et al., 2007).
Organisms possessing the haloalkane dehalogenase enzyme has been reported (Table
1.5). Statistical analysis of activity by quantitative classification techniques reveals at
least three unique specificity classes within this family of enzymes. These are:
(i) Haloalkane dehalogenase of Xanthobacter flavus, Ancylobacter aquaticus DH12,
Ancylobacter aquaticus DH5, Ancylobacter aquaticus DH2, Ancylobacter aquaticus
Ancylobacter aquaticus UV6, Ancylobacter aquaticus UV5 (Govender, 2009)
Xanthobacter autotrophicus GJ10, Xanthobacter autotrophicus GJ11, Ancylobacter
aquaticus AD20, Ancylobacter aquaticus AD25 and Pseudomonas sp. E4M,
18
(ii) Haloalkane dehalogenase of Rhodococcus sp. HA1, Rhodococcus sp. M15-3,
Acinetobacter sp. GJ70, Rhodococcus erythropolis Y2, Rhodococcus sp. CP9,
Rhodococcus rhodochrous NCIMB 13064, Pseudomonas pavonaceae 170 and
Mycobacterium sp. GP1,
(iii) Haloalkane dehalogenase of Sphingomonas paucimobilis UT26 (Damborsky and
Koca, 1999).
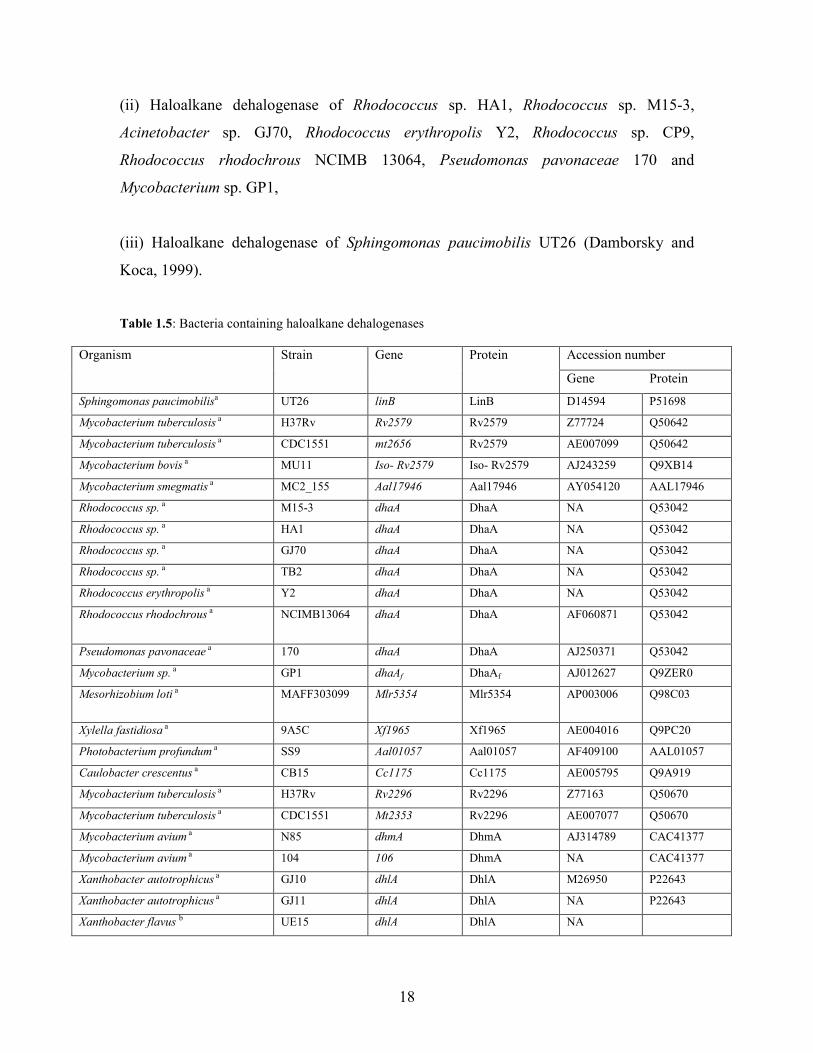
Table 1.5: Bacteria containing haloalkane dehalogenases
Organism Strain Gene Protein Accession number
Gene Protein
Sphingomonas paucimobilisa UT26 linB LinB D14594 P51698
Mycobacterium tuberculosis a H37Rv Rv2579 Rv2579 Z77724 Q50642
Mycobacterium tuberculosis a CDC1551 mt2656 Rv2579 AE007099 Q50642
Mycobacterium bovis a MU11 Iso- Rv2579 Iso- Rv2579 AJ243259 Q9XB14
Mycobacterium smegmatis a MC2_155 Aal17946 Aal17946 AY054120 AAL17946
Rhodococcus sp. a M15-3 dhaA DhaA NA Q53042
Rhodococcus sp. a HA1 dhaA DhaA NA Q53042
Rhodococcus sp. a GJ70 dhaA DhaA NA Q53042
Rhodococcus sp. a TB2 dhaA DhaA NA Q53042
Rhodococcus erythropolis a Y2 dhaA DhaA NA Q53042
Rhodococcus rhodochrous a NCIMB13064 dhaA DhaA AF060871 Q53042
Pseudomonas pavonaceae a 170 dhaA DhaA AJ250371 Q53042
Mycobacterium sp. a GP1 dhaAf DhaAf AJ012627 Q9ZER0
Mesorhizobium loti a MAFF303099 Mlr5354 Mlr5354 AP003006 Q98C03
Xylella fastidiosa a 9A5C Xf1965 Xf1965 AE004016 Q9PC20
Photobacterium profundum a SS9 Aal01057 Aal01057 AF409100 AAL01057
Caulobacter crescentus a CB15 Cc1175 Cc1175 AE005795 Q9A919
Mycobacterium tuberculosis a H37Rv Rv2296 Rv2296 Z77163 Q50670
Mycobacterium tuberculosis a CDC1551 Mt2353 Rv2296 AE007077 Q50670
Mycobacterium avium a N85 dhmA DhmA AJ314789 CAC41377
Mycobacterium avium a 104 106 DhmA NA CAC41377
Xanthobacter autotrophicus a GJ10 dhlA DhlA M26950 P22643
Xanthobacter autotrophicus a GJ11 dhlA DhlA NA P22643
Xanthobacter flavus b UE15 dhlA DhlA NA
19
Ancylobacter aquaticus a AD20 dhlA DhlA NA P22643
Ancylobacter aquaticus a AD25 dhlA DhlA NA P22643
Ancylobacter aquaticus c AD27 dhlA DhlA
Ancylobacter aquaticus c DH12 dhlA DhlA FJ573164
Ancylobacter aquaticus c DH5 dhlA DhlA FJ573163
Ancylobacter aquaticus c DH2 dhlA DhlA FJ573162
Ancylobacter aquaticus c UV6 dhlA DhlA FJ573165
Ancylobacter aquaticus c UV5 dhlA DhlA FJ573166 a (Jesenka et al., 2002), b (Song et al., 2004), c (Govender, 2009)
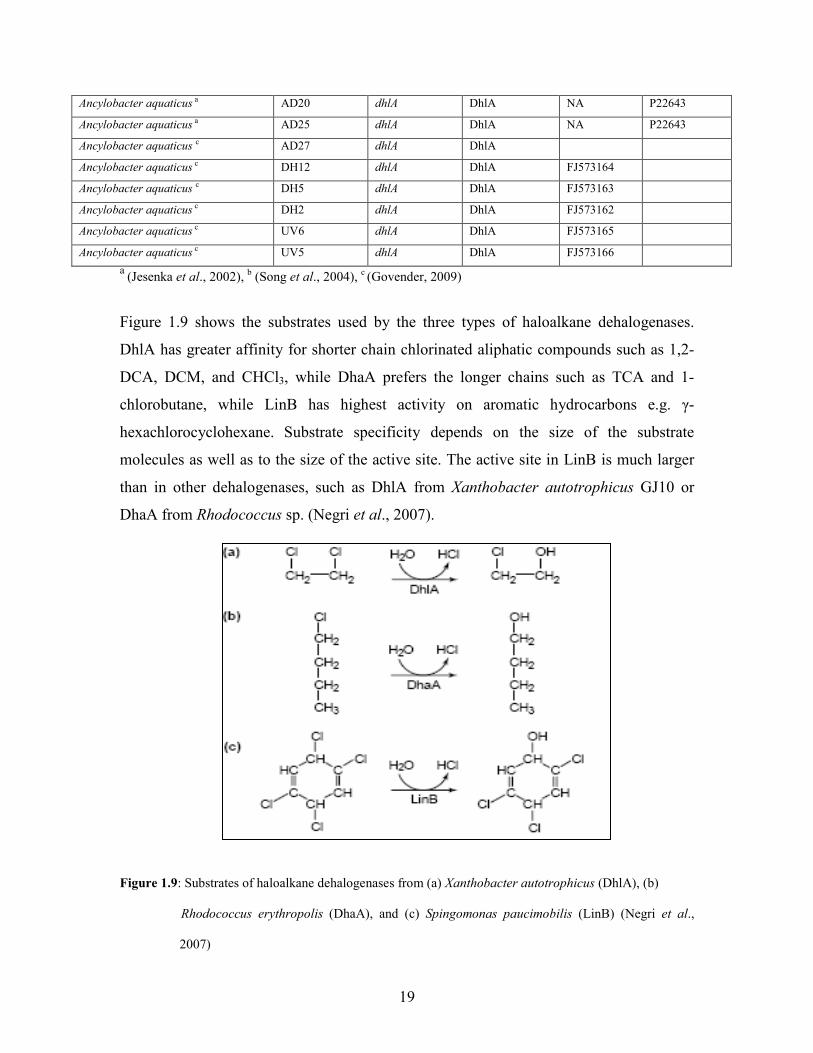
Figure 1.9 shows the substrates used by the three types of haloalkane dehalogenases.
DhlA has greater affinity for shorter chain chlorinated aliphatic compounds such as 1,2-
DCA, DCM, and CHCl3, while DhaA prefers the longer chains such as TCA and 1-
chlorobutane, while LinB has highest activity on aromatic hydrocarbons e.g. γ-
hexachlorocyclohexane. Substrate specificity depends on the size of the substrate
molecules as well as to the size of the active site. The active site in LinB is much larger
than in other dehalogenases, such as DhlA from Xanthobacter autotrophicus GJ10 or
DhaA from Rhodococcus sp. (Negri et al., 2007).
Figure 1.9: Substrates of haloalkane dehalogenases from (a) Xanthobacter autotrophicus (DhlA), (b)
Rhodococcus erythropolis (DhaA), and (c) Spingomonas paucimobilis (LinB) (Negri et al.,
2007)
20
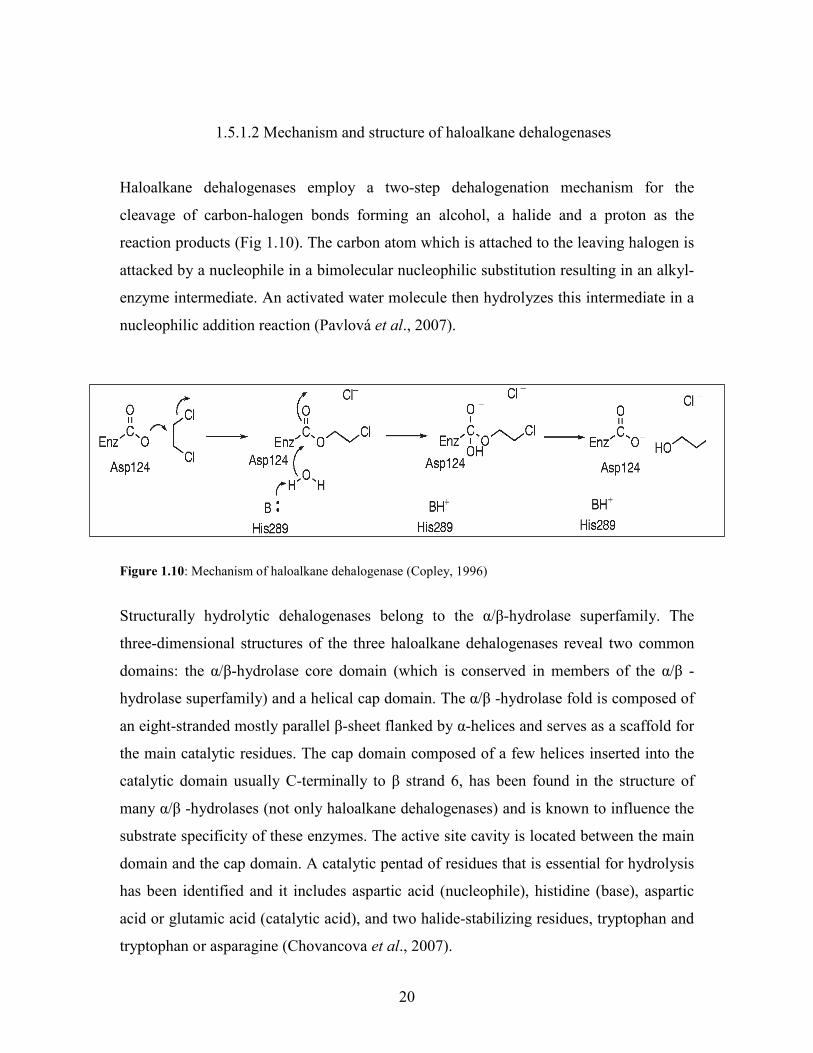
1.5.1.2 Mechanism and structure of haloalkane dehalogenases
Haloalkane dehalogenases employ a two-step dehalogenation mechanism for the
cleavage of carbon-halogen bonds forming an alcohol, a halide and a proton as the
reaction products (Fig 1.10). The carbon atom which is attached to the leaving halogen is
attacked by a nucleophile in a bimolecular nucleophilic substitution resulting in an alkyl-
enzyme intermediate. An activated water molecule then hydrolyzes this intermediate in a
nucleophilic addition reaction (Pavlová et al., 2007).
Figure 1.10: Mechanism of haloalkane dehalogenase (Copley, 1996)
Structurally hydrolytic dehalogenases belong to the α/β-hydrolase superfamily. The
three-dimensional structures of the three haloalkane dehalogenases reveal two common
domains: the α/β-hydrolase core domain (which is conserved in members of the α/β -
hydrolase superfamily) and a helical cap domain. The α/β -hydrolase fold is composed of
an eight-stranded mostly parallel β-sheet flanked by α-helices and serves as a scaffold for
the main catalytic residues. The cap domain composed of a few helices inserted into the
catalytic domain usually C-terminally to β strand 6, has been found in the structure of
many α/β -hydrolases (not only haloalkane dehalogenases) and is known to influence the
substrate specificity of these enzymes. The active site cavity is located between the main
domain and the cap domain. A catalytic pentad of residues that is essential for hydrolysis
has been identified and it includes aspartic acid (nucleophile), histidine (base), aspartic
acid or glutamic acid (catalytic acid), and two halide-stabilizing residues, tryptophan and
tryptophan or asparagine (Chovancova et al., 2007).
21
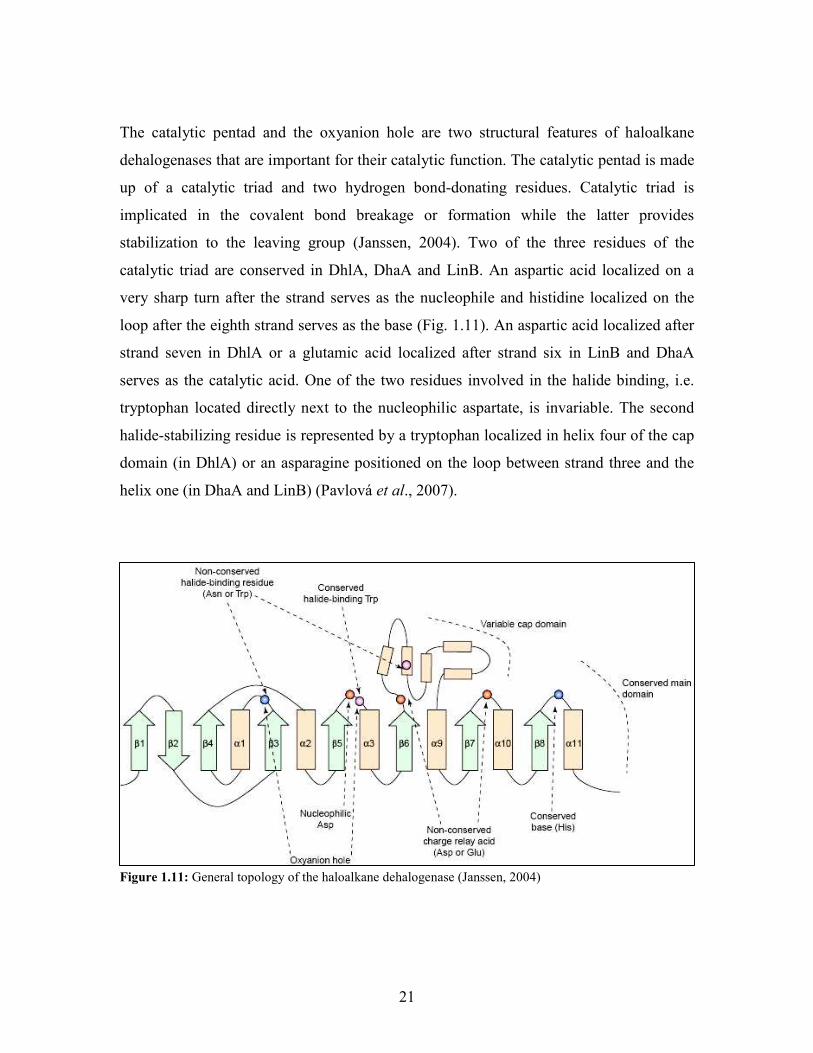
The catalytic pentad and the oxyanion hole are two structural features of haloalkane
dehalogenases that are important for their catalytic function. The catalytic pentad is made
up of a catalytic triad and two hydrogen bond-donating residues. Catalytic triad is
implicated in the covalent bond breakage or formation while the latter provides
stabilization to the leaving group (Janssen, 2004). Two of the three residues of the
catalytic triad are conserved in DhlA, DhaA and LinB. An aspartic acid localized on a
very sharp turn after the strand serves as the nucleophile and histidine localized on the
loop after the eighth strand serves as the base (Fig. 1.11). An aspartic acid localized after
strand seven in DhlA or a glutamic acid localized after strand six in LinB and DhaA
serves as the catalytic acid. One of the two residues involved in the halide binding, i.e.
tryptophan located directly next to the nucleophilic aspartate, is invariable. The second
halide-stabilizing residue is represented by a tryptophan localized in helix four of the cap
domain (in DhlA) or an asparagine positioned on the loop between strand three and the
helix one (in DhaA and LinB) (Pavlová et al., 2007).
Figure 1.11: General topology of the haloalkane dehalogenase (Janssen, 2004)
22
1.5.2 Alcohol dehydrogenase
These enzymes are categorized into four types i.e. three alcohol dehydrogenases and one
methanol dehydrogenase. Methanol dehydrogenases are located in the periplasmic space
of methylotrophic bacteria which catalyze the oxidation of methanol to formaldehyde.
The physiological electron acceptor is a soluble cytochrome CL. The enzyme has a α2β2
tetrametric formation with small β-subunits folding around the surface of the α-subunits.
It also contains pyrroloquinoline quinone (PQQ) which is bound within the α-subunit and
Ca2+ maintaining it in the active site with the required configuration. PQQ is the non-
covalently bound prosthetic group of many quinoproteins (Shibata et al., 2001).
The other type of alcohol dehydrogenase is a soluble quinoprotein ethanol dehydrogenase
derived from Pseudomonas aeruginosa that is similar to methanol dehydrogenases.
However, these enzymes have a lower affinity to methanol. The remaining two types of
alcohol dehydrogenases are soluble and membrane bound quinohaemoprotein alcohol
dehydrogenases (Shibata et al., 2001). The alcohol dehydrogenase responsible for 2-
chloroethanol conversion is the periplasmic quinoprotein alcohol dehydrogenase, also
commonly present in methylotrophic bacteria. The tetrameric enzyme is composed of 60-
kDa and 10-kDa subunits. The enzyme is induced by methanol or 2-chloroethanol
(Janssen et al., 1995).
1.5.3 Chloroacetaldehyde (CAA) dehydrogenase
Aldehyde dehydrogenases form a large group of detoxifying enzymes that catalyze the
NAD (P)+- dependent oxidations of a broad spectrum of aliphatic and aromatic aldehydes
to their corresponding carboxylic acids (Bergeron et al., 1998). The 1,2-DCA degrader,
X. autotrophicus GJ10 show the presence of both a plasmid encoded and chromosomally
encoded aldehyde dehydrogenase. The chromosome, however, carries a relatively
inactive counterpart (Bergeron et al., 1998). Genetic studies have indicated that
chromosomally encoded genes are also essential for chloroacetaldehyde metabolism
(Janssen et al., 1999).
23
Other acetaldehyde dehydrogenases have been found to play a role in the degradation
pathways of other xenobiotic compounds. A variety of enzymes have evolved to
metabolize aldehydes to less reactive forms. The most effective pathway for aldehyde
metabolism is their oxidation to carboxylic acids by aldehyde dehydrogenases.
Regardless of their specificity, these NAD/NADP-dependent enzymes share common
structural and functional features that catalyze the oxidation of a broad spectrum of
aliphatic and aromatic aldehydes (Sripo et al., 2002).
1.5.4 Haloacid (HA) dehalogenases
Haloacid dehalogenases catalyze the hydrolysis of halogenated carboxylic acids, such as
2-chloroacetate, an intermediate formed in the 1,2-DCA degradation pathway. Eighteen
haloalkanoic acid dehalogenases have been investigated (Hill et al., 1999) and these
enzymes are generally found to cluster in the phylum Proteobacteria (Kerr and Marchesi,
2006).
1.5.4.1 Types of 2-haloacid dehalogenases
2-Haloacid dehalogenases are classified into three groups based on their substrate
specificities. L-2-Haloacid dehalogenases catalyze the dehalogenation of L-2-
haloalkanoic acids, whereas D-2-haloacid dehalogenase acts on D-2-haloalkanoic acid.
DL-2-haloacid dehalogenase acts on both enantiomers with the inversion of the C2
configuration of the substrates (Kurihara et al., 2000).
1.5.4.2 Mechanism and structure of the 2-haloacid dehalogenase
2-Haloacid dehalogenases are dimers with two or three domains per subunit. There is a
core domain with a Rossmann-fold-like six-stranded parallel β-sheet flanked by five α-
helices, a subdomain consisting of a four helix bundle and in some enzymes, a
dimerization domain of two antiparallel α-helices (Kurihara et al., 2000). The fold in
24
haloacid dehalogenases is completely different from the α/β-hydrolase fold of the
haloalkane dehalogenases. Haloacid dehalogenases use an aspartate based catalytic
mechanism that proceeds via a covalent intermediate but there is no histidine to activate a
nucleophilic water molecule. In addition, the halide binding site is very different. The
activation mechanism of the water molecule is unknown but it has been suggested that
another aspartate in the active site fulfills this function (De Jong and Dikstra, 2003).
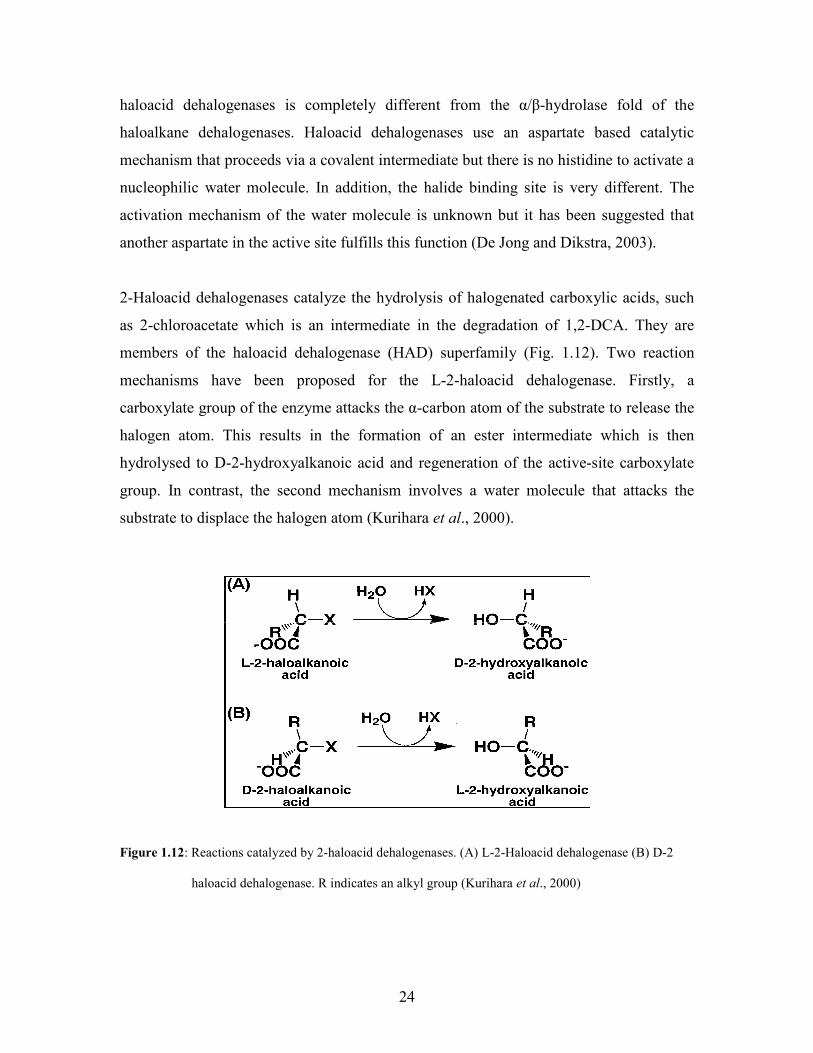
2-Haloacid dehalogenases catalyze the hydrolysis of halogenated carboxylic acids, such
as 2-chloroacetate which is an intermediate in the degradation of 1,2-DCA. They are
members of the haloacid dehalogenase (HAD) superfamily (Fig. 1.12). Two reaction
mechanisms have been proposed for the L-2-haloacid dehalogenase. Firstly, a
carboxylate group of the enzyme attacks the α-carbon atom of the substrate to release the
halogen atom. This results in the formation of an ester intermediate which is then
hydrolysed to D-2-hydroxyalkanoic acid and regeneration of the active-site carboxylate
group. In contrast, the second mechanism involves a water molecule that attacks the
substrate to displace the halogen atom (Kurihara et al., 2000).
Figure 1.12: Reactions catalyzed by 2-haloacid dehalogenases. (A) L-2-Haloacid dehalogenase (B) D-2
haloacid dehalogenase. R indicates an alkyl group (Kurihara et al., 2000)
25
1.6 BIOREMEDIATION
Bioremediation is an in situ clean-up strategy which uses the ability of microorganisms to
decrease the concentration and/or toxicity of a considerable number of contaminants. It is
a cost-effective, versatile, environment-friendly treatment strategy that has a significant
role in the rapidly developing field of environmental renewal (Jain et al., 2005).
Bioremediation utilizes the ability of microorganisms to degrade and/or detoxify
chemical substances (Jain et al., 2005). Strategies involved in bioremediation are
bioattenuation, biostimulation and bioaugmentation. Bioattenuation is monitoring the
natural progress of degradation over time so as to ensure the decrease of the contaminant
with each sampling time. Biostimulation is the intentional stimulation of indigenous
microorganisms by electron acceptors/donors, water, or nutrient addition (Widada et al.,
2002). Bioaugmentation is the addition of contaminant degrading organisms, which have
higher activity or greater specificity towards the contaminant (Van den Wijngaard et al.,
1993) and can speed-up the degradation process. The recalcitrance of many synthetic
chemicals to biodegradation is due to the lack of enzymes at critical steps in catabolic
pathways. Therefore the discovery of new catabolic pathways leading to mineralization
of these recalcitrant compounds would be valuable and afford a better knowledge of the
diversity of catabolic pathways for the degradation of chlorinated compounds as well as
bring valuable information for bioremediation processes (Jain et al., 2005).
1.6.1 Advantages of bioremediation
Bioremediation is a natural process as it employs the use of living organisms. It is an
economical, versatile, environment-friendly and efficient treatment strategy and is
gradually making inroads for environmental clean-up treatments (Singh et al., 2008). The
residues for the treatment are usually harmless products and include carbon dioxide,
water, and cell biomass. Bioremediation is also useful for the complete destruction of a
wide variety of contaminants with no movement of contaminants from one environmental
26
medium to another. Another advantage is that it can be carried out on site, without
causing too much of interference in normal activities (Vidalli, 2001).
1.6.2 Disadvantages of bioremediation
Regardless of the fact that microorganisms capable of degrading pollutants are usually
already present in contaminated soils and aquifers, local environmental conditions could
be unfavourable in these areas (Fantroussi and Agathos, 2005). This could make it
difficult to extrapolate from bench and pilot-scale studies to full-scale field operations
(Vidalli, 2001). Some other concerns of bioremediation are that the products formed after
biodegradation may be more persistent or toxic than the parent compounds. Since
biological processes are often very specific, bioremediation is limited to those
compounds that are biodegradable. Lastly, an obvious disadvantage of bioremediation is
that it may take longer than other treatment options (Vidalli, 2001).
Therefore, to gain maximum benefits from this process, molecular biology is being
employed to gain a better understanding of the microorganism’s natural transformational
ability at the genetic level, to accelerate the progress of designer microbes for improved
hazardous waste removal (Fantroussi and Agathos, 2005).
1.7 PURPOSE OF THE STUDY
1,2-DCA is a highly recalcitrant and toxic compound, both to humans and the
environment. The highly reactive intermediates of 1,2-DCA catabolism,
chloroacetaldehyde and halocarboxylic acids, further contribute to its toxicity. This is due
to the electrophilic nature of the carbonyl groups found in chloroacetaldehyde and the
recalcitrant carbon-chlorine bond in halocarboxylic acids. CAA dehydrogenases play a
crucial role in 1,2-DCA degradation as it prevents an accumulation of 2-chloroethanol,
which is lethal to the bacterial cell. Also, HA dehalogenase, the last enzyme of the
pathway, finally cleaves the recalcitrant carbon-chlorine bond, with the release of
27
harmless substances. Thus, the presence of these enzymes in 1,2-DCA degrading
microorganisms is important for complete degradation to occur. Furthermore,
characterizing their degradative ability on 1,2-DCA and other halogenated compounds
may enable the possible use of these strains in biological systems for the effective
removal of such toxic xenobiotics.
The hydrolytic pathway of 1,2-DCA has extensively been studied in X. autotrophicus
GJ10, isolated from activated sludge in a wastewater treatment plant. It was one of the
first organisms to demonstrate the use a of number halogenated short chain hydrocarbons
as carbon sources (Erable et al., 2006). It was found to possess two hydrolytic
dehalogenases in its degradation pathway. The haloalkane dehalogenase acts on 1,2-DCA
while the haloacid dehalogenase acts on monochloroacetic acid (MCA). Both MCA and
1,2-DCA are regarded as priority pollutants by the Environmental Protection Agency.
Thus, there is a need for the removal of such chlorinated compounds from the
environment. However, the use of an organism such as X. autotrophicus GJ10 is limited
for in situ bioremediation as it produces extracellular polysaccharides at concentrations
higher than 5 mM thus reducing 1,2-DCA uptake into the bacterial cell (Mena-Benetez et
al., 2008). Since the characteristics of this organism do not make it suitable for certain
applications, there is a need to obtain novel 1,2-DCA degraders with different properties
which can then be applied in bioremediation strategies for optimal removal of chlorinated
compounds. Five Ancylobacter strains were previously isolated in our laboratory, based
on their ability to utilize 1,2-DCA as a sole carbon source. These isolates were identified
by 16S rDNA sequencing and found to be different strains of Ancylobacter aquaticus.
One of the main objectives of this study was to determine the ability of these strains to
utilize 1,2-DCA, as well as other halogenated aliphatic hydrocarbons, as a carbon source.
The degradation potential of these organisms will also be compared to the well
characterized X. autotrophicus GJ10 and two previously characterized Ancylobacter
aquaticus strains AD25 and AD27. Ancylobacter aquaticus AD25 and AD27 were
previously isolated from brackish water sediment with 2-chloroethylvinylether supplied
as carbon source and was later reported to use 1,2-DCA as sole carbon source. Both
strains possess the catabolic pathway elucidated in X. autotrophicus GJ10 (Fig. 1.8) as
28
well as the dhlA gene which is identical to the gene of X. autotrophicus GJ10. A.
aquaticus AD25 was also shown to have a higher affinity for 1,2-DCA than X.
autotrophicus GJ10, as a result of its higher dehalogenase content. Comparing the South
African isolates to these well characterized strains might give a better understanding of
the degradation potential of these strains and its suitability for bioremediation strategies.
South African A. aquaticus strains were also found to follow the catabolic pathway
elucidated in X. autotrophicus GJ10 (Fig. 1.8). Incidentally, these strains also possess the
first enzyme of the pathway, the hydrolytic dehalogenase, encoded by dhlA gene. It was
therefore of interest to determine if these isolates possess the other important genes
involved in the 1,2-DCA degradation pathway and whether homologs of these genes
exist. Therefore, the other objective of this study was to investigate the presence of the
CAA dehydrogenase and HA dehalogenase encoding genes (latter two enzymes of the
pathway) in isolates of Ancylobacter using Southern hybridization technique. The control
strain used for all experiments was X. autotrophicus GJ10 with the aldB and dhlB genes,
encoding the CAA dehydrogenase and haloacetate dehalogenase enzymes respectively,
being used as the probes during the hybridization experiments.
1.8 HYPOTHESIS
It is hypothesized that the characterization of 1,2-dichloroethane-degrading Ancylobacter
strains as well as the genes and enzymes involved in the degradation pathway may
provide a better understanding of the potential application of the organisms and/or their
enzymes in bioremediation processes.
1.9 OBJECTIVES
1.9.1 To establish the 1,2-dichloroethane degradation potential of Ancylobacter strains;
29
1.9.2 To characterize CAA dehydrogenase and HA dehalogenase-encoding genes in
strains of Ancylobacter isolates; and
1.9.3 To investigate and compare the specific dehalogenase activities of the
Ancylobacter strains under various conditions.
1.10 AIMS
1.10.1 To determine the growth rates of the Ancylobacter strains in 1,2-dichloroethane
and monochloroacetic acid;
1.10.2 To monitor the biodegradation of 1,2-dichloroethane by pure cultures of
Ancylobacter strains;
1.10.3 To determine the pH and temperature optima of the haloalkane and haloacid
dehalogenases in crude extracts of Ancylobacter strains;
1.10.4 To determine the substrate range of the dehalogenase enzymes in crude extracts of
Ancylobacter strains;
1.10.5 To identify the presence of CAA dehydrogenase and HA dehalogenase genes in
Ancylobacter strains that are capable of growing on 1,2-dichloroethane as a sole carbon
source; and
1.10.6 To clone and sequence CAA dehydrogenase and HA dehalogenase genes obtained
from these strains.
30
CHAPTER TWO
MATERIALS AND METHODS
2.1 GROWTH AND MAINTENANCE OF BACTERIAL CULTURES
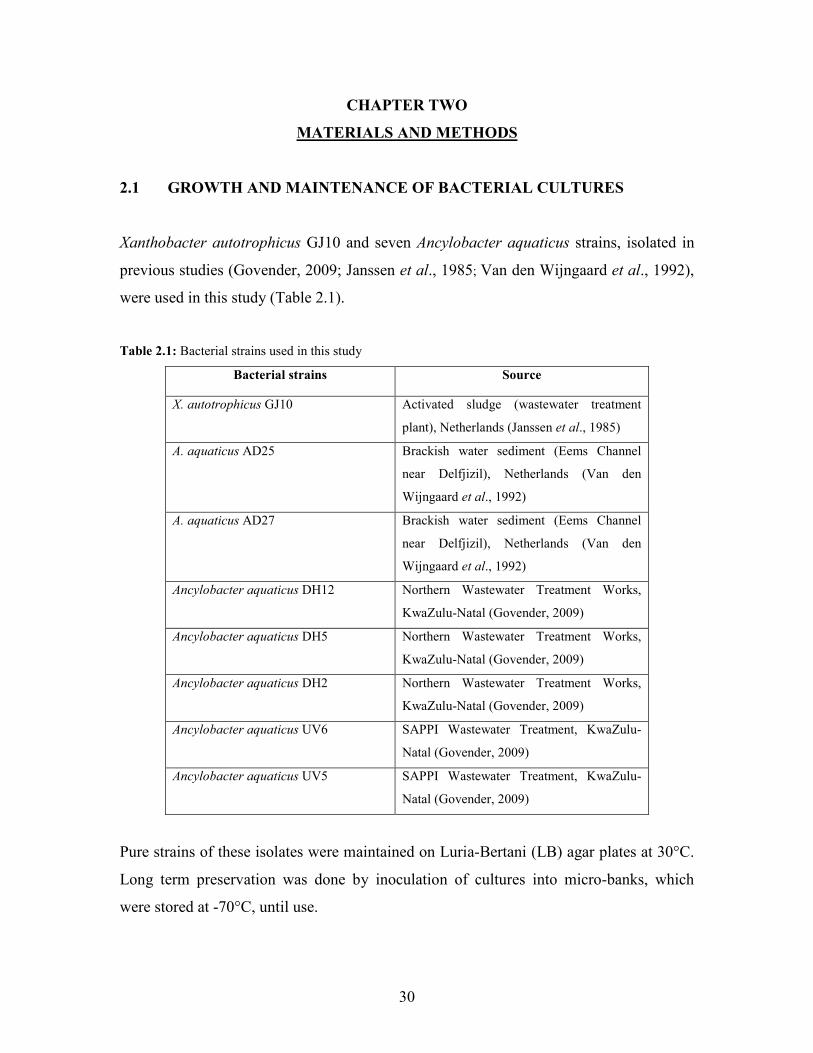
Xanthobacter autotrophicus GJ10 and seven Ancylobacter aquaticus strains, isolated in
previous studies (Govender, 2009; Janssen et al., 1985; Van den Wijngaard et al., 1992),
were used in this study (Table 2.1).
Table 2.1: Bacterial strains used in this study
Bacterial strains Source
X. autotrophicus GJ10 Activated sludge (wastewater treatment
plant), Netherlands (Janssen et al., 1985)
A. aquaticus AD25 Brackish water sediment (Eems Channel
near Delfjizil), Netherlands (Van den
Wijngaard et al., 1992)
A. aquaticus AD27 Brackish water sediment (Eems Channel
near Delfjizil), Netherlands (Van den
Wijngaard et al., 1992)
Ancylobacter aquaticus DH12 Northern Wastewater Treatment Works,
KwaZulu-Natal (Govender, 2009)
Ancylobacter aquaticus DH5 Northern Wastewater Treatment Works,
KwaZulu-Natal (Govender, 2009)
Ancylobacter aquaticus DH2 Northern Wastewater Treatment Works,
KwaZulu-Natal (Govender, 2009)
Ancylobacter aquaticus UV6 SAPPI Wastewater Treatment, KwaZulu-
Natal (Govender, 2009)
Ancylobacter aquaticus UV5 SAPPI Wastewater Treatment, KwaZulu-
Natal (Govender, 2009)
Pure strains of these isolates were maintained on Luria-Bertani (LB) agar plates at 30°C.
Long term preservation was done by inoculation of cultures into micro-banks, which
were stored at -70°C, until use.
31
2.2 STANDARDIZATION OF BACTERIAL STRAINS FOR INOCULATION
INTO GROWTH MEDIA
Pre-cultures of individual isolates (Table 2.1) were inoculated into sterile 100 ml minimal
salts media (MSM) (Appendix I), as previously described by Janssen et al. (1985),
containing 500 µl 1 × trace element solution (Appendix I) and 100 µl 1 × vitamin solution
(Appendix I), in 250 ml Wheaton serum bottles. These were incubated at 30oC on a
rotary shaker at 150 rpm for three days. Cells were pelleted at 5000 × g for 15 min at 4oC
in a Beckman Model J2-21 centrifuge, washed twice with 10 mM Tris.SO4 buffer (pH
7.5) and finally re-suspended in 5 ml of the same buffer. The inocula were standardized,
using a spectrophotometer (UltroSpec II, KB), to an optical density of 1.0 at a
wavelength of 450 nm, prior to inoculation.
2.3 GROWTH MEASUREMENT STUDIES OF Ancylobacter aquaticus
ISOLATES ON VARIOUS HALOGENATED COMPOUNDS
The growth patterns of the bacterial isolates in the presence of 1,2-DCA as a sole carbon
source was monitored in two different media types. One hundred milliliters of minimal
salts media containing either 10 mg/l yeast extract (MMY) or a 1 × vitamin solution
(MMV) (Van den Wijngaard et al., 1993), was inoculated with a 1% standardized culture
of the bacterial isolates. Batch experiments were performed in 250 ml Wheaton serum
bottles. 1,2-DCA was added to a final concentration of 5 mM and immediately sealed
with Teflon-lined screw caps to prevent evaporation of the volatile compound. Batch
experiments with monochloroacetic acid (5 mM) as a sole carbon source were set-up in
250 ml flasks at two pH values of 7 and 9. Batch experiments were also set-up for 1,3-
dichloropropene (5 mM), and 1,3-dibromopropane (5 mM) as sole carbon source in 250
ml Wheaton serum bottles. The bottles and flasks were incubated at 30oC with shaking at
150 rpm for 84 h. Two negative controls were used in all experiments. A non-inoculated
control was used to determine the abiotic loss of the volatile compounds. The second
control contained an organism not known to degrade halogenated compounds i.e.
32
Escherichia coli DH5αF’. One milliliter samples were removed every 12 h using a sterile
syringe and the optical density was measured at 450 nm using a spectrophotometer.
Growth rate constants of individual microorganisms were determined based on the
growth curve using the equation (Rikvkina et al., 2000):
2.4 DETERMINATION OF FREE HALIDE RELEASED DURING
DEGRADATION OF HALOGENATED COMPOUNDS
The colorimetric method of Bergmann and Sanik (1957) was used to detect and quantify
free chlorides in the culture medium during growth of all bacterial isolates investigated
(Table 2.1). The method used for the assay was adapted from Olaniran et al. (2005). One
millilitre samples were removed from Wheaton bottles and centrifuged at 10 000 × g. The
clear supernatant obtained after centrifugation was treated with 0.2 ml of reagent I (0.03
M ferric ammonium sulphate in 9 M HNO3) and 0.4 ml of reagent II (saturated mercury
thiocyanate in 95% ethanol). This was then incubated for 10 min at room temperature to
allow for colour development. The absorbance of the product Fe(SCN)2+ was measured
spectrophotometrically at 460 nm using a standard UV/VIS spectrophotometer (Ultrospec
II, LKB). A standard curve to determine released chloride and bromide concentration was
prepared using different dilutions of a 2 mM KCl and 2 mM KBr stock solution,
respectively. A 1 ml solution of the different concentrations of KCl and KBr was treated
as described for the culture filtrate above. The chloride and bromide ion concentrations
were determined from the regression equation obtained from plotting the absorbance
readings against the salt concentrations. All assays were performed in triplicate. Standard
deviation and T-test analysis was done using Microsoft Excel.
k = log Nt – log N0 0.301t
33
2.5 MEASUREMENT OF DEHALOGENASE ENZYME ACTIVITIES
2.5.1 Preparation of crude extracts
Crude extracts were prepared from 500 ml cultures (refer to Table 2.1) grown to the late
exponential phase and harvested by centrifugation at 10 000 × g for 10 min. Cells were
then re-suspended in 10 mM Tris.SO4 (pH 7.5) that contained 1 mM β-mercaptoethanol
and 1 mM EDTA (TEM buffer) and washed for 10 min in TEM buffer at 10 000 × g.
Cells were then disrupted by sonication (SONIC RUPTOR 400) under constant cooling
(4°C). A crude extract was obtained after unbroken cells and debris had been removed by
centrifugation for 30 min at 12 000 × g. To protect enzymes against inactivation, extracts
were kept at 0 to 4°C. Protein concentration was measured by the Bradford method
(Bradford, 1976) using bovine serum albumin as the reference protein.
2.5.2 Dehalogenase enzyme assays
Haloalkane and haloacid dehalogenase activities were measured colorimetrically by
monitoring halide release, a modified method of Song et al. (2004). Haloalkane
dehalogenase activity was determined by incubating 0.2 ml crude extract at 30°C with 3
ml of 5 mM 1,2-DCA in 10 mM Tris.SO4 (pH 7.5). After incubation for 60 min at 30°C,
0.2ml of 0.03 M NH4Fe(SO4)2 in 6 M HNO3 was added, followed by 0.4 ml saturated
Hg(SCN)2 in ethanol. Chloride liberation was measured spectrophotometrically
(Ultrospec II, LKB) at 460 nm. Haloacid dehalogenase activity was determined similarly
but with 5 mM monochloroacetic acid in 50 mM glycine.NaOH buffer (pH 9) as the
substrate solution. One unit of dehalogenase activity was defined as the amount of
enzyme that catalyzed the formation of 1 µM of halide per min. The effect of pH on
enzyme activity was determined by incubating the crude extract at different pH
conditions using potassium phosphate (pH 6), 10 mM Tris.SO4 (pH 7-8) and 50 mM
glycine.NaOH (pH 9). To determine the substrate range activities of crude enzyme of the
34
bacterial strains, different substrates were substituted in the haloalkane dehalogenase
enzyme activity assay.
2.6 ISOLATION OF TOTAL DNA
Bacterial isolates (Table 2.1) were grown to late exponential phase in 30 ml of LB broth
(10 g tryptone, 5 g yeast extract and 5 g sodium chloride per litre). Total genomic DNA
was isolated from all bacterial isolates using the CTAB/NaCl method according to
Ausubel et al. (1989). To obtain a high yield of genomic DNA, the method was scaled up
five times and pellet resuspended in a smaller volume of 10 mM Tris.SO4 buffer (pH
7.5). Genomic DNA was separated by agarose gel electrophoresis. The samples were run
on a 1% agarose gel (1 × TAE buffer) at 100 V for 2 h and stained with ethidium bromide
(0.25 µg/ml). Gel images were captured using the Chemi-Genius Bio Imaging System
(Syngene). Genomic DNA from all South African isolates as well as X. autotrophicus
GJ10, A. aquaticus AD25 and AD27 were quantified using the GeneQuant, RNA/DNA
Calculator (Pharmacia).
2.7 RESTRICTION ENZYME DIGESTION
Total genomic DNA isolated from each strain as per Table 2.1 was digested with
restriction endonucleases, EcoRI; PstI; BamHI and HindIII, following the manufacturer’s
recommendations. This was to compare location of genes for all isolates. Reaction
mixtures consisted of 1 µg DNA, 1 unit (U) restriction endonuclease, 1 × restriction
endonuclease buffer and finally brought up to a volume of 20 µl with sterile double-
distilled water. Reactions were incubated at 37°C overnight, followed by gel
electrophoresis on a 1% agarose gel prepared using 1 × TAE buffer (as per section 2.6.
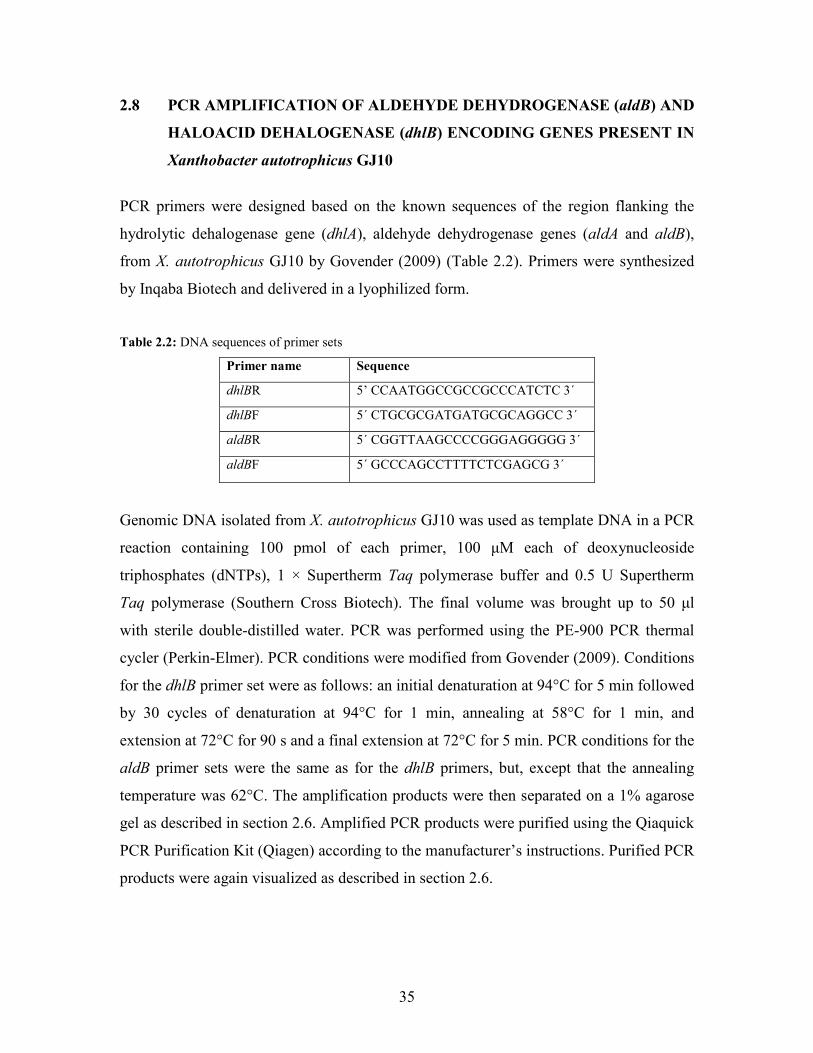
35
2.8 PCR AMPLIFICATION OF ALDEHYDE DEHYDROGENASE (aldB) AND
HALOACID DEHALOGENASE (dhlB) ENCODING GENES PRESENT IN
Xanthobacter autotrophicus GJ10
PCR primers were designed based on the known sequences of the region flanking the
hydrolytic dehalogenase gene (dhlA), aldehyde dehydrogenase genes (aldA and aldB),
from X. autotrophicus GJ10 by Govender (2009) (Table 2.2). Primers were synthesized
by Inqaba Biotech and delivered in a lyophilized form.
Table 2.2: DNA sequences of primer sets
Primer name Sequence
dhlBR 5’ CCAATGGCCGCCGCCCATCTC 3΄
dhlBF 5΄ CTGCGCGATGATGCGCAGGCC 3΄
aldBR 5΄ CGGTTAAGCCCCGGGAGGGGG 3΄
aldBF 5΄ GCCCAGCCTTTTCTCGAGCG 3΄
Genomic DNA isolated from X. autotrophicus GJ10 was used as template DNA in a PCR
reaction containing 100 pmol of each primer, 100 µM each of deoxynucleoside
triphosphates (dNTPs), 1 × Supertherm Taq polymerase buffer and 0.5 U Supertherm
Taq polymerase (Southern Cross Biotech). The final volume was brought up to 50 µl
with sterile double-distilled water. PCR was performed using the PE-900 PCR thermal
cycler (Perkin-Elmer). PCR conditions were modified from Govender (2009). Conditions
for the dhlB primer set were as follows: an initial denaturation at 94°C for 5 min followed
by 30 cycles of denaturation at 94°C for 1 min, annealing at 58°C for 1 min, and
extension at 72°C for 90 s and a final extension at 72°C for 5 min. PCR conditions for the
aldB primer sets were the same as for the dhlB primers, but, except that the annealing
temperature was 62°C. The amplification products were then separated on a 1% agarose
gel as described in section 2.6. Amplified PCR products were purified using the Qiaquick
PCR Purification Kit (Qiagen) according to the manufacturer’s instructions. Purified PCR
products were again visualized as described in section 2.6.
36
2.9 SOUTHERN HYBRIDIZATION
Restricted genomic DNA was separated by electrophoresis on a 0.8% agarose gel. A
lower percentage gel increases the speed of DNA transfer. Southern Blotting was
performed as per Sambrook et al., (1989). The gel was incubated with 0.25 mM HCl for
10 min and then treated with denaturation solution (1.5 M NaCl, 0.5 N NaOH) for 2 × 15
min. Denatured DNA fragments were then neutralized with a neutralization buffer for 2 ×
15 min. The gel was equilibrated for 20 min in 20 × SSC (3 M NaCl, 0.3 M Sodium
Citrate). The treated DNA fragments were subsequently transferred to a Hybond-N+
membrane (Amersham Pharmacia Biotech) by overnight capillary transfer. Following the
overnight transfer, the membrane was rinsed in 2 × SSC solution and air dried.
Purified PCR products, dhlB and aldB, obtained from X. autotrophicus GJ10 was labeled
with digoxigenin-11-dUTP using the nonradioactive DIG High Prime DNA Labeling and
Detection Kit (Roche). The labeling reaction was performed according to the
manufacturer’s instructions. Subsequently, hybridization was carried out at 40-42°C
overnight with gentle agitation. This was then followed by the stringency washes. Firstly,
the membrane was washed (2 × 5 min) in approximately 30 ml 2 × SSC containing 0.1%
SDS at room temperature with constant agitation. Secondly, the membrane was washed
(2 × 15 min) in 0.5 × SSC containing 0.1% SDS, (pre-warmed to 65°C), and incubated at
65°C with gentle agitation. Finally, colorimetric detection of the hybridization signals
was performed according to the manufacturer’s protocol (Roche).
2.10 CLONING AND SEQUENCING OF THE aldB AND dhlB GENES
2.10.1 Purification of DNA fragments
Total genomic DNA, from organisms producing positive signals, was restricted as per
section 2.6 and run on a 1% agarose gel at 50 V for 6 hours. Regions showing a positive
37
signal on the nylon membrane were excised from the agarose gel and purified using the
QIAquick Gel Extraction Kit (Qiagen), according to the manufacturer’s instructions.
2.10.2 Preparation of electrocompetent E. coli cells
Three milliliters of an overnight E. coli DH5α’F LB broth culture was used as a pre-
culture to inoculate 100 ml LB medium. This was incubated at 37°C, with shaking at 150
rpm, until the cell density reached 0.5 at OD600nm. The culture was then immediately
placed on ice to prevent further growth. The cells were harvested by centrifugation at
10 000 × g for 10 min. The resultant cell pellet was washed consecutively with 100 ml,
50 ml and 5 ml cold 10% (v/v) glycerol with centrifugation at 10 000 × g for 10 min after
every wash. Lastly, the pellet was re-suspended in a final volume of 2.5 ml cold 10%
glycerol and subsequently transferred as 80 µl aliquots into microfuge tubes. The cells
were snap frozen with -70°C absolute ethanol and stored at -70°C until further use.
2.10.3 Isolation and restriction of pBluescript II SK
E. coli DH5α’, containing pBluescript II SK, was grown overnight at 37°C in 3 ml LB
broth with 100 µg/ml ampicillin. Isolation of the plasmid was performed using the High
Pure Plasmid Isolation Kit (Roche) according to the manufacturers’ instructions. Briefly,
the cells were pelleted and re-suspended in 250 µl lysis buffer with gentle mixing by
inverting the tube six times. The lysed solution was then treated with 350 µl cold binding
buffer followed by gentle mixing. At this point the solution became cloudy with the
formation of a flocculant precipitate. The flocculant was removed by centrifugation at
13 000 × g for 10 min. The supernatant was transferred to a high pure filter spin column
and centrifuged at full 15 800 × g for 1 min. The flowthrough liquid was discarded and
the cells were washed with 700 µl wash buffer II. Finally the plasmid DNA was eluted
with 50 µl elution buffer. Isolated pBSK was restricted with the corresponding restriction
endonucleases, EcoRI; PstI; BamHI and HindIII, for cloning procedures. The reaction
mixtures were as follows: 1 U restriction enzyme, 1 U restriction enzyme buffer, 1 U
alkaline phosphatase, in a final volume of 20 µl. The reaction was incubated at 37°C for 1
h.
38
2.10.4 Ligation of inserts to plasmid vector
Linearized pBluescript II SK was purified using the Qiagen PCR Purification Kit (Roche)
according to manufacturer’s instructions. Ligation of the purified inserts to restricted
plasmids took place overnight at room temperature using a 5:1 (insert: plasmid) ratio.
Each reaction contained 1 µl plasmid DNA, 5 µl insert, 1 µl T4 DNA ligase and 1 µl T4
ligase buffer which was brought up to a final volume of 10 µl with sterile double-distilled
water.
2.10.5 Transformation of E. coli DH5α’F
Transformation of electrocompetent cells was performed using the Gene Pulser
(BIORAD) using the method by Ausubel et al. (1989). The apparatus was set at 25 µF,
2.5 kV and 200 Ω for a 0.2 cm cuvette. Two and a half microlitres of the ligation mixture
was added to 80 µl of electrocompetent E. coli cells and transferred to a chilled BioRad
cuvette. Following electroporation, the cells were immediately suspended in 1 ml of pre-
warmed SOC medium (Appendix I), to enhance the survival of transformants. The SOC
medium containing transformants were incubated, with shaking, for 1 h at 37°C. To
obtain a high number of clones, the cells were then pelleted and spread onto LB agar
containing 100 µg/ml ampicillin, 50 µl of 100 mg/ml X-gal and 20 µl of 1M IPTG. The
plates were incubated for 16 h at 37°C. Selection of positive clones was based on blue-
white selection. The white clones were transferred to a fresh LB agar plate containing
ampicillin for further analysis.
2.10.6 Plasmid DNA isolation
Plasmid DNA was isolated using a modified procedure of the alkaline lysis method of
Birnboim and Doly (1979). Clones were grown overnight at 37°C in 3 ml LB broth
containing 100 µg/ml ampicillin. Bacterial cells were harvested by centrifugation at
15 800 × g for 3 min in a microcentrifuge tube. All traces of the supernatant were
removed and the pellet was re-suspended in 100 µl of Solution A (25 mM Tris.Cl; 50
mM glucose; 10 mM EDTA; pH 8) containing 100 µg/ml RNase A. The cell suspension
was lysed by addition of 200 µl of freshly prepared Solution B (0.2 M NaOH; 1% SDS)
39
with immediate inversion of the microcentrifuge tubes and incubated for less than 5 min
at room temperature. As soon as the cell suspension turned clear (indicating cell lysis), it
was neutralized by the addition of Solution C (3 M sodium acetate, pH 4.8) and incubated
on ice for 5 min. Precipitated material was removed by centrifugation at maximum speed
(15 800 × g) for 15 min. DNA in the supernatant was precipitated by the addition of 2
volumes of cold 100% ethanol and incubation at -70°C for 15 min. The precipitated DNA
was centrifuged for 15 min and washed once in 70% ethanol. The DNA was pelleted, air-
dried and thereafter dissolved in 20 µl of 10 mM Tris.Cl (pH 8) and stored at -20°C.
40
CHAPTER THREE
RESULTS
3.1 DEGRADATION OF HALOGENATED ALIPHATIC HYDROCARBONS
3.1.1 Aerobic utilization of 1,2-DCA
3.1.1.1 Growth pattern of Ancylobacter strains in minimal media
supplemented with either yeast extract or vitamins
Nine isolates, including recently isolated Ancylobacter species and X. autotrophicus GJ10
were investigated for their ability to utilize 1,2-DCA as a carbon source, by monitoring
their growth patterns over time. Generally, a lag period of 12 h was observed during the
growth of the isolates on 1,2-DCA, followed by an increase in growth (Fig. 3.1).
Optimum growth was observed in minimal media supplemented with yeast extract after
36 h incubation period for isolate Ancylobacter aquaticus DH12 with an optical density
of 0.462 at 450 nm (Fig. 3.1). This was followed very closely by Ancylobacter aquaticus
DH5 with optical density of 0.46, Ancylobacter aquaticus UV5 with 0.444 and A.
aquaticus AD25 with 0.45 after 48 h. Both X. autotrophicus GJ10 and Ancylobacter
aquaticus UV6 reached the end of exponential phase after 60 h with optical density
readings of 0.47 and 0.42, respectively (Fig. 3.1). A. aquaticus AD27 had the slowest
growth and a gradual increase in optical density over the 84 hr incubation period was
observed, reaching an optical density of 0.291 at 84 h. This is in contrast to the other
isolates which reached the end of the exponential phase after 60 h (Fig. 3.1). No
significant increase in turbidity was observed in the un-inoculated control and negative
control inoculated with E. coli (Fig 3.1).
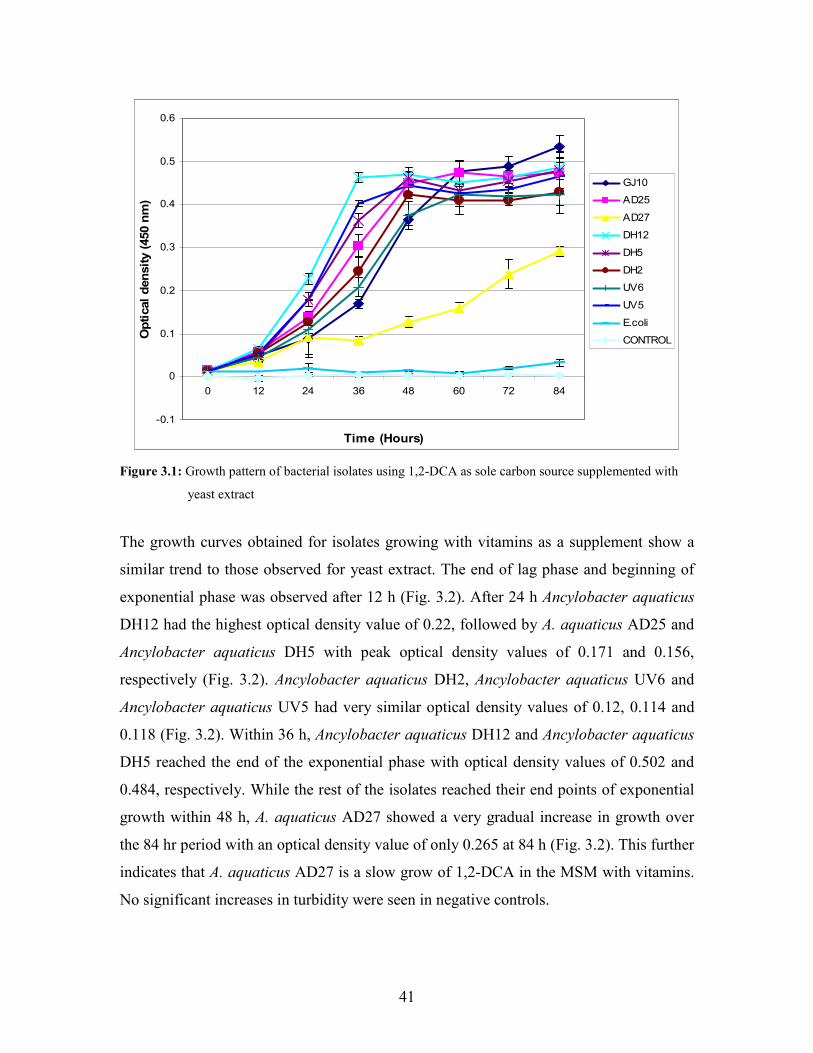
41
-0.1
0
0.1
0.2
0.3
0.4
0.5
0.6
0 12 24 36 48 60 72 84
Time (Hours)
Op
tica
l d
ensi
ty (
450
nm
)
GJ10
AD25
AD27
DH12
DH5
DH2
UV6
UV5
E.coli
CONTROL
Figure 3.1: Growth pattern of bacterial isolates using 1,2-DCA as sole carbon source supplemented with
yeast extract
The growth curves obtained for isolates growing with vitamins as a supplement show a
similar trend to those observed for yeast extract. The end of lag phase and beginning of
exponential phase was observed after 12 h (Fig. 3.2). After 24 h Ancylobacter aquaticus
DH12 had the highest optical density value of 0.22, followed by A. aquaticus AD25 and
Ancylobacter aquaticus DH5 with peak optical density values of 0.171 and 0.156,
respectively (Fig. 3.2). Ancylobacter aquaticus DH2, Ancylobacter aquaticus UV6 and
Ancylobacter aquaticus UV5 had very similar optical density values of 0.12, 0.114 and
0.118 (Fig. 3.2). Within 36 h, Ancylobacter aquaticus DH12 and Ancylobacter aquaticus
DH5 reached the end of the exponential phase with optical density values of 0.502 and
0.484, respectively. While the rest of the isolates reached their end points of exponential
growth within 48 h, A. aquaticus AD27 showed a very gradual increase in growth over
the 84 hr period with an optical density value of only 0.265 at 84 h (Fig. 3.2). This further
indicates that A. aquaticus AD27 is a slow grow of 1,2-DCA in the MSM with vitamins.
No significant increases in turbidity were seen in negative controls.
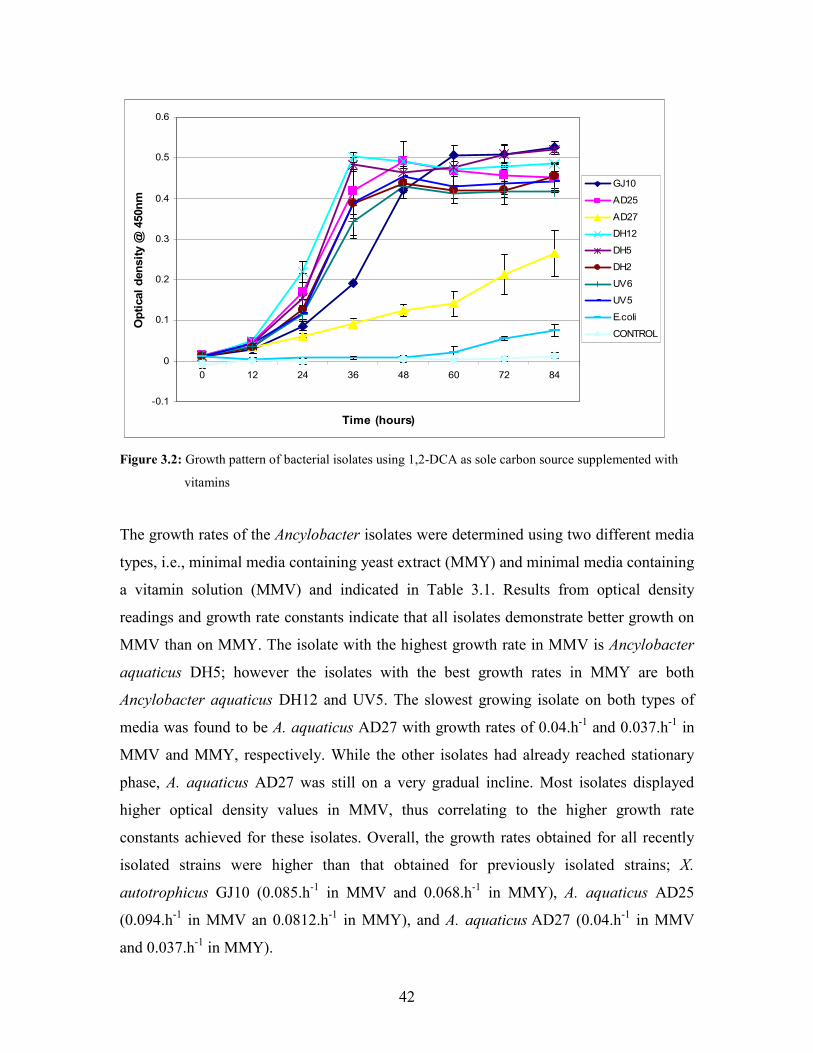
42
-0.1
0
0.1
0.2
0.3
0.4
0.5
0.6
0 12 24 36 48 60 72 84
Time (hours)
Op
tica
l d
ensi
ty @
450
nm
GJ10
AD25
AD27
DH12
DH5
DH2
UV6
UV5
E.coli
CONTROL
Figure 3.2: Growth pattern of bacterial isolates using 1,2-DCA as sole carbon source supplemented with
vitamins
The growth rates of the Ancylobacter isolates were determined using two different media
types, i.e., minimal media containing yeast extract (MMY) and minimal media containing
a vitamin solution (MMV) and indicated in Table 3.1. Results from optical density
readings and growth rate constants indicate that all isolates demonstrate better growth on
MMV than on MMY. The isolate with the highest growth rate in MMV is Ancylobacter
aquaticus DH5; however the isolates with the best growth rates in MMY are both
Ancylobacter aquaticus DH12 and UV5. The slowest growing isolate on both types of
media was found to be A. aquaticus AD27 with growth rates of 0.04.h-1 and 0.037.h-1 in
MMV and MMY, respectively. While the other isolates had already reached stationary
phase, A. aquaticus AD27 was still on a very gradual incline. Most isolates displayed
higher optical density values in MMV, thus correlating to the higher growth rate
constants achieved for these isolates. Overall, the growth rates obtained for all recently
isolated strains were higher than that obtained for previously isolated strains; X.
autotrophicus GJ10 (0.085.h-1 in MMV and 0.068.h-1 in MMY), A. aquaticus AD25
(0.094.h-1 in MMV an 0.0812.h-1 in MMY), and A. aquaticus AD27 (0.04.h-1 in MMV
and 0.037.h-1 in MMY).
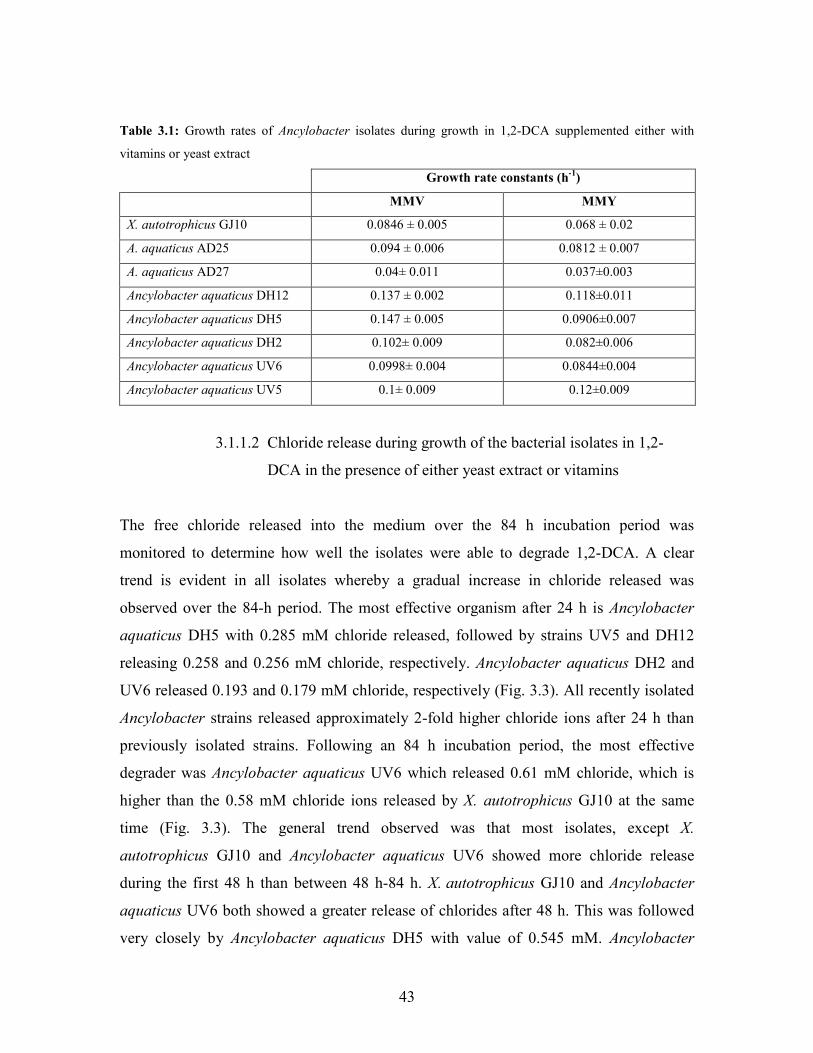
43
Table 3.1: Growth rates of Ancylobacter isolates during growth in 1,2-DCA supplemented either with
vitamins or yeast extract
Growth rate constants (h-1)
MMV MMY
X. autotrophicus GJ10 0.0846 ± 0.005 0.068 ± 0.02
A. aquaticus AD25 0.094 ± 0.006 0.0812 ± 0.007
A. aquaticus AD27 0.04± 0.011 0.037±0.003
Ancylobacter aquaticus DH12 0.137 ± 0.002 0.118±0.011
Ancylobacter aquaticus DH5 0.147 ± 0.005 0.0906±0.007
Ancylobacter aquaticus DH2 0.102± 0.009 0.082±0.006
Ancylobacter aquaticus UV6 0.0998± 0.004 0.0844±0.004
Ancylobacter aquaticus UV5 0.1± 0.009 0.12±0.009
3.1.1.2 Chloride release during growth of the bacterial isolates in 1,2-
DCA in the presence of either yeast extract or vitamins
The free chloride released into the medium over the 84 h incubation period was
monitored to determine how well the isolates were able to degrade 1,2-DCA. A clear
trend is evident in all isolates whereby a gradual increase in chloride released was
observed over the 84-h period. The most effective organism after 24 h is Ancylobacter
aquaticus DH5 with 0.285 mM chloride released, followed by strains UV5 and DH12
releasing 0.258 and 0.256 mM chloride, respectively. Ancylobacter aquaticus DH2 and
UV6 released 0.193 and 0.179 mM chloride, respectively (Fig. 3.3). All recently isolated
Ancylobacter strains released approximately 2-fold higher chloride ions after 24 h than
previously isolated strains. Following an 84 h incubation period, the most effective
degrader was Ancylobacter aquaticus UV6 which released 0.61 mM chloride, which is
higher than the 0.58 mM chloride ions released by X. autotrophicus GJ10 at the same
time (Fig. 3.3). The general trend observed was that most isolates, except X.
autotrophicus GJ10 and Ancylobacter aquaticus UV6 showed more chloride release
during the first 48 h than between 48 h-84 h. X. autotrophicus GJ10 and Ancylobacter
aquaticus UV6 both showed a greater release of chlorides after 48 h. This was followed
very closely by Ancylobacter aquaticus DH5 with value of 0.545 mM. Ancylobacter
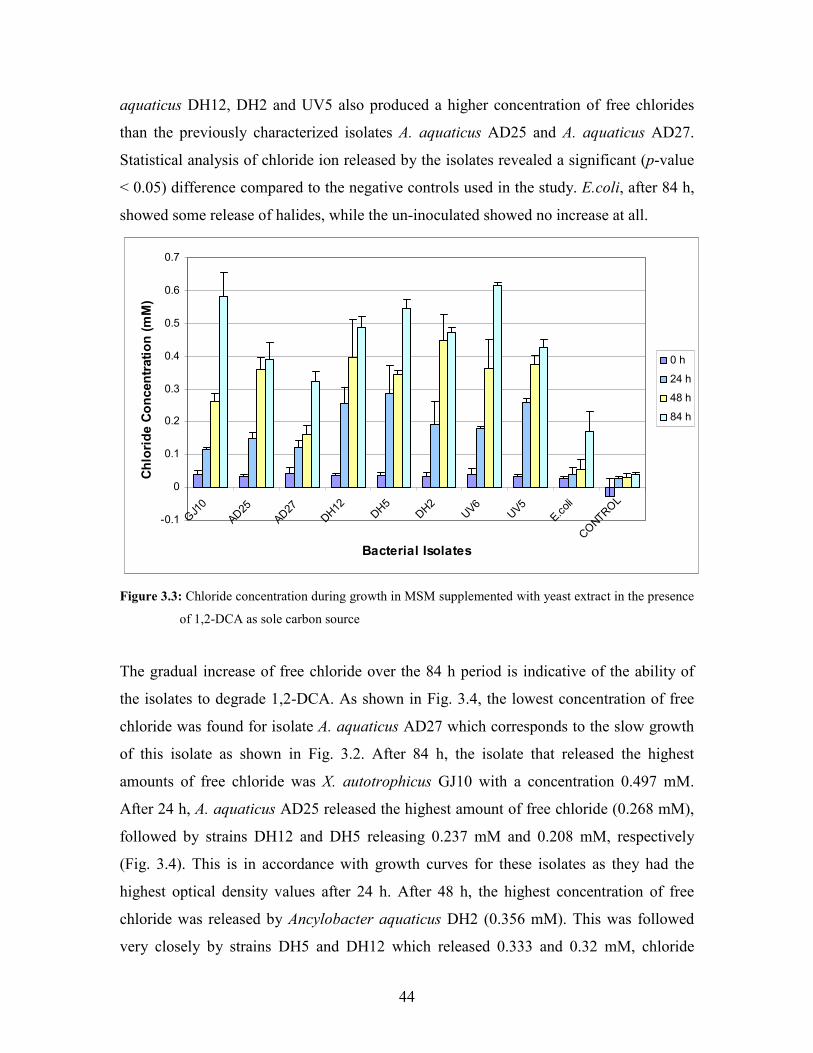
44
aquaticus DH12, DH2 and UV5 also produced a higher concentration of free chlorides
than the previously characterized isolates A. aquaticus AD25 and A. aquaticus AD27.
Statistical analysis of chloride ion released by the isolates revealed a significant (p-value
< 0.05) difference compared to the negative controls used in the study. E.coli, after 84 h,
showed some release of halides, while the un-inoculated showed no increase at all.
-0.1
0
0.1
0.2
0.3
0.4
0.5
0.6
0.7
GJ10
AD25
AD27
DH12
DH5
DH2
UV6
UV5
E.coli
CONTRO
L
Bacterial Isolates
Ch
lori
de
Co
nce
ntr
atio
n (
mM
)
0 h
24 h
48 h
84 h
Figure 3.3: Chloride concentration during growth in MSM supplemented with yeast extract in the presence
of 1,2-DCA as sole carbon source
The gradual increase of free chloride over the 84 h period is indicative of the ability of
the isolates to degrade 1,2-DCA. As shown in Fig. 3.4, the lowest concentration of free
chloride was found for isolate A. aquaticus AD27 which corresponds to the slow growth
of this isolate as shown in Fig. 3.2. After 84 h, the isolate that released the highest
amounts of free chloride was X. autotrophicus GJ10 with a concentration 0.497 mM.
After 24 h, A. aquaticus AD25 released the highest amount of free chloride (0.268 mM),
followed by strains DH12 and DH5 releasing 0.237 mM and 0.208 mM, respectively
(Fig. 3.4). This is in accordance with growth curves for these isolates as they had the
highest optical density values after 24 h. After 48 h, the highest concentration of free
chloride was released by Ancylobacter aquaticus DH2 (0.356 mM). This was followed
very closely by strains DH5 and DH12 which released 0.333 and 0.32 mM, chloride
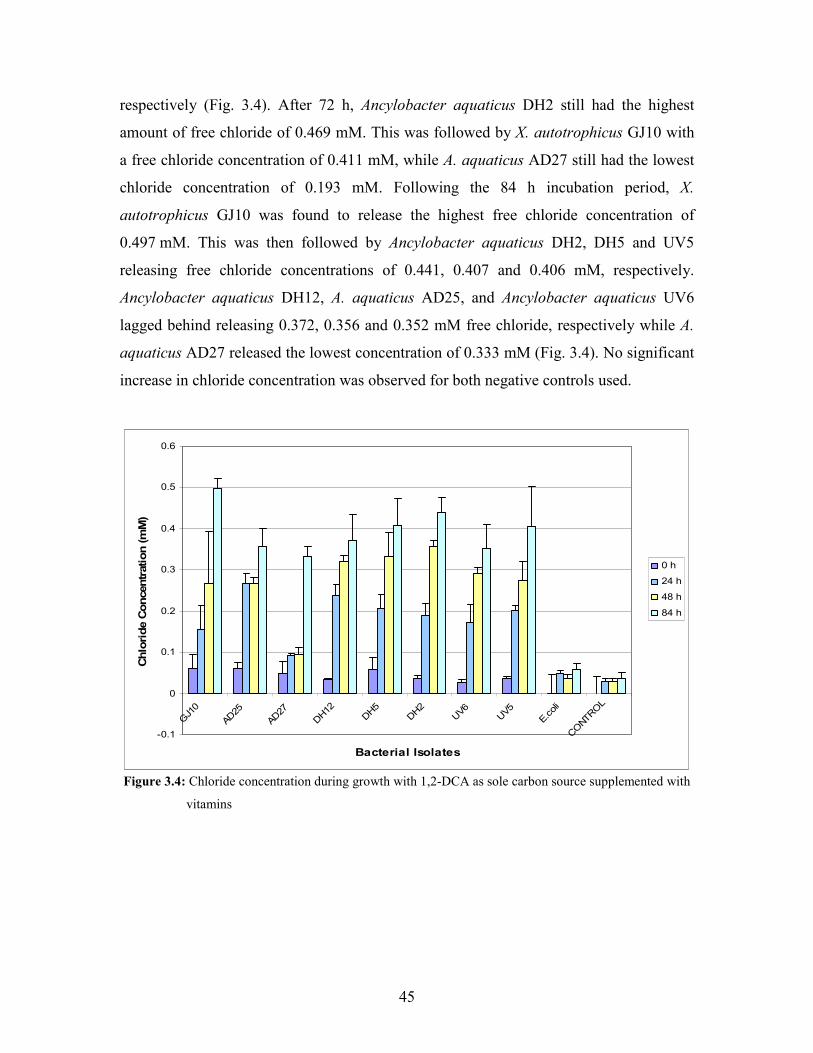
45
respectively (Fig. 3.4). After 72 h, Ancylobacter aquaticus DH2 still had the highest
amount of free chloride of 0.469 mM. This was followed by X. autotrophicus GJ10 with
a free chloride concentration of 0.411 mM, while A. aquaticus AD27 still had the lowest
chloride concentration of 0.193 mM. Following the 84 h incubation period, X.
autotrophicus GJ10 was found to release the highest free chloride concentration of
0.497 mM. This was then followed by Ancylobacter aquaticus DH2, DH5 and UV5
releasing free chloride concentrations of 0.441, 0.407 and 0.406 mM, respectively.
Ancylobacter aquaticus DH12, A. aquaticus AD25, and Ancylobacter aquaticus UV6
lagged behind releasing 0.372, 0.356 and 0.352 mM free chloride, respectively while A.
aquaticus AD27 released the lowest concentration of 0.333 mM (Fig. 3.4). No significant
increase in chloride concentration was observed for both negative controls used.
-0.1
0
0.1
0.2
0.3
0.4
0.5
0.6
GJ10
AD25
AD27
DH12
DH5
DH2
UV6
UV5
E.coli
CONTRO
L
Bacterial Isolates
Chlo
ride
Conce
ntr
atio
n (m
M)
0 h
24 h
48 h
84 h
Figure 3.4: Chloride concentration during growth with 1,2-DCA as sole carbon source supplemented with
vitamins
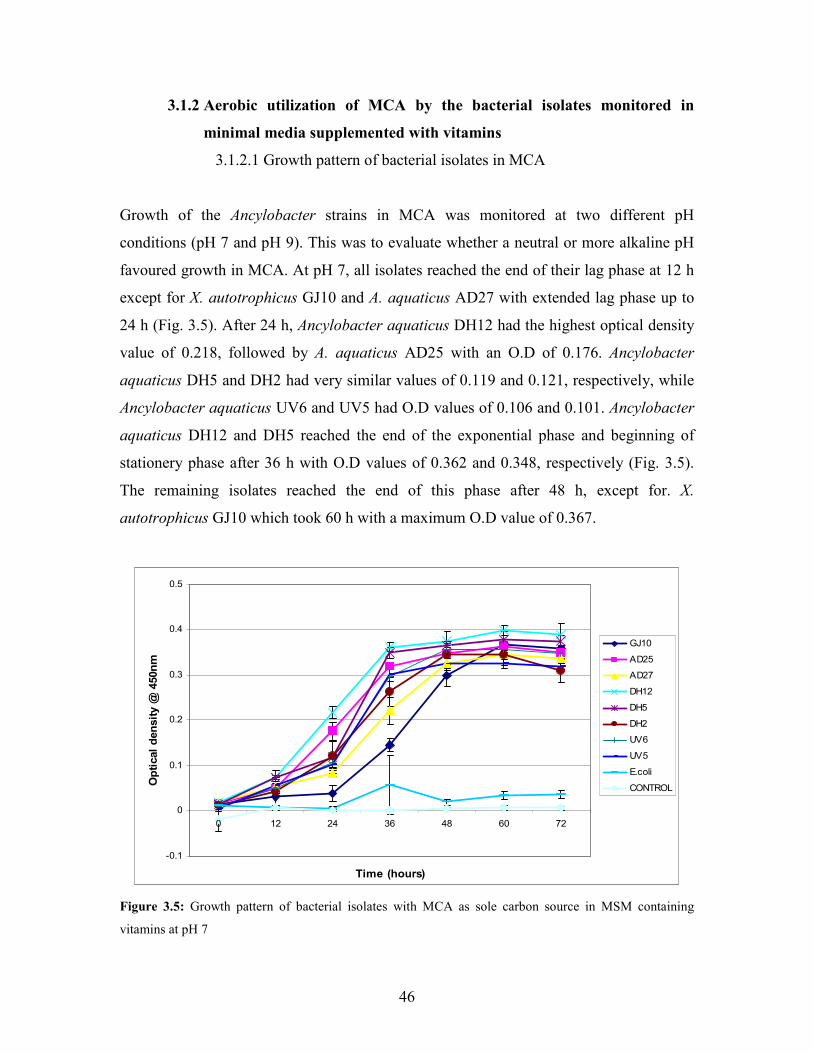
46
3.1.2 Aerobic utilization of MCA by the bacterial isolates monitored in
minimal media supplemented with vitamins
3.1.2.1 Growth pattern of bacterial isolates in MCA
Growth of the Ancylobacter strains in MCA was monitored at two different pH
conditions (pH 7 and pH 9). This was to evaluate whether a neutral or more alkaline pH
favoured growth in MCA. At pH 7, all isolates reached the end of their lag phase at 12 h
except for X. autotrophicus GJ10 and A. aquaticus AD27 with extended lag phase up to
24 h (Fig. 3.5). After 24 h, Ancylobacter aquaticus DH12 had the highest optical density
value of 0.218, followed by A. aquaticus AD25 with an O.D of 0.176. Ancylobacter
aquaticus DH5 and DH2 had very similar values of 0.119 and 0.121, respectively, while
Ancylobacter aquaticus UV6 and UV5 had O.D values of 0.106 and 0.101. Ancylobacter
aquaticus DH12 and DH5 reached the end of the exponential phase and beginning of
stationery phase after 36 h with O.D values of 0.362 and 0.348, respectively (Fig. 3.5).
The remaining isolates reached the end of this phase after 48 h, except for. X.
autotrophicus GJ10 which took 60 h with a maximum O.D value of 0.367.
-0.1
0
0.1
0.2
0.3
0.4
0.5
0 12 24 36 48 60 72
Time (hours)
Op
tica
l d
ensi
ty @
450
nm
GJ10
AD25
AD27
DH12
DH5
DH2
UV6
UV5
E.coli
CONTROL
Figure 3.5: Growth pattern of bacterial isolates with MCA as sole carbon source in MSM containing
vitamins at pH 7
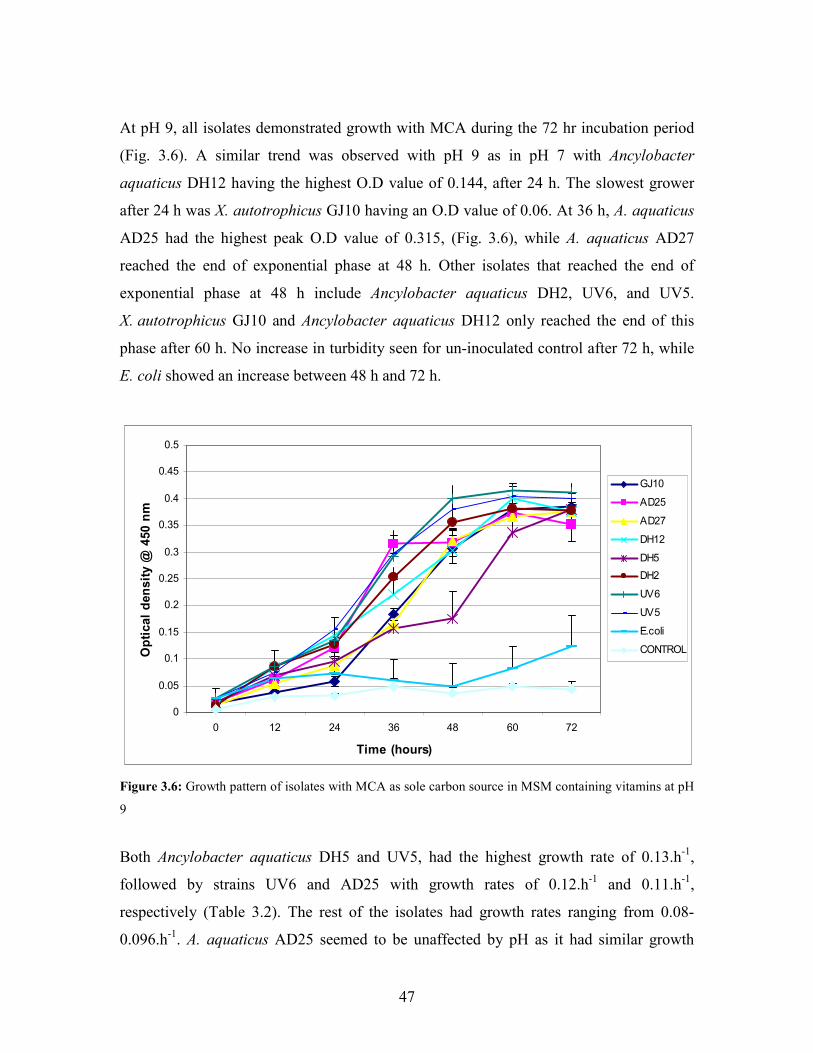
47
At pH 9, all isolates demonstrated growth with MCA during the 72 hr incubation period
(Fig. 3.6). A similar trend was observed with pH 9 as in pH 7 with Ancylobacter
aquaticus DH12 having the highest O.D value of 0.144, after 24 h. The slowest grower
after 24 h was X. autotrophicus GJ10 having an O.D value of 0.06. At 36 h, A. aquaticus
AD25 had the highest peak O.D value of 0.315, (Fig. 3.6), while A. aquaticus AD27
reached the end of exponential phase at 48 h. Other isolates that reached the end of
exponential phase at 48 h include Ancylobacter aquaticus DH2, UV6, and UV5.
X. autotrophicus GJ10 and Ancylobacter aquaticus DH12 only reached the end of this
phase after 60 h. No increase in turbidity seen for un-inoculated control after 72 h, while
E. coli showed an increase between 48 h and 72 h.
0
0.05
0.1
0.15
0.2
0.25
0.3
0.35
0.4
0.45
0.5
0 12 24 36 48 60 72
Time (hours)
Op
tica
l d
ensi
ty @
450
nm
GJ10
AD25
AD27
DH12
DH5
DH2
UV6
UV5
E.coli
CONTROL
Figure 3.6: Growth pattern of isolates with MCA as sole carbon source in MSM containing vitamins at pH
9
Both Ancylobacter aquaticus DH5 and UV5, had the highest growth rate of 0.13.h-1,
followed by strains UV6 and AD25 with growth rates of 0.12.h-1 and 0.11.h-1,
respectively (Table 3.2). The rest of the isolates had growth rates ranging from 0.08-
0.096.h-1. A. aquaticus AD25 seemed to be unaffected by pH as it had similar growth
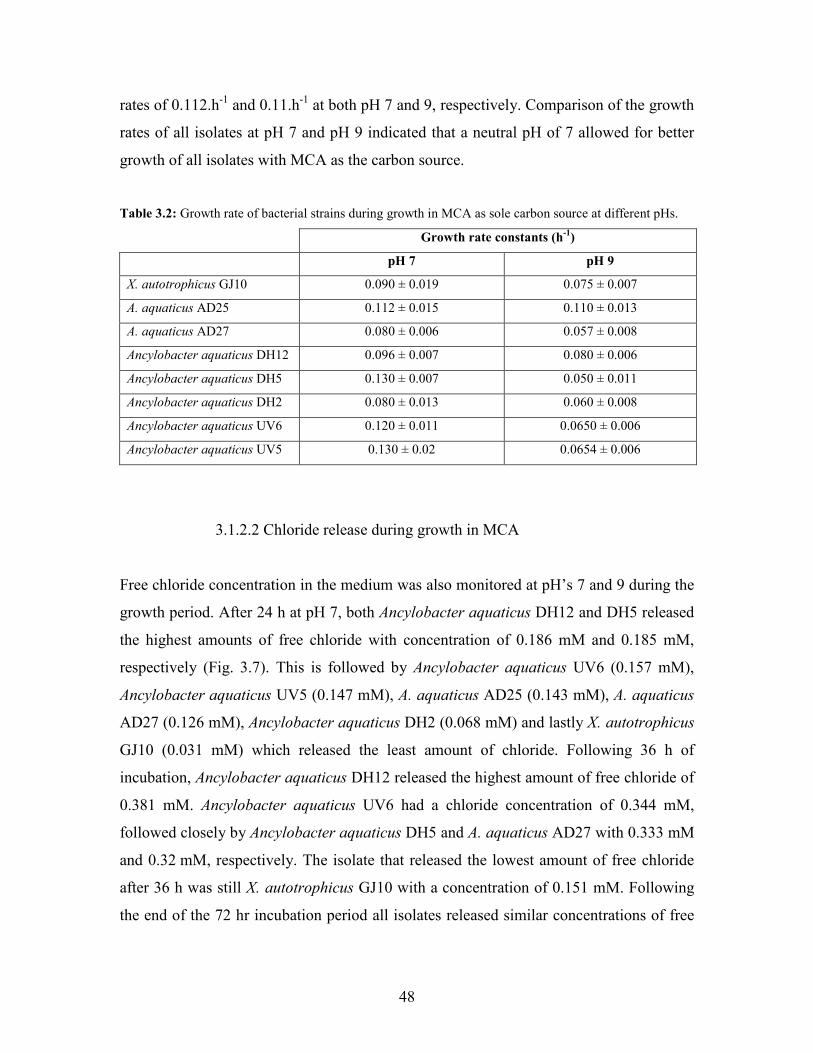
48
rates of 0.112.h-1 and 0.11.h-1 at both pH 7 and 9, respectively. Comparison of the growth
rates of all isolates at pH 7 and pH 9 indicated that a neutral pH of 7 allowed for better
growth of all isolates with MCA as the carbon source.
Table 3.2: Growth rate of bacterial strains during growth in MCA as sole carbon source at different pHs.
Growth rate constants (h-1)
pH 7 pH 9
X. autotrophicus GJ10 0.090 ± 0.019 0.075 ± 0.007
A. aquaticus AD25 0.112 ± 0.015 0.110 ± 0.013
A. aquaticus AD27 0.080 ± 0.006 0.057 ± 0.008
Ancylobacter aquaticus DH12 0.096 ± 0.007 0.080 ± 0.006
Ancylobacter aquaticus DH5 0.130 ± 0.007 0.050 ± 0.011
Ancylobacter aquaticus DH2 0.080 ± 0.013 0.060 ± 0.008
Ancylobacter aquaticus UV6 0.120 ± 0.011 0.0650 ± 0.006
Ancylobacter aquaticus UV5 0.130 ± 0.02 0.0654 ± 0.006
3.1.2.2 Chloride release during growth in MCA
Free chloride concentration in the medium was also monitored at pH’s 7 and 9 during the
growth period. After 24 h at pH 7, both Ancylobacter aquaticus DH12 and DH5 released
the highest amounts of free chloride with concentration of 0.186 mM and 0.185 mM,
respectively (Fig. 3.7). This is followed by Ancylobacter aquaticus UV6 (0.157 mM),
Ancylobacter aquaticus UV5 (0.147 mM), A. aquaticus AD25 (0.143 mM), A. aquaticus
AD27 (0.126 mM), Ancylobacter aquaticus DH2 (0.068 mM) and lastly X. autotrophicus
GJ10 (0.031 mM) which released the least amount of chloride. Following 36 h of
incubation, Ancylobacter aquaticus DH12 released the highest amount of free chloride of
0.381 mM. Ancylobacter aquaticus UV6 had a chloride concentration of 0.344 mM,
followed closely by Ancylobacter aquaticus DH5 and A. aquaticus AD27 with 0.333 mM
and 0.32 mM, respectively. The isolate that released the lowest amount of free chloride
after 36 h was still X. autotrophicus GJ10 with a concentration of 0.151 mM. Following
the end of the 72 hr incubation period all isolates released similar concentrations of free
49
chloride ranging from 0.256-0.346 mM (Fig. 3.8). Both negative controls did not show
any significant increases in chloride concentration.
0
0.1
0.2
0.3
0.4
0.5
0.6
GJ10
AD25
AD27
DH12
DH5
DH2
UV6
UV5
E.coli
CONTRO
L
Bacterial Isolates
Ch
lori
de
Co
nce
ntr
atio
n (
mM
)
0 h
24 h
48 h
72 h
Figure 3.7: Concentration of chloride released during growth on MCA in MSM containing vitamins at pH7
Following the 72 h incubation period at pH 9 (Fig. 3.8), the isolates that released the
highest concentration of free chloride were Ancylobacter aquaticus DH12 and DH2 with
concentrations of 0.407 mM and 0.408 mM, respectively. The isolate that released the
least free chloride ions after 72 h was A. aquaticus AD25 with 0.224 mM, while the rest
of the isolates release free chloride in the range of 0.259-0.386 mM (Fig. 3.8). In all
cases, growth was accompanied by halide release which significantly (p-value<0.05)
exceeded the values obtained for the un-inoculated controls, which had no significant
increases.
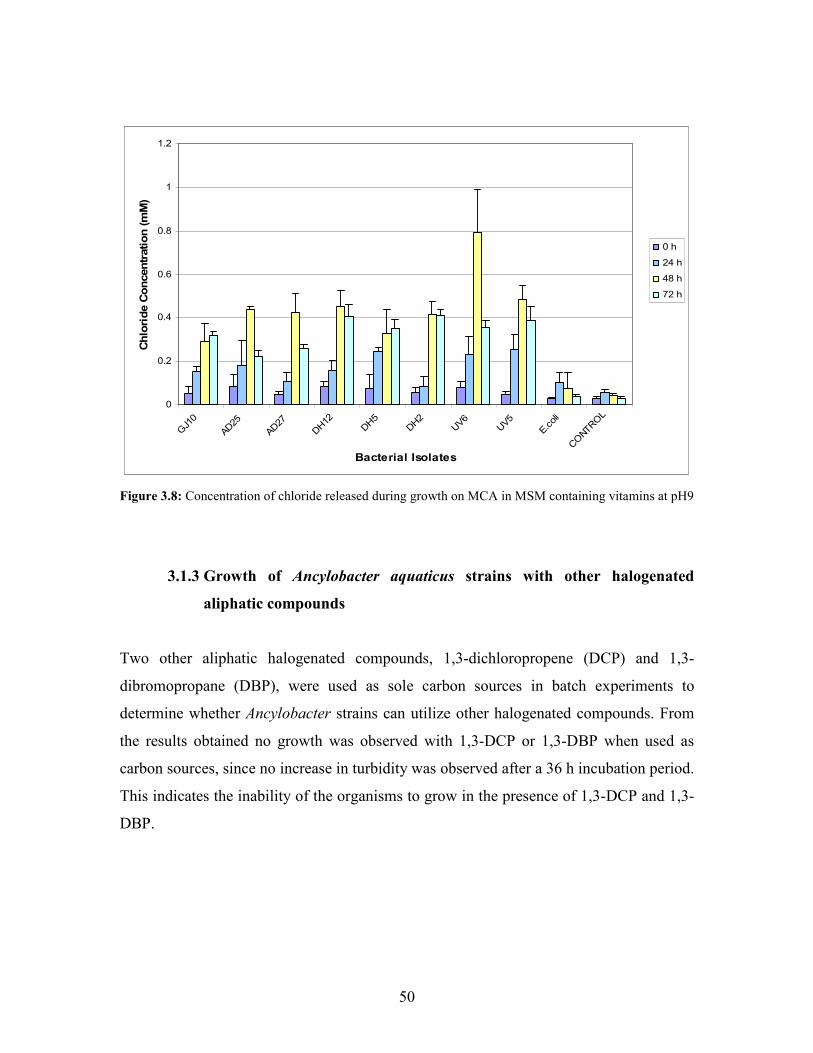
50
0
0.2
0.4
0.6
0.8
1
1.2
GJ10
AD25
AD27
DH12
DH5
DH2
UV6
UV5
E.coli
CONTRO
L
Bacterial Isolates
Ch
lori
de
Co
nce
ntr
atio
n (
mM
)
0 h
24 h
48 h
72 h
Figure 3.8: Concentration of chloride released during growth on MCA in MSM containing vitamins at pH9
3.1.3 Growth of Ancylobacter aquaticus strains with other halogenated
aliphatic compounds
Two other aliphatic halogenated compounds, 1,3-dichloropropene (DCP) and 1,3-
dibromopropane (DBP), were used as sole carbon sources in batch experiments to
determine whether Ancylobacter strains can utilize other halogenated compounds. From
the results obtained no growth was observed with 1,3-DCP or 1,3-DBP when used as
carbon sources, since no increase in turbidity was observed after a 36 h incubation period.
This indicates the inability of the organisms to grow in the presence of 1,3-DCP and 1,3-
DBP.
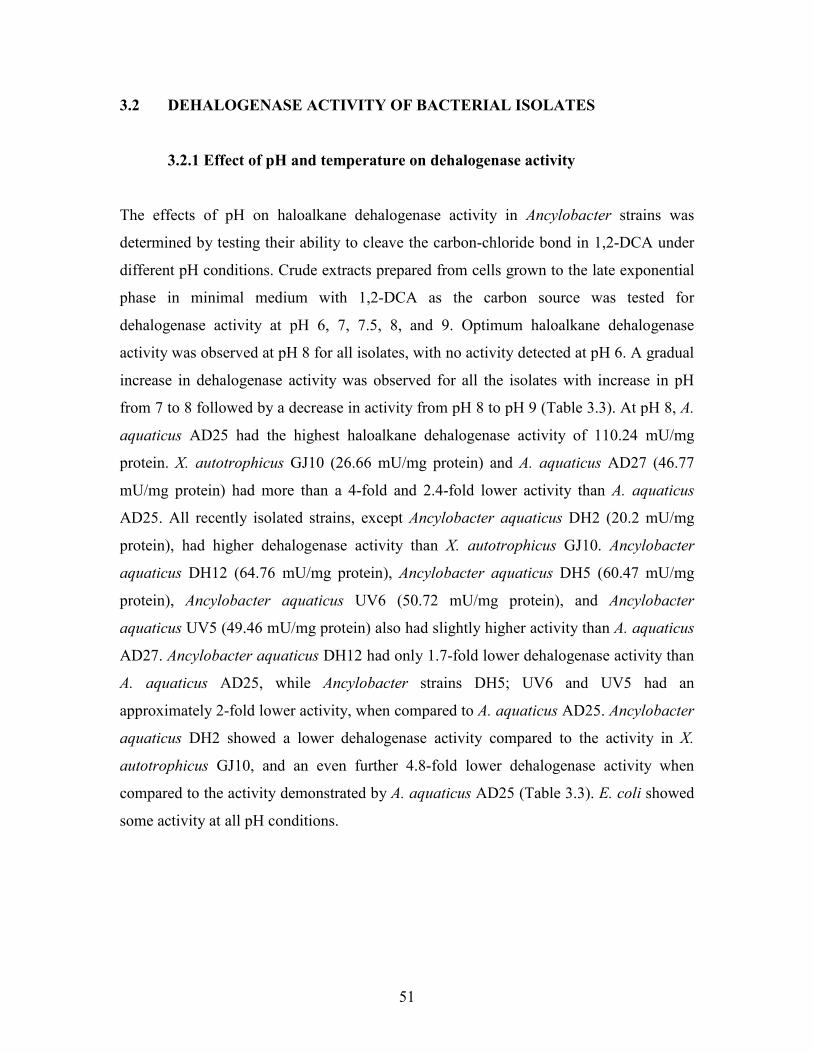
51
3.2 DEHALOGENASE ACTIVITY OF BACTERIAL ISOLATES
3.2.1 Effect of pH and temperature on dehalogenase activity
The effects of pH on haloalkane dehalogenase activity in Ancylobacter strains was
determined by testing their ability to cleave the carbon-chloride bond in 1,2-DCA under
different pH conditions. Crude extracts prepared from cells grown to the late exponential
phase in minimal medium with 1,2-DCA as the carbon source was tested for
dehalogenase activity at pH 6, 7, 7.5, 8, and 9. Optimum haloalkane dehalogenase
activity was observed at pH 8 for all isolates, with no activity detected at pH 6. A gradual
increase in dehalogenase activity was observed for all the isolates with increase in pH
from 7 to 8 followed by a decrease in activity from pH 8 to pH 9 (Table 3.3). At pH 8, A.
aquaticus AD25 had the highest haloalkane dehalogenase activity of 110.24 mU/mg
protein. X. autotrophicus GJ10 (26.66 mU/mg protein) and A. aquaticus AD27 (46.77
mU/mg protein) had more than a 4-fold and 2.4-fold lower activity than A. aquaticus
AD25. All recently isolated strains, except Ancylobacter aquaticus DH2 (20.2 mU/mg
protein), had higher dehalogenase activity than X. autotrophicus GJ10. Ancylobacter
aquaticus DH12 (64.76 mU/mg protein), Ancylobacter aquaticus DH5 (60.47 mU/mg
protein), Ancylobacter aquaticus UV6 (50.72 mU/mg protein), and Ancylobacter
aquaticus UV5 (49.46 mU/mg protein) also had slightly higher activity than A. aquaticus
AD27. Ancylobacter aquaticus DH12 had only 1.7-fold lower dehalogenase activity than
A. aquaticus AD25, while Ancylobacter strains DH5; UV6 and UV5 had an
approximately 2-fold lower activity, when compared to A. aquaticus AD25. Ancylobacter
aquaticus DH2 showed a lower dehalogenase activity compared to the activity in X.
autotrophicus GJ10, and an even further 4.8-fold lower dehalogenase activity when
compared to the activity demonstrated by A. aquaticus AD25 (Table 3.3). E. coli showed
some activity at all pH conditions.
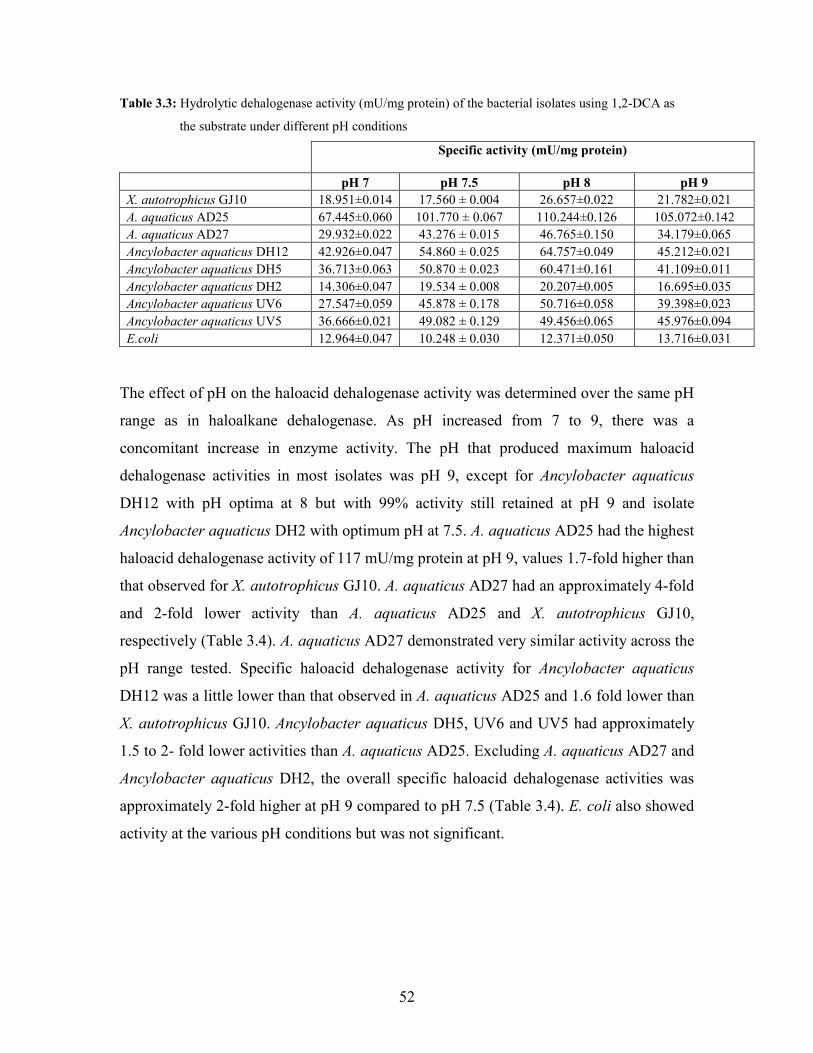
52
Table 3.3: Hydrolytic dehalogenase activity (mU/mg protein) of the bacterial isolates using 1,2-DCA as
the substrate under different pH conditions
Specific activity (mU/mg protein)
pH 7 pH 7.5 pH 8 pH 9 X. autotrophicus GJ10 18.951±0.014 17.560 ± 0.004 26.657±0.022 21.782±0.021 A. aquaticus AD25 67.445±0.060 101.770 ± 0.067 110.244±0.126 105.072±0.142 A. aquaticus AD27 29.932±0.022 43.276 ± 0.015 46.765±0.150 34.179±0.065 Ancylobacter aquaticus DH12 42.926±0.047 54.860 ± 0.025 64.757±0.049 45.212±0.021 Ancylobacter aquaticus DH5 36.713±0.063 50.870 ± 0.023 60.471±0.161 41.109±0.011 Ancylobacter aquaticus DH2 14.306±0.047 19.534 ± 0.008 20.207±0.005 16.695±0.035 Ancylobacter aquaticus UV6 27.547±0.059 45.878 ± 0.178 50.716±0.058 39.398±0.023 Ancylobacter aquaticus UV5 36.666±0.021 49.082 ± 0.129 49.456±0.065 45.976±0.094 E.coli 12.964±0.047 10.248 ± 0.030 12.371±0.050 13.716±0.031
The effect of pH on the haloacid dehalogenase activity was determined over the same pH
range as in haloalkane dehalogenase. As pH increased from 7 to 9, there was a
concomitant increase in enzyme activity. The pH that produced maximum haloacid
dehalogenase activities in most isolates was pH 9, except for Ancylobacter aquaticus
DH12 with pH optima at 8 but with 99% activity still retained at pH 9 and isolate
Ancylobacter aquaticus DH2 with optimum pH at 7.5. A. aquaticus AD25 had the highest
haloacid dehalogenase activity of 117 mU/mg protein at pH 9, values 1.7-fold higher than
that observed for X. autotrophicus GJ10. A. aquaticus AD27 had an approximately 4-fold
and 2-fold lower activity than A. aquaticus AD25 and X. autotrophicus GJ10,
respectively (Table 3.4). A. aquaticus AD27 demonstrated very similar activity across the
pH range tested. Specific haloacid dehalogenase activity for Ancylobacter aquaticus
DH12 was a little lower than that observed in A. aquaticus AD25 and 1.6 fold lower than
X. autotrophicus GJ10. Ancylobacter aquaticus DH5, UV6 and UV5 had approximately
1.5 to 2- fold lower activities than A. aquaticus AD25. Excluding A. aquaticus AD27 and
Ancylobacter aquaticus DH2, the overall specific haloacid dehalogenase activities was
approximately 2-fold higher at pH 9 compared to pH 7.5 (Table 3.4). E. coli also showed
activity at the various pH conditions but was not significant.
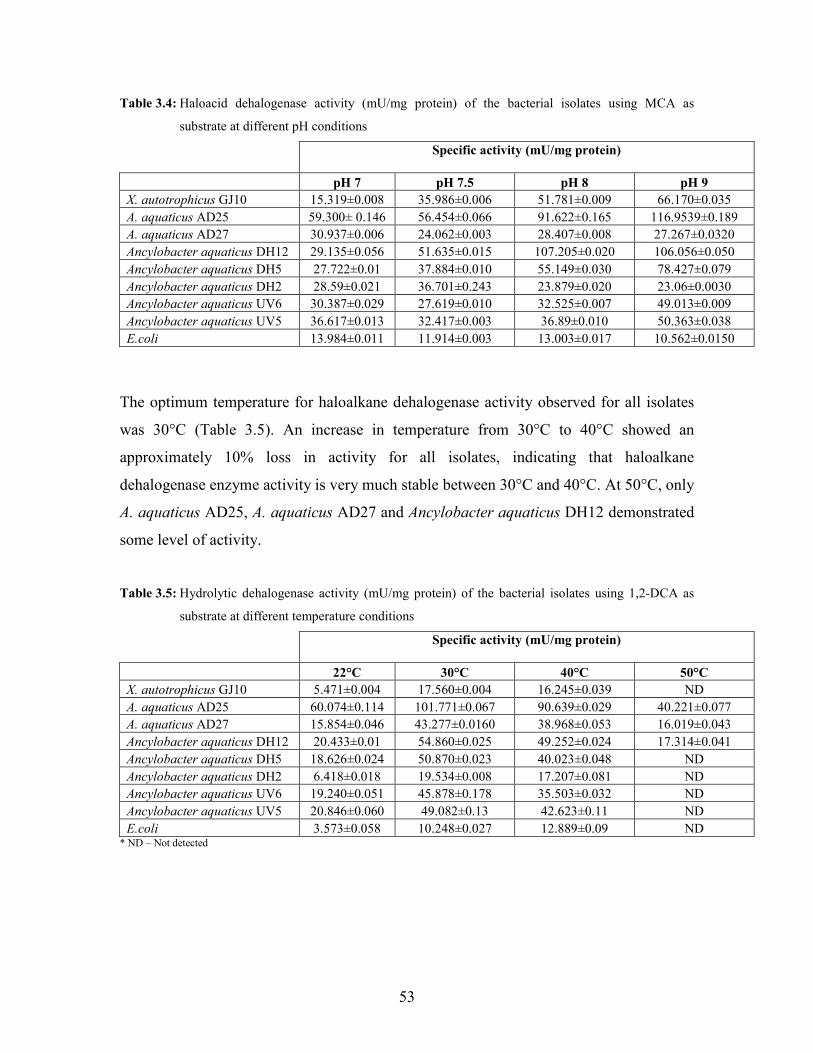
53
Table 3.4: Haloacid dehalogenase activity (mU/mg protein) of the bacterial isolates using MCA as
substrate at different pH conditions
Specific activity (mU/mg protein)
pH 7 pH 7.5 pH 8 pH 9 X. autotrophicus GJ10 15.319±0.008 35.986±0.006 51.781±0.009 66.170±0.035 A. aquaticus AD25 59.300± 0.146 56.454±0.066 91.622±0.165 116.9539±0.189 A. aquaticus AD27 30.937±0.006 24.062±0.003 28.407±0.008 27.267±0.0320 Ancylobacter aquaticus DH12 29.135±0.056 51.635±0.015 107.205±0.020 106.056±0.050 Ancylobacter aquaticus DH5 27.722±0.01 37.884±0.010 55.149±0.030 78.427±0.079 Ancylobacter aquaticus DH2 28.59±0.021 36.701±0.243 23.879±0.020 23.06±0.0030 Ancylobacter aquaticus UV6 30.387±0.029 27.619±0.010 32.525±0.007 49.013±0.009 Ancylobacter aquaticus UV5 36.617±0.013 32.417±0.003 36.89±0.010 50.363±0.038 E.coli 13.984±0.011 11.914±0.003 13.003±0.017 10.562±0.0150
The optimum temperature for haloalkane dehalogenase activity observed for all isolates
was 30°C (Table 3.5). An increase in temperature from 30°C to 40°C showed an
approximately 10% loss in activity for all isolates, indicating that haloalkane
dehalogenase enzyme activity is very much stable between 30°C and 40°C. At 50°C, only
A. aquaticus AD25, A. aquaticus AD27 and Ancylobacter aquaticus DH12 demonstrated
some level of activity.
Table 3.5: Hydrolytic dehalogenase activity (mU/mg protein) of the bacterial isolates using 1,2-DCA as
substrate at different temperature conditions
Specific activity (mU/mg protein)
22°C 30°C 40°C 50°C X. autotrophicus GJ10 5.471±0.004 17.560±0.004 16.245±0.039 ND A. aquaticus AD25 60.074±0.114 101.771±0.067 90.639±0.029 40.221±0.077 A. aquaticus AD27 15.854±0.046 43.277±0.0160 38.968±0.053 16.019±0.043 Ancylobacter aquaticus DH12 20.433±0.01 54.860±0.025 49.252±0.024 17.314±0.041 Ancylobacter aquaticus DH5 18.626±0.024 50.870±0.023 40.023±0.048 ND Ancylobacter aquaticus DH2 6.418±0.018 19.534±0.008 17.207±0.081 ND Ancylobacter aquaticus UV6 19.240±0.051 45.878±0.178 35.503±0.032 ND Ancylobacter aquaticus UV5 20.846±0.060 49.082±0.13 42.623±0.11 ND E.coli 3.573±0.058 10.248±0.027 12.889±0.09 ND
* ND – Not detected
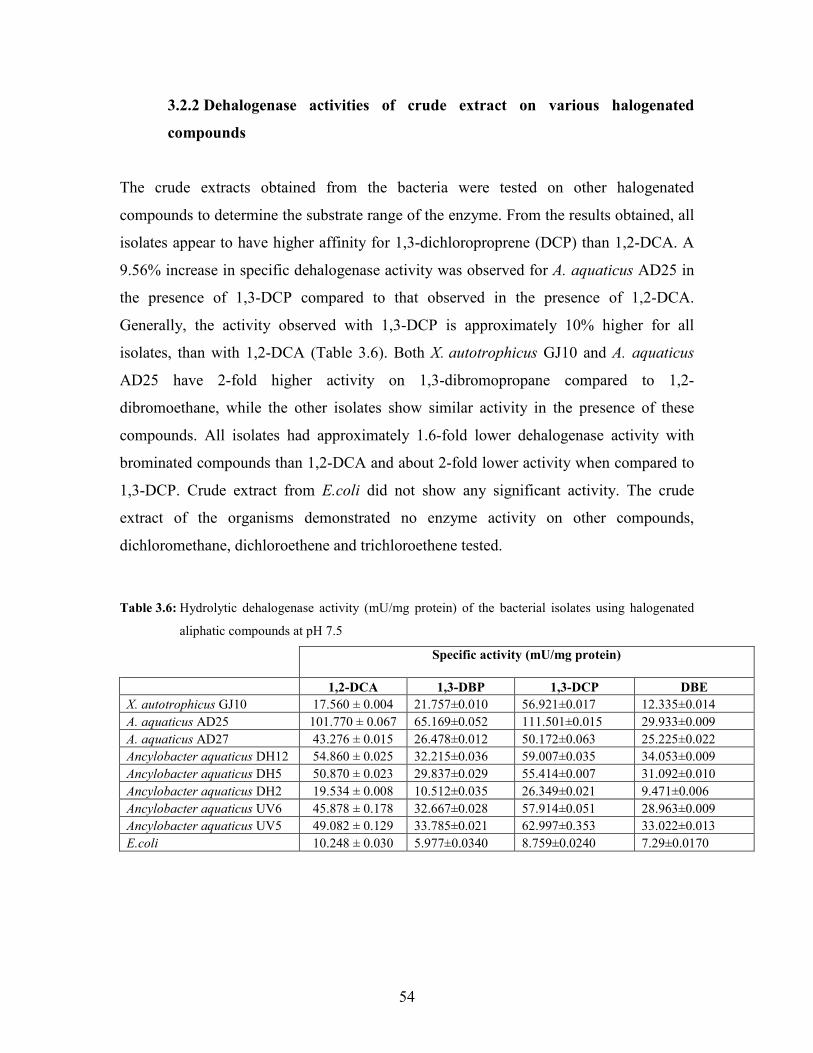
54
3.2.2 Dehalogenase activities of crude extract on various halogenated
compounds
The crude extracts obtained from the bacteria were tested on other halogenated
compounds to determine the substrate range of the enzyme. From the results obtained, all
isolates appear to have higher affinity for 1,3-dichloroproprene (DCP) than 1,2-DCA. A
9.56% increase in specific dehalogenase activity was observed for A. aquaticus AD25 in
the presence of 1,3-DCP compared to that observed in the presence of 1,2-DCA.
Generally, the activity observed with 1,3-DCP is approximately 10% higher for all
isolates, than with 1,2-DCA (Table 3.6). Both X. autotrophicus GJ10 and A. aquaticus
AD25 have 2-fold higher activity on 1,3-dibromopropane compared to 1,2-
dibromoethane, while the other isolates show similar activity in the presence of these
compounds. All isolates had approximately 1.6-fold lower dehalogenase activity with
brominated compounds than 1,2-DCA and about 2-fold lower activity when compared to
1,3-DCP. Crude extract from E.coli did not show any significant activity. The crude
extract of the organisms demonstrated no enzyme activity on other compounds,
dichloromethane, dichloroethene and trichloroethene tested.
Table 3.6: Hydrolytic dehalogenase activity (mU/mg protein) of the bacterial isolates using halogenated
aliphatic compounds at pH 7.5
Specific activity (mU/mg protein)
1,2-DCA 1,3-DBP 1,3-DCP DBE X. autotrophicus GJ10 17.560 ± 0.004 21.757±0.010 56.921±0.017 12.335±0.014 A. aquaticus AD25 101.770 ± 0.067 65.169±0.052 111.501±0.015 29.933±0.009 A. aquaticus AD27 43.276 ± 0.015 26.478±0.012 50.172±0.063 25.225±0.022 Ancylobacter aquaticus DH12 54.860 ± 0.025 32.215±0.036 59.007±0.035 34.053±0.009 Ancylobacter aquaticus DH5 50.870 ± 0.023 29.837±0.029 55.414±0.007 31.092±0.010 Ancylobacter aquaticus DH2 19.534 ± 0.008 10.512±0.035 26.349±0.021 9.471±0.006 Ancylobacter aquaticus UV6 45.878 ± 0.178 32.667±0.028 57.914±0.051 28.963±0.009 Ancylobacter aquaticus UV5 49.082 ± 0.129 33.785±0.021 62.997±0.353 33.022±0.013 E.coli 10.248 ± 0.030 5.977±0.0340 8.759±0.0240 7.29±0.0170
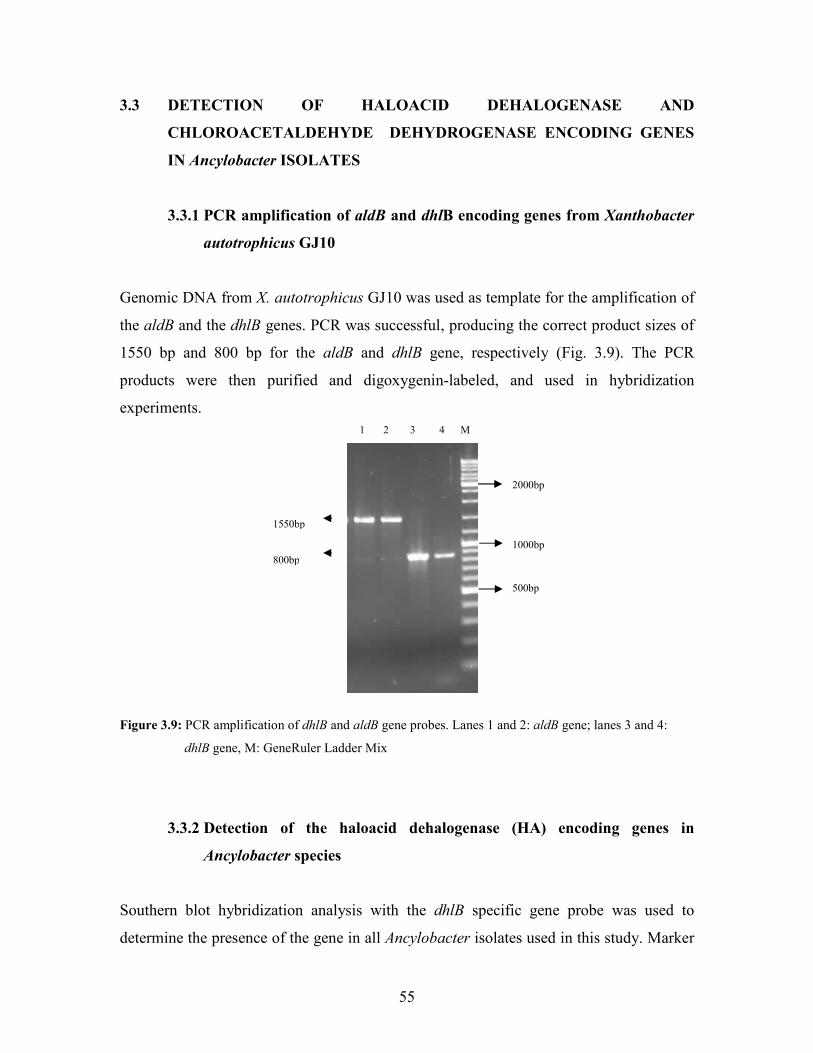
55
3.3 DETECTION OF HALOACID DEHALOGENASE AND
CHLOROACETALDEHYDE DEHYDROGENASE ENCODING GENES
IN Ancylobacter ISOLATES
3.3.1 PCR amplification of aldB and dhlB encoding genes from Xanthobacter
autotrophicus GJ10
Genomic DNA from X. autotrophicus GJ10 was used as template for the amplification of
the aldB and the dhlB genes. PCR was successful, producing the correct product sizes of
1550 bp and 800 bp for the aldB and dhlB gene, respectively (Fig. 3.9). The PCR
products were then purified and digoxygenin-labeled, and used in hybridization
experiments.
Figure 3.9: PCR amplification of dhlB and aldB gene probes. Lanes 1 a
dhlB gene, M: GeneRuler Ladder Mix
3.3.2 Detection of the haloacid dehalogenase
Ancylobacter species
Southern blot hybridization analysis with the dhlB speci
determine the presence of the gene in all Ancylobacter isola
1 2 3 4 M
2000bp
500bp
1000bp
800bp1550bp
nd 2: aldB gene; lanes 3 and 4:
(HA) encoding genes in
fic gene probe was used to
tes used in this study. Marker
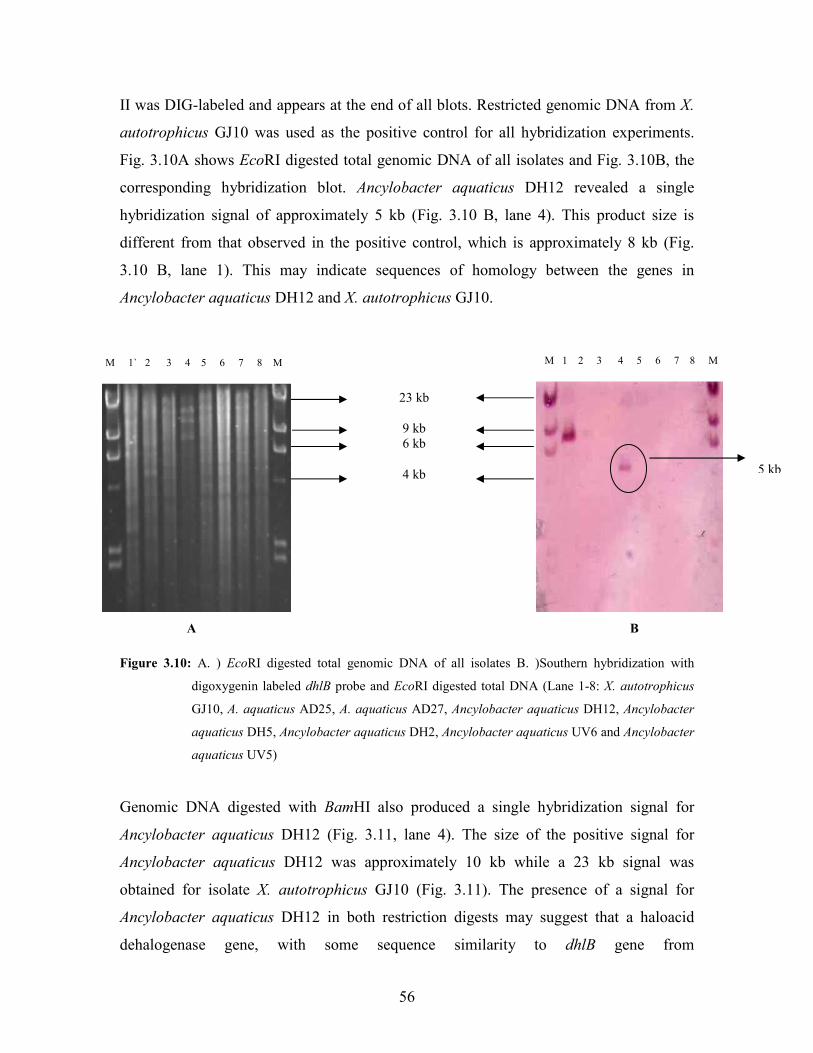
56
II was DIG-labeled and appears at the end of all blots. Restricted genomic DNA from X.
autotrophicus GJ10 was used as the positive control for all hybridization experiments.
Fig. 3.10A shows EcoRI digested total genomic DNA of all isolates and Fig. 3.10B, the
corresponding hybridization blot. Ancylobacter aquaticus DH12 revealed a single
hybridization signal of approximately 5 kb (Fig. 3.10 B, lane 4). This product size is
different from that observed in the positive control, which is approximately 8 kb (Fig.
3.10 B, lane 1). This may indicate sequences of homology between the genes in
Ancylobacter aquaticus DH12 and X. autotrophicus GJ10.
Figure 3.10: A. ) EcoRI digested total genomic DNA of all isolates B. )Southern hybridization with
digoxygenin labeled dhlB probe and EcoRI digested total DNA (Lane 1-8: X. autotrophicus
GJ10, A. aquaticus AD25, A. aquaticus AD27, Ancylobacter aquaticus DH12, Ancylobacter
aquaticus DH5, Ancylobacter aquaticus DH2, Ancylobacter aquaticus UV6 and Ancylobacter
aquaticus UV5)
Genomic DNA digested with BamHI also produced a single hybridization signal for
Ancylobacter aquaticus DH12 (Fig. 3.11, lane 4). The size of the positive signal for
Ancylobacter aquaticus DH12 was approximately 10 kb while a 23 kb signal was
obtained for isolate X. autotrophicus GJ10 (Fig. 3.11). The presence of a signal for
Ancylobacter aquaticus DH12 in both restriction digests may suggest that a haloacid
dehalogenase gene, with some sequence similarity to dhlB gene from
M 1` 2 3 4 5 6 7 8 M M 1 2 3 4 5 6 7 8 M
23 kb
9 kb 6 kb
4 kb
5 kbB
A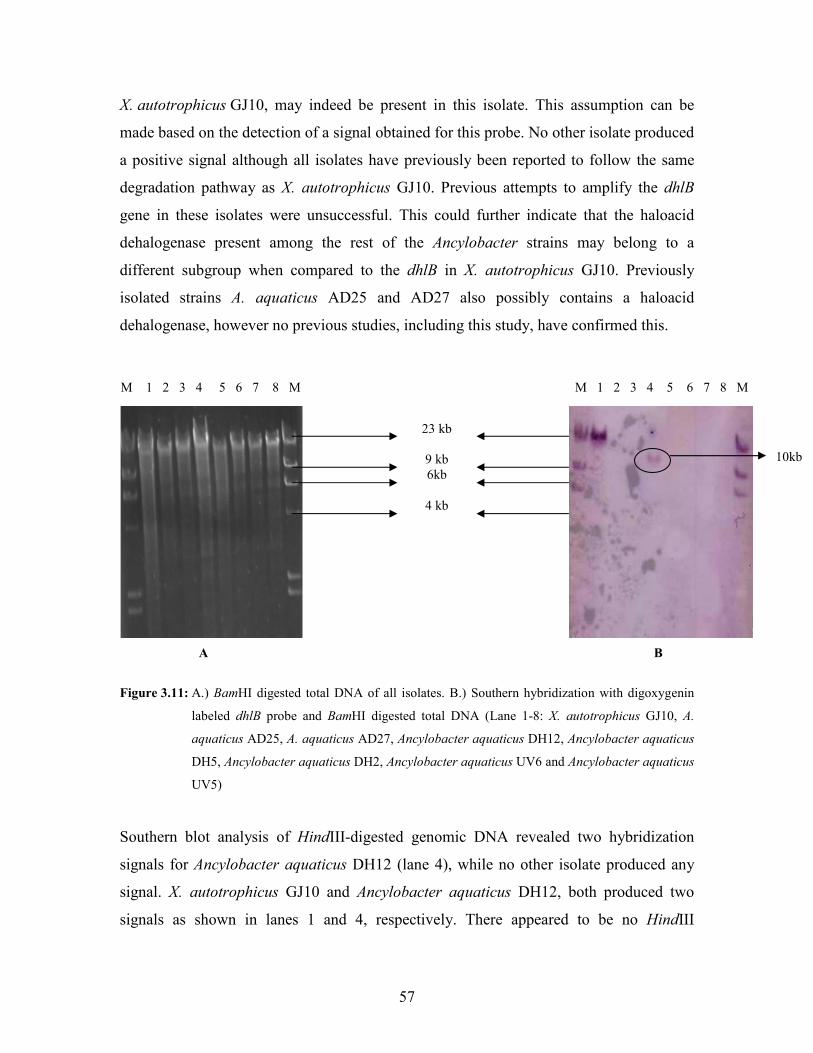
57
X. autotrophicus GJ10, may indeed be present in this isolate. This assumption can be
made based on the detection of a signal obtained for this probe. No other isolate produced
a positive signal although all isolates have previously been reported to follow the same
degradation pathway as X. autotrophicus GJ10. Previous attempts to amplify the dhlB
gene in these isolates were unsuccessful. This could further indicate that the haloacid
dehalogenase present among the rest of the Ancylobacter strains may belong to a
different subgroup when compared to the dhlB in X. autotrophicus GJ10. Previously
isolated strains A. aquaticus AD25 and AD27 also possibly contains a haloacid
dehalogenase, however no previous studies, including this study, have confirmed this.
Figure 3.11: A.) BamHI digested total DNA of all isolates. B.) Southern hybridization with digoxygenin
labeled dhlB probe and BamHI digested total DNA (Lane 1-8: X. autotrophicus GJ10, A.
aquaticus AD25, A. aquaticus AD27, Ancylobacter aquaticus DH12, Ancylobacter aquaticus
DH5, Ancylobacter aquaticus DH2, Ancylobacter aquaticus UV6 and Ancylobacter aquaticus
UV5)
Southern blot analysis of HindIII-digested genomic DNA revealed two hybridization
signals for Ancylobacter aquaticus DH12 (lane 4), while no other isolate produced any
signal. X. autotrophicus GJ10 and Ancylobacter aquaticus DH12, both produced two
signals as shown in lanes 1 and 4, respectively. There appeared to be no HindIII
B
M 1 2 3 4 5 6 7 8 M M 1 2 3 4 5 6 7 8 M
23 kb
9 kb 6kb
4 kb
A
10kb
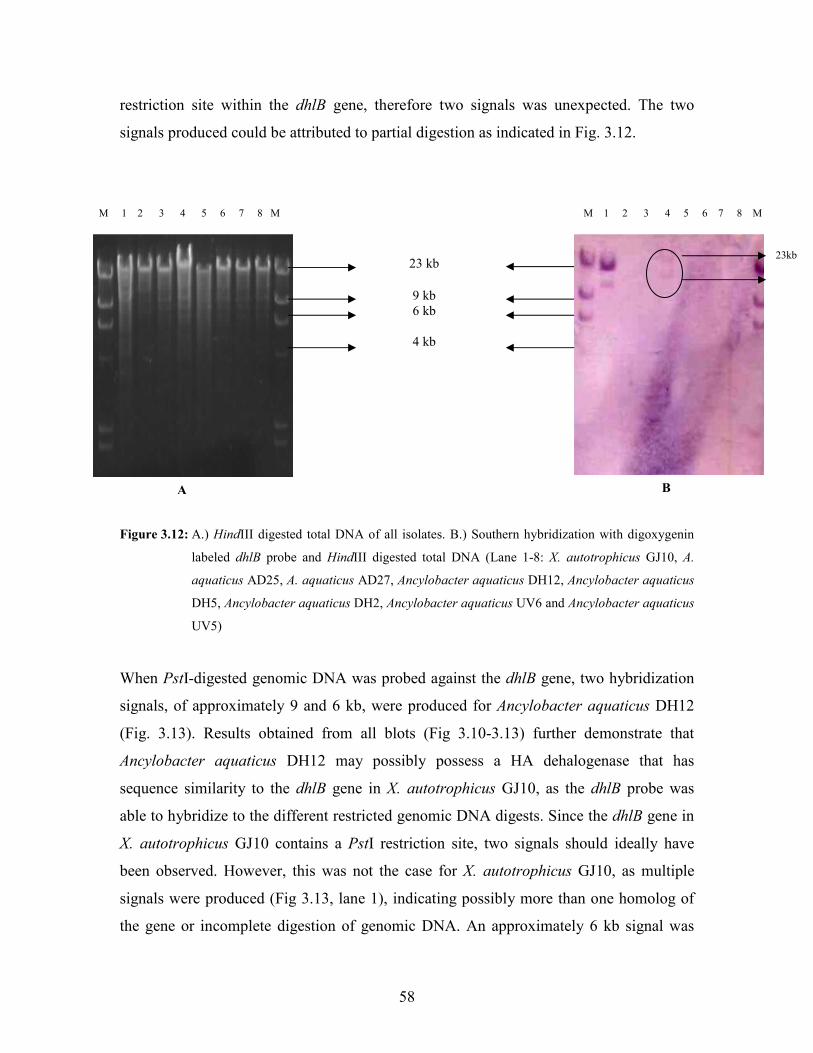
58
restriction site within the dhlB gene, therefore two signals was unexpected. The two
signals produced could be attributed to partial digestion as indicated in Fig. 3.12.
Figure 3.12: A.) HindIII digested total DNA of all isolates. B.) Southern hybridization with digoxygenin
labeled dhlB probe and HindIII digested total DNA (Lane 1-8: X. autotrophicus GJ10, A.
aquaticus AD25, A. aquaticus AD27, Ancylobacter aquaticus DH12, Ancylobacter aquaticus
DH5, Ancylobacter aquaticus DH2, Ancylobacter aquaticus UV6 and Ancylobacter aquaticus
UV5)
When PstI-digested genomic DNA was probed against the dhlB gene, two hybridi
signals, of approximately 9 and 6 kb, were produced for Ancylobacter aquaticus
(Fig. 3.13). Results obtained from all blots (Fig 3.10-3.13) further demonstrat
Ancylobacter aquaticus DH12 may possibly possess a HA dehalogenase tha
sequence similarity to the dhlB gene in X. autotrophicus GJ10, as the dhlB prob
able to hybridize to the different restricted genomic DNA digests. Since the dhlB g
X. autotrophicus GJ10 contains a PstI restriction site, two signals should ideally
been observed. However, this was not the case for X. autotrophicus GJ10, as m
signals were produced (Fig 3.13, lane 1), indicating possibly more than one homo
the gene or incomplete digestion of genomic DNA. An approximately 6 kb sign
23 kb
9 kb 6 kb
4 kb
M 1 2 3 4 5 6 7 8 M M 1 2 3 4 5 6 7 8 M M 1 2 3 4 5 6 7 8 M
A B
23kb
zation
DH12
e that
t has
e was
ene in
have
ultiple
log of
al was
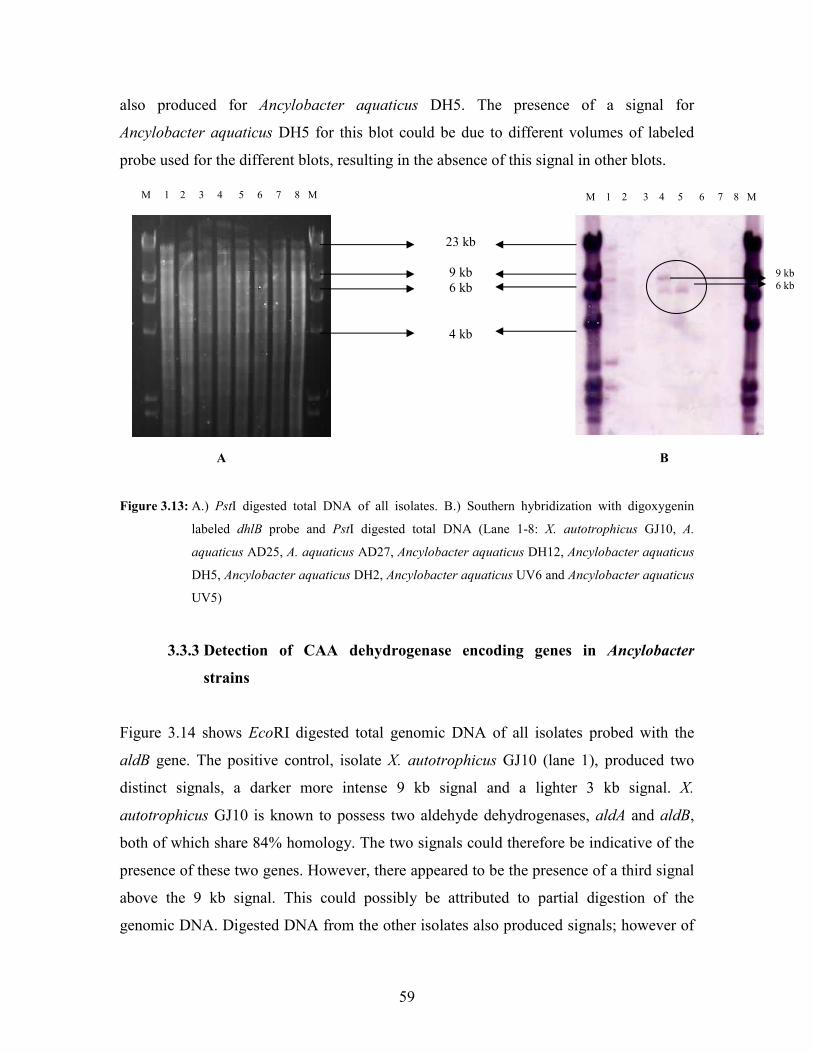
59
also produced for Ancylobacter aquaticus DH5. The presence of a signal for
Ancylobacter aquaticus DH5 for this blot could be due to different volumes of labeled
probe used for the different blots, resulting in the absence of this signal in other blots.
Figure 3.13: A.) PstI digested total DNA of all isolates. B.) Southern hybridization with digoxygenin
labeled dhlB probe and PstI digested total DNA (Lane 1-8: X. autotrophicus GJ10, A.
aquaticus AD25, A. aquaticus AD27, Ancylobacter aquaticus DH12, Ancylobacter aquaticus
DH5, Ancylobacter aquaticus DH2, Ancylobacter aquaticus UV6 and Ancylobacter aquaticus
UV5)
3.3.3 Detection of CAA dehydrogenase encoding genes in Ancylobacter
strains
Figure 3.14 shows EcoRI digested total genomic DNA of all isolates probed with the
aldB gene. The positive control, isolate X. autotrophicus GJ10 (lane 1), produced two
distinct signals, a darker more intense 9 kb signal and a lighter 3 kb signal. X.
autotrophicus GJ10 is known to possess two aldehyde dehydrogenases, aldA and aldB,
both of which share 84% homology. The two signals could therefore be indicative of the
presence of these two genes. However, there appeared to be the presence of a third signal
above the 9 kb signal. This could possibly be attributed to partial digestion of the
genomic DNA. Digested DNA from the other isolates also produced signals; however of
M 1 2 3 4 5 6 7 8 M M 1 2 3 4 5 6 7 8 M
23 kb
6 kb
4 kb
9 kb
A B
23 kb
9 kb 6 kb
4 kb
9 kb 6 kb
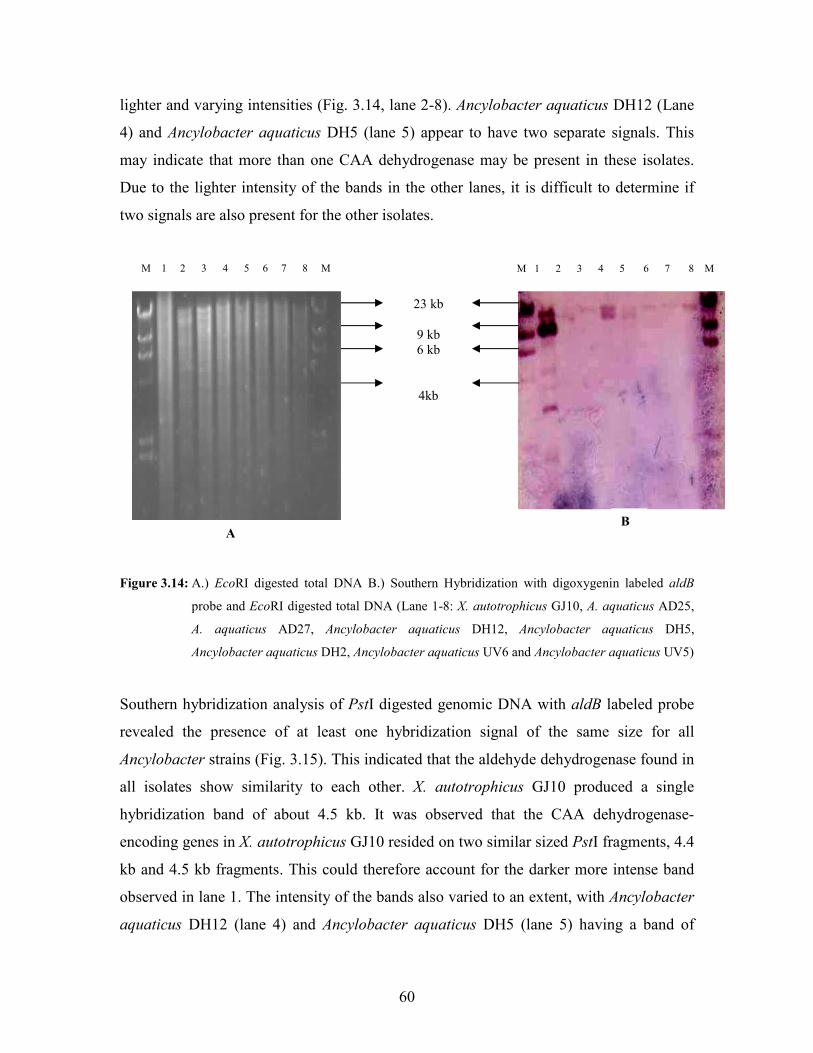
lighter and varying intensities (Fig. 3.14, lane 2-8). Ancylobacter aquaticus DH12 (Lane
4) and Ancylobacter aquaticus DH5 (lane 5) appear to have two separate signals. This
may indicate that more than one CAA dehydrogenase may be present in these isolates.
Due to the lighter intensity of the bands in the other lanes, it is difficult to determine if
two signals are also present for the other isolates.
Figure 3.14: A.) EcoRI digested total DNA B.) Southern Hybridization with digoxygenin labeled aldB
probe and EcoRI digested total DNA (Lane 1-8: X. autotrophicus GJ10, A. aquaticus AD25,
A. aquaticus AD27, Ancylobacter aquaticus DH12, Ancylobacter aquaticus DH5,
Ancylobacter aquaticus DH2, Ancylobacter aquaticus UV6 and Ancylobacter aquaticus UV5)
Southern hybridization analysis of PstI digested genomic DNA with aldB labeled probe
revealed the presence of at least one hybridization signal of the same size for all
Ancylobacter strains (Fig. 3.15). This indicated that the aldehyde dehydrogenase found in
all isolates show sim
hybridization band o
encoding genes in X.
kb and 4.5 kb fragme
observed in lane 1. Th
aquaticus DH12 (lan
M 1 2 3 4 5 6 7 8 M
23 kb
9 kb 6 kb
4kb
M 1 2 3 4 5 6 7 8 M
A B
ilarity to each other. X. autotrophicus GJ10 produced a single
60
f about 4.5 kb. It was observed that the CAA dehydrogenase-
autotrophicus GJ10 resided on two similar sized PstI fragments, 4.4
nts. This could therefore account for the darker more intense band
e intensity of the bands also varied to an extent, with Ancylobacter
e 4) and Ancylobacter aquaticus DH5 (lane 5) having a band of
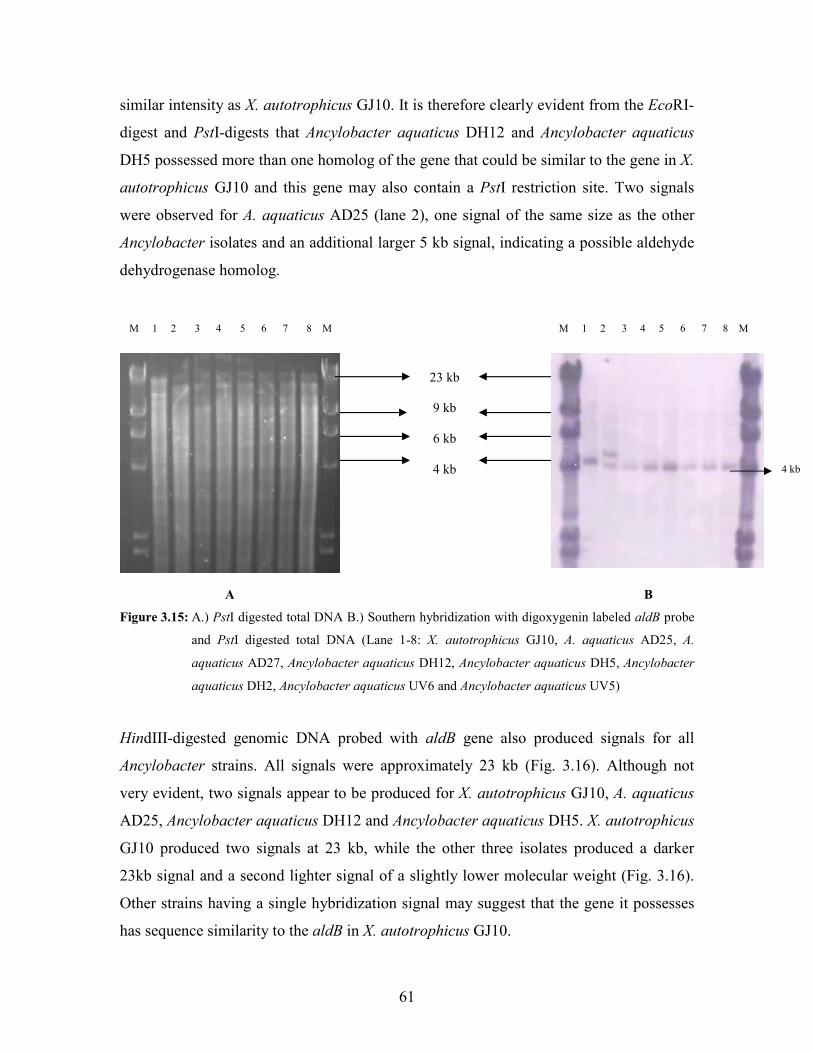
61
similar intensity as X. autotrophicus GJ10. It is therefore clearly evident from the EcoRI-
digest and PstI-digests that Ancylobacter aquaticus DH12 and Ancylobacter aquaticus
DH5 possessed more than one homolog of the gene that could be similar to the gene in X.
autotrophicus GJ10 and this gene may also contain a PstI restriction site. Two signals
were observed for A. aquaticus AD25 (lane 2), one signal of the same size as the other
Ancylobacter isolates and an additional larger 5 kb signal, indicating a possible aldehyde
dehydrogenase homolog.
Figure 3.15: A.) PstI digested total DNA B.) Southern hybridization with digoxygenin labeled aldB probe
and PstI digested total DNA (Lane 1-8: X. autotrophicus GJ10, A. aquaticus AD25, A.
aquaticus AD27, Ancylobacter aquaticus DH12, Ancylobacter aquaticus DH5, Ancylobacter
aquaticus DH2, Ancylobacter aquaticus UV6 and Ancylobacter aquaticus UV5)
HindIII-digested genomic DNA probed with aldB gene also produced signals for all
Ancylobacter strains. All signals were approximately 23 kb (Fig. 3.16). Although not
very evident, two signals appear to be produced for X. autotrophicus GJ10, A. aquaticus
AD25, Ancylobacter aquaticus DH12 and Ancylobacter aquaticus DH5. X. autotrophicus
GJ10 produced two signals at 23 kb, while the other three isolates produced a darker
23kb signal and a second lighter signal of a slightly lower molecular weight (Fig. 3.16).
Other strains having a single hybridization signal may suggest that the gene it possesses
has sequence similarity to the aldB in X. autotrophicus GJ10.
M 1 2 3 4 5 6 7 8 M
23 kb
9 kb
6 kb
4 kb
M 1 2 3 4 5 6 7 8 M
4 kb
B
A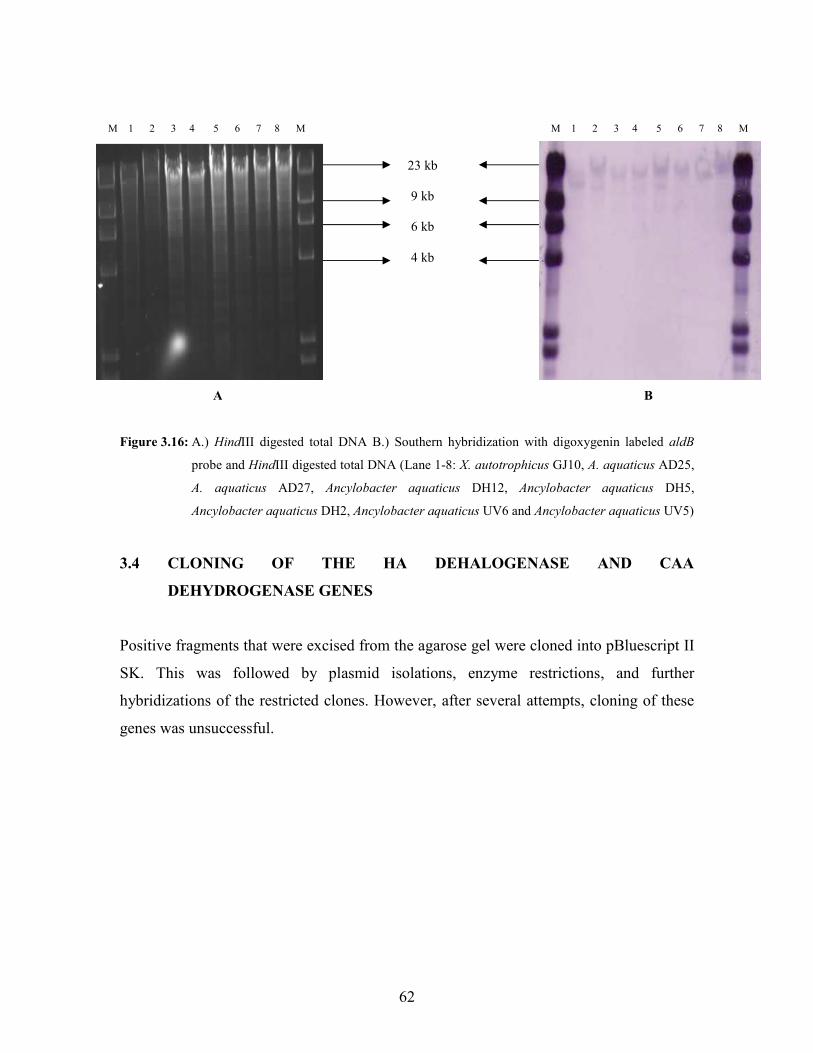
62
Figure 3.16: A.) HindIII digested total DNA B.) Southern hybridization with digoxygenin labeled aldB
probe and HindIII digested total DNA (Lane 1-8: X. autotrophicus GJ10, A. aquaticus AD25,
A. aquaticus AD27, Ancylobacter aquaticus DH12, Ancylobacter aquaticus DH5,
Ancylobacter aquaticus DH2, Ancylobacter aquaticus UV6 and Ancylobacter aquaticus UV5)
3.4 CLONING OF THE HA DEHALOGENASE AND CAA
DEHYDROGENASE GENES
Positive fragments that were excised from the agarose gel were cloned into pBluescript II
SK. This w llowed by plasmid isolations, enzyme restrictions, and her
hybridizations of the restricted clones. However, after several attempts, cloning
genes was unsuccessful.
M 1 2 3 4 5 6 7 8 M
23 kb
9 kb
6 kb
4 kb
M 1 2 3 4 5 6 7 8 M
A B
furt
as foof these
63
CHAPTER FOUR
DISCUSSION
In the present study, five Ancylobacter strains recently isolated in our laboratories were
investigated for their ability to utilize and degrade 1,2-DCA and a number of other
halogenated hydrocarbons. To establish the effect of organic nutrients on bacterial growth
rates, all isolates were cultured in minimal salts media containing either a vitamin
solution (MMV) or 10 mg/l yeast extract (MMY). Significant increases in turbidity were
observed in both media types tested over the 84 hr incubation period. This therefore
confirmed the ability of the five Ancylobacter strains to utilize 1,2-DCA as a carbon and
energy source for growth. Two species belonging to Ancylobacter have previously been
reported to be capable of degrading organochloride compounds. These were identified as
A. aquaticus and A. dichloromethanicus which are aerobic facultative methylotrophs.
A. aquaticus was able to utilize 1,2-DCA, while A. dichloromethanicus utilized
dichloromethane as a sole carbon source (Van den Wijngaard et al., 1992; Xin et al.,
2006). Members belonging to the genus Ancylobacter therefore demonstrate the ability to
degrade chlorinated compounds, as was confirmed in this study.
All bacterial strains, with the exception of A. aquaticus AD27, displayed similar growth
patterns in both minimal media investigated, demonstrating distinct phases of the growth
curve i.e. lag, exponential and stationery. Based on these growth curves, growth rate
constants of individual isolates were established and compared in MMV and MMY. Most
bacterial isolates demonstrated higher growth rates in minimal media supplemented with
vitamins, while Ancylobacter aquaticus DH12 had a higher growth rate in the presence of
yeast extract. Ancylobacter aquaticus UV5 and A. aquaticus AD27 displayed similar
growth rates in both types of minimal media. X. autotrophicus GJ10 and A. aquaticus
AD25 also grew optimally in vitamins with higher growth rates being observed in the
presence of vitamins. These results indicate the requirement of organic nutrients for
various microorganisms involved in 1,2-DCA degradation. The overall effect of vitamins
on microbial growth was greater than yeast extract. Similarly, Van den Wijngaard et al.
(1993), investigated the effects of vitamins and yeast extract on the growth of
64
X. autotrophicus GJ10 in 1,2-DCA. In the presence of yeast extract (10 mg/L)
X. autotrophicus GJ10 had a growth rate of 0.04.h-1, while the addition of vitamins
resulted in a further increase of 0.09.h-1. Other previously characterized strains, namely;
A. aquaticus AD25 and Pseudomonas sp. strain DE2 also demonstrated optimal growth
when 1,2-DCA was used as a carbon source, in the presence of vitamins (Field and
Sierra-Alvarez, 2004). Although vitamins stimulate microbial growth better than yeast
extract, the quantity of chlorides released during the 84 h incubation period is overall
lower for vitamins. Yeast extract may therefore be a more feasible option in
bioremediation strategies for complete removal of chlorinated compounds. Results here
do, however, confirm the need for essential co-factors in microorganisms that can utilize
chlorinated aliphatics. .
Growth rates obtained for X. autotrophicus GJ10 and A. aquaticus AD25 in the current
study differ from the growth rates reported in previous studies. In the study done by Van
den Wijngaard et al. (1992), a higher growth rate was observed for X. autotrophicus
GJ10. This may be due to the growth of the organism in minimal media supplemented
with both vitamins and yeast extract, whilst in this study bacterial cells were grown in
MMV only. On the contrary, a slower growth rate (0.04.h-1) was observed for A.
aquaticus AD25 as compared to the 0.094.h-1 obtained in this study. Comparatively, in
this study, A. aquaticus AD25 was observed to have a higher growth rate of 0.081.h-1
growing in MMY. The supplemented yeast extract used in the minimal salts media
produced a higher growth rate for A. aquaticus AD25 than the 30mg yeast extract used in
the study by Van der Ploeg et al. (1994). Different growth rates obtained in the different
studies may be attributed to various factors such as pH, temperature, microbial biomass
and the presence of other compounds, in this case the supplement yeast extract, which
can affect biodegradation kinetics. Other factors that may significantly influence
mineralization include, cell population density, as well as the xenobiotic compound
concentration/cell biomass ratio (Gallego et al., 2000). These factors should be taken into
consideration when designing bioremediation strategies or constructing bioreactors, so as
to maximize the benefits of xenobiotic degraders.
65
During growth in 1,2-DCA, the growth rates observed for the isolates under investigation
in this study were similar to other well-known aerobic 1,2-DCA degraders such as X.
autotrophicus GJ10 (0.11.h-1), Pseudomonas sp DE2 (0.08.h-1), A. aquaticus AD20
(0.08.h-1) and Pseudomonas sp. DCA1 (0.14.h-1) (Field and Sierra-Alvarez, 2004), while,
the lowest growth rate obtained was A. aquaticus AD27. The growth pattern for this
organism illustrated only gradual increases in turbidity in both minimal media used with
no distinct exponential phase. Accumulation of toxic intermediates may have interfered
with the optimum rate at which the enzymes are active thus resulting in slower adaptation
of the isolate in 1,2-DCA. It has previously been reported that due to the lack of a
regulatory system for dehalogenase synthesis, the haloalkane dehalogenase is
constitutively produced (Pries et al., 1994). As a result, the reactive intermediates may
accumulate and if the enzyme active against these intermediates is not in high content,
the organism is unable to cope, leading to bacterial cell death. This may therefore account
for the low growth rate observed for A. aquaticus AD27 in comparison to the other
strains of Ancylobacter. These results correlated with a study done by Govender (2009),
whereby all five recently isolated Ancylobacter aquaticus (DH12, DH2, DH5, UV6 and
UV5) demonstrated better growth in the presence of 1,2-DCA than the previously
isolated A. aquaticus AD27.
The growth pattern of the bacterial isolates obtained in the presence of 1,2-DCA was
further supported by the proportional increases of chloride ions released during the
incubation period. Higher concentrations of chloride ions were released during the first
24 h for most bacterial isolates, followed thereafter by slower release. A similar trend was
observed for A. aquaticus AD25 with significant amount of chloride ions being released
in the first 24 h of incubation, while most of the chlorides released by X. autotrophicus
GJ10 were observed after 48 h of incubation. This may be indicative of an initial higher
haloalkane dehalogenase activity which may have resulted in producing large quantities
of the 2-chloroethanol and chloroacetaldehydes, which are critical intermediates of 1,2-
DCA metabolism. High dehalogenase content and an absence of a regulatory system for
dehalogenase synthesis in 1,2-DCA degraders has previously been reported (Van den
Wijngaard et al., 1992). The constitutive production of the haloalkane dehalogenase
66
result in large amounts of intermediate alcohols being produced, as previously reported
by Van den Wijngaard et al. (1992). The low content of dehydrogenases may have not
been able to deal with the high volumes of 2-chloroethanol and chloroacetaldehydes
which are toxic to the bacterial cell. This may have therefore resulted in a slower release
of chloride ions after 48 h. A. aquaticus AD25 has previously been shown to possess
much higher dehalogenase content than X. autotrophicus GJ10 (Van den Wijngaard et
al., 1992). This may explain the higher chloride release observed by A. aquaticus AD25
and the other bacterial strains during the first 24 hours of incubation. Statistical analysis
revealed a significant (p<0.05) difference in the amount of chlorides released by the five
recently isolated Ancylobacter strains in the presence of 1,2-DCA as compared to the
negative controls. However, when the chloride ions released by individual Ancylobacter
isolates were compared to positive controls X. autotrophicus GJ10 and A. aquaticus
strains AD25 and AD27, no significant difference was observed (p>0.05). Earlier studies
have indicated slow aerobic biodegradation, however recent results demonstrate
otherwise, with the discovery of a wider range of microorganisms capable of degradation
(X. autotrophicus GJ10, A. aquaticus strains and Pseudomonas sp. strain DCA). Other
bacteria that have been found to degrade 1,2-DCA under aerobic conditions include
Nitrobacter, Nitrosomonas and Nitrospira species. These are oxygenase expressing
microorganisms that have the potential to degrade 1,2-DCA through cometabolic
processes, with oxygen as the electron acceptor (Kocamemi and Cecen, 2009).
The ability of the Ancylobacter strains to degrade other halogenated compounds was
further tested. Batch experiments were set up at pH 7 and pH 9 with MCA as a sole
carbon source. All bacterial strains were capable of growth in the presence of MCA, with
higher growth rates observed at neutral pH of 7. Growth rates obtained for the recently
isolated Ancylobacter strains were comparable to the previously isolated strains. This
study was similar to a study done by of Kerr and Marchesi (2006), also demonstrating
better growth and degradation of halocarboxylic acids at a neutral pH. X. autotrophicus
GJ10 previously demonstrated poor growth in MCA (Van den Wijngaard et al., 1992);
however a later study done by Torz and Beschkov (2005) suggested otherwise. The latter
study correlated with results in this study, whereby growth was evident for X.
67
autotrophicus GJ10 with a growth rate of 0.08.h-1. Better growth was observed by X.
autotrophicus GJ10 in both (previous and current) studies when pre-culture of the isolates
were initially grown in 1,2-DCA prior to inoculation into fresh media with MCA as
carbon source. Higher haloacid dehalogenase content provided by the1,2-DCA may have
resulted in an improved growth rate, as previously observed (Torz and Beschkov, 2005).
1,3-Dichloropropene (1,3-DCP), a longer-chained chlorinated compound was also added
to batch experiments to determine its use as sole carbon and energy source by the
bacterial isolates. No visible change in turbidity was observed after a 36 h incubation
period, indicating no growth for all Ancylobacter strains under investigation, as well as
previously characterized strains. The longer chained structure of 1,3-DCP possibly does
not allow the compound to cross the bacterial membrane as easily as a shorter chained
compound thus leading to no growth. Alternatively, the presence of the C=C bond may
have contributed to the recalcitrance and toxicity of the compound as no visible growth
was observed. The other compounds investigated for their use as a carbon source were
two brominated hydrocarbons, 1,2-dibromoethane (1,2-DBE) and 1,3-dibromopropane
(1,3-DBP). Both compounds failed to induce growth for any of the organisms. Although
brominated compounds are less stable than their chlorinated analogs, they also appear to
be more toxic, as the carbon-bromine bond is more labile than the carbon-chlorine bond
and is thus more reactive (Van der Ploeg et al., 1995). No other studies previously
reported growth of Ancylobacter species or X. autotrophicus GJ10 in the presence of
brominated compounds. This explains the lack of growth when 1,3-DBP or 1,2-DBE was
used as a carbon source.
Specific dehalogenase activities were determined from the crude extracts of the bacterial
isolates. Halide production was observed when 1,2-DCA and other halogenated
compounds (MCA, 1,3-DCP, 1,3-DBP and 1,2-DBE) were used as substrates in
dehalogenase assays. This confirmed the presence of the haloalkane dehalogenase
enzyme in the five recently Ancylobacter isolated strains. No halides were released when
dichloromethane, dichloroethene or trichloroethene were tested as a substrate in the
dehalogenase assays. This can be explained, as these compounds are not known to be
68
degraded aerobically but under anaerobic conditions in the presence of a reductive
dehalogenase (Van der Ploeg et al., 1995).
The haloalkane dehalogenase is an enzyme with a broad substrate range, capable of
hydrolyzing several chlorinated and brominated aliphatic hydrocarbons, as confirmed by
all isolates. Although, some of these substrates (1,3-DCP , 1,3-DBP and 1,2-DBE) were
efficiently hydrolyzed in the dehalogenase assays, no growth was observed when the
same substrates were used as a sole carbon source in batch experiments as indicated
earlier in the discussion. It has previously been reported that some of these substrates,
which are environmentally important compounds do not support growth of
microorganisms (Janssen et al., 1989), but the enzymes present can affect hydrolysis by
directly cleaving the carbon-halogen bond. These compounds were previously reported to
act as substrates for the haloalkane dehalogenase (Janssen et al., 1995), and as further
confirmed in this study.
Halide production from the individual substrates revealed that enzyme activity for all
isolates was highest when 1,3-DCP was used as the substrate. An overall 10% higher
activity was observed when compared to 1,2-DCA, for all isolates except X.
autotrophicus GJ10. This is in contrast to a study done by Janssen et al. (1995) whereby
higher dehalogenase activity was observed in the presence of 1,2-DCA as compared to
1,3-DCP i.e. 96% activity on 1,3-DCP relative to the 100% activity obtained on 1,2-DCA
(Janssen et al., 1995). This reduction in activity can possibly be attributed to the
subsequent sub-culturing of the bacterial isolates in the absence of 1,2-DCA over several
years.
The haloalkane dehalogenase present in X. autotrophicus GJ10, A. aquaticus AD25 and
UV6 had a higher affinity for 1,3-DBP as compared to 1,2-DBE, while the other isolates
had similar activity on both compounds. The actual cleavage of the carbon-halogen bond
is not rate-limiting in the overall conversion of both 1,2-DCA and 1,2-DBE, however the
rate of cleavage of the C-Br bond is faster than the rate of cleavage of the C -Cl bond.
This is because bromine is better replaced in bimolecular substitutions than chlorine due
69
to its weaker activity (Schanstra et al., 1996). The differences in activity or affinity of the
haloalkane dehalogenases for the various halogenated compounds could be due to the
different rates at which these isolates have adapted cleavage mechanisms to survive in the
presence of pollutants at contaminated sites.
Specific dehalogenase activities of A. aquaticus AD25 and A. aquaticus AD27 with 1,2-
DCA was higher than that of X. autotrophicus GJ10, with a 4-fold and 2.4-fold higher
activity, respectively. The specific dehalogenase activities of the recently isolated
Ancylobacter strains are comparable to the activities of A. aquaticus AD27 whilst also
higher than that of X. autotrophicus GJ10. Results correspond with the findings of Van
den Wijngaard et al. (1992), whereby, higher dehalogenase activities were reported for A.
aquaticus AD25 and A. aquaticus AD27 as compared to X. autotrophicus GJ10. The
potential for use of such organisms in bioremediation strategies is immense, as growth
rates and enzyme activities of these isolates correlate well with X. autotrophicus GJ10
and previously characterized Ancylobacter strains.
To determine the pH optima of the dehalogenase activities of the Ancylobacter strains,
crude extracts of the organisms were used in dehalogenase assays with different pH
buffers. Optimum pH obtained for the haloalkane dehalogenase in all Ancylobacter
strains was pH 8, while the previously isolated strains A. aquaticus AD25, A. aquaticus
AD27 and X. autotrophicus GJ10 was further confirmed also at pH 8. It has previously
been reported that haloalkane dehalogenase activity in the well-studied X. autotrophicus
GJ10 cleaved the carbon-chlorine bond optimally at pH 8.2 (Janssen et al., 1985), while
haloalkane dehalogenase activity in Mycobacterium avium N85 was optimum at pH 8
(Jesenska et al., 2002). Thus, it was not surprising that the optimum haloalkane
dehalogenase activity obtained in this study was the same. Since the haloalkane
dehalogenase enzyme present in these Ancylobacter strains was found to be identical to
the haloalkane dehalogenase possessed by X. autotrophicus GJ10 (Govender, 2009), then
the characteristics of the enzymes should ideally be the same.
70
Maximum haloacid dehalogenase activity in A. aquaticus AD25, DH5, UV6 and UV5
was observed at pH 9. The L-2-haloacid dehalogenase has been isolated from a few
bacterial isolates thus far, which includes X. autotrophicus GJ10, Pseudomonas putida
109 and Pseudomonas sp. strain YL. The pH optimum for maximum haloacid
dehalogenase activity in X. autotrophicus GJ10 and Pseudomonas sp. strain YL was
reported to be 9.5. This is similar to the observation made in this study as maximum
activity for most of the bacterial isolates was at pH 9. L-2-haloacid dehalogenases from
other bacteria also exhibit common properties, having maximum reactivity in the pH
range of 9-11 (Kurihara et al., 2000). However, the haloacid dehalogenase present in
Ancylobacter aquaticus DH12 displayed similar activity at both pH 8 and 9. Such activity
has been previously reported in a high affinity thermostable L-2-haloacid dehalogenase
from Azotobacter sp. strain RC26 (Diez et al., 1996), indicating that some haloacid
dehalogenases do possess a wider pH range. A pH optimum of 9 for most isolates could
possibly indicate haloacid dehalogenases fall into the same group as X. autotrophicus
GJ10. Both Ancylobacter aquaticus DH2 and A. aquaticus AD27, when grown in
minimal salts media with MCA as sole carbon source, had the lowest growth rates among
all the isolates used in the study with a corresponding low haloacid dehalogenase
activities. A. aquaticus AD27, apart from having a low growth rate in MCA, also had low
growth rates when 1,2-DCA was used as sole carbon source. This may be due to less
efficient dehalogenases or as previously mentioned, due to accumulation of toxic
intermediates which resulted in eventual death of bacterial cells. Although aquaticus
DH2 also had low dehalogenase activity, growth was better as compared to A. aquaticus
AD27. It has previously been reported that regulation of the 1,2-DCA pathway is at the
level of alcohol dehydrogenase and aldehyde dehydrogenase rather than at the haloalkane
dehalogenase level. An increase in alcohol dehydrogenase activity during a decreasing
growth rate has frequently been observed with different methylotrophs (Van den
Wijngaard et al., 1992). Thus, although the haloalkane dehalogenase activity is low in
Ancylobacter aquaticus DH2, enhanced growth rates of this organism may have been due
to higher expression levels of the dehydrogenase enzymes compensating for the lower
dehalogenase activity, thus enhancing overall growth rate. The mildly alkaline pH
optimum observed for haloacid dehalogenase activities observed in these isolates
71
appeared to be a common feature for L-2-haloacid dehalogenases as reported in previous
studies (Asmara et al., 1993; Busto et al., 1992, Diez et al., 1996; Janssen et al., 1985).
The optimum temperature, at which highest haloalkane dehalogenase activity was
observed, was 30°C. This temperature was optimum for all strains of Ancylobacter
isolates and other previously isolated strains as reported by Janssen et al. (1985) and Van
den Wijngaard et al. (1992). Highest activity observed at 30°C may have been due to
adaptation of these environmental strains during growth. As temperature varies in the
environment, so do the isolates adapt to the varying temperatures. This could account for
the stable enzyme activity observed at 40°C, with only a 10% loss in enzyme activity. At
a temperature of 50°C, only three strains showed enzyme activity, namely A. aquaticus
AD25, AD27 and Ancylobacter aquaticus DH12. Activity detected at this temperature
make the haloalkane dehalogenase in these organisms a thermostable enzyme and can be
considered for implementation on an industrial scale.
Overall, low enzyme activities were observed for all dehalogenase assays performed; as
compared to specific dehalogenase activities reported in previous studies (Janssen et al.,
1985; Van den Wijngaard et al., 1992). This may have been due to reduced enzyme
stability over extended periods of time as well as sub-optimal assay conditions. Lower
enzyme activities observed in this study also correlates with a study done by Govender
(2009), whereby specific activities were also much lower than that reported in previous
studies. This may indicate that the enzymes became less stable over time. Factors that
may have contributed to such low enzyme activities included possible protein
degradation of crude cell lysates or loss in protein expression due to repeated
subculturing on media lacking 1,2-DCA. Loss in activity due to subculturing has been
reported in previous studies, for example John et al. (2009) reported that several
subcultivation steps in the absence of chlorinated ethenes resulted in the reversible loss of
the reductive dehalogenase gene expression in the gram-negative anaerobic S.
multivorans. Other studies have also reported loss of gene expression in the absence of
chlorinated aliphatic hydrocarbons as the carbon source (Futagami et al., 2006a;
Futagami et al., 2006b; Krum and Ensign, 2001).
72
Southern hybridization was performed using the dhlB and aldB genes from X.
autotrophicus GJ10 as probes to determine whether genes were located on identical or
different restriction fragments. Genomic DNA, extracted from all isolates, was digested
with individual restriction enzymes followed by hybridization. Southern blot analysis for
the dhlB probe indicated signal production for Ancylobacter aquaticus DH12 only.
Southern blot analysis of the genomic DNA from Ancylobacter aquaticus DH12, digested
with EcoRI and BamHI, revealed signals at 4kb and 10 kb fragments, respectively. This
indicates that the Ancylobacter aquaticus DH12 genome possibly contains a single copy
of the dhlB gene without any additional homologous genes. PstI restricted genomic DNA
of Ancylobacter aquaticus DH12 showed two hybridization signals. Since the dhlB gene
in X. autotrophicus GJ10 possesses a PstI restriction site, two signals were ideally
expected. However, multiple signals with two darker and lighter signals being observed.
This result concurs with that of Govender (2009), suggesting the possibility of X.
autotrophicus GJ10 possessing more than one homolog of the dhlB gene. Two
hybridization signals detected for Ancylobacter aquaticus DH12 may indicate either the
presence of a PstI restriction site within the encoding gene region or the presence of more
than one homolog of the gene. The presence of more than one haloacid dehalogenase in
the same organism and with only minor differences in substrate specificities have been
demonstrated in other studies (Van der Ploeg et al., 1991). Finding more than one copy of
the dhlB gene in Ancylobacter aquaticus DH12 was thus not surprising. It has been
suggested that these isoenzymes may have arisen by gene duplication and subsequent
divergent evolution (Van der Ploeg et al., 1991). Although the dhlB probe hybridized to
different restriction fragments of Ancylobacter aquaticus DH12 and X. autotrophicus
GJ10, hybridization signals may imply the possible presence of a haloacid dehalogenase
gene in Ancylobacter aquaticus DH12. In a study done by Song et al. (2004), genomic
DNA of X. flavus UE-15 also hybridized with the dhlB probe from X. autotrophicus
GJ10, but on a different restriction fragment i.e. a 23 kb BamHI fragment, while an
approximately 10 kb positive fragment was produced for BamHI restricted genomic DNA
of Ancylobacter aquaticus DH12. Thus, it is interesting to note that all three organisms,

73
being 1,2-DCA degraders, appear to possess the dhlB gene, however, located on different
restriction fragments.
Analysis of blots from southern hybridization experiments revealed the presence of the
aldB gene in all isolates including previously isolated Ancylobacter strains, A. aquaticus
AD25 and A. aquaticus AD27. PstI-digested genomic DNA of all strains produced a
single 4 kb hybridization signal in all strains except A. aquaticus AD25 which produced
the 4 kb signal as well as an additional signal on a larger fragment. This indicated that the
aldB gene is homologous in all Ancylobacter strains as it is observed to be located on the
same restriction fragment. These results correlated with Govender (2009), who also
demonstrated signals on the same sized fragments for the aldB gene probe, in all strains,
except A. aquaticus AD25 which also produced an additional hybridization signal. This
might indicate that A. aquaticus AD25 possibly contains more than one copy of the
aldehyde dehydrogenase gene. In a study done by Wijngaard et al. (1992), A. aquaticus
AD25 was reported to have a 17-fold higher aldehyde dehydrogenase activity as
compared to the activity in X. autotrophicus GJ10. Detection of an additional signal for
A. aquaticus AD25 may therefore indicate the presence of more than one homolog of
aldB which could be responsible for the higher aldehyde dehydrogenase activity
observed.
X. autotrophicus GJ10 was observed to produce a single hybridization signal of
approximately 4.5 kb. This is in correlation with a study done by Bergeron et al. (1998)
where a single 4.5 kb signal was also obtained from PstI digested genomic DNA. The
intense dark band observed in this study also corresponds to Bergeron et al. (1998) as
both the CAA dehydrogenase encoding genes were found to reside on two similar sized
PstI fragments of 4.4 and 4.5 kb. The intensity of the signals across all lanes was found to
vary. X. autotrophicus GJ10, Ancylobacter aquaticus DH12 and Ancylobacter aquaticus
DH5 produced much darker signals as compared to the other isolates. Southern blot
analysis of the EcoRI digested genomic DNA also revealed that Ancylobacter aquaticus
DH12 and DH5 produced two similar sized signals, while GJ10 was also observed to
have multiple signals. The other isolates produced signals, however of lighter intensities.
74
This indicates that these Ancylobacter strains may contain more than one aldehyde
dehydrogenase as previously identified in GJ10 (Bergeron et al., 1998). The detection of
more than one enzyme in an isolate has been reported in several other bacterial strains,
whether these genes are chromosomally or plasmid-borne still remain to be investigated.
However, different plasmid and chromosomally encoded aldehyde dehydrogenases have
been observed in other organisms such as, Pseudomonas oleovorans (Van der Ploeg et
al., 1994). The detection of haloacid dehalogenases and aldehyde dehydrogenases in
these Ancylobacter strains could explain their ability to degrade the recalcitrant 1,2-DCA.
Several attempts to clone the positive fragments for further characterization were futile as
DNA sequencing proved to be unsuccessful on a number of accounts. Re-cloning into a
different plasmid vector was also unsuccessful. Therefore, further investigations may still
be required to characterize these enzymes on both the molecular and protein levels so as
to gain an insight into their possible application for bioremediation of sites contaminated
by halogenated organic compounds.
75
CHAPTER FIVE
CONCLUDING REMARKS
5.1 THE RESEARCH IN PERSPECTIVE
Short-chain halogenated aliphatic hydrocarbons comprise one of the most important
groups of chemicals that are produced in large quantities industrially (Song et al., 2003).
1,2-Dichloroethane (1,2-DCA), for example, is used for the production of vinyl chloride
(chloroethene), a starting compound for the synthesis of polyvinyl chloride (PVC). Other
compounds such as tetrachloroethene and trichloroethene are used as degreasing agents,
while 1,2-dibromoethane and 1,3-dichloropropene are used as nematocides in agriculture
(Van Hylckama Vlieg and Janssen, 2001). The last few decades has seen significant
amounts of halogenated aliphatic hydrocarbons being released into the environment due
to improper disposal, accidental spillage, or deliberate release, causing numerous cases of
environmental pollution (Jain et al., 2005).
Various physico-chemical processes, such as land-filling, excavation and incineration,
have been developed for treating such pollutants; however, these approaches are
frequently prohibitively expensive, non-specific, or have the potential for introducing
secondary contamination (Singh et al., 2008). Despite the toxicity and recalcitrance of
halogenated compounds, microorganisms have evolved various mechanisms to degrade
and transform these compounds, utilizing it as carbon and energy source. Bioremediation
is thus an attractive alternative method for the clean-up of environmental pollutants.
Bioremediation relies on the metabolic capacities of the microorganisms and their ability
to adapt to hostile environments in the transformation of xenobiotics to harmless or less
toxic compounds (Fantroussi and Agathos, 2005).
1,2-DCA has been given much attention as a model compound as it can be biologically
degraded by microorganisms under several geochemical conditions. 1,2-DCA is subject
to both aerobic and anaerobic biodegradation. Aerobic biodegradation has been most
76
extensively studied as these conditions result in the complete mineralization of 1,2-DCA
to harmless substances namely; CO2, H2O and Cl- (Janssen et al., 1985). A number of
pure cultures capable of metabolizing 1,2-DCA aerobically has been isolated (Hage &
Hartmans, 1999; Janssen et al., 1985; Stucki et al., 1983; Van den Wijngaard et al.,
1992). The present study investigated the aerobic biodegradation of 1,2-DCA by five
recently isolated South African Ancylobacter strains. This involved establishing the effect
of vitamins and yeast extract on bacterial growth rates as well as determining the specific
dehalogenase activities of the individual isolates (Ancylobacter aquaticus DH12, DH5,
DH2, UV6 and UV5) under various conditions. The presence of 1,2-DCA degrading
encoding genes, CAA dehydrogenase and HA dehalogenase, was also investigated.
To determine the bacterial growth rates and the effect of organic nutrients on bacterial
growth, all isolates, including previously characterized strains (Ancylobacter aquaticus
AD27, Ancylobacter aquaticus AD25 and Xanthobacter autotrophicus GJ10), were
grown in batch culture containing either a vitamin solution or yeast extract (10 mg/l), and
5 mM 1,2-DCA. The ability of the five isolates to aerobically utilize 1,2-DCA as a sole
carbon and energy source was confirmed. Furthermore, some of these growth rates were
higher than that obtained for the previously characterized X. autotrophicus GJ10 and A.
aquaticus strains AD25 and AD27. Although X. autotrophicus GJ10 is a well known 1,2-
DCA degrader, the rate at which it can degrade 1,2-DCA is limited by the rate at which
CAA can be metabolized. Thus, the use of the South African isolates in bioremediation
strategies may be promising in future applications and result in improving degradation
rates of 1,2-DCA at contaminated sites.
The ability of some microorganism to degrade 1,2-DCA is dependent on the addition of
an organic nutrient. Some microorganisms may require vitamins or yeast extract whilst
others may not require either. X. autotrophicus GJ10 (Janssen et al., 1985), X. flavus
UE15 (Song et al., 2004) and A. aquaticus strains AD25 and AD27 (van den Wijngaard
et al., 1992) all have a requirement for various vitamins and co-factors. The current study
confirmed the requirement for vitamins and yeast extract, with higher growth rate
constants being obtained for previously characterized strains, X. autotrophicus GJ10 and
77
A. aquaticus AD25, growing in minimal media supplemented with vitamins. The addition
of vitamins to the batch cultures containing the South African isolates also had an overall
greater impact on microbial growth than yeast extract. However, yeast extract resulted in
the release of a higher concentration of chlorides over the 84 h incubation period than
vitamins. The highest growth rate obtained in minimal salts media supplemented with
vitamins was Ancylobacter aquaticus DH5 while Ancylobacter aquaticus DH12 had the
highest growth rate in minimal media supplemented with yeast extract. This indicates that
organisms of the same species may require different preferences for organic nutrients
when involved in 1,2-DCA degradation. Therefore, prior to applying organisms in
bioremediation strategies, it would be important to determine if the organism requires an
organic nutrient and if so, what is the feasibility and effectiveness of the nutrient in
stimulating microbial growth.
To further investigate the ability of the five South African isolates to utilize 1,2-DCA,
specific haloalkane and haloacid dehalogenase activities were determined under various
conditions. Optimum pH for the haloalkane and haloacid dehalogenase was observed at
pH 8 and pH 9, for most isolates, respectively. The optimum temperature for haloalkane
dehalogenase activity was observed at 30°C, while activity was still stable at 40°C with
only 10% loss in activity. The stability of enzyme activity under various physical
conditions makes these organisms useful in the bioremediation of sites contaminated with
chlorinated compounds, as they would be able to withstand and adapt to various
environmental conditions.
Previously characterized A. aquaticus AD25 demonstrated the highest dehalogenase
activity while the five recently isolated Ancylobacter strains had higher activities than the
previously characterized A. aquaticus AD27 and X. autotrophicus GJ10. The South
African isolate with the highest dehalogenase activity, for both the haloalkane and
haloacid dehalogenase was Ancylobacter aquaticus DH12. This was followed very
closely by Ancylobacter aquaticus DH5. Haloalkane dehalogenase present in all the
isolates display a wide substrate range with compounds such as 1,3-dichloropropene, 1,2-
dibromopropane and 1,3-dibromopropane being used as substrates in the dehalogenase
78
assays. These properties therefore make the isolates useful in bioremediation of sites
contaminated with a wide variety of halogenated hydrocarbons.
Dehalogenation is the critical step in the biodegradation of chlorinated aliphatic
hydrocarbons as these enzymes cleave the carbon-chlorine bond. There are at least two
distinct groups of hydrolytic dehalogenases based on their substrate range, namely;
haloalkane dehalogenases and haloacid dehalogenases. The haloalkane dehalogenase is
the first enzyme of the 1,2-DCA degradation pathway and is encoded for by the dhlA
gene. This gene has thus far been identified in a few bacterial strains (Janssen et al.,
1985;; Song et al., 2004; Van den Wijngaard et al., 1992). The recently isolated South
African strains investigated in this study also possessed the first enzyme of the pathway,
the hydrolytic dehalogenase, encoded for by dhlA gene (Govender, 2009). This therefore
may have contributed to the high growth rates obtained when 1,2-DCA was used as a
carbon source.
Although, the ability to grow with 1,2-DCA is attributed to the presence of two
hydrolytic dehalogenases, observations have demonstrated the special role plasmid
encoded aldehyde dehydrogenases play in the degradation pathway of Xanthobacter
autotrophicus GJ10. In the absence of the plasmid, the organism is unable to grow in the
presence of 2-chloroethanol, an intermediate of the pathway (Van der Ploeg et al., 1994).
The ability of X. autotrophicus GJ10 to overcome the toxicity of these intermediates is
attributed to the production of three different aldehyde dehydrogenases with the high
expression of a plasmid encoded chloroacetaldehyde dehydrogenase (Van der Ploeg et
al., 1994).
It was therefore of interest to determine whether South African isolates possessed the
other important genes, namely; chloroacetaldehyde dehydrogenase and haloacid
dehalogenase encoding genes, or their homologs. The presence of the genes was
confirmed by using the Southern hybridization technique. The control strain used was
Xanthobacter autotrophicus GJ10, while the aldB and dhlB genes were used as the
probes during hybridization experiments. Positive hybridization signals were obtained for
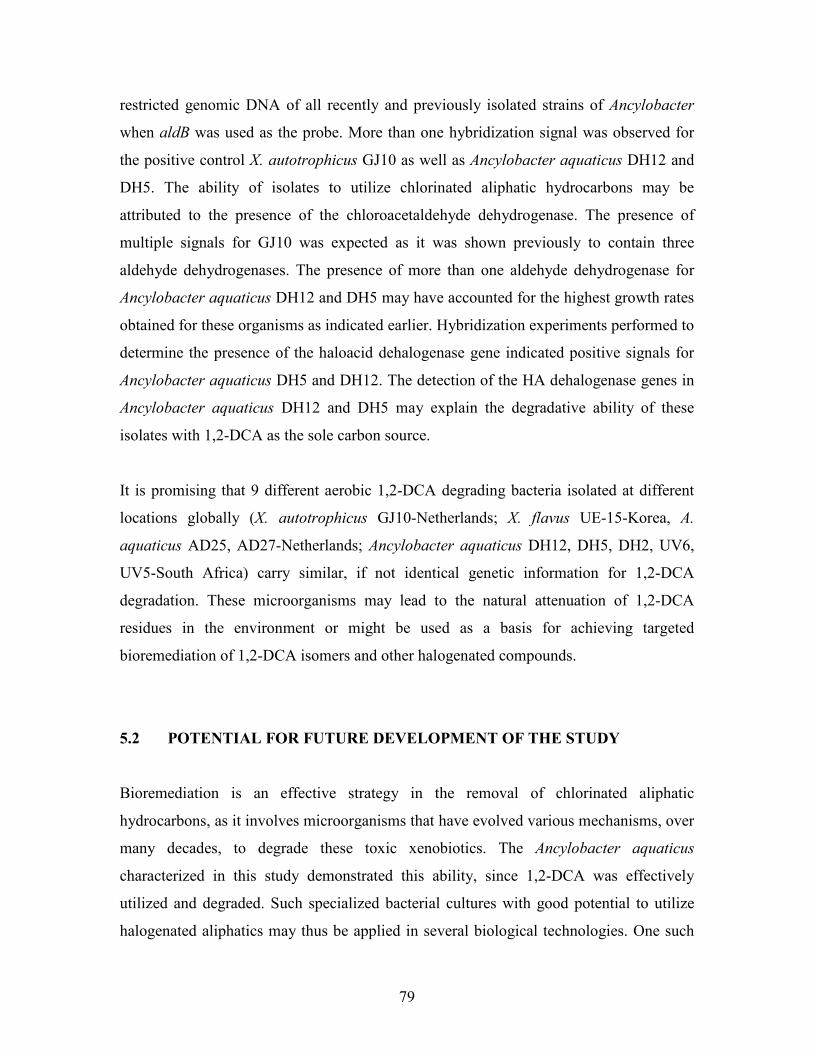
79
restricted genomic DNA of all recently and previously isolated strains of Ancylobacter
when aldB was used as the probe. More than one hybridization signal was observed for
the positive control X. autotrophicus GJ10 as well as Ancylobacter aquaticus DH12 and
DH5. The ability of isolates to utilize chlorinated aliphatic hydrocarbons may be
attributed to the presence of the chloroacetaldehyde dehydrogenase. The presence of
multiple signals for GJ10 was expected as it was shown previously to contain three
aldehyde dehydrogenases. The presence of more than one aldehyde dehydrogenase for
Ancylobacter aquaticus DH12 and DH5 may have accounted for the highest growth rates
obtained for these organisms as indicated earlier. Hybridization experiments performed to
determine the presence of the haloacid dehalogenase gene indicated positive signals for
Ancylobacter aquaticus DH5 and DH12. The detection of the HA dehalogenase genes in
Ancylobacter aquaticus DH12 and DH5 may explain the degradative ability of these
isolates with 1,2-DCA as the sole carbon source.
It is promising that 9 different aerobic 1,2-DCA degrading bacteria isolated at different
locations globally (X. autotrophicus GJ10-Netherlands; X. flavus UE-15-Korea, A.
aquaticus AD25, AD27-Netherlands; Ancylobacter aquaticus DH12, DH5, DH2, UV6,
UV5-South Africa) carry similar, if not identical genetic information for 1,2-DCA
degradation. These microorganisms may lead to the natural attenuation of 1,2-DCA
residues in the environment or might be used as a basis for achieving targeted
bioremediation of 1,2-DCA isomers and other halogenated compounds.
5.2 POTENTIAL FOR FUTURE DEVELOPMENT OF THE STUDY
Bioremediation is an effective strategy in the removal of chlorinated aliphatic
hydrocarbons, as it involves microorganisms that have evolved various mechanisms, over
many decades, to degrade these toxic xenobiotics. The Ancylobacter aquaticus
characterized in this study demonstrated this ability, since 1,2-DCA was effectively
utilized and degraded. Such specialized bacterial cultures with good potential to utilize
halogenated aliphatics may thus be applied in several biological technologies. One such
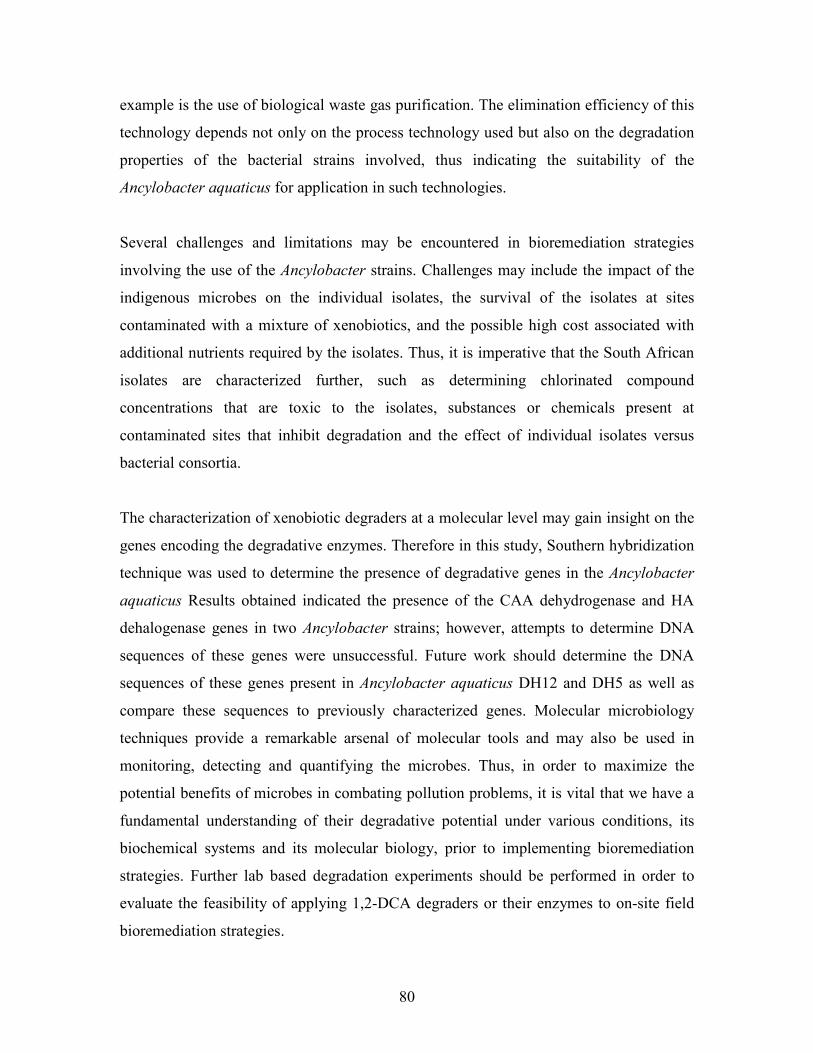
80
example is the use of biological waste gas purification. The elimination efficiency of this
technology depends not only on the process technology used but also on the degradation
properties of the bacterial strains involved, thus indicating the suitability of the
Ancylobacter aquaticus for application in such technologies.
Several challenges and limitations may be encountered in bioremediation strategies
involving the use of the Ancylobacter strains. Challenges may include the impact of the
indigenous microbes on the individual isolates, the survival of the isolates at sites
contaminated with a mixture of xenobiotics, and the possible high cost associated with
additional nutrients required by the isolates. Thus, it is imperative that the South African
isolates are characterized further, such as determining chlorinated compound
concentrations that are toxic to the isolates, substances or chemicals present at
contaminated sites that inhibit degradation and the effect of individual isolates versus
bacterial consortia.
The characterization of xenobiotic degraders at a molecular level may gain insight on the
genes encoding the degradative enzymes. Therefore in this study, Southern hybridization
technique was used to determine the presence of degradative genes in the Ancylobacter
aquaticus Results obtained indicated the presence of the CAA dehydrogenase and HA
dehalogenase genes in two Ancylobacter strains; however, attempts to determine DNA
sequences of these genes were unsuccessful. Future work should determine the DNA
sequences of these genes present in Ancylobacter aquaticus DH12 and DH5 as well as
compare these sequences to previously characterized genes. Molecular microbiology
techniques provide a remarkable arsenal of molecular tools and may also be used in
monitoring, detecting and quantifying the microbes. Thus, in order to maximize the
potential benefits of microbes in combating pollution problems, it is vital that we have a
fundamental understanding of their degradative potential under various conditions, its
biochemical systems and its molecular biology, prior to implementing bioremediation
strategies. Further lab based degradation experiments should be performed in order to
evaluate the feasibility of applying 1,2-DCA degraders or their enzymes to on-site field
bioremediation strategies.
81
REFERENCES
Asmara, W., U. Murdiyatmo, A. J. Baines, A. T. Bull and D.J. Hardman. 1993.
Protein engineering of the 2-haloacid halidohydrolase IVa from Pseudomonas cepacia.
Biochemical Journal. 292: 69-74.
Ausubel, F. M., R.E. Kingston, K. K. Moore, J. G. Seidman, J. A. Smith and K.
Struhl. 1989. Current protocols in molecular biology, vol 2. Greene Publishing
Associates and Wiley-Interscience, New York.
Baden, W. 2008. Merck Chemicals and Reagents. Merck KGaA, Darmstadt. Willmy
Printmedia. p. 210-333.
Bergeron, H., D. Labbe, C. Turmel and P. C. K. Lau. 1998. Cloning, sequencing and
expression of a linear plasmid-based and a chromosomal homolog of chloroacetaldehyde
dehydrogenase- encoding genes in Xanthobacter autotrophicus GJ10. Gene. 207: 9-18.
Bergman, J.G. and J Sanik. 1957. Determination of trace amounts of chlorine in
naptha. Analytical Chemistry 29: 241-243.
Birnboim, H. C., and J. Doly. 1979. A rapid alkaline extraction procedure for screening
recombinant plasmid DNA. Nucleic Acids Resources. 7: 1513-1517.
Bouwer, E. J., and P. L. McCarty. 1983. Transformations of 1- and 2-carbon
halogenated aliphatic organic compounds under methanogenic conditions. Applied and
Environmental Microbiology. 45: 1286- 1294.
Bradford, M. M. 1976. A rapid and sensitive method for quantitation of microgram
quantities of protein utilizing the principle of protein-dye-binding. Analytical
Biochemistry. 72: 248-254.
82
Busto, M.D., P.P. Smith, M Perez-Mateos and R.G. Burns. 1992. Degradation of
aliphatic halogen-substituted pesticides by dehalogenase isolated from Pseudomonas
alcaligenes. Identification and properties of the enzyme. Science of the Total
Environment. 123/124: 267-277.
Chaudhry G. R. and S. Chapalamadugu. 1991. Biodegradation of chlorinated organic
compounds. Microbiological Reviews. 55: 59-79.
Chovancova E., J. Kosinski, J. M. Bujnicki and J. Damborsky. 2007. Phylogenetic
analysis of haloalkane dehalogenases. Proteins: Structure, Function, and Bioinformatics.
67: 1-12.
Copley, S. D. 1998. Microbial dehalogenases: enzymes recruited to convert xenobiotic
substrates. Current Opinion in Chemical Biology. 2: 613-617.
Damborský, J. and J. Koća. 1999. Analysis and reaction mechanism and substrate
specificity of haloalkane dehalogenases by sequential and structural comparisons. Protein
Engineering. 12: 989-998.
Davis, G. B., B. M Patterson and C. D. Johnston. 2009. Aerobic bioremediation of 1,2-
dichloroethane and vinyl chloride at field scale. Journal of Contaminant Hydrology. 107:
91-100.
De Jong, R. M. and B. W. Dijkstra. 2003. Structure and mechanism of bacterial
dehalogenases: different ways to cleave a carbon–halogen bond. Current Opinion in
Structural Biology. 13: 722- 730.
De Wildeman, S and W. Verstraete. 2003. The quest for microbial reductive
dechlorination of C2 to C4 chloroalkanes is warranted. Applied Microbiology and
Biotechnology. 61:94-102.
83
De Wildeman, S., G. Diekert, H. Van Langenhove and W. Verstraete. 2003.
Stereoselective microbial dehalorespiration with vicinal dichlorinated alkanes. Applied
and Environmental Microbiology. 69: 5643-5647.
Dewulf, D., D. Drijvers and H. Van Langenhove. 1995. Measurement of Henry’s law
constant as a function of temperature and salinity for the low-temperature range.
Atmosphere Environment. 29: 323-331.
Diez, A., M. I. Prieto, M. J. Alverez, J. M. Bautista, A. Puyet and A. Garrido-
Pertierra. 1996. Purification and properties of a high affinity L-2-haloacid dehalogenase
from Azotobacter sp. strain RC26. Letters in Applied Microbiology. 23: 289-282.
Dinglasan-Panlilio, S., S. M. Dworatzek, and E. Edwards. 2006. Microbial oxidation
of 1,2-dichloroethane under anoxic conditions with nitrate as electron acceptor in mixed
and pure cultures. FEMS Microbial Ecology. 56: 355-364.
Erable, B., I. Goubet, S. Lamare, M, Legoy and T. Maugard. 2006. Bioremediation of
halogenated compounds: Comparison of dehalogenating bacteria and improvement of
catalyst stability. Chemosphere. 65: 1146-1152.
Fantroussi, S. E. and S. N. Agathos. 2005. Is bioaugmentation a feasible strategy for
pollutant removal and site remediation. Current Opinion in Microbiology. 8: 268-275.
Fetzner, S. 1998. Bacterial dehalogenation. Applied and Microbiology Biotechnology.
50: 633-657.
Fetzner, S. and F. Lingens.1994. Bacterial Dehalogenases: Biochemistry, Genetics, and
Biotechnological Applications. Microbiological Reviews. 58:641-685
84
Field, A. J. and R. Sierra-Alvarez. 2004. Biodegradability of chlorinated solvents and
related chlorinated aliphatic compounds. University of Arizona.
Fogel, M. M., A. R. Taddeo, and S. Fogel. 1986. Biodegradation of chlorinated ethenes
by a methane-utilizing mixed culture. Applied and Environmental Microbiology. 51: 720-
724.
Futagami, T., Y. Tsuboi, A. Suyama, M. Goto, and K. Furukawa. 2006a. Emergence
of two types of nondechlorinating variants in the tetrachloroethene- halorespiring
Desulfitobacterium sp. strain Y51. Applied and Microbiology Biotechnology. 70:720–
728.
Futagami, T., T. Yamaguchi, S. Nakayama, M. Goto and Kensuke Furukawa.
2006b. Effects of Chloromethanes on Growth of and Deletion of the pce Gene Cluster in
Dehalorespiring Desulfitobacterium hafniense Strain Y51. Applied and Environmental
Microbiology. 72: 5998-6003.
Gallego, A, C. E., M Gomez, S. Fortunato, L. Cenzano, S. Rossi, M. Paglilla, D.
Gomez Hermida, L. E. Higa and S. E. Korol. 2001. Factors affecting biodegradation of
2-chlorophenol by Alcaligenes sp. in aerobic reactors. Environmental Toxicology. 16:
306-313.
Govender, A. 2009. Characterization of 1,2-dichloroethane degrading Ancylobacter
aquaticus strains. Ph.D Thesis. University of KwaZulu-Natal.
Grostern, A. and E. A. Edwards. 2006. Growth of Dehalobacter and Dehalococcoides
spp. during degradation of chlorinated ethanes. Applied and Microbiology Biotechnology.
72: 428-436.
85
Hage, J.C. and S. Hartmans. 1999. Monooxygenase-mediated 1,2-dichloroethane
degradation by Pseudomonas sp. strain DCA1. Applied and Environmental Microbiology.
65:2466-2470.
Hardman, D. J., P. C. Gowland, and J. H. Slater. 1986. Plasmids from soil bacteria
enriched on halogenated alkanoic acids. Applied and Environmental Microbiology.
51:44-51.
He J, K. M. Ritalahti, K. Yang, S. Koenigsberg and F. E. L¨offler. 2003
Detoxification of vinyl chloride to ethene coupled to growth of an anaerobic bacterium.
Nature. 424: 62–65.
Hill, K. E., J. R. Marchesi, and A. J. Weightman. 1999. Investigation of two
evolutionarily unrelated halocarboxylic acid dehalogenase gene families. Journal of
Bacteriology. 181:2535–2547.
Hunkeler, D. and R. Aravena. 2000. Evidence of substantial carbon isotope
fractionation among substrate, inorganic carbon, and biomass during aerobic
mineralization of 1,2-dichloroethane by Xanthobacter autotrophicus GJ10. Applied and
Environmental Microbiology. 66: 4870-4876.
Jacobsen, J. S., C. P. Perkins, J. T. Callahan, K. Sambamurti and M. Z. Humayun.
1989. Mechanisms of mutagenesis by chloroacetaldehyde. Genetics. 121: 213-222.
Jain R, K, M. Kapur1, S. Labana, Banwari Lal, P. M. Sarma, D. Bhattacharya and
I. S. Thakur. 2005. Microbial diversity: Application of microorganisms for the
biodegradation of xenobiotics. Current Science. 89: 101-112.
86
Janssen, D. B., I. J.Z. Dinkla, G. J. Poelarands and P. Terpstra. 2005. Bacterial
degradation of xenobiotic compounds: evolution and distribution of novel enzyme
activities. Environmental Microbiology. 7: 1868-1882.
Janssen, D. B. 2004. Evolving haloalkane dehalogenases. Current Opinion in Chemical
Biology. 8: 150-159.
Janssen, D. B., F. Pries, J. van der Pleeg, B. Kazemier, P. Terpstra and B. Witholt.
1989. Cloning of 1, 2-dichloroethane degradation genes of Xanthobacter autotrophicus
GJ10 and expression and sequencing of the dhlA gene. Journal of Bacteriology. 171: 12.
6791-6799.
Janssen, D. B., A. Scheper, L. Dijkhuizen and B. Witholt. 1985. Degradation of
halogenated aliphatic compounds by Xanthobacter autotrophicus GJ10. Applied and
Environmental Microbiology. 49: 673-677.
Janssen, D. B., J. R. van der Ploeg and F. Pries. 1995. Genetic adaptation of bacteria to
halogenated aliphatic compounds. Environmental Health Perspective. 103: 29-32.
Jesenská, A., M. Bartoś, V. Czerneková, I. Rychlík, I. Pavlík and J. Damborský.
2002. Cloning and expression of the haloalkane dehalogenase gene dhmA from
Mycobacterium avium N85 and preliminary characterization of dhmA. Applied and
Environmental Microbiology. 68: 3724-3730.
John, M., R. Rubick, R. P. H. Schmitz, J. Rakoczy, T. Schubert and G. Diekert.
2009. Retentive memory of bacteria: Long term regulation of dehalorespiration in
Sulfurospirillum multivorans. Journal of Bacteriology. 191: 1650-1655.
Kerr, L. M. and J. R. Marchesi. 2006. Isolation of novel bacteria able to degrade -
halocarboxylic acids by enrichment from environmental samples. Chemosphere. 64: 848-
855.
87
Krum, J. G. and S. A. Ensign. 2001. Evidence that a linear megaplasmid encodes
enzymes of aliphatic alkene and epoxide metabolism and coenzyme M (2-
mercaptoethanesulfonate) biosynthesis in Xanthobacter Strain Py2. Journal of
Bacteriology. 183: 2172-2177.
Kurihara, T. and N. Esaki. 2008. Bacterial dehalogenases and related enzymes:
Occurrences, reaction mechanisms and application. The Chemical Record. 8: 67-74.
Kurihara, T., N. Esaki and K. Soda. 2000. Bacterial 2-haloacid dehalogenases:
structures and reaction mechanisms. Journal of Molecular Catalysis B: Enzymatic. 10:
57-65.
Ma, X. and C. Wang. 2009. Impacts of physiochemical properties of chlorinated
solvents on the sorption of trichloroethylene to the roots of Typha latifolia.
Environmental Pollution. 157: 1019-1023.
Maymo-Gatell, X., T. Anguish, S. H Zinder. 1999. Reductive dechlorination of
chlorinated ethenes and 1,2-dichloroethane by ‘‘ Dehalococcoides ethenogenes’’ 195.
Applied and Environmental Microbiology 65: 3108–3113.
Mena-Benitez, G.L., F. Gandia-Herrero, S. Graham, T. R. Larson, S. J. Mcqueen-
Mason, C. E. French, E. L. Rylott and N.C. Bruce. 2008. Engineering a catabolic
pathway in plants for the degradation of 1,2-dichlorethane. Plant Physiology. 147: 1192-
1198.
National Toxicology Program (NTP). 2005. Report on Carcinogens, Eleventh Edition;
U.S. Department of Health and Human Services, Public Health Service, National
Toxicology Program. http://ntp.niehs.nih.gov/index.cfm?objectid=32BA9724-F1F6-
975E-7FCE50709CB4C932.
88
Negri, A., E. Marco, J. Damborský and F. Gago. 2007. Stepwise dissection and
visualization of the catalytic mechanism of haloalkane dehalogenase LinB using
molecular dynamics simulations and computer graphics. Journal of Molecular Graphics
and Modelling. 26: 643-651.
Nelson, M. J. K., S. 0. Montgomery, and P. H. Pritchard. 1988. Trichloroethylene
metabolism by microorganisms that degrade aromatic compounds. Applied and
Environmental Microbiology. 54: 604-606.
Neilson, A. H., A.-S. Allard, P.-A. Hynning, and M. Remberger. 1988.
Transformations of halogenated aromatic aldehydes by metabolically stable anaerobic
enrichment culture. Applied and Environmental Microbiology. 54: 2226-2236.
Ojo, O. A. 2007. Molecular strategies of microbial adaptation to xenobiotics in natural
environment. Biotechnology and Molecular Biology Reviews. 2 : 1-13.
Olaniran, A. O., B. Pillay and D. Pillay. 2005. Characterization of two bacteria isolated
from a wastewater treatment plant in South Africa for aerobic dehalogenation of some
aliphatic chlorinated compounds. International Journal of Environmental Studies. 62: 59-
68.
Pavlová M., M. Klvaka, A. Jesenská, Z. Prokop, H. Konebná, T. Sato, M. Tsuda, Y.
Nagata and J. Damborský. 2007. The identification of catalytic pentad in the
haloalkane dehalogenase DhmA from Mycobacterium avium N85: Reaction mechanism
and molecular evolution. Journal of Structural Biology. 157: 384–392.
Pham, H., N. Boon, M. Marzorati and W. Verstraete. 2009. Enhanced removal of 1,2-
dichloroethane by anadophilic microbial consortia. Water Research. 43: 2936-2946.
89
Poelarends, G. J., M. Wilkins, M. J. Larkin, J. D. van Elsas and D. B. Janssen. 1998.
Degradation of 1,3-dichloropropene by Pseudomonas cichorii 170. Applied and
Environmental Microbiology. 64: 2931-2936.
Poelarends, G. J., M. Zandstra, T. Bosma, L. A. Kulakov, M. J. Larkin, J. R.
Marchesi, A. J. Weightman, and D. B. Janssen. 2000. Haloalkane-utilizing
Rhodococcus strains isolated from geographically distinct locations possess a highly
conserved gene cluster encoding haloalkane catabolism. Journal of Bacteriology. 182:
2725-2731.
Pries, F., J. R van der Ploeg, J. Dolfing and D. B. Janssen. 1994. Degradation of
halogenated aliphatic compounds: The role of adaptation. FEMS Microbiology Reviews.
15: 279-295.
Richard, A. M. and E. S. Hunter. 1996. Quantitative structure-activity relationships for
the developmental toxicity of haloacetic acids in mammalian whole embryo culture.
Teratology. 53: 352-360.
Ridder, I. S., H. J. Rozeboom, K. H. Kalk, D. B. Janssen and B. W. Dijkstra. 1999.
Three dimensional-structure of L-2-haloacid dehalogenase from Xanthobacter
autotrophicus GJ10 complexed with the substrate-analogue formate. The Journal of
Biological Chemistry. 52: 33015-33022.
Rikvkina, R. M., E. I. Friedmann, C. P. McKay and G. A. Gilichinsky. 2000.
Measurement of Microbial Growth. Applied and Environmental Microbiology. 66: 3230-
3233.
Sambrook, J., E. F. Fritsch and T. Maniatis. 1989. Molecular cloning: A laboratory
manual. Second edition, Cold Spring Harbour Laboratory, Cold Spring Harbour, New
York.
90
Schanstra, J. P., J. Kingma and D.B. Janssen. 1996. Specificity and kinetics of
haloalkane dehalogenase. Journal of Biological Chemistry. 271: 14747-14753.
Shibata, T., Y. Ishil, Y. Noguchi, H. Yamada, Y. Saito and M. Yamashita. 2001.
Purification and molecular characterization of a quinoprotein alcohol dehydrogenase
from Pseudogluconobacter saccharoketogenes IFO 14464. Journal of Bioscience and
Bioengineering. 92: 524-531.
Singh, S., S. H. Kang, A. Malchandani and W. Chen. 2008. Bioremediation:
environmental clean-up through pathway engineering. Current Opinion in Biotechnology.
19: 437-444.
Song, J., D. Lee., K., Lee, and C. Kim. 2003. Characteristics of several bacterial isolates
capable of degrading chloroaliphatic compounds via hydrolytic dechlorination. Journal of
Microbiology. 41: 277-283.
Song, J., D. Lee., K., Lee, and C. Kim. 2004. Genetic organization of the dhlA gene
encoding 1,2-dichloroethane dechlorinase from Xanthobacter flavus UE15. Journal of
Microbiology. 42: 188-193.
Squillace, P. J., M.J. Moran, W.W. Lapham, C. V. Price, R. M. Clawges and J. S.
Zogorski.1999. Volatile organic compounds in untreated ambient groundwater of the
United States. Environmental Science in Technology. 33: 4176-4182.
Sripo, T, A. Phongdara, C. Wanapu and A. B. Caplan. 2002. Screening and
characterization of aldehyde dehydrogenase gene from Halomonas salina strain AS11.
Journal of Biotechnology. 95: 171-179.
Stucki, G., U. Krebser and T. Leisinger.1983. Bacterial growth on 1, 2-dichloroethane.
Experentia. 39: 1271-1273.
91
Swanson, P. E. 1999. Dehalogenases applied industrial-scale biocatalysis. Current
Opinions in Biotechnology. 10: 365: 369.
Tiedje, J. M. 1993. Bioremediation from an ecological perspective. In situ
bioremediation: When does it work? National-Academy-of-Sciences, National Academy
Press. Washington, D.C., pp. 110-120.
Torz, M., P. and V. Beschkov. 2005. Biodegradation of monochloroacetic acid used as a
sole carbon and energy source by Xanthobacter autotrophicus GJ10 strain in batch and
continuous culture. Biodegradation. 16: 423-433.
Torz, M., P. Wietzes, V. Beschkov and D. B Janssen. 2007. Metabolism of mono- and
dihalogenated C1 and C2 compounds by Xanthobacter autotrophicus GJ10 growing on
1,2-dichloroethane. Biodegradation. 18: 145-157.
Tsang, J. S. H., and L. Sam. 1999. Cloning and characterization of a cryptic haloacid
dehalogenase from Burkholderia cepacia MBA4. Journal of. Bacteriology. 181:6003–
6009.
Vandenbergh, P. A., and B. S. Kunka. 1988. Metabolism of volatile chlorinated
aliphatic hydrocarbons by Pseudomonas fluorescens. Applied and Environmental
Microbiology. 54: 2578-2579.
Van den Wijngaard, A. J., K W van der Kamp, J. van der Ploeg, F. Pries, B
.Kazemier and D. B. Janssen. 1992. Degradation of 1, 2-dichloroethane by
Ancylobacter aquaticus and other facultative methylotrophs. Applied and Environmental
Microbiology. 58: 976–983.
Van den Wijngaard, A. J., R. G. van der Kleij, R. E. Doornweerd and D. B. Janssen.
1993. Influence of organic nutrients and cocultures on the competitive behavior of 1, 2-
92
dichloroethane- degrading bacteria. Applied and Environmental Microbiology. 59: 3400-
3405.
Van der Ploeg, J. and D. B. Janssen. 1995. Sequence analysis of the upstream region of
dhlB, the gene encoding haloalkanoic acid dehalogenase of Xanthobacter autotrophicus
GJ10. Biodegradation. 6: 257-263.
Van der Ploeg, J., M. P. Smidt, A. S. Landa, and D. B. Janssen. 1994. Identification
of chloroacetaldehyde dehydrogenase involved in 1,2-dichloroethane degradation.
Applied and Environmental Microbiology. 60:1599–1605.
Van der Ploeg, J., G. Van Hall and D. B. Janssen. 1991. Characterization of the
haloacid dehalogenase from Xanthobacter autotrophicus GJ10 and sequencing of the
dhlB gene. Journal of Bacteriology. 173: 7925-7933.
Van der Zaan, B., J. de Weert, H. Rijnaarts, W. M. de Vos, H. Smidt, and J.
Gerritse. 2009. Degradation of 1,2-dichloroethane by microbial communities from river
sediment at various redox conditions. Water Research. 43: 3207-3216.
Van Hylckama Vlieg, J. E. T., G. J. Poelarends, A. E. Mars and D. B. Janssen. 2000.
Detoxification of reactive intermediates during microbial metabolism of halogenated
compounds. Current Opinion in Microbiology. 3: 257-262.
Van Hylckama Vlieg, J. E. T and D. B. Janssen. 2001. Formation and detoxification of
reactive intermediates in the metabolism of chlorinated ethenes. Journal of
Biotechnology. 85: 81-102.
Van Pée, K. and S. Unversucht. 2003. Biological dehalogenation halogenation
reactions. Chemosphere. 52: 299-312.
93
Vidali M. 2001. Bioremediation. An overview. Pure and Applied Chemistry. 73: 1163-
1172.
Vogel, T. M. and P. L. McCarty. 1987. Abiotic and biotic transformations of 1,1,1
trichloroethane under methanogenic conditions. Environmental Science and Technology.
21: 1208-1213.
Widada, J., H. Nojiri and T. Omori. 2002. Recent developments in molecular
techniques for identification and monitoring of xenobiotic-degrading bacteria and their
catabolic genes in bioremediation. Applied and Environmental Microbiology. 60: 45-59.
Wubbolts, M. G., and K. N. Timmis. 1990. Biotransformation of substituted benzoates
to the corresponding cis-diols by an engineered strain of Pseudomonas oleovorans
producing the TOL plasmid-specific enzyme toluate-1,2-dioxygenase. Applied and
Environmental Microbiology. 56: 569-571
Xin, Y. H., Y. G. Ghou and W. X. Chen. 2006. Ancylobacter polymorphus sp. nov. and
Ancylobacter vacuolatus sp. nov. International Journal of Systematic and Evolutionary
Microbiology. 56: 1185-1188.
Yokota, T., H. Fuse, T. Omori, and Y. Minoda. 1986. Microbial dehalogenation of
haloalkanes mediated by oxygenase or halidohydrolase. Agricultural and Biological
Chemistry. 50: 453-460.
94
APPENDIX I
1. Composition of buffers and media
1.a Minimal Salts Media (per litre): (as per Section 2.2)
5.37 g of Na2HPO4 12H20,
1.36 g of KH2PO4,
0.5 g of (NH4)2SO4,
0.2 g of MgSO4 '7H20,
5 ml of a salts solution
1.b 1 x Trace element solution (per litre): (as per Section 2.2)
• 530 mg CaCl2
• 200 mg FeSO4.7H2O
• 10 mg ZnSO4.7H2O
• 10 mg H3BO3
• 10 mg CoCl2
• 10 mg MnSO4.5H2O
• 10 mg NaMoO4.2H2O
• 2 mg NiCl2.6H2O
1.c 1 x Vitamin solution (per litre): (as per Section 2.2)
• 0.012 g biotin
• 1 g choline chloride
• 1 g calcium (D)-pantothenate
• 2 g i-inositol
• 1 g nicotinic acid
• 1 g pyridoxine chloride
• 1 g thiamine chloride
• 0.2 g p-aminobenzoic acid
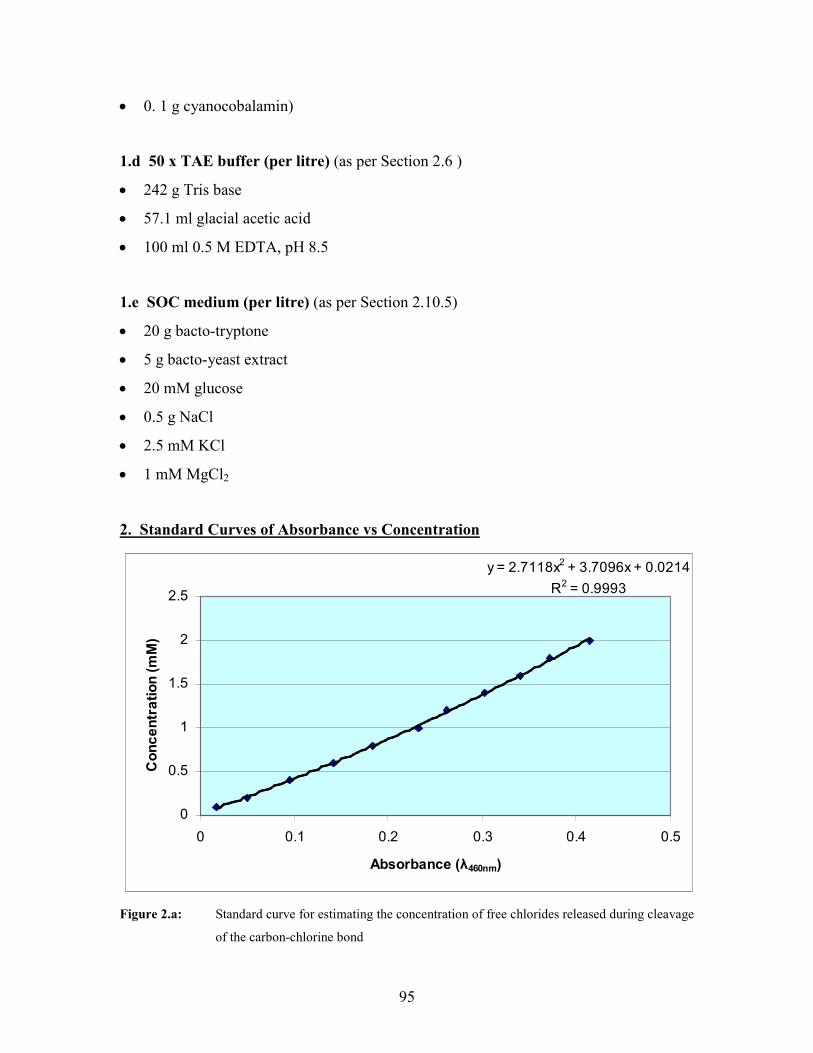
95
• 0. 1 g cyanocobalamin)
1.d 50 x TAE buffer (per litre) (as per Section 2.6 )
• 242 g Tris base
• 57.1 ml glacial acetic acid
• 100 ml 0.5 M EDTA, pH 8.5
1.e SOC medium (per litre) (as per Section 2.10.5)
• 20 g bacto-tryptone
• 5 g bacto-yeast extract
• 20 mM glucose
• 0.5 g NaCl
• 2.5 mM KCl
• 1 mM MgCl2
2. Standard Curves of Absorbance vs Concentration
y = 2.7118x2 + 3.7096x + 0.0214
R2 = 0.9993
0
0.5
1
1.5
2
2.5
0 0.1 0.2 0.3 0.4 0.5
Absorbance (λ460nm)
Con
cent
ratio
n (m
M)
Figure 2.a: Standard curve for estimating the concentration of free chlorides released during cleavage
of the carbon-chlorine bond
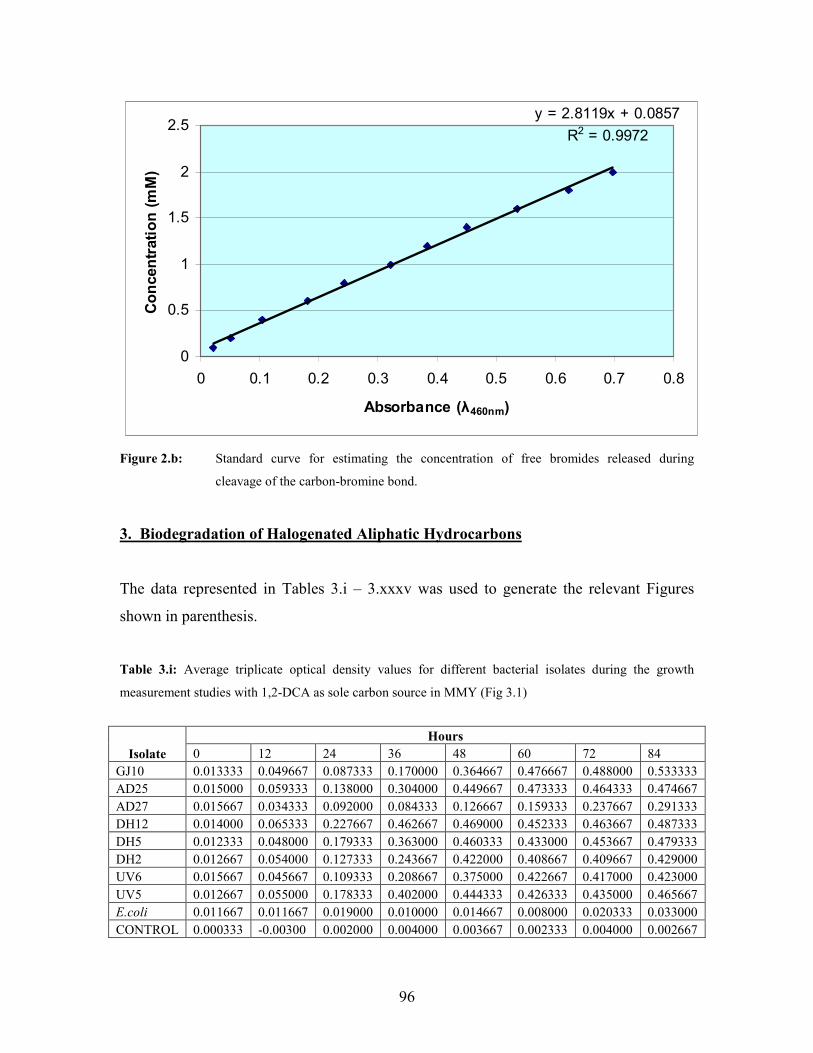
96
y = 2.8119x + 0.0857R2 = 0.9972
0
0.5
1
1.5
2
2.5
0 0.1 0.2 0.3 0.4 0.5 0.6 0.7 0.8
Absorbance (λ460nm)
Co
nce
ntr
atio
n (
mM
)
Figure 2.b: Standard curve for estimating the concentration of free bromides released during
cleavage of the carbon-bromine bond.
3. Biodegradation of Halogenated Aliphatic Hydrocarbons
The data represented in Tables 3.i – 3.xxxv was used to generate the relevant Figures
shown in parenthesis.
Table 3.i: Average triplicate optical density values for different bacterial isolates during the growth
measurement studies with 1,2-DCA as sole carbon source in MMY (Fig 3.1)
Isolate Hours
0 12 24 36 48 60 72 84 GJ10 0.013333 0.049667 0.087333 0.170000 0.364667 0.476667 0.488000 0.533333 AD25 0.015000 0.059333 0.138000 0.304000 0.449667 0.473333 0.464333 0.474667 AD27 0.015667 0.034333 0.092000 0.084333 0.126667 0.159333 0.237667 0.291333 DH12 0.014000 0.065333 0.227667 0.462667 0.469000 0.452333 0.463667 0.487333 DH5 0.012333 0.048000 0.179333 0.363000 0.460333 0.433000 0.453667 0.479333 DH2 0.012667 0.054000 0.127333 0.243667 0.422000 0.408667 0.409667 0.429000 UV6 0.015667 0.045667 0.109333 0.208667 0.375000 0.422667 0.417000 0.423000 UV5 0.012667 0.055000 0.178333 0.402000 0.444333 0.426333 0.435000 0.465667 E.coli 0.011667 0.011667 0.019000 0.010000 0.014667 0.008000 0.020333 0.033000 CONTROL 0.000333 -0.00300 0.002000 0.004000 0.003667 0.002333 0.004000 0.002667
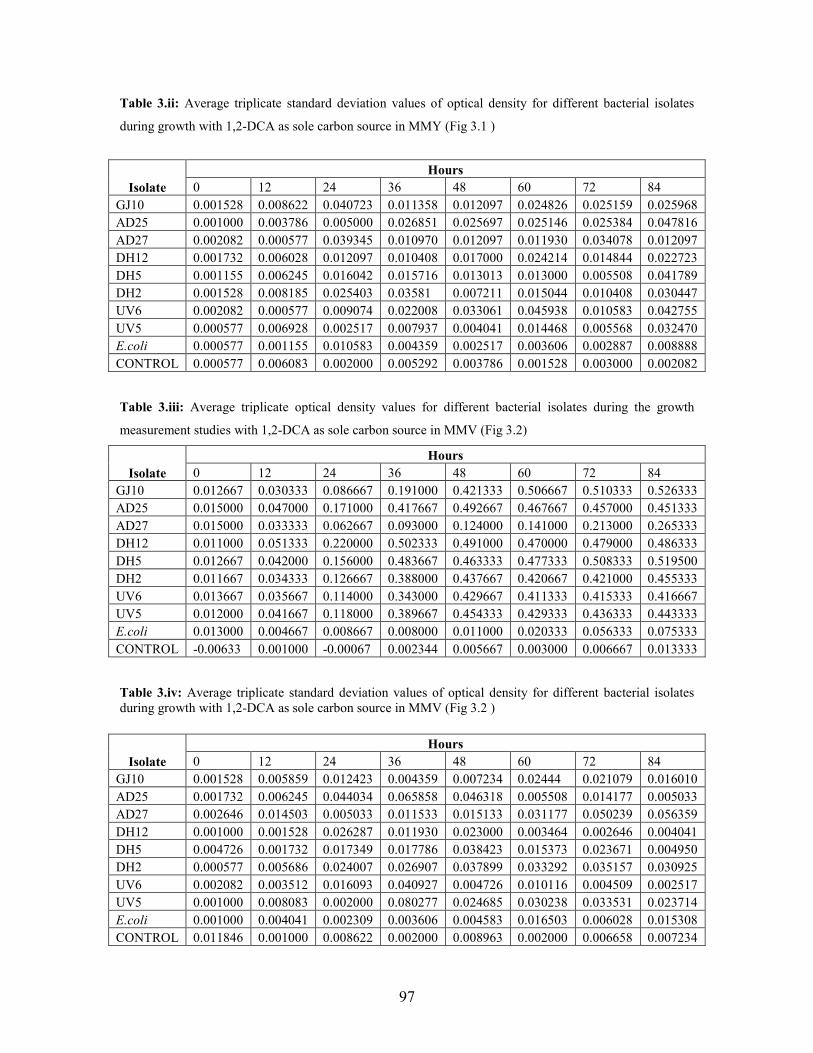
97
Table 3.ii: Average triplicate standard deviation values of optical density for different bacterial isolates
during growth with 1,2-DCA as sole carbon source in MMY (Fig 3.1 )
Isolate Hours
0 12 24 36 48 60 72 84 GJ10 0.001528 0.008622 0.040723 0.011358 0.012097 0.024826 0.025159 0.025968 AD25 0.001000 0.003786 0.005000 0.026851 0.025697 0.025146 0.025384 0.047816 AD27 0.002082 0.000577 0.039345 0.010970 0.012097 0.011930 0.034078 0.012097 DH12 0.001732 0.006028 0.012097 0.010408 0.017000 0.024214 0.014844 0.022723 DH5 0.001155 0.006245 0.016042 0.015716 0.013013 0.013000 0.005508 0.041789 DH2 0.001528 0.008185 0.025403 0.03581 0.007211 0.015044 0.010408 0.030447 UV6 0.002082 0.000577 0.009074 0.022008 0.033061 0.045938 0.010583 0.042755 UV5 0.000577 0.006928 0.002517 0.007937 0.004041 0.014468 0.005568 0.032470 E.coli 0.000577 0.001155 0.010583 0.004359 0.002517 0.003606 0.002887 0.008888 CONTROL 0.000577 0.006083 0.002000 0.005292 0.003786 0.001528 0.003000 0.002082
Table 3.iii: Average triplicate optical density values for different bacterial isolates during the growth
measurement studies with 1,2-DCA as sole carbon source in MMV (Fig 3.2)
Isolate Hours
0 12 24 36 48 60 72 84 GJ10 0.012667 0.030333 0.086667 0.191000 0.421333 0.506667 0.510333 0.526333 AD25 0.015000 0.047000 0.171000 0.417667 0.492667 0.467667 0.457000 0.451333 AD27 0.015000 0.033333 0.062667 0.093000 0.124000 0.141000 0.213000 0.265333 DH12 0.011000 0.051333 0.220000 0.502333 0.491000 0.470000 0.479000 0.486333 DH5 0.012667 0.042000 0.156000 0.483667 0.463333 0.477333 0.508333 0.519500 DH2 0.011667 0.034333 0.126667 0.388000 0.437667 0.420667 0.421000 0.455333 UV6 0.013667 0.035667 0.114000 0.343000 0.429667 0.411333 0.415333 0.416667 UV5 0.012000 0.041667 0.118000 0.389667 0.454333 0.429333 0.436333 0.443333 E.coli 0.013000 0.004667 0.008667 0.008000 0.011000 0.020333 0.056333 0.075333 CONTROL -0.00633 0.001000 -0.00067 0.002344 0.005667 0.003000 0.006667 0.013333
Table 3.iv: Average triplicate standard deviation values of optical density for different bacterial isolates during growth with 1,2-DCA as sole carbon source in MMV (Fig 3.2 )
Isolate Hours
0 12 24 36 48 60 72 84 GJ10 0.001528 0.005859 0.012423 0.004359 0.007234 0.02444 0.021079 0.016010 AD25 0.001732 0.006245 0.044034 0.065858 0.046318 0.005508 0.014177 0.005033 AD27 0.002646 0.014503 0.005033 0.011533 0.015133 0.031177 0.050239 0.056359 DH12 0.001000 0.001528 0.026287 0.011930 0.023000 0.003464 0.002646 0.004041 DH5 0.004726 0.001732 0.017349 0.017786 0.038423 0.015373 0.023671 0.004950 DH2 0.000577 0.005686 0.024007 0.026907 0.037899 0.033292 0.035157 0.030925 UV6 0.002082 0.003512 0.016093 0.040927 0.004726 0.010116 0.004509 0.002517 UV5 0.001000 0.008083 0.002000 0.080277 0.024685 0.030238 0.033531 0.023714 E.coli 0.001000 0.004041 0.002309 0.003606 0.004583 0.016503 0.006028 0.015308 CONTROL 0.011846 0.001000 0.008622 0.002000 0.008963 0.002000 0.006658 0.007234
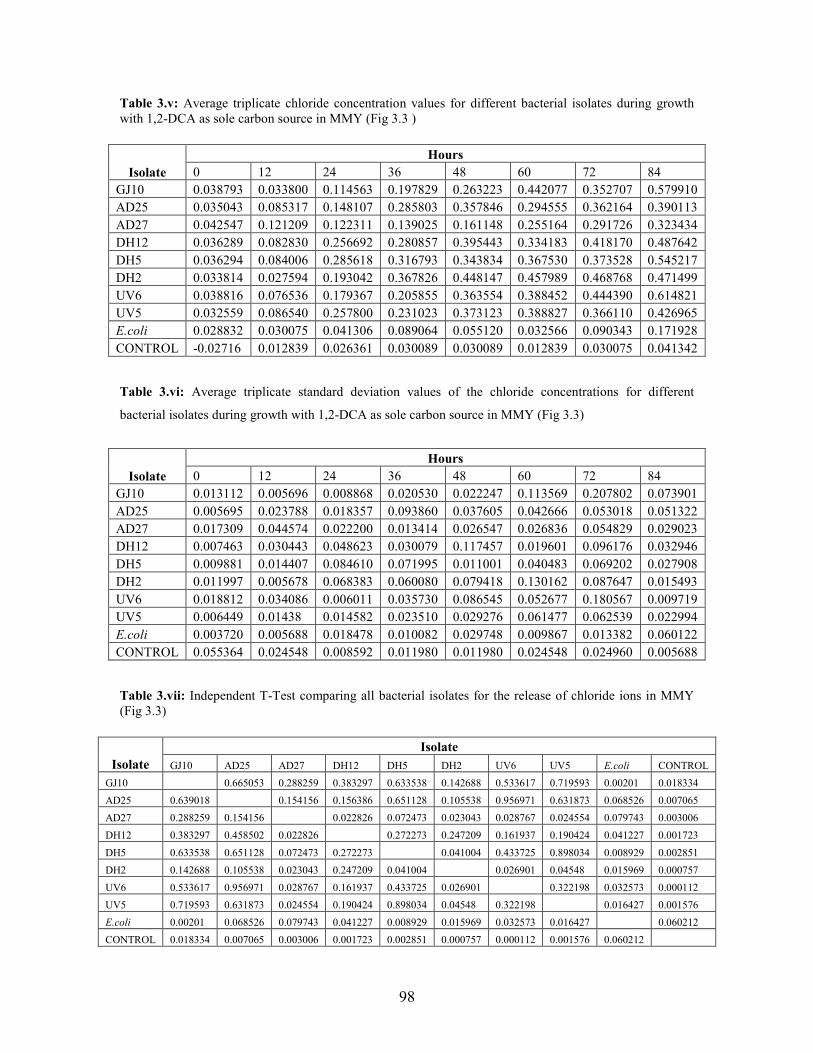
98
Table 3.v: Average triplicate chloride concentration values for different bacterial isolates during growth with 1,2-DCA as sole carbon source in MMY (Fig 3.3 )
Isolate Hours
0 12 24 36 48 60 72 84 GJ10 0.038793 0.033800 0.114563 0.197829 0.263223 0.442077 0.352707 0.579910 AD25 0.035043 0.085317 0.148107 0.285803 0.357846 0.294555 0.362164 0.390113 AD27 0.042547 0.121209 0.122311 0.139025 0.161148 0.255164 0.291726 0.323434 DH12 0.036289 0.082830 0.256692 0.280857 0.395443 0.334183 0.418170 0.487642 DH5 0.036294 0.084006 0.285618 0.316793 0.343834 0.367530 0.373528 0.545217 DH2 0.033814 0.027594 0.193042 0.367826 0.448147 0.457989 0.468768 0.471499 UV6 0.038816 0.076536 0.179367 0.205855 0.363554 0.388452 0.444390 0.614821 UV5 0.032559 0.086540 0.257800 0.231023 0.373123 0.388827 0.366110 0.426965 E.coli 0.028832 0.030075 0.041306 0.089064 0.055120 0.032566 0.090343 0.171928 CONTROL -0.02716 0.012839 0.026361 0.030089 0.030089 0.012839 0.030075 0.041342
Table 3.vi: Average triplicate standard deviation values of the chloride concentrations for different
bacterial isolates during growth with 1,2-DCA as sole carbon source in MMY (Fig 3.3)
Isolate Hours
0 12 24 36 48 60 72 84 GJ10 0.013112 0.005696 0.008868 0.020530 0.022247 0.113569 0.207802 0.073901 AD25 0.005695 0.023788 0.018357 0.093860 0.037605 0.042666 0.053018 0.051322 AD27 0.017309 0.044574 0.022200 0.013414 0.026547 0.026836 0.054829 0.029023 DH12 0.007463 0.030443 0.048623 0.030079 0.117457 0.019601 0.096176 0.032946 DH5 0.009881 0.014407 0.084610 0.071995 0.011001 0.040483 0.069202 0.027908 DH2 0.011997 0.005678 0.068383 0.060080 0.079418 0.130162 0.087647 0.015493 UV6 0.018812 0.034086 0.006011 0.035730 0.086545 0.052677 0.180567 0.009719 UV5 0.006449 0.01438 0.014582 0.023510 0.029276 0.061477 0.062539 0.022994 E.coli 0.003720 0.005688 0.018478 0.010082 0.029748 0.009867 0.013382 0.060122 CONTROL 0.055364 0.024548 0.008592 0.011980 0.011980 0.024548 0.024960 0.005688
Table 3.vii: Independent T-Test comparing all bacterial isolates for the release of chloride ions in MMY (Fig 3.3)
Isolate Isolate
GJ10 AD25 AD27 DH12 DH5 DH2 UV6 UV5 E.coli CONTROL
GJ10 0.665053 0.288259 0.383297 0.633538 0.142688 0.533617 0.719593 0.00201 0.018334
AD25 0.639018 0.154156 0.156386 0.651128 0.105538 0.956971 0.631873 0.068526 0.007065
AD27 0.288259 0.154156 0.022826 0.072473 0.023043 0.028767 0.024554 0.079743 0.003006
DH12 0.383297 0.458502 0.022826 0.272273 0.247209 0.161937 0.190424 0.041227 0.001723
DH5 0.633538 0.651128 0.072473 0.272273 0.041004 0.433725 0.898034 0.008929 0.002851
DH2 0.142688 0.105538 0.023043 0.247209 0.041004 0.026901 0.04548 0.015969 0.000757
UV6 0.533617 0.956971 0.028767 0.161937 0.433725 0.026901 0.322198 0.032573 0.000112
UV5 0.719593 0.631873 0.024554 0.190424 0.898034 0.04548 0.322198 0.016427 0.001576
E.coli 0.00201 0.068526 0.079743 0.041227 0.008929 0.015969 0.032573 0.016427 0.060212
CONTROL 0.018334 0.007065 0.003006 0.001723 0.002851 0.000757 0.000112 0.001576 0.060212
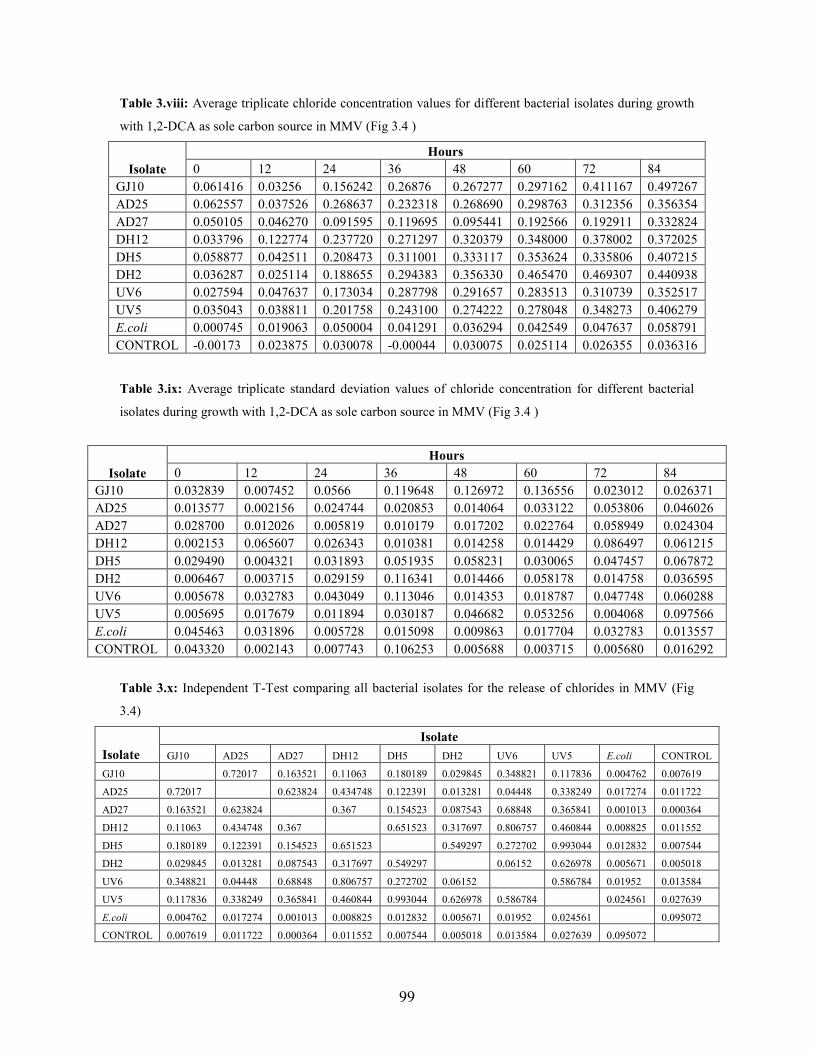
99
Table 3.viii: Average triplicate chloride concentration values for different bacterial isolates during growth
with 1,2-DCA as sole carbon source in MMV (Fig 3.4 )
Isolate Hours
0 12 24 36 48 60 72 84 GJ10 0.061416 0.03256 0.156242 0.26876 0.267277 0.297162 0.411167 0.497267 AD25 0.062557 0.037526 0.268637 0.232318 0.268690 0.298763 0.312356 0.356354 AD27 0.050105 0.046270 0.091595 0.119695 0.095441 0.192566 0.192911 0.332824 DH12 0.033796 0.122774 0.237720 0.271297 0.320379 0.348000 0.378002 0.372025 DH5 0.058877 0.042511 0.208473 0.311001 0.333117 0.353624 0.335806 0.407215 DH2 0.036287 0.025114 0.188655 0.294383 0.356330 0.465470 0.469307 0.440938 UV6 0.027594 0.047637 0.173034 0.287798 0.291657 0.283513 0.310739 0.352517 UV5 0.035043 0.038811 0.201758 0.243100 0.274222 0.278048 0.348273 0.406279 E.coli 0.000745 0.019063 0.050004 0.041291 0.036294 0.042549 0.047637 0.058791 CONTROL -0.00173 0.023875 0.030078 -0.00044 0.030075 0.025114 0.026355 0.036316
Table 3.ix: Average triplicate standard deviation values of chloride concentration for different bacterial
isolates during growth with 1,2-DCA as sole carbon source in MMV (Fig 3.4 )
Isolate Hours
0 12 24 36 48 60 72 84 GJ10 0.032839 0.007452 0.0566 0.119648 0.126972 0.136556 0.023012 0.026371 AD25 0.013577 0.002156 0.024744 0.020853 0.014064 0.033122 0.053806 0.046026 AD27 0.028700 0.012026 0.005819 0.010179 0.017202 0.022764 0.058949 0.024304 DH12 0.002153 0.065607 0.026343 0.010381 0.014258 0.014429 0.086497 0.061215 DH5 0.029490 0.004321 0.031893 0.051935 0.058231 0.030065 0.047457 0.067872 DH2 0.006467 0.003715 0.029159 0.116341 0.014466 0.058178 0.014758 0.036595 UV6 0.005678 0.032783 0.043049 0.113046 0.014353 0.018787 0.047748 0.060288 UV5 0.005695 0.017679 0.011894 0.030187 0.046682 0.053256 0.004068 0.097566 E.coli 0.045463 0.031896 0.005728 0.015098 0.009863 0.017704 0.032783 0.013557 CONTROL 0.043320 0.002143 0.007743 0.106253 0.005688 0.003715 0.005680 0.016292
Table 3.x: Independent T-Test comparing all bacterial isolates for the release of chlorides in MMV (Fig
3.4)
Isolate Isolate
GJ10 AD25 AD27 DH12 DH5 DH2 UV6 UV5 E.coli CONTROL
GJ10 0.72017 0.163521 0.11063 0.180189 0.029845 0.348821 0.117836 0.004762 0.007619
AD25 0.72017 0.623824 0.434748 0.122391 0.013281 0.04448 0.338249 0.017274 0.011722
AD27 0.163521 0.623824 0.367 0.154523 0.087543 0.68848 0.365841 0.001013 0.000364
DH12 0.11063 0.434748 0.367 0.651523 0.317697 0.806757 0.460844 0.008825 0.011552
DH5 0.180189 0.122391 0.154523 0.651523 0.549297 0.272702 0.993044 0.012832 0.007544
DH2 0.029845 0.013281 0.087543 0.317697 0.549297 0.06152 0.626978 0.005671 0.005018
UV6 0.348821 0.04448 0.68848 0.806757 0.272702 0.06152 0.586784 0.01952 0.013584
UV5 0.117836 0.338249 0.365841 0.460844 0.993044 0.626978 0.586784 0.024561 0.027639
E.coli 0.004762 0.017274 0.001013 0.008825 0.012832 0.005671 0.01952 0.024561 0.095072
CONTROL 0.007619 0.011722 0.000364 0.011552 0.007544 0.005018 0.013584 0.027639 0.095072
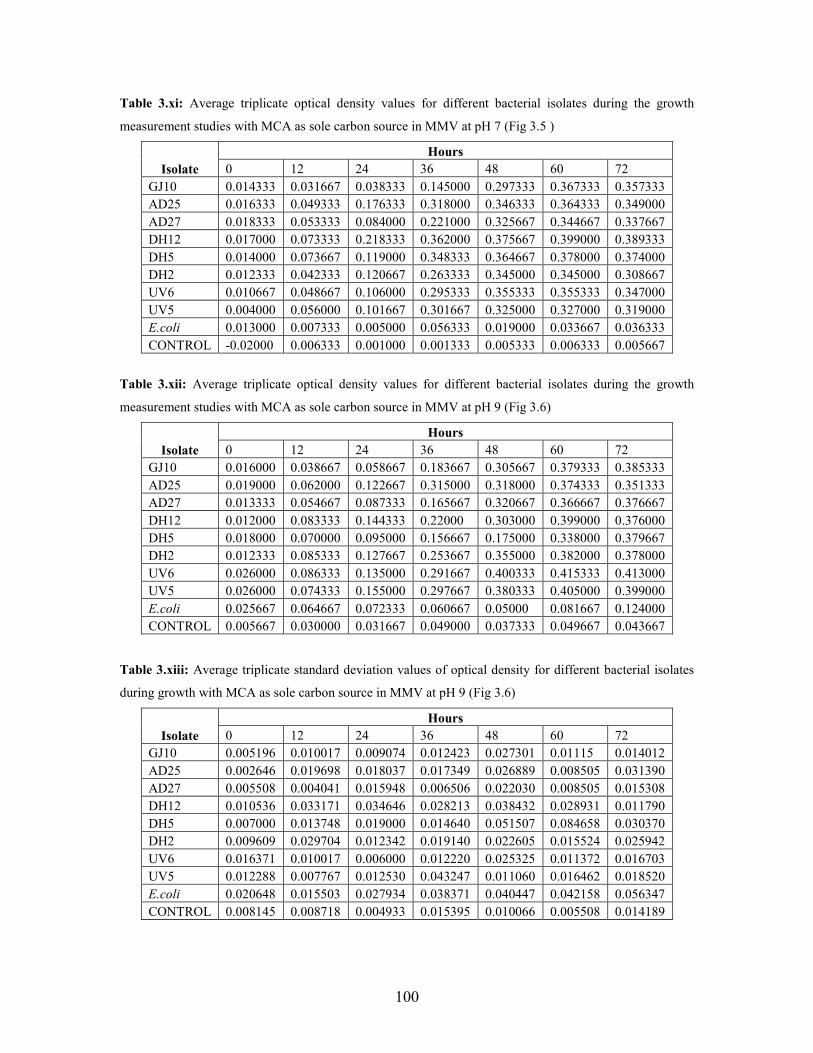
100
Table 3.xi: Average triplicate optical density values for different bacterial isolates during the growth
measurement studies with MCA as sole carbon source in MMV at pH 7 (Fig 3.5 )
Isolate Hours
0 12 24 36 48 60 72 GJ10 0.014333 0.031667 0.038333 0.145000 0.297333 0.367333 0.357333 AD25 0.016333 0.049333 0.176333 0.318000 0.346333 0.364333 0.349000 AD27 0.018333 0.053333 0.084000 0.221000 0.325667 0.344667 0.337667 DH12 0.017000 0.073333 0.218333 0.362000 0.375667 0.399000 0.389333 DH5 0.014000 0.073667 0.119000 0.348333 0.364667 0.378000 0.374000 DH2 0.012333 0.042333 0.120667 0.263333 0.345000 0.345000 0.308667 UV6 0.010667 0.048667 0.106000 0.295333 0.355333 0.355333 0.347000 UV5 0.004000 0.056000 0.101667 0.301667 0.325000 0.327000 0.319000 E.coli 0.013000 0.007333 0.005000 0.056333 0.019000 0.033667 0.036333 CONTROL -0.02000 0.006333 0.001000 0.001333 0.005333 0.006333 0.005667
Table 3.xii: Average triplicate optical density values for different bacterial isolates during the growth
measurement studies with MCA as sole carbon source in MMV at pH 9 (Fig 3.6)
Isolate Hours
0 12 24 36 48 60 72 GJ10 0.016000 0.038667 0.058667 0.183667 0.305667 0.379333 0.385333 AD25 0.019000 0.062000 0.122667 0.315000 0.318000 0.374333 0.351333 AD27 0.013333 0.054667 0.087333 0.165667 0.320667 0.366667 0.376667 DH12 0.012000 0.083333 0.144333 0.22000 0.303000 0.399000 0.376000 DH5 0.018000 0.070000 0.095000 0.156667 0.175000 0.338000 0.379667 DH2 0.012333 0.085333 0.127667 0.253667 0.355000 0.382000 0.378000 UV6 0.026000 0.086333 0.135000 0.291667 0.400333 0.415333 0.413000 UV5 0.026000 0.074333 0.155000 0.297667 0.380333 0.405000 0.399000 E.coli 0.025667 0.064667 0.072333 0.060667 0.05000 0.081667 0.124000 CONTROL 0.005667 0.030000 0.031667 0.049000 0.037333 0.049667 0.043667
Table 3.xiii: Average triplicate standard deviation values of optical density for different bacterial isolates
during growth with MCA as sole carbon source in MMV at pH 9 (Fig 3.6)
Isolate Hours
0 12 24 36 48 60 72 GJ10 0.005196 0.010017 0.009074 0.012423 0.027301 0.01115 0.014012 AD25 0.002646 0.019698 0.018037 0.017349 0.026889 0.008505 0.031390 AD27 0.005508 0.004041 0.015948 0.006506 0.022030 0.008505 0.015308 DH12 0.010536 0.033171 0.034646 0.028213 0.038432 0.028931 0.011790 DH5 0.007000 0.013748 0.019000 0.014640 0.051507 0.084658 0.030370 DH2 0.009609 0.029704 0.012342 0.019140 0.022605 0.015524 0.025942 UV6 0.016371 0.010017 0.006000 0.012220 0.025325 0.011372 0.016703 UV5 0.012288 0.007767 0.012530 0.043247 0.011060 0.016462 0.018520 E.coli 0.020648 0.015503 0.027934 0.038371 0.040447 0.042158 0.056347 CONTROL 0.008145 0.008718 0.004933 0.015395 0.010066 0.005508 0.014189
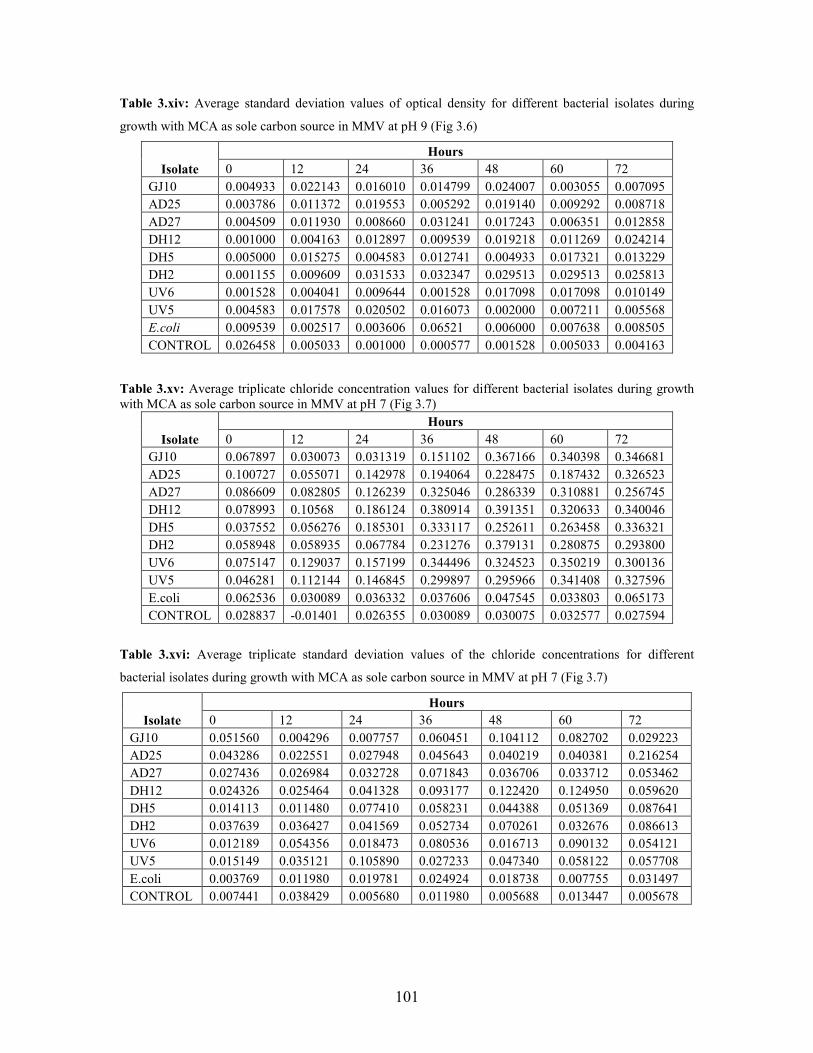
101
Table 3.xiv: Average standard deviation values of optical density for different bacterial isolates during
growth with MCA as sole carbon source in MMV at pH 9 (Fig 3.6)
Isolate Hours
0 12 24 36 48 60 72 GJ10 0.004933 0.022143 0.016010 0.014799 0.024007 0.003055 0.007095 AD25 0.003786 0.011372 0.019553 0.005292 0.019140 0.009292 0.008718 AD27 0.004509 0.011930 0.008660 0.031241 0.017243 0.006351 0.012858 DH12 0.001000 0.004163 0.012897 0.009539 0.019218 0.011269 0.024214 DH5 0.005000 0.015275 0.004583 0.012741 0.004933 0.017321 0.013229 DH2 0.001155 0.009609 0.031533 0.032347 0.029513 0.029513 0.025813 UV6 0.001528 0.004041 0.009644 0.001528 0.017098 0.017098 0.010149 UV5 0.004583 0.017578 0.020502 0.016073 0.002000 0.007211 0.005568 E.coli 0.009539 0.002517 0.003606 0.06521 0.006000 0.007638 0.008505 CONTROL 0.026458 0.005033 0.001000 0.000577 0.001528 0.005033 0.004163
Table 3.xv: Average triplicate chloride concentration values for different bacterial isolates during growth with MCA as sole carbon source in MMV at pH 7 (Fig 3.7)
Isolate Hours
0 12 24 36 48 60 72 GJ10 0.067897 0.030073 0.031319 0.151102 0.367166 0.340398 0.346681 AD25 0.100727 0.055071 0.142978 0.194064 0.228475 0.187432 0.326523 AD27 0.086609 0.082805 0.126239 0.325046 0.286339 0.310881 0.256745 DH12 0.078993 0.10568 0.186124 0.380914 0.391351 0.320633 0.340046 DH5 0.037552 0.056276 0.185301 0.333117 0.252611 0.263458 0.336321 DH2 0.058948 0.058935 0.067784 0.231276 0.379131 0.280875 0.293800 UV6 0.075147 0.129037 0.157199 0.344496 0.324523 0.350219 0.300136 UV5 0.046281 0.112144 0.146845 0.299897 0.295966 0.341408 0.327596 E.coli 0.062536 0.030089 0.036332 0.037606 0.047545 0.033803 0.065173 CONTROL 0.028837 -0.01401 0.026355 0.030089 0.030075 0.032577 0.027594
Table 3.xvi: Average triplicate standard deviation values of the chloride concentrations for different
bacterial isolates during growth with MCA as sole carbon source in MMV at pH 7 (Fig 3.7)
Isolate Hours
0 12 24 36 48 60 72 GJ10 0.051560 0.004296 0.007757 0.060451 0.104112 0.082702 0.029223 AD25 0.043286 0.022551 0.027948 0.045643 0.040219 0.040381 0.216254 AD27 0.027436 0.026984 0.032728 0.071843 0.036706 0.033712 0.053462 DH12 0.024326 0.025464 0.041328 0.093177 0.122420 0.124950 0.059620 DH5 0.014113 0.011480 0.077410 0.058231 0.044388 0.051369 0.087641 DH2 0.037639 0.036427 0.041569 0.052734 0.070261 0.032676 0.086613 UV6 0.012189 0.054356 0.018473 0.080536 0.016713 0.090132 0.054121 UV5 0.015149 0.035121 0.105890 0.027233 0.047340 0.058122 0.057708 E.coli 0.003769 0.011980 0.019781 0.024924 0.018738 0.007755 0.031497 CONTROL 0.007441 0.038429 0.005680 0.011980 0.005688 0.013447 0.005678
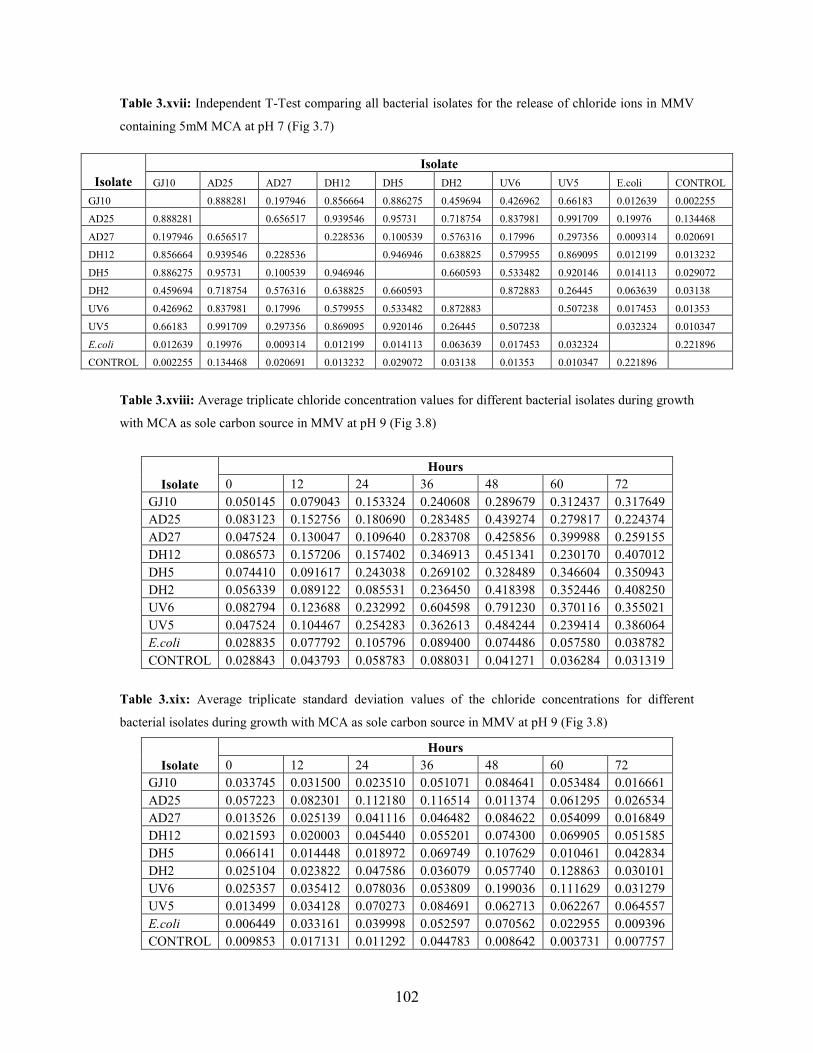
102
Table 3.xvii: Independent T-Test comparing all bacterial isolates for the release of chloride ions in MMV
containing 5mM MCA at pH 7 (Fig 3.7)
Table 3.xviii: Average triplicate chloride concentration values for different bacterial isolates during growth
with MCA as sole carbon source in MMV at pH 9 (Fig 3.8)
Isolate Hours
0 12 24 36 48 60 72 GJ10 0.050145 0.079043 0.153324 0.240608 0.289679 0.312437 0.317649 AD25 0.083123 0.152756 0.180690 0.283485 0.439274 0.279817 0.224374 AD27 0.047524 0.130047 0.109640 0.283708 0.425856 0.399988 0.259155 DH12 0.086573 0.157206 0.157402 0.346913 0.451341 0.230170 0.407012 DH5 0.074410 0.091617 0.243038 0.269102 0.328489 0.346604 0.350943 DH2 0.056339 0.089122 0.085531 0.236450 0.418398 0.352446 0.408250 UV6 0.082794 0.123688 0.232992 0.604598 0.791230 0.370116 0.355021 UV5 0.047524 0.104467 0.254283 0.362613 0.484244 0.239414 0.386064 E.coli 0.028835 0.077792 0.105796 0.089400 0.074486 0.057580 0.038782 CONTROL 0.028843 0.043793 0.058783 0.088031 0.041271 0.036284 0.031319
Table 3.xix: Average triplicate standard deviation values of the chloride concentrations for different
bacterial isolates during growth with MCA as sole carbon source in MMV at pH 9 (Fig 3.8)
Isolate Hours
0 12 24 36 48 60 72 GJ10 0.033745 0.031500 0.023510 0.051071 0.084641 0.053484 0.016661 AD25 0.057223 0.082301 0.112180 0.116514 0.011374 0.061295 0.026534 AD27 0.013526 0.025139 0.041116 0.046482 0.084622 0.054099 0.016849 DH12 0.021593 0.020003 0.045440 0.055201 0.074300 0.069905 0.051585 DH5 0.066141 0.014448 0.018972 0.069749 0.107629 0.010461 0.042834 DH2 0.025104 0.023822 0.047586 0.036079 0.057740 0.128863 0.030101 UV6 0.025357 0.035412 0.078036 0.053809 0.199036 0.111629 0.031279 UV5 0.013499 0.034128 0.070273 0.084691 0.062713 0.062267 0.064557 E.coli 0.006449 0.033161 0.039998 0.052597 0.070562 0.022955 0.009396 CONTROL 0.009853 0.017131 0.011292 0.044783 0.008642 0.003731 0.007757
Isolate
Isolate GJ10 AD25 AD27 DH12 DH5 DH2 UV6 UV5 E.coli CONTROL
GJ10 0.888281 0.197946 0.856664 0.886275 0.459694 0.426962 0.66183 0.012639 0.002255
AD25 0.888281 0.656517 0.939546 0.95731 0.718754 0.837981 0.991709 0.19976 0.134468
AD27 0.197946 0.656517 0.228536 0.100539 0.576316 0.17996 0.297356 0.009314 0.020691
DH12 0.856664 0.939546 0.228536 0.946946 0.638825 0.579955 0.869095 0.012199 0.013232
DH5 0.886275 0.95731 0.100539 0.946946 0.660593 0.533482 0.920146 0.014113 0.029072
DH2 0.459694 0.718754 0.576316 0.638825 0.660593 0.872883 0.26445 0.063639 0.03138
UV6 0.426962 0.837981 0.17996 0.579955 0.533482 0.872883 0.507238 0.017453 0.01353
UV5 0.66183 0.991709 0.297356 0.869095 0.920146 0.26445 0.507238 0.032324 0.010347
E.coli 0.012639 0.19976 0.009314 0.012199 0.014113 0.063639 0.017453 0.032324 0.221896
CONTROL 0.002255 0.134468 0.020691 0.013232 0.029072 0.03138 0.01353 0.010347 0.221896
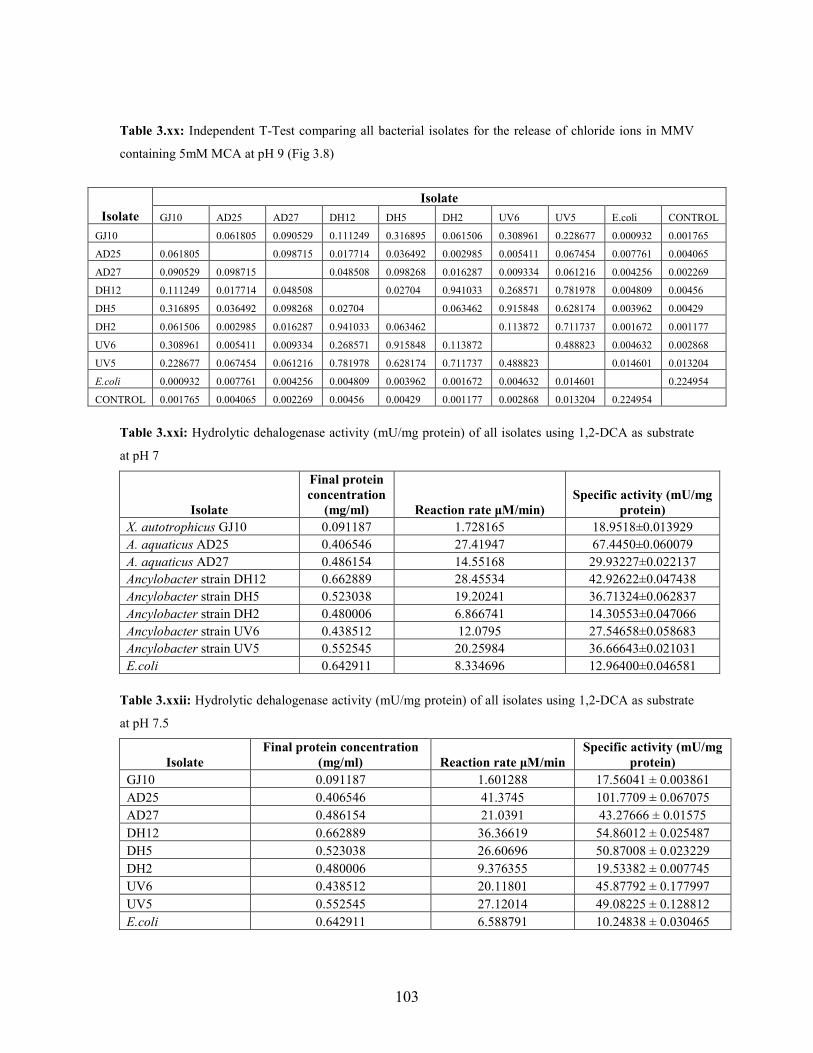
103
Table 3.xx: Independent T-Test comparing all bacterial isolates for the release of chloride ions in MMV
containing 5mM MCA at pH 9 (Fig 3.8)
Isolate Isolate
GJ10 AD25 AD27 DH12 DH5 DH2 UV6 UV5 E.coli CONTROL
GJ10 0.061805 0.090529 0.111249 0.316895 0.061506 0.308961 0.228677 0.000932 0.001765
AD25 0.061805 0.098715 0.017714 0.036492 0.002985 0.005411 0.067454 0.007761 0.004065
AD27 0.090529 0.098715 0.048508 0.098268 0.016287 0.009334 0.061216 0.004256 0.002269
DH12 0.111249 0.017714 0.048508 0.02704 0.941033 0.268571 0.781978 0.004809 0.00456
DH5 0.316895 0.036492 0.098268 0.02704 0.063462 0.915848 0.628174 0.003962 0.00429
DH2 0.061506 0.002985 0.016287 0.941033 0.063462 0.113872 0.711737 0.001672 0.001177
UV6 0.308961 0.005411 0.009334 0.268571 0.915848 0.113872 0.488823 0.004632 0.002868
UV5 0.228677 0.067454 0.061216 0.781978 0.628174 0.711737 0.488823 0.014601 0.013204
E.coli 0.000932 0.007761 0.004256 0.004809 0.003962 0.001672 0.004632 0.014601 0.224954
CONTROL 0.001765 0.004065 0.002269 0.00456 0.00429 0.001177 0.002868 0.013204 0.224954
Table 3.xxi: Hydrolytic dehalogenase activity (mU/mg protein) of all isolates using 1,2-DCA as substrate
at pH 7
Isolate
Final protein concentration
(mg/ml) Reaction rate µM/min) Specific activity (mU/mg
protein) X. autotrophicus GJ10 0.091187 1.728165 18.9518±0.013929 A. aquaticus AD25 0.406546 27.41947 67.4450±0.060079 A. aquaticus AD27 0.486154 14.55168 29.93227±0.022137 Ancylobacter strain DH12 0.662889 28.45534 42.92622±0.047438 Ancylobacter strain DH5 0.523038 19.20241 36.71324±0.062837 Ancylobacter strain DH2 0.480006 6.866741 14.30553±0.047066 Ancylobacter strain UV6 0.438512 12.0795 27.54658±0.058683 Ancylobacter strain UV5 0.552545 20.25984 36.66643±0.021031 E.coli 0.642911 8.334696 12.96400±0.046581
Table 3.xxii: Hydrolytic dehalogenase activity (mU/mg protein) of all isolates using 1,2-DCA as substrate
at pH 7.5
Isolate Final protein concentration
(mg/ml) Reaction rate µM/min Specific activity (mU/mg
protein) GJ10 0.091187 1.601288 17.56041 ± 0.003861 AD25 0.406546 41.3745 101.7709 ± 0.067075 AD27 0.486154 21.0391 43.27666 ± 0.01575 DH12 0.662889 36.36619 54.86012 ± 0.025487 DH5 0.523038 26.60696 50.87008 ± 0.023229 DH2 0.480006 9.376355 19.53382 ± 0.007745 UV6 0.438512 20.11801 45.87792 ± 0.177997 UV5 0.552545 27.12014 49.08225 ± 0.128812 E.coli 0.642911 6.588791 10.24838 ± 0.030465
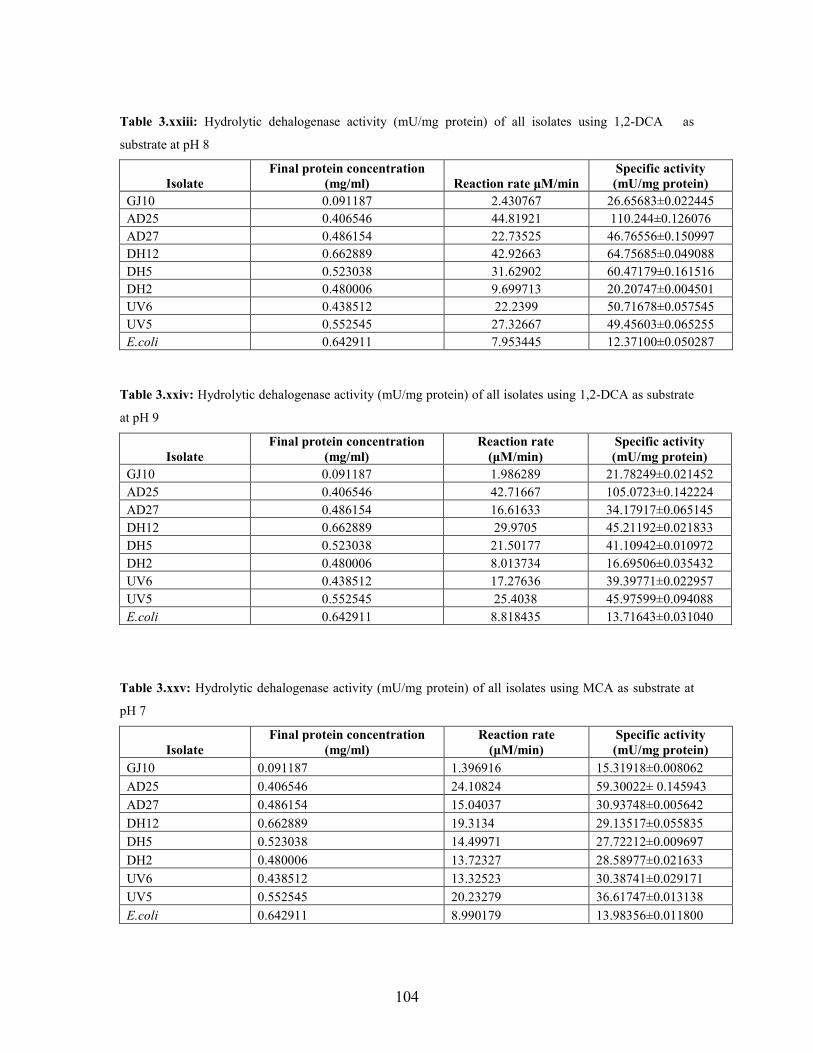
104
Table 3.xxiii: Hydrolytic dehalogenase activity (mU/mg protein) of all isolates using 1,2-DCA as
substrate at pH 8
Isolate Final protein concentration
(mg/ml) Reaction rate µM/min Specific activity (mU/mg protein)
GJ10 0.091187 2.430767 26.65683±0.022445 AD25 0.406546 44.81921 110.244±0.126076 AD27 0.486154 22.73525 46.76556±0.150997 DH12 0.662889 42.92663 64.75685±0.049088 DH5 0.523038 31.62902 60.47179±0.161516 DH2 0.480006 9.699713 20.20747±0.004501 UV6 0.438512 22.2399 50.71678±0.057545 UV5 0.552545 27.32667 49.45603±0.065255 E.coli 0.642911 7.953445 12.37100±0.050287
Table 3.xxiv: Hydrolytic dehalogenase activity (mU/mg protein) of all isolates using 1,2-DCA as substrate
at pH 9
Isolate Final protein concentration
(mg/ml) Reaction rate
(µM/min) Specific activity (mU/mg protein)
GJ10 0.091187 1.986289 21.78249±0.021452 AD25 0.406546 42.71667 105.0723±0.142224 AD27 0.486154 16.61633 34.17917±0.065145 DH12 0.662889 29.9705 45.21192±0.021833 DH5 0.523038 21.50177 41.10942±0.010972 DH2 0.480006 8.013734 16.69506±0.035432 UV6 0.438512 17.27636 39.39771±0.022957 UV5 0.552545 25.4038 45.97599±0.094088 E.coli 0.642911 8.818435 13.71643±0.031040
Table 3.xxv: Hydrolytic dehalogenase activity (mU/mg protein) of all isolates using MCA as substrate at
pH 7
Isolate Final protein concentration
(mg/ml) Reaction rate
(µM/min) Specific activity (mU/mg protein)
GJ10 0.091187 1.396916 15.31918±0.008062 AD25 0.406546 24.10824 59.30022± 0.145943 AD27 0.486154 15.04037 30.93748±0.005642 DH12 0.662889 19.3134 29.13517±0.055835 DH5 0.523038 14.49971 27.72212±0.009697 DH2 0.480006 13.72327 28.58977±0.021633 UV6 0.438512 13.32523 30.38741±0.029171 UV5 0.552545 20.23279 36.61747±0.013138 E.coli 0.642911 8.990179 13.98356±0.011800
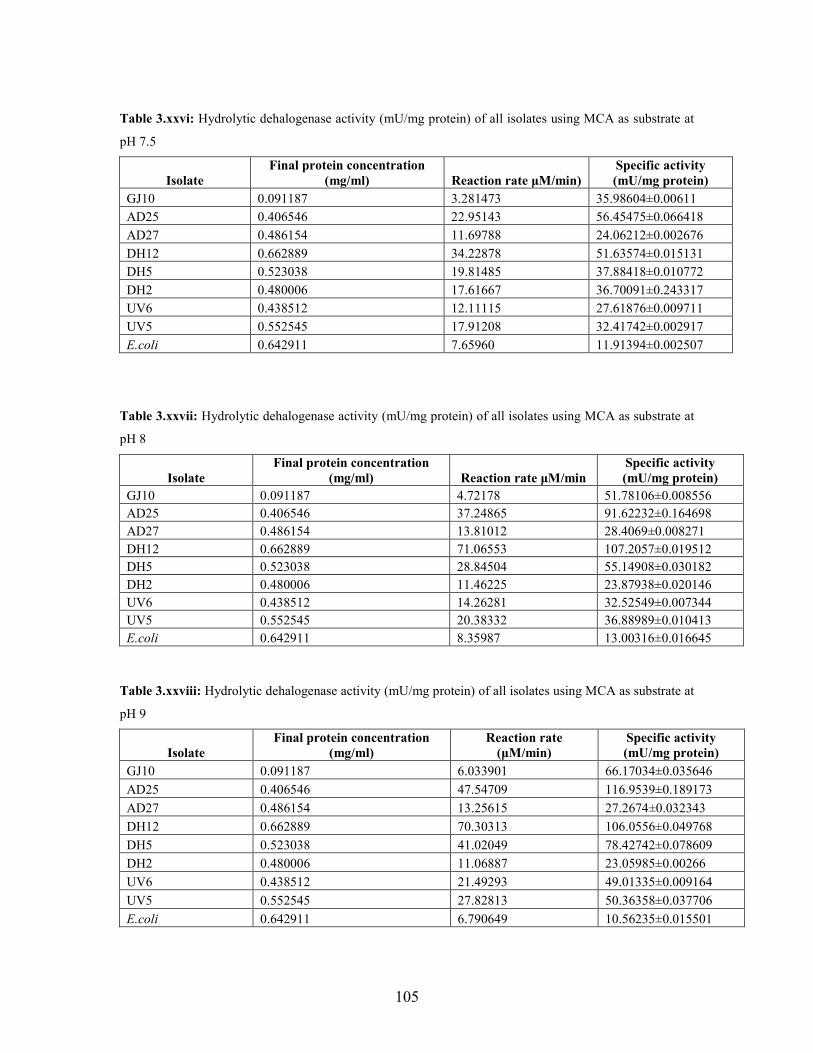
105
Table 3.xxvi: Hydrolytic dehalogenase activity (mU/mg protein) of all isolates using MCA as substrate at
pH 7.5
Isolate Final protein concentration
(mg/ml) Reaction rate µM/min) Specific activity (mU/mg protein)
GJ10 0.091187 3.281473 35.98604±0.00611 AD25 0.406546 22.95143 56.45475±0.066418 AD27 0.486154 11.69788 24.06212±0.002676 DH12 0.662889 34.22878 51.63574±0.015131 DH5 0.523038 19.81485 37.88418±0.010772 DH2 0.480006 17.61667 36.70091±0.243317 UV6 0.438512 12.11115 27.61876±0.009711 UV5 0.552545 17.91208 32.41742±0.002917 E.coli 0.642911 7.65960 11.91394±0.002507
Table 3.xxvii: Hydrolytic dehalogenase activity (mU/mg protein) of all isolates using MCA as substrate at
pH 8
Isolate Final protein concentration
(mg/ml) Reaction rate µM/min Specific activity (mU/mg protein)
GJ10 0.091187 4.72178 51.78106±0.008556 AD25 0.406546 37.24865 91.62232±0.164698 AD27 0.486154 13.81012 28.4069±0.008271 DH12 0.662889 71.06553 107.2057±0.019512 DH5 0.523038 28.84504 55.14908±0.030182 DH2 0.480006 11.46225 23.87938±0.020146 UV6 0.438512 14.26281 32.52549±0.007344 UV5 0.552545 20.38332 36.88989±0.010413 E.coli 0.642911 8.35987 13.00316±0.016645
Table 3.xxviii: Hydrolytic dehalogenase activity (mU/mg protein) of all isolates using MCA as substrate at
pH 9
Isolate Final protein concentration
(mg/ml) Reaction rate
(µM/min) Specific activity (mU/mg protein)
GJ10 0.091187 6.033901 66.17034±0.035646 AD25 0.406546 47.54709 116.9539±0.189173 AD27 0.486154 13.25615 27.2674±0.032343 DH12 0.662889 70.30313 106.0556±0.049768 DH5 0.523038 41.02049 78.42742±0.078609 DH2 0.480006 11.06887 23.05985±0.00266 UV6 0.438512 21.49293 49.01335±0.009164 UV5 0.552545 27.82813 50.36358±0.037706 E.coli 0.642911 6.790649 10.56235±0.015501
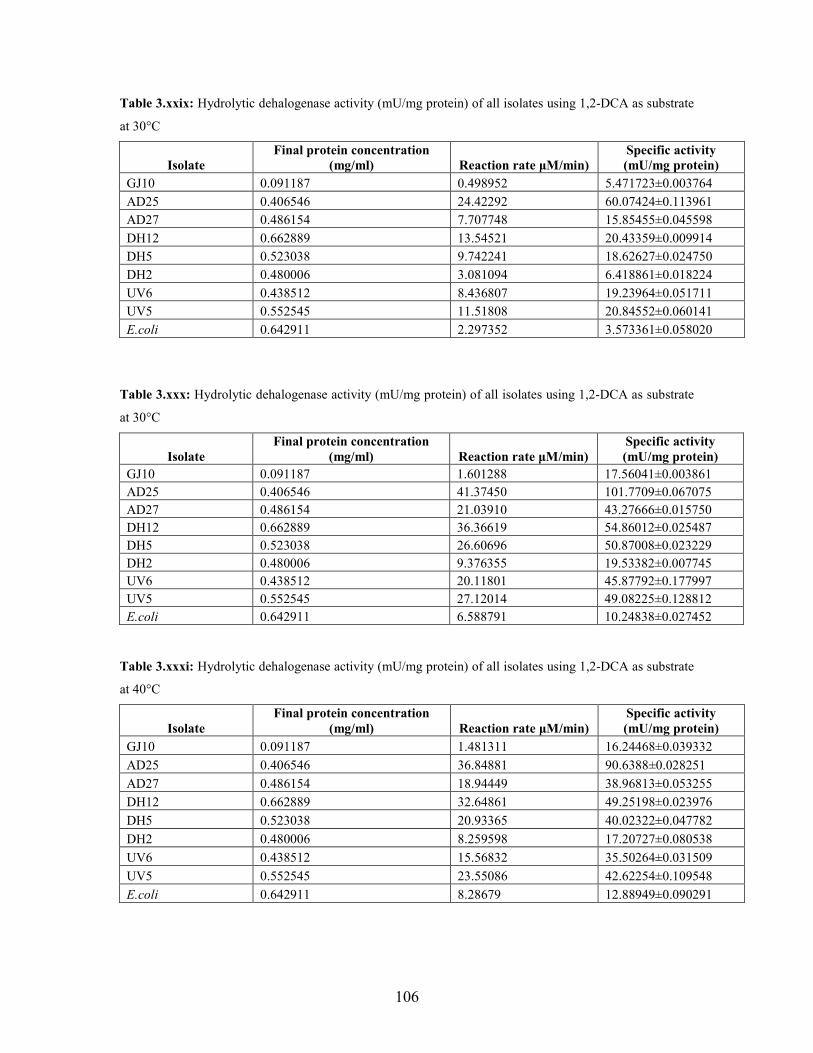
106
Table 3.xxix: Hydrolytic dehalogenase activity (mU/mg protein) of all isolates using 1,2-DCA as substrate
at 30°C
Isolate Final protein concentration
(mg/ml) Reaction rate µM/min) Specific activity (mU/mg protein)
GJ10 0.091187 0.498952 5.471723±0.003764 AD25 0.406546 24.42292 60.07424±0.113961 AD27 0.486154 7.707748 15.85455±0.045598 DH12 0.662889 13.54521 20.43359±0.009914 DH5 0.523038 9.742241 18.62627±0.024750 DH2 0.480006 3.081094 6.418861±0.018224 UV6 0.438512 8.436807 19.23964±0.051711 UV5 0.552545 11.51808 20.84552±0.060141 E.coli 0.642911 2.297352 3.573361±0.058020
Table 3.xxx: Hydrolytic dehalogenase activity (mU/mg protein) of all isolates using 1,2-DCA as substrate
at 30°C
Isolate Final protein concentration
(mg/ml) Reaction rate µM/min) Specific activity (mU/mg protein)
GJ10 0.091187 1.601288 17.56041±0.003861 AD25 0.406546 41.37450 101.7709±0.067075 AD27 0.486154 21.03910 43.27666±0.015750 DH12 0.662889 36.36619 54.86012±0.025487 DH5 0.523038 26.60696 50.87008±0.023229 DH2 0.480006 9.376355 19.53382±0.007745 UV6 0.438512 20.11801 45.87792±0.177997 UV5 0.552545 27.12014 49.08225±0.128812 E.coli 0.642911 6.588791 10.24838±0.027452
Table 3.xxxi: Hydrolytic dehalogenase activity (mU/mg protein) of all isolates using 1,2-DCA as substrate
at 40°C
Isolate Final protein concentration
(mg/ml) Reaction rate µM/min) Specific activity (mU/mg protein)
GJ10 0.091187 1.481311 16.24468±0.039332 AD25 0.406546 36.84881 90.6388±0.028251 AD27 0.486154 18.94449 38.96813±0.053255 DH12 0.662889 32.64861 49.25198±0.023976 DH5 0.523038 20.93365 40.02322±0.047782 DH2 0.480006 8.259598 17.20727±0.080538 UV6 0.438512 15.56832 35.50264±0.031509 UV5 0.552545 23.55086 42.62254±0.109548 E.coli 0.642911 8.28679 12.88949±0.090291
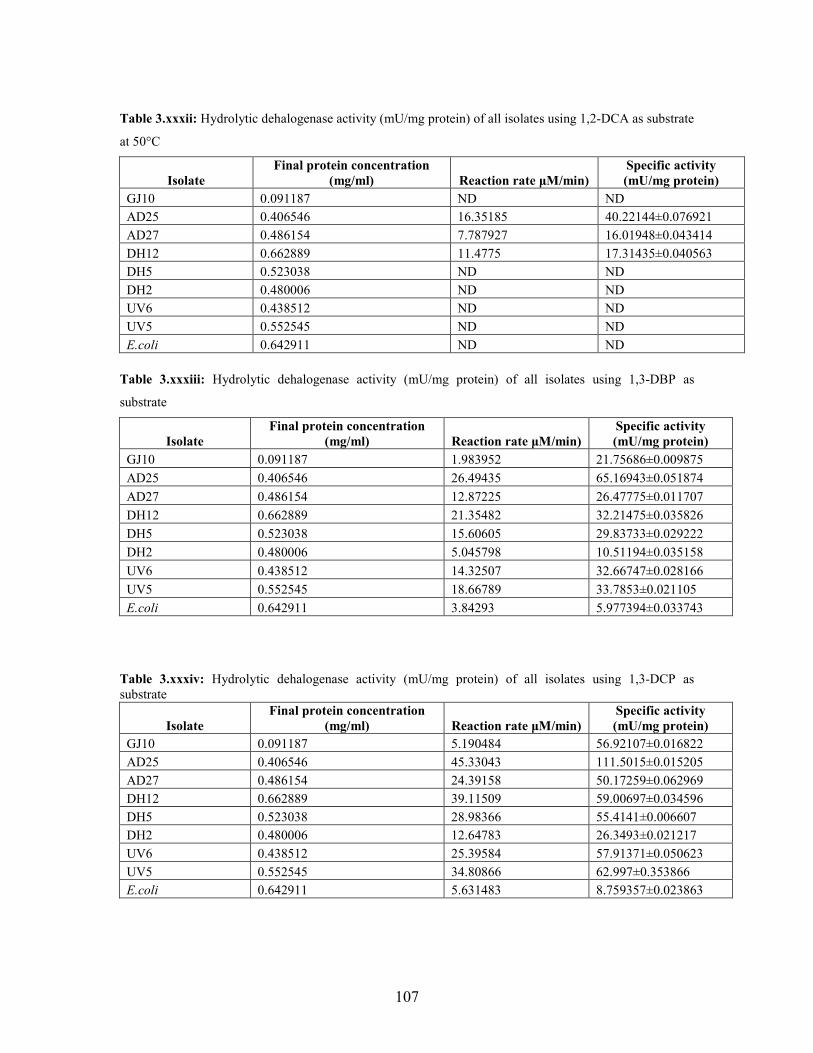
107
Table 3.xxxii: Hydrolytic dehalogenase activity (mU/mg protein) of all isolates using 1,2-DCA as substrate
at 50°C
Isolate Final protein concentration
(mg/ml) Reaction rate µM/min) Specific activity (mU/mg protein)
GJ10 0.091187 ND ND AD25 0.406546 16.35185 40.22144±0.076921 AD27 0.486154 7.787927 16.01948±0.043414 DH12 0.662889 11.4775 17.31435±0.040563 DH5 0.523038 ND ND DH2 0.480006 ND ND UV6 0.438512 ND ND UV5 0.552545 ND ND E.coli 0.642911 ND ND
Table 3.xxxiii: Hydrolytic dehalogenase activity (mU/mg protein) of all isolates using 1,3-DBP as
substrate
Isolate Final protein concentration
(mg/ml) Reaction rate µM/min) Specific activity (mU/mg protein)
GJ10 0.091187 1.983952 21.75686±0.009875 AD25 0.406546 26.49435 65.16943±0.051874 AD27 0.486154 12.87225 26.47775±0.011707 DH12 0.662889 21.35482 32.21475±0.035826 DH5 0.523038 15.60605 29.83733±0.029222 DH2 0.480006 5.045798 10.51194±0.035158 UV6 0.438512 14.32507 32.66747±0.028166 UV5 0.552545 18.66789 33.7853±0.021105 E.coli 0.642911 3.84293 5.977394±0.033743
Table 3.xxxiv: Hydrolytic dehalogenase activity (mU/mg protein) of all isolates using 1,3-DCP as substrate
Isolate Final protein concentration
(mg/ml) Reaction rate µM/min) Specific activity (mU/mg protein)
GJ10 0.091187 5.190484 56.92107±0.016822 AD25 0.406546 45.33043 111.5015±0.015205 AD27 0.486154 24.39158 50.17259±0.062969 DH12 0.662889 39.11509 59.00697±0.034596 DH5 0.523038 28.98366 55.4141±0.006607 DH2 0.480006 12.64783 26.3493±0.021217 UV6 0.438512 25.39584 57.91371±0.050623 UV5 0.552545 34.80866 62.997±0.353866 E.coli 0.642911 5.631483 8.759357±0.023863
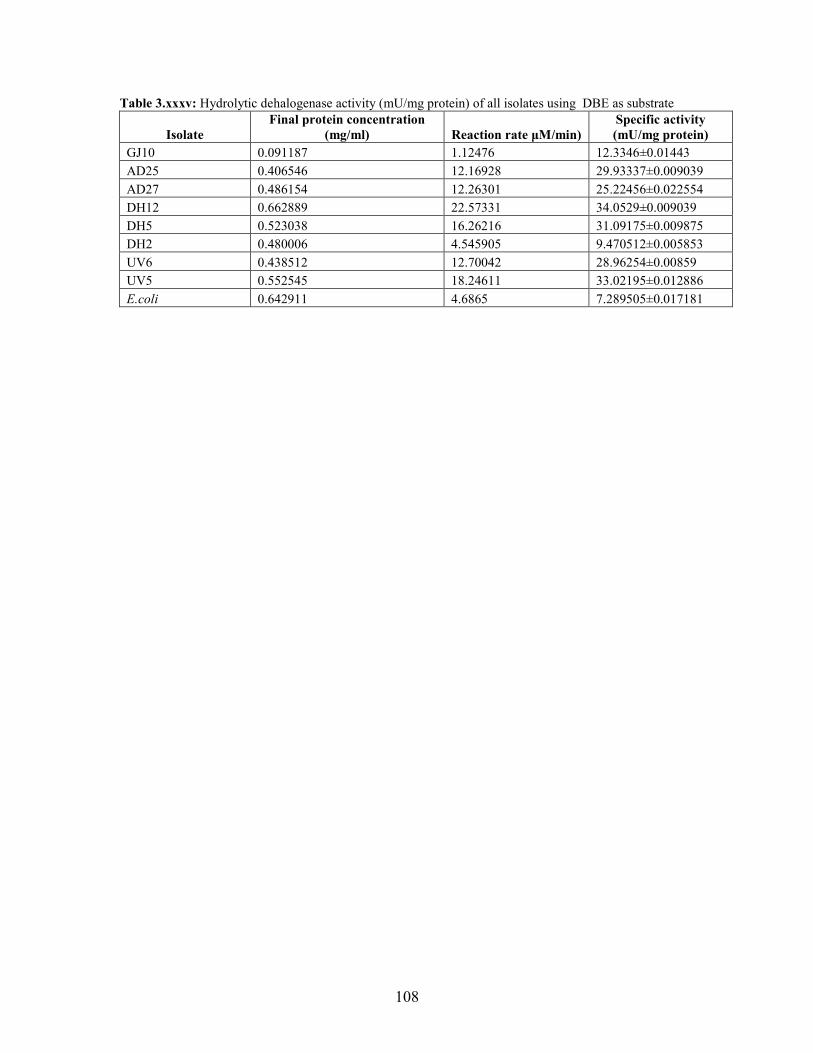
108
Table 3.xxxv: Hydrolytic dehalogenase activity (mU/mg protein) of all isolates using DBE as substrate
Isolate Final protein concentration
(mg/ml) Reaction rate µM/min) Specific activity (mU/mg protein)
GJ10 0.091187 1.12476 12.3346±0.01443 AD25 0.406546 12.16928 29.93337±0.009039 AD27 0.486154 12.26301 25.22456±0.022554 DH12 0.662889 22.57331 34.0529±0.009039 DH5 0.523038 16.26216 31.09175±0.009875 DH2 0.480006 4.545905 9.470512±0.005853 UV6 0.438512 12.70042 28.96254±0.00859 UV5 0.552545 18.24611 33.02195±0.012886 E.coli 0.642911 4.6865 7.289505±0.017181