Embed Size (px)
Citation preview
ORIGINAL PAPER
Characterization and stochastic modeling of uncertaintiesin the biodiesel production
Sheraz Abbasi • Urmila M. Diwekar
Received: 26 September 2012 / Accepted: 22 February 2013 / Published online: 7 March 2013
� Springer-Verlag Berlin Heidelberg 2013
Abstract There are inherent uncertainties in the biodiesel
production process arising out of feedstock composition,
operating and design parameters and can have significant
impact on the product quality and process economics. In this
paper, the uncertainties are quantified in the form of probabi-
listic distribution function. Stochastic modeling capability is
implemented in the ASPEN process simulator to take into
consideration these uncertainties and the output is evaluated to
determine impact on process efficiency and quality of biodiesel.
Keywords Biodiesel � Stochastic modeling �Uncertainties
Introduction
Biodiesel Background
Biodiesel is a renewable alternative to fossil fuel-based
diesel for use in diesel engines. Biodiesel is a renewable
alternative to diesel fuel because it is derived from bio-
based feed stocks such as plant and vegetable oils and
recycle grease compared to fossil fuel-based diesel which
is derived primarily from the refining of crude oil (Kinast
2003). The common feedstock for biodiesel manufacturing
are (i) plant oils such as soybean oil, cottonseed oil, and
canola oil, (ii) recycled greases or oils such as yellow
grease, and (iii) animal fat such as beet tallow, pork, and
lard (Kinast 2003; Gerpen et al. 2009).
Biodiesel burns much cleaner than conventional diesel
because it does not contain any sulfur content. Lifecycle
analysis shows that biodiesel contains 2.5–3.5 units of
energy for every unit of fossil energy input in its produc-
tion (Sheehan 1998). Some fossil fuel is consumed in the
production of biodiesel in the form of fuel used for farm
equipment, transportation (trucks, locomotives), and feed-
stock for fertilizer, pesticide, steam electricity, and meth-
anol used in the manufacturing process. Biodiesel displaces
petroleum at nearly a 1- to 1 ratio on a life cycle basis.
Because biodiesel is an energy efficient fuel, it reduces the
demand for petroleum based products (Sheehan et al. 1998;
Hill et al. 2006; Huo et al. 2008). Biodiesel use as fuel
significantly reduces greenhouse gas emissions (GHG). For
biodiesel produced from crops harvested from fields which
are already in production, GHG including carbon dioxide
(CO2) and NOx emissions are reduced by 41 % (Sheehan
et al. 1998). As an in any other combustion process, the
burning of biodiesel releases CO2 to the atmosphere.
However, since biodiesel is derived from plant sources
which trap CO2 during photosynthesis, biodiesel con-
sumption does not add CO2 to the atmosphere compared to
fossil fuel based diesel fuel. Particulate matter and hydro-
carbon emissions and diesel fuel combustion are toxic and
carcinogenic having an adverse impact on human health.
However, using B100 (pure biodiesel) fuel eliminates upto
90 % of these air toxins and B20 (20 % biodiesel blend)
reduces air toxins by 20–40 % (Gerpen et al. 2009).
Biodiesel improves the operation of engines even if
used in very low concentrations of 1 % by improving the
S. Abbasi � U. M. Diwekar (&)
Department of Bioengineering, University of Illinois at Chicago,
525 S. Morgan Street, Chicago, IL 60680, USA
e-mail: [email protected]
S. Abbasi
e-mail: [email protected]
U. M. Diwekar
Center for Uncertain Systems: Tools for Optimization
& Management (CUSTOM), Vishwamitra Research Institute,
Clarendon Hills, IL 60514, USA
123
Clean Techn Environ Policy (2014) 16:79–94
DOI 10.1007/s10098-013-0596-4
lubricity of fuels which helps diesel engines by preventing
moving parts from wearing out prematurely. Biodiesel also
raises the cetane number of fuels. Compared to other bio-
based fuels such as ethanol, biodiesel is easy to use because
it can be stored and handled by the same equipment which
handles diesel. No additional equipment or no modification
is required for its use as a motor fuel and users can expect a
completely trouble-free B20 experience (Gerpen et al.
2009). Biodiesel contains 8 % less energy per gallon than
typical No. 2 diesel in United States and 12.5 % less
energy per pound. Biodiesel similar to fossil diesel does
suffer from freezing and gelling in very cold weather
(Kinast 2003; Gerpen et al. 2009).
ASTM D6751 definition of biodiesel states that biodiesel
is composed of mono-alkyl esters of long chain fatty acids
derived from plant oils or animal fats and contains only one
ester linkage in each molecule (Gerpen et al. 2009). Bio-
diesel can be made from methyl, ethyl, isopropyl, and other
alcohols, but most literature and commercially available
biodiesel consists of methyl esters. Biodiesel specifications
are defined by ASTM PS121-99. Plant oils and animal fats
contain fatty acids and triglycerides (Kinast 2003; Gerpen
et al. 2009). However, composition of these triglycerides
vary considerably from feed to feed. Further, there are
significant uncertainties in operating parameters for the
process of biodiesel production.
Scope of this work
The major sources of uncertainties in the biodiesel pro-
duction process are (i) the composition of the feedstock in
terms of different triglycerides, (ii) the mole ratio of
methanol to oil, and (iii) the reactor operating parameters.
However, we have found not a single paper addressing
uncertainties in bio-based fuel production. This was the key
driver behind this paper on stochastic modeling of the
biodiesel production process as it allows the capture of the
uncertainties in the production process and an evaluation of
the impact of those uncertainties on the overall process.
This study takes a flowsheet developed for the contin-
uous transesterification of biodiesel production and uses
stochastic modeling to evaluate how the uncertainties
affect the flowsheet and impacts the (i) quantity and quality
of biodiesel produced, (ii) the physical properties of the
biodiesel produced, and (iii) comparison between the out-
put of biodiesel quantity, quality, and physical properties
between the deterministic and stochastic models.
Benefits of results of this study
The major benefit of this study is that it allows the capture
of uncertainties in the biodiesel production process. By
having knowledge of the type of quality, quantity, and
physical properties of the biodiesel produced form the
various feedstocks the following benefits can be gained.
1. Plant designer can design a more economically
efficient plant.
2. Production planners and purchasing can select feed-
stocks as they have a better knowledge of what feedstock
will give what quality and quantity of product.
3. Marketing and sales can get a better handle on profit-
ability of product produced as they know what feedstock
will give what quality and quantity of product.
4. Plant operations can get a better understanding of the
operation of their plant.
5. A more flexible plant which can handle multiple
sources of feedstock could be design.
Biodiesel production technologies
The primary raw materials for biodiesel production are
vegetable oils, animal fats, and recycled grease. These
feedstocks contain triglycerides and free fatty acids. The
secondary feedstock for biodiesel is methanol. Other
alcohols are also suitable but methanol is the most widely
used and widely researched alcohol used in biodiesel pro-
duction. Triglycerides react with methanol to form methyl
esters. One mole of triglyceride reacts with 3 mol of
methanol to form 3 mol of methyl esters and 1 mol glyc-
erol. The reaction is could be either acid or base catalyzed.
The reaction is a multistep process with the intermediate
formation of diglycerides and monoglycerides. Each step
of the reaction is a reversible equilibrium step. The com-
mon catalyst which is used commercially is sodium
hydroxide, potassium hydroxide, and sodium methoxide.
Acid catalysts are considered to be too slow for industrial
processing. Acid catalysts are used when the feedstock has
high fatty acid content (Gerpen et al. 2004).
The biodiesel manufacturing process is a multistep
process involving (i) pre-treatment of the feed, (ii)
transesterification of triglycerides in the feed to form
methyl esters, (iii) separation process to separate biodiesel
(methyl esters), glycerol, and methanol. The pretreatment
of feedstock includes a degumming step to remove phos-
pholipids and fatty acids are removed in the refining step.
The selection of the type of oil affects the production
technology which is selected (Gerpen et al. 2004).
The available process technologies for biodiesel pro-
duction are
1. Batch processing this process include the a stirred tank
reactor for transesterification, settling tank for sepa-
rating the glycerol and methyl esters, batch distillation
to remove the alcohol, wash water to remove residual
methanol, and then separation of water (Gerpen 2004).
80 S. Abbasi, U. M. Diwekar
123
2. Continuous processing this version of the process
includes a continuous stirred tank reactor CSTR (or
series of CSTR for greater extent of reaction). The
CSTR design does not insure sufficient mixing and
consequently the glycerol product is dispersed in the
ester phase driving the reaction backward and reducing
the overall product yield. A plug flow reactor (PFR)
can also be used in the place of CSTR or a
combination of the two. Continuous distillation trains
are used for separation.
3. Acid-catalyzed direct esterification process if the
feedstock has a high content of free fatty acids, adding
alkali or caustic will cause saponification. Acid could
be used as a catalyst for high free fatty acid feedstocks.
After the reaction stop, base is used to neutralize the
acid and the product mix is the dried.
4. Non-catalyzed systems Biox process cosolvents are
designed to overcome the slow reaction time caused by
the extremely low solubility of alcohol in the triglycer-
ide phase. The Biox process uses a co-solvent, tetrahy-
drofuran THF to solubilize the methanol resulting in a
faster reaction. After the reaction, the co-solvent is
recovered. This system requires a low operating tem-
perature. The co-solvents are usually Environmental
Protection Agency (EPA) classified toxic pollutants so
environmental impact is a significant concern. The co-
solvent must be completely removed from both the
glycerol and biodiesel (Gerpen et al. 2004).
5. Supercritical process supercritical methanol, ethanol,
propanol, and butanol are the alcohols used. This
process has high product yields due to the simulta-
neous transesterification and methyl esterifcation of
fatty acids. The reaction time is also reduced. How-
ever, the downside of the process is that it requires
comparatively higher operating temperatures (250
compared to 60 �C) and very high operating pressures
(10–25 MPa). In addition, water is produced as a
product. The high equipment, energy, and waste
disposal costs make this process unattractive. This
process competes with batch and continuous biodiesel
production process (Demirbas 2006).
Out of the various processes described, the commonly
employed industrial processes are the batch and continuous
processes. They are usually preferred over other processes
because of their relative simplicity. The complexity of
other processes and the volatility of the biodiesel markets
make the other processes unattractive (Gerpen et al. 2004).
Biodiesel feedstocks
The feedstock commonly used for biodiesel production are
soybean oil, corn oil, rapeseed, lard, tallow, linseed oil, and
yellow grease (M311K 2008). Biodiesel feedstock is clas-
sified according to the content of triglyceride and free fatty
acid. The quality of the biodiesel produced depends on the
fatty ester content. The triglycerides found in biodiesel are
1. Tripalmitin based on palmitic acid R = –(CH2)14–CH3
16 carbons, (including the one that R is attached to.)
(16:0).
2. Triolein, based on oleic acid, oleic: R = –(CH2)7
CH = CH(CH2)7CH3 18 carbons, 1 double bond
(18:1).
3. Tristearin based on stearic acid, stearic: R = –(CH2)16–
CH3 18 carbons, 0 double bonds (18:0).
4. Trilinolein based on linoleic acid, linoleic: R = –(CH2)7
CH = CH–CH2–CH = CH(CH2)4CH3 18 carbons, 2
double bonds (18:2).
5. Trilinolenin based on linoleinic acid, linolenic: R =
–(CH2)7CH = CH–CH2–CH = CH–CH2–CH = CH–
CH2–CH3.
The type and amount of triglycerides in the feedstock
varies considerably because of nature as a bio-based
material. The other major raw material for biodiesel pro-
duction is methanol. The choice of catalyst is typically
sodium hydroxide or sodium methoxide (Gerpen et al.
2004).
Design and optimization of biodiesel production
The common design variables in biodiesel production are
(1) process technology, (2) feedstocks, and (3) operating
conditions. The choice of process technology is not a major
factor because industrial processes favor either batch or
continuous transesterification for a variety of factors (Ki-
nast 2003; Gerpen et al. 2004). The major other factors
which influence process design are feedstock availability
and the operating conditions. Because of the bio-based
feedstock, the percentage of triglycerides and the type of
triglyceride in the biodiesel feed varies considerably (18
carbons, 3 double bonds [18:3]).
The following table illustrates the various types of tri-
glycerides and their percentage mass fraction in the dif-
ferent oils used for biodiesel production.
The biodiesel production process is relatively new and
the feedstock composition is highly variable, the mole ratio
of the oil to methanol and the operating temperature of the
reactor also vary considerably. It is difficult to settle on a
single stoichiometric ratio of feedstock to methanol
because the feedstock components vary considerably. Even
in the same feedstock, the range of a single component
mass fraction could be very broad. The methanol to oil
ratio ranges for 4:1–6:1. The reactor operating temperature
also varies considerably as the operating temperature has to
be adjusted in situ to improve conversion. For equipment
Characterization and stochastic modeling 81
123
and plant design basis, the operating temperature typically
falls in the 333–367 K range.
Most recently, El-Halwagi et al. considered various soy
biodiesel production pathways for optimization (Myint and
El-Halwagi 2008). Their team simulated various scenarios
and modeled the soy bean oil-based biodiesel using ASPEN.
They carried out sensitivity analysis and found that the cost
of soybean oil is the largest contributor to the production
cost. However, the actual components of the feedstocks
create significant uncertainties and are very important in the
economic analysis of the biodiesel production process.
Process description
Out of the various biodiesel production technologies, batch
and continuous biodiesel production technologies utilizing
either a CSTR or PFR or a combination of both are the
most commonly used for commercial purposes (Kinast
2003; Gerpen et al. 2004). Continuous biodiesel production
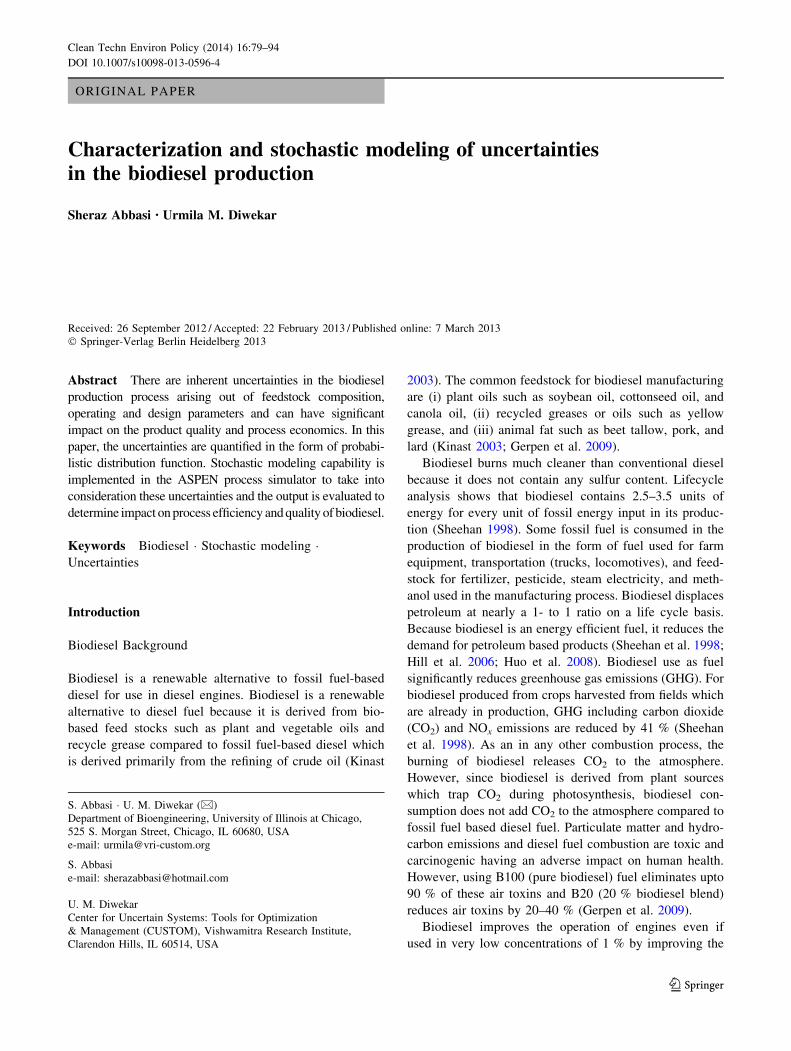
utilizing a CSTR was modeled in this study. Figure 1 is a
block flow diagram of the biodiesel production process
utilized in this study.
The biodiesel production process involves (i) reaction
for transesterification and (ii) separation step to separate
glycerol, methanol, catalyst, and water.
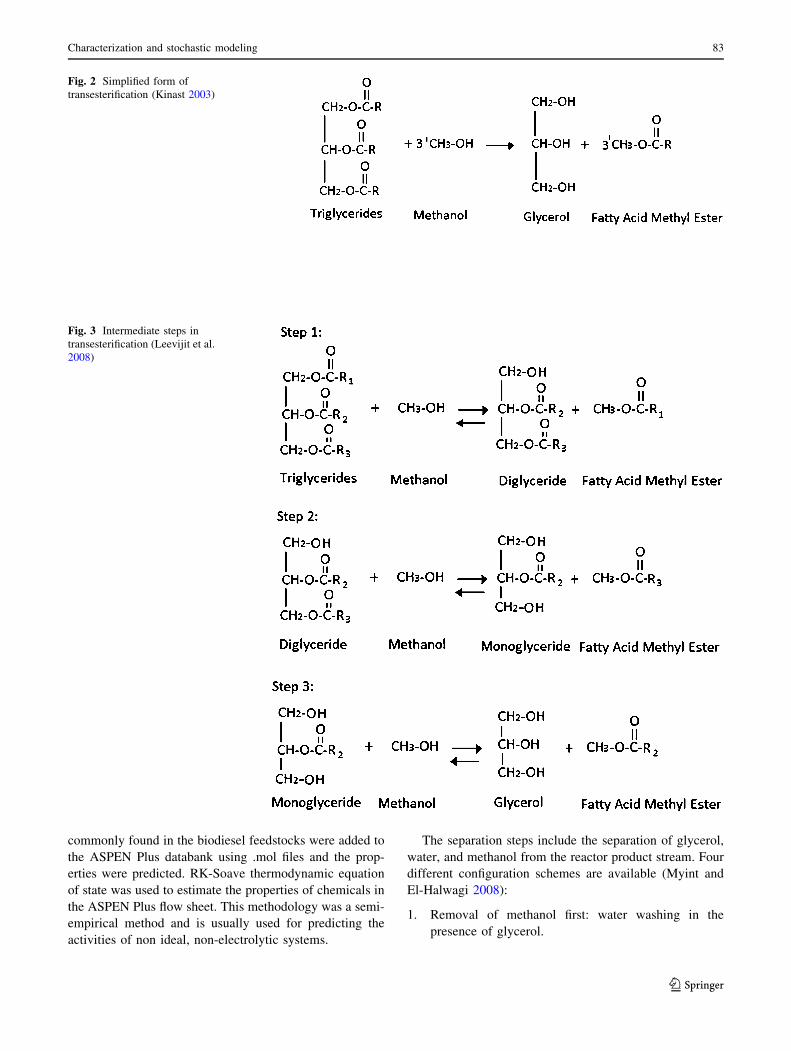
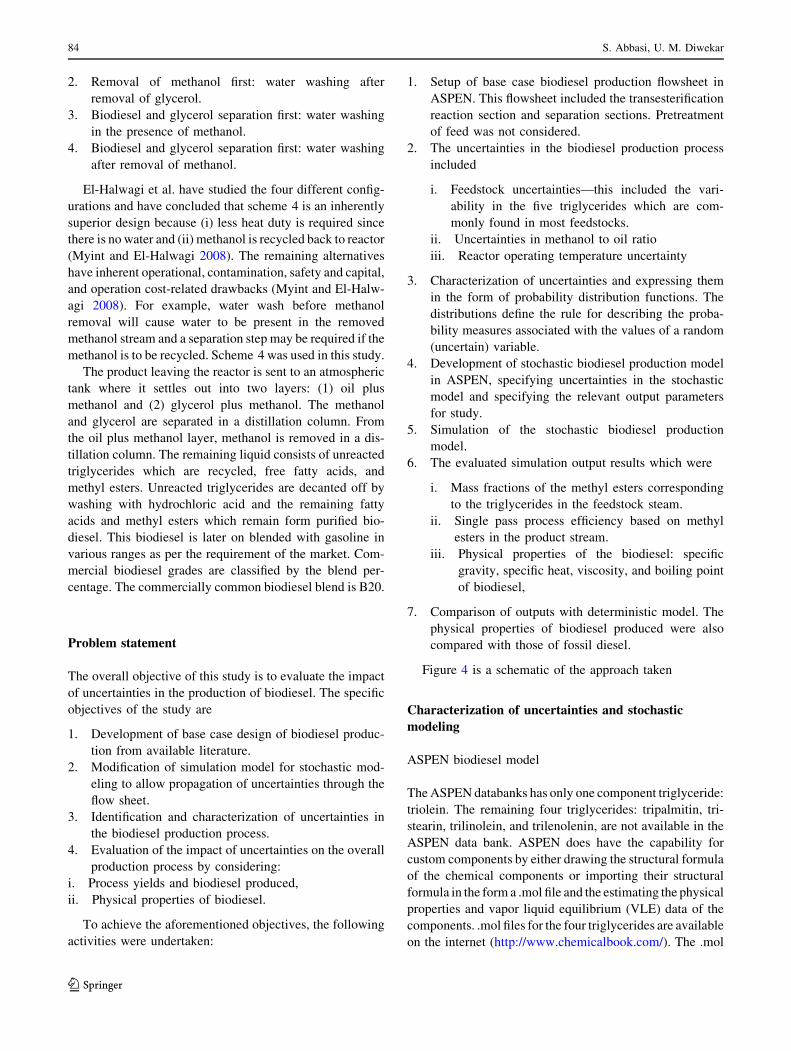
The reaction step involves transesterification. Figure 2
shows the simplified form of the transesterification reaction
and Fig. 3 shows the intermediate steps in the transesteri-
fication reaction.
In recent literature, the optimization of biodiesel process
pathways has utilized a PFR, and assumed a constant
biodiesel conversion of 95 % on the basis of constant
feedstock components or assumed a single feedstock
component (Myint and El-Halwagi 2008; Ataya et al.
2008a, b). PFR studies have shown that the rate of reaction
and conversion of packed bed liquid phase reaction (het-
erogenous phase) and simple liquid–liquid phase reaction
(homogenous phase) reaction is similar (Ataya et al.
2008b). In addition, most recent literature has focused on
using the feedstock components to optimize the separation
process of biodiesel production (Myint and El-Halwagi
2008; Olivera et al. 2010). This study focused on using a
CSTR model in the biodiesel flow sheet because
1. CSTR is easy to model compared to homogenous or
heterogenous PFR models. A more detailed discussion
is included in the later section of this paper.
2. CSTRs most closely mimic batch reactors in industry.
3. Different triglyceride components in the feedstock can
be more easily modeled.
4. Both kinetic and equilibrium reaction information can
be utilized.
High temperatures and pressures can transesterify the
fats without prior removal or treatment of fatty acids, near
atmospheric pressures and longer reaction times are pre-
ferred because of the associated equipment and operating
costs (Myint and El-Halwagi 2008). A continuous process
design is selected due to better performance as result of
heat economization, improving product purity and lower
capital costs.
The reactor temperature is kept between 140 and 200 �F
and the reactor is operated at slight pressures to keep the
methanol in the liquid phase. Sodium hydroxide was the
catalyst used in this reaction. The molar ratio of methanol
to oil was varied between 6:1 and 4:1 with a 4:1 being used
as the deterministic case. The reactor is designed for a flow
rate of 20,000 lb/h.
Only the triglyceride triolein is available in the ASPEN
Plus databank. The remaining four triglycerides which are
Fig. 1 Block diagram of
biodiesel production
82 S. Abbasi, U. M. Diwekar
123
commonly found in the biodiesel feedstocks were added to
the ASPEN Plus databank using .mol files and the prop-
erties were predicted. RK-Soave thermodynamic equation
of state was used to estimate the properties of chemicals in
the ASPEN Plus flow sheet. This methodology was a semi-
empirical method and is usually used for predicting the
activities of non ideal, non-electrolytic systems.
The separation steps include the separation of glycerol,
water, and methanol from the reactor product stream. Four
different configuration schemes are available (Myint and
El-Halwagi 2008):
1. Removal of methanol first: water washing in the
presence of glycerol.
Fig. 2 Simplified form of
transesterification (Kinast 2003)
Fig. 3 Intermediate steps in
transesterification (Leevijit et al.
2008)
Characterization and stochastic modeling 83
123
2. Removal of methanol first: water washing after
removal of glycerol.
3. Biodiesel and glycerol separation first: water washing
in the presence of methanol.
4. Biodiesel and glycerol separation first: water washing
after removal of methanol.
El-Halwagi et al. have studied the four different config-
urations and have concluded that scheme 4 is an inherently
superior design because (i) less heat duty is required since
there is no water and (ii) methanol is recycled back to reactor
(Myint and El-Halwagi 2008). The remaining alternatives
have inherent operational, contamination, safety and capital,
and operation cost-related drawbacks (Myint and El-Halw-
agi 2008). For example, water wash before methanol
removal will cause water to be present in the removed
methanol stream and a separation step may be required if the
methanol is to be recycled. Scheme 4 was used in this study.
The product leaving the reactor is sent to an atmospheric
tank where it settles out into two layers: (1) oil plus
methanol and (2) glycerol plus methanol. The methanol
and glycerol are separated in a distillation column. From
the oil plus methanol layer, methanol is removed in a dis-
tillation column. The remaining liquid consists of unreacted
triglycerides which are recycled, free fatty acids, and
methyl esters. Unreacted triglycerides are decanted off by
washing with hydrochloric acid and the remaining fatty
acids and methyl esters which remain form purified bio-
diesel. This biodiesel is later on blended with gasoline in
various ranges as per the requirement of the market. Com-
mercial biodiesel grades are classified by the blend per-
centage. The commercially common biodiesel blend is B20.
Problem statement
The overall objective of this study is to evaluate the impact
of uncertainties in the production of biodiesel. The specific
objectives of the study are
1. Development of base case design of biodiesel produc-
tion from available literature.
2. Modification of simulation model for stochastic mod-
eling to allow propagation of uncertainties through the
flow sheet.
3. Identification and characterization of uncertainties in
the biodiesel production process.
4. Evaluation of the impact of uncertainties on the overall
production process by considering:
i. Process yields and biodiesel produced,
ii. Physical properties of biodiesel.
To achieve the aforementioned objectives, the following
activities were undertaken:
1. Setup of base case biodiesel production flowsheet in
ASPEN. This flowsheet included the transesterification
reaction section and separation sections. Pretreatment
of feed was not considered.
2. The uncertainties in the biodiesel production process
included
i. Feedstock uncertainties—this included the vari-
ability in the five triglycerides which are com-
monly found in most feedstocks.
ii. Uncertainties in methanol to oil ratio
iii. Reactor operating temperature uncertainty
3. Characterization of uncertainties and expressing them
in the form of probability distribution functions. The
distributions define the rule for describing the proba-
bility measures associated with the values of a random
(uncertain) variable.
4. Development of stochastic biodiesel production model
in ASPEN, specifying uncertainties in the stochastic
model and specifying the relevant output parameters
for study.
5. Simulation of the stochastic biodiesel production
model.
6. The evaluated simulation output results which were
i. Mass fractions of the methyl esters corresponding
to the triglycerides in the feedstock steam.
ii. Single pass process efficiency based on methyl
esters in the product stream.
iii. Physical properties of the biodiesel: specific
gravity, specific heat, viscosity, and boiling point
of biodiesel,
7. Comparison of outputs with deterministic model. The
physical properties of biodiesel produced were also
compared with those of fossil diesel.
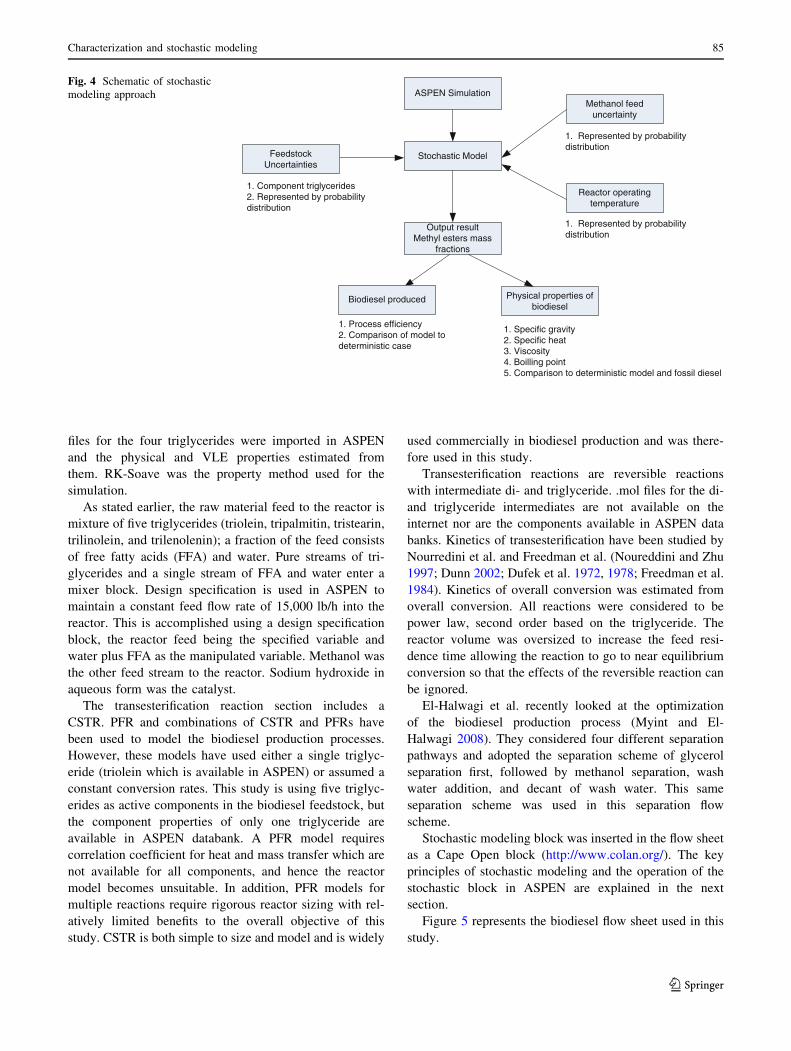
Figure 4 is a schematic of the approach taken
Characterization of uncertainties and stochastic
modeling
ASPEN biodiesel model
The ASPEN databanks has only one component triglyceride:
triolein. The remaining four triglycerides: tripalmitin, tri-
stearin, trilinolein, and trilenolenin, are not available in the
ASPEN data bank. ASPEN does have the capability for
custom components by either drawing the structural formula
of the chemical components or importing their structural
formula in the form a .mol file and the estimating the physical
properties and vapor liquid equilibrium (VLE) data of the
components. .mol files for the four triglycerides are available
on the internet (http://www.chemicalbook.com/). The .mol
84 S. Abbasi, U. M. Diwekar
123
files for the four triglycerides were imported in ASPEN
and the physical and VLE properties estimated from
them. RK-Soave was the property method used for the
simulation.
As stated earlier, the raw material feed to the reactor is
mixture of five triglycerides (triolein, tripalmitin, tristearin,
trilinolein, and trilenolenin); a fraction of the feed consists
of free fatty acids (FFA) and water. Pure streams of tri-
glycerides and a single stream of FFA and water enter a
mixer block. Design specification is used in ASPEN to
maintain a constant feed flow rate of 15,000 lb/h into the
reactor. This is accomplished using a design specification
block, the reactor feed being the specified variable and
water plus FFA as the manipulated variable. Methanol was
the other feed stream to the reactor. Sodium hydroxide in
aqueous form was the catalyst.
The transesterification reaction section includes a
CSTR. PFR and combinations of CSTR and PFRs have
been used to model the biodiesel production processes.
However, these models have used either a single triglyc-
eride (triolein which is available in ASPEN) or assumed a
constant conversion rates. This study is using five triglyc-
erides as active components in the biodiesel feedstock, but
the component properties of only one triglyceride are
available in ASPEN databank. A PFR model requires
correlation coefficient for heat and mass transfer which are
not available for all components, and hence the reactor
model becomes unsuitable. In addition, PFR models for
multiple reactions require rigorous reactor sizing with rel-
atively limited benefits to the overall objective of this
study. CSTR is both simple to size and model and is widely
used commercially in biodiesel production and was there-
fore used in this study.
Transesterification reactions are reversible reactions
with intermediate di- and triglyceride. .mol files for the di-
and triglyceride intermediates are not available on the
internet nor are the components available in ASPEN data
banks. Kinetics of transesterification have been studied by
Nourredini et al. and Freedman et al. (Noureddini and Zhu
1997; Dunn 2002; Dufek et al. 1972, 1978; Freedman et al.
1984). Kinetics of overall conversion was estimated from
overall conversion. All reactions were considered to be
power law, second order based on the triglyceride. The
reactor volume was oversized to increase the feed resi-
dence time allowing the reaction to go to near equilibrium
conversion so that the effects of the reversible reaction can
be ignored.
El-Halwagi et al. recently looked at the optimization
of the biodiesel production process (Myint and El-
Halwagi 2008). They considered four different separation
pathways and adopted the separation scheme of glycerol
separation first, followed by methanol separation, wash
water addition, and decant of wash water. This same
separation scheme was used in this separation flow
scheme.
Stochastic modeling block was inserted in the flow sheet
as a Cape Open block (http://www.colan.org/). The key
principles of stochastic modeling and the operation of the
stochastic block in ASPEN are explained in the next
section.
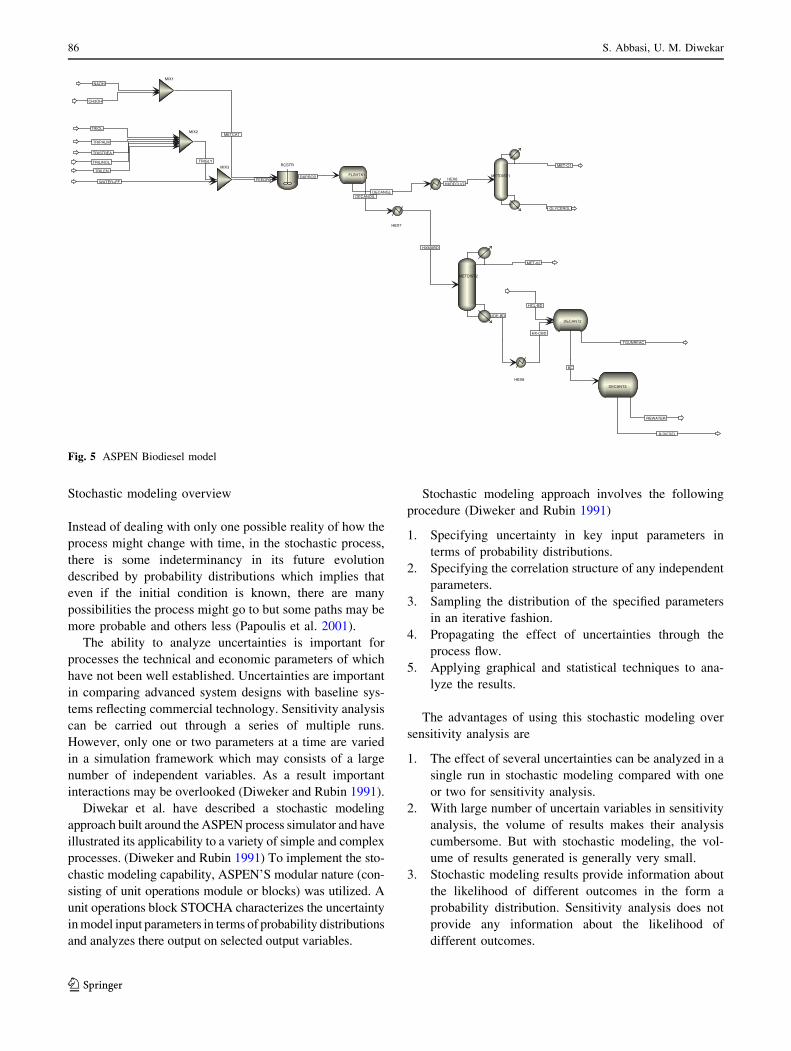
Figure 5 represents the biodiesel flow sheet used in this
study.
ASPEN Simulation
Stochastic ModelFeedstock Uncertainties
Reactor operating temperature
Methanol feed uncertainty
Output resultMethyl esters mass
fractions
Biodiesel produced Physical properties of biodiesel
1. Process efficiency2. Comparison of model to deterministic case
1. Specific gravity2. Specific heat3. Viscosity4. Boilling point5. Comparison to deterministic model and fossil diesel
1. Component triglycerides2. Represented by probability distribution
1. Represented by probability distribution
1. Represented by probability distribution
Fig. 4 Schematic of stochastic
modeling approach
Characterization and stochastic modeling 85
123
Stochastic modeling overview
Instead of dealing with only one possible reality of how the
process might change with time, in the stochastic process,
there is some indeterminancy in its future evolution
described by probability distributions which implies that
even if the initial condition is known, there are many
possibilities the process might go to but some paths may be
more probable and others less (Papoulis et al. 2001).
The ability to analyze uncertainties is important for
processes the technical and economic parameters of which
have not been well established. Uncertainties are important
in comparing advanced system designs with baseline sys-
tems reflecting commercial technology. Sensitivity analysis
can be carried out through a series of multiple runs.
However, only one or two parameters at a time are varied
in a simulation framework which may consists of a large
number of independent variables. As a result important
interactions may be overlooked (Diweker and Rubin 1991).
Diwekar et al. have described a stochastic modeling
approach built around the ASPEN process simulator and have
illustrated its applicability to a variety of simple and complex
processes. (Diweker and Rubin 1991) To implement the sto-
chastic modeling capability, ASPEN’S modular nature (con-
sisting of unit operations module or blocks) was utilized. A
unit operations block STOCHA characterizes the uncertainty
in model input parameters in terms of probability distributions
and analyzes there output on selected output variables.
Stochastic modeling approach involves the following
procedure (Diweker and Rubin 1991)
1. Specifying uncertainty in key input parameters in
terms of probability distributions.
2. Specifying the correlation structure of any independent
parameters.
3. Sampling the distribution of the specified parameters
in an iterative fashion.
4. Propagating the effect of uncertainties through the
process flow.
5. Applying graphical and statistical techniques to ana-
lyze the results.
The advantages of using this stochastic modeling over
sensitivity analysis are
1. The effect of several uncertainties can be analyzed in a
single run in stochastic modeling compared with one
or two for sensitivity analysis.
2. With large number of uncertain variables in sensitivity
analysis, the volume of results makes their analysis
cumbersome. But with stochastic modeling, the vol-
ume of results generated is generally very small.
3. Stochastic modeling results provide information about
the likelihood of different outcomes in the form a
probability distribution. Sensitivity analysis does not
provide any information about the likelihood of
different outcomes.
TRIOL
TRIPALM
TRISTREA
TRILINOL
TRILEN
TRIGLY
WATER+FF FEEDRX
METCAT
RXPROD
NAOH
CH3OH
DECANOIL
HXMXBD
DECANGL
HXDECLIQ
MET-O1
GLYCEROL
MET-02
CRUDE-BD
HX-CBD
HCL-BD
8C
TGUNREAC
B-DIESEL
REWATER
MIX2
MIX3 RCSTR
MIX1
HEX7
FLSHTK1HEX6
METDIST1
METDIST2
DECANT2
HEX8
DECANT3
Fig. 5 ASPEN Biodiesel model
86 S. Abbasi, U. M. Diwekar
123
4. Various sampling techniques area available with
stochastic modeling for random sampling of input
variables.
Stochastic simulation in ASPEN
The procedure of setting up stochastic modeling in ASPEN
is follows (Subramanayan et al. 2007)
1. The STOCHA block is imported in ASPEN.
2. Dummy streams are attached to the STOCHA block.
3. Key input parameters required for the STOCHA block
are
a. Number of input uncertain variables
b. Number of output uncertain variables
c. Sampling technique
d. Probability distribution function to represent the
uncertainties in the input parameters.
The software provides a set of seventeen types of
probability distribution functions for characterization of
input variables. The probability distribution function used
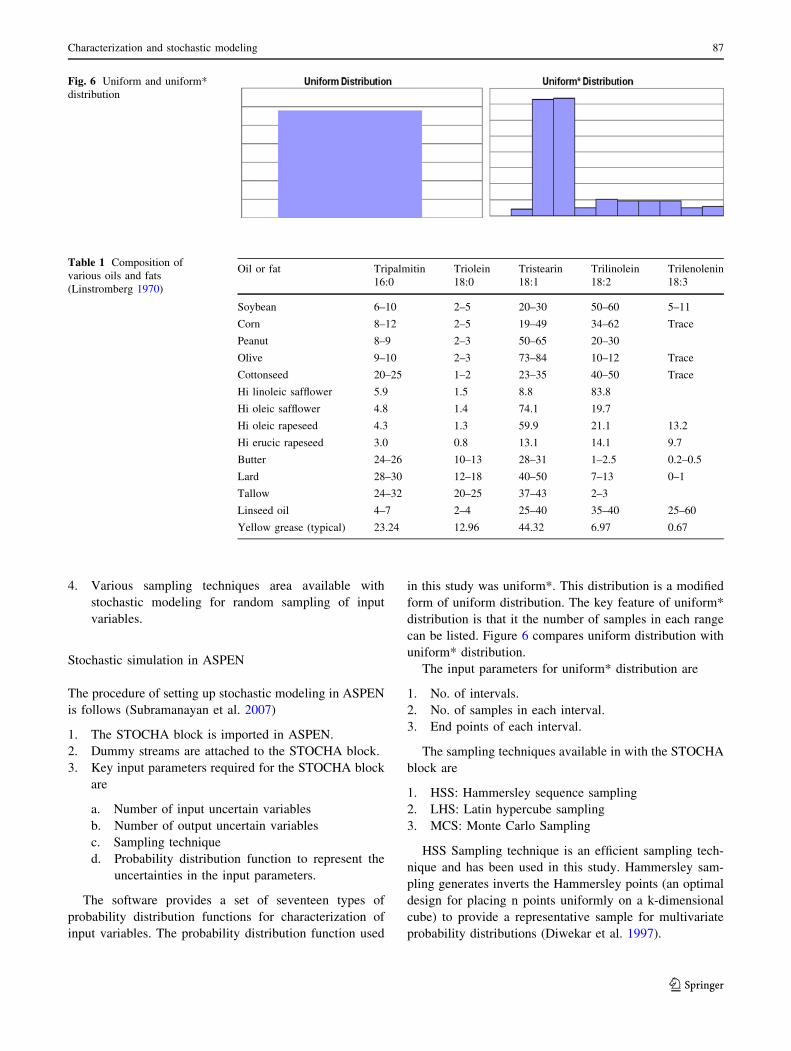
in this study was uniform*. This distribution is a modified
form of uniform distribution. The key feature of uniform*
distribution is that it the number of samples in each range
can be listed. Figure 6 compares uniform distribution with
uniform* distribution.
The input parameters for uniform* distribution are
1. No. of intervals.
2. No. of samples in each interval.
3. End points of each interval.
The sampling techniques available in with the STOCHA
block are
1. HSS: Hammersley sequence sampling
2. LHS: Latin hypercube sampling
3. MCS: Monte Carlo Sampling
HSS Sampling technique is an efficient sampling tech-
nique and has been used in this study. Hammersley sam-
pling generates inverts the Hammersley points (an optimal
design for placing n points uniformly on a k-dimensional
cube) to provide a representative sample for multivariate
probability distributions (Diwekar et al. 1997).
Fig. 6 Uniform and uniform*
distribution
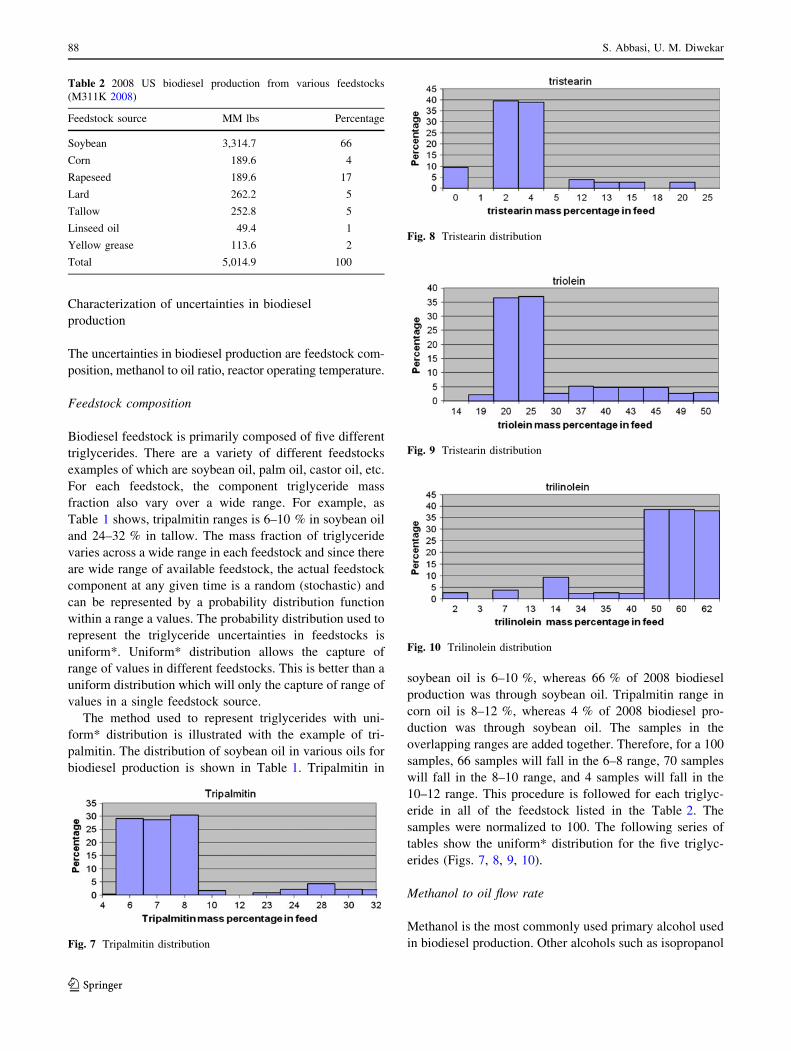
Table 1 Composition of
various oils and fats
(Linstromberg 1970)
Oil or fat Tripalmitin Triolein Tristearin Trilinolein Trilenolenin
16:0 18:0 18:1 18:2 18:3
Soybean 6–10 2–5 20–30 50–60 5–11
Corn 8–12 2–5 19–49 34–62 Trace
Peanut 8–9 2–3 50–65 20–30
Olive 9–10 2–3 73–84 10–12 Trace
Cottonseed 20–25 1–2 23–35 40–50 Trace
Hi linoleic safflower 5.9 1.5 8.8 83.8
Hi oleic safflower 4.8 1.4 74.1 19.7
Hi oleic rapeseed 4.3 1.3 59.9 21.1 13.2
Hi erucic rapeseed 3.0 0.8 13.1 14.1 9.7
Butter 24–26 10–13 28–31 1–2.5 0.2–0.5
Lard 28–30 12–18 40–50 7–13 0–1
Tallow 24–32 20–25 37–43 2–3
Linseed oil 4–7 2–4 25–40 35–40 25–60
Yellow grease (typical) 23.24 12.96 44.32 6.97 0.67
Characterization and stochastic modeling 87
123
Characterization of uncertainties in biodiesel
production
The uncertainties in biodiesel production are feedstock com-
position, methanol to oil ratio, reactor operating temperature.
Feedstock composition
Biodiesel feedstock is primarily composed of five different
triglycerides. There are a variety of different feedstocks
examples of which are soybean oil, palm oil, castor oil, etc.
For each feedstock, the component triglyceride mass
fraction also vary over a wide range. For example, as
Table 1 shows, tripalmitin ranges is 6–10 % in soybean oil
and 24–32 % in tallow. The mass fraction of triglyceride
varies across a wide range in each feedstock and since there
are wide range of available feedstock, the actual feedstock
component at any given time is a random (stochastic) and
can be represented by a probability distribution function
within a range a values. The probability distribution used to
represent the triglyceride uncertainties in feedstocks is
uniform*. Uniform* distribution allows the capture of
range of values in different feedstocks. This is better than a
uniform distribution which will only the capture of range of
values in a single feedstock source.
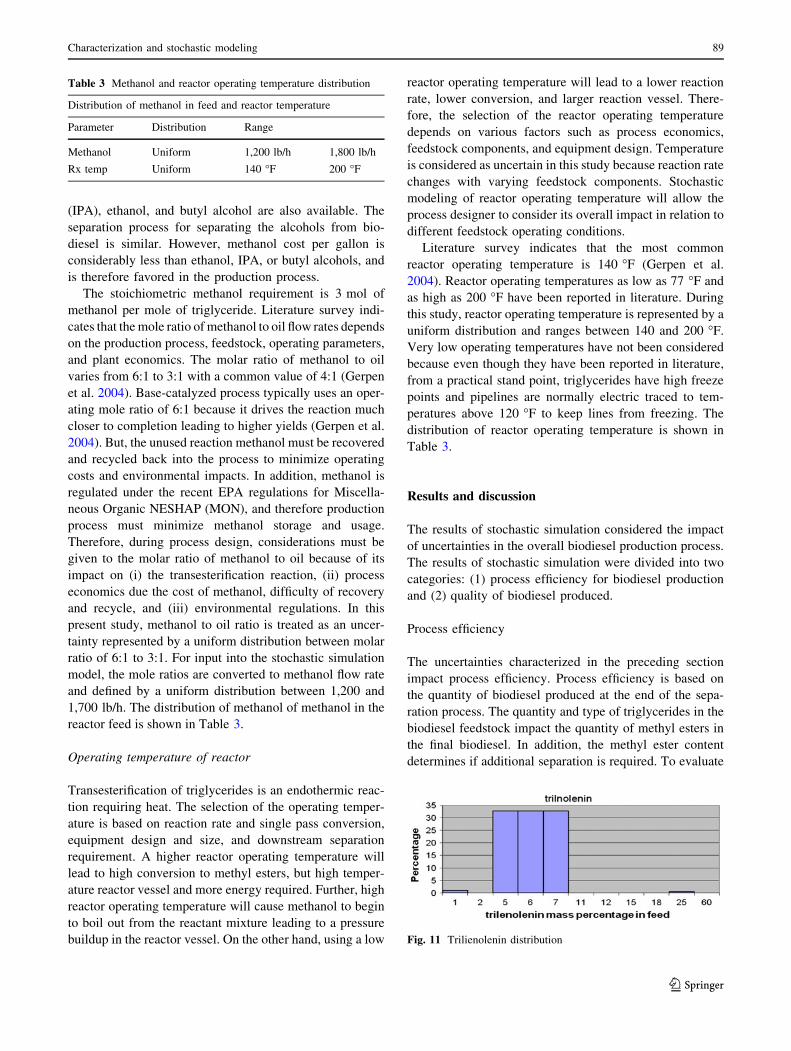
The method used to represent triglycerides with uni-
form* distribution is illustrated with the example of tri-
palmitin. The distribution of soybean oil in various oils for
biodiesel production is shown in Table 1. Tripalmitin in
soybean oil is 6–10 %, whereas 66 % of 2008 biodiesel
production was through soybean oil. Tripalmitin range in
corn oil is 8–12 %, whereas 4 % of 2008 biodiesel pro-
duction was through soybean oil. The samples in the
overlapping ranges are added together. Therefore, for a 100
samples, 66 samples will fall in the 6–8 range, 70 samples
will fall in the 8–10 range, and 4 samples will fall in the
10–12 range. This procedure is followed for each triglyc-
eride in all of the feedstock listed in the Table 2. The
samples were normalized to 100. The following series of
tables show the uniform* distribution for the five triglyc-
erides (Figs. 7, 8, 9, 10).
Methanol to oil flow rate
Methanol is the most commonly used primary alcohol used
in biodiesel production. Other alcohols such as isopropanol
Table 2 2008 US biodiesel production from various feedstocks
(M311K 2008)
Feedstock source MM lbs Percentage
Soybean 3,314.7 66
Corn 189.6 4
Rapeseed 189.6 17
Lard 262.2 5
Tallow 252.8 5
Linseed oil 49.4 1
Yellow grease 113.6 2
Total 5,014.9 100
Fig. 7 Tripalmitin distribution
Fig. 8 Tristearin distribution
Fig. 9 Tristearin distribution
Fig. 10 Trilinolein distribution
88 S. Abbasi, U. M. Diwekar
123
(IPA), ethanol, and butyl alcohol are also available. The
separation process for separating the alcohols from bio-
diesel is similar. However, methanol cost per gallon is
considerably less than ethanol, IPA, or butyl alcohols, and
is therefore favored in the production process.
The stoichiometric methanol requirement is 3 mol of
methanol per mole of triglyceride. Literature survey indi-
cates that the mole ratio of methanol to oil flow rates depends
on the production process, feedstock, operating parameters,
and plant economics. The molar ratio of methanol to oil
varies from 6:1 to 3:1 with a common value of 4:1 (Gerpen
et al. 2004). Base-catalyzed process typically uses an oper-
ating mole ratio of 6:1 because it drives the reaction much
closer to completion leading to higher yields (Gerpen et al.
2004). But, the unused reaction methanol must be recovered
and recycled back into the process to minimize operating
costs and environmental impacts. In addition, methanol is
regulated under the recent EPA regulations for Miscella-
neous Organic NESHAP (MON), and therefore production
process must minimize methanol storage and usage.
Therefore, during process design, considerations must be
given to the molar ratio of methanol to oil because of its
impact on (i) the transesterification reaction, (ii) process
economics due the cost of methanol, difficulty of recovery
and recycle, and (iii) environmental regulations. In this
present study, methanol to oil ratio is treated as an uncer-
tainty represented by a uniform distribution between molar
ratio of 6:1 to 3:1. For input into the stochastic simulation
model, the mole ratios are converted to methanol flow rate
and defined by a uniform distribution between 1,200 and
1,700 lb/h. The distribution of methanol of methanol in the
reactor feed is shown in Table 3.
Operating temperature of reactor
Transesterification of triglycerides is an endothermic reac-
tion requiring heat. The selection of the operating temper-
ature is based on reaction rate and single pass conversion,
equipment design and size, and downstream separation
requirement. A higher reactor operating temperature will
lead to high conversion to methyl esters, but high temper-
ature reactor vessel and more energy required. Further, high
reactor operating temperature will cause methanol to begin
to boil out from the reactant mixture leading to a pressure
buildup in the reactor vessel. On the other hand, using a low
reactor operating temperature will lead to a lower reaction
rate, lower conversion, and larger reaction vessel. There-
fore, the selection of the reactor operating temperature
depends on various factors such as process economics,
feedstock components, and equipment design. Temperature
is considered as uncertain in this study because reaction rate
changes with varying feedstock components. Stochastic
modeling of reactor operating temperature will allow the
process designer to consider its overall impact in relation to
different feedstock operating conditions.
Literature survey indicates that the most common
reactor operating temperature is 140 �F (Gerpen et al.
2004). Reactor operating temperatures as low as 77 �F and
as high as 200 �F have been reported in literature. During
this study, reactor operating temperature is represented by a
uniform distribution and ranges between 140 and 200 �F.
Very low operating temperatures have not been considered
because even though they have been reported in literature,
from a practical stand point, triglycerides have high freeze
points and pipelines are normally electric traced to tem-
peratures above 120 �F to keep lines from freezing. The
distribution of reactor operating temperature is shown in
Table 3.
Results and discussion
The results of stochastic simulation considered the impact
of uncertainties in the overall biodiesel production process.
The results of stochastic simulation were divided into two
categories: (1) process efficiency for biodiesel production
and (2) quality of biodiesel produced.
Process efficiency
The uncertainties characterized in the preceding section
impact process efficiency. Process efficiency is based on
the quantity of biodiesel produced at the end of the sepa-
ration process. The quantity and type of triglycerides in the
biodiesel feedstock impact the quantity of methyl esters in
the final biodiesel. In addition, the methyl ester content
determines if additional separation is required. To evaluate
Table 3 Methanol and reactor operating temperature distribution
Distribution of methanol in feed and reactor temperature
Parameter Distribution Range
Methanol Uniform 1,200 lb/h 1,800 lb/h
Rx temp Uniform 140 �F 200 �F
Fig. 11 Trilienolenin distribution
Characterization and stochastic modeling 89
123
the process efficiency, the stochastic model outputs were
set as (1) quantity of biodiesel produced in lb/h and (2)
methyl ester mass fraction in the biodiesel stream. These
two output results are used to determine evaluate process
efficiency as the single pass production of methyl esters
based on a feed flow rate of 20,000 lb/h of feedstock.
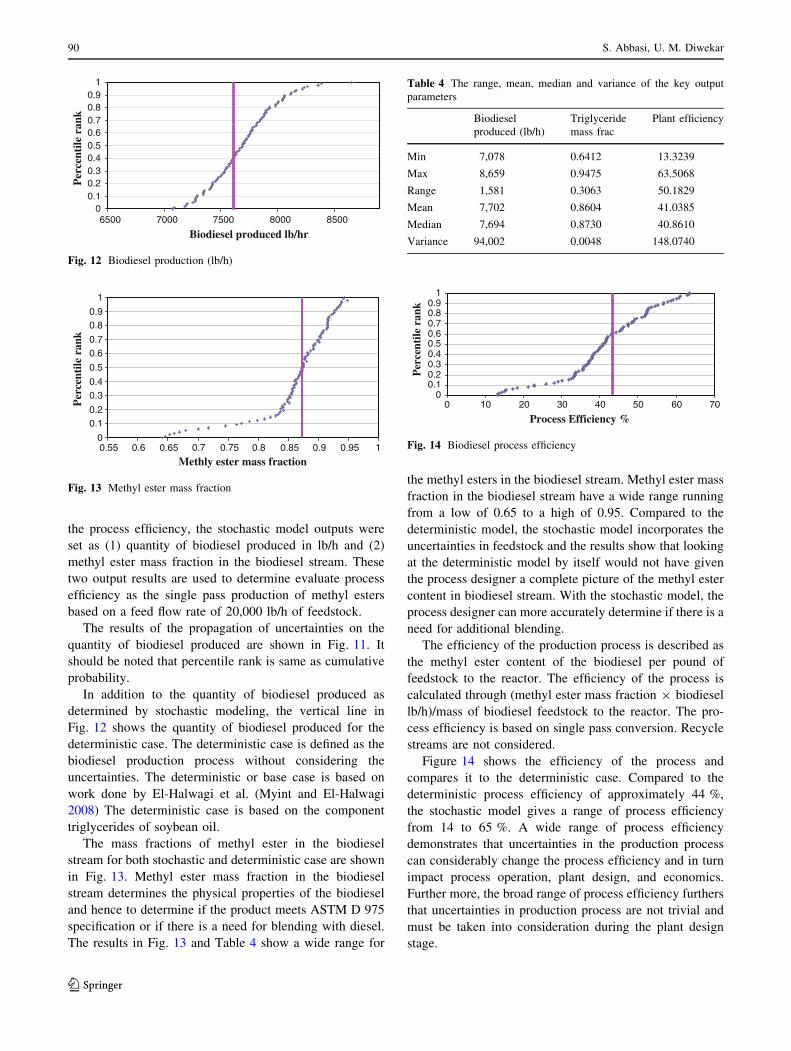
The results of the propagation of uncertainties on the
quantity of biodiesel produced are shown in Fig. 11. It
should be noted that percentile rank is same as cumulative
probability.
In addition to the quantity of biodiesel produced as
determined by stochastic modeling, the vertical line in
Fig. 12 shows the quantity of biodiesel produced for the
deterministic case. The deterministic case is defined as the
biodiesel production process without considering the
uncertainties. The deterministic or base case is based on
work done by El-Halwagi et al. (Myint and El-Halwagi
2008) The deterministic case is based on the component
triglycerides of soybean oil.
The mass fractions of methyl ester in the biodiesel
stream for both stochastic and deterministic case are shown
in Fig. 13. Methyl ester mass fraction in the biodiesel
stream determines the physical properties of the biodiesel
and hence to determine if the product meets ASTM D 975
specification or if there is a need for blending with diesel.
The results in Fig. 13 and Table 4 show a wide range for
the methyl esters in the biodiesel stream. Methyl ester mass
fraction in the biodiesel stream have a wide range running
from a low of 0.65 to a high of 0.95. Compared to the
deterministic model, the stochastic model incorporates the
uncertainties in feedstock and the results show that looking
at the deterministic model by itself would not have given
the process designer a complete picture of the methyl ester
content in biodiesel stream. With the stochastic model, the
process designer can more accurately determine if there is a
need for additional blending.
The efficiency of the production process is described as
the methyl ester content of the biodiesel per pound of
feedstock to the reactor. The efficiency of the process is
calculated through (methyl ester mass fraction 9 biodiesel
lb/h)/mass of biodiesel feedstock to the reactor. The pro-
cess efficiency is based on single pass conversion. Recycle
streams are not considered.
Figure 14 shows the efficiency of the process and
compares it to the deterministic case. Compared to the
deterministic process efficiency of approximately 44 %,
the stochastic model gives a range of process efficiency
from 14 to 65 %. A wide range of process efficiency
demonstrates that uncertainties in the production process
can considerably change the process efficiency and in turn
impact process operation, plant design, and economics.
Further more, the broad range of process efficiency furthers
that uncertainties in production process are not trivial and
must be taken into consideration during the plant design
stage.
00.10.20.30.40.50.60.70.80.9
1
6500 7000 7500 8000 8500
Biodiesel produced lb/hr
Per
cent
ile r
ank
Fig. 12 Biodiesel production (lb/h)
0
0.10.2
0.30.4
0.5
0.60.7
0.80.9
1
0.55 0.6 0.65 0.7 0.75 0.8 0.85 0.9 0.95 1
Methly ester mass fraction
Per
cent
ile r
ank
Fig. 13 Methyl ester mass fraction
Table 4 The range, mean, median and variance of the key output
parameters
Biodiesel
produced (lb/h)
Triglyceride
mass frac
Plant efficiency
Min 7,078 0.6412 13.3239
Max 8,659 0.9475 63.5068
Range 1,581 0.3063 50.1829
Mean 7,702 0.8604 41.0385
Median 7,694 0.8730 40.8610
Variance 94,002 0.0048 148.0740
00.10.20.30.40.50.60.70.80.9
1
0 10 20 30 40 50 60 70
Process Efficiency %P
erce
ntile
ran
k
Fig. 14 Biodiesel process efficiency
90 S. Abbasi, U. M. Diwekar
123
Biodiesel quality
The properties of biodiesel produced must meet or come
close to meeting ASTM D975 specification for conven-
tional diesel fuel. The specific properties evaluated in this
model are specific gravity, specific heat, boiling point,
viscosity, and cetane number. The physical properties of
the biodiesel fuel effects the quality of the fuel and is a
factor in making a determination if the fuel can be directly
used in diesel engines or if blending is required. Due to the
uncertainties in the biodiesel production process, the
properties of the fuel fall in a range (Table 5). For the
physical properties named above, a comparison is made
between the properties calculated or evaluated through
stochastic modeling and the values obtained through the
deterministic model. In addition, the physical properties
obtained through stochastic modeling are also compared
with conventional diesel for the case of specific gravity,
cetane number, and viscosity.
The specific and specific heat capacity of biodiesel are
obtained through the ASPEN simulation model. Raoults law
was used to determine the boiling point of biodiesel. The
viscosity of the biodiesel was determined by Grunberg–
Nissan used for determining the viscosity of liquid mixtures.
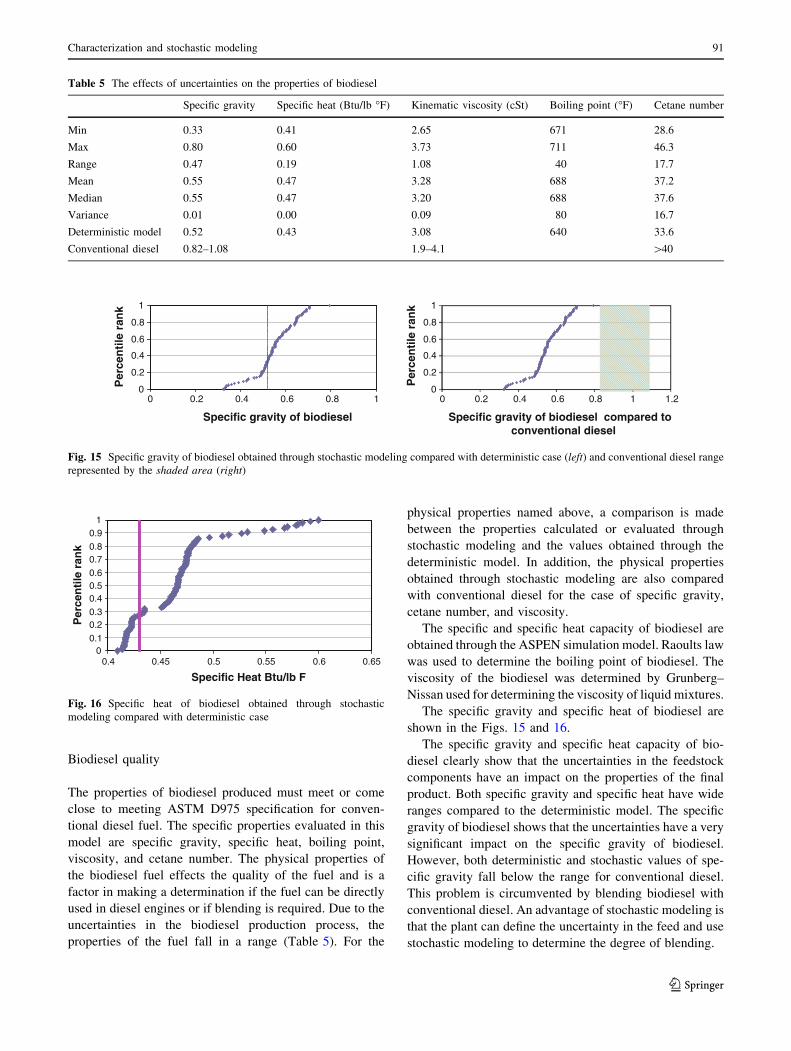
The specific gravity and specific heat of biodiesel are
shown in the Figs. 15 and 16.
The specific gravity and specific heat capacity of bio-
diesel clearly show that the uncertainties in the feedstock
components have an impact on the properties of the final
product. Both specific gravity and specific heat have wide
ranges compared to the deterministic model. The specific
gravity of biodiesel shows that the uncertainties have a very
significant impact on the specific gravity of biodiesel.
However, both deterministic and stochastic values of spe-
cific gravity fall below the range for conventional diesel.
This problem is circumvented by blending biodiesel with
conventional diesel. An advantage of stochastic modeling is
that the plant can define the uncertainty in the feed and use
stochastic modeling to determine the degree of blending.
Table 5 The effects of uncertainties on the properties of biodiesel
Specific gravity Specific heat (Btu/lb �F) Kinematic viscosity (cSt) Boiling point (�F) Cetane number
Min 0.33 0.41 2.65 671 28.6
Max 0.80 0.60 3.73 711 46.3
Range 0.47 0.19 1.08 40 17.7
Mean 0.55 0.47 3.28 688 37.2
Median 0.55 0.47 3.20 688 37.6
Variance 0.01 0.00 0.09 80 16.7
Deterministic model 0.52 0.43 3.08 640 33.6
Conventional diesel 0.82–1.08 1.9–4.1 [40
0
0.2
0.4
0.6
0.8
1
0 0.2 0.4 0.6 0.8 1
Specific gravity of biodiesel
Per
cen
tile
ran
k
0
0.2
0.4
0.6
0.8
1
0 0.2 0.4 0.6 0.8 1 1.2
Specific gravity of biodiesel compared to conventional diesel
Per
cen
tile
ran
k
Fig. 15 Specific gravity of biodiesel obtained through stochastic modeling compared with deterministic case (left) and conventional diesel range
represented by the shaded area (right)
00.1
0.20.3
0.40.50.6
0.70.8
0.91
0.4 0.45 0.5 0.55 0.6 0.65
Specific Heat Btu/lb F
Per
cen
tile
ran
k
Fig. 16 Specific heat of biodiesel obtained through stochastic
modeling compared with deterministic case
Characterization and stochastic modeling 91
123
Using a stochastic model, quality control departments at
plants can make judgments about the need for blending or
further processing of biodiesel. In addition, uncertainty
characterization can be narrowed down to a single feed-
stock such as soybean oil or tallow and then stochastic
modeling can be used to determine the bandwidth for the
physical properties leading to better control of product
specification.
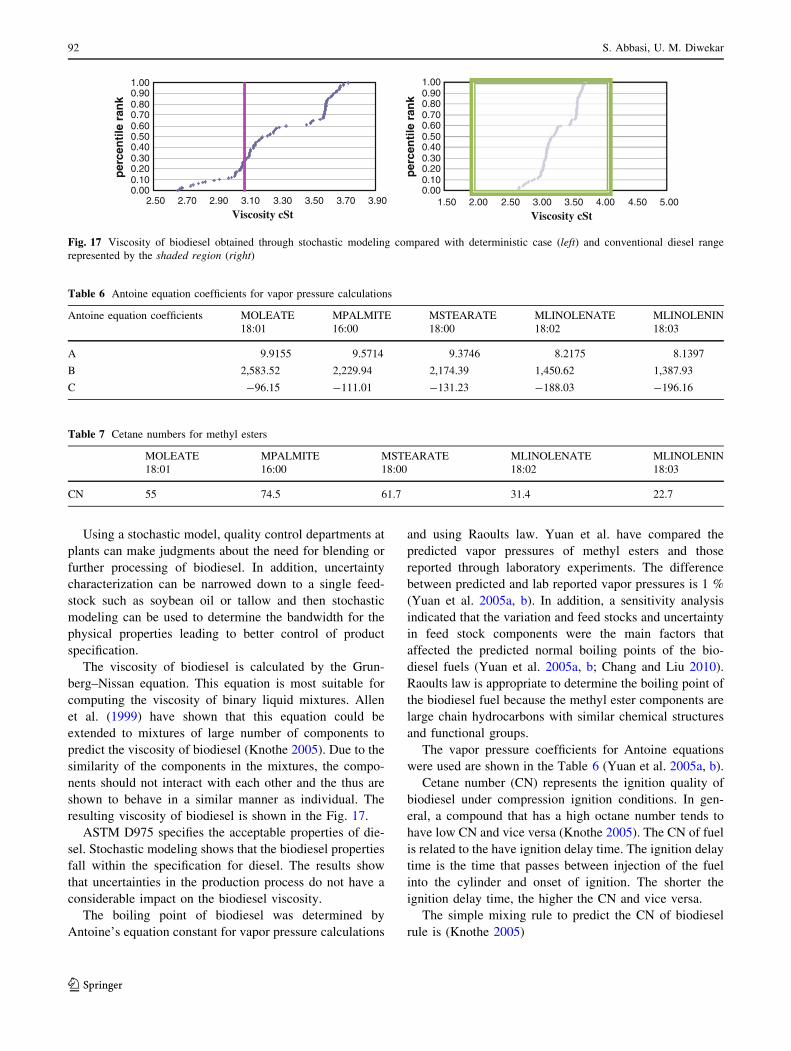
The viscosity of biodiesel is calculated by the Grun-
berg–Nissan equation. This equation is most suitable for
computing the viscosity of binary liquid mixtures. Allen
et al. (1999) have shown that this equation could be
extended to mixtures of large number of components to
predict the viscosity of biodiesel (Knothe 2005). Due to the
similarity of the components in the mixtures, the compo-
nents should not interact with each other and the thus are
shown to behave in a similar manner as individual. The
resulting viscosity of biodiesel is shown in the Fig. 17.
ASTM D975 specifies the acceptable properties of die-
sel. Stochastic modeling shows that the biodiesel properties
fall within the specification for diesel. The results show
that uncertainties in the production process do not have a
considerable impact on the biodiesel viscosity.
The boiling point of biodiesel was determined by
Antoine’s equation constant for vapor pressure calculations
and using Raoults law. Yuan et al. have compared the
predicted vapor pressures of methyl esters and those
reported through laboratory experiments. The difference
between predicted and lab reported vapor pressures is 1 %
(Yuan et al. 2005a, b). In addition, a sensitivity analysis
indicated that the variation and feed stocks and uncertainty
in feed stock components were the main factors that
affected the predicted normal boiling points of the bio-
diesel fuels (Yuan et al. 2005a, b; Chang and Liu 2010).
Raoults law is appropriate to determine the boiling point of
the biodiesel fuel because the methyl ester components are
large chain hydrocarbons with similar chemical structures
and functional groups.
The vapor pressure coefficients for Antoine equations
were used are shown in the Table 6 (Yuan et al. 2005a, b).
Cetane number (CN) represents the ignition quality of
biodiesel under compression ignition conditions. In gen-
eral, a compound that has a high octane number tends to
have low CN and vice versa (Knothe 2005). The CN of fuel
is related to the have ignition delay time. The ignition delay
time is the time that passes between injection of the fuel
into the cylinder and onset of ignition. The shorter the
ignition delay time, the higher the CN and vice versa.
The simple mixing rule to predict the CN of biodiesel
rule is (Knothe 2005)
0.000.100.200.300.400.500.600.700.800.901.00
2.50 2.70 2.90 3.10 3.30 3.50 3.70 3.90
Viscosity cSt
per
cen
tile
ran
k
0.000.100.200.300.400.500.600.700.800.901.00
1.50 2.00 2.50 3.00 3.50 4.00 4.50 5.00
Viscosity cSt
per
cen
tile
ran
k
Fig. 17 Viscosity of biodiesel obtained through stochastic modeling compared with deterministic case (left) and conventional diesel range
represented by the shaded region (right)
Table 6 Antoine equation coefficients for vapor pressure calculations
Antoine equation coefficients MOLEATE MPALMITE MSTEARATE MLINOLENATE MLINOLENIN
18:01 16:00 18:00 18:02 18:03
A 9.9155 9.5714 9.3746 8.2175 8.1397
B 2,583.52 2,229.94 2,174.39 1,450.62 1,387.93
C -96.15 -111.01 -131.23 -188.03 -196.16
Table 7 Cetane numbers for methyl esters
MOLEATE MPALMITE MSTEARATE MLINOLENATE MLINOLENIN
18:01 16:00 18:00 18:02 18:03
CN 55 74.5 61.7 31.4 22.7
92 S. Abbasi, U. M. Diwekar
123
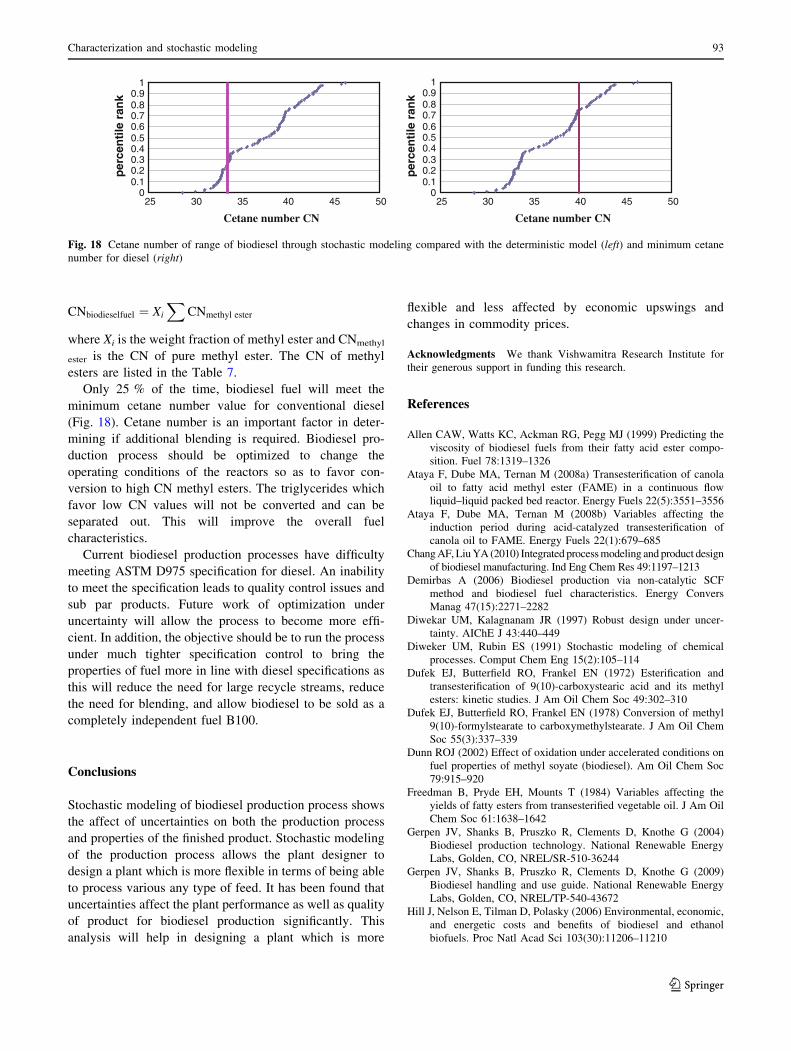
CNbiodieselfuel ¼ Xi
XCNmethyl ester
where Xi is the weight fraction of methyl ester and CNmethyl
ester is the CN of pure methyl ester. The CN of methyl
esters are listed in the Table 7.
Only 25 % of the time, biodiesel fuel will meet the
minimum cetane number value for conventional diesel
(Fig. 18). Cetane number is an important factor in deter-
mining if additional blending is required. Biodiesel pro-
duction process should be optimized to change the
operating conditions of the reactors so as to favor con-
version to high CN methyl esters. The triglycerides which
favor low CN values will not be converted and can be
separated out. This will improve the overall fuel
characteristics.
Current biodiesel production processes have difficulty
meeting ASTM D975 specification for diesel. An inability
to meet the specification leads to quality control issues and
sub par products. Future work of optimization under
uncertainty will allow the process to become more effi-
cient. In addition, the objective should be to run the process
under much tighter specification control to bring the
properties of fuel more in line with diesel specifications as
this will reduce the need for large recycle streams, reduce
the need for blending, and allow biodiesel to be sold as a
completely independent fuel B100.
Conclusions
Stochastic modeling of biodiesel production process shows
the affect of uncertainties on both the production process
and properties of the finished product. Stochastic modeling
of the production process allows the plant designer to
design a plant which is more flexible in terms of being able
to process various any type of feed. It has been found that
uncertainties affect the plant performance as well as quality
of product for biodiesel production significantly. This
analysis will help in designing a plant which is more
flexible and less affected by economic upswings and
changes in commodity prices.
Acknowledgments We thank Vishwamitra Research Institute for
their generous support in funding this research.
References
Allen CAW, Watts KC, Ackman RG, Pegg MJ (1999) Predicting the
viscosity of biodiesel fuels from their fatty acid ester compo-
sition. Fuel 78:1319–1326
Ataya F, Dube MA, Ternan M (2008a) Transesterification of canola
oil to fatty acid methyl ester (FAME) in a continuous flow
liquid–liquid packed bed reactor. Energy Fuels 22(5):3551–3556
Ataya F, Dube MA, Ternan M (2008b) Variables affecting the
induction period during acid-catalyzed transesterification of
canola oil to FAME. Energy Fuels 22(1):679–685
Chang AF, Liu YA (2010) Integrated process modeling and product design
of biodiesel manufacturing. Ind Eng Chem Res 49:1197–1213
Demirbas A (2006) Biodiesel production via non-catalytic SCF
method and biodiesel fuel characteristics. Energy Convers
Manag 47(15):2271–2282
Diwekar UM, Kalagnanam JR (1997) Robust design under uncer-
tainty. AIChE J 43:440–449
Diweker UM, Rubin ES (1991) Stochastic modeling of chemical
processes. Comput Chem Eng 15(2):105–114
Dufek EJ, Butterfield RO, Frankel EN (1972) Esterification and
transesterification of 9(10)-carboxystearic acid and its methyl
esters: kinetic studies. J Am Oil Chem Soc 49:302–310
Dufek EJ, Butterfield RO, Frankel EN (1978) Conversion of methyl
9(10)-formylstearate to carboxymethylstearate. J Am Oil Chem
Soc 55(3):337–339
Dunn ROJ (2002) Effect of oxidation under accelerated conditions on
fuel properties of methyl soyate (biodiesel). Am Oil Chem Soc
79:915–920
Freedman B, Pryde EH, Mounts T (1984) Variables affecting the
yields of fatty esters from transesterified vegetable oil. J Am Oil
Chem Soc 61:1638–1642
Gerpen JV, Shanks B, Pruszko R, Clements D, Knothe G (2004)
Biodiesel production technology. National Renewable Energy
Labs, Golden, CO, NREL/SR-510-36244
Gerpen JV, Shanks B, Pruszko R, Clements D, Knothe G (2009)
Biodiesel handling and use guide. National Renewable Energy
Labs, Golden, CO, NREL/TP-540-43672
Hill J, Nelson E, Tilman D, Polasky (2006) Environmental, economic,
and energetic costs and benefits of biodiesel and ethanol
biofuels. Proc Natl Acad Sci 103(30):11206–11210
00.10.20.30.40.50.60.70.80.9
1
25 30 35 40 45 50
Cetane number CN
per
cen
tile
ran
k
00.10.20.30.40.50.60.70.80.9
1
25 30 35 40 45 50
Cetane number CN
per
cen
tile
ran
k
Fig. 18 Cetane number of range of biodiesel through stochastic modeling compared with the deterministic model (left) and minimum cetane
number for diesel (right)
Characterization and stochastic modeling 93
123
Huo H, Wang M, Bloyd C, Putsche V (2008) Life-cycle assessment of
energy and greenhouse gas effects of soybean-derived biodiesel
and renewable fuels. Argonne National Laboratory, Lemont, IL,
ANL/ESD/08-2
Kinast JA (2003) Production of biodiesel from multiple feedstocks
and properties of biodiesel and biodiesel/blends. National
Renewable Energy Labs, Golden, CO, NREL/SR-510-31460
Knothe G (2005) Dependence of Biodiesel Fuel Properties on
the Structure of Fatty Acid Alkyl Esters. Fuel Proc. Tech. 86:
1059–1070
Leevijit L, Prateepchaikul G, Tongurai C, Wisutmethangoon (2008)
Performance test of a 6-stage continuous reactor for palm methyl
ester production. Bioresour Technol 99(1):214–221
Linstromberg WW (1970) Organic chemistry. D.C. Heath and Co.,
Lexington, pp 129–133
M311K (2008) Fats and oil: production, consumption, and stocks.
Current industrial report, United States Census Bureau, Wash-
ington D.C
Myint LL, El-Halwagi MM (2008) Process analysis and optimization
of biodiesel production from soybean oil. J Clean Technol
Environ Policies 11(3):263–276
Nocker LD, Spirinckx C, Torfs R (1998) Comparison of LCA and
external-cost analysis for biodiesel and diesel. In: 2nd interna-
tional conference LCA in agriculture agro-industry and forestry
Noureddini H, Zhu D (1997) Kinetics of transesterification of
soyabean oil. JAOCS 74:1457–1463
Olivera M, Queimada AJ, Coutinho J (2010) Modeling of biodiesel
multicomponent systems with the cubic-plus-association (CPA)
equation of state. Ind Eng Chem Res 49(3):1419–1427
Papoulis A, Pillai SU (2001) Probability random variables and
stochastic processes. McGraw-Hill Science/Engineering/Math,
Blacklick
Sheehan J, Camobreco V, Duffield J, Graboski M, Shapouri H (1998)
An overview of biodiesel and petroleum diesel life cycles.
National Renewable Energy Labs, Golden, CO, NREL/TP-580-
24772
Subramanayan K, Diwekar UM (2007) User manual for CAPE-OPEN
compliant stochastic simulation capability. VRI CUSTOM
Yuan W, Hansen AC, Zhang Q (2005a) Vapor pressure and normal
boiling point predictions for pure methyl esters and biodiesel
fuels. Fuel 84(7):943–950
Yuan W, Hansen AC, Zhang Q (2005b) Vapor pressure and normal
boiling point prediction for pure methyl esters and biodiesel
fuels. Fuel 84:943–950
94 S. Abbasi, U. M. Diwekar
123


![Geometrical Stochastic Modeling and Characterization of 2-D … · 2017-01-27 · Stochastic Geometry and its application. John Wiley & Sons, 1987. [10] B. Galerne. Computation of](https://img.pdfslide.us/doc/110x75/5f9762dc0a715068b22489fb/geometrical-stochastic-modeling-and-characterization-of-2-d-2017-01-27-stochastic.jpg)


![AN EQUILIBRIUM CHARACTERIZATION OF THE TERM … · AN EQUILIBRIUM CHARACTERIZATION OF THE TERM ... (1969)] by a stochastic differential equation ... Solutions of partial differential](https://img.pdfslide.us/doc/110x75/5b580bee7f8b9aec628bd80b/an-equilibrium-characterization-of-the-term-an-equilibrium-characterization.jpg)