Embed Size (px)
Citation preview
Turk J Chem
(2016) 40: 28 – 37
c⃝ TUBITAK
doi:10.3906/kim-1407-7
Turkish Journal of Chemistry
http :// journa l s . tub i tak .gov . t r/chem/
Research Article
Characterization and photocatalytic properties of TiO2/chitosan nanocomposites
synthesized by hydrothermal process
Funda SAYILKAN1,2,∗, Fatma Bilge EMRE1,2
1Prof. Dr. Hikmet Sayılkan Advanced Materials Research and Application Laboratory,
Scientific and Technological Research Center, Inonu University, Malatya, Turkey2Department of Elementary Education, Faculty of Education, Inonu University, Malatya, Turkey
Received: 03.07.2014 • Accepted/Published Online: 05.04.2015 • Final Version: 05.01.2016
Abstract: Nanocomposites of TiO2 /chitosan (nTC) were synthesized by hydrothermal process at 200 ◦C. Photo-
catalytic activity of the nanocomposites was studied with degradation of malachite green (MG) in aqueous medium.
Structural and physico-chemical properties of the obtained nanocomposites were characterized by XRD, SEM, BET,
FTIR, and particle size analyzer. Complete photodegradation of MG was successfully achieved with the aid of the
nanocomposites. The optimum photocatalytic degradation conditions, irradiation time, irradiation power, and amount
of catalyst were studied. Photocatalytic activity of the synthesized nanocomposites in terms of degradation of MG
was compared with that of undoped TiO2 (synthesized by our team) and chitosan under normal conditions. It was
concluded that the synthesized nanocomposites had better photocatalytic activity. The best result (100% degradation)
was obtained with amount of nTC of 0.25 g and irradiation time of 120 min.
Key words: Nanocomposite, photocatalytic activity, photodegradation, hydrothermal process
1. Introduction
Chitosan is a linear, semicrystalline polysaccharide composed of β -(1-4)-linked-D-glucosamine and N-acetil-D-
glucosamine units.1 The structure of this polymer is explained in Figure 1.
O
NH2
OH
OH
OH
O
O
NH2OH
O
OH
O
NH2OH
OH
O
O
NH2
OH
OH
OH
n
Figure 1. Structure of chitosan.
Due to the specific features of these amino groups, chitosan also efficiently forms complexes of various
species such as metal ions, and therefore they are often used for the treatment of wastewaters, by purifying
∗Correspondence: [email protected]
28
SAYILKAN and EMRE/Turk J Chem
them through removing heavy metals.1 The complex ability of chitosan is further utilized to refine beverages
(wine, juices, etc.).2 Moreover, chitosan exhibits other remarkable intrinsic properties: this polysaccharide ex-
hibits antibacterial activity,3,4 along with antifungal5 and mucoadhesive.6 It can be biodegraded into nontoxic
residues7,8—the rate of its degradation is highly related to the molecular mass of the polymer and its deacetyla-
tion degree—and its biocompatibility with physiological medium has been proven to some extent.9,10 All these
singular features make chitosan an outstanding material for biomedical applications.11
TiO2 is one of the most commonly used photocatalysts for degradation of pollutants.12−16 As it is envi-
ronmentally friendly, cheap, nonphotocorrosive, stable, highly available, and capable of mineralizing pollutants
completely, it has been largely used as the catalyzer for water decontamination.17,18 Nano-TiO2 and its com-
posites can be synthesized by different methods such as sol-gel and hydrothermal method.19,20 Hydrothermal
synthesis is a nanoparticle preparation route that utilizes heat and pressure to initiate reactions of reagents
dissolved in water or organic solvent. Nanoparticles can be produced without the requirement for postreaction
calcinations. The method is attractive as it can produce nanoparticles and nanocomposites with minimal or no
agglomeration.19,21
In recent years, chitosan biopolymer (CS) has shown multifunctional performance with TiO2 in het-
erogeneous photocatalysis technology, including its use as a stabilizer,22 a recovery agent23 for increasing the
adsorption capacity of CS-TiO2 adsorbent in the removal of metal ions,24,25 and for enhancing the adsorption–
photocatalytic process of dye and organic pollutant species.25−29
Malachite green (triphenylmethane dye) (MG) is a basic cationic dye readily soluble in water. MG is
widely used for coloring leather and silk and it is well known as an effective, inexpensive topical fungicide
and disinfectant used in the aquaculture industry. However, the toxic effects of MG have been studied
extensively.30,31 Therefore, different methods (adsorbtion,32 photocatalysis,33 sonosorption34 etc.) were used
to remove MG from wastewater.
The aim of the present study was to demonstrate, unlike the previously reported studies (in situ sol-gel
process,35 coating26 etc.), that TiO2/chitosan nanocomposites were synthesized by a hydrothermal method
using metal alkoxide. In this method, experiments were performed at relatively low temperature and short
experiment time. New materials were used for the photocatalytic degradation of MG dye. Overall the
experiment showed that the new nanocomposites are good for photocatalytic degradation of MG, which is
a hazardous dye.
2. Results and discussion
2.1. Characterization of the nanocomposites
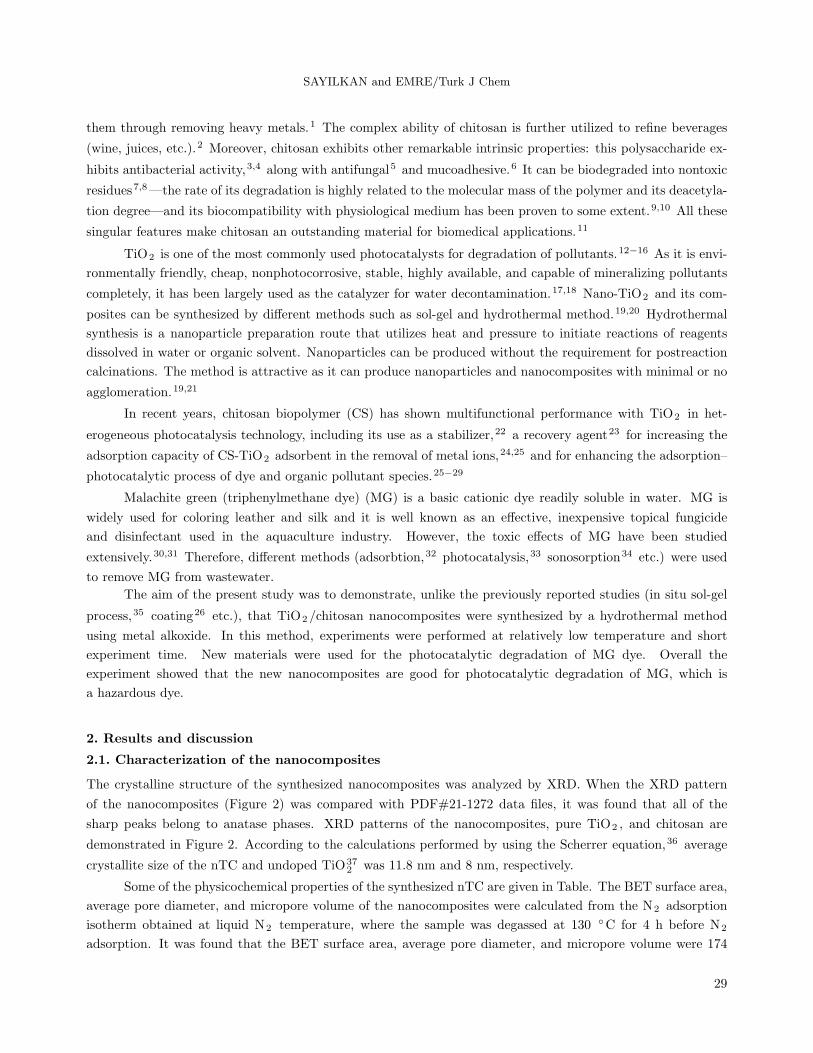
The crystalline structure of the synthesized nanocomposites was analyzed by XRD. When the XRD pattern
of the nanocomposites (Figure 2) was compared with PDF#21-1272 data files, it was found that all of the
sharp peaks belong to anatase phases. XRD patterns of the nanocomposites, pure TiO2 , and chitosan are
demonstrated in Figure 2. According to the calculations performed by using the Scherrer equation,36 average
crystallite size of the nTC and undoped TiO372 was 11.8 nm and 8 nm, respectively.
Some of the physicochemical properties of the synthesized nTC are given in Table. The BET surface area,
average pore diameter, and micropore volume of the nanocomposites were calculated from the N2 adsorption
isotherm obtained at liquid N2 temperature, where the sample was degassed at 130 ◦C for 4 h before N2
adsorption. It was found that the BET surface area, average pore diameter, and micropore volume were 174
29
SAYILKAN and EMRE/Turk J Chem
m2 /g, 8.70 nm, and 0.033 mL/g, respectively. According to the result of the DFT plus method, mesoporosity
dominated and was distributed in the range of 5–20 A. The mesoporosity (ratio of mesopores to total pore
volume, Vme/Vtot) was 98.1%. The microporosity (ratio of micropores to total pore volume, Vmi/Vtot) was
1.9%.
20 40 60 80
Chitosan
10 20 30 40 50 60 70 80
TiO2
25.24
37.62 48.22 54.72
0 20 40 60 80
Inte
nsi
ty
2 Theta, degree
nTC
Figure 2. The XRD patterns of nTC, pure TiO2 ,37 and chitosan.
Table. Some physicochemical characteristics of the synthesized nTC and comparison with the literature (NR: not
reported).
BET Average
ReferenceCrystalline Crystalline surface pore Micropore Particle Degradationtype size (nm) area diameter volume size (%)
(m2/g) (nm) (mL/g) (nm)Anatase/ Brookite NR 3.8 15.24 0.043 NR 41–91 [25]Anatase/ Rutile 4–18 NR NR NR NR 87 (max) [26]NR NR 1.342 90 [27]Anatase 11.8 174 8.70 0.033 168 100 This study
The functional group of the hydrothermally synthesized nanocomposite was analyzed by FT-IR (Figure
3). Both TiO2 and nTC were observed through the main bands due to stretching vibrations of OH groups
between the range of 3600 cm−1 and 3000 cm−1 . The vibrations of amine group NH2 (ν = 1535 cm−1) and
the vibrations of the hydrogen bond and protonation of the amino groups (ν = 1410 cm−1) were observed in
the composite (nTC).38 Vibration frequencies related to the C–H bonding –CH2 (ν = 2930 cm−1) and –CH3
30

SAYILKAN and EMRE/Turk J Chem
(ν = 2980 cm−1) were observed. Bending vibrations of methylene and methyl groups were also visible at 1380
cm−1 and 1460 cm−1 , respectively.39 Moreover, characteristic peaks related to TiO2–TiO2 (Ti–O/Ti–O–C)
(ν = 1000–1200 cm−1) were not observed in the nTC.
1000 2000 3000 4000
70
80
90
100
% T
ransm
itta
nce
Wavenumbers cm-1
Chi- TiO2
TiO2
Figure 3. Typical FT-IR spectrum of pure TiO2 and synthesized nTC particles.
Typical SEM images of nTC particles and pure TiO372 are shown in Figure 4. This figure indicates that
the shapes of the particles are quite similar to each other and they are likely to become spherical.
Particle size of nanocomposites was determined by particle size analyzer. The particle size distribution
of the nTC is shown in Figure 5.
Figure 4. Typical SEM microphotograph of hydrothermally synthesized a) pure-TiO372 and b) nTC particles.
2.2. Photocatalytic degradation of MG
The strong preadsorption of the MG on the nTC surface is an important phenomenon for an efficient charge
transfer, and it not only affects the photodegradation rate, but also changes the photocatalytic mechanism. For
this reason, before examining the photocatalytic activity of nTC as a catalyst for degradation of MG, adsorption
tests were carried out by keeping it at its natural pH, and containing MG (C0 = 30 mg/L, 25 mL) and 0.25 g
31

SAYILKAN and EMRE/Turk J Chem
of nTC in the dark at room temperature for 30, 60, 90, and 120 min. It was determined that the adsorption
process on nTC was completed after 120 min and the adsorption at 614 nm (λmax) did not change with the
prolonged soaking time from 90 to 120 min. Therefore, before the optimization studies nTC/MG mixtures were
kept in the dark for 90 min.
Figure 5. Particle size distribution of nTC.
The photocatalytic degradation of MG was examined by using the hydrothermally synthesized nTC
crystalline as catalyst under irradiation. Photocatalytic degradation of MG catalyzed by nTC under different
irradiation times is shown in Figure 6a. Normalized concentration variations with irradiation power, amount of
nTC, and initial MG concentration in the mixture are also shown in Figures 6b–6e, respectively.
0 50 100 150
0
50
100
Deg
redat
ion,
%
Time, min
2 3 4 5 6 7 898
99
100
101
Deg
redat
ion,
%)
Irridation power
a b
c de
Irradiation
power
W / m 2
1 300
3 450
5 610
7 770
9 940
0.0 0.2 0.4 0.620
40
60
80
100
Deg
redat
ion,
%
Amount of catalyst, mg
10 20 30 40 50 60
99.6
99.8
100.0
Deg
redat
ion,
%
Dye concentration, ppm
2 4 6
0
50
100
Deg
redat
ion,
%
pH
Figure 6. Photocatalytic degradation of MG a) Effect of irradiation time, b) Effect of irradiation power, c) Effect of
amount of catalyst, d) Effect of dye concentration, e) Effect of pH.
The effects of irradiation time on the degradation of MG at constant irradiation power (770 W/m2 , PI 7),
amount of the nTC (0.25 g), initial concentration of dye (30 mg/L, 25 mL), and in natural pH were examined.
32

SAYILKAN and EMRE/Turk J Chem
The effect of irradiation time on MG degradation is shown in Figure 6a. The increase in irradiation time made
the nTC/MG mixture colorless, which indicated the degradation of MG. Decolorization was completed at 120
min for nTC. Generally, the logarithmic plot of concentration data gives a straight line, the slope of which helps
to predict the rate constant of the reaction. That is lnC0 /C = kt, where C is the dye concentration (mg/L)
at instant t (min), C0 is the dye concentration (mg/L) at t = 0 (min), and k is a rate constant (1/min). The
first order rate constant k was obtained from the slope of the linear plot of ln(C0 /C) versus time. Figure 7
shows that ln(C0/C) is linear with the irradiation time, obtained by replotting in the ln(C0/C)-t coordinates;
this means that photodecomposition of MG obeys the rules of pseudo-first order reaction kinetics. The reaction
rate decreases with irradiation time since it follows apparent first-order kinetics and additionally competition
for degradation may occur between the reactant and the intermediate products. The difficulty of converting
the N-atoms of dye into oxidized nitrogen compounds causes slow kinetics of dye degradation after a certain
time limit. The deactivation of active sites by strong by-products deposition (carbon, etc.) causes a reaction of
short chain aliphatic with OH · radicals and the short life-time of photocatalyst.37,40
0 30 60 90 120
0
2
4
R2
= 0.94888
Y = -0.53+ 0.037.X
ln
(C0
/C)
Time (min)
Figure 7. Pseudo-first-order photodegradation kinetics of MG.
The effects of irradiation power on the degradation of MG at constant irradiation time (120 min), amount
of the nTC (0.25 g), initial concentration of dye (30 mg/L, 25 mL), and in natural pH were examined. The results
are presented in Figure 6b. It can be seen that MG completely degrades with increasing irradiation power up to
770 W/m2 . The mixture became transparent and colorless, suggesting that degradation at these levels results
in complete mineralization.41,42 This is probably due to the fact that low light intensity reactions involving
electron–hole (e−/h+) formation are predominant and electron–hole recombination is negligible. However, as
the light intensity increased, so did the light electron–hole recombination, which caused the reaction rate to
decrease.
To optimize the amount of catalyst, a series of experiments were carried out in which the loading varied
from 0.1 to 0.5 g with a dye concentration of 30 mg/L, irradiation power 770 W/m2 , irradiation time 120 min,
and in natural pH. The degradation efficiency of MG for various catalyst loadings is shown in Figure 6c. The
results indicate that the photocatalytic efficiency increases up to a maximum as a function of catalyst loading.
The optimum amount of catalyst was determined as 0.25 g. The increased amount of catalyst produces a
proportional increase in the number of active radicals by absorbing increased numbers of photons, which are
sufficient and readily accessible for the degradation of nearby MG.43,44
33
SAYILKAN and EMRE/Turk J Chem
The photocatalytic degradation at different initial concentrations of MG in the range of 10–50 mg/L was
examined with determined conditions as the irradiation time (120 min), irradiation power (770 W/m2), amount
of the nTC (0.25 g), and in natural pH. As shown in Figure 6d, the photocatalytic degradation efficiency of
MG by nTC under the UV-light decreased with increases in the concentration of MG. This negative effect can
be explained as follows: as the dye concentration increases, the equilibrium adsorption of dye on the catalyst
surface active sites increases too; hence competitive adsorption of O2 on the same sites decreases, meaning
a lower formation rate of O2•− , H2O2 , and •OH radical, which is the principal oxidant necessary for high
degradation efficiency. On the other hand, when the Beer–Lambert law is taken into account, as the initial
dye concentration increases, the path length of photons entering the solution decreases, which results in lower
photon adsorption on catalyst particles and, consequently, a lower photodegradation rate.45−47
Several tests were performed to observe the effect of pH on photodegradation in the determined conditions
(Figure 6e). Natural pH of the nTC/MG mixture (containing 0.25 g of nTC and 30 mg/L MG) was nearly
4. pH of the medium varied between 2 and 6 by addition of HCl and NaOH. It was found that the highest
degradation activity was observed at pH 3 and pH 4. Above and below this pH value activities decreased. This
behavior shows that the interaction between catalyst and dye must occur because of the interaction of acid sites
MOH+2 or amphoteric sites MOH of catalysts with amine or aromatic groups of MG dye.48
Photocatalytic activity of the synthesized nanocomposites for degradation of MG was compared with
undoped-TiO372 and chitosan at optimum conditions. Photocatalytic degradation results for nTC, undoped
TiO2 , and chitosan were 100%, 90%, and 88%, respectively. This result shows that nanocomposites (nTC) had
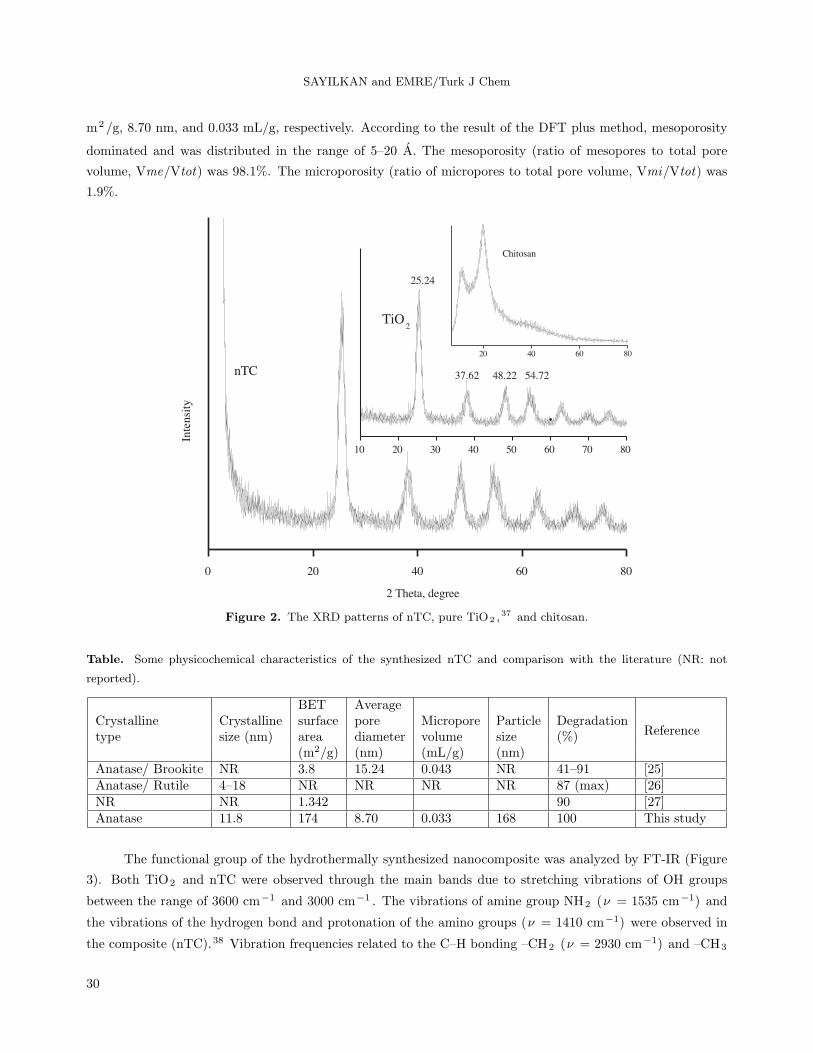
the best photocatalytic activity. The photocatalytic mechanism of MG is represented in Figure 8.
Figure 8. Possible photocatalytic degradation mechanism of MG.
In this study, nanocomposites (nTC) were easily synthesized by hydrothermal process at 200 ◦C in 4
h. This is a new method for synthesis of nTC. The synthesis of the new composite’s structure was explained
by analysis (FT-IR, XRD etc.). Afterwards, nTC was used for MG photocatalytic degradation. A possible
degradation mechanism is demonstrated in Figure 8. Photocatalytic activity of the synthesized nanocomposites
for degradation of MG was compared with that of undoped-TiO2 and chitosan under optimum conditions. It
was found that the synthesized nanocomposites had better photocatalytic activity. Results of this work were
compared with the literature and summarized in the Table.
34

SAYILKAN and EMRE/Turk J Chem
3. Experimental
3.1. Chemicals and apparatus
Tetraisopropylorthotitanate ((Ti(OPr i)4) (97%) and chitosan (MW = 100,000–300,000) provided by Alfa Aesar
and Acros Organics, respectively, were used in the synthesis of nanocomposites to be used as photocatalyst.
Acetic acid from Merck (HAc, 99%–100%) was used as solvent for chitosan. Isopropyl alcohol (Riedel de
Haen, 99%) was used as solvent. Malachite green oxalate (MGO) purchased from a local textile factory was
of analytical reagent grade and it was used without further purification. Deionized water was used for the
hydrolysis of Ti(OPr i)4 .
The crystalline structure of the nanocomposites was analyzed by X-ray powder diffraction (XRD) pattern
obtained from Rigaku Geigerflex D Max/B diffractometer with Cu Kα radiation (λ= 0.15418 nm with a step
of 0.04◦). The crystallite size of the anatase particle was calculated using the Scherrer equation. Surface
morphology of the nanocomposites was performed using SEM (LEO EVO 40). An ASAP 2000 model BET
analyzer was used to determine the surface area and average pore diameter. The BET surface area, average
pore diameter, and micropore volume of the nanocomposites were calculated from the N2 adsorption isotherm
at liquid N2 temperature. The sample was degassed at 130 ◦C for 4 h before N2 adsorption. Pore size
distribution of the nanocomposites was computed by DFT plus method. FT-IR spectra were collected using
a PerkinElmer Spectrum One FT-IR spectrometer. FT-IR measurements of the samples were carried out in
transmission mode in the region from 700 cm−1 to 4000 cm−1 with ATR unit. Particle size of nanocomposites
was determined by using a Malvern Nanoseries Zetasizer. Dye concentration in the solutions and mixtures was
determined by using a Varian Cary 50 model UV/VIS spectrophotometer. Irradiation was carried out using a
SOLARBOX 1500 model simulated irradiation unit with a Xe-lamp and a controller to change the irradiation
time and power input from 390 to 1100 W/m2 .
3.2. Preparation of nanocomposites
Different amounts of chitosan (0.1, 0.2, 0.3, and 0.4 g) were added to alkoxide solution (5 g). The best pho-
tocatalytic degradation result obtained with the weight ratio of chitosan/Ti(OPr i)4 was 0.2/5 g/g. Ti(OPr i)4
was dissolved in i-propanol and chitosan (0.2 g) that was dissolved in 3% HAc. The preparation was stirred
at ambient temperature for 10 min until it became homogeneous. Chitosan/HAc mixture was added dropwise
to the alkoxide solution quickly. The hydrolysis reaction started at this step. After being stirred for about 30
min, the solution was transferred into a stainless steel Teflon-lined autoclave and heated at 200 ◦C for 4 h and
the condensation reaction of the mixture was completed. Then the powders, which had been separated through
centrifuging, were dried in a vacuum sterilizer at 40 ◦C for 4 h. In this way, the nanocomposite powder was
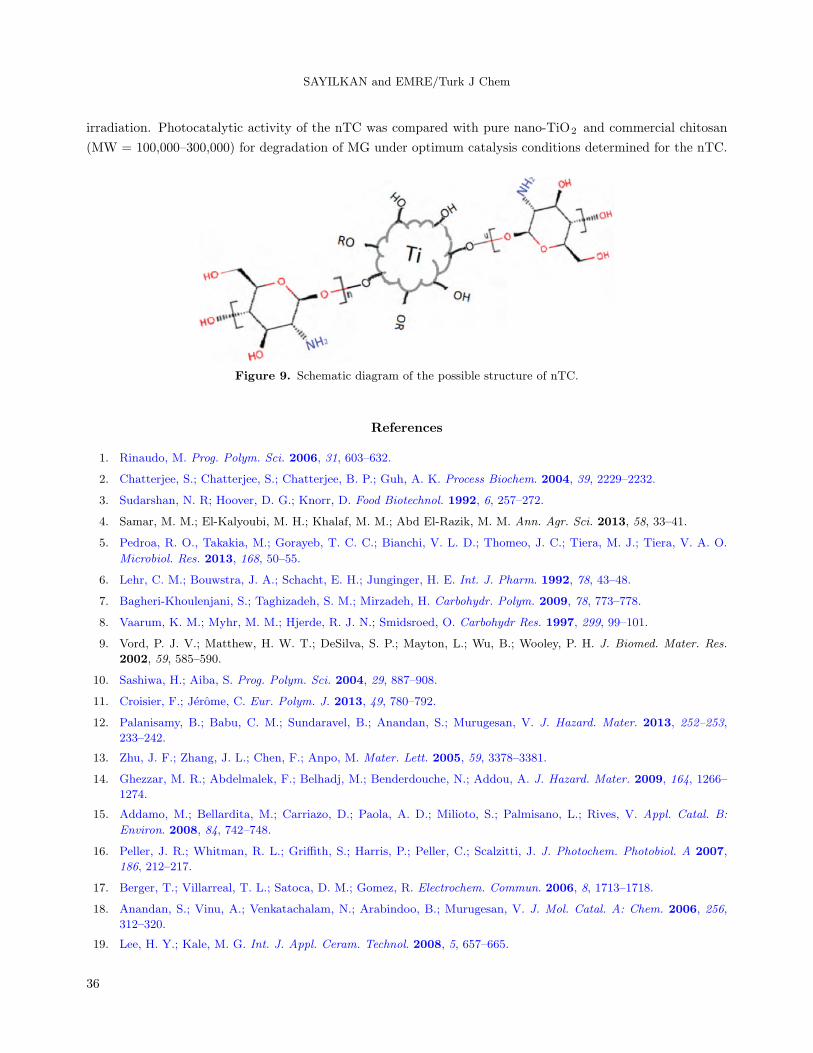
obtained. After the hydrolysis and condensation reactions, the possible structure of nanocomposites is as shown
in Figure 9.
3.3. Photodegradation experiments
For the photocatalytic degradation experiment, the necessary volume of MG solution was added to the nTC. The
prepared nTC/MG dye mixture was incubated in the dark for 90 min to equilibrate, the nTC/MG dye mixture
was poured into a disposable flask, and the flask was quickly placed in the SOLARBOX, ready for irradiation
to induce the photochemical reaction. The decomposition of MG was monitored by measuring the absorbency
at 614 nm (λmax) and degradation was quantified by detecting MG concentration (C) before, during, and after
35
SAYILKAN and EMRE/Turk J Chem
irradiation. Photocatalytic activity of the nTC was compared with pure nano-TiO2 and commercial chitosan
(MW = 100,000–300,000) for degradation of MG under optimum catalysis conditions determined for the nTC.
Figure 9. Schematic diagram of the possible structure of nTC.
References
1. Rinaudo, M. Prog. Polym. Sci. 2006, 31, 603–632.
2. Chatterjee, S.; Chatterjee, S.; Chatterjee, B. P.; Guh, A. K. Process Biochem. 2004, 39, 2229–2232.
3. Sudarshan, N. R; Hoover, D. G.; Knorr, D. Food Biotechnol. 1992, 6, 257–272.
4. Samar, M. M.; El-Kalyoubi, M. H.; Khalaf, M. M.; Abd El-Razik, M. M. Ann. Agr. Sci. 2013, 58, 33–41.
5. Pedroa, R. O., Takakia, M.; Gorayeb, T. C. C.; Bianchi, V. L. D.; Thomeo, J. C.; Tiera, M. J.; Tiera, V. A. O.
Microbiol. Res. 2013, 168, 50–55.
6. Lehr, C. M.; Bouwstra, J. A.; Schacht, E. H.; Junginger, H. E. Int. J. Pharm. 1992, 78, 43–48.
7. Bagheri-Khoulenjani, S.; Taghizadeh, S. M.; Mirzadeh, H. Carbohydr. Polym. 2009, 78, 773–778.
8. Vaarum, K. M.; Myhr, M. M.; Hjerde, R. J. N.; Smidsroed, O. Carbohydr Res. 1997, 299, 99–101.
9. Vord, P. J. V.; Matthew, H. W. T.; DeSilva, S. P.; Mayton, L.; Wu, B.; Wooley, P. H. J. Biomed. Mater. Res.
2002, 59, 585–590.
10. Sashiwa, H.; Aiba, S. Prog. Polym. Sci. 2004, 29, 887–908.
11. Croisier, F.; Jerome, C. Eur. Polym. J. 2013, 49, 780–792.
12. Palanisamy, B.; Babu, C. M.; Sundaravel, B.; Anandan, S.; Murugesan, V. J. Hazard. Mater. 2013, 252–253,
233–242.
13. Zhu, J. F.; Zhang, J. L.; Chen, F.; Anpo, M. Mater. Lett. 2005, 59, 3378–3381.
14. Ghezzar, M. R.; Abdelmalek, F.; Belhadj, M.; Benderdouche, N.; Addou, A. J. Hazard. Mater. 2009, 164, 1266–
1274.
15. Addamo, M.; Bellardita, M.; Carriazo, D.; Paola, A. D.; Milioto, S.; Palmisano, L.; Rives, V. Appl. Catal. B:
Environ. 2008, 84, 742–748.
16. Peller, J. R.; Whitman, R. L.; Griffith, S.; Harris, P.; Peller, C.; Scalzitti, J. J. Photochem. Photobiol. A 2007,
186, 212–217.
17. Berger, T.; Villarreal, T. L.; Satoca, D. M.; Gomez, R. Electrochem. Commun. 2006, 8, 1713–1718.
18. Anandan, S.; Vinu, A.; Venkatachalam, N.; Arabindoo, B.; Murugesan, V. J. Mol. Catal. A: Chem. 2006, 256,
312–320.
19. Lee, H. Y.; Kale, M. G. Int. J. Appl. Ceram. Technol. 2008, 5, 657–665.
36

SAYILKAN and EMRE/Turk J Chem
20. Balachandaran, K.; Venckatesh, R.; Sivaraj, R. Int. J. Eng. Sci. Tech. 2010, 2, 3695–3700.
21. Bilton, M.; Milne, S. J.; Brown, P. A. Open Journal of Inorganic Non-metallic Materials 2012, 2, 1–10.
22. Ozerin, A. N.; Zelenetskii, A. N.; Akopova, T. A.; Pavlova-Verevkina, O. B.; Ozerin, L. A.; Surin, N. M., Kechek’yan,
A. S. Polym. Sci. Ser. A. 2006, 48, 638–643.
23. Kim, T. Y.; Lee, Y. H.; Park, K. H.; Kim, S. J.; Cho, S. Y. Res. Chem. Intermediat. 2005, 31, 343–358.
24. Tao, Y.; Ye, L.; Pan, J.; Wang, Y.; Tang, B. J. Hazard. Mater. 2009, 161, 718–722.
25. Zubieta, C. E.; Messina, P. V.; Luengo, C.; Dennehy, M.; Pieroni, O.; Schulz, P. C. J. Hazard. Mater. 2008, 152,
765–777.
26. Zainal, Z.; Hui, L. K.; Hussein, M. Z.; Abdullah, A. H.; Hamadneh, I. R. J. Hazard. Mater. 2009, 164, 138–145.
27. Li, Q.; Su, H.; Tan, T. Biochem. Eng. J. 2008, 38, 212–218.
28. Nawi, M. A.; Sabar, S.; Jawad, A. H.; Ngah, W. S. W. Biochem. Eng. J. 2010, 49, 317–325.
29. Nawi, M. A.; Jawad, A. H.; Sabar, S.; Ngah, W. S. W. Desalination 2011, 280, 288–296.
30. Srivastava, S.; Sinha, R.; Roy, D. Aquat. Toxicol. 2004, 66, 319–329.
31. Culp, S. J.; Bealand, F. A. J. Am. Coll. Toxicol. 1996, 15, 219–238.
32. Akar, E.; Altinisik, A.; Seki, Y. Ecol. Eng. 2013, 52, 19–27.
33. Sayılkan, F.; Asilturk, M.; Tatar, P.; Kiraz, N.; Arpac, E.; Sayılkan, H. J. Hazard. Mater. 2007, 148, 735–744.
34. Sonawane, S. H.; Chaudhari, S. A.; Ghodke, S. A.; Parande, M. G.; Bhandari, V. M.; Michra, S.; Kulkarni, R. D.
Ultrason. Sonochem. 2009, 16, 351–355.
35. Yang, D.; Li, J.; Jiang, Z.; Lu, L.; Chen, X. Chem. Eng. Sci. 2009, 64, 3130–3137.
36. Patterson, A. L. Phys. Rev. 1939, 56, 978–982.
37. Sayılkan, F.; Erdemoglu, S.; Asilturk, M.; Akarsu, M.; Sener, S.; Sayılkan, H.; Erdemoglu, M.; Arpac, E. Mater.
Res. Bull. 2006, 41, 2276–2285.
38. Mano, J. F.; Koniarova, D.; Reis, R. L. J. Mater. Sci.- Mater. Med. 2003, 14, 127–135.
39. Tao, Y.; Pan, J.; Yan, S.; Tang, B.; Zhu, L. Mater. Sci. Eng. B. 2007, 138, 84–89.
40. Zhou, X. J.; Guo, W. Q.; Yang, S. S.; Zheng, H. S.; Ren, N. Q. Bioresource Technol. 2013, 128, 827–830.
41. Gao, G.; Zhang, A.; Zhang, M.; Chen, J.; Zhang, Q. Chin. J. Catal. 2008, 29, 426–430.
42. Ju, Y.; Yang, S.; Ding, Y.; Sun, C.; Zhang, A.; Wang, L. J. Phys. Chem. A 2008, 112, 11172–11177.
43. Liu, Y.; Ohko, Y.; Zhang, R.; Yang, Y.; Zhang, Z. J. Hazard. Mater. 2010, 184, 386–391.
44. Daneshvar, N.; Salari, D.; Khataee, A. R. J. Photochem. Photobiol. A 2003, 157, 111–116.
45. Lu, C.; Wu, Y.; Mai, F.; Chung, W.; Wu, C.; Lin, W.; Chen, C. J. Mol. Catal. A: Chem. 2009, 310, 159–165.
46. Rauf, M. A.; Ashraf, S. S. Chem. Eng. J. 2009, 151, 10–18.
47. Sakthivel, S.; Neppolian, B.; Shankar, M. V.; Arabindoo, B.; Palanichamy, M.; Murugesan, V. Sol. Energ. Mat.
Sol. C. 2003, 77, 65–82.
48. Prado, A. G. S.; Costa, L. L. J. Hazard. Mater. 2009, 169, 297–301.
37