Embed Size (px)
Citation preview

antibodies
Article
Characterization and Modeling of Reversible AntibodySelf-Association Provide Insights into Behavior, Prediction,and Correction
Carl Mieczkowski 1, Alan Cheng 2,* , Thierry Fischmann 3 , Mark Hsieh 1, Jeanne Baker 1, Makiko Uchida 1,Gopalan Raghunathan 1, Corey Strickland 3 and Laurence Fayadat-Dilman 1
�����������������
Citation: Mieczkowski, C.; Cheng,
A.; Fischmann, T.; Hsieh, M.; Baker, J.;
Uchida, M.; Raghunathan, G.;
Strickland, C.; Fayadat-Dilman, L.
Characterization and Modeling of
Reversible Antibody Self-Association
Provide Insights into Behavior,
Prediction, and Correction. Antibodies
2021, 10, 8. https://doi.org/10.3390/
antib10010008
Received: 1 December 2020
Accepted: 1 February 2021
Published: 15 February 2021
Publisher’s Note: MDPI stays neutral
with regard to jurisdictional claims in
published maps and institutional affil-
iations.
Copyright: © 2021 by the authors.
Licensee MDPI, Basel, Switzerland.
This article is an open access article
distributed under the terms and
conditions of the Creative Commons
Attribution (CC BY) license (https://
creativecommons.org/licenses/by/
4.0/).
1 Discovery Biologics, Protein Sciences, Merck & Co., Inc., South San Francisco, CA 94080, USA;[email protected] (C.M.); [email protected] (M.H.); [email protected] (J.B.);[email protected] (M.U.); [email protected] (G.R.);[email protected] (L.F.-D.)
2 Discovery Chemistry, Modeling and Informatics, Merck & Co., Inc., South San Francisco, CA 94080, USA3 Department of Chemistry, Modeling and Informatics, Merck & Co., Inc., Kenilworth, NJ 07033, USA;
[email protected] (T.F.); [email protected] (C.S.)* Correspondence: [email protected]; Tel.: +1-650-496-4834
Abstract: Reversible antibody self-association, while having major developability and therapeuticimplications, is not fully understood or readily predictable and correctable. For a strongly self-associating humanized mAb variant, resulting in unacceptable viscosity, the monovalent affinityof self-interaction was measured in the low µM range, typical of many specific and biologicallyrelevant protein–protein interactions. A face-to-face interaction model extending across both theheavy-chain (HC) and light-chain (LC) Complementary Determining Regions (CDRs) was apparentfrom biochemical and mutagenesis approaches as well as computational modeling. Light scatteringexperiments involving individual mAb, Fc, Fab, and Fab’2 domains revealed that Fabs self-interactto form dimers, while bivalent mAb/Fab’2 forms lead to significant oligomerization. Site-directedmutagenesis of aromatic residues identified by homology model patch analysis and self-dockingdramatically affected self-association, demonstrating the utility of these predictive approaches,while revealing a highly specific and tunable nature of self-binding modulated by single pointmutations. Mutagenesis at these same key HC/LC CDR positions that affect self-interaction alsotypically abolished target binding with notable exceptions, clearly demonstrating the difficulties yetpossibility of correcting self-association through engineering. Clear correlations were also observedbetween different methods used to assess self-interaction, such as Dynamic Light Scattering (DLS)and Affinity-Capture Self-Interaction Nanoparticle Spectroscopy (AC-SINS). Our findings advanceour understanding of therapeutic protein and antibody self-association and offer insights into itsprediction, evaluation and corrective mitigation to aid therapeutic development.
Keywords: antibody; protein; self-association; self-interaction; developability; in silico prediction;computational modeling; viscosity; dynamic light scattering
1. Introduction
Monoclonal antibodies and biologics in general have enjoyed increasing success andutility as therapeutic agents addressing a variety of biological targets of interest. As oflate 2019, 79 commercial monoclonal antibody or antibody-based therapeutics have beenapproved [1], with several hundred currently being evaluated in clinical development [2].Central to a therapeutic antibody’s selection and success is its developability profile, whichis a key driver in pre-clinical and clinical lead nomination [3,4]. Previously, developabilityflags in therapeutic antibodies have been correlated to overall clinical success, clearly indi-cating that developability attributes may impact clinical development beyond drug productpurity, stability and manufacturability [5]. The developability properties of therapeutic
Antibodies 2021, 10, 8. https://doi.org/10.3390/antib10010008 https://www.mdpi.com/journal/antibodies

Antibodies 2021, 10, 8 2 of 20
antibodies range from expression and purification amenability to its physicochemicalstability and behavior, both in the drug product form and in vivo [6–8]. Other major devel-opability properties, such as self-association, can directly impact manufacturability andformulation success [3,9], and even strongly correlate to non-specific binding and animalPharmacokinetics and clearance, therefore, affecting its overall efficacy [10–13].
Therapeutic antibody self-association has been well studied from a rheological stand-point and is known to directly impact solution viscosity, injectability, and manufacturabil-ity [14,15]. Therapeutic antibody formulations as low as 13 mg/mL have been reportedto appreciably self-associate, significantly increasing solution viscosity and decreasingsolubility, precluding further development even at typical dose concentrations and formu-lation conditions [16]. Moreover, strong antibody self-interaction tends to manifest in highviscosities at higher formulation concentrations, such as 100 to 200 mg/mL (or approxi-mately 0.7–1.4 mM for a typical monoclonal antibody) and beyond [3]. Increasing solutionviscosity is due to a concentration-dependent oligomerization effect of self-interactingmolecules, particularly antibodies, whereby effectively large polymeric structures give riseto dramatic changes in solution rheology [17,18]. A resulting increase in viscosity may beexponential, making process filtration and pumping operations difficult and infeasible,and in the drug product form, handling, injectability, and potentially even stability may benegatively impacted [3,19,20]. This behavior is a major negative developability attributethat is difficult to predict from sequence or structure and correct through molecular engi-neering and can halt further development and the selection of even the most promisinglarge-molecule candidates [21].
High-concentration rheological behavior has significant importance in the selection oflead therapeutic candidates [22]. In general, molecular properties such as pI, net charge,and hydrophobicity can affect the rheology of antibody solutions [23]. Particularly at higherdrug concentrations, it was shown that hydrophobic and charged surface patches resultin increased self-interaction and solution viscosity above 100 mg/mL and approaching200 mg/mL [24,25]. Such self-interactions can even lead to additional undesirable out-comes, such as opalescence, phase separation and gelling [26,27]. Antibody self-interactionshave been reported to occur between antibody variable domains [21,28] as well as variable–constant interactions [16]. To possibly predict or correlate molecular properties to rheo-logical outcomes, in silico computational approaches have been employed to ascertaina molecule’s propensity to self-interact [29]. Surface behavior characteristics, such aszeta potential and net charge derived from modeling, have also been correlated to viscos-ity, [18,30,31] other self-interaction parameters, including AC-SINS and kD [32], and leadmolecule selection and success [33,34]. In addition to the inherent or predicted propertiesof a molecule, temperature [35,36] and formulation conditions [9,28] can have a dramaticeffect on solution rheology. Because of this, formulation approaches have been success-ful in mitigating self-association, such as modulating pH and ionic strength [37–39], orthe addition of excipients, such as Arginine [40,41]. However, success is still dependenton the nature of the self-interacting therapeutic molecule and additional challenges andlimitations are presented both from a process and formulation perspective.
In addition to directly measuring viscosity, a number of analytical methods and char-acteristics are informative of self-association, where typically size is directly measuredor characterized. Notably, light scattering approaches, such as Dynamic Light Scatter-ing (DLS), to determine the diffusion interaction parameter (kD) are informative andhave been correlated to viscosity at higher concentrations [42]. Other measured or cal-culated characteristics, such as the second virial coefficient (A2 or B22), isoelectric point(pI) and zeta potential, have also been correlated to self-association phenomena [42–44].Other techniques that evaluate self-interaction propensity or the propensity to interactwith a column matrix involve Affinity-Capture Self-interaction Nanoparticle Spectroscopy(AC-SINS) [45–47], Analytical Ultracentrifugation (AUC) [48,49], Cross-Interaction Chro-matography (CIC) and Standup Monolayer Adsorption Chromatography (SMAC) [43],
Antibodies 2021, 10, 8 3 of 20
many of which have been previously correlated to other self-interaction parameters, suchas kD, B22 and viscosity [39,50,51].
While self-association is impacted and defined by molecular surface properties, for-mulation effects, process considerations, and characterization approaches, the fundamentalnature of an antibody’s reversible self-interaction has yet to be fully gleaned, such asits typical orientation and strength. Additionally, while self-association can be routinelycharacterized and has been correlated to surface attributes elucidated both from crys-tal structures and computational models [16,21,29,52], predicting self-association fromsequence or using in silico techniques to address and mitigate it is not routine or fullyunderstood. Therefore, there is significant interest in understanding how to better predictand correct self-association at a sequence level to advance developability efforts. Previously,self-association of a recombinant monoclonal antibody was dramatically impacted andmodulated by conservative mutagenesis of a single heavy-chain complementary deter-mining region-3 (HC-CDR3) residue at position 104 [6], necessitating mitigation to findvariants with lower, more acceptable self-association propensity. Developability attributeswere evaluated for these variants, including DLS, AC-SINS, and viscosity, and correlationsbetween these methods were apparent. However, this case study also offered a uniqueopportunity to further probe and to examine the intrinsic nature of self-interaction andhow to better predict and correct it. Herein using similar variants, we verified viscosityprofiles in a representative formulation buffer using the W104 and F104 mAb variants,validating the strongly self-associating F104 variant as a major developability risk to formu-lation efforts. We also mapped this strong self-association by evaluating the interaction ofindividual antibody domains using DLS, revealing this self-interaction was independent ofthe Fc domains and involved a blocking or likely face-to-face interaction between opposingFab domains involving the CDR apparatus. We also determined the binding affinity of thisstrong self-interaction using both BIAcore Surface Plasmon Resonance (SPR) and Isother-mal Titration Calorimetry (ITC), revealing, for the first time, the magnitude and bindingaffinity of representative, strong antibody self-interaction that arises in unacceptably highviscosity. We further evaluated in silico computational approaches, such as homology mod-eling and docking for their ability to predict and inform corrective engineering. Identifiedby homology modeling and docking were multiple key interacting residues in the HCand LC CDRs. These residues were subsequently and individually mutated, and all werefound to dramatically affect self-interaction by DLS and AC-SINS. Given the highly specificand tunable nature of this self-interaction that structurally overlaps with its functionality,corrective engineering, while maintaining critical developability attributes such as targetantigen binding, is challenging although demonstrated herein to be feasible. This studysheds much needed light on the nature of antibody self-association and how to potentiallypredict, correct and mitigate it.
2. Materials and Methods2.1. Protein Expression and Purification
All recombinant antibodies (mAbs) and antibody binding fragments (Fabs) used areof the IgG1 isotype and were constructed by gene synthesis and expressed and purifiedas previously described [6]. Briefly, multi-liter (large) scale transient transfections wereperformed in 1 L shake flasks using the ExpiCHO Expression System (Thermo FisherScientific, Waltham, MA, USA) according to the manufacturer’s protocol for all proteinproduction. Antibodies were then affinity purified by Protein A MabSelect SuRe LX resin(GE Healthcare) in batch binding mode. Eluted antibody was then buffer exchangedinto 20 mM Sodium Acetate pH 5.5 or 1X PBS pH 7.4 (Thermo Scientific). All purifiedrecombinant antibodies were buffer exchanged overnight using 10 K MWCO Slide-A-Lyzer dialysis cassettes. Samples were concentrated using a Vivaspin™ ultrafiltration spincolumn with 10 K MWCO membrane (Sigma, Saint Louis, MO, USA). Concentration wasdetermined by UV absorbance at 280 nm on a Nanodrop 2000 1-position Spectrophotometer(Thermo Scientific, Waltham, MA, USA).

Antibodies 2021, 10, 8 4 of 20
For the preparation of Fab’2 constructs, the relevant mAb was digested by immobilizedpepsin using the Pierce F(ab’)2 Preparation Kit (Thermo Scientific, Waltham, MA, USA)according to the manufacturer protocol. Digested material was ProA affinity purified andthe digested Fab’2 was recovered in the flow-through and buffer-exchanged, concentrated,and measured for concentration as performed for Fabs/mAbs.
All antibody variant identities were confirmed by intact LC-MS, as previously de-scribed [6].
2.2. Dynamic Light Scattering (DLS)
A DynaPro PlateReader II (Wyatt Technology, Santa Barbara, CA, USA) was usedfor all DLS experiments. First, 65 µL of recombinant antibody solution in 1X PBS pH 7.4was added in duplicate to a 384-microwell glass bottom plate (Greiner bio-one, Austria).Then, 10 acquisitions were taken for a duration of 5 s at 25 ◦C using an auto-attenuatedlaser wavelength of 825 nm. Dynamics software version 7.8 (Wyatt Technology, SantaBarbara, CA, USA) was used for data analysis. All values, including hydrodynamic radius(Rh), diffusional coefficients (D), and diffusion interaction parameters (kD) are reported asthe average of duplicate well collections. kD’s in units of mL/g were obtained over theconcentration range of 1–10 mg/mL at 1, 2, 4, 6, 8, and 10 mg/mL concentrations. kD wasthen calculated by the Dynamics software from plotting measured diffusional coefficients(Dm) versus sample concentration (C) and using the equation Dm = Do(1 + kD·C) [53].Negative kD’s indicate self-interaction and increases in the magnitude indicate increasedself-interaction. The Mw-R (or estimated molecular weight from radius) is calculated inDynamics from measured diffusional coefficients using a standard spherical model.
2.3. Affinity-Capture Self-Interaction Nanoparticle Spectroscopy (AC-SINS)
Gold nanoparticles (Ted Pella) were exchanged into water and an 80/20 (v/v) captureantibody/non-capture antibody mixture (Jackson Immuno Research Labs, West Grove,PA, USA) was exchange into 20 mM Sodium Acetate pH 4.3. Then, 1 mL of gold nanopar-ticles were incubated overnight with 100 µL of antibody mixture. Gold nanoparticleswere then pelleted by centrifugation and supernatant was decanted to achieve a finalvolume of 50 µL, followed by gentle mixing. Then, 5 µL of this concentrated nanoparticlesuspension was added to 45 µL PBS solution containing 0.05 mg/mL of antibody of interestin a 384-well clear plate (Fisher Scientific, Waltham, MA, USA) and incubated at roomtemperature for 2 h in the dark. The plate was then quickly spun down at 3000 rpm andscanned from 450 to 650 nm using an EPOCH/2 Microplate reader from BioTek (Winooski,VT, USA). Values reported are averages of duplicate wells and are sample red shift wave-lengths at maximum absorbance subtracting the blank reference (PBS only). Greater redshifts indicate increased self-interaction.
2.4. Viscosity Measurements
Viscosity was performed as previously described [6]. Briefly, dynamic viscositieswere measured using a VROC initium (Rheosense, San Ramon, CA, USA) and processedusing built-in software. Each reported viscosity value in Centipoise (cP) was the averageof 10 measurements performed at 25 ◦C. For samples at 100 mg/mL, duplicate sampleinjections were performed.
2.5. Modeling
All modeling, including homology modeling, surface patch analysis, and protein–protein docking, was performed using MOE 2019.0102 (Chemical Computing Group,Montreal, QC, Canada), as described below. All calculations were performed using theAmber10:EHT force-field.
Homology models were produced for both F104 and W104 Fabs. The frameworkregions were modeled using the human antibody structure with highest sequence identity(PDB ID: 3sqo). Light chain CDR1, CDR2, and CDR3 were modeled using antibody
Antibodies 2021, 10, 8 5 of 20
fragment structures with PDB ID’s of 5ken, 4 × 80, and 1 × 4, with sequence identitiesof 82%, 100%, and 78%, respectively. Heavy chain CDR1 and CDR2 were modeled usinga structure with PDB ID of 5gs2, with sequence identities of 80% and 71%, respectively.Modeling of HC-CDR3 is known to be more challenging due to higher sequence variationand flexibility. Here, we used the three structural templates with highest sequence identity,60% (PDB IDs of 1jgu, 1dbj, and 3ixt). The three homology models produced by MOE hadsimilar loop conformations and the positioning of the heavy chain 104 residue, and so themodel based on the 3ixt template, which has a Phe at the 104 position, was selected for theF104 Fab. For the W104 Fab, we used an identical approach but selected the 1dbj templatefor HC-CDR3 because it has a Trp at the heavy chain 104 position.
Surface patch analysis was performed in MOE on homology models of the F104 andW104 Fabs, using the default potential threshold value of 0.09 kcal/mol.
Protein–protein docking, as implemented in MOE, was used to model the self-interactionof the F104 Fab. The approach uses a coarse-grained representation for initial docking,followed by the refinement of docking poses using an all-atom representation. Docking waslimited to the CDR regions, included side-chain flexibility, and used a docking potentialthat includes an extra term favoring the burial of hydrophobic patches identified by thesurface patch analysis. This resulted in 94 docked models, which were then clustered bybinding epitopes. The largest cluster identified by this method included 14 models andinvolved all four VL CDR residues and at least three of the five VH CDR residues of thelargest hydrophobic patch. The 14 docked poses were visually inspected and found to clusterinto four binding modes.
2.6. Isothermal Titration Calorimetry (ITC)
Isothermal titration calorimetry (ITC) was conducted using a MicroCal PEAQ-ITCAutomated (Malvern Inc., Westborough, MA, USA) to determine the dissociation constantof antibody dimers. Fabs were prepared in PBS pH 7.4. The W104 Fab (371 µM) or F104Fab (300 µM) in the ITC syringe was titrated into the matching buffer in the ITC cell at25 ◦C. Reference power was set to 10 µcal/sec with initial delay of 60 s and stirring speedof 750 rpm. Injection volume was 0.4 µL for the first injection and 4 µL for subsequentinjections and 13 total injections were made. Injection duration was 0.8 s for the firstinjection and 6 s for subsequent injections with 150 s spacing. Baseline was adjustedusing buffer–buffer titration. Data analysis was done using MicroCal PEAQ-ITC AnalysisSoftware using the dissociation model.
2.7. Surface Plasmon Resonance (BIAcore)
Binding affinity of Fab against captured mAb was determined by surface plasmonresonance (SPR) on a BIAcore T200 (Cytiva). The running buffer, 10 mM HEPES, 150 mMNaCl, 0.05% v/v Surfactant P20, 3 mM EDTA, pH 7.4 (HBS-EP+, Cytiva, Marlborough,MA, USA) was used for immobilization and reagent dilutions. All binding kinetics weremeasured at 25 ◦C.
For each injection cycle, mAbs were first captured in flow cells 2, 3 and 4 with ananti-human Fc antibody (Human Antibody Capture Kit, Cytiva, Marlborough, MA, USA)immobilized to the sensor chip (Series S CM5, Cytiva, Marlborough, MA, USA). Flow cell1 with no captured mAb was used as a reference. Serial dilutions of the Fab, ranging inconcentration from 1 to 32 µM, and buffer blanks were injected in multiple cycles over thecaptured mAbs and reference surfaces for a 60 s association followed by a 180 s dissociation.The surfaces were regenerated with a 30 s injection of 3 M MgCl2 after each cycle.
Double referenced titration data were globally fit to a 1:1 Langmuir binding model todetermine the association rate constant, ka (1/M·s), and the dissociation rate constant, kd(1/s), using the BIAcore T200 Evaluation Software version 2.0 (Cytiva, Marlborough, MA,USA). The equilibrium dissociation constant was calculated as KD (M) = kd/ka.

Antibodies 2021, 10, 8 6 of 20
3. Results3.1. Viscosity Characterization for Two Antibody Variants
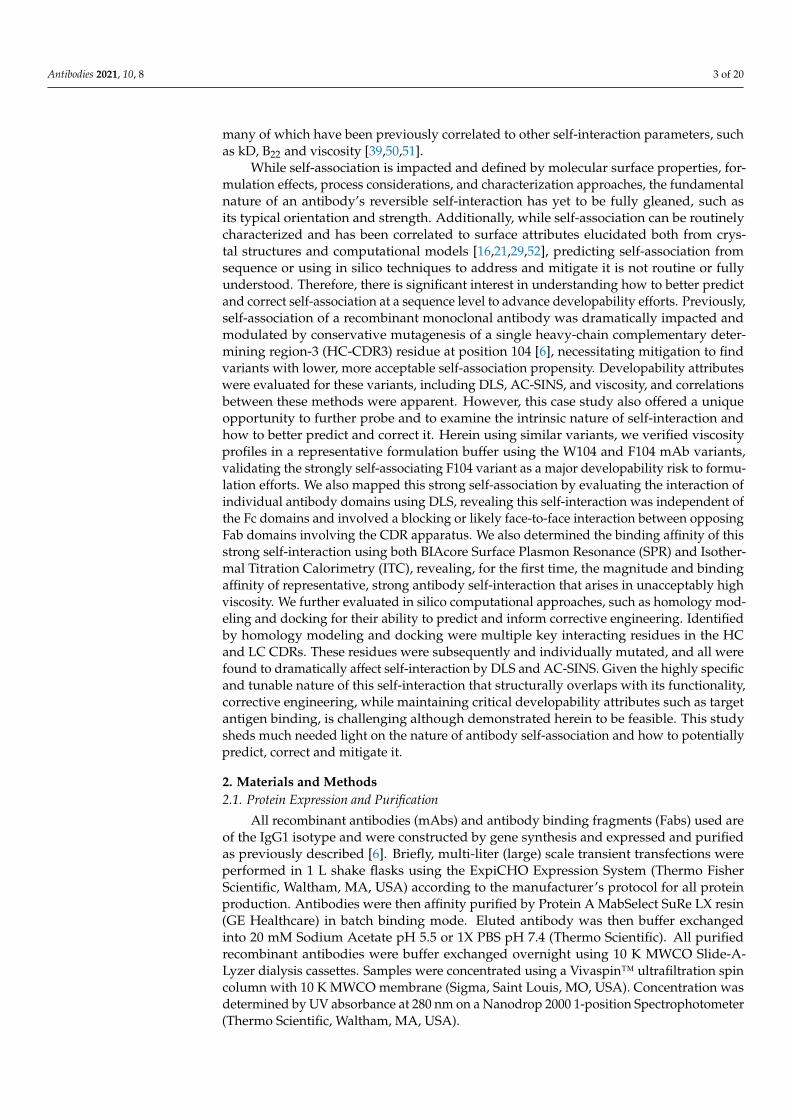
Previously, a strongly self-associating mAb was reported where mutagenesis at asingle position, HC-CDR3-104, dramatically affected the degree of self-interaction [6]. InFigure 1A, viscosity curves up to 100 mg/mL in a representative low pH and ionic strengthformulation buffer (20 mM Sodium Acetate pH 5.5) are plotted for both the HC-W104 andHC-F104 variants. While the W104 variant has low viscosity up to 100 mg/mL (4.2 cP), theF104 variant increases exponentially up to 58.3 cP. At 100 mg/mL in PBS pH 7.4, viscositieswere 4.8 and 43.7 cP, respectively, for the HC-W104 and HC-F104 variants (Figure 1B).These measured viscosities in both acetate and PBS buffers are over 2 times higher thanwhat would be considered a typical allowable limit for either downstream processingor injectability [54]. Such strong and robust self-interaction rendered this F104 variantundevelopable, especially for a higher formulation concentration (>100 mg/mL). Since theHC-F104 variant had unacceptably high viscosity in both acetate and PBS buffers, furtherevaluation of the self-interaction herein focused on PBS formulations for all variants toremain consistent across all biophysical and analytical assays.
Antibodies 2021, 10, x FOR PEER REVIEW 6 of 19
Double referenced titration data were globally fit to a 1:1 Langmuir binding model
to determine the association rate constant, ka (1/M·s), and the dissociation rate constant,
kd (1/s), using the BIAcore T200 Evaluation Software version 2.0 (Cytiva, Marlborough,
MA, USA). The equilibrium dissociation constant was calculated as KD (M) = kd/ka.
3. Results
3.1. Viscosity Characterization for Two Antibody Variants
Previously, a strongly self-associating mAb was reported where mutagenesis at a
single position, HC-CDR3-104, dramatically affected the degree of self-interaction [6]. In
Figure 1A, viscosity curves up to 100 mg/mL in a representative low pH and ionic strength
formulation buffer (20 mM Sodium Acetate pH 5.5) are plotted for both the HC-W104 and
HC-F104 variants. While the W104 variant has low viscosity up to 100 mg/mL (4.2 cP), the
F104 variant increases exponentially up to 58.3 cP. At 100 mg/mL in PBS pH 7.4, viscosities
were 4.8 and 43.7 cP, respectively, for the HC-W104 and HC-F104 variants (Figure 1B).
These measured viscosities in both acetate and PBS buffers are over 2 times higher than
what would be considered a typical allowable limit for either downstream processing or
injectability [54]. Such strong and robust self-interaction rendered this F104 variant unde-
velopable, especially for a higher formulation concentration (>100 mg/mL). Since the HC-
F104 variant had unacceptably high viscosity in both acetate and PBS buffers, further eval-
uation of the self-interaction herein focused on PBS formulations for all variants to remain
consistent across all biophysical and analytical assays.
Figure 1. (A) Viscosity (dynamic) versus mAb concentration for W104 (blue circles) and F104 (orange circles) IgG1 mAb
variants in 20 mM Sodium Acetate pH 5.5 from 25–100 mg/mL. Each viscosity curve was fit to the equation y = Aekx, where
the exponential factor (k) and R2 of the fit are given for each variant. (B) Table of viscosities for the two W104 and F104
mAb variants in both 20 mM Acetate pH 5.5 and PBS pH 7.4 at 100 mg/mL. * Previously reported [6].
3.2. Biophysical Characterization and Modeling of Antibody Self-Association Using Individual
Antibody Domains for Two Antibody Variants
To better understand the nature of this self-association, individual domains consist-
ing of Fab, Fab’2, and mAb, along with the conserved IgG1 Fc, were prepared for both
F104 and W104 variants. In PBS pH 7.4, preparations ranging from 1–10 mg/mL of each
construct and variant were prepared and evaluated by DLS. In Figure 2A, construct MW
(based on sequence), kD obtained by DLS, and hydrodynamic radius (Rh) at both 1 and 10
mg/mL, are tabulated. As expected, the F104 mAb self-associated efficiently and a highly
negative kD of −44.6 mL/g was obtained. By comparison, the HC-W104 mAb variant,
while structurally similar to the HC-F104 mAb, has a significantly less negative kD of
−15.3 mL/g. The F104 Fab’2 had a similar highly negative kD of −44.8 mL/g versus its mAb
counterpart. This similarity alone is strong evidence that the Fab domains are self-inter-
acting independent of the Fc domain, and further, in Figure 2B, a 1:1 mixture of IgG1 F104
Fab (kD = −9.5 mL/g) and IgG1-Fc (kD = −2.7 mL/g) does not increase self-interaction (or
decrease kD), but rather an intermediate kD value results (−8.0 mL/g), supporting the idea
that the Fab and Fc domains are not directly interacting.
Figure 1. (A) Viscosity (dynamic) versus mAb concentration for W104 (blue circles) and F104 (orange circles) IgG1 mAbvariants in 20 mM Sodium Acetate pH 5.5 from 25–100 mg/mL. Each viscosity curve was fit to the equation y = Aekx, wherethe exponential factor (k) and R2 of the fit are given for each variant. (B) Table of viscosities for the two W104 and F104mAb variants in both 20 mM Acetate pH 5.5 and PBS pH 7.4 at 100 mg/mL. * Previously reported [6].
3.2. Biophysical Characterization and Modeling of Antibody Self-Association Using IndividualAntibody Domains for Two Antibody Variants
To better understand the nature of this self-association, individual domains consistingof Fab, Fab’2, and mAb, along with the conserved IgG1 Fc, were prepared for both F104and W104 variants. In PBS pH 7.4, preparations ranging from 1–10 mg/mL of eachconstruct and variant were prepared and evaluated by DLS. In Figure 2A, construct MW(based on sequence), kD obtained by DLS, and hydrodynamic radius (Rh) at both 1 and10 mg/mL, are tabulated. As expected, the F104 mAb self-associated efficiently and ahighly negative kD of −44.6 mL/g was obtained. By comparison, the HC-W104 mAbvariant, while structurally similar to the HC-F104 mAb, has a significantly less negative kDof −15.3 mL/g. The F104 Fab’2 had a similar highly negative kD of −44.8 mL/g versusits mAb counterpart. This similarity alone is strong evidence that the Fab domains areself-interacting independent of the Fc domain, and further, in Figure 2B, a 1:1 mixtureof IgG1 F104 Fab (kD = −9.5 mL/g) and IgG1-Fc (kD = −2.7 mL/g) does not increaseself-interaction (or decrease kD), but rather an intermediate kD value results (−8.0 mL/g),supporting the idea that the Fab and Fc domains are not directly interacting.

Antibodies 2021, 10, 8 7 of 20Antibodies 2021, 10, x FOR PEER REVIEW 7 of 19
Figure 2. Dynamic Light Scattering (DLS) results for various constructs and HC-104 variants. (A) Tabulated molecular
weight (MW), known from sequence, and interaction parameter (kD) and hydrodynamic radius (Rh) obtained by DLS for
both W104 and F104 variants in the Fab, Fab’2, and mAb forms. Highly negative kDs and large Rh values are in red font.
(B) kD tabulated for Fc and Fab constructs for W104 and F104, and Fab/Fc mixtures (1:1 molar ratio). (C) Calculated Mw
values derived from measured diffusional coefficients plotted against concentration for Fab, Fab’2, and mAb constructs
for F104 (orange symbols) and W104 (blue symbols). Fab, Fab’2, and mAb are designated as diamonds, squares, and open
circles, respectively. (D) Calculated Mw values derived from measured diffusional coefficients for Fab forms only of W104
(blue diamonds) and F104 (orange squares).
Interestingly, the F104 variant, which has a high propensity to self-interact, has a
much more negative kD in the Fab’2 and mAb forms than the Fab alone (−9.5 mL/g). Like-
wise, the highly negative kDs for Fab’2 and Mab constructs yield huge, reversible com-
plexes by DLS, resulting in Rh values of 14.4 and 16.2 nm at 10 mg/mL in PBS, respectively.
Since the sizes of these complexes are not the result of aggregation driven by unfolding
(aggregation measured by SE-UPLC is not significant, See Table S1) and are concentration
dependent, these are reversible complexes formed through the participation of fully
folded, native antibody or antibody domains consistent of typical self-interaction phe-
nomena [28]. The sizes of the complexes formed at 10 mg/mL, a relatively low formulation
concentration, for the F104 Fab’2 and mAb constructs are so large that molecular weights
of 1714 and 2290 kDa (Figure 2C) are calculated from the Rh values (assuming a standard
spherical model), respectively. This corresponds to an approximate average size of the 17
non-covalently associated units for the Fab’2 construct and 16 non-covalently associated
units for the mAb construct at 10 mg/mL. However, in the case of the F104 Fab construct,
only a slightly negative kD of −9.5 mL/g is measured, and Rh modestly increases from 3.9
nm to only 4.3 nm in the 1–10 mg/mL concentration range. At 6 mg/mL, a concentration
where size appears to have already plateaued, a complex with a Mw of 95 kDa is calcu-
lated, which approximates a Fab dimer. This highlighted in Figure 2D.
While the Fab and Fab’2 surely interact in the same manner independent of the Fc
domain, they result in entirely different complexes at the same concentrations. From this
result, we hypothesized that the interaction was a face-to-face blocking interaction involv-
ing the variable domains or HC/LC CDR network, which in the case of the monovalent
Fab, would block any subsequent interactions. In the bivalent Fab’2 or mAb forms, how-
ever, one face-to-face interaction involving two molecules would still leave two available
Fab domains for self-interaction and further self-oligomerization, and this holds true as
the polymerization continues to arise in larger complexes in a concentration-dependent
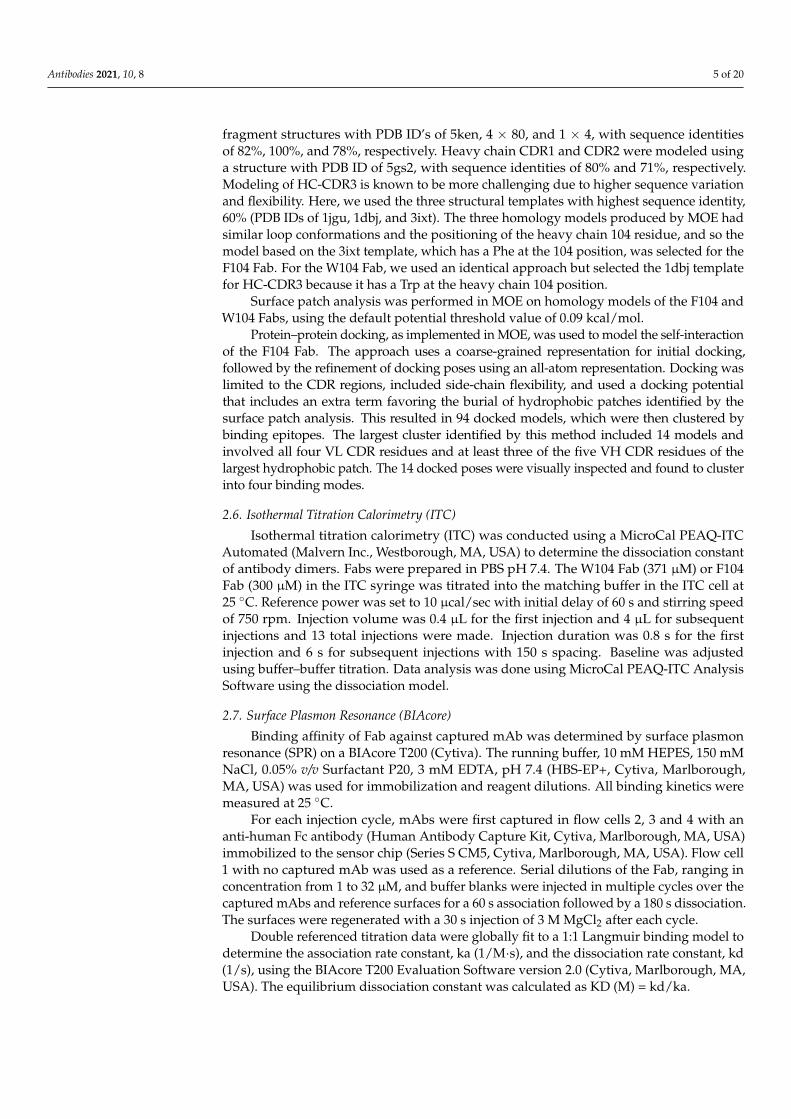
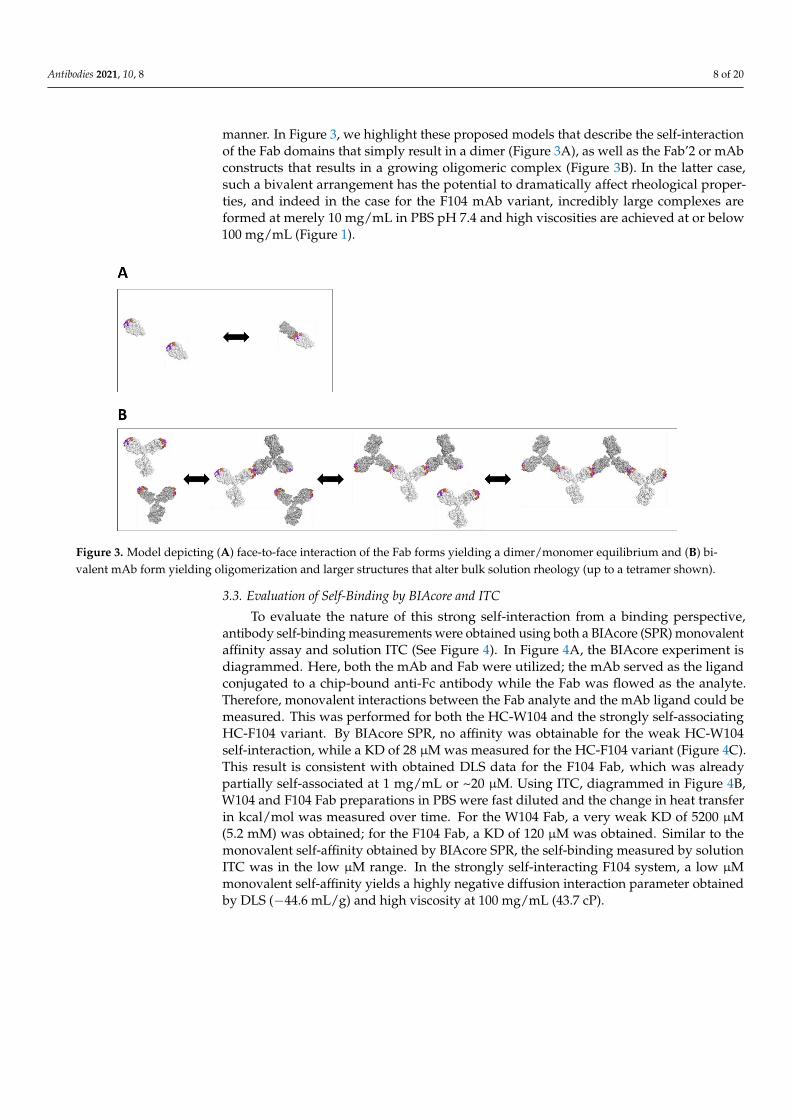
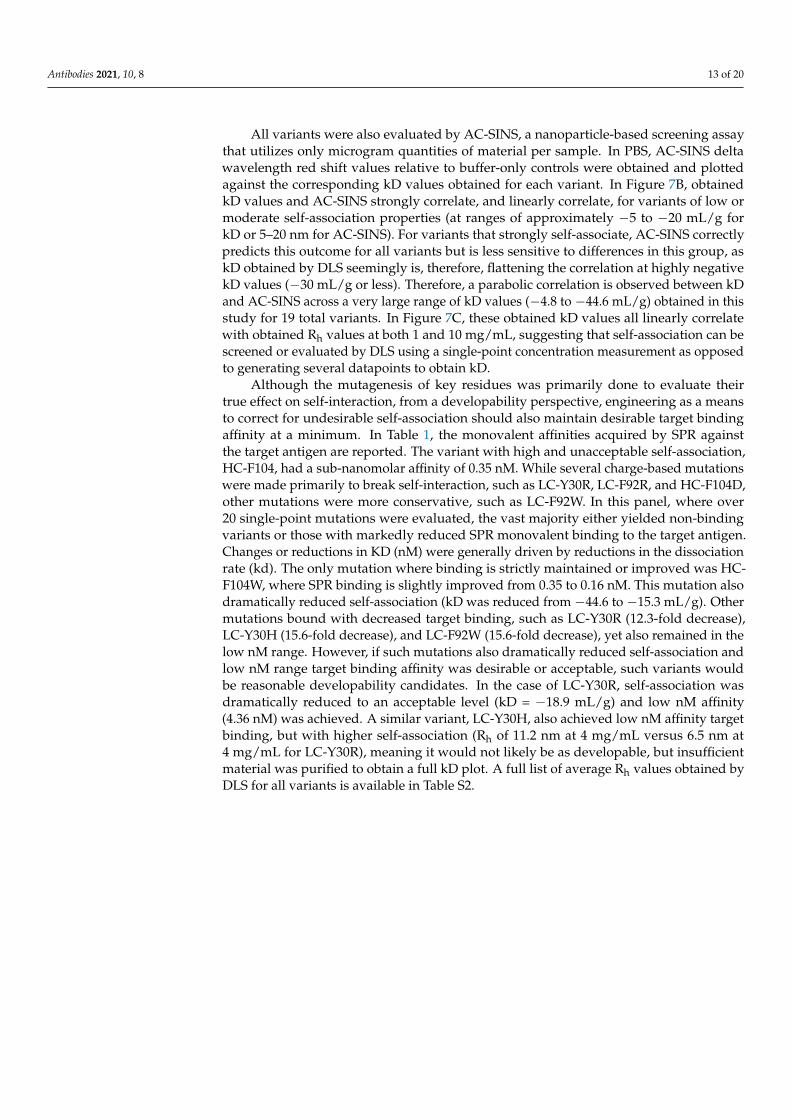
manner. In Figure 3, we highlight these proposed models that describe the self-interaction
of the Fab domains that simply result in a dimer (Figure 3A), as well as the Fab’2 or mAb
Figure 2. Dynamic Light Scattering (DLS) results for various constructs and HC-104 variants. (A) Tabulated molecularweight (MW), known from sequence, and interaction parameter (kD) and hydrodynamic radius (Rh) obtained by DLS forboth W104 and F104 variants in the Fab, Fab’2, and mAb forms. Highly negative kDs and large Rh values are in red font.(B) kD tabulated for Fc and Fab constructs for W104 and F104, and Fab/Fc mixtures (1:1 molar ratio). (C) Calculated Mw
values derived from measured diffusional coefficients plotted against concentration for Fab, Fab’2, and mAb constructs forF104 (orange symbols) and W104 (blue symbols). Fab, Fab’2, and mAb are designated as diamonds, squares, and opencircles, respectively. (D) Calculated Mw values derived from measured diffusional coefficients for Fab forms only of W104(blue diamonds) and F104 (orange squares).
Interestingly, the F104 variant, which has a high propensity to self-interact, has a muchmore negative kD in the Fab’2 and mAb forms than the Fab alone (−9.5 mL/g). Likewise,the highly negative kDs for Fab’2 and Mab constructs yield huge, reversible complexes byDLS, resulting in Rh values of 14.4 and 16.2 nm at 10 mg/mL in PBS, respectively. Since thesizes of these complexes are not the result of aggregation driven by unfolding (aggregationmeasured by SE-UPLC is not significant, See Table S1) and are concentration dependent,these are reversible complexes formed through the participation of fully folded, nativeantibody or antibody domains consistent of typical self-interaction phenomena [28]. Thesizes of the complexes formed at 10 mg/mL, a relatively low formulation concentration,for the F104 Fab’2 and mAb constructs are so large that molecular weights of 1714 and2290 kDa (Figure 2C) are calculated from the Rh values (assuming a standard sphericalmodel), respectively. This corresponds to an approximate average size of the 17 non-covalently associated units for the Fab’2 construct and 16 non-covalently associated unitsfor the mAb construct at 10 mg/mL. However, in the case of the F104 Fab construct, only aslightly negative kD of −9.5 mL/g is measured, and Rh modestly increases from 3.9 nm toonly 4.3 nm in the 1–10 mg/mL concentration range. At 6 mg/mL, a concentration wheresize appears to have already plateaued, a complex with a Mw of 95 kDa is calculated, whichapproximates a Fab dimer. This highlighted in Figure 2D.
While the Fab and Fab’2 surely interact in the same manner independent of the Fcdomain, they result in entirely different complexes at the same concentrations. From thisresult, we hypothesized that the interaction was a face-to-face blocking interaction involv-ing the variable domains or HC/LC CDR network, which in the case of the monovalentFab, would block any subsequent interactions. In the bivalent Fab’2 or mAb forms, how-ever, one face-to-face interaction involving two molecules would still leave two availableFab domains for self-interaction and further self-oligomerization, and this holds true asthe polymerization continues to arise in larger complexes in a concentration-dependent
Antibodies 2021, 10, 8 8 of 20
manner. In Figure 3, we highlight these proposed models that describe the self-interactionof the Fab domains that simply result in a dimer (Figure 3A), as well as the Fab’2 or mAbconstructs that results in a growing oligomeric complex (Figure 3B). In the latter case,such a bivalent arrangement has the potential to dramatically affect rheological proper-ties, and indeed in the case for the F104 mAb variant, incredibly large complexes areformed at merely 10 mg/mL in PBS pH 7.4 and high viscosities are achieved at or below100 mg/mL (Figure 1).
Antibodies 2021, 10, x FOR PEER REVIEW 8 of 19
constructs that results in a growing oligomeric complex (Figure 3B). In the latter case, such
a bivalent arrangement has the potential to dramatically affect rheological properties, and
indeed in the case for the F104 mAb variant, incredibly large complexes are formed at
merely 10 mg/mL in PBS pH 7.4 and high viscosities are achieved at or below 100 mg/mL
(Figure 1).
Figure 3. Model depicting (A) face-to-face interaction of the Fab forms yielding a dimer/monomer equilibrium and (B) biva-
lent mAb form yielding oligomerization and larger structures that alter bulk solution rheology (up to a tetramer shown).
3.3. Evaluation of Self-Binding by BIAcore and ITC
To evaluate the nature of this strong self-interaction from a binding perspective, an-
tibody self-binding measurements were obtained using both a BIAcore (SPR) monovalent
affinity assay and solution ITC (See Figure 4). In Figure 4A, the BIAcore experiment is
diagrammed. Here, both the mAb and Fab were utilized; the mAb served as the ligand
conjugated to a chip-bound anti-Fc antibody while the Fab was flowed as the analyte.
Therefore, monovalent interactions between the Fab analyte and the mAb ligand could be
measured. This was performed for both the HC-W104 and the strongly self-associating
HC-F104 variant. By BIAcore SPR, no affinity was obtainable for the weak HC-W104 self-
interaction, while a KD of 28 μM was measured for the HC-F104 variant (Figure 4C). This
result is consistent with obtained DLS data for the F104 Fab, which was already partially
self-associated at 1 mg/mL or ~20 μM. Using ITC, diagrammed in Figure 4B, W104 and
F104 Fab preparations in PBS were fast diluted and the change in heat transfer in kcal/mol
was measured over time. For the W104 Fab, a very weak KD of 5200 μM (5.2 mM) was
obtained; for the F104 Fab, a KD of 120 μM was obtained. Similar to the monovalent self-
affinity obtained by BIAcore SPR, the self-binding measured by solution ITC was in the
low μM range. In the strongly self-interacting F104 system, a low μM monovalent self-
affinity yields a highly negative diffusion interaction parameter obtained by DLS (−44.6
mL/g) and high viscosity at 100 mg/mL (43.7 cP).
Figure 3. Model depicting (A) face-to-face interaction of the Fab forms yielding a dimer/monomer equilibrium and (B) bi-valent mAb form yielding oligomerization and larger structures that alter bulk solution rheology (up to a tetramer shown).
3.3. Evaluation of Self-Binding by BIAcore and ITC
To evaluate the nature of this strong self-interaction from a binding perspective,antibody self-binding measurements were obtained using both a BIAcore (SPR) monovalentaffinity assay and solution ITC (See Figure 4). In Figure 4A, the BIAcore experiment isdiagrammed. Here, both the mAb and Fab were utilized; the mAb served as the ligandconjugated to a chip-bound anti-Fc antibody while the Fab was flowed as the analyte.Therefore, monovalent interactions between the Fab analyte and the mAb ligand could bemeasured. This was performed for both the HC-W104 and the strongly self-associatingHC-F104 variant. By BIAcore SPR, no affinity was obtainable for the weak HC-W104self-interaction, while a KD of 28 µM was measured for the HC-F104 variant (Figure 4C).This result is consistent with obtained DLS data for the F104 Fab, which was alreadypartially self-associated at 1 mg/mL or ~20 µM. Using ITC, diagrammed in Figure 4B,W104 and F104 Fab preparations in PBS were fast diluted and the change in heat transferin kcal/mol was measured over time. For the W104 Fab, a very weak KD of 5200 µM(5.2 mM) was obtained; for the F104 Fab, a KD of 120 µM was obtained. Similar to themonovalent self-affinity obtained by BIAcore SPR, the self-binding measured by solutionITC was in the low µM range. In the strongly self-interacting F104 system, a low µMmonovalent self-affinity yields a highly negative diffusion interaction parameter obtainedby DLS (−44.6 mL/g) and high viscosity at 100 mg/mL (43.7 cP).

Antibodies 2021, 10, 8 9 of 20Antibodies 2021, 10, x FOR PEER REVIEW 9 of 19
Figure 4. Schematics diagramming (A) BIAcore Surface Plasmon Resonance (SPR) format where
the mAb serves as the ligand and the Fab of interest, shown here as an equilibrium of monomer
and dimer forms, as the analyte. (B) Isothermal Calorimetry (ITC) format (in solution) where the
Fab of interest is shown as an equilibrium of Fab dimer and monomer. In the experiment, the Fab
is dimerized and is fast diluted to initially favor the monomer. (C) Measured affinities or KDs
(nM) are tabulated for both approaches, including kd and ka for SPR.
3.4. Homology Modeling by Patch Analysis and Self-Docking
We performed structure-based modeling studies to explore potentially predictive
and corrective tools, as well as in an effort to understand the dramatic difference in self-
association observed between the F104 and W104 antibodies. Homology models of the
F104 and W104 Fabs were built and subsequently used for computing hydrophobic and
charged patches. Attraction between complementary patches, such as two hydrophobic
patches or two oppositely charged ionic patches, can drive self-interaction and aggrega-
tion [29].
Analysis of the F104 Fab model identified a large hydrophobic patch with a surface
area of 250 Å 2 that includes HC-F104 itself and eight additional residues in the LC and HC
CDR regions (see Figure 5). This patch includes residues from multiple CDR loops in both
the HC and LC, including HC-CDR3, LC-CDR1, and LC-CDR3. In evaluating this promi-
nent hydrophobic patch, the top residues in order of contribution were HC-F104, LC-F92,
LC-Y30, and LC-Y32.
Figure 4. Schematics diagramming (A) BIAcore Surface Plasmon Resonance (SPR) format where themAb serves as the ligand and the Fab of interest, shown here as an equilibrium of monomer anddimer forms, as the analyte. (B) Isothermal Calorimetry (ITC) format (in solution) where the Fabof interest is shown as an equilibrium of Fab dimer and monomer. In the experiment, the Fab isdimerized and is fast diluted to initially favor the monomer. (C) Measured affinities or KDs (nM) aretabulated for both approaches, including kd and ka for SPR.
3.4. Homology Modeling by Patch Analysis and Self-Docking
We performed structure-based modeling studies to explore potentially predictiveand corrective tools, as well as in an effort to understand the dramatic difference in self-association observed between the F104 and W104 antibodies. Homology models of the F104and W104 Fabs were built and subsequently used for computing hydrophobic and chargedpatches. Attraction between complementary patches, such as two hydrophobic patches ortwo oppositely charged ionic patches, can drive self-interaction and aggregation [29].
Analysis of the F104 Fab model identified a large hydrophobic patch with a surfacearea of 250 Å2 that includes HC-F104 itself and eight additional residues in the LC andHC CDR regions (see Figure 5). This patch includes residues from multiple CDR loops inboth the HC and LC, including HC-CDR3, LC-CDR1, and LC-CDR3. In evaluating thisprominent hydrophobic patch, the top residues in order of contribution were HC-F104,LC-F92, LC-Y30, and LC-Y32.
Antibodies 2021, 10, x FOR PEER REVIEW 9 of 19
Figure 4. Schematics diagramming (A) BIAcore Surface Plasmon Resonance (SPR) format where
the mAb serves as the ligand and the Fab of interest, shown here as an equilibrium of monomer
and dimer forms, as the analyte. (B) Isothermal Calorimetry (ITC) format (in solution) where the
Fab of interest is shown as an equilibrium of Fab dimer and monomer. In the experiment, the Fab
is dimerized and is fast diluted to initially favor the monomer. (C) Measured affinities or KDs
(nM) are tabulated for both approaches, including kd and ka for SPR.
3.4. Homology Modeling by Patch Analysis and Self-Docking
We performed structure-based modeling studies to explore potentially predictive
and corrective tools, as well as in an effort to understand the dramatic difference in self-
association observed between the F104 and W104 antibodies. Homology models of the
F104 and W104 Fabs were built and subsequently used for computing hydrophobic and
charged patches. Attraction between complementary patches, such as two hydrophobic
patches or two oppositely charged ionic patches, can drive self-interaction and aggrega-
tion [29].
Analysis of the F104 Fab model identified a large hydrophobic patch with a surface
area of 250 Å 2 that includes HC-F104 itself and eight additional residues in the LC and HC
CDR regions (see Figure 5). This patch includes residues from multiple CDR loops in both
the HC and LC, including HC-CDR3, LC-CDR1, and LC-CDR3. In evaluating this promi-
nent hydrophobic patch, the top residues in order of contribution were HC-F104, LC-F92,
LC-Y30, and LC-Y32.
Figure 5. Cont.

Antibodies 2021, 10, 8 10 of 20Antibodies 2021, 10, x FOR PEER REVIEW 10 of 19
.
Figure 5. Fab homology models. (A) Model of HC:F104 Fab with VL in teal, VH in blue, VL CDR1-
3 in purple, VH CDRs 1–2 in orange, VH CDR3 in red, and F104 in red spacefill. (B) Surface patch
analysis of HC-F104 Fab homology model with hydrophobic patches in green, positive patches in
blue, and negative patches in red. (C,D) Top view of CDR region of HC-F104 Fab and HC-W104
Fab homology models, respectively, rendered in Pymol. Left, ribbon depiction with F104 or W104
highlighted in red spacefill. Right, patch analysis rendered in MOE. F104 and W104 are circled
with a dashed yellow ellipse.
Analysis of the W104 Fab homology model identified two hydrophobic patches in
the CDR region with areas of 230 Å 2 and 60 Å 2. While the total hydrophobic patch size in
the W104 antibody CDR region is larger than that of the F104 antibody, at 290 Å 2 versus
250 Å 2, the larger side chain of W104 and the presence of a polar NH moiety on the W104
side chain results in a disruption of the hydrophobic patch, which alone may contribute
to a reduction in self-interaction in addition to changes in self-complementarity. Further,
the larger W104 patch qualitatively differs from the single F104 patch, appearing more
branched and discontinuous. In evaluating these patches in the W104 model, HC-W104,
LC-F92, LC-Y30, and LC-Y32 are also found to be the top contributors to the overall hy-
drophobicity.
To generate hypotheses on specific molecular interactions contributing to the ob-
served self-interaction, we performed protein–protein docking using two modeled F104
Fabs. Docking identified four plausible models for the interaction, which are shown in
Figure 6. All models present a face-to-face interaction involving the HC- and LC-CDR
apparatus. We prioritized model #3 because it has the largest interaction interface between
the two Fabs. The model involves a nearly symmetric interface, with LC-Y30 and LC-F92
of one Fab forming stacking and hydrophobic interactions with HC-F104 of the opposing
Fab. We note that docking with the W104 Fab model resulted in similar results, and so
docking by itself is unable to rank order the two mutants.
Figure 5. Fab homology models. (A) Model of HC:F104 Fab with VL in teal, VH in blue, VL CDR1-3in purple, VH CDRs 1–2 in orange, VH CDR3 in red, and F104 in red spacefill. (B) Surface patchanalysis of HC-F104 Fab homology model with hydrophobic patches in green, positive patches inblue, and negative patches in red. (C,D) Top view of CDR region of HC-F104 Fab and HC-W104Fab homology models, respectively, rendered in Pymol. Left, ribbon depiction with F104 or W104highlighted in red spacefill. Right, patch analysis rendered in MOE. F104 and W104 are circled with adashed yellow ellipse.
Analysis of the W104 Fab homology model identified two hydrophobic patches in theCDR region with areas of 230 Å2 and 60 Å2. While the total hydrophobic patch size in theW104 antibody CDR region is larger than that of the F104 antibody, at 290 Å2 versus 250 Å2,the larger side chain of W104 and the presence of a polar NH moiety on the W104 side chainresults in a disruption of the hydrophobic patch, which alone may contribute to a reductionin self-interaction in addition to changes in self-complementarity. Further, the largerW104 patch qualitatively differs from the single F104 patch, appearing more branched anddiscontinuous. In evaluating these patches in the W104 model, HC-W104, LC-F92, LC-Y30,and LC-Y32 are also found to be the top contributors to the overall hydrophobicity.
To generate hypotheses on specific molecular interactions contributing to the observedself-interaction, we performed protein–protein docking using two modeled F104 Fabs.Docking identified four plausible models for the interaction, which are shown in Figure 6.All models present a face-to-face interaction involving the HC- and LC-CDR apparatus.We prioritized model #3 because it has the largest interaction interface between the twoFabs. The model involves a nearly symmetric interface, with LC-Y30 and LC-F92 of oneFab forming stacking and hydrophobic interactions with HC-F104 of the opposing Fab. Wenote that docking with the W104 Fab model resulted in similar results, and so docking byitself is unable to rank order the two mutants.

Antibodies 2021, 10, 8 11 of 20Antibodies 2021, 10, x FOR PEER REVIEW 11 of 19
Figure 6. Fab protein-protein docking results. (A) Four poses seen in the top epitope cluster. (B)
Details of model #3, a model for self-interaction supported by experimental data.
3.5. Mutagenesis of Residues Revealed by Homology Model Patch Analysis and Self-Docking
Position HC-104 clearly has a large impact on self-interaction and viscosity (Figures
1 and 2). In addition to this position, the preferred homology model revealed two addi-
tional residues involved in a prominent hydrophobic patch, LC-Y30 and LC-F92. A fourth
residue, LC-Y32, was also identified but not was further evaluated in this study. To verify
that these residues do indeed affect self-association in solution, various single mutants at
positions LC-Y30 and LC-F92 were engineered on the strongly self-associating HC-F104
variant followed by expression and purification. Additional single point HC-104 mutants
were also evaluated. Using purified variants, preparations of 1–10 mg/mL in PBS were
evaluated by DLS. In Figure 7A, kD values obtained by DLS for all variants are plotted.
Clearly, mutations at all sites had a significant impact on self-association, and some seem-
ingly disrupted self-interaction to baseline kD values, similar to weakly associating W104
Fabs (−4.5 mL/g) and mAbs (−15.3 mL/g), as summarized in Figure 2A. These variants
include LC-Y30D (−7.9 mL/g), LC-F92R (−10.8 mL/g), and HC-W104K (−4.8 mL/g), all of
whose charged-based mutations were expected to disrupt the self-binding interface and
significantly reduce the kD magnitude from the original value of −44.6 mL/g. Other mu-
tations at position HC-104 to Arg and Asp also dramatically reduced the magnitude of kD
values. These variants with low and acceptable kD’s, plotted in Figure 7A, are shaded
green. Interestingly, mutagenesis to Gly at all three sites resulted in largely negative kD
values and only are slightly reduced in magnitude compared to the HC-F104 variant.
Other mutations had a moderately reducing effect on self-association (e.g., HC-F104S and
LC-F92H, shaded in black). Clearly, the self-interaction of this antibody was dramatically
attenuated by single point mutations engineered across all three sites in both the HC- and
LC-CDRs.
All variants were also evaluated by AC-SINS, a nanoparticle-based screening assay
that utilizes only microgram quantities of material per sample. In PBS, AC-SINS delta
wavelength red shift values relative to buffer-only controls were obtained and plotted
against the corresponding kD values obtained for each variant. In Figure 7B, obtained kD
values and AC-SINS strongly correlate, and linearly correlate, for variants of low or mod-
erate self-association properties (at ranges of approximately −5 to −20 mL/g for kD or 5–
20 nm for AC-SINS). For variants that strongly self-associate, AC-SINS correctly predicts
this outcome for all variants but is less sensitive to differences in this group, as kD ob-
tained by DLS seemingly is, therefore, flattening the correlation at highly negative kD
Figure 6. Fab protein-protein docking results. (A) Four poses seen in the top epitope cluster. (B) Details of model #3, amodel for self-interaction supported by experimental data.
3.5. Mutagenesis of Residues Revealed by Homology Model Patch Analysis and Self-Docking
Position HC-104 clearly has a large impact on self-interaction and viscosity(Figures 1 and 2). In addition to this position, the preferred homology model revealedtwo additional residues involved in a prominent hydrophobic patch, LC-Y30 and LC-F92.A fourth residue, LC-Y32, was also identified but not was further evaluated in this study.To verify that these residues do indeed affect self-association in solution, various singlemutants at positions LC-Y30 and LC-F92 were engineered on the strongly self-associatingHC-F104 variant followed by expression and purification. Additional single point HC-104mutants were also evaluated. Using purified variants, preparations of 1–10 mg/mL inPBS were evaluated by DLS. In Figure 7A, kD values obtained by DLS for all variants areplotted. Clearly, mutations at all sites had a significant impact on self-association, and someseemingly disrupted self-interaction to baseline kD values, similar to weakly associatingW104 Fabs (−4.5 mL/g) and mAbs (−15.3 mL/g), as summarized in Figure 2A. These vari-ants include LC-Y30D (−7.9 mL/g), LC-F92R (−10.8 mL/g), and HC-W104K (−4.8 mL/g),all of whose charged-based mutations were expected to disrupt the self-binding interfaceand significantly reduce the kD magnitude from the original value of −44.6 mL/g. Othermutations at position HC-104 to Arg and Asp also dramatically reduced the magnitudeof kD values. These variants with low and acceptable kD’s, plotted in Figure 7A, areshaded green. Interestingly, mutagenesis to Gly at all three sites resulted in largely negativekD values and only are slightly reduced in magnitude compared to the HC-F104 variant.Other mutations had a moderately reducing effect on self-association (e.g., HC-F104S andLC-F92H, shaded in black). Clearly, the self-interaction of this antibody was dramaticallyattenuated by single point mutations engineered across all three sites in both the HC-and LC-CDRs.

Antibodies 2021, 10, 8 12 of 20
Antibodies 2021, 10, x FOR PEER REVIEW 12 of 19
values (−30 mL/g or less). Therefore, a parabolic correlation is observed between kD and
AC-SINS across a very large range of kD values (−4.8 to −44.6 mL/g) obtained in this study
for 19 total variants. In Figure 7C, these obtained kD values all linearly correlate with ob-
tained Rh values at both 1 and 10 mg/mL, suggesting that self-association can be screened
or evaluated by DLS using a single-point concentration measurement as opposed to gen-
erating several datapoints to obtain kD.
Figure 7. (A) kD (mL/g) obtained by DLS (1–10 mg/mL in PBS) shown as bar plots for all variants
engineered at HC-104, LC-Y30, and LC-F92. Obtained kD values less than −30 mL/g are shaded
red bars, and those higher than −20 mL/g are shaded green. Values between −20 and −30 mL/g are
shaded black. Error bars are shown. (B) kD values obtained for all 19 interface mutants are plotted
Figure 7. (A) kD (mL/g) obtained by DLS (1–10 mg/mL in PBS) shown as bar plots for all variantsengineered at HC-104, LC-Y30, and LC-F92. Obtained kD values less than −30 mL/g are shaded redbars, and those higher than −20 mL/g are shaded green. Values between −20 and −30 mL/g areshaded black. Error bars are shown. (B) kD values obtained for all 19 interface mutants are plottedagainst corresponding ∆AC-SINS values (blue circles with error bars for each method and the R2 ofthe parabolic fit). Each data point is labeled by variant. (C) kD values obtained for all 19 interfacemutants are plotted against corresponding Rh values (nm) obtained at both 1 mg/mL (orange circles)and 10 mg/mL (blue circles) along with R2 of the linear fits.
Antibodies 2021, 10, 8 13 of 20
All variants were also evaluated by AC-SINS, a nanoparticle-based screening assaythat utilizes only microgram quantities of material per sample. In PBS, AC-SINS deltawavelength red shift values relative to buffer-only controls were obtained and plottedagainst the corresponding kD values obtained for each variant. In Figure 7B, obtainedkD values and AC-SINS strongly correlate, and linearly correlate, for variants of low ormoderate self-association properties (at ranges of approximately −5 to −20 mL/g forkD or 5–20 nm for AC-SINS). For variants that strongly self-associate, AC-SINS correctlypredicts this outcome for all variants but is less sensitive to differences in this group, askD obtained by DLS seemingly is, therefore, flattening the correlation at highly negativekD values (−30 mL/g or less). Therefore, a parabolic correlation is observed between kDand AC-SINS across a very large range of kD values (−4.8 to −44.6 mL/g) obtained in thisstudy for 19 total variants. In Figure 7C, these obtained kD values all linearly correlatewith obtained Rh values at both 1 and 10 mg/mL, suggesting that self-association can bescreened or evaluated by DLS using a single-point concentration measurement as opposedto generating several datapoints to obtain kD.
Although the mutagenesis of key residues was primarily done to evaluate theirtrue effect on self-interaction, from a developability perspective, engineering as a meansto correct for undesirable self-association should also maintain desirable target bindingaffinity at a minimum. In Table 1, the monovalent affinities acquired by SPR againstthe target antigen are reported. The variant with high and unacceptable self-association,HC-F104, had a sub-nanomolar affinity of 0.35 nM. While several charge-based mutationswere made primarily to break self-interaction, such as LC-Y30R, LC-F92R, and HC-F104D,other mutations were more conservative, such as LC-F92W. In this panel, where over20 single-point mutations were evaluated, the vast majority either yielded non-bindingvariants or those with markedly reduced SPR monovalent binding to the target antigen.Changes or reductions in KD (nM) were generally driven by reductions in the dissociationrate (kd). The only mutation where binding is strictly maintained or improved was HC-F104W, where SPR binding is slightly improved from 0.35 to 0.16 nM. This mutation alsodramatically reduced self-association (kD was reduced from −44.6 to −15.3 mL/g). Othermutations bound with decreased target binding, such as LC-Y30R (12.3-fold decrease),LC-Y30H (15.6-fold decrease), and LC-F92W (15.6-fold decrease), yet also remained in thelow nM range. However, if such mutations also dramatically reduced self-association andlow nM range target binding affinity was desirable or acceptable, such variants wouldbe reasonable developability candidates. In the case of LC-Y30R, self-association wasdramatically reduced to an acceptable level (kD = −18.9 mL/g) and low nM affinity(4.36 nM) was achieved. A similar variant, LC-Y30H, also achieved low nM affinity targetbinding, but with higher self-association (Rh of 11.2 nm at 4 mg/mL versus 6.5 nm at4 mg/mL for LC-Y30R), meaning it would not likely be as developable, but insufficientmaterial was purified to obtain a full kD plot. A full list of average Rh values obtained byDLS for all variants is available in Table S2.

Antibodies 2021, 10, 8 14 of 20
Table 1. BIAcore SPR and DLS results summary table for all variants. Tabulated are SPR KD (nM)values, the ratio of the measured KD and the HC-F104 reference KD (KD/KDref), and kD (mL/g)values obtained by DLS. The reference F104 is highlighted gray. All LC-Y30 and LC-F92 variantsare site-directed mutants of the F104 variant. The single F104W variant with comparable BIAcoreSPR KD to the reference is highlighted green. Variants with 10–20× differences in binding relativeto the variant are highlighted yellow, and those with greater than 20-fold difference in SPR bindingor non-binding (NB) are highlighted red. kD (mL/g) measured by DLS is color coded in terms ofdegree of self-association (greater than −20 mL/g, green; −20 to −29 mL/g, yellow; −30 mL/g orless, red). “NA” denotes no measurement.
Variant KD (nM) KD/KDref kD (mL/g)F104 0.35 1 −44.6
F104W 0.16 0.44 −15.3F104I 108 305 −36.9F104H 1372 3879 −38.5F104D NB NB −10.9F104K NB NB −4.8F104E NB NB −18.1F104S NB NB −20.1F104G NB NB −41.6F104R NB NB −10.7Y30R 4.36 12.3 −18.9Y30H 5.5 15.6 NAY30N 45.5 129 NAY30D 60.9 172 −7.9Y30Q 82.6 234 NAY30G 170 481 −42.9F92W 5.51 15.6 −37.4F92H 35.1 99.2 −20.7F92V 38.7 109 −21.4F92R 50.2 142 −10.8F92S 62.7 177 −31F92G 142 402 −31.3
4. Discussion
Here, strong self-interaction is observed for HC-F104 mAb constructs, resulting insignificantly high viscosities at 100 mg/mL in both low formulation pH and physiologicalpH conditions and highly negative self-interaction parameters by DLS (see Figures 1 and 2).While formulation dependence is important to self-association propensity, and why, in thecase of the HC-F104 mAb, viscosity remains high and even increases at a lower pH andionic strength (versus PBS pH 7.4) is of interest, this was not explored further in this study.Since high viscosity was found to persist in these formulations that differ by ~2 pH unitsand have different ionic strengths, we hypothesized that the self-interaction was mainlyhydrophobically driven. Additionally, since self-association was robust in PBS, a bufferthat is physiologically and process-relevant, is likely to better conformationally stabilize themolecule, and accommodates all experimental approaches herein; all further experimentalwork was performed in PBS buffer to be consistent across variants and analytical methods.
In Figure 2, it is shown by DLS measurements that individual F104 Fab and Fab’2 do-mains self-interact independent of the Fc domain. For the W104 variants, self-interaction isdramatically reduced, although a weaker self-interaction persists, and consistent with thisobservation, low viscosity up to 100 mg/mL across different buffer conditions is observed(Figure 1). For the F104 domain variants, self-association is dramatically enhanced in thebivalent mAb/Fab’2 forms versus the monovalent Fab form, since each self-interactionevent leads to additional available CDR faces to propagate oligomerization (see Figure 3).On the other hand, F104 Fab self-interaction leads to dimerization, blocking all additionalinteractions. Since the HC-CDR3-104 position greatly modulated this interaction andsubsequent oligomerization was blocked in the Fab form, a face-to-face interaction involv-

Antibodies 2021, 10, 8 15 of 20
ing the CDR regions was modeled (see Figure 3). Interestingly, similar observations werepreviously made, where rheological differences between monovalent Fab and bivalentFab’2/mAb have been observed [28,55], although herein we show specifically that the F104Fab self-dimerizes and further oligomerization is blocked. In terms of the developmentof bispecifics or multi-specifics, this implies that screening self-association in the bivalent,monospecific forms prior to formatting may not translate at all to rheological effects in themulti-specific form, which is typically monovalent for each targeting arm. This also clearlyshowcases the challenges of developing even higher order monospecific, multivalent an-tibody therapeutics (such as tetravalent), which, if appreciably self-interact, will be evenmore susceptible to high viscosity and negative rheological outcomes directly arising frominherent multi-valency.
By evaluating binding affinities by both BIAcore SPR and ITC, we see that our self-interacting F104 antibody has low µM affinity (28 µM by a monovalent SPR assay and120 µM by ITC), which appears to be largely driven by high dissociation rates (kd) incomparison to antigen binding (See Figure 4). Self-association of W104 variants are signifi-cantly weaker, and either low or non-binding is measured by ITC and SPR, respectively.For the F104 mAb, a low µM self-affinity is significant when considering that concentra-tions during process and formulation conditions may reach into the mM range, meaningthat all recombinant antibodies will be self-associated and oligomerized into large, het-erogenous structures. Therefore, we see exponentially high viscosity (43.7–58.3 cP) up to100 mg/mL (or ~700 µM), precluding higher process and formulation concentrations andfurther rendering the molecule high risk and undevelopable. This also clearly explainsthe low viscosities observed for the W104 mAb (4.5–4.8 cP, Figure 1), which self-bindsin the mM range, according to ITC. Previously, binding by ITC and BIAcore has beenevaluated for a self-interacting antibody system [56], but no affinities were obtained. Onlyrecently, self-binding affinities for strong self-interacting antibodies or antibody bindingfragments have been measured using AUC and ITC methods [21]. Similar to the resultsobtained by Schrag and coworkers for Fab variants, our obtained binding affinities for Faband/or mAb interactions were in the low µM range. However, in our study, we furthercorrelate these low µM affinities to high viscosities under typical formulation conditions,which clearly render the molecules high risk or undevelopable. Interestingly, our obtainedrange of binding affinities of 28–120 µM for the F104 Fabs are comparable to other protein–protein interactions that are biologically relevant, such as signaling proteins involved inmacromolecular complexation or homodimerization [57,58].
Patch analysis of a preferred homology model of the F104 Fab shows a prominenthydrophobic patch (250 Å2, Figure 5), which is consistent with surface areas of other anti-bodies known to self-interact [16,21]. Within this hydrophobic patch, three hydrophobic,aromatic residues are present: HC-F104, LC-Y30 and LC-F92. We clearly showed that mu-tations to all 3 sites dramatically impacted self-association characteristics. Consistent witha predominantly hydrophobic self-binding interface, charge-based mutations drasticallysuppressed self-interaction. Therefore, patch analysis of the F104 Fab correctly predictedthe hydrophobic patch primarily responsible for self-interaction and was helpful in identi-fying the residues most responsible for it. However, this same exercise reaches a similarconclusion when performed for the W104 Fab, which does not appreciably self-interact insolution. In other words, clearly the patch(es) defined by homology modeling can informwhich residues to engineer to correct for potential self-association, but by itself cannotpredict actual self-association. In addition to likely requiring a defined patch potentiallyamenable to self-binding, antibody self-complementarity is a clear requirement for self-binding that arises in negative rheological outcomes. This is well underscored by the strongpropensity of F104 mAbs or Fab’2s to self-interact, whereas a highly conservative Phe toTrp mutation exhibits a completely different outcome. Perhaps the more discontinuousnature of the patches generated for W104 offers clues to the difference in self-associationoutcomes. More likely responsible for the great differences between the W104 and F104variants is the presence of sensitive, tunable self-complementarity analogous to antibody–

Antibodies 2021, 10, 8 16 of 20
antigen interactions, where even conservative single point mutations can affect targetbinding affinities orders of magnitude [59]. In our self-interacting system, we see the largedifferences between F104 and W104 by both SPR and ITC binding, as well as by DLSand AC-SINS, highlighting how highly specific self-interaction is affected by a simpleF104 to W104 transition. Further, both these variants have sub-nM binding against thesame biological target (Table 1), therefore they are likely to exist in similar conformations.Interestingly, the mutagenesis of a similar Trp in the HC-CDR3 of another antibody hasbeen shown to dramatically affect self-association [32], highlighting the importance ofaromatic CDR residues in self-association. Other aromatic and hydrophobic CDR residueshave been reported to be involved in antibody self-association as well [21,55], underscoringthat self-association is often driven by forces beyond electrostatics.
The docking of F104 Fabs (see Methods), followed by epitope clustering, resulted in theidentification of one dominant epitope, represented by four binding modes, all involvinga face-to-face CDR interaction involving the F104 of both Fabs (Figure 6A). Previously,docking has been studied in relation to antibody–antigen or ligand binding [60,61]. In ourstudy, one particular dock model reveals an interaction involving the same patch shownto affect face-to-face self-interaction in solution (Figure 6B). We already mentioned thatself-interaction is likely to proceed by a face-to-face arrangement; docking allows us tobuild atomic models of possible specific interactions consistent with this.
Fab–Fab self-interactions have been characterized in the context of evaluating crystalcontacts of pre-existing structures of Fabs and Fab–antigen complexes, where interactionswere observed between the Fab CDR region and the Fab Framework (FW) [16,62]. Inother reports, Fab–Fc interactions that are isotype dependent have been observed [56].Additionally, Schrag and coworkers solved a crystal structure of a self-association proneFab dimer and the dimer interface was mediated by symmetric CDR interactions composedof predominantly aromatic contacts [21]. Our face-to-face self-interaction is also driven bymultiple CDR aromatic residues and is likely to be a common configuration and mecha-nism, since the CDR apparatus has evolved and is designed for binding. Moreover, thetop ranked docking structure with the highest buried surface area is a highly symmetricalface-to-face complex involving the CDR apparatus. Consistent with our biochemical andmodeling results, Fab self-association reported by Schrag and coworkers were attributed tothe binding symmetry and surface flexibility of the CDR apparatus [21]. Interestingly, mu-tagenesis to glycine at all three CDR sites only slightly lowered self-association, indicatingthat, while the self-binding interface is highly specific to certain interfacial residues, it maybe compensated through increased local main chain flexibility, enabled by the presence ofglycine residues. Additionally, the inherent binding proclivity, along with inherent flexibil-ity of the CDRs, means that the self-binding of the CDR apparatus to itself is inevitable andone of the likely possibilities for self-interacting recombinant antibodies.
From a developability perspective, there is significant interest in understanding how tobetter predict and correct self-association at a sequence or in silico level without impactingother key attributes such as binding and stability. Here, simply using a homology model,three sites were revealed in a prominent hydrophobic patch and all were shown to signifi-cantly impact self-interaction. To be viable correction variants, at a minimum target antigen,binding affinity or activity must be acceptably maintained. In Figure 7, only one variantout of the 22 total variants that were mutated at three separate CDR sites, HC-W104F,maintains both sub-nM target antigen affinity and significantly lowers self-interaction to anacceptable range. Another variant, LC-Y30R, also significantly lowered self-association toan acceptable level and maintained low nM target affinity. This exercise demonstrates thedifficulties of correcting problematic self-association, particularly when the same CDR ap-paratus that has evolved for binding is also involved in strong self-interaction. Often, highaffinity, or significantly improving it through affinity maturation, increases the likelihoodof further encountering negative developability attributes [21,63]. Supporting this notion,in the case of the HC-F104 variant, we have both sub-nM target binding and unacceptableself-association propensity. Because antibody self-interaction will almost certainly involve
Antibodies 2021, 10, 8 17 of 20
the functional CDR apparatus, possibly on both molecules, the probability of success foreach variant to maintain tight target binding and reduce self-association is low (<10% inour study). Therefore, we have learned that the selection and evaluation of more variants atvarious positions will increase the likelihood of achieving the desired results. Overall, it isshown here that both homology patch analysis and self-docking can inform potential self-associating regions with low µM affinity and residues amenable to corrective engineeringdespite its difficulty, but also may not predict actual self-association because of the apparentrequirement for unique self-interaction specificity or complementarity between molecules.
5. Conclusions
Herein, reversible antibody self-association is evaluated biochemically using individ-ual domains, through binding affinity measurements, by in silico homology modeling anddocking approaches, and by site-directed mutagenesis. Interestingly, the self-interactionof mAb variants are shown to likely proceed through a blocking face-to-face interactioninvolving the HC and LC CDRs that is potently magnified by bivalency. This self-binding,leading to unacceptable viscosity at 100 mg/mL in different formulations, also has low µMself-affinity and is highly tunable by and sensitive to single-point mutations to three differ-ent HC/LC CDR residues informed by homology model patch analysis and self-docking.The evaluation of these self-association mutants demonstrate that corrective engineeringis difficult yet feasible and warrants several mutations at multiple positions to increaselikelihood of success. Additionally, in silico approaches, while useful and informative inidentifying potential self-interacting regions, are likely not able to address the specificityand complementarity of self-binding that is evident in a system that exhibits significantself-interaction propensity and sensitivity to even conservative mutations at multiple sites.This study enhances our understanding of antibody self-association and potential meansof addressing and mitigating it from a developability perspective.
Supplementary Materials: The following are available online at https://www.mdpi.com/2073-4468/10/1/8/s1, Table S1: SE-UPLC retention times (RT) and % purity tabulated for each variant,Table S2: Tabulated diffusional coefficients (Do), hydrodynamic radii (Rh) measured over the range of1–10 mg/mL, and ∆AC-SINS values (in nm) for all variants evaluated. “NA” denotes not measuredor available.
Author Contributions: Conceptualization, C.M., A.C.; methodology, C.M., A.C., M.H.; formalanalysis, C.M., A.C., T.F., M.H., J.B., M.U., G.R.; investigation, C.M., A.C., T.F., M.H.; writing—original draft preparation, C.M.; writing—review and editing, C.M., A.C., L.F.-D.; supervision, C.S.,L.F.-D. All authors have read and agreed to the published version of the manuscript.
Funding: This research received no external funding.
Institutional Review Board Statement: Not applicable.
Informed Consent Statement: Not applicable.
Data Availability Statement: Not applicable.
Conflicts of Interest: The authors, all employees of Merck & Co. Inc., declare no conflict of interest.
References1. Lu, R.; Hwang, Y.; Liu, I.; Lee, C.C.; Tsai, H.Z.; Li, H.J.; Wu, H.C. Development of therapeutic antibodies for the treatment of
diseases. J. Biomed. Sci. 2020, 27, 1–30. [CrossRef]2. Kaplon, H.; Reichert, J.M. Antibodies to watch in 2019. mAbs 2019, 11, 219–238. [CrossRef]3. Shire, S.J. Formulation and manufacturability of biologics. Curr. Opin. Biotechnol. 2009, 20, 708–714. [CrossRef] [PubMed]4. Le Basle, Y.; Chennell, P.; Tokhadze, N.; Astier, A.; Sautou, V. Physicochemical stability of monoclonal antibodies: A review. J.
Pharm. Sci. 2020, 109, 169–190. [CrossRef] [PubMed]5. Jain, T.; Sun, T.; Durand, S.; Hall, A.; Houston, N.R.; Nett, J.H.; Sharkey, B.; Bobrowitcz, B.; Caffry, I.; Yu, Y.; et al. Biophysical
features of the clinical mAb landscape. Proc. Natl. Acad. Sci. USA 2017, 114, 944–949. [CrossRef]6. Bailly, M.; Mieczkowski, C.; Juan, V.; Metwally, E.; Tomazela, D.; Baker, J.; Uchida, M.; Kofman, E.; Raoufi, F.; Motlagh, S.; et al.
Predicting antibody developability profiles through early stage discovery screening. mAbs 2020, 12, 1–28. [CrossRef] [PubMed]

Antibodies 2021, 10, 8 18 of 20
7. Wang, W.; Singh, S.; Zeng, D.; King, K.; Nema, S. Antibody structure, instability, and formulation. J. Pharm. Sci. 2007, 96, 1–26.[CrossRef]
8. Jarasch, A.; Koll, H.; Regula, J.T.; Bader, M.; Papadimitriou, A.; Kettenberger, H. Developability assessment during the selectionof novel therapeutic antibodies. J. Pharm. Sci. 2015, 104, 1885–1898. [CrossRef]
9. Daugherty, A.L.; Mrsny, R.J. Formulation and delivery issues for monoclonal antibody therapeutics. Adv. Drug Deliv. Rev. 2006,58, 686–706. [CrossRef]
10. Avery, L.B.; Wade, J.; Wang, M.; Tam, A.; King, A.; Piche-Nicholas, N.; Kavosi, M.S.; Penn, S.; Cirelli, D.; Kurz, J.C.; et al.Establishing in vitro in vivo correlations to screen monoclonal antibodies for physicochemical properties related to favorablehuman pharmacokinetics. mAbs 2018, 10, 244–255. [CrossRef]
11. Hotzel, I.; Theil, F.P.; Bernstein, L.J.; Prabhu, S.; Deng, R.; Quintana, L.; Lutman, J.; Sibia, R.; Chan, P.; Bumbaca, D.; et al. Astrategy for risk mitigation of antibodies with fast clearance. mAbs 2012, 4, 753–760. [CrossRef]
12. Kelly, R.; Sun, T.; Jain, T.; Caffry, I.; Yu, Y.; Cao, Y.; Lynaugh, H.; Brown, M.; Vásquez, M.; Wittrup, K.D.; et al. High throughputcross-interaction measures for human IgG1 antibodies correlate with clearance rates in mice. mAbs 2015, 7, 770–777. [CrossRef]
13. Geng, S.B.; Cheung, J.K.; Narasimhan, C.; Shameen, M.; Tessier, P.M. Improving monoclonal antibody selection and engineeringusing measurements of colloidal protein interactions. J. Pharm. Sci. 2014, 103, 3356–3363. [CrossRef]
14. Liu, J.; Nguyen, M.D.; Andya, J.D.; Shire, S.J. Reversible self-association increases the viscosity of a concentrated monoclonalantibody in aqueous solution. J. Pharm. Sci. 2005, 94, 1928–1940. [CrossRef]
15. Laue, T.M.; Shire, S.J. The molecular interaction process. J. Pharm. Sci. 2020, 109, 154–160. [CrossRef] [PubMed]16. Bethea, D.; Wu, S.J.; Luo, J.; Hyun, L.; Lacy, E.R.; Teplyakov, A.; Jacobs, S.A.; O’Neil, K.T.; Gilliland, G.L.; Feng, Y. Mechanisms of
self association of a human monoclonal antibody CNTO607. Protein Eng. Des. Sel. 2012, 25, 531–537. [CrossRef] [PubMed]17. Saluja, A.; Kalonia, D.S. Nature and consequences of protein–protein interactions in high protein concentration solutions. Int. J.
Pharm. 2008, 358, 1–15. [CrossRef]18. Tomar, D.S.; Kumar, S.; Singh, S.K.; Goswami, S.; Li, L. Molecular basis of high viscosity in concentrated antibody solutions:
Strategies for high concentration drug product development. mAbs 2016, 8, 216–218. [CrossRef] [PubMed]19. Cromwell, M.; Felten, C.; Flores, H.; Liu, J.; Shire, S.J. Self-association of therapeutic proteins: Implications for product
development. In Misbehaving Proteins; Murphy, R.M., Tsai, A.M., Eds.; Springer: Berlin/Heidelberg, Germany, 2006; pp. 313–330.20. Warne, N.W. Development of high concentration protein biopharmaceuticals: The use of platform approaches in formulation
development. Eur. J. Pharm. Biopharm. 2009, 78, 208–212. [CrossRef] [PubMed]21. Schrag, J.D.; Picard, M.E.; Gaudreault, F.; Gagnon, L.P.; Baardsnes, J. Binding symmetry and surface flexibility mediate antibody
self-association. mAbs 2019, 11, 1300–1318. [CrossRef] [PubMed]22. Shire, S.J.; Shahrokh, Z.; Liu, J. Challenges in the development of high protein concentration formulations. J. Pharm. Sci. 2004,
93, 1390–1402. [CrossRef]23. Lehermayr, C.; Mahler, H.C.; Mader, K.; Fischer, S. Assessment of net charge and protein-protein interactions of different
monoclonal antibodies. J. Pharm. Sci. 2011, 100, 2551–2562. [CrossRef] [PubMed]24. Yadav, S.; Laue, T.M.; Kalonia, D.S.; Singh, S.N.; Shire, S.J. The influence of charge distribution on self-association and viscosity
behavior of monoclonal antibody solutions. Mol. Pharm. 2012, 9, 791–802. [CrossRef] [PubMed]25. Esfandiary, R.; Parupudi, A.; Casas-Finet, J.; Gadre, D.; Sathish, H. Mechanism of reversible self-association of a monoclonal
antibody: Role of electrostatic and hydrophobic interactions. J. Pharm. Sci. 2014, 104, 577–586. [CrossRef]26. Salinas, B.A.; Sathish, H.A.; Bishop, S.M.; Harn, N.; Carpenter, J.F.; Randolph, T.W. Understanding and modulating opalescence
and viscosity in a monoclonal antibody formulation. J. Pharm. Sci. 2010, 99, 82–93. [CrossRef] [PubMed]27. Casaz, P.; Boucher, E.; Wollacott, R.; Pierce, B.G.; Rivera, R.; Sedic, M.; Ozturk, S.; Thomas, W.D., Jr.; Wang, Y. Resolving
self-association of a therapeutic antibody by formulation optimization and molecular approaches. mAbs 2014, 6, 1533–1539.[CrossRef]
28. Kanai, S.; Liu, J.; Patapoff, T.W.; Shire, S.J. Reversible self-association of a concentrated monoclonal antibody solution mediatedby Fab-Fab interaction that impacts solution viscosity. J. Pharm. Sci. 2008, 97, 4219–4227. [CrossRef] [PubMed]
29. Agrawal, N.; Helk, B.; Kumar, S.; Mody, N.; Sathish, H.A.; Samra, H.S.; Buck, P.M.; Li, L.; Trout, B.L. Computational tool for theearly screening of monoclonal antibodies for their viscosities. mAbs 2016, 8, 43–48. [CrossRef] [PubMed]
30. Apgar, J.R.; Tam, A.S.P.; Sorm, R.; Moesta, S.; King, A.C.; Yang, H.; Kelleher, K.; Murphy, D.; D’Antona, A.M.; Yan, G.; et al.Modeling and mitigation of high concentration antibody viscosity through structure-based computer-aided protein design. PLoSONE 2020, 5, 1–26. [CrossRef] [PubMed]
31. Li, L.; Kumar, S.; Buck, P.M.; Burns, C.; Lavoie, J.; Singh, S.K.; Warne, N.W.; Nichols, P.; Luksha, N.; Boardman, D. Concentrationdependent viscosity of monoclonal antibody solutions: Explaining experimental behavior in terms of molecular properties.Pharm. Res. 2014, 31, 3161–3178. [CrossRef]
32. Shan, L.; Mody, N.; Sormani, P.; Rosenthal, K.L.; Damschroder, M.M.; Esfandiary, R. Developability assessment of engineeredmonoclonal antibody variants with a complex self-association behavior using complementary analytical and in silico tools. Mol.Pharm. 2018, 15, 5697–5710. [CrossRef]
33. Raybould, M.I.J.; Marks, C.; Krawczyk, K.; Taddese, B.; Nowak, J.; Lewis, A.P.; Bujotzek, A.; Shi, J.; Deane, C.M. Five computationaldevelopability guidelines for therapeutic antibody profiling. Proc. Natl. Acad. Sci. USA 2019, 116, 4025–4030. [CrossRef]

Antibodies 2021, 10, 8 19 of 20
34. Sharma, V.K.; Patapoff, T.W.; Kabakoff, B.; Pai, S.; Hilario, E.; Zhang, B.; Li, C.; Borisov, O.; Kelley, R.F.; Chorny, I.; et al. In silicoselection of therapeutic antibodies for development: Viscosity, clearance, and chemical stability. Proc. Natl. Acad. Sci. USA 2014,111, 18601–18606. [CrossRef]
35. Cromwell, M.E.; Hilario, E.; Jacobson, F. Protein aggregation and bioprocessing. AAPS J. 2006, 8, E572–E579. [CrossRef]36. Monkos, K. Concentration and temperature dependence of viscosity in lysozyme aqueous solutions. Biochim. Biophys. Acta 1997,
1339, 304–310. [CrossRef]37. Yadav, S.; Shire, S.J.; Kalonia, D.S. Factors affecting the viscosity in high concentration solutions of different monoclonal antibodies.
J. Pharm. Sci. 2010, 99, 4812–4826. [CrossRef]38. Scherer, T.M.; Liu, J.; Shire, S.J.; Minton, A.P. Intermolecular interactions of IgG1 monoclonal antibodies at high concentrations
characterized by light scattering. J. Phys. Chem. B 2010, 114, 12948–12957. [CrossRef] [PubMed]39. Saito, S.; Hasegawa, J.; Kobayashi, N.; Kishi, N.; Uchiyama, S.; Fukui, K. Behavior of monoclonal antibodies: Relation between
the second virial coefficient (B(2)) at low concentrations and aggregation propensity and viscosity at high concentrations. Pharm.Res. 2012, 29, 397–410. [CrossRef] [PubMed]
40. Borwankar, A.U.; Dear, B.J.; Twu, A.; Hung, J.J.; Dinin, A.K.; Wilson, B.K.; Yue, J.; Maynard, J.A.; Truskett, T.M.; Johnston, K.P.Viscosity reduction of a concentrated monoclonal antibody with arginine·HCl and arginine·glutamate. Ind. Eng. Chem. Res. 2016,55, 11225–11234. [CrossRef]
41. Inoue, N.; Takai, E.; Arakawa, T.; Shiraki, K. Specific decrease in solution viscosity of antibodies by arginine for therapeuticformulations. Mol. Pharm. 2014, 11, 1889–1896. [CrossRef]
42. Connolly, B.D.; Petry, C.; Yadav, S.; Demeule, B.; Ciaccio, N.; Moore, J.M.; Shire, S.J.; Gokarn, Y.R. Weak interactions govern theviscosity of concentrated antibody solutions: High-throughput analysis using the diffusion interaction parameter. Biophys. J.2012, 103, 69–78. [CrossRef] [PubMed]
43. Saluja, A.; Fesinmeyer, R.M.; Hogan, S.; Brems, D.N.; Gokarn, Y.R. Diffusion and sedimentation interaction parameters formeasuring the second virial coefficient and their utility as predictors of protein aggregation. Biophys. J. 2010, 99, 2657–2665.[CrossRef] [PubMed]
44. Tessier, P.M.; Wu, J.; Dickinson, C.D. Emerging methods for identifying monoclonal antibodies with low propensity to self-associate during the early discovery process. Expert Opin. Drug Deliv. 2014, 11, 461–465. [CrossRef]
45. Geng, S.B.; Wittekind, M.; Vigil, A.; Tessier, P.M. Measurements of monoclonal antibody self-association are correlated withcomplex biophysical properties. Mol. Pharm. 2016, 13, 1636–1645. [CrossRef]
46. Sule, S.V.; Dickinson, C.D.; Lu, J.; Chow, C.K.; Tessier, P.M. Rapid analysis of antibody self-association in complex mixtures usingimmunogold conjugates. Mol. Pharm. 2013, 10, 1322–1331. [CrossRef]
47. Jayaraman, J.; Wu, J.; Brunelle, M.C.; Cruz, A.M.M.; Goldberg, D.S.; Lobo, B.; Shah, A.; Tessier, P.M. Plasmonic measurements ofmonoclonal antibody self-association using self-interaction nanoparticle spectroscopy. Biotechnol. Bioeng. 2014, 111, 1513–1520.[CrossRef]
48. Howlett, G.J.; Minton, A.P.; Rivas, G. Analytical ultracentrifugation for the study of protein association and assembly. Curr. Opin.Chem. Biol. 2006, 10, 430–436. [CrossRef]
49. Jimenez, M.; Rivas, G.; Minton, A.P. Quantitative characterization of weak self-association in concentrated solutions of im-munoglobulin G via the measurement of sedimentation equilibrium and osmotic pressure. Biochemistry 2007, 46, 8373–8378.[CrossRef]
50. Esfandiary, R.; Hayes, D.B.; Parupudi, A.; Casas-Finet, J.; Bai, S.; Samra, H.S.; Shah, A.U.; Sathishi, H.A. A Systematic multitech-nique approach for detection and characterization of reversible self-association during formulation development of therapeuticantibodies. J. Pharm. Sci. 2012, 102, 62–72. [CrossRef] [PubMed]
51. Liu, Y.; Caffry, I.; Wu, J.; Geng, S.B.; Jain, T.; Sun, T.; Reid, F.; Cao, Y.; Estep, P. High-throughput screening for developability duringearly-stage antibody discovery using self-interaction nanoparticle spectroscopy. mAbs 2014, 6, 483–492. [CrossRef] [PubMed]
52. Wu, S.J.; Luo, J.; O’Neil, K.T.; Kang, J.; Lacy, E.R.; Canziani, G.; Baker, A.; Huang, M.; Tang, Q.M.; Raju, T.S.; et al. Structure-basedengineering of a monoclonal antibody for improved solubility. Protein Eng. Des. Sel. 2010, 23, 643–651. [CrossRef]
53. Brown, W.; Nicolai, T. Dynamic Light Scattering: The Method and Some Applications; Oxford University Press: New York,NY, USA, 1993.
54. Berteau, C.; Filipe-Santos, O.; Wang, T.; Rojas, H.E.; Granger, C.; Schwarzenbach, F. Evaluation of the impact of viscosity, injectionvolume, and injection flow rate on subcutaneous injection tolerance. Med. Devices Evid. Res. 2015, 8, 473–484.
55. Tilegenova, C.; Izadi, S.; Yin, J.; Huang, C.S.; Wu, J.; Ellerman, D.; Hymowitz, S.G.; Walters, B.; Salisbury, C.; Carter, P.J. Dissectingthe molecular basis of high viscosity of monospecific and bispecific IgG antibodies. mAbs 2020, 12, 1–11. [CrossRef]
56. Nishi, H.; Miyajima, M.; Wakiyama, N.; Kubota, K.; Hasegawa, J.; Uchiyama, S.; Fukui, K. Fc domain mediated self-association ofan IgG1 monoclonal antibody under a low ionic strength condition. J. Biosci. Bioeng. 2011, 112, 326–332. [CrossRef] [PubMed]
57. Kuriyan, J.; Eisenberg, D. The origin of protein interactions and allostery in colocalization. Nature 2007, 450, 983–990. [CrossRef]58. Kastritis, P.L.; Bonvin, A.M. On the binding affinity of macromolecular interactions: Daring to ask why proteins interact. J. R. Soc.
Interface 2013, 10, 1–27. [CrossRef] [PubMed]59. Chen, C.; Roberts, V.A.; Rittenberg, M.B. Random point mutations in an antibody CDR2 sequence: Many mutated antibodies lose
their ability to bind antigen. J. Exp. Med. 1992, 176, 855–866. [CrossRef]

Antibodies 2021, 10, 8 20 of 20
60. Ambrosetti, F.; Jimenez-Garcia, B.; Roel-Touris, J.; Bonvin, A.M. Modeling antibody-antigen complexes by information-drivendocking. Structure 2020, 28, 119–129. [CrossRef] [PubMed]
61. Pedotti, M.; Simonelli, L.; Livoti, E.; Varani, L. Computational docking of antibody-antigen complexes, opportunities and pitfallsillustrated by influenza hemagglutinin. Int. J. Mol. Sci. 2011, 12, 226–251. [CrossRef]
62. Teplyakov, A.; Obmolova, G.; Wu, S.J.; Luo, J.; Kang, J.; O’Neil, K.; Gilliland, G.L. Epitope mapping of anti-interleukin-13neutralizing antibody CNTO607. J. Mol. Biol. 2009, 389, 115–123. [CrossRef]
63. Shetata, L.; Maurer, D.P.; Wec, A.Z.; Lilov, A.; Champney, A.; Sun, T.; Archambault, K.; Burnina, I.; Lynaugh, H.; Zhi, X.; et al.Affinity maturation enhances antibody specificity but compromises conformational stability. Cell Rep. 2019, 28, 3300–3308.[CrossRef] [PubMed]