Embed Size (px)
Citation preview

Canada Composting Council, March 2017
Characterization and Management
of Food Waste In North America
Sources: Just Eat It, A Food Waste Story, 2014; Tetra Tech, 2014
Ed Products
Generators
Processors
End ProductsApplications
Production
Education
Source Reduction
Onsite Processing
Depackaging
MRF
Regulatory Requirements
Managing Impacts
New Technologies
Creating Markets
Public Sector Procurement Updating Specifications
ImproveSoil Health
Offset Chemical Fertilizers
Renewable Energy
Climate Change
Adaptation
ProcessingDistribution
Retail
Organics Circular Economy
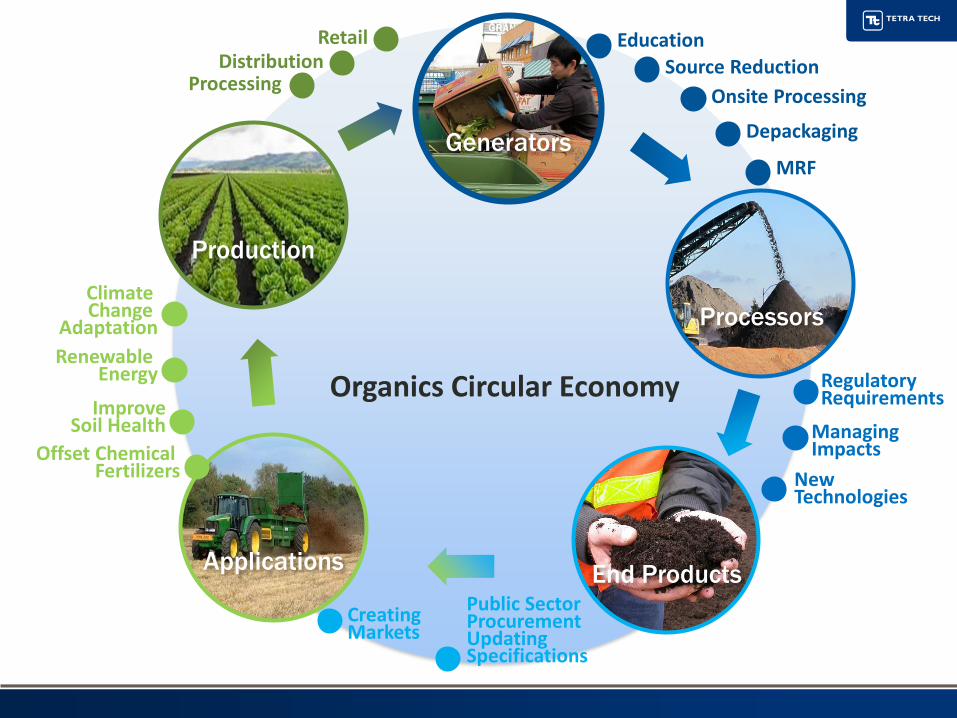
Agenda
• Introduction and Context
• What is Food waste?▪ Define and establish hierarchy▪ Across food supply chain
• Why is this issue important?▪ Quantifying Food Waste▪ Global and North America Goals
• What are the primary causes?
• Challenges and Approaches - Highlights
• Relevance for BC
Source: Tetra Tech, 2014

Project Overview
• Characterization and Management of Food Waste in N.A.▪ Food waste issue, characterize across the food supply chain ▪ Rationale for reducing food waste, related challenges▪ Key regulatory and non-regulatory approaches to reduce, recover, and
measure food waste ▪ Environmental and social impacts, initial recommendations
• Commission for Environmental Cooperation
Source Tetra Tech, 2017
▪ An intergovernmental organization created by Canada, Mexico, and the United States (US) under the North American Agreement on Environmental Cooperation (NAAEC) and addresses environmental issues of continental concern (e.g,, climate change)
Source: Tetra Tech, 2017

Definitions – Food Loss and Food Waste
• Food loss▪ Any edible and inedible parts of food,
that are removed from the food supply chain to be recovered, recycled or disposed. Food loss encompasses food waste. Adapted from
FUSIONS 2014
• Food waste▪ Losses occurring at retail, food
service and consumer stages are termed food waste to factor in behaviour at those stages. Adapted from Parfitt
et al. 2010; Gustavsson 2011 (for FAO)
Sources: Tetra Tech, 2016

Definitions – Food Recovery Hierarchy
• Source Reduction – Actions to minimize surplus food generation and prevent avoidable FLW generation.
• Recovery for Human Consumption Actions to recover safe and nutritious food for human consumption through receiving, storing, or processing food, with or without payment, which would otherwise be discarded or wasted.
• Recovery for Animal ConsumptionActions to recover safe and nutritious food for animal feed through receiving, storing, or processing, with or without payment, food, which would otherwise be wasted.
• Recycling – Actions to recycle food for non-food related uses through processes such as industrial processing for compounds including fats and oils, composting, and anaerobic digestion.
• Disposal – Actions to dispose food through controlled and uncontrolled means such as landfilling, open dumping, incineration and sewage.Sources: Adapted from EPA (2016a), MacRae et al. (2016), Papargyropoulou et al. (2014), Kelly (2014), WRAP (2013)
Disposal
Recycling
Recovery for Animal
Consumption
Recovery for Human
Consumption
Source Reduction
SCOPE OF
REPORT

What Comprises the Food Supply Chain?
Food Production
Post-Harvest
Food Production
Pre-Harvest

Global Food Waste by Weight
• 1.3 billion tonnes of food is wasted annually
▪ Approximately one third of the food produced for human consumption
▪ The United Nation’s Food and Agriculture Organization (FAO) uses commodity production volumes reported by country to generate these estimates
9
Source: Gustavsson et al., 2011 for FAO
Cereals, 19%
Roots and tubers, 20%
Fruits and vegetables, 44%
Oilseeds and pulses, 3%
Meat, 4%
Dairy, 8%
Fish and seafood, 2%
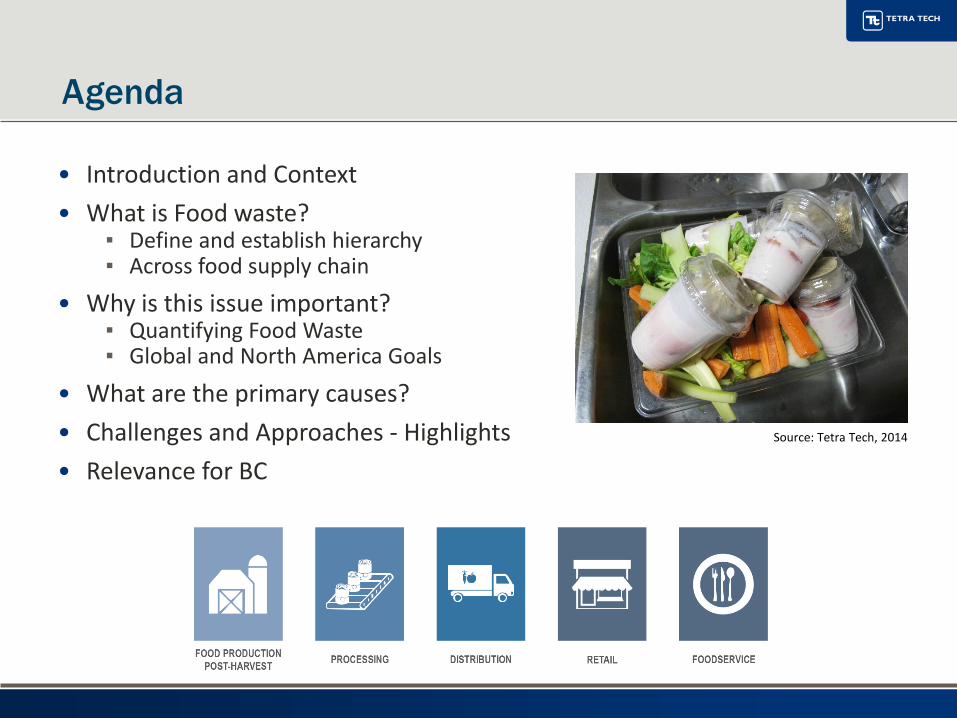
North American Food Waste By Country
0
20
40
60
80
100
120
Canada Mexico United States
Foo
d W
aste
1(m
illio
n to
nnes
per
yea
r)
Pre-Harvest Post-Harvest Processing Distribution Consumer2
1. Food waste tonnage includes food and inedible parts, based on estimates from FAO Food Balance Sheets2. FAO data includes the market system in distribution (e.g., retail and foodservice)

North American Food Waste Per Capita
0
100
200
300
400
500
600
Canada Mexico United States
Foo
d W
aste
1 (k
ilogr
am p
er c
apita
per
yea
r)
Pre-Harvest Post-Harvest Processing Distribution Consumer2
1. Food waste tonnage includes food and inedible parts, based on estimates from FAO Food Balance Sheets2. FAO data includes the market system in distribution (e.g., retail and foodservice)
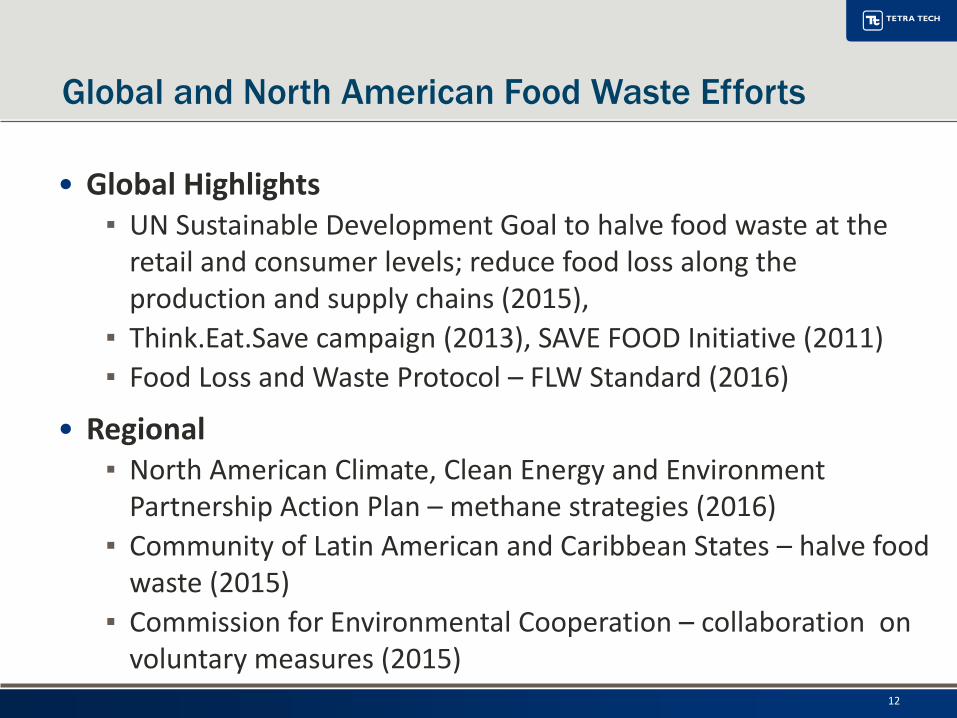
Global and North American Food Waste Efforts
• Global Highlights▪ UN Sustainable Development Goal to halve food waste at the
retail and consumer levels; reduce food loss along the production and supply chains (2015),
▪ Think.Eat.Save campaign (2013), SAVE FOOD Initiative (2011)
▪ Food Loss and Waste Protocol – FLW Standard (2016)
• Regional▪ North American Climate, Clean Energy and Environment
Partnership Action Plan – methane strategies (2016)
▪ Community of Latin American and Caribbean States – halve food waste (2015)
▪ Commission for Environmental Cooperation – collaboration on voluntary measures (2015)
12
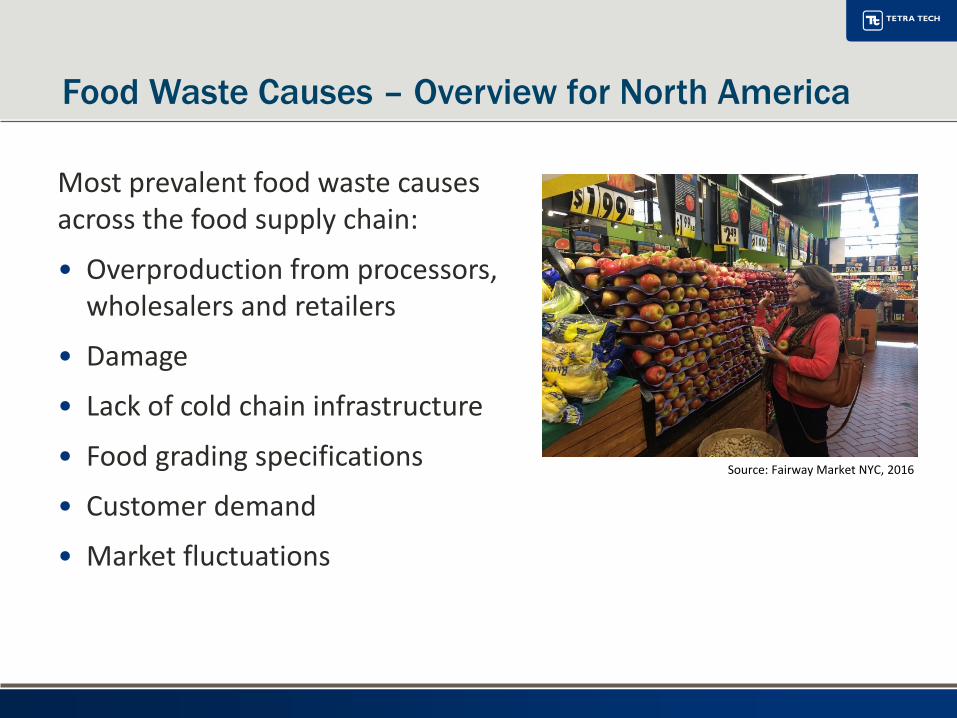
Food Waste Causes – Overview for North America
Most prevalent food waste causes across the food supply chain:
• Overproduction from processors, wholesalers and retailers
• Damage
• Lack of cold chain infrastructure
• Food grading specifications
• Customer demand
• Market fluctuations
Source: Fairway Market NYC, 2016

Challenges to Food Waste Source Reduction
14
Post Harvest Food Production
Processing Distribution Retail Foodservice
High grading standards
Market fluctuations
Best before date uncertainty
Customer expectations
Lack of cold chain management
Limited shelf/storagespace for second grade products
Food waste is not seen as an economic issue

Challenges by Stakeholder – Source Reduction
• Industry ▪ Lack of awareness of waste▪ Concern around minimal short
term financial benefit
• Businesses▪ Health risk concerns▪ Limited shelf space
• Government▪ Limited funding▪ Balancing different stakeholders
needs across the complex food system
• Non-government Organizations▪ Concern may arise that food waste reduction could result in
fewer food donations
Source: Greater Vancouver Food Bank, 2015
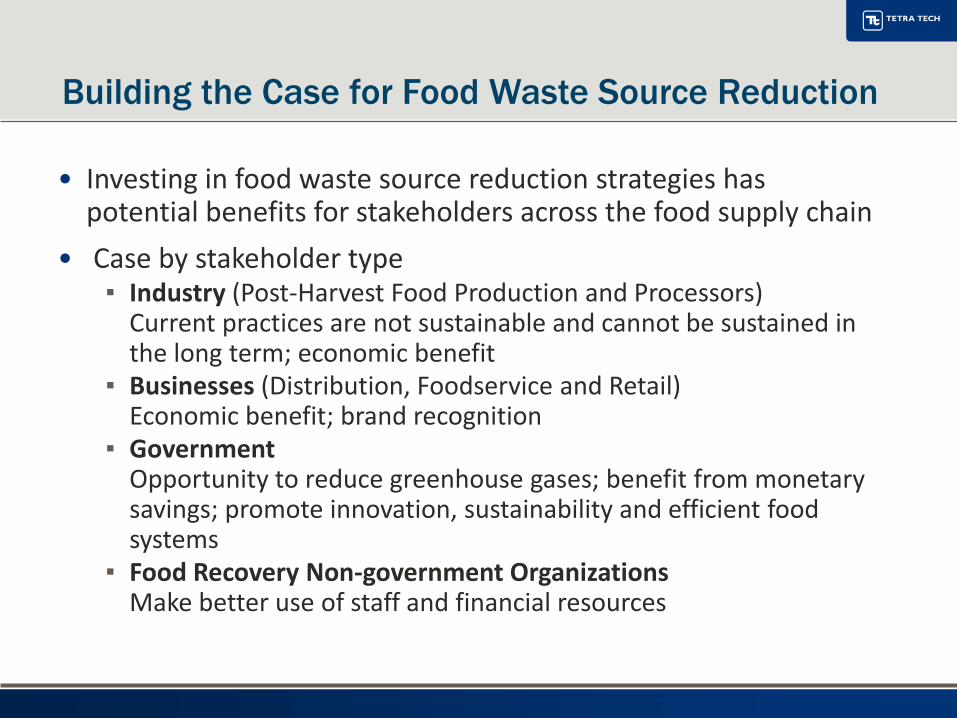
Building the Case for Food Waste Source Reduction
• Investing in food waste source reduction strategies has potential benefits for stakeholders across the food supply chain
• Case by stakeholder type▪ Industry (Post-Harvest Food Production and Processors)
Current practices are not sustainable and cannot be sustained in the long term; economic benefit
▪ Businesses (Distribution, Foodservice and Retail)Economic benefit; brand recognition
▪ GovernmentOpportunity to reduce greenhouse gases; benefit from monetary savings; promote innovation, sustainability and efficient food systems
▪ Food Recovery Non-government Organizations Make better use of staff and financial resources

Approaches
1. Food Waste Source Reduction2. Food Waste Rescue and Recovery3. Measuring, Tracking and Reporting
17
Source: Granville Island, 2011

Food Waste Source ReductionApproaches Across the Food Supply Chain
18
ApproachesCanada, Mexico & United States1
Post Harvest Food Production
Processing Distribution Retail Foodservice
1. Menu Adjustments
2. Operational Changes toReduce Over Portioning
3. Waste Measuring andTracking
4. Increasing Marketability ofProduce
5. Clarifying Best Before Dates
6. Packaging Adjustments
7. Improving Cold ChainManagement
1. Approach sections pertain to all three countries with the exception of #7 which addresses cold chain management as relevant for Mexico

Food Recovery and RescueApproaches Across the Food Supply Chain
19
ApproachesCanada, Mexico & United States1
Post Harvest Food Production
Processing Distribution Retail Foodservice
1. Value-Added Processing
2. Donation Tax Incentive and Liability Protection
3. Increasing Access to Healthy Food
4. Storage and TransportationImprovements
5. Online Food Recovery Platforms
6. Feeding Animals
1. Approach sections pertain to all three countries

Measuring, Tracking and ReportingApproaches Across the Food Supply Chain
20
ApproachesCanada, Mexico & United States1
Post-Harvest Food Production
Processing Distribution Retail Foodservice
1. Waste Composition Studies
2. Diaries
3. Surveys
4. Models and Proxy Data Extrapolation
1. Approach sections pertain to all three countries

Case Study – Increasing Marketability of Produce
• The Misfits Campaign was launched by RedHat Co-operative in Southern Alberta
• Pilot program in Calgary, Alberta, Canada has expanded to broker produce from the United States and Mexico
• Retailers are slow to scale up program beyond running pilots
21
Source: Feeding the 5000, 2015Source: The Misfits, 2015

• BC Tree Fruits produces 77 million kilograms of fruit; 20% culled
• Culled fruit usually destined for juicing and animal feed, but these prices are low
• Partnered with Lonetree Cider to make Broken Ladder cider
▪ Aims to recover 25% of culled fruit for cider, giving higher-value market for fruit
▪ Profits go to processor and growers of the co-operative
Case Study – Value-Added Processing
22
Source: BC Tree Fruits Cider Co. (2016)

• The British Columbia Centre for Disease Control developed two guidelines:
▪ Guidelines for Food Distribution Organizations with Grocery or Meal Programs
▪ Industry Food Donation Guidelines
• Updated regularly to include effective communication with industry, volunteers and other FDOs to better understand liability of food donations
• Explains and addresses liability concerns to donors to help reduce barriers to donating healthy food
Case Study – Guidelines for Donations
23
Source: BC Centre for Disease Control, 2015

▪ Monitor progress towards the region’s 80% diversion goal with 10% waste reduction by 2020
▪ Food waste is sorted into 10 categories to differentiate between unavoidable food waste and several avoidable food waste items
▪ By expanding food waste categories, Metro Vancouver is better positioned to evaluate not just organics waste diversion but also food waste reduction over time
Case Study – Waste Composition Studies
24
Source: Tetra Tech 2016
• Metro Vancouver waste characterization studies

Relevance to BC
25

Residential Food Waste Prevention Toolkit
26
The toolkit is available for downloading at: http://www2.gov.bc.ca/assets/gov/environment/waste-management/recycling/organics/resources/food_waste_reduction_toolkit.pdf
• Includes rationale and background information on the problem and opportunity
• Business case for food waste prevention
• Food waste prevention programming options and links to tools and resources

How Much Preventable Food Waste Occurs in BC?
Garbage Bin Composition
27
53%29%
18%12% 5%
83%
Avoidable Food Waste
Unavoidable Food Waste
Other
Organics Bin Composition
• 25% of the total material set out for residential curbside collection is preventable food waste
• This is approximately 100 kg of preventable food waste each year for every person in the province

Economic Benefits
For every tonne of food waste prevented:
• $5,000 in savings from not purchasing the wasted food and drink
• Disposal fee savings for households and businesses
• Local government save disposal capacity at landfills and need for additional processing infrastructure
• Savings from less collection and hauling
28
Source: Photo by Common Energy UBC
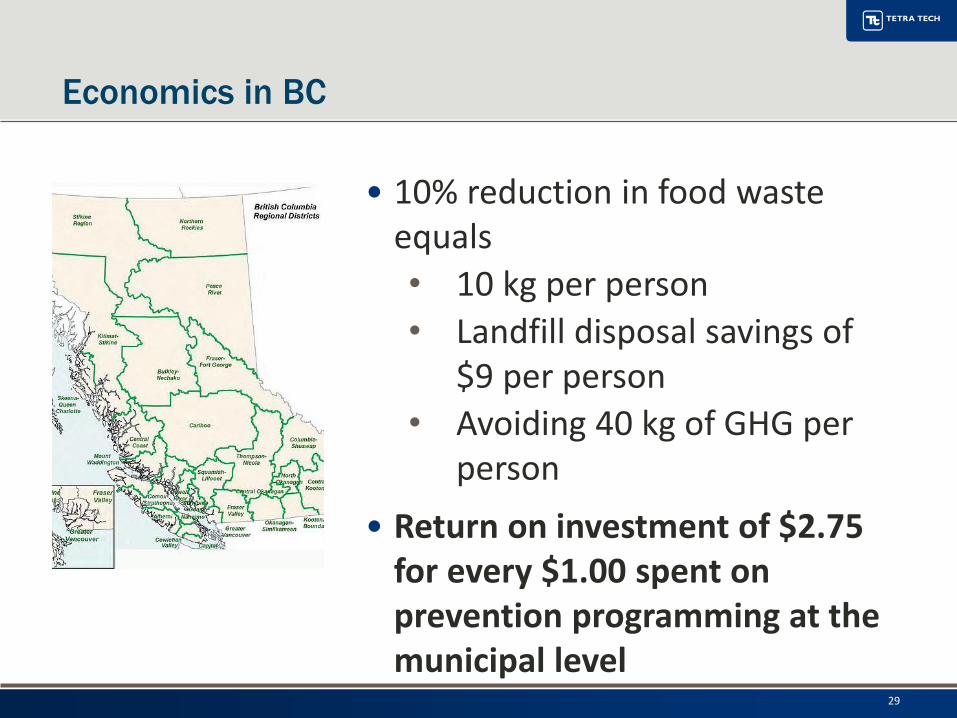
Economics in BC
• 10% reduction in food waste equals
• 10 kg per person
• Landfill disposal savings of $9 per person
• Avoiding 40 kg of GHG per person
• Return on investment of $2.75 for every $1.00 spent on prevention programming at the municipal level
29

Social and Environmental Benefits
• Partnerships
• Learning and skills training
• Reduction of 4 tonnes of greenhouse gases (GHG) per tonne of food waste prevented
• Avoids wasting resources used to produce, package and transport food from the farm to our plates
▪ Water
▪ Energy
▪ Land
▪ Packaging
30

Social and Environmental Benefits
31
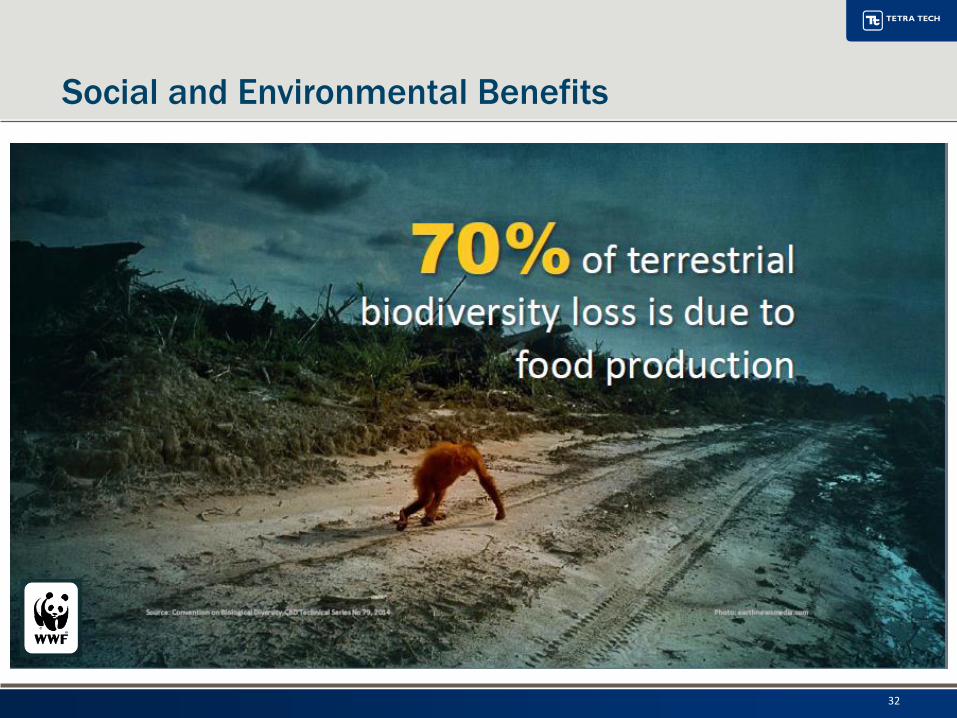
Social and Environmental Benefits
32

Thank you
Questions?
Tamara Shulman, Planning Lead
Solid Waste Management Practice
604.608.8636
33
Source: Tetra Tech, 2015