Embed Size (px)
Citation preview
VIPR
SRAC Final Project No. 600
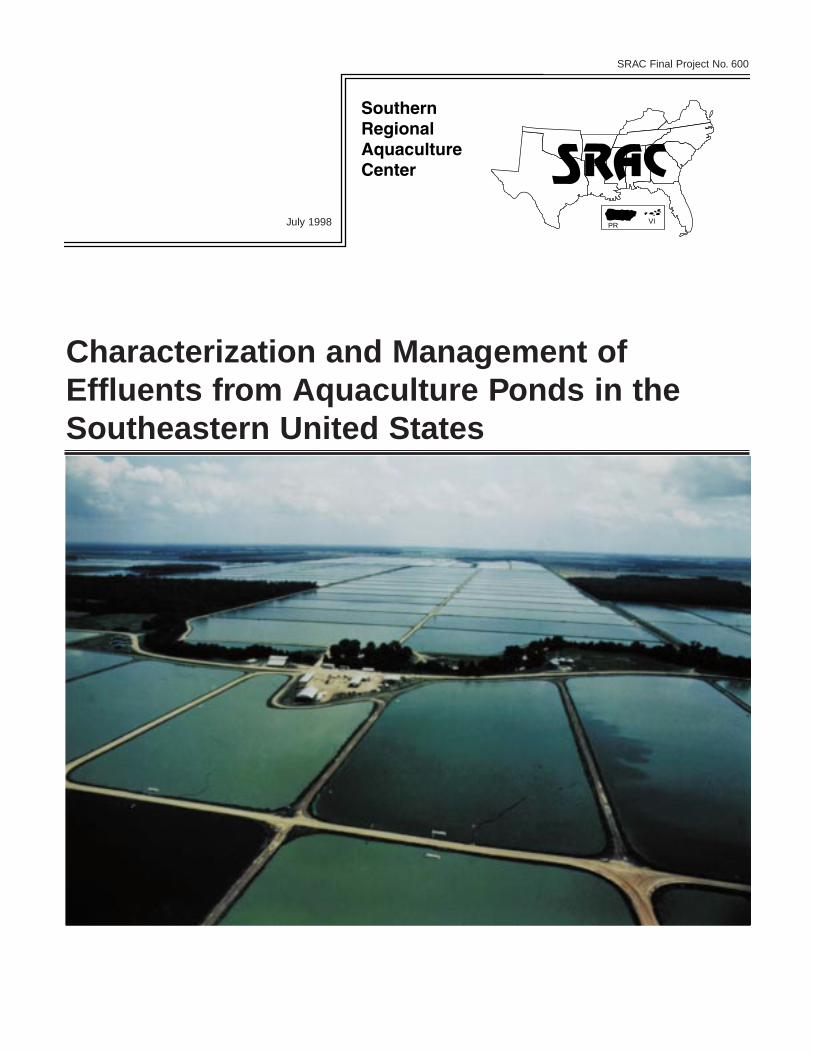
Characterization and Management ofEffluents from Aquaculture Ponds in theSoutheastern United States
July 1998

Final Project Report on theSRAC Regional Research Project
“Characterization of Finfish and Shellfish Aquacultural Effluents”
SRAC No. 600
Compiled byCraig S.Tucker
Southern Regional Aquaculture CenterP.O. Box 197
Stoneville, Mississippi 38776
Telephone: 601-686-9311Fax: 601-686-3569

The project summarized in this report was devel-oped and funded through the Southern RegionalAquaculture Center, which is one of five regionalaquaculture research and Extension centers estab-lished by Congress in 1985 and administered by theUnited States Department of Agriculture. The fivecenters are located in the northeastern, north-cen-tral, southern, western, and tropical Pacific regionsof the country. The Southern Regional AquacultureCenter began organizational activities in 1987, andthe first research and Extension projects were initi-ated in 1988.The thirteen states and two territoriesincluded in the Southern Region are Alabama,Arkansas, Florida, Georgia, Kentucky, Louisiana,Mississippi, North Carolina, Oklahoma, Puerto Rico,South Carolina,Tennessee,Texas, U.S.Virgin Islandsand Virginia.
The regional aquaculture centers encourage coop-erative and collaborative research and Extensioneducational programs in aquaculture having regional or national applications. Center programs
complement and strengthen existing research and Extension educational programs provided bythe Department of Agriculture and other publicinstitutions.
The mission of the centers is to support aquacul-ture research, development, demonstration, andExtension education to enhance viable and prof-itable domestic aquaculture production for the ben-efit of consumers, producers, service industries, andthe American economy. Projects developed andfunded by the centers are based on regional indus-try needs and are designed to aid commercial aqua-culture development in all states and territories.The centers are organized to take advantage of thebest aquaculture science, education skills, and facili-ties in the United States. Center programs ensureeffective coordination and a region-wide, teamapproach to projects jointly conducted by research,Extension, government, and industry personnel.Interagency collaboration and shared funding arestrongly encouraged.
i
Preface
University of Florida, Lead Institution Jerome Shireman
Auburn University Claude Boyd
Clemson University David Brune
Louisiana State University Robert Romaire
Mississippi State University Craig Tucker, John Waldrop
North Carolina State University Tom Losordo, Jeffrey Hinshaw, Philip Westerman
Texas A&M University Jim Davis, Don Steinbach
University of Arkansas at Pine Bluff Carole Engle
University of Georgia Suhas Ghate, Gary Burtle, George Lewis
Waddell Mariculture Center J. Stephen Hopkins
Project Participants
Preface ................................................................................................................................................i
Project Participants ............................................................................................................................i
List of Tables ....................................................................................................................................iii
Executive Summary ............................................................................................................................1
Project Background ............................................................................................................................3
Project Objectives ..............................................................................................................................4
Objective 1. Characterization of Effluents from Aquaculture Ponds in the Southeastern United States ............................................................................................5
Quality of Effluents from Channel Catfish Ponds..........................................................5Quality of Effluents from Channel Catfish Ponds During Harvest ................................8Quality of Effluents from Crawfish Ponds ..................................................................10Quality of Effluents from Hybrid Striped Bass Ponds..................................................13Quality of Effluents from the Hypolimnetic Waters of Watershed Ponds ..................15
Objective 2. Evaluation of Management Practices that May Reduce the Impact of Aquaculture Effluents on the Environment ................................................................18
Reusing Water for Multiple Fish Crops ........................................................................18Using Conservative Water Management Practices ......................................................20Minimizing Water Exchange in Penaeid Shrimp Ponds ..............................................24Using Pond Effluents for Irrigation of Soybeans..........................................................27Treating Pond Effluents Using Constructed Wetlands ................................................28Treating Pond Effluents Using Grass Filter Strips ........................................................31
Objective 3. An Economic Analysis of Treating Effluents from Channel Catfish Ponds ..................34
Recommendations for Managing Aquaculture Pond Effluents ........................................................39
Publications and Presentations ........................................................................................................41
ii
Contents
Table 1. Means and ranges of selected water quality variables in potential effluents from25 commercial channel catfish ponds in central and west-central Alabama fromwinter 1991 through autumn 1992 ..................................................................................................6
Table 2. Means and ranges of selected water quality variables in potential effluents from20 commercial channel catfish ponds in northwest Mississippi from summer 1991through spring 1992 ........................................................................................................................7
Table 3. Means and ranges for selected water quality variables from hybrid striped bassponds in South Carolina ................................................................................................................13
Table 4. Average values for selected water quality variables in water supplies and in potentialeffluents from hybrid striped bass ponds in South Carolina..........................................................14
Table 5. Production characteristics and average concentrations of selected water qualityvariables in potential effluents from fingerling hybrid striped bass ponds and inhybrid striped bass foodfish growout ponds in South Carolina ....................................................15
Table 6. Average channel catfish production data for three annually drained and threeundrained ponds ............................................................................................................................19
Table 7. Average concentrations (± 95% confidence intervals) for selected water qualityvariables in three annually drained and three undrained channel catfish ponds ..........................20
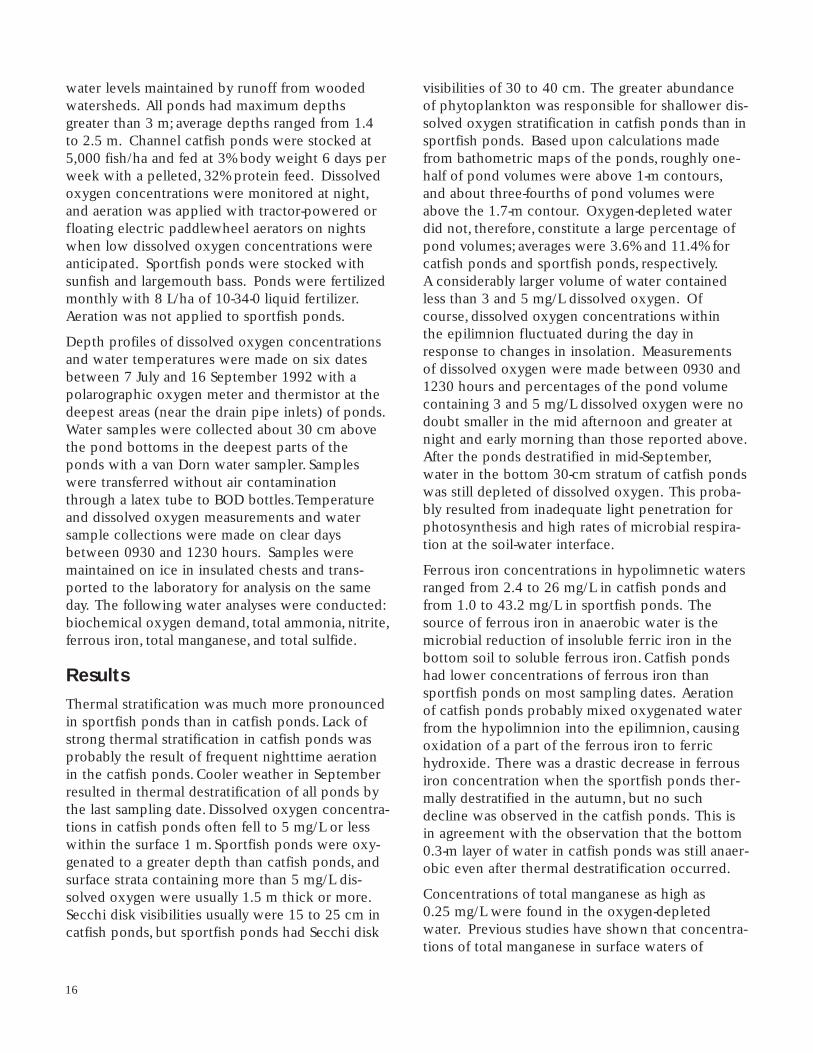
Table 8. Predicted pond overflows (cm) from levee-type channel catfish ponds under twowater-management scenarios..........................................................................................................22
Table 9. Predicted discharge (kg/ha of pond surface) of total nitrogen, total phosphorus,and biochemical oxygen demand from levee-type channel catfish ponds under two water-management scenarios ..................................................................................................22
Table 10. Predicted quantities (kg/ha per year) of nitrogen, phosphorus, and organic matter (expressed as chemical oxygen demand) discharged annually from levee-type channel catfish ponds under two water-management scenarios and three different intervals between pond drainings ................................................................................................................23
Table 11. Average values (± standard deviation) for selected water quality variables in the water supply and in ponds used to raise shrimp Penaeus setiferus at three different daily water exchange rates (25%, 2.5%, and 0%) and two different shrimp densities (44 shrimp/m2 and 22 shrimp/m2) ................................................................................................25
Table 12. Mass discharge (kg/ha per crop) of substances from ponds prior to pond draining,less the quantities pumped into ponds for routine water exchange ............................................26
Table 13. Mass discharge (kg/ha per crop) of substances from ponds including water discharged during pond draining, less the quantities pumped into ponds for initial filling and routine water exchange ..............................................................................................................................27
Table 14. Percent reductions in concentrations of selected potential pollutants in effluent from a channel catfish pond after treatment by flow through a constructed wetland at three different mean hydraulic residence times ......................................................................................30
iii
List of Tables

Table 15. Percent removal of suspended solids in channel catfish pond effluents after flowing through grass filter strips of different slopes and at different effluent application rates ..............33
Table 16. Average concentrations of selected water quality variables in effluents from channel catfish ponds before and after flowing through grass filter strips ..................................33
Table 17. Channel catfish production costs and returns with a pond stocking rate of 9,884 fish/ha and no treatment of pond effluent ..........................................................................35
Table 18. Additional costs (dollars per kilogram of fish produced) under alternative treatments and additional production (kg/ha) required to break even ........................................36
Table 19. Results of the linear programming model ......................................................................................36
iv

This document summarizes the findings of theSouthern Regional Aquaculture Center projectCharacterization of Finfish and ShellfishAquacultural Effluents. The primary objectives ofthe project were to describe the quality of watersdischarged from aquaculture ponds in the south-eastern United States and to assess the effectivenessand economics of various effluent managementpractices.
Characterization of EffluentsMulti-year studies of pond effluent quality wereconducted in channel catfish ponds in Alabama andMississippi, crawfish ponds in Louisiana, and hybridstriped bass ponds in South Carolina. Suspendedsolids, total phosphorus, and, possibly, total nitrogenappeared to be the water quality variables of great-est concern relative to the potential impacts ofaquaculture pond effluents on the environment.Catfish pond effluent quality varied seasonally andwas generally poorest in the summer months whenhigh fish feeding rates caused the accumulation oforganic matter, total nitrogen, and total phosphorusin pond waters. However, highest instantaneousconcentrations of potential pollutants were dis-charged when ponds were drained to facilitate fishharvest, regardless of the time of year. The last 10to 20% of the effluent that was discharged fromponds during harvest contained relatively high concentrations of solids because fish and seiningactivities disturbed the bottom soil in the shallowwater, and materials associated with the soil weredischarged from the pond. In crawfish ponds, con-centrations of nutrients and solids in effluents werehighest in spring and fall, and certain water qualityvariables were significantly affected by the type ofvegetative forage in the pond. No seasonal varia-tion was seen in the quality of effluents fromhybrid striped bass ponds. Most aquaculture in thesoutheast is conducted in shallow, levee-typeponds; however, deep ponds constructed on water-sheds are sometimes used in hilly regions. Waterquality in shallow ponds was found to vary littlefrom surface to bottom but waters discharged fromthe bottoms of deep ponds often contained much
higher concentrations of certain substances thancommonly found in surface waters.
Management of Effluents Several pond management practices showed greatpotential for reducing the impact of effluents onthe environment. Reusing channel catfish pondwater for multiple crops by harvesting fish withoutdraining the pond greatly reduced the volume ofeffluent discharged and also made full use of thenatural waste assimilation capacity of the pondecosystem. Effluent volume was also significantlyreduced by keeping the pond water level belowthe level of the pond overflow device so that rain-fall was captured rather than allowed to overflow.A model of pond overflow for an average climato-logical year showed that capturing rainfall, ratherthan letting it leave the pond as overflow, reducedthe discharge of nitrogen by more than 91%,phosphorus by more than 88%, and biochemicaloxygen demand by more than 92% compared toponds managed without water storage potential.A study of marine shrimp ponds showed that water exchange—a common practice in shrimpfarming—can be dramatically reduced, or eliminat-ed entirely, without sacrificing growth or survival of shrimp. Reduced or eliminated water exchangedecreases the total amounts of nutrients, solids,and organic matter discharged into adjacent waterbodies. Water exchange is less often used in theculture of freshwater fish, but another studyshowed that if water exchange is practiced toimprove water quality in freshwater fish ponds, theresulting effluent can be used to irrigate agronomiccrops. Although the nutrient content of water fromaquaculture ponds may be too low to significantlyenhance crop production, use of effluent for cropirrigation reduces the overall volume of effluentdischarged. Two studies were conducted to assessthe effectiveness of treating effluents before theyare discharged into the environment. Passing pondeffluents through constructed wetlands was a highly effective technique for reducing the concen-trations of nutrients and organic matter in thewater ultimately discharged to the environment.
1
Executive Summary
A second study showed that suspended solids fromcatfish pond effluent can be significantly reducedand concentrations of organic matter and nitrogenlowered by applying the effluent as an overlandrunoff to well-established strips of either Bahia orBermudagrass. This filtering technique is relativelyeasy and inexpensive, although relatively large landareas also may be required to use this techniquecommercially.
Economics of Effluent TreatmentAn economic analysis of effluent treatment optionsshowed that treatment with rice irrigation, con-structed wetlands, or a paired-pond systemincreased costs by $0.00 to $0.11/kg for catfishproduction. If treatment was required by law, riceirrigation was the preferred treatment from theeconomic perspective. Constructed wetlands werenever selected as a profitable option due to highinvestment and maintenance costs. Investment taxcredits or other incentives would be required forconstructed wetlands to become an economicallyfeasible treatment alternative. Effluent standardsand tax charges appear to be effective means ofinternalizing fish pond effluent discharge. However,large farms will do the best job of internalizing thecosts of treating effluent. Small farms not only haveless access to capital, but also are not efficientenough to adopt new technologies to reduce efflu-ent discharge. Imposing control options will makeit harder for new potential catfish farmers to beginoperation, particularly with less than 130-ha farms.
RecommendationsThe results of this project suggest that the impactof aquaculture pond effluents on the environmentcan be greatly reduced by following some or all ofthe following management practices:
■ Use high quality feeds and efficient feeding prac-tices;
■ Provide adequate aeration and circulation ofpond water;
■ Minimize water exchange;
■ If water must be exchanged in ponds, considerreusing the effluent for some other purpose,such as irrigating terrestrial crops;
■ Operate ponds for several years without drain-ing;
■ Reuse water that is drained from ponds when-ever possible;
■ In ponds that are partially drained to facilitatefish harvest, hold the last portion of pond waterin the pond for 2 to 3 days to allow solids to set-tle before draining completely, or do not dis-charge this last portion of water;
■ Maintain some storage volume in ponds to cap-ture rainfall and reduce overflow;
■ Optimize watershed areas to reduce excessivedischarge; and
■ Consider treating effluents by using constructedwetlands.
2

Nearly all of the commercial aquaculture in thesoutheastern United States is practiced in earthenponds. In pond aquaculture, rapid growth of finfishor shellfish is encouraged by fertilizing ponds toincrease the availability of natural foods or by pro-viding manufactured feeds designed to meet thenutritional requirements of the animal under cul-ture. Although fish generally convert feed into fleshmore efficiently than warm-blooded animals, theefficiency of nutrient use by the animal under cul-ture is not high. Regardless of the methods used toenhance production, less than 30% of the feed orfertilizer nitrogen and phosphorus added to aqua-culture ponds is recovered in the harvest of the cultured animal. The remainder of the nutrient loadis lost to the pond ecosystem. The nutrients enter-ing the water from fertilizer, uneaten feed, fishfeces, and fish metabolites stimulate the productionof large amounts of organic matter in the form ofphytoplankton. Thus, concentrations of potentialpollutants accumulate in pond water during thegrow-out period, and these substances may be dis-charged from ponds following rain storms or whenponds are drained between crops. So, aquaculture,as is true of all agriculture, produces waste.
The major constituents of concern in aquacultureeffluents are organic matter, nitrogen, phosphorus,and suspended solids. Pesticides and other toxicmaterials typically are not present in effluents fromaquaculture ponds, as they may be in effluentsfrom other industries. Thus, the potential impact ofaquaculture on natural waters is eutrophication ofthe receiving water, rather than a direct toxic effecton animal or plant health downstream from the dis-charge. The potential environmental effects ofwater discharged from aquaculture ponds include:
■ Organic matter in the effluent may increase theoxygen demand of waters downstream from thedischarge.
■ Nitrogen and phosphorus in the effluent maystimulate algal blooms in the receiving body ofwater.
■ Solids in the effluent may settle out downstreamfrom the point of discharge.
The effect on receiving waters will depend largelyupon the volume and strength of effluents in rela-tion to the volume of the receiving water body, andthe aquatic species present in the receiving waterbody.
From a regulatory standpoint, the issue of aquacul-ture pond effluents emerged when the NationalPollutant Discharge Elimination System (NPDES)was created as part of the Federal Water PollutionControl Act of 1972. That Act, and its subsequentamendments, has become known as the CleanWater Act. Under the Act, the discharge of pollu-tants from “point sources” is prohibited unless thedischarge is authorized by an NPDES permit. TheAct also designates the United States EnvironmentalProtection Agency to administer and enforce theNPDES, although states are encouraged to developand operate their own program in lieu of theFederal program. Most states originally had littleinterest in regulating discharges from aquaculturefacilities because aquaculture was perceived aseither a “clean” industry or as too small an industryto have a significant impact on the environment.However, the remarkable growth of the aquacultureindustry in the 1980s caused more and more statesto develop, or consider developing, regulatory pro-cedures. The development of rational regulationswas severely hampered by the lack of informationregarding the nature of aquaculture effluents ortheir possible impacts on natural waters. Prior to1990, there were many opinions about the qualityand quantity of effluents from aquaculture ponds,although most of those opinions were uninformedbecause almost no data on effluent quality or theenvironmental impacts of pond aquaculture actually existed.
In 1990, the Board of Directors of the SouthernRegional Aquaculture Center addressed the con-cerns of the aquaculture industry in the southeast-ern United States by approving the development ofa project to investigate the issue of aquacultureeffluents. The project was developed through thecooperative efforts of aquaculture industry repre-sentatives and scientists from across the region.That group of concerned experts decided that the
3
Project Background
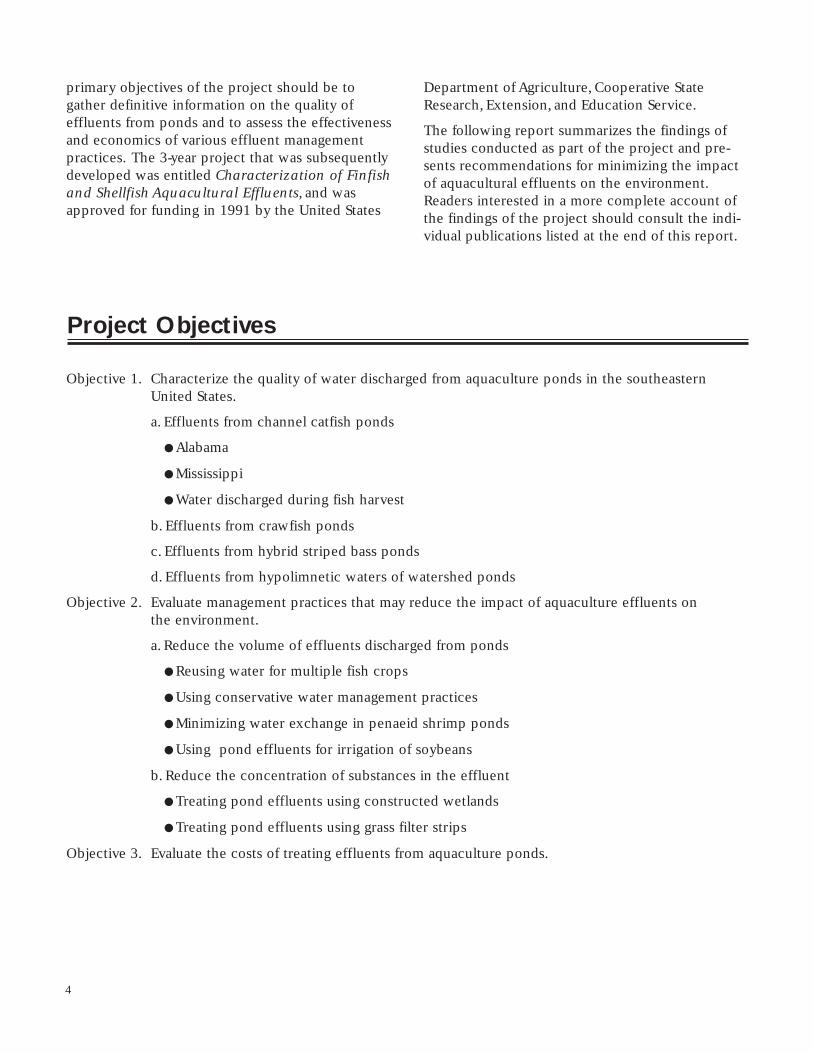
Objective 1. Characterize the quality of water discharged from aquaculture ponds in the southeastern United States.
a. Effluents from channel catfish ponds
● Alabama
● Mississippi
● Water discharged during fish harvest
b. Effluents from crawfish ponds
c. Effluents from hybrid striped bass ponds
d. Effluents from hypolimnetic waters of watershed ponds
Objective 2. Evaluate management practices that may reduce the impact of aquaculture effluents on the environment.
a. Reduce the volume of effluents discharged from ponds
● Reusing water for multiple fish crops
● Using conservative water management practices
● Minimizing water exchange in penaeid shrimp ponds
● Using pond effluents for irrigation of soybeans
b. Reduce the concentration of substances in the effluent
● Treating pond effluents using constructed wetlands
● Treating pond effluents using grass filter strips
Objective 3. Evaluate the costs of treating effluents from aquaculture ponds.
primary objectives of the project should be to gather definitive information on the quality of effluents from ponds and to assess the effectivenessand economics of various effluent managementpractices. The 3-year project that was subsequentlydeveloped was entitled Characterization of Finfishand Shellfish Aquacultural Effluents, and wasapproved for funding in 1991 by the United States
Department of Agriculture, Cooperative StateResearch, Extension, and Education Service.
The following report summarizes the findings ofstudies conducted as part of the project and pre-sents recommendations for minimizing the impactof aquacultural effluents on the environment.Readers interested in a more complete account ofthe findings of the project should consult the indi-vidual publications listed at the end of this report.
4
Project Objectives
5
Quality of Effluents fromChannel Catfish Ponds
Channel catfish farming is the largest aquacultureindustry in the United States and almost all com-mercial production occurs in earthen ponds in thesoutheastern states. Although there is extensiveinformation regarding water quality in catfishponds, almost all of this information was collectedover short time frames (typically limited to the sum-mer growing season) from small experimentalponds. Such data are of limited usefulness in assess-ing the impact of pond effluents on the environ-ment because most catfish ponds are operated yeararound and a large portion of the total effluent vol-ume is discharged in the winter. The following twostudies were therefore conducted to describe long-term changes in the quality of effluents from com-mercial catfish ponds in two of the major catfish-producing states in the region. Matched water sam-ples were collected from all ponds at two depthsbecause waters may be discharged from pondsfrom either the surface or the bottom of the ponddepending on the structure of the drain device.
Methods
Alabama Water samples were collected four times a year dur-ing February, May, August and November of 1991and 1992 from 25 commercial channel catfishponds in central and west-central Alabama. Twosamples were collected from near the drain of eachpond. One sample was dipped approximately 0.3 mfrom the surface and another sample was collectedapproximately 0.3 m above the bottom with a man-ually operated peristaltic pump. Samples were usu-ally collected between 1000 to 1400 hours. Afterreturning to the laboratory, samples were immedi-ately analyzed for 5-day biochemical oxygendemand, total ammonia, total Kjeldahl nitrogen,total phosphorus, suspended solids, and settleablesolids (additional measurements were also madeand results can be found in M. F. Schwartz and C. E.
Boyd, 1994, Channel Catfish Pond Effluents,Progressive Fish-Culturist 56:273-281).
MississippiWater samples were obtained from 20 ponds inWashington County, northwest Mississippi, over a2-year period beginning in the summer of 1991.Ponds averaged about 7 ha in area and 1.25 m indepth. All ponds had been in continuous fish pro-duction, without draining, for at least 3 years atnominal stocking densities of 18,000 to 24,000fish/ha. Daily feeding rates averaged between 75and 100 kg/ha in May through September andbetween 5 and 20 kg/ha in December throughFebruary. Samples were collected between 0800and 0900 on dates in August (summer), November(autumn), February (winter), and May (spring). Oneach sampling date, samples were obtained using a2.2-L Kemmerer bottle from the surface 30 cm andthe bottom 30 cm of each pond at a site adjacent tothe discharge pipe. Samples were returned to thelaboratory and analyses were initiated within 45minutes of collection for 5-day biochemical oxygendemand, total ammonia, total nitrogen, total phos-phorus, suspended solids, and settleable solids(additional measurements were also made andresults can be found in C. S.Tucker, S.W. Kingsbury,J.W. Pote, and C.W.Wax, 1996, Effects of WaterManagement Practices on Discharge of Nutrientsand Organic Matter from Channel Catfish Ponds,Aquaculture 147:57-69).
Results
AlabamaConcentrations of selected water quality variablesin potential pond effluents are summarized in Table 1. All data were highly variable among pondsand it was difficult to distinguish seasonal trends inwater quality. Also, there were few differencesbetween the quality of surface and bottom waterbecause the ponds in this study were relatively shal-low (less than 1.5 m maximum depth) and rarelystratified. Therefore, analytical results obtainedfrom surface and bottom samples were averaged toobtain one value for each pond and sampling date.
Objective 1: Characterization of Effluents from AquaculturePonds in the Southeastern United States
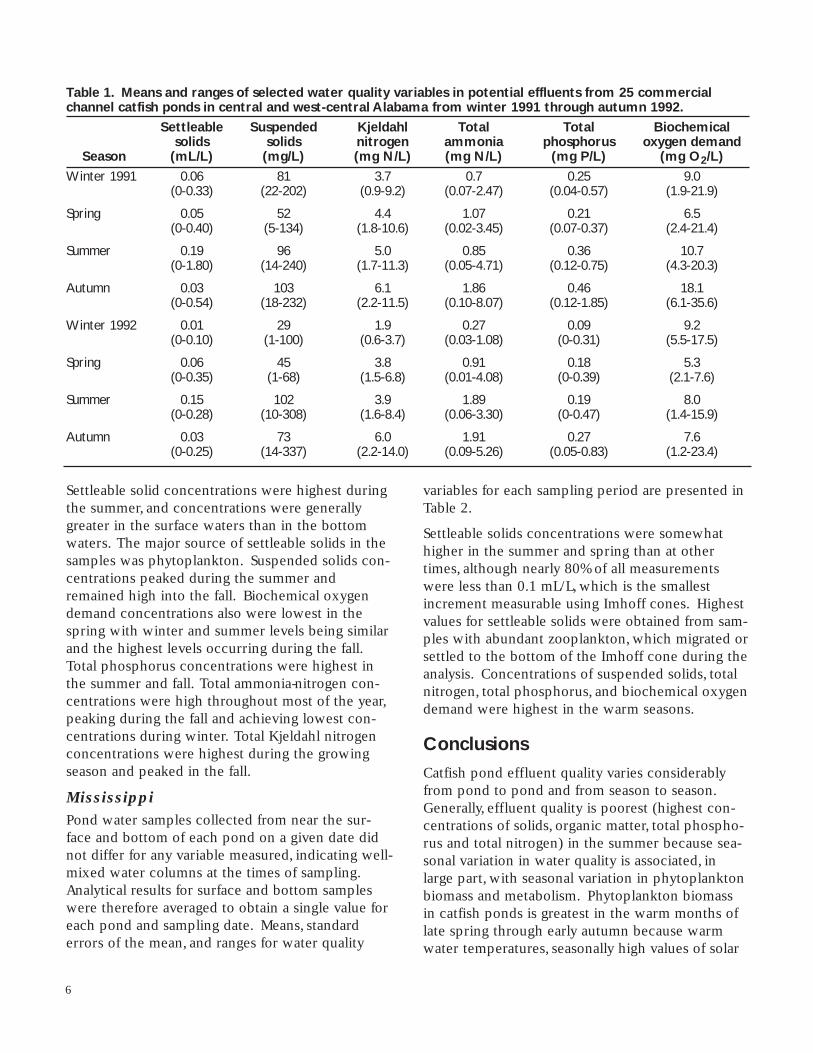
Settleable solid concentrations were highest duringthe summer, and concentrations were generallygreater in the surface waters than in the bottomwaters. The major source of settleable solids in thesamples was phytoplankton. Suspended solids con-centrations peaked during the summer andremained high into the fall. Biochemical oxygendemand concentrations also were lowest in thespring with winter and summer levels being similarand the highest levels occurring during the fall.Total phosphorus concentrations were highest inthe summer and fall. Total ammonia-nitrogen con-centrations were high throughout most of the year,peaking during the fall and achieving lowest con-centrations during winter. Total Kjeldahl nitrogenconcentrations were highest during the growingseason and peaked in the fall.
MississippiPond water samples collected from near the sur-face and bottom of each pond on a given date didnot differ for any variable measured, indicating well-mixed water columns at the times of sampling.Analytical results for surface and bottom sampleswere therefore averaged to obtain a single value foreach pond and sampling date. Means, standarderrors of the mean, and ranges for water quality
variables for each sampling period are presented inTable 2.
Settleable solids concentrations were somewhathigher in the summer and spring than at othertimes, although nearly 80% of all measurementswere less than 0.1 mL/L, which is the smallestincrement measurable using Imhoff cones. Highestvalues for settleable solids were obtained from sam-ples with abundant zooplankton, which migrated orsettled to the bottom of the Imhoff cone during theanalysis. Concentrations of suspended solids, totalnitrogen, total phosphorus, and biochemical oxygendemand were highest in the warm seasons.
ConclusionsCatfish pond effluent quality varies considerablyfrom pond to pond and from season to season.Generally, effluent quality is poorest (highest con-centrations of solids, organic matter, total phospho-rus and total nitrogen) in the summer because sea-sonal variation in water quality is associated, inlarge part, with seasonal variation in phytoplanktonbiomass and metabolism. Phytoplankton biomassin catfish ponds is greatest in the warm months oflate spring through early autumn because warmwater temperatures, seasonally high values of solar
6
Table 1. Means and ranges of selected water quality variables in potential effluents from 25 commercial channel catfish ponds in central and west-central Alabama from winter 1991 through autumn 1992.
Settleable Suspended Kjeldahl Total Total Biochemicalsolids solids nitrogen ammonia phosphorus oxygen demand
Season (mL/L) (mg/L) (mg N/L) (mg N/L) (mg P/L) (mg O2/L)
Winter 1991 0.06 81 3.7 0.7 0.25 9.0(0-0.33) (22-202) (0.9-9.2) (0.07-2.47) (0.04-0.57) (1.9-21.9)
Spring 0.05 52 4.4 1.07 0.21 6.5(0-0.40) (5-134) (1.8-10.6) (0.02-3.45) (0.07-0.37) (2.4-21.4)
Summer 0.19 96 5.0 0.85 0.36 10.7(0-1.80) (14-240) (1.7-11.3) (0.05-4.71) (0.12-0.75) (4.3-20.3)
Autumn 0.03 103 6.1 1.86 0.46 18.1(0-0.54) (18-232) (2.2-11.5) (0.10-8.07) (0.12-1.85) (6.1-35.6)
Winter 1992 0.01 29 1.9 0.27 0.09 9.2(0-0.10) (1-100) (0.6-3.7) (0.03-1.08) (0-0.31) (5.5-17.5)
Spring 0.06 45 3.8 0.91 0.18 5.3(0-0.35) (1-68) (1.5-6.8) (0.01-4.08) (0-0.39) (2.1-7.6)
Summer 0.15 102 3.9 1.89 0.19 8.0(0-0.28) (10-308) (1.6-8.4) (0.06-3.30) (0-0.47) (1.4-15.9)
Autumn 0.03 73 6.0 1.91 0.27 7.6(0-0.25) (14-337) (2.2-14.0) (0.09-5.26) (0.05-0.83) (1.2-23.4)
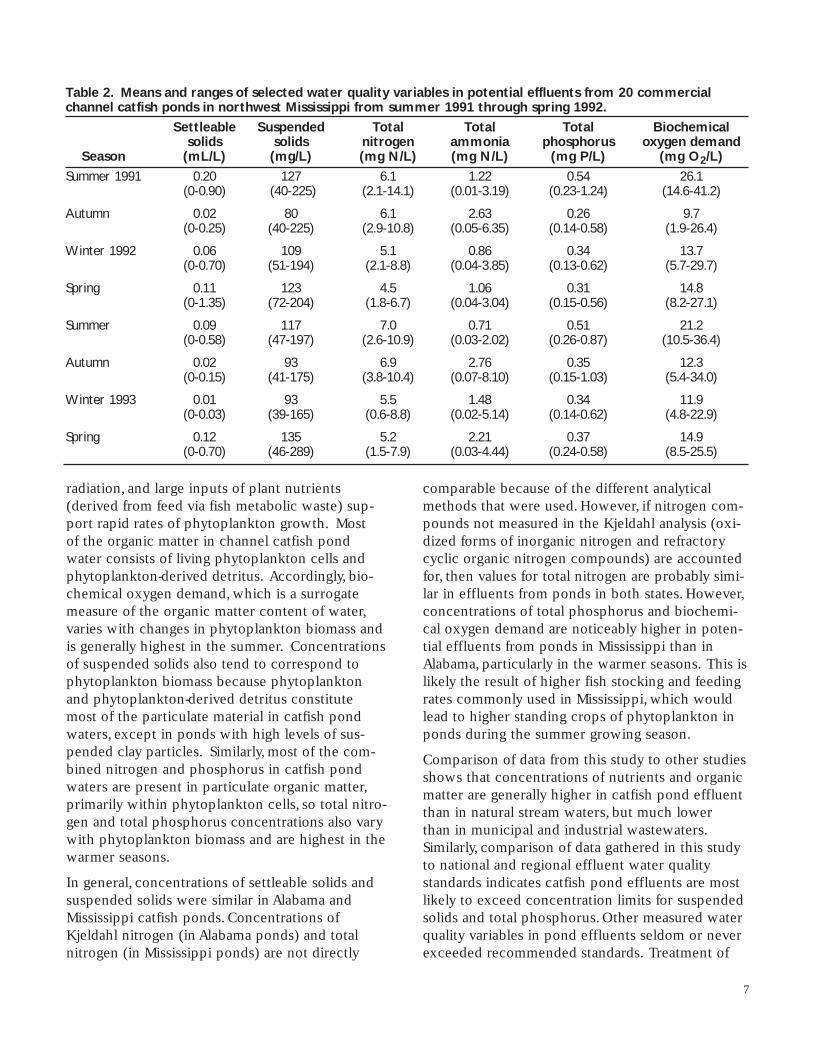
radiation, and large inputs of plant nutrients(derived from feed via fish metabolic waste) sup-port rapid rates of phytoplankton growth. Most of the organic matter in channel catfish pond water consists of living phytoplankton cells andphytoplankton-derived detritus. Accordingly, bio-chemical oxygen demand, which is a surrogatemeasure of the organic matter content of water,varies with changes in phytoplankton biomass andis generally highest in the summer. Concentrationsof suspended solids also tend to correspond to phytoplankton biomass because phytoplankton and phytoplankton-derived detritus constitute most of the particulate material in catfish pondwaters, except in ponds with high levels of sus-pended clay particles. Similarly, most of the com-bined nitrogen and phosphorus in catfish pondwaters are present in particulate organic matter,primarily within phytoplankton cells, so total nitro-gen and total phosphorus concentrations also varywith phytoplankton biomass and are highest in thewarmer seasons.
In general, concentrations of settleable solids andsuspended solids were similar in Alabama andMississippi catfish ponds. Concentrations ofKjeldahl nitrogen (in Alabama ponds) and totalnitrogen (in Mississippi ponds) are not directly
comparable because of the different analyticalmethods that were used. However, if nitrogen com-pounds not measured in the Kjeldahl analysis (oxi-dized forms of inorganic nitrogen and refractorycyclic organic nitrogen compounds) are accountedfor, then values for total nitrogen are probably simi-lar in effluents from ponds in both states. However,concentrations of total phosphorus and biochemi-cal oxygen demand are noticeably higher in poten-tial effluents from ponds in Mississippi than inAlabama, particularly in the warmer seasons. This islikely the result of higher fish stocking and feedingrates commonly used in Mississippi, which wouldlead to higher standing crops of phytoplankton inponds during the summer growing season.
Comparison of data from this study to other studiesshows that concentrations of nutrients and organicmatter are generally higher in catfish pond effluentthan in natural stream waters, but much lower than in municipal and industrial wastewaters.Similarly, comparison of data gathered in this studyto national and regional effluent water quality standards indicates catfish pond effluents are mostlikely to exceed concentration limits for suspendedsolids and total phosphorus. Other measured waterquality variables in pond effluents seldom or neverexceeded recommended standards. Treatment of
7
Table 2. Means and ranges of selected water quality variables in potential effluents from 20 commercial channel catfish ponds in northwest Mississippi from summer 1991 through spring 1992.
Settleable Suspended Total Total Total Biochemicalsolids solids nitrogen ammonia phosphorus oxygen demand
Season (mL/L) (mg/L) (mg N/L) (mg N/L) (mg P/L) (mg O2/L)
Summer 1991 0.20 127 6.1 1.22 0.54 26.1(0-0.90) (40-225) (2.1-14.1) (0.01-3.19) (0.23-1.24) (14.6-41.2)
Autumn 0.02 80 6.1 2.63 0.26 9.7(0-0.25) (40-225) (2.9-10.8) (0.05-6.35) (0.14-0.58) (1.9-26.4)
Winter 1992 0.06 109 5.1 0.86 0.34 13.7(0-0.70) (51-194) (2.1-8.8) (0.04-3.85) (0.13-0.62) (5.7-29.7)
Spring 0.11 123 4.5 1.06 0.31 14.8(0-1.35) (72-204) (1.8-6.7) (0.04-3.04) (0.15-0.56) (8.2-27.1)
Summer 0.09 117 7.0 0.71 0.51 21.2(0-0.58) (47-197) (2.6-10.9) (0.03-2.02) (0.26-0.87) (10.5-36.4)
Autumn 0.02 93 6.9 2.76 0.35 12.3(0-0.15) (41-175) (3.8-10.4) (0.07-8.10) (0.15-1.03) (5.4-34.0)
Winter 1993 0.01 93 5.5 1.48 0.34 11.9(0-0.03) (39-165) (0.6-8.8) (0.02-5.14) (0.14-0.62) (4.8-22.9)
Spring 0.12 135 5.2 2.21 0.37 14.9(0-0.70) (46-289) (1.5-7.9) (0.03-4.44) (0.24-0.58) (8.5-25.5)

aquaculture effluents will present a unique prob-lem because traditional wastewater treatment sys-tems are designed for waters that are much moreconcentrated in pollutants than aquaculture efflu-ents. Most of the materials in pond effluents aredischarged in the form of solids. This includesphosphorus because most of the total phosphorusin pond waters is present as organic phosphoruscompounds in live phytoplankton cells or particu-late detritus. Therefore, the impact of suspendedsolids and total phosphorus concentrations—thevariables that most often exceeded recommendedeffluent concentration limits—could be greatlyreduced by sedimentation or other processes thatremove particulate material.
Quality of Effluents fromChannel Catfish Ponds
During HarvestThere are two basic types of channel catfish ponds:levee ponds and watershed ponds. Levee pondsdischarge little water following rains, because theyhave small watershed areas. Watershed ponds nor-mally discharge considerable water following heavyrains because they have large watershed areas.However, the most significant release of effluentsfrom channel catfish ponds occurs when ponds aredrained. Some catfish farmers drain ponds annuallyfor fish harvest. Others drain ponds only every 3 to 8 years as dictated by the need to repair pondlevees or to adjust the fish inventory. Surface water that flows from ponds following rains is similar in composition to pond water and is nothighly polluted. Draining a pond for harvest resultsin the fish being concentrated into a smaller vol-ume of water, which causes sediments to be stirredup by the activity of fish and the seining operation.Thus, the quality of effluents deteriorates duringpond draining. Therefore, this study was conductedto obtain additional information on quality of efflu-ents released from channel catfish ponds duringpond draining and fish harvest.
MethodsThree watershed ponds on the Auburn UniversityFisheries Research Unit of the Alabama AgriculturalExperiment Station near Auburn, Alabama wereused in this study. Pond surface areas ranged from
0.92 to 1.32 ha and average depths were 1.37 to1.73 m. The ponds were stocked with fingerlingchannel catfish at a rate of 10,000/ha in April 1991and were fed daily at approximately 3% of bodyweight per day with a pelleted commercial rationof 32% crude protein during the growing seasonand intermittently during the winter. Ponds weredrained during the period 7 January through 28January 1992. Drains were opened early in themorning and closed in the evening. This procedurewas repeated daily until the water levels were lowenough to permit seining. Drains were then closedand ponds seined. After the first seining, drainswere re-opened to allow ponds to drain further andconcentrate remaining fish for easy capture. All fishwere removed from one of the ponds in one day; itwas necessary to seine the other two ponds onmore than one day. After as many fish as possiblehad been removed by seining, ponds were allowedto drain completely so fish that escaped seiningcould be removed from the bottoms by hand.Water samples were collected twice daily, 1 to 2hours after drains were opened in the morning,and 6 hours after morning samples were collected.One sample was collected 0.3 m below the watersurface and one from the flow of the drain pipe.Water levels were recorded from staff gages in eachpond in order to calculate the volume of water discharged per day. Samples were immediately analyzed for 5-day biochemical oxygen demand,nitrite, nitrate, total ammonia, Kjeldahl nitrogen,total phosphorus, soluble reactive phosphorus, andsettleable solids.
ResultsTotal masses of substances released from ponds ineffluents were calculated by summing products ofdaily mean concentration of a variable (g/m3) anddaily effluent volume (m3) for each day. There wasconsiderable variation among ponds in amounts ofeach water quality variable released. This differ-ence was thought to be related to the fact that fishwere seined from one pond in a single day, whereasthe other two ponds were seined on more thanone day. Each time ponds were seined, sedimentswere stirred into the water and concentrations ofvarious substances increased. Most of the nitrogenand phosphorus in the effluent were contained indissolved organic matter or particulate matter, for
8

there was little total ammonia nitrogen, nitrite-nitrogen, and nitrate-nitrogen in relation to totalKjeldahl-nitrogen, and only a small proportion ofthe total phosphorus could be accounted for in soluble reactive phosphorus. Ponds did not containheavy phytoplankton blooms at harvest because oflow winter temperatures. The biochemical oxygendemand was expressed by soluble organic matterand particulate organic matter stirred into thewater from the bottom sediments during seining.The major component of total settleable solids wassuspended soil particles.
Changes in concentrations of water quality vari-ables in effluents during draining and harvest fol-lowed similar trends in all three ponds. Data fromone pond are summarized for illustration. Seiningcommenced after approximately 96 hours of drain-ing. Concentrations of total ammonia-nitrogenremained below 0.1 mg/L during the first 48 hoursof draining and did not exceed 0.5 mg/L until thedrain had been open for more than 120 hours.Concentrations in the surface and effluent sampleswere roughly equivalent throughout the drainingevent. Concentrations of total Kjeldahl nitrogenremained below 5.0 mg/L for the first 72 hours ofdraining in both the surface and effluent samples.After that time, the surface concentration increasedslightly to peak at 10 mg/L while the effluent con-centration increased sharply to a peak of 137 mg/L.Concentrations of nitrite-nitrogen fluctuated withno apparent trend during the first 120 hours ofdraining. After this time, the surface concentrationincreased from 0.002 mg/L to 0.006 mg/L while theeffluent concentration increased from 0.002 mg/Lto a peak of 0.007 mg/L at 144 hours. Concentra-tions of nitrate-nitrogen fluctuated greatly through-out the draining event with surface concentrationsshowing almost no increase over time. Effluent concentrations increased from 0.36 mg/L at thebeginning of draining to 0.64 mg/L at the end.Concentrations of soluble reactive phosphorusremained stable at 0.001 mg/L for the first 48 hoursof draining, increased gradually to 0.02 mg/L after96 hours and then increased sharply to peak at0.12 mg/L at the surface and 0.16 mg/L in the effluent. Total phosphorus concentrations wereabout 0.15 mg/L in the surface water and effluentfor the first 72 hours of draining. They thenincreased markedly to 1.0 mg/L at the surface and
1.3 mg/L in the effluent. Biochemical oxygendemand was around 10 mg/l in surface water forthe first 48 hours and then increased gradually topeak at 18 mg/L. Effluent values for biochemicaloxygen demand remained about the same as sur-face values for the first 120 hours and thenincreased sharply to peak at 296 mg/L. Concentra-tions of total settleable solids remained negligiblein the surface water throughout the draining event.Effluent concentrations of total settleable solidsparalleled those at the surface for the first 120hours of draining, after which they increasedsharply to peak at 60 ml/L. Values of pH fluctuatedthroughout draining while decreasing steadily.
The cumulative percentages of total nitrogen, totalphosphorous, biochemical oxygen demand, and set-tleable matter discharged relative to the cumulativepercentages of effluent discharged were calculatedfor the pond described above. Approximately 50%of the nitrogen, phosphorus, and biochemical oxy-gen demand was discharged in the last 15 to 20%of the effluent discharged from a pond. For set-tleable solids, 50% of the total was discharged inthe last 5% of the effluent discharged.
ConclusionsConcentrations of total Kjeldahl nitrogen, biochemi-cal oxygen demand, and settleable solids were fairlyconstant throughout the draining phase. It was notuntil the seining phase that these variablesincreased in concentration. On the other hand, totalammonia nitrogen, soluble reactive phosphorous,and total phosphorus steadily increased during thedraining phase and sharply increased during theseining phase. Increases in phosphorus were mostlikely a result of sediments being stirred up, whilethe elevated total ammonia nitrogen concentrationswere probably a result of metabolic wastes becom-ing more concentrated in a decreasing volume ofwater. Values of pH steadily decreased throughoutpond draining. As the fish in a pond become moreconcentrated in a decreasing volume of water, car-bon dioxide from their respiration was a major fac-tor causing pH to decline. Both nitrite-nitrogen andnitrate-nitrogen concentrations fluctuated widely inall three ponds during draining and seining. Thesefindings suggest that the best way to minimize thepollution potential of aquaculture pond effluents isto harvest ponds as quickly as possible, and either
9

not discharge water during the seining phase or to discharge this highly contaminated water into a settling basin or retention pond. It also may befeasible to allow effluents to flow untreated intothe environment during the pre-seining phase ofdraining, because concentrations of potential pollutants are low during this phase of draining.
Quality of Effluents fromCrawfish Ponds
Freshwater crawfishes are exploited for food world-wide and most of the United States crawfish pro-duction is derived from ponds, nearly all of whichare located in Louisiana. As with many types ofpond aquaculture, crawfish producers occasionallydischarge water from ponds to maintain goodwater quality and increase production. Water isalso discharged from ponds when precipitationexceeds pond storage capacity. This study wasconducted to characterize the quality of effluentsfrom commercial crawfish ponds and to describethe relationship between pond management(specifically the type of vegetative forage) andeffluent quality.
MethodsSeventeen commercial crawfish ponds (2.2 to 23.6 ha in surface area) in south-central and south-west Louisiana were used in this study. Three typesof crawfish culture systems were selected: rice-field, permanent, and wooded. Rice-field ponds had rice foliage as the forage detrital base for crawfish. Rice-field ponds included rice-crawfishdouble-cropping systems in which rice was plantedin April and the grain harvested in July or August.Rice “set-aside” ponds (rice planted August 1 orlater) were also included as study sites. Permanentcrawfish ponds selected were either planted withrice or sorghum-sudan grass in early to late sum-mer, or they were not planted with cultivated for-ages and had native aquatic and terrestrial plants.Wooded ponds were characterized as having nativeterrestrial and aquatic flora and leaf litter. Commer-cial ponds were managed according to the owners’discretion with regards to flooding date, pumpinghours, effluent discharge, and draining dates. Twocrawfish ponds at the Louisiana Agricultural Exper-iment Station’s Ben Hur Aquaculture Research
Farm, Baton Rouge, were included in the effluentstudy. The ponds, which ranged in surface areafrom 1.5 to 2.0 ha, were planted with rice in lateJuly 1991.
Effluent samples were collected from within eachpond on 4 days in November 1991, February 1992,and April 1992 (corresponding to fall, winter, andspring seasons, respectively). During the drainingof the ponds, which began in May and ended inJuly 1992 (summer season), at least three sampleswere collected at the drain inside each pond on different dates over 1 to 2 weeks. In each pond, asample of water representing a composite of sur-face to bottom was collected at a drain when notflowing, and before the outfall when flowing, andtransported on ice to the laboratory for analysis.Samples were stored and preserved following standard procedures.
Samples of effluent were collected between 0700and 1000 hours. Laboratory analyses generallybegan by 1300 hours. Dissolved oxygen and watertemperature were measured in situ at the drainwith a polarographic oxygen meter. In addition,the following water quality analyses were conduct-ed in the laboratory: total ammonia, nitrite, nitrate,Kjeldahl nitrogen, total phosphorus, soluble reactivephosphorus, chemical oxygen demand, settleablesolids, total solids, total volatile solids, and 5-daybiochemical oxygen demand (other analyses werealso made and results can be found in F. X.Orellana, 1992, Characterization of Effluents fromCommercial Crawfish Ponds in South Louisiana,M. S.Thesis, Louisiana State University).
ResultsDissolved oxygen concentrations in crawfish pondeffluents ranged from 0.4 to 12.6 mg/L. Concentra-tion in effluent during fall (mean = 6.5 mg/L) washigher than the concentration in winter (mean =4.7 mg/L), spring (mean = 4.9 mg/L), and summer(mean = 4.3 mg/L) because low water temperatureincreased oxygen solubility and decreased metabo-lism by aquatic biota. Ponds with rice and nativevegetation generally had higher concentrations ofdissolved oxygen than ponds with sorghum-sudangrass. Because of their low vegetative biomass,ponds with native vegetation had the highest dis-solved oxygen concentrations in the fall (mean =
10

7.8 mg/L). Ponds with sorghum-sudan grass hadthe lowest fall dissolved oxygen concentrations(mean = 5.0 mg/L) because of high vegetativestanding crops. In contrast, by spring and summer,ponds with native vegetation had the lowest con-centration of dissolved oxygen in effluents (meanless than 3.5 mg/L) because a relatively high quan-tity of vegetative biomass depleted ponds of theoxygen. Ponds with rice and sorghum-sudan grasshad the highest dissolved oxygen concentrations(mean values greater than 4.5 mg/L) in spring andsummer because vegetation had completely dissi-pated, and this reduced oxygen consumption.
Chemical oxygen demand concentrations rangedfrom 3.9 to 163.8 mg/L (overall mean = 38.7 mg/L),and biochemical oxygen demand values rangedfrom 0.6 to 26.6 mg/L (overall mean = 5.3 mg/L.The chemical oxygen demand in spring (mean =46.5 mg/L) and summer (mean = 61.3) was 75 to130% higher, respectively, than chemical oxygendemand concentrations in fall (mean = 27.4 mg/L)and winter (mean = 26.2 mg/L).The concentrationsof biochemical oxygen demand followed a similartrend to chemical oxygen demand, with biochemi-cal oxygen demand values in spring (mean = 5.1mg/L) and summer (mean = 11.6 mg/L) being 63 to270% higher, respectively, than biochemical oxygendemand in fall (mean = 2.7 mg/L) and winter(mean = 3.6 mg/L). Several ponds had effluentswith biochemical oxygen demand concentrationsthat exceeded 20 mg/L during summer drainage.The high concentrations of chemical oxygendemand and biochemical oxygen demand in craw-fish pond effluent in spring and summer probablyresulted from an increase in phytoplankton andzooplankton production which was favored bywarmer temperatures and longer photoperiod.Decomposition of macrophytes and an increase insuspended bottom sediments from crawfish forag-ing and harvesting activities were also responsiblefor higher chemical oxygen demand and biochemi-cal oxygen demand in spring and summer. Thechemical oxygen demand concentration of efflu-ents in ponds with rice (mean = 41.3 mg/L) andsorghum-sudan grass (mean = 40.7 mg/L) was higher than in ponds with native terrestrial andaquatic flora (mean = 33.4 mg/L), but there was no difference in biochemical oxygen demand ofeffluents among the three forage types. The high
chemical oxygen demand in rice and sorghum-sudan grass pond effluents resulted from anincrease in particulate organic matter from decomposition of the high standing crop of plantedforages compared with native vegetation.
Total solids concentration in spring and summerranged from 143 mg/L to 2,431 mg/L (mean = 522mg/L), and total volatile solids ranged from 0 mg/Lto 432 mg/L (mean = 96 mg/L). Total solids andtotal volatile solids concentrations in summer(mean = 607 mg/L and 109 mg/L, respectively)increased significantly from concentrations inspring (mean = 460 mg/L and 87 mg/L), and theincrease was attributed to crawfish harvesting, adecrease in vegetation, and bottom foraging bycrawfish which suspended sediment. Bottom sedi-ments were also evident in summer effluents aswater was discharged during summer drainage.Effluents from ponds with native vegetation hadsignificantly lower concentrations of total solidsand total volatile solids in spring and summer(mean = 286 mg/L and 69 mg/L, respectively) thanin rice ponds (mean = 646 mg/L and 113 mg/L)and sorghum-sudan grass ponds (mean = 578 mg/Land 92 mg/L. Ponds with native vegetation hadhigh standing crops of aquatic macrophytes inspring and summer which helped to settle sedi-ments that were suspended from harvesting activi-ties. Macrophytes also reduced the effect of windon ponds which contributes significantly to suspen-sion of bottom sediments, particularly in shallowponds. Settleable solids concentration in summer(mean = 0.312 mL/L) increased 429% from fall,winter, and spring concentrations (mean = 0.059mL/L). Bottom foraging activity by crawfish andharvesting contributed to the high levels of set-tleable solids in spring and summer by suspendingbottom sediments. Also, bottom sediments werehigher in effluent water during drainage. No differ-ence in the concentration of settleable solids wasobserved among the three forage regimes.
Soluble reactive phosphorus concentrations rangedfrom 0.002 to 0.653 mg/L (mean = 0.116 mg/L),and total phosphorus concentrations ranged from0.039 mg/L to 1.126 mg/L (mean = 0.329 mg/L).The concentrations of soluble reactive phosphorusand total phosphorus in crawfish pond effluentsincreased from fall (mean soluble reactive phospho-rus = 0.081 mg/L and mean TP = 0.141 mg/L) to
11

winter (mean soluble reactive phosphorus = 0.132mg/L and mean total phosphorus = 0.314 mg/L).The concentration of soluble reactive phosphorusin the fall (mean = 0.081 mg/L) differed signifi-cantly from that in winter (mean = 0.132 mg/L),spring (mean = 0.118 mg/L), and summer (mean =0.139 mg/L). The soluble reactive phosphorus concentrations in effluents from ponds with nativevegetation (mean = 0.093 mg/L) and rice (mean =0.114 mg/L) were less than in ponds with sorghum-sudan grass (mean = 0.164 mg/L).The concentra-tion of total phosphorus did not differ betweenwinter (mean = 0.314 mg/L) and spring (mean =0.324 mg/L). Total phosphorus concentration insummer (mean = 0.614 mg/L) differed significantlyfrom concentrations in fall, winter, and spring. Totalphosphorus concentrations were lower in pondswith native vegetation (mean = 0.268 mg/L) than in ponds with rice (mean = 0.327 mg/L) andsorghum-sudan grass (mean = 0.425 mg/L). Thedecomposition of macrophytes after ponds wereflooded in the fall was reflected in higher concen-trations of soluble reactive phosphorus and totalphosphorus in effluents in winter and spring.Relatively high soluble reactive phosphorus andtotal phosphorus concentrations were present insummer effluents, particularly in rice and sorghum-sudan grass ponds, from the release of phosphorusin suspended bottom sediments. High concentra-tions of soluble reactive phosphorus in rice andsorghum-sudan grass ponds in winter, spring, andsummer was also indicative of a low phytoplanktondensity. The summer concentration of soluble reac-tive phosphorus was relatively low in ponds withnative vegetation because inorganic phosphateswere utilized by aquatic macrophytes.
Concentrations of total ammonia-nitrogen in winter(mean = 0.232 mg/L) and spring (mean = 0.302mg/L) was 160 and 240% higher, respectively, thanin fall (mean = 0.089 mg/L), and the increase waslargely attributed to decomposition of macrophytesand an increase in suspended bottom sediments.The mean total ammonia-nitrogen concentration insummer (mean = 0.353 mg/L) did not differ fromthe spring concentration. Total ammonia-nitrogenwas higher in ponds with sorghum-sudan grass(mean = 0.304 mg/L) than in ponds with rice(mean = 0.215 mg/L) or native vegetation (mean =0.236 mg/L). The mean concentration of Kjeldahl
nitrogen in spring (mean = 3.063 mg/L) and sum-mer (mean = 3.007 mg/L) was higher than the concentration in fall (mean = 1.039 mg/L) and winter (mean = 1.688 mg/L), and the increase wascaused by an increase in organic matter fromdecomposition of macrophytes, and an increase insuspended bottom sediments. The concentration of Kjeldahl nitrogen was higher in ponds with rice(mean = 2.615 mg/L) and sorghum-sudan grass(mean = 2.546 mg/L) than in ponds with nativevegetation (mean = 2.005 mg/L). Nitrite-nitrogenand nitrate-nitrogen concentration increased 167%and 114% from fall (mean nitrite = 0.006 mg/L andmean nitrate = 0.035 mg/L) through spring (meannitrite = 0.016 mg/L and mean nitrate = 0.075mg/L), but declined 44% and 47% by summer(mean nitrite = 0.009 mg/L and mean nitrate =0.040 mg/L). Nitrite and nitrate concentration inponds with sorghum-sudan grass (mean nitrite =0.018 mg/L and mean nitrate = 0.087 mg/L) wereabout 100% and 102% higher, respectively, thanconcentrations in ponds with rice (mean nitrite =0.009 mg/L and mean nitrate = 0.043 mg/L) orwith native vegetation (mean nitrite = 0.007 mg/Land mean nitrate = 0.043 mg/L). Nitrite-nitrogenconcentrations are highest in cold months becauseof lower assimilation rates of nitrogen by phyto-plankton, nitrification of ammonia and denitrifica-tion of nitrate, and disturbance of anaerobic sedi-ments by mechanical aeration. Concentrations of nitrate are correlated with nitrite because ofnitrification of nitrite to nitrate, and high concentra-tions of nitrate are favored by low phytoplanktonabundance.
ConclusionsThe concentrations of nutrients and solids in efflu-ents in crawfish ponds are generally much higherin spring and summer than fall and winter. Effluentquality is poorest during the summer drainage period. The type and quantity of summer vegeta-tive foliage have a significant influence on the quality of the water discharged from crawfishponds. Ponds with native vegetation generally havelower concentrations of nutrients and solids thanponds with rice or sorghum-sudan grass, and thusare most likely to comply with effluent standards.Ponds with volunteer vegetation generally havelower vegetative biomass in fall than ponds with
12
planted forages, and the presence of aquatic macro-phytes in spring and summer in ponds with nativevegetation increases nutrient uptake and reducesthe level of suspended sediments. Ponds plantedwith rice or sorghum-sudan grass could requiresome pretreatment of effluents prior to dischargeto reduce the concentration of nutrients and solids.Also, planting aquatic macrophytes near the ponddrain may act as a natural filtration system toreduce the amount of suspended solids and nutri-ents discharged in effluents of crawfish ponds.
Quality of Effluents fromHybrid Striped Bass Ponds
Commercial production of hybrid striped bass is arapidly growing segment of aquaculture in thesoutheastern United States. Most of the productionoccurs in the south Atlantic coastal states, althoughsome production can be found in all states of theregion. Water is periodically discharged from pondsused to raise hybrid striped bass and concern overthe impact of those discharges has been voiced bysome regulatory agencies. Much of this concern isbased on the lack of any information regarding thenature and volume of effluents released from com-mercial culture ponds.Therefore, this study wasconducted to provide a representative databasefrom commercial hybrid striped bass ponds.
MethodsTwenty commercial hybrid striped bass ponds inSouth Carolina were sampled in this study. Anattempt was made to include ponds on both largeand small operations, as well as ponds from boththe coastal plain and piedmont areas of the state.Most striped bass hybrids are farmed using fresh-water, although there is some interest in includingstriped bass hybrids in the diversification of coastalaquaculture farms which raise shrimp and estuarinefish. Most of the commercial ponds sampled werefreshwater but there was some representation ofsaltwater ponds as well. The striped bass farmingindustry in the state is vertically integrated withproduction of broodstock, sac fry, fingerlings andseveral categories of market fish. While the sam-pling tended to concentrate on growout ponds,fingerling production ponds and one broodstockpond were also included. Where possible, individ-
ual ponds were followed through a productioncycle from one quarter to the next. The same pondand group of fish were tracked for up to four con-secutive annual quarters.
Water samples were collected from the surface andbottom of each pond using a Kemmerer water sam-pler. Samples were also collected from the watersource (either well or surface water) for each farmon the day ponds were sampled. From each sample,a subsample was acid-preserved for nutrient analy-sis and a corresponding subsample was placed onice for analysis of other variables. Water sampleswere returned to the laboratory as quickly as possi-ble and analyses were initiated immediately uponreceipt at the laboratory.
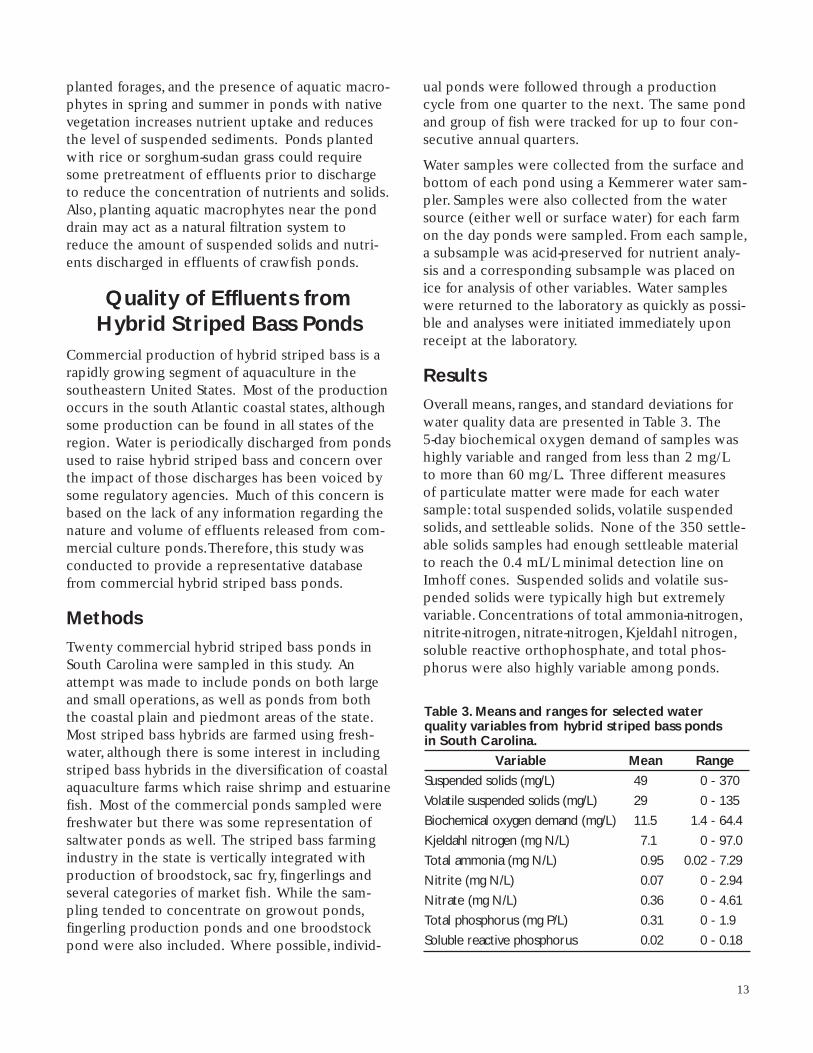
ResultsOverall means, ranges, and standard deviations forwater quality data are presented in Table 3. The 5-day biochemical oxygen demand of samples washighly variable and ranged from less than 2 mg/Lto more than 60 mg/L. Three different measures of particulate matter were made for each watersample: total suspended solids, volatile suspendedsolids, and settleable solids. None of the 350 settle-able solids samples had enough settleable materialto reach the 0.4 mL/L minimal detection line onImhoff cones. Suspended solids and volatile sus-pended solids were typically high but extremelyvariable. Concentrations of total ammonia-nitrogen,nitrite-nitrogen, nitrate-nitrogen, Kjeldahl nitrogen,soluble reactive orthophosphate, and total phos-phorus were also highly variable among ponds.
13
Table 3. Means and ranges for selected water quality variables from hybrid striped bass ponds in South Carolina.
Variable Mean Range
Suspended solids (mg/L) 49 0 - 370
Volatile suspended solids (mg/L) 29 0 - 135
Biochemical oxygen demand (mg/L) 11.5 1.4 - 64.4
Kjeldahl nitrogen (mg N/L) 7.1 0 - 97.0
Total ammonia (mg N/L) 0.95 0.02 - 7.29
Nitrite (mg N/L) 0.07 0 - 2.94
Nitrate (mg N/L) 0.36 0 - 4.61
Total phosphorus (mg P/L) 0.31 0 - 1.9
Soluble reactive phosphorus 0.02 0 - 0.18
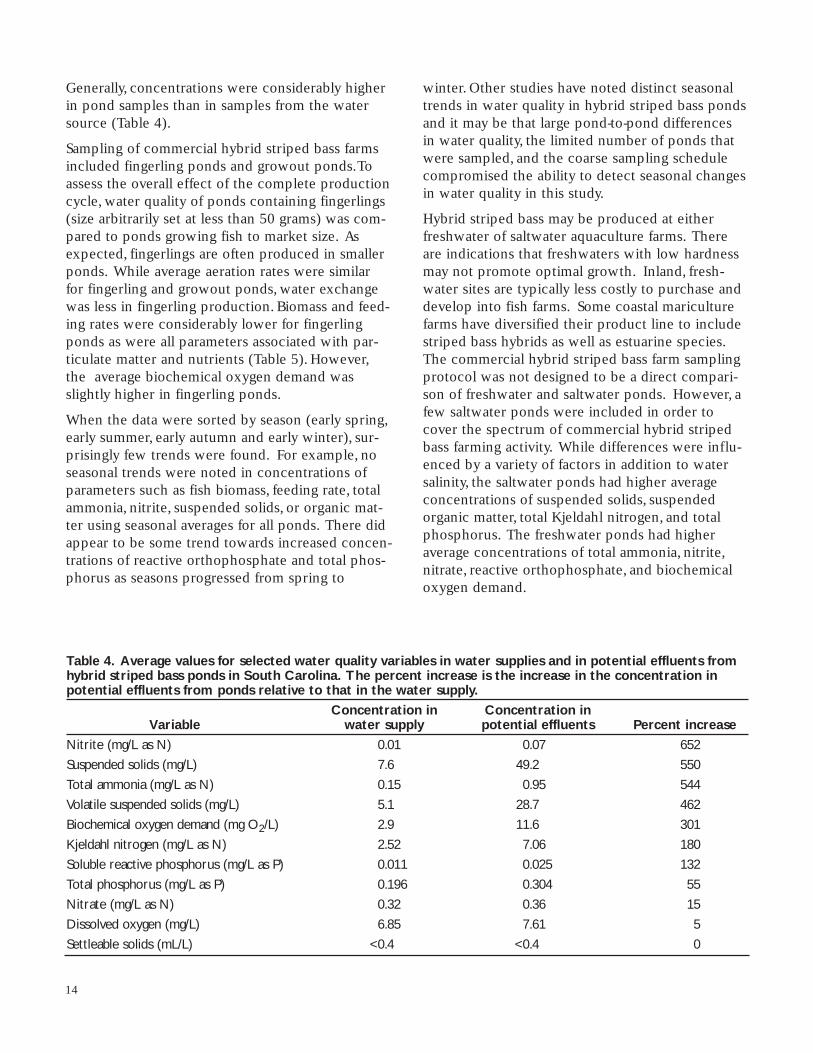
Generally, concentrations were considerably higherin pond samples than in samples from the watersource (Table 4).
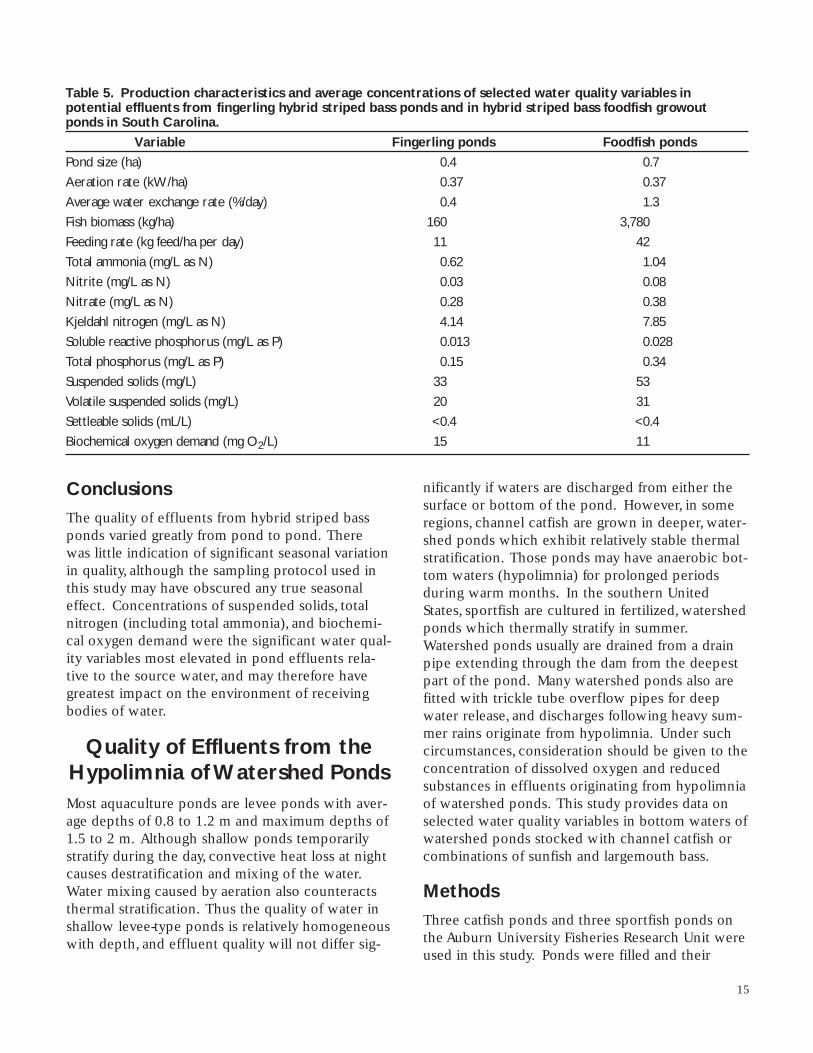
Sampling of commercial hybrid striped bass farmsincluded fingerling ponds and growout ponds.Toassess the overall effect of the complete productioncycle, water quality of ponds containing fingerlings(size arbitrarily set at less than 50 grams) was com-pared to ponds growing fish to market size. Asexpected, fingerlings are often produced in smallerponds. While average aeration rates were similarfor fingerling and growout ponds, water exchangewas less in fingerling production. Biomass and feed-ing rates were considerably lower for fingerlingponds as were all parameters associated with par-ticulate matter and nutrients (Table 5). However,the average biochemical oxygen demand wasslightly higher in fingerling ponds.
When the data were sorted by season (early spring,early summer, early autumn and early winter), sur-prisingly few trends were found. For example, noseasonal trends were noted in concentrations ofparameters such as fish biomass, feeding rate, totalammonia, nitrite, suspended solids, or organic mat-ter using seasonal averages for all ponds. There didappear to be some trend towards increased concen-trations of reactive orthophosphate and total phos-phorus as seasons progressed from spring to
winter. Other studies have noted distinct seasonaltrends in water quality in hybrid striped bass pondsand it may be that large pond-to-pond differencesin water quality, the limited number of ponds thatwere sampled, and the coarse sampling schedulecompromised the ability to detect seasonal changesin water quality in this study.
Hybrid striped bass may be produced at eitherfreshwater of saltwater aquaculture farms. Thereare indications that freshwaters with low hardnessmay not promote optimal growth. Inland, fresh-water sites are typically less costly to purchase anddevelop into fish farms. Some coastal mariculturefarms have diversified their product line to includestriped bass hybrids as well as estuarine species.The commercial hybrid striped bass farm samplingprotocol was not designed to be a direct compari-son of freshwater and saltwater ponds. However, afew saltwater ponds were included in order tocover the spectrum of commercial hybrid stripedbass farming activity. While differences were influ-enced by a variety of factors in addition to watersalinity, the saltwater ponds had higher averageconcentrations of suspended solids, suspendedorganic matter, total Kjeldahl nitrogen, and totalphosphorus. The freshwater ponds had higheraverage concentrations of total ammonia, nitrite,nitrate, reactive orthophosphate, and biochemicaloxygen demand.
14
Table 4. Average values for selected water quality variables in water supplies and in potential effluents from hybrid striped bass ponds in South Carolina. The percent increase is the increase in the concentration inpotential effluents from ponds relative to that in the water supply.
Concentration in Concentration inVariable water supply potential effluents Percent increase
Nitrite (mg/L as N) 0.01 0.07 652
Suspended solids (mg/L) 7.6 49.2 550
Total ammonia (mg/L as N) 0.15 0.95 544
Volatile suspended solids (mg/L) 5.1 28.7 462
Biochemical oxygen demand (mg O2/L) 2.9 11.6 301
Kjeldahl nitrogen (mg/L as N) 2.52 7.06 180
Soluble reactive phosphorus (mg/L as P) 0.011 0.025 132
Total phosphorus (mg/L as P) 0.196 0.304 55
Nitrate (mg/L as N) 0.32 0.36 15
Dissolved oxygen (mg/L) 6.85 7.61 5
Settleable solids (mL/L) <0.4 <0.4 0
ConclusionsThe quality of effluents from hybrid striped bassponds varied greatly from pond to pond. Therewas little indication of significant seasonal variationin quality, although the sampling protocol used inthis study may have obscured any true seasonaleffect. Concentrations of suspended solids, totalnitrogen (including total ammonia), and biochemi-cal oxygen demand were the significant water qual-ity variables most elevated in pond effluents rela-tive to the source water, and may therefore havegreatest impact on the environment of receivingbodies of water.
Quality of Effluents from theHypolimnia of Watershed PondsMost aquaculture ponds are levee ponds with aver-age depths of 0.8 to 1.2 m and maximum depths of1.5 to 2 m. Although shallow ponds temporarilystratify during the day, convective heat loss at nightcauses destratification and mixing of the water.Water mixing caused by aeration also counteractsthermal stratification. Thus the quality of water inshallow levee-type ponds is relatively homogeneouswith depth, and effluent quality will not differ sig-
nificantly if waters are discharged from either thesurface or bottom of the pond. However, in someregions, channel catfish are grown in deeper, water-shed ponds which exhibit relatively stable thermalstratification. Those ponds may have anaerobic bot-tom waters (hypolimnia) for prolonged periodsduring warm months. In the southern UnitedStates, sportfish are cultured in fertilized, watershedponds which thermally stratify in summer.Watershed ponds usually are drained from a drainpipe extending through the dam from the deepestpart of the pond. Many watershed ponds also arefitted with trickle tube overflow pipes for deepwater release, and discharges following heavy sum-mer rains originate from hypolimnia. Under suchcircumstances, consideration should be given to theconcentration of dissolved oxygen and reducedsubstances in effluents originating from hypolimniaof watershed ponds. This study provides data onselected water quality variables in bottom waters ofwatershed ponds stocked with channel catfish orcombinations of sunfish and largemouth bass.
MethodsThree catfish ponds and three sportfish ponds onthe Auburn University Fisheries Research Unit wereused in this study. Ponds were filled and their
15
Table 5. Production characteristics and average concentrations of selected water quality variables in potential effluents from fingerling hybrid striped bass ponds and in hybrid striped bass foodfish growout ponds in South Carolina.
Variable Fingerling ponds Foodfish ponds
Pond size (ha) 0.4 0.7
Aeration rate (kW/ha) 0.37 0.37
Average water exchange rate (%/day) 0.4 1.3
Fish biomass (kg/ha) 160 3,780
Feeding rate (kg feed/ha per day) 11 42
Total ammonia (mg/L as N) 0.62 1.04
Nitrite (mg/L as N) 0.03 0.08
Nitrate (mg/L as N) 0.28 0.38
Kjeldahl nitrogen (mg/L as N) 4.14 7.85
Soluble reactive phosphorus (mg/L as P) 0.013 0.028
Total phosphorus (mg/L as P) 0.15 0.34
Suspended solids (mg/L) 33 53
Volatile suspended solids (mg/L) 20 31
Settleable solids (mL/L) <0.4 <0.4
Biochemical oxygen demand (mg O2/L) 15 11
water levels maintained by runoff from woodedwatersheds. All ponds had maximum depthsgreater than 3 m; average depths ranged from 1.4to 2.5 m. Channel catfish ponds were stocked at5,000 fish/ha and fed at 3% body weight 6 days perweek with a pelleted, 32% protein feed. Dissolvedoxygen concentrations were monitored at night,and aeration was applied with tractor-powered orfloating electric paddlewheel aerators on nightswhen low dissolved oxygen concentrations wereanticipated. Sportfish ponds were stocked withsunfish and largemouth bass. Ponds were fertilizedmonthly with 8 L/ha of 10-34-0 liquid fertilizer.Aeration was not applied to sportfish ponds.
Depth profiles of dissolved oxygen concentrationsand water temperatures were made on six datesbetween 7 July and 16 September 1992 with apolarographic oxygen meter and thermistor at thedeepest areas (near the drain pipe inlets) of ponds.Water samples were collected about 30 cm abovethe pond bottoms in the deepest parts of theponds with a van Dorn water sampler. Sampleswere transferred without air contaminationthrough a latex tube to BOD bottles.Temperatureand dissolved oxygen measurements and watersample collections were made on clear daysbetween 0930 and 1230 hours. Samples weremaintained on ice in insulated chests and trans-ported to the laboratory for analysis on the sameday. The following water analyses were conducted:biochemical oxygen demand, total ammonia, nitrite,ferrous iron, total manganese, and total sulfide.
ResultsThermal stratification was much more pronouncedin sportfish ponds than in catfish ponds. Lack ofstrong thermal stratification in catfish ponds wasprobably the result of frequent nighttime aerationin the catfish ponds. Cooler weather in Septemberresulted in thermal destratification of all ponds bythe last sampling date. Dissolved oxygen concentra-tions in catfish ponds often fell to 5 mg/L or lesswithin the surface 1 m. Sportfish ponds were oxy-genated to a greater depth than catfish ponds, andsurface strata containing more than 5 mg/L dis-solved oxygen were usually 1.5 m thick or more.Secchi disk visibilities usually were 15 to 25 cm incatfish ponds, but sportfish ponds had Secchi disk
visibilities of 30 to 40 cm. The greater abundanceof phytoplankton was responsible for shallower dis-solved oxygen stratification in catfish ponds than insportfish ponds. Based upon calculations madefrom bathometric maps of the ponds, roughly one-half of pond volumes were above 1-m contours,and about three-fourths of pond volumes wereabove the 1.7-m contour. Oxygen-depleted waterdid not, therefore, constitute a large percentage ofpond volumes; averages were 3.6% and 11.4% forcatfish ponds and sportfish ponds, respectively.A considerably larger volume of water containedless than 3 and 5 mg/L dissolved oxygen. Ofcourse, dissolved oxygen concentrations within the epilimnion fluctuated during the day inresponse to changes in insolation. Measurementsof dissolved oxygen were made between 0930 and1230 hours and percentages of the pond volumecontaining 3 and 5 mg/L dissolved oxygen were nodoubt smaller in the mid afternoon and greater atnight and early morning than those reported above.After the ponds destratified in mid-September,water in the bottom 30-cm stratum of catfish pondswas still depleted of dissolved oxygen. This proba-bly resulted from inadequate light penetration forphotosynthesis and high rates of microbial respira-tion at the soil-water interface.
Ferrous iron concentrations in hypolimnetic watersranged from 2.4 to 26 mg/L in catfish ponds andfrom 1.0 to 43.2 mg/L in sportfish ponds. Thesource of ferrous iron in anaerobic water is themicrobial reduction of insoluble ferric iron in thebottom soil to soluble ferrous iron. Catfish pondshad lower concentrations of ferrous iron thansportfish ponds on most sampling dates. Aerationof catfish ponds probably mixed oxygenated waterfrom the hypolimnion into the epilimnion, causingoxidation of a part of the ferrous iron to ferrichydroxide. There was a drastic decrease in ferrousiron concentration when the sportfish ponds ther-mally destratified in the autumn, but no suchdecline was observed in the catfish ponds. This isin agreement with the observation that the bottom0.3-m layer of water in catfish ponds was still anaer-obic even after thermal destratification occurred.
Concentrations of total manganese as high as 0.25 mg/L were found in the oxygen-depletedwater. Previous studies have shown that concentra-tions of total manganese in surface waters of
16

Alabama ponds seldom exceed 0.05 mg/L. Concen-trations of total sulfide in bottom waters were 0 to1.29 mg/L. Much higher concentrations of total sulfide have been measured in anaerobic waters inother locations. However, waters on the AuburnUniversity Fisheries Research Unit contain 1 to 2 mg/L of sulfate-S, so little sulfate is available forreduction to sulfide. High concentrations of ferrous iron also would result in precipitation ofsulfide as insoluble iron pyrite. Concentrations of nitrite-N in bottom waters were 0 to 0.15 mg/L.It is not unusual to find even higher concentrationsof nitrite-N in surface water of fish ponds. Concen-trations of total ammonia-nitrogen were higher inthe hypolimnetic waters of catfish ponds than insportfish ponds. This observation reflects the highinputs of nitrogen in feed. Surface waters of catfishponds stocked at the rates used in the presentstudy normally contain 0.5-1.5 mg/L total ammonia-nitrogen, while sportfish ponds fertilized at ratesused in this study seldom contain more than 0.25mg/L of total ammonia-nitrogen. Higher concentra-tions of total ammonia-nitrogen in bottom waterthan surface water likely resulted from microbialmineralization of ammonia from organic matterwhich settled to pond bottoms from epilimnia.Values of biochemical oxygen demand ranged from9.6 to 19.8 mg/L. Because the raw water sampleswere diluted directly in the BOD bottles, biochemi-cal oxygen demand values represent oxygen con-sumption by both oxidation of organic matter andreduced inorganic substances (primarily ferrousiron). The biochemical oxygen demand was similarin catfish and sportfish ponds on all but two dates(18 August and 2 September). These differencescannot be explained from existing data. Surface
waters of fish ponds usually have biochemical oxy-gen demand values of 10 to 25 mg/L (Boyd 1990),so the bottom waters were not exceptionally highin biochemical oxygen demand.
ConclusionsHypolimnetic water from deep watershed pondsfertilized to promote sunfish production or fed toenhance channel catfish yields may be of lowerquality than corresponding surface waters.Specifically, hypolimnetic waters may contain lowerdissolved oxygen concentrations and higher con-centrations of ferrous iron, total manganese, totalsulfide, and total ammonia than commonly found insurface waters. Discharge of hypolimnetic waterfrom ponds into natural waterways could havetoxic effects on fish and other aquatic organisms.Logical steps can be implemented to minimizeproblems with hypolimnetic discharges from water-shed ponds as follows:
1) fill deep water areas of watershed ponds withsoil during construction;
2) do not install deep water intake overflow pipes;
3) use water circulation devices or sufficient aera-tion to prevent thermal stratification;
4) harvest fish without draining water from ponds;
5) if ponds must be drained, drain after naturalthermal destratification occurs in the fall;
6) if water must be drained from the bottom ofthermally destratified ponds, detain the effluentin holding ponds or let it flow over a series ofcascades for reaeration before discharging intonatural waterways.
17

Reusing Water for MultipleFish Crops
The mass of nutrients or organic matter dischargedfrom ponds is a function of the concentration ofthe substance in the effluent and the volume ofwater discharged. Although it may be difficult toreduce the concentration of potential pollutants inpond effluents, it is relatively easy to control dis-charge volume. The most obvious procedure forreducing the volume of effluents from channel cat-fish ponds is to harvest the fish without drainingthe ponds. However, this practice is usable only ifyear-to-year reuse of water does not cause reducedfish yields due to deterioration of water qualityover time. This study was conducted to comparewater quality and fish production between annuallydrained ponds and undrained ponds over a 3-yearperiod.
Methods
Six levee ponds (400 to 660 m2 with averagedepths of 0.9 to 1.0 m and maximum depths of 1.3 to 1.5 m) on the Auburn University FisheriesResearch Unit were used in this research. In 1990,1991 and 1992, ponds were stocked with smallchannel catfish at 15,000 fish/ha in March and harvested in late September or October. A 32%crude protein, pelleted feed was offered 6 days perweek at 3% of body weight per day. Feeding rateswere increased weekly assuming a feed conversionratio of 1.6. When dead fish were observed inponds, they were removed and weighed so thatfeeding rates could be adjusted. Daily feeding ratedid not exceed 67 kg/ha per day. When this ratewas reached, it was continued until fish harvest.All ponds had a 0.37-kW vertical pump aerator connected to a timer. Aerators were operated frommidnight until 0700 hours daily from 15 June untilharvest each year. Water levels in ponds were main-tained 10 to 12 cm below the tops of standingdrain pipes to prevent overflow after rains. Water
was added from a pipeline when necessary toreplace evaporation and seepage losses.
Three ponds were designated to be harvested bydraining each year. To harvest fish, water levelswere lowered to about 10% of pond area and fishremoved with a seine. A wire mesh cap was placedaround the drain pipe and the remainder of thewater was discharged so that fish which escapedseining could be harvested by hand. After a 3-weekdrying period, ponds were refilled. In the otherthree ponds, a large seine was passed through theponds several times to capture the fish. Afterwards,rotenone was applied at 2.5 mg/L to kill anyremaining fish. Ponds were checked every fewhours for several days to make sure that all deadfish were removed. The total number of fish ineach pond was counted and weighed. A 10% subsample was taken for estimating average weightof individual fish.
Near the middle of each month, a 1-m water col-umn sampler was used to collect a water samplefrom the deep end of each pond. Samples weretaken between 0700 and 0800 hours and immedi-ately carried to the laboratory for analyses. The fol-lowing water quality variables were determined:settleable solids, total suspended solids, 5-day bio-chemical oxygen demand, Kjeldahl nitrogen, totalammonia, total phosphorus, and chlorophyll a(results of additional analyses can be found in K. S.Seok, C. E. Boyd, and M. F. Schwartz, 1995,WaterQuality in Annually Drained and Undrained ChannelCatfish Ponds over a Three-Year Period, ProgressiveFish-Culturist 57:52- 58).
ResultsPonds for this study were selected for similarity oftreatment history and inputs of organic matter,nitrogen and phosphorus to the ponds over the 19-year period of pond use were roughly equal.The water supply for all six ponds was a reservoirfilled by surface runoff from a forested watershed.
18
Objective 2: Evaluation of Management Practices That May Reduce the Impact of Aquaculture Effluents on theEnvironment

This water has a total alkalinity of 10 to 12 mg/Land low concentrations of nitrogen and phospho-rus.
Fish production data are summarized in Table 6.Each year, fish stock were of different weights, andgrowing seasons were of different lengths. Thesedifferences could not be avoided because of limitson availability of small fish and labor for harvestingthe fish. Net fish production, average weight of fishat harvest, and feed conversion ratio did not differsignificantly between treatments in any of the threeyears. However, net fish production was greater inboth treatments in 1990 than in other years andwas lower in 1992 than in 1990 and 1991, but feedconversion did not differ significantly among yearsin either treatment.
Phytoplankton blooms, as estimated from chloro-phyll a concentrations, increased as the grow-outperiod progressed in response to greater nutrientinputs from fish feed. Average chlorophyll a con-centrations (Table 7) did not differ between treat-ments in 1990 and 1992, but in 1991, undrainedponds contained more chlorophyll a than drainedponds. Because of aeration, dissolved oxygen con-centrations were usually above 3 mg/L at dawn inboth treatments. During July, August and Septem-ber of all years, there were mornings when averagedissolved oxygen concentrations fell below 3 mg/L,and in individual ponds, dissolved oxygen concen-trations as low as 1.5 mg/L were observed. How-ever, there was no significant mortality of fish as a
result of oxygen depletion.There were no differ-ences in dissolved oxygen concentration betweentreatments or among years.
Total ammonia-nitrogen concentrations werealmost identical between treatments in 1990.In 1991 and 1992, much higher peaks in totalammonia-nitrogen were observed in the undrainedtreatment than in the drained treatment, and aver-age total ammonia-nitrogen concentrations weregreater in the undrained ponds than in the drainedponds in 1992. This suggests that higher totalammonia-nitrogen concentrations may be expectedin undrained ponds. However, on the last samplingdates in October of 1991 and 1992, total ammonia-nitrogen concentrations were similar in both treat-ments. Concentrations of suspended solids, bio-chemical oxygen demand, Kjeldahl nitrogen, andtotal phosphorus increased as the growing seasonsprogressed each year. The highest concentrationsof individual variables observed in late summer andearly fall when feeding rates were high were: bio-chemical oxygen demand, 25 to 30 mg/L; totalphosphorus, 0.3 to 0.5 mg/L; Kjeldahl nitrogen,3 to 6 mg/L; and suspended solids, 80 to 100 mg/L.As noted above, differences between treatmentswere found for chlorophyll a and total ammonia-nitrogen, but no other differences in water qualityvariables were noted. The tendency for Kjeldahlnitrogen concentrations to increase over time inboth drained and undrained ponds is interesting,but it cannot be explained from existing data.
19
Table 6. Average channel catfish production data for three annually drained and three undrained ponds. Fishwere stocked at 15,000 fish/ha. Feed conversion is the weight of feed offered divided by net fish production.
Net fish production Average harvest size Feed conversionYear and treatment (kg/ha) (g/fish) (kg feed/kg fish)
1990Drained 6,580 452 1.47Undrained 6,683 465 1.51
1991Drained 5,750 430 1.31Undrained 5,860 480 1.31
1992Drained 5,230 360 1.28Undrained 4,990 390 1.33

20
ConclusionsFew differences in water quality and no differencesin fish production were observed between annuallydrained and undrained catfish ponds over a 3-yearperiod. Findings also suggested that effluents fromcatfish ponds which had not been drained for 3 years were similar in quality to those from catfishponds drained each year. Natural processes, such asnutrient uptake by bottom soils, microbial decom-position of organic matter, denitrification, and sedi-mentation, continually remove potential pollutantsfrom pond water. Operation of ponds withoutdraining makes use of the waste assimilation capa-city of the pond ecosystem; it is not merely a wayto delay discharge of wastes. As such, ponds maybe operated for multiple years without drainingwith no decrease in fish production attributable todeterioration in environmental conditions withinthe pond. Reuse of water for multiple crops willresult in significant savings in water use and willalso reduce overall effluent volume.
Using Conservative WaterManagement Practices
When fish are grown in ponds, wastes are heldwithin the culture system for some time beforethey are released. During that time, natural pro-cesses remove potential pollutants from the waterand the amounts of nutrients and organic matterultimately discharged from ponds are, therefore,substantially less than the overall waste loading tothe pond. Also, the volume of water dischargedfrom ponds can be controlled to some extent bymanipulating pond water storage capacity andreusing water for multiple fish crops before drain-
ing the pond. Therefore, it may be possible to sig-nificantly reduce discharge of nutrients and organicmatter from ponds and, by extension, diminish theimpact of discharge on receiving waters by usingrelatively simple water management practices thatreduce effluent volume or delay water dischargefrom ponds.The following study was undertaken tocharacterize effluents from channel catfish cultureponds in northwest Mississippi and to model thereduction in waste discharge that could result fromthe use of two water management practices: main-taining surplus water storage capacity and notdraining ponds between fish crops.
MethodsA water quality data set was generated by samplingcommercial channel catfish ponds in northwestMississippi for 2 years (summarized in Table 2,above). That information was then used in a hydro-logic model of pond overflow volume to describethe reduction in waste discharge that could resultfrom the use of two water management practices:maintaining surplus water storage capacity and notdraining ponds between fish crops.
Water discharged from catfish ponds, as a result ofoverflow only, was calculated using a hydrologicalequation, with appropriate climatological data forthe period 1961-1990 obtained from the NationalWeather Service Cooperative Observation Systemfor Stoneville, Mississippi. Pond evaporation wasobtained by multiplying pan evaporation data by0.8 and a value of 0.04 cm/day was assumed forinfiltration losses.
Quarterly overflow losses were determined for twopond water management scenarios. One scenario
Table 7. Average concentrations (± 95% confidence intervals) for selected water quality variables in threeannually drained and three undrained channel catfish ponds.
1990 1991 1992
Variable Drained Undrained Drained Undrained Drained Undrained
Suspended solids (mg/L) 35.2±9.8 40.0±12.2 28.1±11.9 46.3±21.5 70.6±16.5 74.3±11.5
BOD5 (mg O2/L) 12.8±3.6 11.7±4.1 12.0±5.3 13.3±2.5 11.6±2.6 10.4±3.4
Kjeldahl nitrogen (mg N/L) 0.66±0.35 1.12±0.39 2.53±0.41 3.34±0.52 4.12±0.60 4.79±0.71
Total ammonia (mg N/L) 0.47±0.12 0.38±0.09 0.97±0.13 0.91±0.07 0.59±0.10 1.11±0.15
Total phosphorus (mg P/L) 0.29±0.09 0.23±0.05 0.35±0.10 0.24±0.08 0.42±0.15 0.27±0.17
Chorophyll a (µg/L) 98±15 115±25 116±27 188±20 65±12 72±10

assumed that ground water was pumped into thepond at the end of each day to replace evaporationplus infiltration. In other words, no storage capa-city was maintained in the pond and any rainfall inexcess of losses was lost as overflow through thedrain. This scenario estimated the maximum pondoverflow that could occur under a given set of cli-matic conditions. The other scenario is a manage-ment option designed to reduce the need forpumped water and reduce overflow volume byallowing for storage of much of the annual rainfall.In that scenario, pond water level was allowed tofluctuate with climatic conditions until pond waterlevels dropped to 15 cm below the overflow struc-ture due to evaporation and infiltration losses inexcess of rainfall. At that point, ground water wasadded to raise the water level to 7.5 cm below thetop of the drain leaving 7.5 cm of storage potentialto capture rainfall that subsequently occurred.Overflow losses were estimated using weather datafor the 30-year (1961-1990) average, the year ofrecord with the most precipitation (1979), the yearof record with the least precipitation (1986), quar-ters of record with the most precipitation, andquarters of record with the least precipitation.
Pond overflow volumes estimated for the twowater management scenarios were then used tocalculate amounts of nitrogen, phosphorus, andorganic matter discharged from ponds as a result ofoverflow only. Mass discharges (in kg/ha of pondsurface) were computed as the product of pondoverflow volume and overall mean concentrationsof total nitrogen, total phosphorus, chemical oxy-gen demand, and biochemical oxygen demand foreach season.
Annual nutrient and organic matter mass dischargeswere then calculated for ponds managed under thetwo different water management scenarios (withand without storage potential) and operated withthree intervals (1, 3 and 5 years) between totalpond drainings. For ponds drained annually it wasassumed that fingerling channel catfish werestocked in early spring, fish were grown throughspring, summer and autumn, and ponds weredrained in winter. Pond discharge thus consisted of overflow in spring, summer and autumn plus125 cm of water discharged during pond drainingin winter. Nutrient and organic matter mass dis-charges were calculated as the product of the mod-
eled total water volume released from ponds (over-flow plus pond draining) and the overall averageconcentration of total nitrogen, total phosphorus,and chemical oxygen demand measured in pondsin the corresponding seasons. Mass dischargeswere similarly calculated for ponds used for culturewith 3 and 5 years between pond drainings, againassuming ponds were stocked in early spring anddrained in winter of the appropriate year. Totalmass discharges over the 3- or 5-year period werethen divided by the 3 or 5, respectively, to obtainaverage annual discharges of nitrogen, phosphorusand organic matter.
ResultsSeasonal variation in pond overflow volume wasrelated in a direct and obvious manner to annualchanges in climatic conditions because precipita-tion and evaporation are major components of thehydrologic equation. Modeled pond overflow vol-umes for the average year were predictably highestin the winter and spring when rainfall was highestand pond evaporation rates were lowest (Table 8),except during the driest year on record (1986)when rainfall was evenly distributed among sea-sons.
Combining the modeled overflow volumes andmeasured concentrations of pond water qualityvariables revealed that seasonal changes in over-flow volume were more important than seasonalchanges in the composition of the pond effluent indetermining the mass of nutrients and organic mat-ter discharged from Mississippi catfish ponds.Specifically, predicted mass discharge was greatestin the winter when overflow volume was maxi-mum and not in the summer when concentrationsof nutrients and organic matter in the pond werehighest.
The model showed that managing ponds to main-tain water storage potential resulted in large reduc-tions in nutrient and organic matter discharge(Table 9). In an average year, modeled annual dis-charge of nitrogen, phosphorus, and organic matterfrom ponds managed to maintain water storagepotential was only about 30% of that from pondsnot managed to maintain surplus storage capacity.Even in wet years, modeled discharge of nutrientsand organic matter was considerably lower from
21
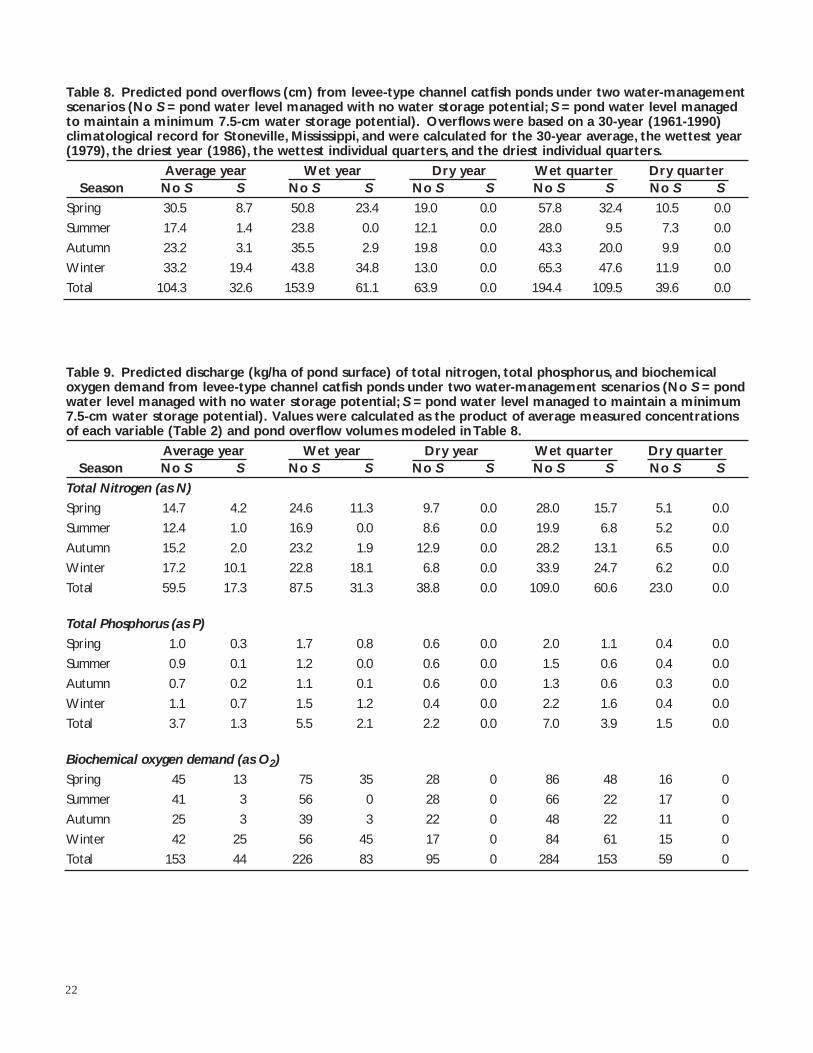
22
Table 8. Predicted pond overflows (cm) from levee-type channel catfish ponds under two water-managementscenarios (No S = pond water level managed with no water storage potential; S = pond water level managedto maintain a minimum 7.5-cm water storage potential). Overflows were based on a 30-year (1961-1990) climatological record for Stoneville, Mississippi, and were calculated for the 30-year average, the wettest year(1979), the driest year (1986), the wettest individual quarters, and the driest individual quarters.
Average year Wet year Dry year Wet quarter Dry quarterSeason No S S No S S No S S No S S No S S
Spring 30.5 8.7 50.8 23.4 19.0 0.0 57.8 32.4 10.5 0.0
Summer 17.4 1.4 23.8 0.0 12.1 0.0 28.0 9.5 7.3 0.0
Autumn 23.2 3.1 35.5 2.9 19.8 0.0 43.3 20.0 9.9 0.0
Winter 33.2 19.4 43.8 34.8 13.0 0.0 65.3 47.6 11.9 0.0
Total 104.3 32.6 153.9 61.1 63.9 0.0 194.4 109.5 39.6 0.0
Table 9. Predicted discharge (kg/ha of pond surface) of total nitrogen, total phosphorus, and biochemical oxygen demand from levee-type channel catfish ponds under two water-management scenarios (No S = pondwater level managed with no water storage potential; S = pond water level managed to maintain a minimum7.5-cm water storage potential). Values were calculated as the product of average measured concentrationsof each variable (Table 2) and pond overflow volumes modeled in Table 8.
Average year Wet year Dry year Wet quarter Dry quarterSeason No S S No S S No S S No S S No S S
Total Nitrogen (as N)
Spring 14.7 4.2 24.6 11.3 9.7 0.0 28.0 15.7 5.1 0.0
Summer 12.4 1.0 16.9 0.0 8.6 0.0 19.9 6.8 5.2 0.0
Autumn 15.2 2.0 23.2 1.9 12.9 0.0 28.2 13.1 6.5 0.0
Winter 17.2 10.1 22.8 18.1 6.8 0.0 33.9 24.7 6.2 0.0
Total 59.5 17.3 87.5 31.3 38.8 0.0 109.0 60.6 23.0 0.0
Total Phosphorus (as P)
Spring 1.0 0.3 1.7 0.8 0.6 0.0 2.0 1.1 0.4 0.0
Summer 0.9 0.1 1.2 0.0 0.6 0.0 1.5 0.6 0.4 0.0
Autumn 0.7 0.2 1.1 0.1 0.6 0.0 1.3 0.6 0.3 0.0
Winter 1.1 0.7 1.5 1.2 0.4 0.0 2.2 1.6 0.4 0.0
Total 3.7 1.3 5.5 2.1 2.2 0.0 7.0 3.9 1.5 0.0
Biochemical oxygen demand (as O2)
Spring 45 13 75 35 28 0 86 48 16 0
Summer 41 3 56 0 28 0 66 22 17 0
Autumn 25 3 39 3 22 0 48 22 11 0
Winter 42 25 56 45 17 0 84 61 15 0
Total 153 44 226 83 95 0 284 153 59 0

ponds managed to reduce overflow volume, andannual discharge from managed ponds was nil inexceptionally dry years. The greatest relative reduc-tion in predicted mass discharge of nutrients andorganic matter occurred in the summer quarter. Inan average summer, managing pond water levels tomaintain water storage potential reduced the pre-dicted discharge of nitrogen by more than 91%,phosphorus by more than 88%, chemical oxygendemand by more than 91%, and biochemical oxygen demand by more than 92% compared tosummertime discharge from ponds managed with-out storage potential. Based on the model, no nitrogen, phosphorus or organic matter would havebeen discharged as a result of overflow from pondsmanaged to maintain storage potential during thesummer of the wettest and driest year of recordand in the driest individual summer quarter.Although the model demonstrated that greatestamounts of nutrients and organic matter are dis-charged from ponds in northwest Mississippi in the winter and spring, reducing waste discharge in summer may be relatively more important thanat other times of the year because the quality ofpotential pond effluents is poorest and streamflows are at their annual minimum, resulting in low rates of dilution of any water discharged from ponds.
Harvesting fish without draining ponds betweencrops substantially reduced the average volume ofwater discharged each year, and the reduction wasgreatest when ponds were also managed to main-tain water storage potential. For ponds not man-aged to maintain surplus water storage, the modelshowed that using ponds for 3 years before drain-ing reduced annual average waste discharge byapproximately 30% compared to annually drainedponds and by about 45% when ponds were notdrained for 5 years (Table 10). When pond waterlevels were managed for water storage potential,discharge of nutrients and organic matter wasreduced relative to annually drained ponds by morethan 50% when ponds were used for 3 yearsbetween drainings, and by more than 60% andwhen ponds were used for 5 years between drain-ings. The use of ponds for several years withoutdraining and refilling is possible, in large part,because natural microbial and physicochemical
processes continually remove nutrients and organicmatter from pond water. The rate at which theseprocesses act is such that channel catfish ponds inthe southeastern United States can be used formany years without significant long-term accumula-tion of nutrients and organic matter in the watercolumn, despite large inputs of metabolic wasteresulting from fish feeding practices. When pondsare drained, the quantities of nutrients and organicmatter in the water that is discharged are, there-fore, much less than the total waste loading to thepond. Increasing the interval between pond drain-ings simply makes fuller use of the “waste treat-ment” capability of the pond ecosystem by allowingnatural processes to remove more wastes from thewater before discharging the water.
23
Table 10. Predicted quantities (kg/ha per year) of nitrogen, phosphorus and organic matter(expressed as chemical oxygen demand) dischargedannually from levee-type channel catfish pondsunder two water-management scenarios and threedifferent intervals between pond drainings. Pondeffluent volumes used to calculate mass dischargeswere for the average weather year based on a 30-year (1961-1990) climatological record for Stone-ville, Mississippi. No S = pond water level managedwith no water storage potential; S = pond waterlevel managed to maintain a minimum 7.5-cmwater storage potential.
Mass discharge(kg/ha per year)
Pond draining schedule No S S
Total Nitrogen (as N)
Drained annually 109 74
Drained every 3 years 76 36
Drained every 5 years 69 29
Total Phosphorus (as N)
Drained annually 7 5
Drained every 3 years 5 3
Drained every 5 years 4 2
Chemical oxygen demand (as O2)
Drained annually 1,480 1,020
Drained every 3 years 1,030 500
Drained every 5 years 940 400

ConclusionsReducing overflow volume by maintaining waterstorage potential in ponds appears to be a simple,inexpensive, and highly effective technique forreducing nutrient and organic matter discharge. Inaddition to the environmental benefits accruingfrom reduced waste discharge, maintenance of stor-age potential in ponds helps conserve groundwater resources by dramatically reducing the needfor pumped water to maintain pond water levelsduring fish culture. If surplus water storage capa-city is available, rainfall is captured in the pondrather than lost as overflow, and the stored waterhelps offset evaporative and infiltration losses.Further reduction in nutrient and organic matterdischarge can be achieved by not draining pondsannually for harvest.
Minimizing Water Exchangein Penaeid Shrimp Ponds
Culture of marine shrimp is the largest aquacultureindustry in the world. Although culture technolo-gies for marine shrimp vary widely, most pond man-agement practices involve some amount of waterexchange in the belief that exchange is needed tomaintain adequate environmental conditions forgood shrimp growth. Obviously, water exchangecan greatly increase the volume of effluent dis-charged from ponds. This study was conducted todetermine the effects of water exchange on marineshrimp production and to determine the impact ofwater exchange on pond effluent characteristics.
MethodsThis study was conducted during 1991 at theWaddell Mariculture Center (WMC), a field stationof the Marine Resources Division of the SouthCarolina Wildlife and Marine Resources Depart-ment. Five 0.1-ha, 1,300-m3 ponds were used.Three ponds were stocked with postlarval Penaeussetiferus at a density of 44 postlarvae/m2; one pondwas stocked at 22/m2 and a fifth pond at 66/m2.Ponds were fed a 3-mm diamenter, 40% protein pellet formulated specifically for shrimp twicedaily. Feeding actually began 10 days prior to stock-ing to induce a bloom of forage prey for postlarvae.
Total amounts of feed applied before stocking as“fertilizer” was proportionately 137.5, 275.0 and412.5 kg/ha for the three stocking densities of 22,44 and 66/m2 respectively. Feeding rates wereidentical for the three ponds stocked at 44/m2 andproportional for the two ponds stocked at 22 and66/m2 (50% and 150% of the rate used for the44/m2 ponds, respectively).
The following water quality variables were mea-sured routinely in all ponds: 5-day biochemical oxy-gen demand, nitrite, nitrate, total ammonia, Kjeldahlnitrogen, soluble reactive phosphorus, suspendedsolids, volatile suspended solids, and in vivo chloro-phyll flourescence (other variables were also mea-sured and data can be found in J. S. Hopkins, R. D.Hamilton, P.A. Sandifer, C. L. Browdy, and A. D.Stokes, 1993, Effect of Water Exchange Rate onProduction,Water Quality, Effluent Characteristicsand Nitrogen Budgets of Intensive Shrimp Ponds,Journal of the World Aquaculture Society 24:304-320). Except for those paramenters measured insitu (such as dissolved oxygen), all samples werecollected in polypropylene bottles and returnedimmediately to the lab for analysis. Samples weredrawn from just below the surface as water inthese heavily aerated ponds has been found to bevery homogenous.
One 44/m2 pond and the ponds stocked at 22 and66/m2 received no water exchange (except asnoted below), while water in the other two 44/m2
ponds was exchanged continuously beginning onday 37 at target rates of 25.0 and 2.5%/day, respec-tively. The ponds are hereafter referred to as 0%-22/m2, 0%-44/m2, 0%-66/m2, 2.5%-44/m2 and25%-44/m2. The combined effects of precipitation,exchange efficiency, and no pumping until day 37resulted in overall average water exchange rates of0.36%, 2.21%, and 18.44% per day for the threetreatments. Drain harvesting increases overall vol-ume of effluent to an average of 1.03%, 2.89% and19.10% of the pond volume per day for 0%, 2.5%and 25% exchange treatments, respectively.Cumulative water exchange over the course of thisstudy totaled 1.5, 4.3 and 28.3 pond volumes for0%, 2.5%t and 25% exchange treatments, respective-ly.
24

ResultsWater exchange and density treatments clearlyaffected shrimp survival. The pond stocked at66/m2 (0%-66/m2) was experiencing heavy mortali-ties by day 89. The 0%-44/m2 treatment also experi-enced mass mortalities. However, noticeable mor-tality did not occur until day 125 and was sporadicover the remaining 4 weeks of the study. Survivalin the other three ponds was excellent, rangingfrom 81.3 to 83.8 percent from direct stocking ofpostlarvae. Water exchange did not appear to affect growth rate. Fastest growth was seen in the 2.5%-44/m2 pond, followed by 0%-22/m2,25%-44/m2, 0%-44/m2 and 0%-66/m2. Growth rates were 0.8, 0.9 and 0.9g/wk for 25%-44/m2,2.5%-44/m2 and 0%-22/m2 ponds, respectively.Analysis of variance indicated that shrimp from2.5%-44/m2 and 0%-22/m2 ponds were not signifi-cantly different in size at harvest yet both were different from shrimp in the 25%-44/m2 pond.Production was highest in the 2.5%-44/m2 pondwith 6,375 kg/ha/crop, followed by 25%-44/m2 and0%-22/m2 with 5,655 and 3,169 kg/ha/crop, respec-tively. These growth rates and production levels areconsidered good for this species in intensive cul-ture. Shrimp production levels as high as 3,169kg/ha/crop without water exchange have not beenreported elsewhere. The level of productionachieved without water exchange is in excess ofaverage production levels of commercial shrimpfarms in South Carolina and the United States.Production of 6,375 kg/ha with only 2.5%/dexchange is also noteworthy.
Water quality differed dramatically among shrimpdensity and water exchange treatments for manyparamenters. Since the 0%-66/m2 pond was termi-nated and water flushed on day 89 due to massivemortalities, data for this pond was omitted frommost analyses. Average concentrations and standarddeviations for selected water variables in threewater exchange treatments stocked at 44 post-larvae/m2 and the no-exchange treatment stockedat 22 postlarvae/m2 are summarized in Table 11.Total ammonia-nitrogen concentrations fluctuatedwidely, often as an inverse response to changes inphytoplankton density. Total ammonia concentra-tions were low initially but the magnitude of fluctu-ations and, thus, average concentration tended toincrease as the season progressed. Total ammonialevels in the 25%-44/m2 pond was not significantlydifferent from that of inlet water. However, totalammonia concentrations increased significantlywith decreasing water exchange or increasing density. Maximum recorded concentrations of total ammonia-nitrogen were 2.7 mg/L for the 25%-44/m2 treatment, 5.6 mg/L for the 2.5%-44/m2
treatment, 9.1 mg/L for the 0%-44/m2 treatment,and 11.0 mg/L for the 0%-22/m2 treatment. Prior totermination, the 0%-66/m2 pond had a maximumrecorded value of 9.0 mg/L.
No significant difference in either nitrite-N ornitrate-N was observed between inlet water andany pond except the 0%-44/m2 treatment. In inletas well as pond water, both nitrite-N and nitrate-Ntended to increase substantially about day 70-75and were declining abruptly just prior to harvest.Maximum recorded values of nitrite-N were
25
Table 11. Average values (± standard deviation) for selected water quality variables in the water supply andin ponds used to raise shrimp, Penaeus setiferus, at three different daily water exchange rates (25%, 2.5%, and0%) and two different shrimp densities (44 shrimp/m2 and 22 shrimp/m2).
Treatment (water exchange rate:shrimp density)
Variable Water supply 25:44 2.5:44 0:44 0:22
Total ammonia (mgN/L) 0.3±0.4 0.5±0.4 1.0±0.9 3.0±2.2 1.5±1.5
Nitrite (mg N/L) 0.4±0.6 0.5±0.8 0.8±0.9 1.3±1.5 0.8±0.9
Nitrate (mg N/L) 4.1±4.9 3.9±5.0 7.2±7.2 9.8±11.0 6.4±6.8
Kjeldahl nitrogen (mg N/L) 4.2±4.7 6.5±3.7 9.2±2.8 15.4±5.2 11.8±6.8
BOD5 (mg O2/L) 1.5±1.4 8.5±4.3 14.7±6.6 18.8±8.1 12.1±5.4

3.8 mg/L for 25%-44/m2 treatment, 3.5 mg/L for the2.5%-44/m2 treatment, 6.3 mg/L for the 0%-44/m2
treatment, and 3.1 mg/L for the 0%-22/m2 treat-ment. Prior to termination, the 0%-66/m2 pond hada maximum recorded value of 15.0 mg/L. Kjeldahlnitrogen was significantly higher in the 25%exchange pond than inlet water but increased with higher stocking densities and lower waterexchange. Total nitrogen tended to decrease duringperiods when phytoplankton concentration waslow.
Soluble reactive phosphorus in the 25% exchangepond was not significantly different from inletwater. However, significant differences were notedas water exchange decreased or density increased.Soluble reactive phosphorus tended to be lowwhen phytoplankton was high. Total suspendedsolids and the volatile suspended solids tended toincrease over the course of the season, but therewere no significant differences between inlet waterand any of the ponds. Inlet water had the highestaverage concentration of organic solids. Like organic nitrogen, solids tended to decrease duringperiods when phytoplankton abundance was low.The 5-day biochemical oxygen demand of pondwater was higher than that of inlet water and tended to increase as water exchange was reducedand density increased. Differences between theinlet water and all ponds were significant. Therewere also significant differences between severalgroups of ponds. The average biochemical oxygendemand in low exchange and 0% exchange pondswas an order of magnitude higher than that of inletwater.
The amount of water discharged to produce a cropin ponds with normal survival was 6, 9 and 64 met-ric tons of water per kg of whole shrimp for the
0%-20/m2, 2.5%-44/m2 and 25%-44/m2 treatments,respectively. Thus, the 0% exchange and reducedexchange treatments result in water usage which isconsiderably below the estimated world-wide rangeof 39-199 mt water/kg shrimp. The “normal” 25%exchange treatment used in the present study had a water consumption rate (64 mt/kg) which fellwithin the range of values reported for commercialfarms.
The water quality parameters of primary impor-tance in discharge regulation are biochemical oxy-gen demand, suspended solids, total ammonia, andsoluble reactive phosphorus. Therefore, these fourparameters were further analyzed by determiningtotal mass of each discharged over the productionseason. Water exiting ponds due to precipitationwas included in the analysis. Daily concentrationswere multiplied by daily flows to determine totalmass of each paramenter in discharge water. Themass of each paramenter which entered pondsfrom the adjacent estuary through water exchange(via the inlet water sampling data) was subtractedfrom the daily discharge. Finally, daily discharge val-ues for each paramenter were summed for the sea-son and extrapolated to kg/ha per crop.
The total weight of nutrients, solids and oxygendemand being added to receiving water tended todecrease with decreasing water exchange and/ordecreasing stocking density (Table 12). Thus,shrimp farmers may have a cost effective means ofimmediately reducing impacts of their effluent onreceiving waters simply by reducing rates of waterexchange.
Mass transfer of these nutrients, solids and oxygendemand was then calculated after inclusion ofappropriate values for pond drainage at the end of the study and subtracting nutrients, solids and
26
Table 12. Mass discharge (kg/ha per crop) of substances from ponds prior to pond draining, less the quantitiespumped into ponds for routine water exchange. Ponds were used to raise shrimp, Penaeus setiferus, at threedifferent daily water exchange rates (25%, 2.5%, and 0%) and two different shrimp densities (44 shrimp/m2
and 22 shrimp/m2).
Reactive BiochemicalTreatment Total ammonia phosphorus Suspended solids oxygen demand
25% exchange:44 shrimp/m2 79.1 30.4 6,699 2,197
2.5% exchange:44 shrimp/m2 41.4 37.2 1,317 551
0% exchange:44 shrimp/m2 21.1 15.7 1,143 125
0% exchange:22 shrimp/m2 9.2 11.3 1,190 92
oxygen demand of water used to fill ponds initially.These values (Table 13) represent total transfer ofnutrients, solids, and biochemical oxygen demandfrom ponds to receiving streams for the entire production process. For ponds with very little routine water exchange, draining dramaticallyincreases total nutrients, solids and oxygen demandin discharged water. On the other hand, total dis-charge of nutrients, solids and oxygen demandfrom ponds with routine water exchange and continual dilution is affected relatively little byincorporating pond drainage in the model. Whenponds stocked at 44/m2 are compared after incor-porating pond drainage into total effluent loading,the 0% exchange treatment actually released moreammonia and orthophosphate than the 2.5%exchange treatment (Table 13). It must be notedthat concentrations of these dissolved inorganicnutrients are extremely dynamic and fluctuatewidely from one week to the next. Therefore, itmay be possible to minimize effects of ponddrainage on total nutrient discharge by timing harvest to coincide with periods of minimal con-centrations of certain dissolved nutrients. Forexample, if the hypothetical drainage day for the 0%-44/m2 pond had been three days earlier, thetotal amount of total ammonia released for the sea-son would have been 20% lower.
ConclusionsWithout resorting to water exchange or some typeof filtration, maximum stocking rates for shrimpfarms are somewhere between 22-44/m2 whichcorresponds to a peak feeding rate of about 70-140 kg/ha per day. This agrees with estimates of the assimilative capacity of static freshwater catfish ponds in the southeastern United States,which is thought to be about 112 kg/ha per day
of 32% protein feed. The much higher inorganicnitrogen concentrations for shrimp ponds with nowater exchange compared to freshwater catfishponds fed at similar rates suggests that the assimila-tive capacity of marine ponds is lower than that offreshwater ponds. In addition, the percentage ofnitrogen lost from the system through volatilizationand/or denitrification, as determined by nitrogenbudgets, may be lower for marine ponds.
This study has important implications for the inten-sive shrimp farming industry. First, water exchangein intensive pond culture can be dramaticallyreduced without sacrificing growth or survival.At lower limits of intensive production, or upperlimits of semi-intensive production, water exchangemay be eliminated entirely. Second, reduced oreliminated water exchange reduces total amountsof nutrients, solids and BOD discharged into adja-cent water bodies.
Using Pond Effluents forIrrigation of Soybeans
Water discharged from aquaculture ponds is oftenviewed simply as a waste product of the cultureprocess. However, that water still has value and itsreuse may have multiple benefits. For instance, ifponds are located near terrestrial crops that requireirrigation, it may be possible to use pond dischargefor irrigation water. That use will reduce actualpond discharge volume (and associated effects onreceiving bodies of water) and will benefit thecrop. The objectives of this research were to char-acterize the various water quality parameters in thepond effluent which can be used as irrigationwater for crops and to estimate their impact onintegrated crop and fish production system.
27
Table 13. Mass discharge (kg/ha per crop) of substances from ponds including water discharged during ponddraining, less the quantities pumped into ponds for initial filling and routine water exchange. Ponds were usedto raise shrimp, Penaeus setiferus, at three different daily water exchange rates (25%, 2.5%, and 0%) and twodifferent shrimp densities (44 shrimp/m2 and 22 shrimp/m2).
Reactive BiochemicalTreatment Total ammonia phosphorus Suspended solids oxygen demand
25% exchange:44 shrimp/m2 92.6 38.6 11,289 2,147
2.5% exchange:44 shrimp/m2 42.0 40.9 6,662 603
0% exchange:44 shrimp/m2 87.4 84.7 5,554 302
0% exchange:22 shrimp/m2 21.2 24.1 6,693 183
MethodsNine, 0. l-ha earthen ponds were filled to a depth of 1.2 m with well water and stocked, in triplicate,with 10- to 15-cm channel catfish fingerlings at22,000, 44,000 and 66,000 fish/ha. Fish were feddaily at 3% of body weight. Ponds were continuous-ly aerated and oxygen levels were above 4 mg/L atall times. Beginning in July, fish weighing more thanabout 0.25 kg were selectively harvested during thefirst week of each month. The last harvest was dur-ing the first week of November. Ponds were par-tially drained (25% of pond volume or about 30 cmof water) several times and the effluent applied toa soybean crop planted in a nearby field. Partiallydrained ponds were immediately filled with wellwater.The number of partial draining and refillingevents were in proportion to the stocking densi-ties; the high-density ponds were partially drainedand refilled eleven times, the medium-density fivetimes, and the low-density two times.The high-density ponds were thus drained approximately at 2-week intervals.
Soybeans were planted in the first week of Juneand harvested in the first week of November.Thecrop was planted with a conservation tillageplanter and no fertilizer was used.Twenty-four (sixreplicates of four treatments in a randomized com-plete block design) 13 m x 13 m field plots wereirrigated with the drained effluent. Control plotswere irrigated with well water on the same dayswhen the high-density effluent was applied. Plotswere sprinkler irrigated for about 3 hours whichamounted to about 3 cm of water during eachapplication.
Pond effluent samples were analyzed for chemicaloxygen demand, total ammonia, total phosphorus,Kjeldahl nitrogen, and total solids.
ResultsWater quality in pond effluents were not affectedby the fish density. Mean values of Kjeldahl nitro-gen were from 9 to 12 mg N/L and mean totalphosphorus concentrations ranged from 0.2 to 0.6 mg P/L. Chemical oxygen demand concentra-tions varied from 56 to 108 mg/L.The average totalammonia nitrogen values in the effluent were from0.4 to 1.24 mg/L and total solids contents were 139to 206 mg/L.
Since pond effluents contain nitrogen, phosphorusand other plant nutrients, crops can benefit if it isused as irrigation water. Based on the Kjeldahlnitrogen concentrations, it appears that the totalamount of nitrogen available for crops varied from0.9 to 1.2 kg N/ha from each centimeter of waterapplied. If the average irrigation amount isassumed to be 30 cm, then the available nitrogenwould be from 27 to 36 kg/ha.This represents a significant portion of nitrogen requirements ofmany agronomic crops. However, soybean yieldwas not affected by the effluent treatment,although the average soybean yield for all treat-ments was 3.6 metric tons/ha, which was doublethe average yield in Georgia. The higher-than-average yield in this study was due to irrigationalone.
ConclusionsIf water exchange is practiced to improve waterquality in fish ponds, the resulting effluent can beused to irrigate agronomic crops, although thenutrient content of the water may be too low toaffect crop production. The main advantage ofusing water from fish ponds for irrigation is thatthe overall discharge volume from the pond isreduced.
Treating Pond Effluents UsingConstructed Wetlands
Wetlands act as biological filters to remove pollu-tants from water, and natural and constructed wetlands sometimes are used for treatment of agri-cultural, municipal and industrial wastewaters.There are several advantages to wetland waste-water treatment. Wetlands are inexpensive to buildand operate, chemical treatment of wastewater iseliminated, wetlands contribute stability to localhydrologic processes, and plant communities inwetlands are excellent wildlife habitats.There isconcern over the feasibility of wetlands for treatingaquaculture effluents, because large areas of landmay be necessary. In the following study, a freewater surface wetland was constructed adjacent to a commercial channel catfish pond, and its effi-ciency in removing potential pollutants from pondwater was evaluated.
28
MethodsThe constructed wetland used in this study wasadjacent to a 6.9-ha channel catfish productionpond near Greensboro in Hale County, Alabama.Two cells, each 84 m long x 14 m wide, were builtin series. Perimeter levees were 3 m wide at topswith 2:1 (horizontal:vertical) side slopes. Verticaldistance from cell bottoms to levee tops was 0.61 m at the middle of the long axes. Cell bottoms and levees were constructed of heavy clay soil.
The 5-cm-diameter intake pipe of an electric pumpwas extended 10 m horizontally from the pondbank and then from the pump to the head of Cell Iwhere it discharged into a manifold that was per-pendicular to the long axis of the cell. Three 10-cm-diameter drain pipes were installed betweenthe end of Cell I and the head of Cell II. Two 10-cm-diameter drain pipes with elbows for attach-ing stand pipes were installed through the levee atthe end of Cell II and then connected to another10-cm-diameter drain pipe so that outflow fromCell II returned to the pond.
Rootstocks of California bulrush (Scirpus californi-cus), giant cutgrass (Zizaniopsis miliacea), andHalifax maidencane (Panicum hemitomon) wereprovided by the Alabama State Office of the USDASoil Conservation Service. Cells were planted dur-ing the last week of May 1992. Holes were made inthe dry pond bottom with a tool for transplantingpine tree seedlings. Rootstocks were placed inholes and holes were closed around rootstocks bytamping. The upper half of Cell I was planted withbulrush on 90-cm centers, and the lower half of thecell was planted with giant cutgrass on 180-cm centers. Cell II was planted with maidencane on90-cm centers. A single application of 10 g/m2 offertilizer (8% N, 8% P2O5, 8% K2O) was applied over
Cell II two months after planting because the maid-encane was not growing very well. The pump wasoperated continuously, and water depth was main-tained at 5 cm while plants became established.
Four mean hydraulic residence time regimes (1, 2, 3 and 4 days) were used in the study. The efficiency of the wetland in reducing concentra-tions of selected water quality variables at each
mean hydraulic residence time was determinedover 6-week periods. A 3-day mean hydraulic resi-dence time was conducted from 13 October to 24 November 1992 during the non-growing season.The 2-day mean hydraulic residence time was tested between 11 May and 15 June 1993; the 1-daymean hydraulic residence time was tested from 6 July to 10 August 1993; the 4-day mean hydraulicresidence time was tested from 24 August to 29 September 1993. Water flow through the wet-land was maintained between trials by operatingthe pump continuously.
During a trial, water samples were collected weeklyfrom the inflow pipe, the drain of Cell I, and thedrain of Cell II. Samples were analyzed for 5-daybiochemical oxygen demand, total Kjeldahl nitro-gen, total phosphorus, suspended solids, volatilesuspended solids, and settleable solids.
ResultsPlants grew slowly, and by the end of September1992 only the bulrush had grown enough to pro-vide full canopy over the area in which it wasplanted. By summer 1993, after a growing periodof 280 days, the cutgrass had formed a full canopyover the area where it was planted.The maiden-cane continued to spread, but even at the end ofthe study it had not produced a full canopy.Sampling to estimate the quantity of vegetation and composition of soil in the cells was not con-ducted during the study to avoid destruction anddisturbance of the plants. Standing crops of plantbiomass in Cell I at the end of the study averagedabout 3,400 g dry weight/m2 for bulrush, and about6,500 g dry weight/m2 for cutgrass. In Cell II,standing crop of maidencane averaged about 3,000 g dry weight/m2. Vegetation consisted pri-marily of the species planted, but there was someinvasion of cattail (Typha latifolia) along the shal-low edges of the cells and mats of filamentousalgae were present. Standing crops of bulrush inCell I were slightly higher near the inlet at the headof the cell than 25 m away. Standing crops of bul-rush and maidencane tended to decrease with dis-tance from the point of inflow. This suggests thatnutrient concentrations declined as water flowedthrough the two cells.
29
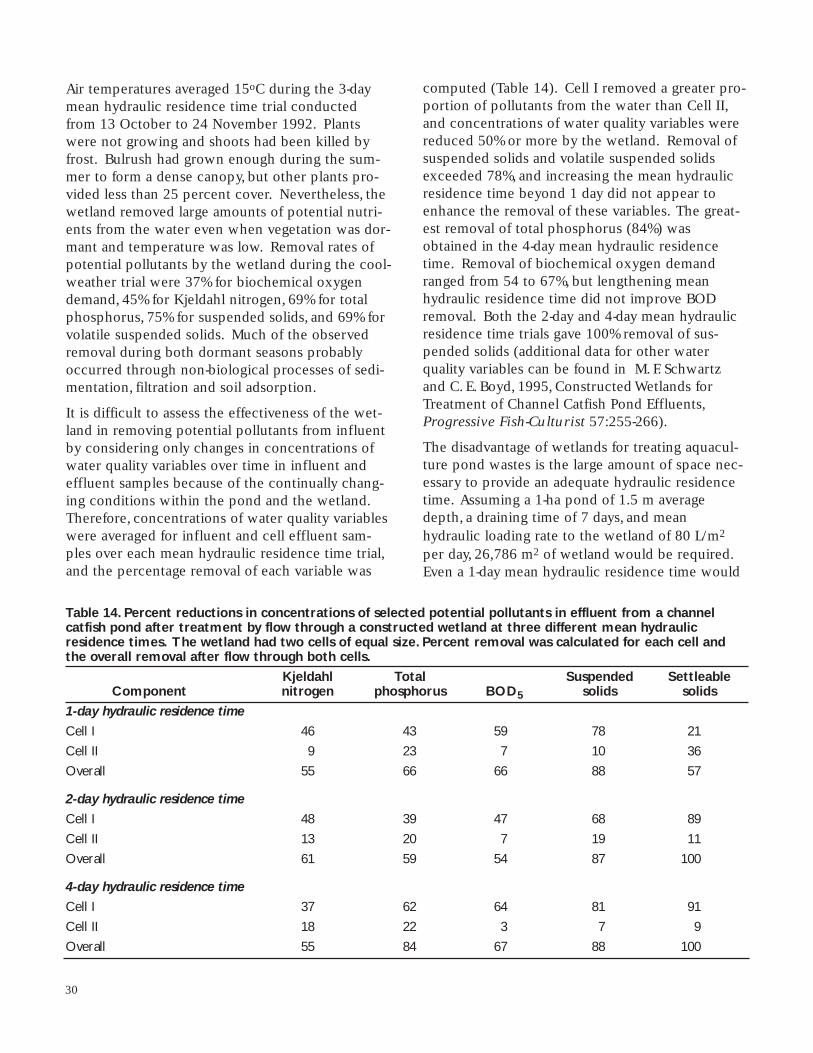
Air temperatures averaged 15oC during the 3-daymean hydraulic residence time trial conductedfrom 13 October to 24 November 1992. Plantswere not growing and shoots had been killed byfrost. Bulrush had grown enough during the sum-mer to form a dense canopy, but other plants pro-vided less than 25 percent cover. Nevertheless, thewetland removed large amounts of potential nutri-ents from the water even when vegetation was dor-mant and temperature was low. Removal rates ofpotential pollutants by the wetland during the cool-weather trial were 37% for biochemical oxygendemand, 45% for Kjeldahl nitrogen, 69% for totalphosphorus, 75% for suspended solids, and 69% forvolatile suspended solids. Much of the observedremoval during both dormant seasons probablyoccurred through non-biological processes of sedi-mentation, filtration and soil adsorption.
It is difficult to assess the effectiveness of the wet-land in removing potential pollutants from influentby considering only changes in concentrations ofwater quality variables over time in influent andeffluent samples because of the continually chang-ing conditions within the pond and the wetland.Therefore, concentrations of water quality variableswere averaged for influent and cell effluent sam-ples over each mean hydraulic residence time trial,and the percentage removal of each variable was
computed (Table 14). Cell I removed a greater pro-portion of pollutants from the water than Cell II,and concentrations of water quality variables werereduced 50% or more by the wetland. Removal ofsuspended solids and volatile suspended solidsexceeded 78%, and increasing the mean hydraulicresidence time beyond 1 day did not appear toenhance the removal of these variables. The great-est removal of total phosphorus (84%) wasobtained in the 4-day mean hydraulic residencetime. Removal of biochemical oxygen demandranged from 54 to 67%, but lengthening meanhydraulic residence time did not improve BODremoval. Both the 2-day and 4-day mean hydraulicresidence time trials gave 100% removal of sus-pended solids (additional data for other water quality variables can be found in M. F. Schwartz and C. E. Boyd, 1995, Constructed Wetlands forTreatment of Channel Catfish Pond Effluents,Progressive Fish-Culturist 57:255-266).
The disadvantage of wetlands for treating aquacul-ture pond wastes is the large amount of space nec-essary to provide an adequate hydraulic residencetime. Assuming a 1-ha pond of 1.5 m averagedepth, a draining time of 7 days, and meanhydraulic loading rate to the wetland of 80 L/m2
per day, 26,786 m2 of wetland would be required.Even a 1-day mean hydraulic residence time would
30
Table 14. Percent reductions in concentrations of selected potential pollutants in effluent from a channel catfish pond after treatment by flow through a constructed wetland at three different mean hydraulic residence times. The wetland had two cells of equal size. Percent removal was calculated for each cell andthe overall removal after flow through both cells.
Kjeldahl Total Suspended Settleable Component nitrogen phosphorus BOD5 solids solids
1-day hydraulic residence time
Cell I 46 43 59 78 21
Cell II 9 23 7 10 36
Overall 55 66 66 88 57
2-day hydraulic residence time
Cell I 48 39 47 68 89
Cell II 13 20 7 19 11
Overall 61 59 54 87 100
4-day hydraulic residence time
Cell I 37 62 64 81 91
Cell II 18 22 3 7 9
Overall 55 84 67 88 100
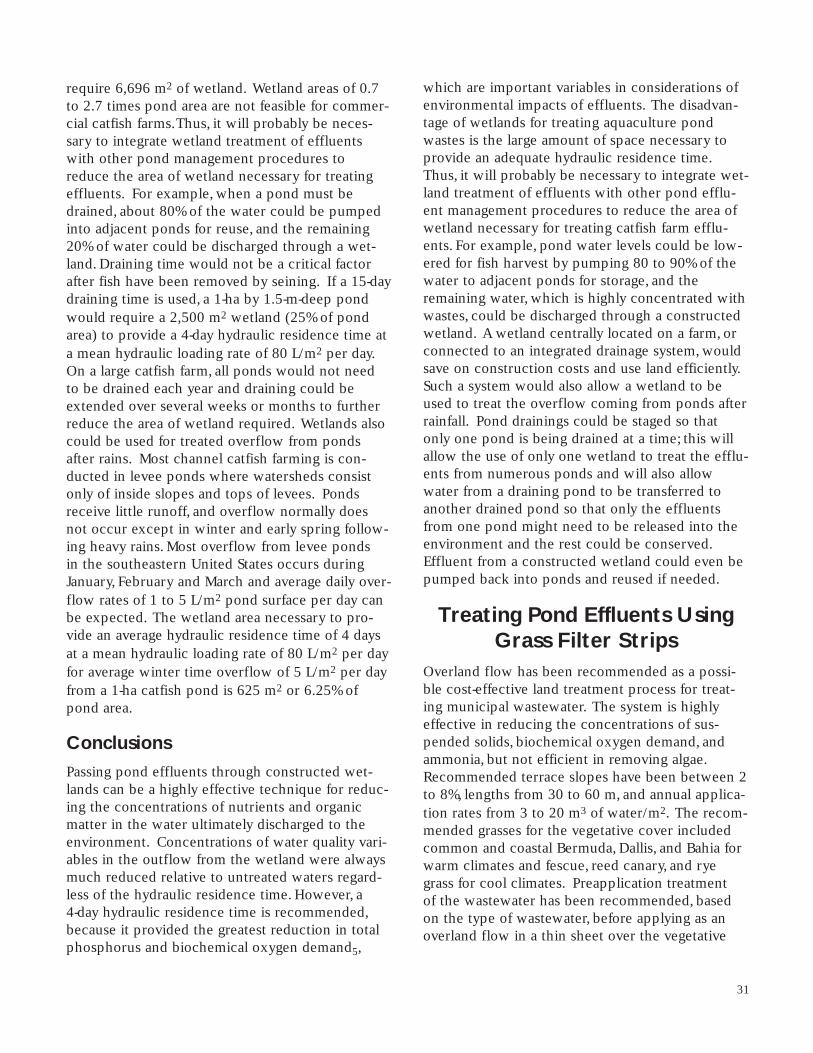
require 6,696 m2 of wetland. Wetland areas of 0.7to 2.7 times pond area are not feasible for commer-cial catfish farms.Thus, it will probably be neces-sary to integrate wetland treatment of effluentswith other pond management procedures toreduce the area of wetland necessary for treatingeffluents. For example, when a pond must bedrained, about 80% of the water could be pumpedinto adjacent ponds for reuse, and the remaining20% of water could be discharged through a wet-land. Draining time would not be a critical factorafter fish have been removed by seining. If a 15-daydraining time is used, a 1-ha by 1.5-m-deep pondwould require a 2,500 m2 wetland (25% of pondarea) to provide a 4-day hydraulic residence time ata mean hydraulic loading rate of 80 L/m2 per day.On a large catfish farm, all ponds would not needto be drained each year and draining could beextended over several weeks or months to furtherreduce the area of wetland required. Wetlands alsocould be used for treated overflow from pondsafter rains. Most channel catfish farming is con-ducted in levee ponds where watersheds consistonly of inside slopes and tops of levees. Pondsreceive little runoff, and overflow normally doesnot occur except in winter and early spring follow-ing heavy rains. Most overflow from levee ponds in the southeastern United States occurs duringJanuary, February and March and average daily over-flow rates of 1 to 5 L/m2 pond surface per day canbe expected. The wetland area necessary to pro-vide an average hydraulic residence time of 4 daysat a mean hydraulic loading rate of 80 L/m2 per dayfor average winter time overflow of 5 L/m2 per dayfrom a 1-ha catfish pond is 625 m2 or 6.25% ofpond area.
ConclusionsPassing pond effluents through constructed wet-lands can be a highly effective technique for reduc-ing the concentrations of nutrients and organicmatter in the water ultimately discharged to theenvironment. Concentrations of water quality vari-ables in the outflow from the wetland were alwaysmuch reduced relative to untreated waters regard-less of the hydraulic residence time. However, a 4-day hydraulic residence time is recommended,because it provided the greatest reduction in totalphosphorus and biochemical oxygen demand5,
which are important variables in considerations ofenvironmental impacts of effluents. The disadvan-tage of wetlands for treating aquaculture pondwastes is the large amount of space necessary toprovide an adequate hydraulic residence time.Thus, it will probably be necessary to integrate wet-land treatment of effluents with other pond efflu-ent management procedures to reduce the area ofwetland necessary for treating catfish farm efflu-ents. For example, pond water levels could be low-ered for fish harvest by pumping 80 to 90% of thewater to adjacent ponds for storage, and theremaining water, which is highly concentrated withwastes, could be discharged through a constructedwetland. A wetland centrally located on a farm, orconnected to an integrated drainage system, wouldsave on construction costs and use land efficiently.Such a system would also allow a wetland to beused to treat the overflow coming from ponds afterrainfall. Pond drainings could be staged so thatonly one pond is being drained at a time; this willallow the use of only one wetland to treat the efflu-ents from numerous ponds and will also allowwater from a draining pond to be transferred toanother drained pond so that only the effluentsfrom one pond might need to be released into theenvironment and the rest could be conserved.Effluent from a constructed wetland could even bepumped back into ponds and reused if needed.
Treating Pond Effluents UsingGrass Filter Strips
Overland flow has been recommended as a possi-ble cost-effective land treatment process for treat-ing municipal wastewater. The system is highlyeffective in reducing the concentrations of sus-pended solids, biochemical oxygen demand, andammonia, but not efficient in removing algae.Recommended terrace slopes have been between 2to 8%, lengths from 30 to 60 m, and annual applica-tion rates from 3 to 20 m3 of water/m2. The recom-mended grasses for the vegetative cover includedcommon and coastal Bermuda, Dallis, and Bahia forwarm climates and fescue, reed canary, and ryegrass for cool climates. Preapplication treatment of the wastewater has been recommended, basedon the type of wastewater, before applying as anoverland flow in a thin sheet over the vegetative
31

surface. In some agricultural systems, grass bufferstrips have been used for filtering solids from ani-mal waste and the use of such strips or other filter-ing methods might be viable for filtering catfishpond effluent. The objective of this study was toinvestigate the effectiveness of grass strips for filter-ing catfish pond effluent to remove solids andnutrients.
MethodsNine ponds at the Coastal Plain Experiment Station,Tifton, Georgia, were filled to a depth of 1.2 m withwell water and stocked with channel catfish finger-lings at the rate 44,000 fish/ha in 1993 and 55,000fish/ha in 1994. The daily feeding rate was kept at3 percent of fish body mass. All ponds were aerat-ed using air-lift aerators to keep the oxygen levelabove 4 mg/L at all times. In addition, surface aera-tors were used as an emergency aeration method.
Grass strips were established in a field adjacent tothe catfish pond research facility. The facility con-sisted of twelve 0.1-ha catfish ponds, tanks to col-lect effluent from the pond drainage system, apumping station, and an irrigation pipe network todeliver pond effluent to the field. Twelve grassstrip plots were established for the filtration experi-ment; they consisted of two different slopes, twodifferent grasses, and three replications. Each grassstrip was 24 m long x 4.5 m wide. Six strips had auniform land slope of 1.5% and six had a slope of3%. Three strips on each slope were planted withBermudagrass sod (Cynodon dactylon) and threewere planted with Bahiagrass (Paspalum notatum)seed. The six 1.5% slope strips were separatedfrom the six 3% slope strips by a 3-m-wide bufferplot. The filtered sample (output) collection loca-tions were at 8 m, 16 m, and 24 m away from theinput location.
Filtration experiments were conducted in themorning hours so that most of the analyses couldbe completed on the same day. The grass plotswere irrigated with well water for about 3 hoursthe previous afternoon in order to minimize waterinfiltration during the experiment. Water waspumped from the pond bottoms and the effluentwas applied uniformly over a narrow strip of gravelto minimize any soil erosion due to applicationintensity. There were two rates of effluent applica-
tion (26 and 18 L/min) in 1994 and one rate (26 L/min) in 1993. Input samples (500 mL) werecollected in three replicates. Each complete testlasted for 3 hours, 11/2 hours for each six-plot areahaving the same slope. Thus, any plot receivedeffluent for 11/2 hours during a test; a total amountof 2,340 L at the higher rate and 1,620 L at thelower rate.
A device similar to a dust pan (30 cm wide) wasconstructed from sheet metal and held manually atthe desired locations to collect the water travellingthrough the grass for analysis. While collecting theoutput samples, care was taken to minimize soil dis-turbance due to the sample collector. In 1993, allsamples were analyzed for total ammonia and sus-pended solids. One sample collected in each test atthe 24 m location from each plot was analyzed forKjeldahl nitrogen, total phosphorus, and chemicaloxygen demand. In 1994, all samples were ana-lyzed for suspended solids and nine samples (threeinput, six filtered) from either grass on a 1.5% slopewere analyzed on alternate test dates for totalKjeldahl nitrogen, total phosphorus, and chemicaloxygen demand.
ResultsThe 1993 experiments were conducted fromSeptember through November and the 1994 experi-ments from May through November. The tempera-ture range during those months was from 10 to37oC. The temperature generally stayed over 15oC.Grasses appeared to be better established in 1994compared to 1993, especially in Bahia plots. The1993 results indicated that the filtration techniqueremoved 18 to 62% of the suspended solids fromthe pond effluent. Filter strip slope and type ofgrass had no effect on filtration efficiency. Samplescollected at the bottom of the plots (24 m traveldistance) had significantly less solids than the sam-ples collected at intermediate travel distances of 8 m or 16 m. In 1994 (Table 15), again, it wasfound that the type of grass, effluent applicationrate, and the land slope did not significantly alterthe amounts of suspended solids removed by thegrass strips.
When the suspended solids concentration was low(less than 30 mg/L), the filter strips were not effec-tive in filtering the solids (Table 15). The strips
32
were most effective in solids removal when thesolids concentration in the pond effluent wasgreater than 200 mg/L. For situations where theconcentration of solids in the effluent was between30 to 200 mg/L, the strips removed the solids by asmuch as 50%. The results from both years weresimilar. The 1994 results were better than 1993probably because of better established grass plots.The rate of solids removal is substantial consideringthat the filtering process was simple.
In 1993, there was no difference in the concentra-tions of total ammonia-nitrogen, total Kjeldahl nitro-gen, total phosphorus , or chemical oxygen demandin the input and filtered water samples. However,in 1994 the filtered samples had significantly lowerconcentrations of chemical oxygen demand andtotal Kjeldahl nitrogen than those of the input samples (Table 16). Simultaneous reduction insolids, chemical oxygen demand, and Kjeldahl nitrogen was expected because the three variablesare highly correlated in aquaculture pond waters.Since suspended solids concentrations in the fil-tered effluent were reduced by filtration in 1994,chemical oxygen demand and Kjeldahl nitrogenwere also significantly lower in 1994. In 1994there was no signficant effect of type of grass andthe effluent application rate on removal of chemi-cal oxygen demand, Kjeldahl nitrogen, and totalphosphorus.
ConclusionsSuspended solids from catfish pond effluent can besignificantly reduced and concentrations of organic
matter and total nitrogen can be lowered by apply-ing the effluent as an overland runoff to well-established strips of either Bahia or Bermudagrass.This filtering technique is relatively easy and inex-pensive. This technique may have application if thefiltered effluent is to be reused for fish productionto conserve groundwater. It could also be used asan effluent treatment before discharging to receiv-ing waters. The filtered effluent will have lowersuspended solids and lower concentrations oforganic matter and nitrogen than before applica-tion to the grass strips, and, therefore, be potentiallyless objectionable to regulators. Further research isneeded to find the efficacy of filters over longerperiods of operation such as over several hours ofcontinuous usage. Effects of grass filtered effluenton fish production also need to be evaluated.These findings will then be useful in establishingthe design parameters of a grass filter system for acommercial size pond.
33
Table 15. Percent removal of suspended solids in channel catfish pond effluents after flowing through grass filter strips of different slopes and at different effluent application rates. Values within a column followed bycommon letters do not differ at the 5 percent level of probability.
Suspended solids 1.5% slope 3% slope(mg/L) in effluent High rate Low rate High rate Low rate
> 200 mg/L 73a 84a 90a 83a
100 - 200 mg/L 55ab 48b 50b 51b
30 - 100 mg/L 45b 40bc 42b 45b
<30 mg/L — 27c 18c 14c
Table 16. Average concentrations of selected water quality variables in effluents from channelcatfish ponds before and after flowing through grass filter strips. * = values after treatment differfrom values before treatment at the 5% level ofprobability.
Before AfterVariable treatment treatment
Kjeldahl nitrogen (mg N/L) 17.9 11.8*
Chemical oxygen demand(mg O2/L) 77.9 60.8*
Total phosphorus (mg P/L) 0.59 0.53
The potential for environmental impact of effluentdischarge from fishpond water is a growing con-cern among policy makers. The argument is thatcomponents of the effluent from aquaculture pro-duction facilities may contribute nutrients and sus-pended matter that may impact the ecosystem ofreceiving bodies of water. Pollution control regula-tions may include either direct or indirect mea-sures. Direct control usually aims at prohibiting theuse of a specific pollutant. Due to the difficultiesthat may arise in completely banning the use of acertain pollutant, environmental agencies tend toset absolute standards as a direct control measure.Indirect controls, such as placing a tax on pollutingactivities, provide an economic incentive to notpollute or to reduce the amount of pollution. Thegreater the amount of pollution, the higher the tax.While taxes provide some economic incentive notto pollute, it is difficult to determine its net welfareto society.
While water quality and effluent discharge haveraised much concern among farmers, scientists, andpolicy makers, few studies have focused on the eco-nomic feasibility of management practices thatmight be adopted by farmers to deal with possibleregulations on effluent discharge. Therefore, thisstudy was conducted to provide an economicanalysis of the farm-level economic impact of estab-lishing certain effluent treatment technologies.Specifically, the methodology used would result inselection of the profit-maximizing effluent manage-ment strategies for various levels of allowable efflu-ent discharge for catfish in the event that regula-tions would enforce fixed levels of allowable efflu-ent discharge or in the case of policies enacted totax effluent discharge. The effect on net farmincome was compared to that of no treatment. Inaddition, the economic tradeoff between policiesand alternative management implications of differ-ent enforcement practices was assessed.
MethodsFour alternative management practices to reducepotential environmental impacts from effluent dis-charges from aquaculture production facilities wereconsidered: (1) no treatment with possibility of animposed tax on effluent discharged; (2) irrigationof rice with effluents from fishponds; (3) recyclingwater through constructed wetlands; and (4) circu-lating water from a catfish pond through a pondstocked with filter-feeding fish (bighead carp).
Three hypothetical catfish farms of various sizes(65, 130 and 260 water hectares) were considered.In each farm, individual ponds were assumed to be8 water hectares. Based on previous studies, bud-gets were developed for the hypothesized farmsizes. Catfish were assumed to be stocked at 4,942,9,884 or 14,826 fish/ha with feed conversion ratesof 2:1 and a mortality of 8% during a 200-day pro-duction period. The representative farm stocked10- to 15-cm and 18- to 20-cm fingerlings with aharvest weight of 0.68 and 0.91 kg, respectively.Marketing constraints were assumed to be due solely to fish off-flavor and represented a charge of $0.02/kg produced and sold.
Table 17 presents catfish production costs andreturns for the assumed base scenario of no efflu-ent treatment. Net returns per hectare were$2,345, $2,614 and $2,740 for the 65-, 130- and 260-hectare farms, respectively. The average costsfor producing catfish were $1.41/kg, $1.39/kg and$1.34/kg for the 65-, 130- and 260-ha farms, respec-tively. Additional costs encountered in implement-ing alternative effluent treatments were derivedfrom published experimental data. The studiesfrom which the data were obtained measuredimpacts on pond water quality but did not specifi-cally measure effluent removal efficiencies.Engineering methods were used to estimate costsfor each technology. The major cost items include
34
Objective 3: An Economic Analysis of Treating Effluents fromChannel Catfish Ponds

the cost of piping and plumbing and an additionalpumping cost. In some areas, it may be possible toconstruct ponds in such a way as to use gravity forirrigation, but in areas with level terrain, this addi-tional pumping cost will be required. Experimentaldata have demonstrated no change in yield of cat-fish when water was removed for irrigation.
The wetland area needed is estimated by specifyingthat it treats 5% of the pond volume and equals0.08 and 0.04 ha of wetland for each pond ha forsurface and subsurface flow wetland systems,respectively. To establish the wetland system withthe current land base, some land would have to betaken out of production to create the wetlandareas. These estimates of constructed wetlandscosts do not include any potential value from thewetland vegetation itself, but they take into accountthe opportunity cost of the land, represented by alost income of $858/ha for rice production, themost likely alternative crop.
Using a paired-ponds treatment method requiresremoving one pond from catfish production forevery pond remaining in production. The lost prof-its that would have resulted from such a systemconstitute a major cost for this alternative.However, this cost is partially offset by revenuesfrom bighead carp production and the higher cat-fish stocking density of 17,637 fish/ha in theremaining catfish production ponds. The revenuesfrom bighead carp may range from $919 to$1,226/ha (yield ranging from 1,323 to 1,764 kg/hasold at a price of $1.37/kg). Studies have shownthat there was no significant difference in catfish
yield when bighead carp were stocked in catfishponds at 1,174 bighead/ha. However, catfish con-sumed about 12% more feed in the filter-fed pondspaired with bighead ponds than in regular catfishponds.
The fixed costs of construction and revenues gen-erated from either the rice or bighead carp cropsexceed other economic factors such as a change inthe price of catfish. This implies that the results ofthis study are not likely to change even if the tech-nologies have widely varying degrees of effluentremoval efficiencies.
A linear programming model was developed toevaluate the economics of alternative effluent treat-ment methods. The linear program was modeledfor the representative farm using the GeneralAlgebraic Modeling System (GAMS). Farm-leveldata were used to formulate the level of activitiesand constraints. Because of the number of activi-ties defined in the model, the linear programmingtableau is not presented. The objective functionwas assumed to maximize profits subject to techni-cal as well as environmental constraints. Technicalconstraints included constraints on (a) labor avail-ability, (b) feed requirements, (c) chemical require-ments, (d) fingerlings purchased, (e) water usage,(f) fuel, oil, and lubrication requirements, (g) repairand maintenance, (h) marketing constraints attrib-uted solely to off-flavor, and (i) constraints due toother production requirements. Environmentalconstraints were defined by levels of biochemicaloxygen demand and ammonia used as indicators of water pollution. Different effluent discharge
35
Table 17. Channel catfish production costs and returns with a pond stocking rate of 9,884 fish/ha and notreatment of pond effluent.
Farm sizeItem 65 hectares 130 hectares 260 hectares
Investment ($, without land) 8,597 7,317 6,897
Gross receipts ($, at $1.54/kg) 12,731 12,731 12,731
Operating cost ($) 9,699 9,526 9,440
Fixed cost ($) 687 591 551
Total cost ($) 10,386 10,117 9,991
Returns ($) 2,345 2,614 2,740
Breakeven price ($/kg) 1.41 1.39 1.34
Breakeven yield (kg/ha) 6,730 6,556 6,475
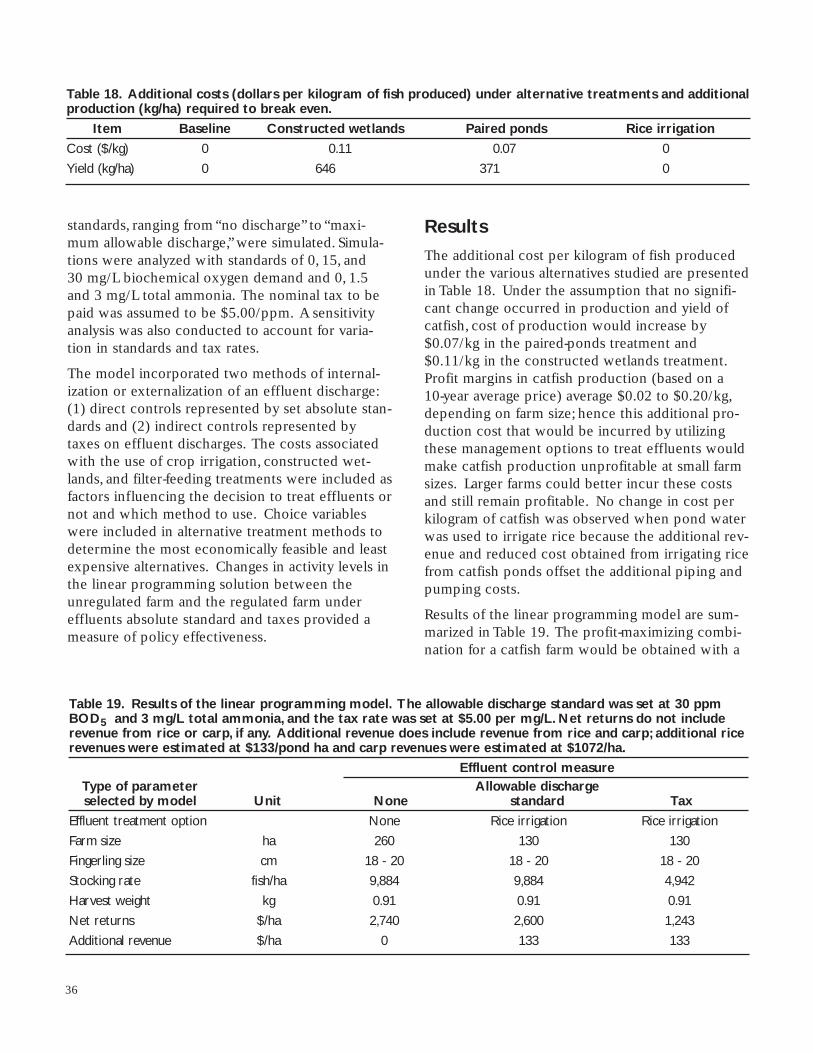
standards, ranging from “no discharge” to “maxi-mum allowable discharge,” were simulated. Simula-tions were analyzed with standards of 0, 15, and 30 mg/L biochemical oxygen demand and 0, 1.5and 3 mg/L total ammonia. The nominal tax to bepaid was assumed to be $5.00/ppm. A sensitivityanalysis was also conducted to account for varia-tion in standards and tax rates.
The model incorporated two methods of internal-ization or externalization of an effluent discharge:(1) direct controls represented by set absolute stan-dards and (2) indirect controls represented bytaxes on effluent discharges. The costs associatedwith the use of crop irrigation, constructed wet-lands, and filter-feeding treatments were included asfactors influencing the decision to treat effluents ornot and which method to use. Choice variableswere included in alternative treatment methods todetermine the most economically feasible and leastexpensive alternatives. Changes in activity levels inthe linear programming solution between theunregulated farm and the regulated farm undereffluents absolute standard and taxes provided ameasure of policy effectiveness.
ResultsThe additional cost per kilogram of fish producedunder the various alternatives studied are presentedin Table 18. Under the assumption that no signifi-cant change occurred in production and yield ofcatfish, cost of production would increase by$0.07/kg in the paired-ponds treatment and$0.11/kg in the constructed wetlands treatment.Profit margins in catfish production (based on a 10-year average price) average $0.02 to $0.20/kg,depending on farm size; hence this additional pro-duction cost that would be incurred by utilizingthese management options to treat effluents wouldmake catfish production unprofitable at small farmsizes. Larger farms could better incur these costsand still remain profitable. No change in cost perkilogram of catfish was observed when pond waterwas used to irrigate rice because the additional rev-enue and reduced cost obtained from irrigating ricefrom catfish ponds offset the additional piping andpumping costs.
Results of the linear programming model are sum-marized in Table 19. The profit-maximizing combi-nation for a catfish farm would be obtained with a
36
Table 18. Additional costs (dollars per kilogram of fish produced) under alternative treatments and additionalproduction (kg/ha) required to break even.
Item Baseline Constructed wetlands Paired ponds Rice irrigation
Cost ($/kg) 0 0.11 0.07 0
Yield (kg/ha) 0 646 371 0
Table 19. Results of the linear programming model. The allowable discharge standard was set at 30 ppmBOD5 and 3 mg/L total ammonia, and the tax rate was set at $5.00 per mg/L. Net returns do not includerevenue from rice or carp, if any. Additional revenue does include revenue from rice and carp; additional ricerevenues were estimated at $133/pond ha and carp revenues were estimated at $1072/ha.
Effluent control measure Type of parameter Allowable dischargeselected by model Unit None standard Tax
Effluent treatment option None Rice irrigation Rice irrigation
Farm size ha 260 130 130
Fingerling size cm 18 - 20 18 - 20 18 - 20
Stocking rate fish/ha 9,884 9,884 4,942
Harvest weight kg 0.91 0.91 0.91
Net returns $/ha 2,740 2,600 1,243
Additional revenue $/ha 0 133 133
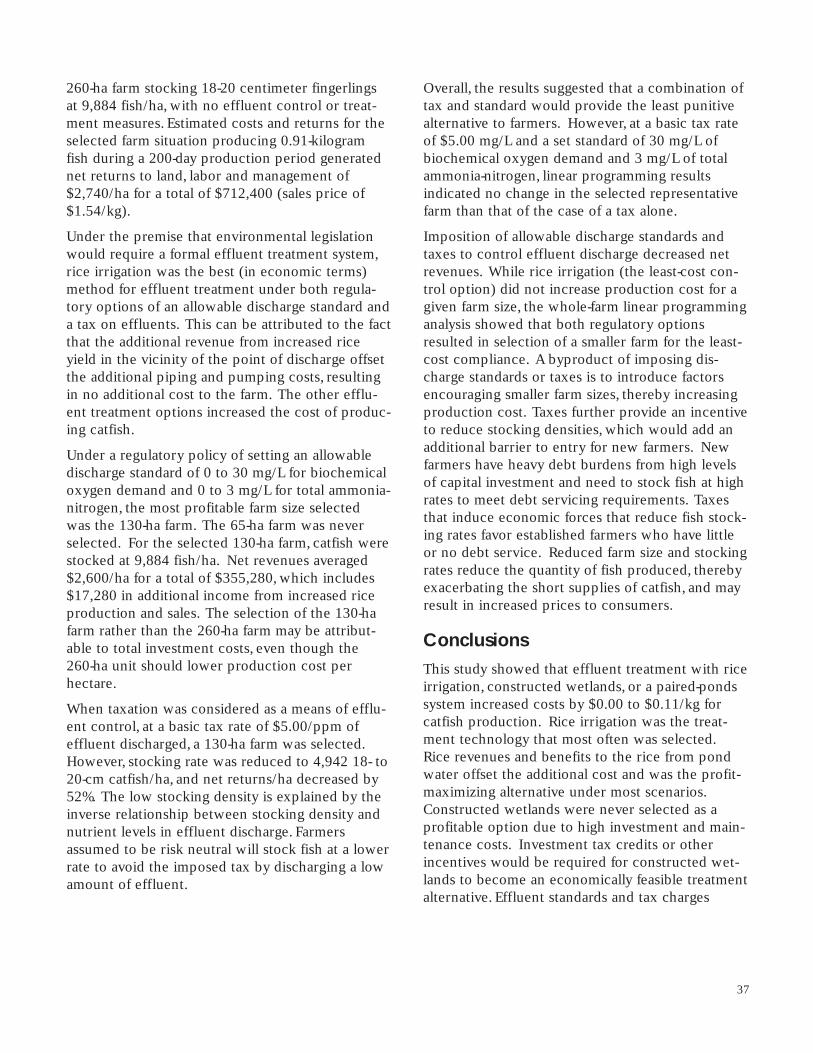
260-ha farm stocking 18-20 centimeter fingerlingsat 9,884 fish/ha, with no effluent control or treat-ment measures. Estimated costs and returns for theselected farm situation producing 0.91-kilogramfish during a 200-day production period generatednet returns to land, labor and management of$2,740/ha for a total of $712,400 (sales price of$1.54/kg).
Under the premise that environmental legislationwould require a formal effluent treatment system,rice irrigation was the best (in economic terms)method for effluent treatment under both regula-tory options of an allowable discharge standard anda tax on effluents. This can be attributed to the factthat the additional revenue from increased riceyield in the vicinity of the point of discharge offsetthe additional piping and pumping costs, resultingin no additional cost to the farm. The other efflu-ent treatment options increased the cost of produc-ing catfish.
Under a regulatory policy of setting an allowabledischarge standard of 0 to 30 mg/L for biochemicaloxygen demand and 0 to 3 mg/L for total ammonia-nitrogen, the most profitable farm size selected was the 130-ha farm. The 65-ha farm was neverselected. For the selected 130-ha farm, catfish werestocked at 9,884 fish/ha. Net revenues averaged$2,600/ha for a total of $355,280, which includes$17,280 in additional income from increased riceproduction and sales. The selection of the 130-hafarm rather than the 260-ha farm may be attribut-able to total investment costs, even though the 260-ha unit should lower production cost perhectare.
When taxation was considered as a means of efflu-ent control, at a basic tax rate of $5.00/ppm ofeffluent discharged, a 130-ha farm was selected.However, stocking rate was reduced to 4,942 18- to20-cm catfish/ha, and net returns/ha decreased by52%. The low stocking density is explained by theinverse relationship between stocking density andnutrient levels in effluent discharge. Farmersassumed to be risk neutral will stock fish at a lowerrate to avoid the imposed tax by discharging a lowamount of effluent.
Overall, the results suggested that a combination oftax and standard would provide the least punitivealternative to farmers. However, at a basic tax rateof $5.00 mg/L and a set standard of 30 mg/L of biochemical oxygen demand and 3 mg/L of totalammonia-nitrogen, linear programming results indicated no change in the selected representativefarm than that of the case of a tax alone.
Imposition of allowable discharge standards andtaxes to control effluent discharge decreased netrevenues. While rice irrigation (the least-cost con-trol option) did not increase production cost for agiven farm size, the whole-farm linear programminganalysis showed that both regulatory options resulted in selection of a smaller farm for the least-cost compliance. A byproduct of imposing dis-charge standards or taxes is to introduce factorsencouraging smaller farm sizes, thereby increasingproduction cost. Taxes further provide an incentiveto reduce stocking densities, which would add anadditional barrier to entry for new farmers. Newfarmers have heavy debt burdens from high levelsof capital investment and need to stock fish at highrates to meet debt servicing requirements. Taxesthat induce economic forces that reduce fish stock-ing rates favor established farmers who have littleor no debt service. Reduced farm size and stockingrates reduce the quantity of fish produced, therebyexacerbating the short supplies of catfish, and mayresult in increased prices to consumers.
ConclusionsThis study showed that effluent treatment with riceirrigation, constructed wetlands, or a paired-pondssystem increased costs by $0.00 to $0.11/kg for catfish production. Rice irrigation was the treat-ment technology that most often was selected.Rice revenues and benefits to the rice from pondwater offset the additional cost and was the profit-maximizing alternative under most scenarios.Constructed wetlands were never selected as aprofitable option due to high investment and main-tenance costs. Investment tax credits or otherincentives would be required for constructed wet-lands to become an economically feasible treatmentalternative. Effluent standards and tax charges
37
appear to be effective means of internalizing fishpond effluent discharge. However, some concernsmust be raised. Large farms will do the best job atinternalizing the costs of treating effluent. Smallfarms not only have restricted access to capital,but also are not efficient enough to adopt newtechnologies to reduce effluent discharge.
However, small farms may not produce levels ofeffluent discharge harmful to the environment.All policies to control effluent discharge reducednet farm revenues. Even rice irrigation, thatshowed no increase in cost of production for agiven farm size, resulted in selecting a smaller farmsize that increased production cost per kilogram offish due to economies of scale. Imposing controloptions will create additional barriers to entry fornew potential catfish farmers, particularly small-
scale (less than 130-ha) farms. Imposing effluentcontrols has an impact on farm size and stockingdensity. Because effluent standards or tax chargesaffect farmers, policy makers would be well advisedto account for the impact of proposed effluentreduction policy on the welfare of fish farmers.While this study was limited to analyzing a fewtechnologies currently available for effluent man-agement in aquaculture, a wide range of optionsshould be studied and the impact assessed.Furthermore, it would be advisable to considerfarm-level decision-making for farmers who are riskaverse. To minimize unintended adverse impacts,policy makers should ensure that adequate researchdata, both biological and economic, are available torepresent the breadth of aquaculture productionsystems and receiving streams before enacting regulations.
38

The results of this project suggest that the impactof aquaculture pond effluents on the environmentcan be reduced by using relatively simple manage-ment practices. Some of these practices requirelabor and expense to implement, and may not beapplicable to all culture situations. However, someof the practices examined in this project and dis-cussed below are logical extensions of good overallfarm management or are simple solutions that donot require extra expense or labor. All aquacultur-ists should strive to reduce the impact of theiractivities on the environment to the greatest extentpossible. The following recommendations shouldhelp achieve that goal.
■ Use high quality feeds and efficient feedingpractices. Feeds are the origin of all pollutantsin catfish pond effluents. The use of a high quality feed improves feed conversion efficiencyand reduces amounts of metabolic waste anduneaten feed. Efficient feeding practices thatreduce waste will reduce feed inputs andimprove feed conversion ratios. Inefficient feedconversion results in poorer quality effluentsbecause the feed not converted into fish fleshenters the pond as waste.
■ Provide adequate aeration and circulationof pond water. Maintenance of dissolved oxy-gen concentrations above 4 or 5 mg/L enhancesthe appetite of fish and encourages good feedconversion ratios. Circulation prevents stratifica-tion and enhances degradation of organic matterin pond bottoms. An evenly oxygenated pondwill oxidize organic matter rapidly. Oxidation oforganic matter within the pond diminishes theamount of organic matter in effluents.
■ Minimize water exchange. Water exchangecan be used to reduce high concentrations ofammonia or other toxic substances if large vol-umes of pond water are exchanged at once.However, the displaced pond water represents apollution load in receiving waters, and heavywater exchange should not be used unlessabsolutely necessary. Furthermore, the effective-ness of water exchange as a water quality man-agement procedure in large commercial aquacul-
ture ponds is questionable. Because incomingwater is greatly diluted when added to largeponds, it is unlikely that sufficient water can be exchanged in a short enough period of timeto have a beneficial effect during acute waterquality crises. Also, research has shown that routine water exchange at low rates (severalpond water exchanges over the growing season)has little or no effect on pond water quality andshould not be used.
■ Operate ponds for several years withoutdraining. This is a common practice of catfishfarmers in the southeastern United States, andresearch conducted as part of this projectshowed that it was possible to maintain adequatewater quality for good fish production for at least3 years in undrained ponds harvested each yearby seining. Reuse of water for multiple cropsalso reduces the need for pumped water to refillponds. After several years, catfish ponds mustbe drained to repair levees and for fish inventoryadjustment. When it is necessary to drain ponds,the last 10 to 20% of water in the pond can beheld for 2 or 3 days before final release to signifi-cantly reduce amounts of pollutants through sedimentation.
■ Capture rainfall to reduce pond overflow.Maintaining storage volume by keeping the pondwater level 7 to 9 cm (2 to 3 inches) below thelevel of the drain greatly reduces the volume ofwater discharged from ponds during rainfallevents. Capturing rainfall in this manner alsoreduces the need for pumped water to maintainpond water levels.
■ Allow solids to settle before dischargingwater. In ponds that are partially drained tofacilitate fish harvest, minimize seining activityduring harvest to avoid resuspension of sedi-ments. After seining, hold the water in the pondfor 2 to 3 days to allow solids to settle beforedraining completely. An even better method is tonot discharge this last portion of water. Holdingwater for 2 days after seining can greatly reducethe discharge of nutrients, solids and organicmatter.
39
Recommendations for Managing Aquaculture Pond Effluents

■ Reuse water that is drained from ponds.Instead of draining ponds for fish harvest, watercan be pumped to adjacent ponds and thenreused in the same or other ponds. Productionponds can be built with higher levees or waterlevels maintained with more free board to pro-vide storage volume. Water from one pond canbe transferred to another with a low-lift pumpand then transferred back by siphon.
■ Optimize watershed areas. Watershed pondsshould not have watershed areas larger than nec-essary to keep ponds full, because excessivelylarge watersheds increase runoff into ponds andresult in high discharge. Runoff from watershedsmay be partially diverted from ponds by terrac-ing or other means.
■ Treat effluents by using constructed wet-lands. Constructed wetlands are very efficientin removing potential pollutants from pondwater providing that at least a 2-day hydraulicretention time is used. Because wetlands func-tion best with emergent, reed swamp plants suchas bulrushes and cattails, the maximum depth fora wetland should be about 50 cm (20 inches),and can be created by constructing a dike 60 cm(2 feet) high around the area in which the waterwill be impounded. Common cattails and bul-rushes can be gathered from the wild and planted in wetlands. The wetland should belarge enough to provide a 2- to 4-day retention
time for influent water. Wetlands should bedownslope from ponds, so water can flow bygravity from ponds into the wetland. The USDASoil Conservation Service can provide advice ondesigning and constructing wetlands. Because of the large land requirement for constructedwetlands, treating only the most concentratedeffluents in the final stages of draining wouldminimize the amount of land needed for con-structed wetlands and significantly improve thequality of those effluents.
■ Use effluents to irrigate terrestrial crops.Under certain conditions, the water dischargedfrom ponds may have value as irrigation waterfor agronomic crops. Routine overflow fromponds cannot be relied upon for irrigation waterbecause crop water requirements will be highestwhen pond overflow volumes are lowest. Also,pumping water through a pond solely to provideirrigation water should not be practiced becausewater is lost to evaporation while the water is inthe pond and the nutrient content of water fromaquaculture ponds is probably too low to signifi-cantly reduce the crop’s fertilizer requirements.However, if water must be pumped through apond for some purpose, such as to improvewater quality conditions within the pond, thenfurther use of the effluent as irrigation water willprovide multiple benefits to the farm and willreduce the overall volume of water discharged tothe environment.
40
The following publications and presentations weredeveloped as part of this Southern Regional AquacultureCenter project:
Journal ArticlesBoyd, C. E. 1993. Catfish pond effluents. Feedstuffs.
January 1993.
Boyd, C. E. and T. Dhendup. 1995. Quality of potentialeffluents from the hypolimnia of watershed pondsused in aquaculture. Progressive Fish-Culurist 57:59-63.
Boyd, C. E. and C. S.Tucker. 1995. Sustainability of chan-nel catfish culture. World Aquaculture 26(3):45-53.
Boyd, C. E., E. Hernandez, J. C.Williams, and R. P. Romaire.1994. Effects of sampling technique on precision esti-mates for water quality variables in fish cultureponds. Journal of Applied Aquaculture 4:1-19.
Ghate, S. R., G. J. Burtle, and M. C. Smith. 1993. Waterquality in catfish ponds subjected to high stockingdensity-selective harvesting production practice.Aquacultural Engineering 12:169-181.
Ghate, S. R., G. J. Burtle, G.Vellidas, and G. L. Newton.1997. Effectiveness of grass strips to filter catfishIctalurus punctatus pond effluent. AquaculturalEngineering 16:149-159.
Hopkins, J. S., R. D. Hamilton II, P.A. Sandifer, C. L. Browdy,and A. D. Stokes. 1993. Effect of water exchange rateon production, water quality, effluent characteristicsand nitrogen budgets of intensive shrimp ponds.Journal of World Aquaculture Society 24:304-320.
Hopkins, J. S., P.A. Sandifer, and C. L. Browdy. 1994.Sludge management in intensive pond culture ofshrimp: Effect of management regime on water quali-ty, sludge characteristics, nitrogen extinction andshrimp production. Aquacultural Engineering13:11-30.
Kouka, P. -J. and C. R. Engle. 1994. An economic analysisof catfish and hybrid striped bass effluent control inthe southeast. Journal of Agricultural and AppliedEconomics 26: 325.
Kouka, P.-J. and C. R. Engle. 1996. Economic implicationsof treating effluents from catfish production.Aquacultural Engineering 15:273-290.
Schwartz, M. F. and C. E. Boyd. 1994. Channel catfishpond effluents. Progressive Fish-Culturist 56:273-281.
Schwartz, M. F. and C. E. Boyd. 1994. Effluent quality dur-ing harvest of channel catfish from watershed ponds.Progressive Fish-Culturist 56:25-32.
Schwartz, M. F. and C. E. Boyd. 1995. Constructed wet-lands for treatment of channel catfish pond effluents.Progressive Fish-Culturist 57:255-266.
Seok, K., S. Leonard, C. E. Boyd, and M. F. Schwartz. 1995.Water quality in annually drained and undrained chan-nel catfish ponds over a three-year period.Progressive Fish-Culturist 57:52-58.
Tucker, C. S., S.W. Kingsbury, J.W. Pote, and C.W.Wax.1996. Effects of water management practices on dis-charge of nutrients and organic matter from channelcatfish ponds. Aquaculture 147:57-69.
Extension PublicationsDavis, J.T. 1993. Survey of aquaculture effluent permit-
ting and 1993 standards in the south. SouthernRegional Aquaculture Center Publication 465.
Kouka, P.- J. and C. R. Engle. 1994. Cost of alternativeeffluent treatments for catfish production. SouthernRegional Aquaculture Center Publication 467.
Kouka, P. J., C. R. Engle, and G. L. Pounds. 1994.Economic implications of selected alternative effluenttreatment technologies for catfish production.Aquaculture/Fisheries Center Working Paper AFC-94-5.University of Arkansas at Pine Bluff, Pine Bluff,AR.
Schwartz, M. F. and C. E. Boyd. 1996. Suggested manage-ment to improve qulaity and reduce quantity of chan-nel catfish pond effluents. Alabama AgriculturalExperiment Station Leaflet 108.
Abstracts or Papers PresentedBoyd, C. E. 1992. The aquaculture effluent problem:
past, present, and future. Pages 191-197 in NationalLivestock, Poultry, and Aquaculture WasteManagement. American Society of AgriculturalEngineers, St. Joseph, MI.
Boyd, C. E. 1993. Overview of the effluent issue in pondraised catfish. Catfish Farmers of America. NewOrleans, LA. February.
Boyd, C. E. 1993. Management of channel catfish pondsto reduce volume and enhance quality of effluents(Abstract). U.S. Chapter of the World AquacultureSociety. Hilton Head Island, SC. January.
Boyd, C. E. 1993. Comparison of primary productivityand nutrients cycling in wetlands and aquacultureponds (Abstract). U.S. Chapter of the WorldAquaculture Society. Hilton Head Island, SC. January.
Boyd, C. E. 1993. Impact of water discharge from aqua-culture facilities. Alabama Fisheries Association.Auburn, AL. January.
41
Publications and Presentations

Burtle, G. J., S. R. Ghate, and G. L. Newton. 1995.Reduced aeration in channel catfish ponds subjectedto frequent flushing and refilling (Abstract). Journalof Animal Science 73 (Suppl. 1):181.
Burtle, G. J., S. R. Ghate, and G. L. Newton. 1995. A com-parison of two mangement strategies for productionof channel catfish Ictalurus punctatus in ponds byvarying fish density and periodic water exchangeintervals (Abstract). Journal of Animal Science 73(Suppl. 1): 200.
Burtle, G. J. and S. R. Ghate. 1993. Integrated channelcatfish and row crop production for aquaculturalpond effluent re-use (Abstract). U.S. Chapter of theWorld Aquaculture Society. Hilton Head Island, SC.January.
Ghate, S. R. and G. J. Burtle. 1993. Water quality in chan-nel catfish ponds intermittently drained for irrigation.Pages 177-186 in Proceedings of an AquacultureEngineering Conference:Techniques for ModernAquaculture. J. K.Wang (editor). American Society ofAgricultural Engineers, St. Joseph, MO.
Ghate, S. R., G. J. Burtle, and G. J. Gasho. 1993. Reuse ofwater from catfish ponds (Abstract). Proceedings ofthe 1993 Georgia Water Research Conference.Athens, GA. April.
Ghate, S. R., G. J. Burtle, and G. J. Gascho. 1994. A tech-nique of intergrating channel catfish and soybean pro-duction systems (Abstract). Annual Meeting of theWorld Aquaculture Society. New Orleans, LA. January.
Ghate, S. R. and G. J. Burtle. 1992. Managing catfish pondeffluent for developing an integrated catfish and cropproduction system. 1992 University System ResearchSymposium on Research. Athens, GA. May.
Ghate, S. R., G. J. Burtle, and M. C. Smith. 1993.Characterization of water quality in catfish (Ictaluruspunctatus) ponds under selective harvesting produc-tion system (Abstract). U.S. Chapter of the WorldAquaculture Society. Hilton Head Island, SC. January.
Heffeman, J.A., J. S. Hopkins, and T. I. J. Smith. 1993.Characterization of striped bass hybrid effluent andwater quality (Abstract). U.S. Chapter of the WorldAquaculture Society. Hilton Head Island, SC. January.
Hopkins, J. S., J.A. Hefferman, and T. J. Smith. 1993. Theeffect of feeding rates on water quality, waterexchange and aeration requirements of striped basshybrid production ponds (Abstract). U.S. Chapter ofthe World Aquaculture Society. Hilton Head Island, SC.January.
Hopkins, J. S., P.A. Sandifer, C. L. Browdy, and A. D. Stokes.Progress in development of intensive shrimp pondproduction systems which minimize the potential forenvironmental impact (Abstract). U.S. Chapter of theWorld Aquaculture Society. Hilton Head Island, SC.January.
Kouka, P. J., C. R. Engle, and G. L. Pounds. 1994. An eco-nomic analysis of catfish and hybrid striped bass pondeffluent control in the Southeast (Abstract). Journalof Agricultural and Applied Economics 26(1):325.
Tucker, C. S. 1992. Quality of potential effluents fromchannel catfish culture ponds. Pages 177-184 inNational Livestock, Poultry, and Aquaculture WasteManagement. American Society of AgriculturalEngineers, St. Joseph, MI.
Tucker, C. S. 1995. Factors affecting the quantity andquality of effluents from freshwater fish ponds(Abstract). Annual Meeting of the World AquacultureSociety. San Diego, CA. February.
Tucker, C. S., S. K. Kingsbury, J.W. Pote, and C. L.Wax.1997. Reducing discharge of nutrients and organicmatter from channel catfish ponds by using conserva-tive water management practices (Abstract).Proceedings of the 1997 Catfish Farmers of AmericaResearch Symposium. Nashville,TN. February.
Waldrop, J. L. 1994. The timing and quantities of efflu-ent discharged from commercial catfish farms inMississippi (Abstract). Proceedings of the MississippiWater Resources Conference. Jackson, MS. April.
Wax, C.L., J. L. Pote, J.L. Pote, C.S.Tucker, and S.K.Kingsbury. 1996. Modeling quantity and quality ofoverflow from aquacultural ponds (Abstract).Proceedings of the Mississippi Water ResourcesConference. Jackson, MS. April.
Theses and DissertationsOrellana, F. X. 1992. Characterization of effluents from
commercial crawfish ponds in south Louisiana. M. S.Thesis. Louisiana State University.
42

This publication was supported in part by the Southern Regional Aquaculture Center through Grant No(s). 93-38500-8393, 94-38500-0045 and96-38500-2630 from the United States Department of Agriculture.


![Characterization and Spectroscopic Study of a Heat-Treated and … · cosmetic industries [1]. After use, azo dyes are generally released into effluents. Their presence in wastewaters](https://img.pdfslide.us/doc/110x75/5fca2bbd280469556949d2d9/characterization-and-spectroscopic-study-of-a-heat-treated-and-cosmetic-industries.jpg)