Embed Size (px)
Citation preview
Characterization and Analysis of Risks to Key Ecosystem Components and Properties

Oceans, Habitat and Species at Risk Publication Series, Newfoundland and Labrador Region
No. 0003
2010
CHARACTERIZATION AND ANALYSIS OF RISKS TO KEY ECOSYSTEM COMPONENTS AND PROPERTIES
by
L. E. Park, L. A. Beresford, and M. R. Anderson
Fisheries and Oceans Canada, Newfoundland and Labrador Region P. O. Box 5667
St. John’s, NL A1C 5X1
ii
©Her Majesty the Queen in Right of Canada, 2010 Cat. No. Fs22-6/3-1-2010E-PDF
ISBN 978-1-100-14004-9 ISSN 1919-2193
DFO No. 2009-1542
Correct citation for this publication: Park, L. E., Beresford, L. A., and M. R. Anderson. 2010. Characterization and Analysis of Risks to Key Ecosystem Components and Properties. Oceans, Habitat and Species at Risk Publication Series, Newfoundland and Labrador Region. 0003: vi + 19 p.
iii
TABLE of CONTENTS
ABSTRACT/RÉSUMÉ……………………..…………………………………………v 1.0 INTRODUCTION…………………………………………………………………1 2.0 LITERATURE REVIEW…………………………………………………………..2 3.0 METHOD…………………………………………………………………………..2 3.1 PHASE I: SCOPING ……………………………………………………………3 3.2 PHASE II: CHARACTERIZATION and ANALYSIS………………………….5 3.2.1 Magnitude of Interaction (MoI)……………………………………………...5 3.2.1.1 Areal Extent (a)…………………………………………………………..5 3.2.1.2 Contact (c)...………………………………………………………………6 3.2.1.3 Duration (d)...…………………………………………………………….7 3.2.1.4 Intensity (i)…………………………………………………………….... 8 3.2.1.5 Calculating Magnitude of Interaction ….………………………………..9 3.2.2 Sensitivity (S)..……………………………………………………………... 10 3.2.2.1 Sensitivity of the CP to Acute Impacts (as)…………………………….. 10 3.2.2.2 Sensitivity of the CP to Chronic Impacts (cs)………………………….. 11 3.2.2.3 Sensitivity of Ecosystem to Harmful Impacts to the CP (es)…………... 12 3.2.2.4 Calculating Sensitivity ……………………………………………….… 12 3.2.3 Risk of Harm Calculation……………………………………………….….. 13 3.3 PHASE III: RELATIVE RANKING OF CPS…………………………………. 14 4.0 REFERENCES……………………………………………………………………. 15 APPENDIX 1: Certainty Checklist...............................………………………………. 17 APPENDIX 2: Map of Placentia Bay Grand Banks Large Oceans Management Area and Ecological and Biologically Significant Areas …………………………….. 19

iv
LIST of FIGURES and TABLES
Figure 1: Risk of Harm Calculation…………………………………………………...…..5 Figure 2: Rating scale for Risk of Harm calculation……………………………………...6 Table 1: List of Relevant Activities or Stressors…………………………………...……..4 Table 2: Risk of Harm Calculation Table for Individual CP……………………......…….6 Table 2a: Example of Magnitude of Interaction Calculation for Individual CP (Seabird Aggregation, Nesting, Feeding and Refuge in Placentia Bay Extension)…..…………..…9 Table 2b: Example of Sensitivity Calculation for Individual CP (Seabird Aggregation, Nesting, Feeding and Refuge in Placentia Bay Extension) ………………………..……..13 Table 2c: Example of Risk of Harm Calculation for Individual CP (Seabird Aggregation, Nesting, Feeding and Refuge in Placentia Bay Extension)…………………….…….…...14 Table 3: Ranking of CPs…………………………………………………….……….……14
v
ABSTRACT Canada’s Oceans Act (1997) calls for the Integrated Management (IM) of all activities in or affecting estuarine, coastal and marine waters. For Large Ocean Management Areas (LOMAs), it is important to set manageable conservation priorities. Within the Placentia Bay/Grand Banks (PB/GB) LOMA, conservation priorities were identified in several steps, starting with the identification of Valued Ecosystem Components (VECs) associated with the LOMA or significant areas within the LOMA. These VECs were further prioritized based on the level of risk from human activities using a three-phase methodology presented here. Phase I provides a systematic way to identify a unique list of high risk (key) activities or stressors for each VEC. In Phase II, the risk of harm associated with each key activity or stressor is calculated for each VEC, based on a determination of the Magnitude of the Interaction and Sensitivity. In Phase III the cumulative scores are calculated for each VEC by combining the scores for each key activity or stressor, and the VECs are ranked based on the cumulative scores. These cumulative scores are influenced by both the severity of harm (calculated in Phase II) and number of key activities and stressors (identified in Phase I), and the final ranking of the VECs reflects the relative risk of harm from key human activities and stressors.
RÉSUMÉ La gestion intégrée de toutes les activités qui s’exercent dans les estuaires ainsi que les eaux côtières et marines est une des prescriptions de la Loi sur les océans (1997). Dans le cas des zones élargies de gestion de l’océan (ZEGO), il importe de fixer des objectifs de conservation gérables. Dans la ZEGO de la baie de Placentia et des Grands Bancs, le choix des priorités visées en matière de conservation s’est effectué en plusieurs étapes. On a d’abord déterminé quelles étaient les composantes valorisées de l’écosystème (CVE) associées à la ZEGO ou à d’importantes parties de la ZEGO. On a ensuite classé ces CVE par ordre de priorité, selon une méthode à trois phases décrite ici, en fonction du risque que faisaient peser sur elle les activités anthropiques. La Phase I de la méthode permet d’établir de manière systématique une liste unique d’activités à haut risque (activités importantes) ou d’agresseurs pour chaque CVE. Dans la Phase II, on calcule le risque que représente chaque activité importante ou agresseur pour chacune des CVE, en se fondant sur l’ampleur de l’interaction et sur la sensibilité de la composante. Dans la Phase III, tous les résultats associés à chaque activité importante ou agresseur sont additionnés et les CVE sont classées d’après ces résultats cumulés, influencés à la fois par la gravité du dommage (calculé à la Phase II) et par le nombre des activités importantes et des agresseurs (qui ont été recensées à la Phase I). Le classement final des CVE reflète le risque relatif associé aux activités anthropiques importantes et aux agresseurs.

vi
1
1.0 INTRODUCTION Integrated Management (IM) strives to manage human activities through a continuous planning process in which stakeholders and regulators reach general agreement on the best mix of conservation, sustainable resource use and economic development within an ocean management area. The Government of Canada has recognized the Placentia Bay/Grand Banks (PB/GB) Large Ocean Management Area (LOMA) shown in Appendix 2, as one of five priority LOMAs in the country. As required under Canada’s Oceans Act, Fisheries and Oceans Canada will lead and facilitate the development of an IM Plan through the PB/GB LOMA Committee established December 2007. The plan will pursue a balance of conservation, social, cultural, economic and governance-related objectives to promote the health and sustainable use of the ecosystem, complementary to similar undertakings in the nested Placentia Bay and Coast of Bays Coastal Management Areas (CMAs). Ecosystem-based management is a key principle of IM, and although the plans will focus on managing human activities, in-depth knowledge of the marine ecosystem is vital to the planning process. In December 2007, regional Science Branch staff concluded their identification of 94 valued ecosystem components and properties thought to be critical conservation priorities and assembled this work in Placentia Bay-Grand Banks Large Ocean Management Area Science-Based Conservation Objectives (Fisheries and Oceans Canada, 2007b). These conservation priorities relate to ecologically and biologically significant areas (EBSAs), ecologically significant species (ESSs), and depleted species (DSs). Together these science considerations provide an extremely valuable tool in the development of PB/GB LOMA IM Plan and serve as the springboard into the collaborative evolution of draft conservation objectives for deliberation by the PB/GB LOMA Committee. The conservation priorities have been identified based on the ecological significance of ecosystem components and properties, without reference to the associated level of risk resulting from human activities. Clearly, elements that are at risk of immediate and irreversible harm must be given a higher priority for management action than those that appear to be relatively safe from harm for the foreseeable future. This document presents a three-phase methodology used to characterize and analyse the level of risk from human activities and/or potential stressors on key marine ecosystem components and/or properties identified for the PB/GB LOMA, and provide information on cumulative effects and identify information gaps. The product provides a relative ranking of the conservation priorities in an effort to facilitate ongoing objective development by the PB/GB LOMA Committee. Please note: “CP” as it is used in the remainder of this document will refer to a marine ecosystem component or property identified by Science Branch as a critical conservation priority.
2.0 LITERATURE REVIEW Various approaches for assessing the impacts of human activities on ecosystems have been developed by scientists, managers and conservation groups around the world. Although none of the systems that were reviewed could be applied directly to the PB/GB LOMA, a number of useful concepts, methods and terminology emerged. These have been adapted in the development of this methodology and are included on the reference list along with other information sources which provided useful guidance.
3.0 METHOD This methodology provides a systematic and transparent process for gathering, evaluating and recording information related to the risk of harm from human activities/stressors on key ecosystem components/ properties (CPs) of the PB/GB LOMA. A critical aspect of this methodology is that it builds on previous work conducted by DFO Science Branch which:
(i) defined and characterized the ecological units (EBSAs and LOMAs) and; (ii) identified key ecosystem components and properties within each ecological unit.
By focusing on the interaction between a single activity/stressor, and a single ecosystem CP associated with a specific area, the method allows a more detailed analysis then is possible when the effects on all ecosystem components are examined at once. A main feature of this method is the identification of the level of certainty or confidence in the data used to inform the process, and the documentation of significant data gaps. The level of certainty associated with each risk of harm score is identified as high (H), medium (M) or low (L) using the Certainty Check List provided in Appendix 1. For interactions with low certainty, information gaps and research priorities are identified. This approach promotes the continued gathering, synthesis and evaluation of information relevant to priority ecosystem CPs, and allows the application of the precautionary principle when considering appropriate management actions. Another important feature is the numerical scoring system which allows scores to be combined for all activities/stressor interactions with a single CP, allowing CPs to be ranked based on cumulative risk. Numerous management measures (gear restrictions, area closures, encounter protocols, by-catch limits, codes of contact and seasonal restrictions, etc.) are currently in place to conserve and protect valued marine ecosystem components and properties. While any relevant conservation measures should be identified in this analysis, temporary measures should not be used to reduce the determination of risk. Therefore, only those conservation measures that can reasonably be expected to stay in place for the next 10 years are considered in the risk calculations.
2

Step-by-step instructions are provided for each phase of the approach. 3.1 PHASE I: SCOPING In most of the approaches that we reviewed, some form of hierarchical or triage system was used in order to ensure that the risks of harm from all potential activities/stressors are considered, while at the same time focusing maximum effort on further analysis of those most at risk. The science-based CPs provide us with the key ecosystem components and properties, and the scoping phase provides a systematic way to identify high risk activities/stressors of relevance for further evaluation, while screening out irrelevant or low risk activities/stressors: 1. For each CP, review Table 1, and mark an X next to all activities/stressors which may
potentially be harmful.
For example, land-based pollution, sea level rise, and coastal erosion may result in harm to some CPs occupying shallow coastal habitats, but are generally considered to be of low risk in the offshore.
2. From those marked as potentially harmful in Step 1 above, select the key (most serious)
activities/stressors to a maximum of eight (adapted from The Nature Conservancy, 2000). Criteria to consider when selecting key activities/stressors include:
The risk of harm to the CP resulting from the activity/stressor, based on recent (last ten
years) data, or science-based predictions for the next ten years. Activities/stressors that are expected to increase to a point where they can cause serious
and irreversible harm should be screened in, even if the current level of harm is minimal. Activities/stressors that overlap the area occupied by the CP, but not the time occupied
by the CP, should generally be screened out. Temporary, short-term closures which prevent a historical overlap should not be used to screen out the activity/stressor, but permanent regulatory changes should.
Note that each CP will have its own unique list of up to 8 activities/stressors identified by this scoping process. These are the key risks which will be quantified in Phase II.
3. Provide a short rationale explaining why each activity/stressor which was identified as
potentially harmful in Step 1 was either screened in for analysis in Phase II or screened out.
3
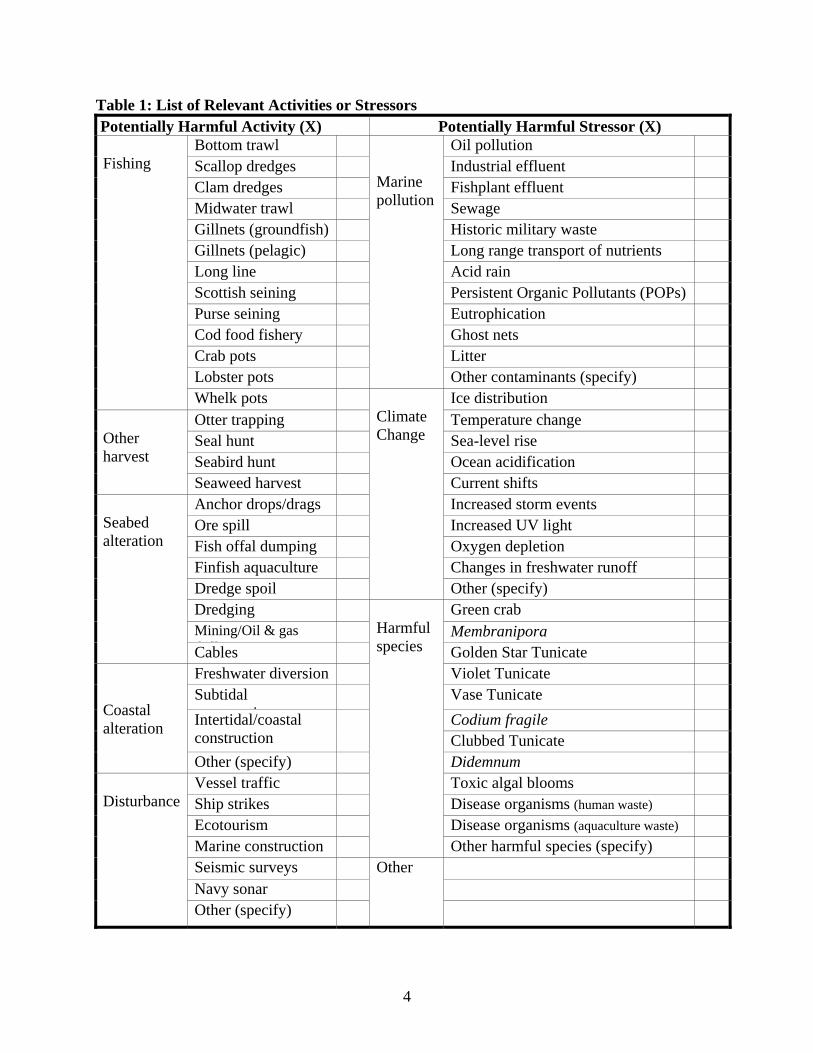
Table 1: List of Relevant Activities or Stressors Potentially Harmful Activity (X) Potentially Harmful Stressor (X)
Bottom trawl Oil pollution Scallop dredges Industrial effluent Clam dredges Fishplant effluent Midwater trawl Sewage Gillnets (groundfish) Historic military waste Gillnets (pelagic) Long range transport of nutrients Long line Acid rain Scottish seining Persistent Organic Pollutants (POPs) Purse seining Eutrophication Cod food fishery Ghost nets Crab pots Litter Lobster pots
Marine pollution
Other contaminants (specify)
Fishing
Whelk pots Ice distribution Otter trapping Temperature change Seal hunt Sea-level rise Seabird hunt Ocean acidification
Other harvest Seaweed harvest Current shifts
Anchor drops/drags Increased storm events Ore spill Increased UV light Fish offal dumping Oxygen depletion Finfish aquaculture Changes in freshwater runoff Dredge spoil
Climate Change Other (specify)
Dredging Green crab Mining/Oil & gas d illi
Membranipora
Seabed alteration Cables Golden Star Tunicate
Freshwater diversion Violet Tunicate Subtidal
t ti Vase Tunicate
Codium fragile Intertidal/coastal construction
Clubbed Tunicate
Coastal alteration Other (specify) Didemnum
Vessel traffic Toxic algal blooms Ship strikes Disease organisms (human waste) Ecotourism Disease organisms (aquaculture waste) Marine construction
Harmful species
Other harmful species (specify) Seismic surveys Navy sonar
Disturbance
Other (specify)
Other
4
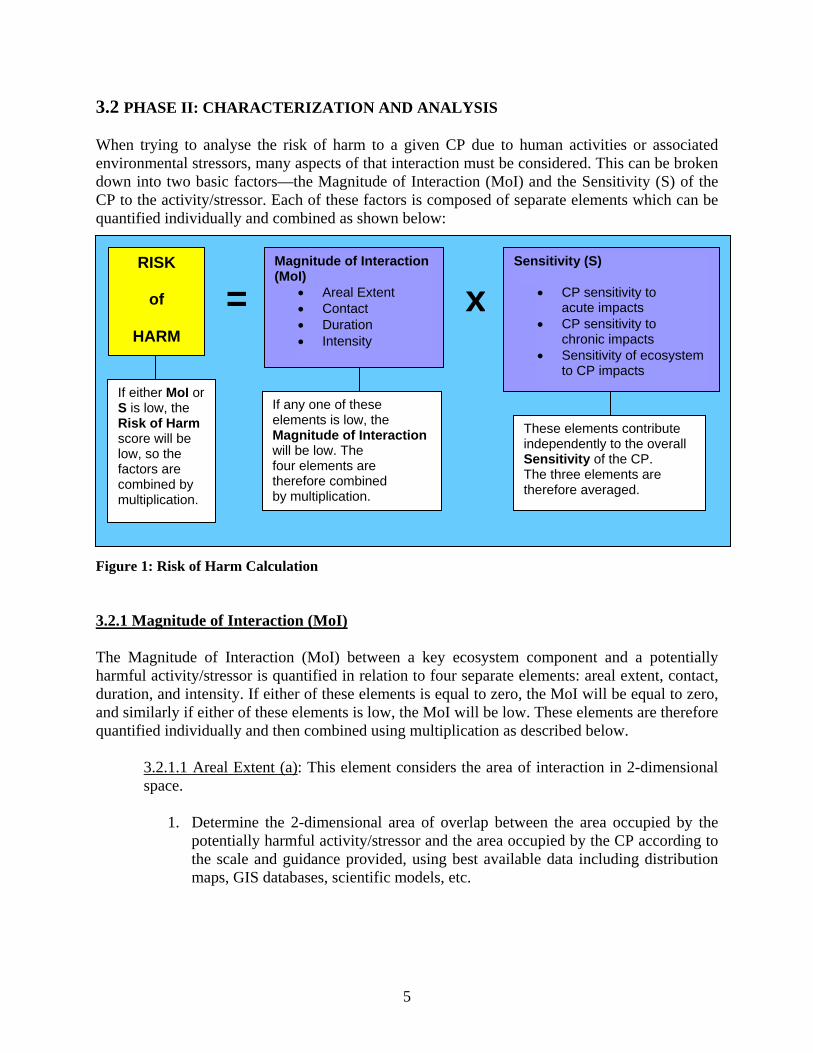
3.2 PHASE II: CHARACTERIZATION AND ANALYSIS When trying to analyse the risk of harm to a given CP due to human activities or associated environmental stressors, many aspects of that interaction must be considered. This can be broken down into two basic factors—the Magnitude of Interaction (MoI) and the Sensitivity (S) of the CP to the activity/stressor. Each of these factors is composed of separate elements which can be quantified individually and combined as shown below:
These elements contribute independently to the overall Sensitivity of the CP. The three elements are therefore averaged.
Sensitivity (S)
CP sensitivity to acute impacts
CP sensitivity to chronic impacts
Sensitivity of ecosystem to CP impacts
x
If any one of these elements is low, the Magnitude of Interaction will be low. The four elements are therefore combined by multiplication.
Magnitude of Interaction (MoI)
Areal Extent Contact Duration Intensity
=RISK
of
HARM
If either MoI or S is low, the Risk of Harm score will be low, so the factors are combined by multiplication.
Figure 1: Risk of Harm Calculation
3.2.1 Magnitude of Interaction (MoI) The Magnitude of Interaction (MoI) between a key ecosystem component and a potentially harmful activity/stressor is quantified in relation to four separate elements: areal extent, contact, duration, and intensity. If either of these elements is equal to zero, the MoI will be equal to zero, and similarly if either of these elements is low, the MoI will be low. These elements are therefore quantified individually and then combined using multiplication as described below.
3.2.1.1 Areal Extent (a): This element considers the area of interaction in 2-dimensional space.
1. Determine the 2-dimensional area of overlap between the area occupied by the potentially harmful activity/stressor and the area occupied by the CP according to the scale and guidance provided, using best available data including distribution maps, GIS databases, scientific models, etc.
5
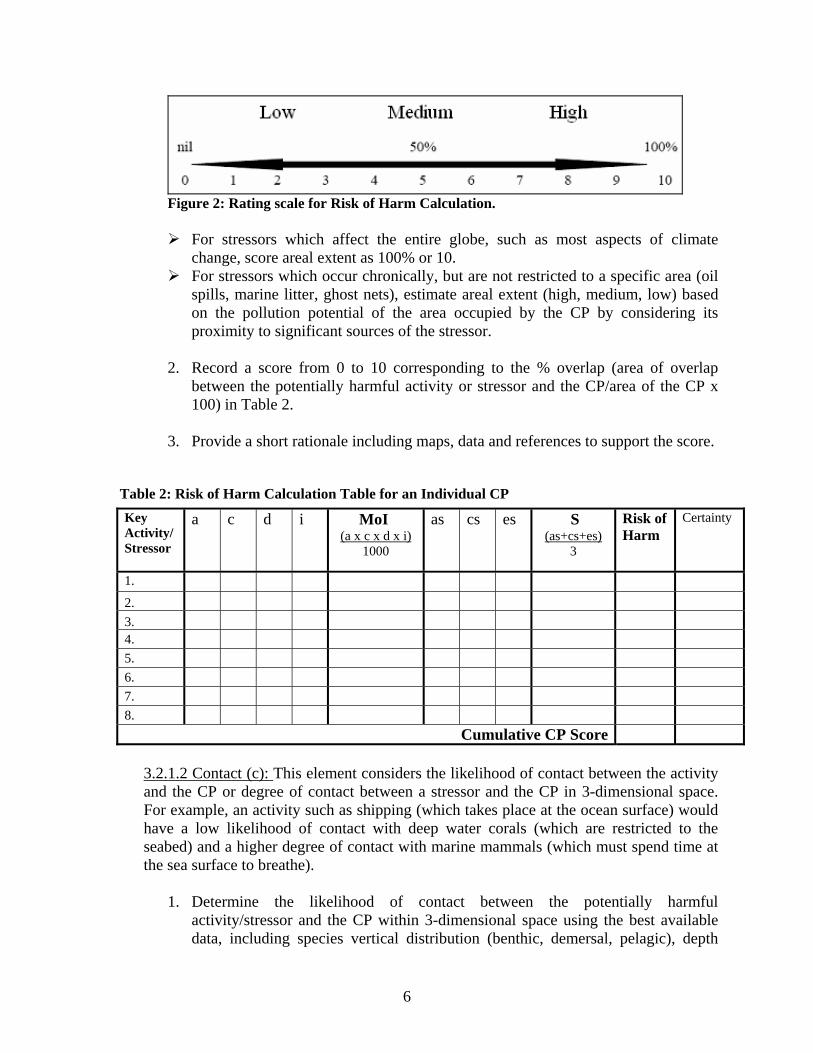
Figure 2: Rating scale for Risk of Harm Calculation.
For stressors which affect the entire globe, such as most aspects of climate
change, score areal extent as 100% or 10. For stressors which occur chronically, but are not restricted to a specific area (oil
spills, marine litter, ghost nets), estimate areal extent (high, medium, low) based on the pollution potential of the area occupied by the CP by considering its proximity to significant sources of the stressor.
2. Record a score from 0 to 10 corresponding to the % overlap (area of overlap
between the potentially harmful activity or stressor and the CP/area of the CP x 100) in Table 2.
3. Provide a short rationale including maps, data and references to support the score.
Table 2: Risk of Harm Calculation Table for an Individual CP
Key Activity/Stressor
a c d i MoI (a x c x d x i)
1000
as cs es S (as+cs+es)
3
Risk of Harm
Certainty
1. 2. 3. 4. 5. 6. 7. 8.
Cumulative CP Score 3.2.1.2 Contact (c): This element considers the likelihood of contact between the activity
and the CP or degree of contact between a stressor and the CP in 3-dimensional space. For example, an activity such as shipping (which takes place at the ocean surface) would have a low likelihood of contact with deep water corals (which are restricted to the seabed) and a higher degree of contact with marine mammals (which must spend time at the sea surface to breathe).
1. Determine the likelihood of contact between the potentially harmful
activity/stressor and the CP within 3-dimensional space using the best available data, including species vertical distribution (benthic, demersal, pelagic), depth
6
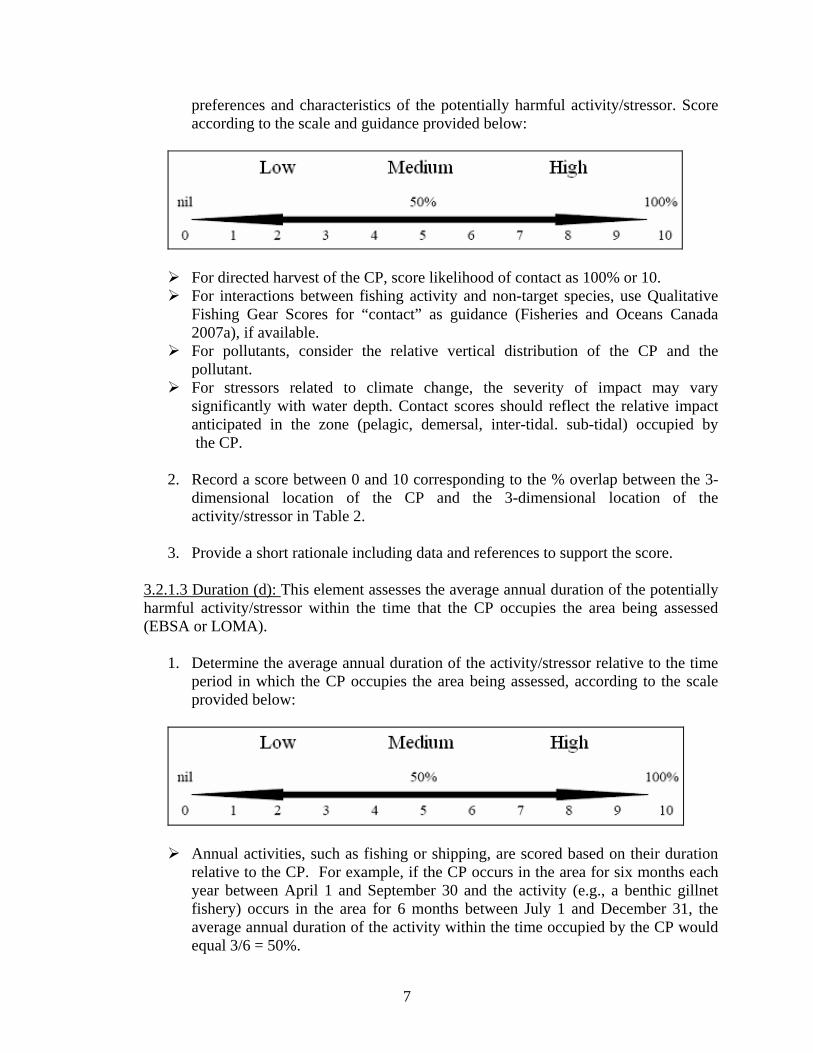
preferences and characteristics of the potentially harmful activity/stressor. Score according to the scale and guidance provided below:
For directed harvest of the CP, score likelihood of contact as 100% or 10. For interactions between fishing activity and non-target species, use Qualitative
Fishing Gear Scores for “contact” as guidance (Fisheries and Oceans Canada 2007a), if available.
For pollutants, consider the relative vertical distribution of the CP and the pollutant. For stressors related to climate change, the severity of impact may vary
significantly with water depth. Contact scores should reflect the relative impact anticipated in the zone (pelagic, demersal, inter-tidal. sub-tidal) occupied by the CP.
2. Record a score between 0 and 10 corresponding to the % overlap between the 3-dimensional location of the CP and the 3-dimensional location of the activity/stressor in Table 2.
3. Provide a short rationale including data and references to support the score.
3.2.1.3 Duration (d): This element assesses the average annual duration of the potentially harmful activity/stressor within the time that the CP occupies the area being assessed (EBSA or LOMA).
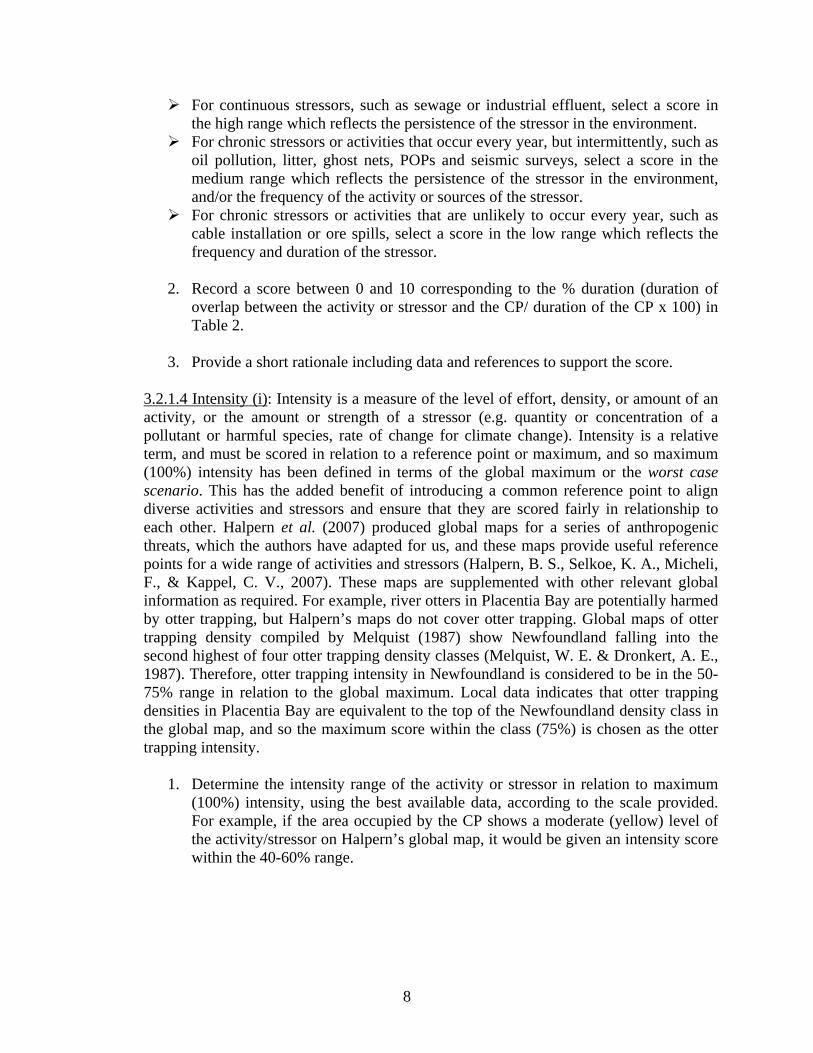
1. Determine the average annual duration of the activity/stressor relative to the time period in which the CP occupies the area being assessed, according to the scale provided below:
Annual activities, such as fishing or shipping, are scored based on their duration relative to the CP. For example, if the CP occurs in the area for six months each year between April 1 and September 30 and the activity (e.g., a benthic gillnet fishery) occurs in the area for 6 months between July 1 and December 31, the average annual duration of the activity within the time occupied by the CP would equal 3/6 = 50%.
7
For continuous stressors, such as sewage or industrial effluent, select a score in the high range which reflects the persistence of the stressor in the environment. For chronic stressors or activities that occur every year, but intermittently, such as oil pollution, litter, ghost nets, POPs and seismic surveys, select a score in the medium range which reflects the persistence of the stressor in the environment, and/or the frequency of the activity or sources of the stressor. For chronic stressors or activities that are unlikely to occur every year, such as cable installation or ore spills, select a score in the low range which reflects the frequency and duration of the stressor.
2. Record a score between 0 and 10 corresponding to the % duration (duration of
overlap between the activity or stressor and the CP/ duration of the CP x 100) in Table 2.
3. Provide a short rationale including data and references to support the score.
3.2.1.4 Intensity (i): Intensity is a measure of the level of effort, density, or amount of an activity, or the amount or strength of a stressor (e.g. quantity or concentration of a pollutant or harmful species, rate of change for climate change). Intensity is a relative term, and must be scored in relation to a reference point or maximum, and so maximum (100%) intensity has been defined in terms of the global maximum or the worst case scenario. This has the added benefit of introducing a common reference point to align diverse activities and stressors and ensure that they are scored fairly in relationship to each other. Halpern et al. (2007) produced global maps for a series of anthropogenic threats, which the authors have adapted for us, and these maps provide useful reference points for a wide range of activities and stressors (Halpern, B. S., Selkoe, K. A., Micheli, F., & Kappel, C. V., 2007). These maps are supplemented with other relevant global information as required. For example, river otters in Placentia Bay are potentially harmed by otter trapping, but Halpern’s maps do not cover otter trapping. Global maps of otter trapping density compiled by Melquist (1987) show Newfoundland falling into the second highest of four otter trapping density classes (Melquist, W. E. & Dronkert, A. E., 1987). Therefore, otter trapping intensity in Newfoundland is considered to be in the 50-75% range in relation to the global maximum. Local data indicates that otter trapping densities in Placentia Bay are equivalent to the top of the Newfoundland density class in the global map, and so the maximum score within the class (75%) is chosen as the otter trapping intensity.
1. Determine the intensity range of the activity or stressor in relation to maximum (100%) intensity, using the best available data, according to the scale provided. For example, if the area occupied by the CP shows a moderate (yellow) level of the activity/stressor on Halpern’s global map, it would be given an intensity score within the 40-60% range.
8
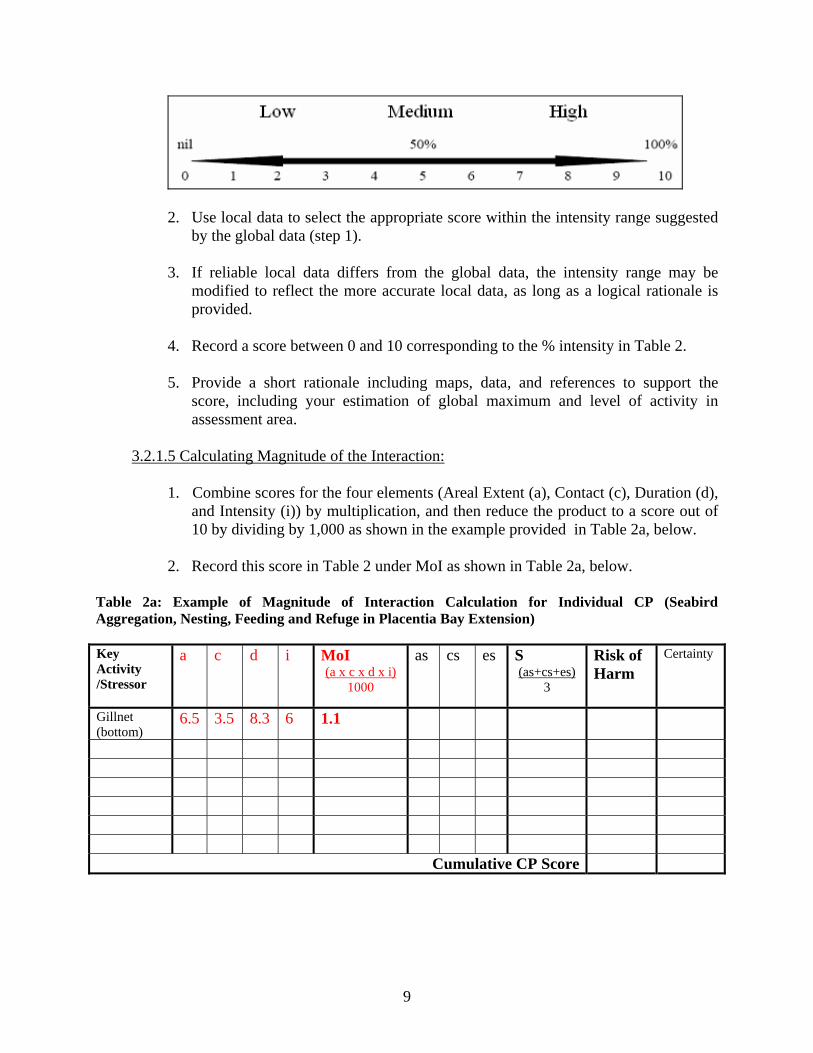
2. Use local data to select the appropriate score within the intensity range suggested
by the global data (step 1).
3. If reliable local data differs from the global data, the intensity range may be modified to reflect the more accurate local data, as long as a logical rationale is provided.
4. Record a score between 0 and 10 corresponding to the % intensity in Table 2.
5. Provide a short rationale including maps, data, and references to support the
score, including your estimation of global maximum and level of activity in assessment area.
3.2.1.5 Calculating Magnitude of the Interaction:
1. Combine scores for the four elements (Areal Extent (a), Contact (c), Duration (d), and Intensity (i)) by multiplication, and then reduce the product to a score out of 10 by dividing by 1,000 as shown in the example provided in Table 2a, below.
2. Record this score in Table 2 under MoI as shown in Table 2a, below.
Table 2a: Example of Magnitude of Interaction Calculation for Individual CP (Seabird Aggregation, Nesting, Feeding and Refuge in Placentia Bay Extension) Key Activity /Stressor
a c d i MoI (a x c x d x i)
1000
as cs es S (as+cs+es)
3
Risk of Harm
Certainty
Gillnet (bottom)
6.5 3.5 8.3 6 1.1
Cumulative CP Score
9

3.2.2 Sensitivity (S) Sensitivity (S) is the degree to which an adverse response may result from an interaction with the activity or stressor. The CP sensitivity to the activity/stressor is quantified in relation to three independent elements: sensitivity to short-term (acute) harm, sensitivity to long-term (chronic) harm and ecological sensitivity, or dependency on the CP. These elements are quantified individually and then averaged. Each element of S is scored based on the severity and nature of the CP sensitivity, without reference to the MoI.
3.2.2.1 Sensitivity of the CP to acute impacts (as): This element measures the sensitivity of the CP to short-term harm as a result of an interaction with the activity or stressor within the area being assessed.
1. Consider the nature and the severity of the potential acute impacts, and record a
score between 0 and 10 in Table 2. For example: if the CP refers to whale feeding, ship strikes may result in the occasional death of a whale without causing serious harm to the population, for a score of 3. Similarly, seismic surveys may result in a disruption with a moderate or high level of severity producing a score of 4 or 7 because the entire feeding aggregation may be disrupted for a significant period of time, over a wide area, but no whales are actually killed.
When scoring this factor, consider the proportion of the CP affected, and the
severity of the effect. When scoring a CP which provides habitat, consider whether the harm causes
disruption, alteration or destruction. For directed commercial harvest of the CP, select a score in the high range which
reflects the mortality rate relative to biomass estimates. For interactions between fishing activity and non-target species, use Qualitative
Fishing Gear Qualitative Scores for “harm” (Fisheries and Oceans Canada, 2007a), as guidance, if available.
For stressors involving ecosystem change, the score should reflect the predicted change over the next 10 years.
If the CP relates to several species or components with a range of scores, select an average value that represents all elements of the CP. For example, if the CP refers to four fish species, each of which have a different Qualitative Fishing Gear Score for harm, select the average of the four scores.
2. Record score between 0 and 10 in Table 2.
10
3. Provide a short rationale including data and references to support the score.
3.2.2.2 Sensitivity of CP to chronic impacts (cs): This element measures the sensitivity of the CP to long-term harm as a result of an interaction with the activity or stressor within the area being assessed. This element should capture indirect effects including food-chain effects, chronic toxicity, reproductive effects (fertility, birth defects, eggshell thinning), and population level changes in growth rate, fecundity, productivity, etc.
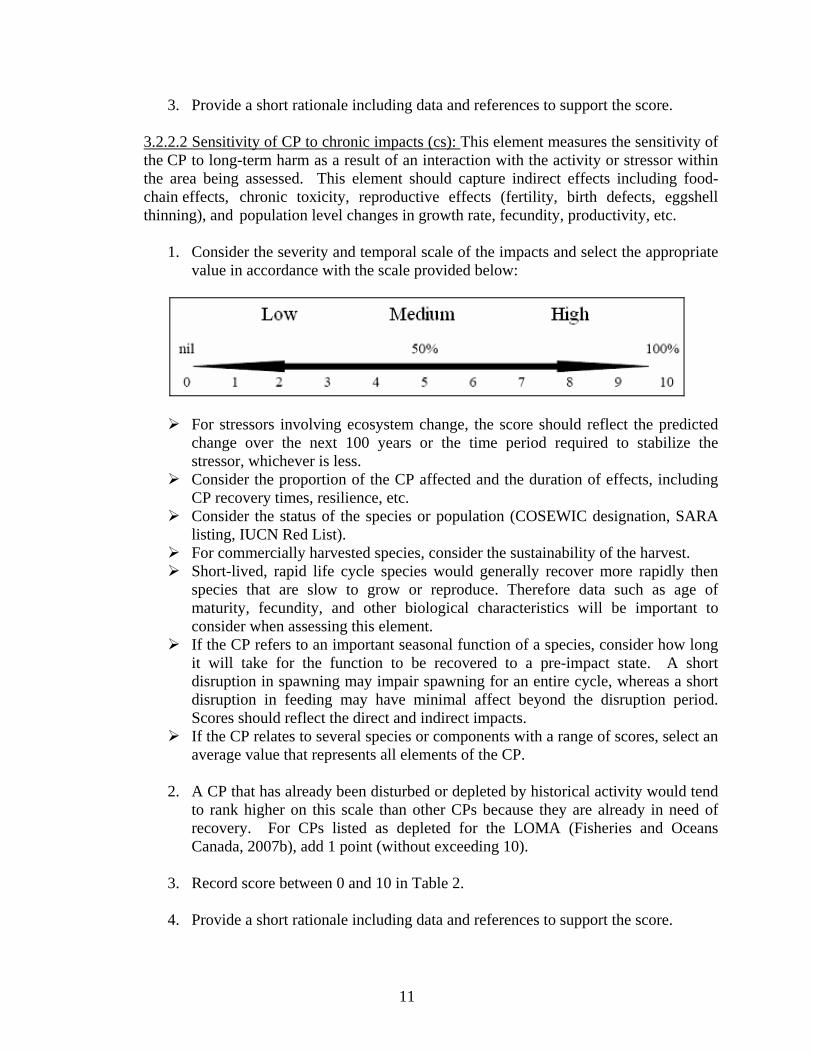
1. Consider the severity and temporal scale of the impacts and select the appropriate value in accordance with the scale provided below:
For stressors involving ecosystem change, the score should reflect the predicted
change over the next 100 years or the time period required to stabilize the stressor, whichever is less. Consider the proportion of the CP affected and the duration of effects, including
CP recovery times, resilience, etc. Consider the status of the species or population (COSEWIC designation, SARA
listing, IUCN Red List). For commercially harvested species, consider the sustainability of the harvest. Short-lived, rapid life cycle species would generally recover more rapidly then species that are slow to grow or reproduce. Therefore data such as age of maturity, fecundity, and other biological characteristics will be important to consider when assessing this element. If the CP refers to an important seasonal function of a species, consider how long
it will take for the function to be recovered to a pre-impact state. A short disruption in spawning may impair spawning for an entire cycle, whereas a short disruption in feeding may have minimal affect beyond the disruption period. Scores should reflect the direct and indirect impacts. If the CP relates to several species or components with a range of scores, select an
average value that represents all elements of the CP.
2. A CP that has already been disturbed or depleted by historical activity would tend to rank higher on this scale than other CPs because they are already in need of recovery. For CPs listed as depleted for the LOMA (Fisheries and Oceans Canada, 2007b), add 1 point (without exceeding 10).
3. Record score between 0 and 10 in Table 2.
4. Provide a short rationale including data and references to support the score.
11
3.2.2.3 Sensitivity of Ecosystem to harmful impacts to the CP (es): This element measures the degree to which the ecosystem is dependent on the CP. It does not measure the affect of the activity/stressor on the ecosystem as a whole, but rather the importance of the CP to ecosystem structure and function. For example, the depletion of Atlantic cod had widespread effects on the PB/GB ecosystem, whereas the loss of sea turtles might have a minor overall impact on ecosystem function.
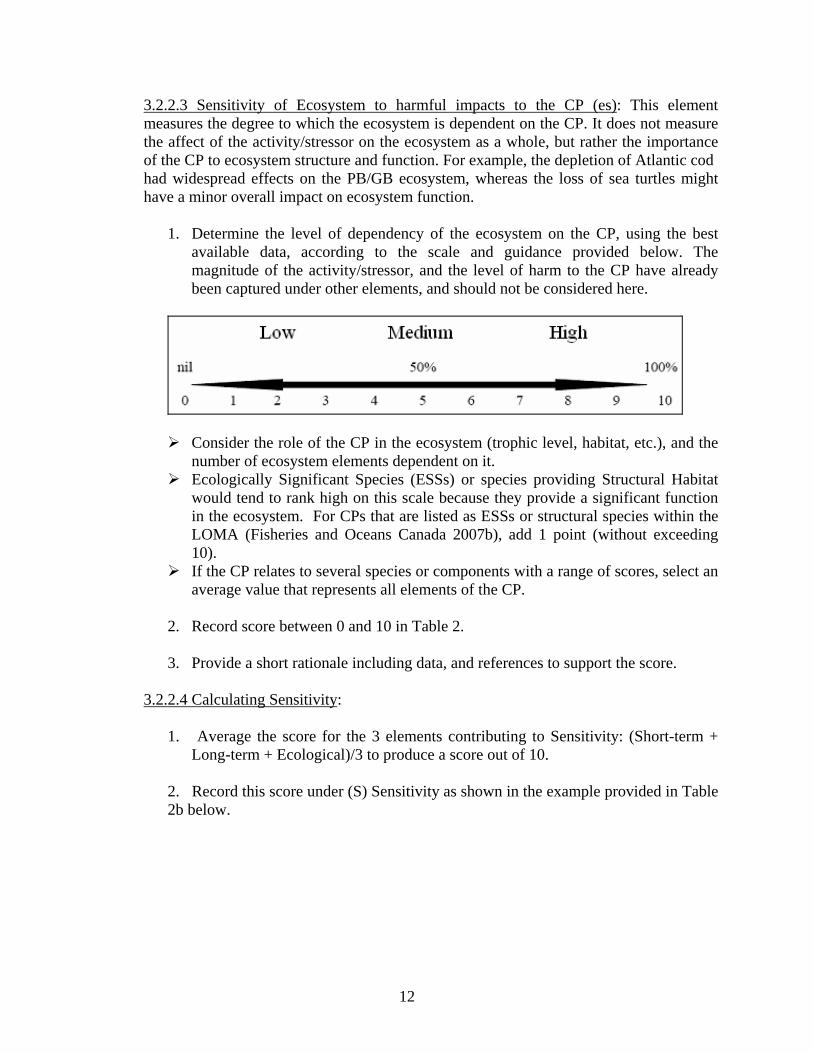
1. Determine the level of dependency of the ecosystem on the CP, using the best
available data, according to the scale and guidance provided below. The magnitude of the activity/stressor, and the level of harm to the CP have already been captured under other elements, and should not be considered here.
Consider the role of the CP in the ecosystem (trophic level, habitat, etc.), and the number of ecosystem elements dependent on it.
Ecologically Significant Species (ESSs) or species providing Structural Habitat would tend to rank high on this scale because they provide a significant function in the ecosystem. For CPs that are listed as ESSs or structural species within the LOMA (Fisheries and Oceans Canada 2007b), add 1 point (without exceeding 10).
If the CP relates to several species or components with a range of scores, select an average value that represents all elements of the CP.
2. Record score between 0 and 10 in Table 2.
3. Provide a short rationale including data, and references to support the score.
3.2.2.4 Calculating Sensitivity:
1. Average the score for the 3 elements contributing to Sensitivity: (Short-term + Long-term + Ecological)/3 to produce a score out of 10.
2. Record this score under (S) Sensitivity as shown in the example provided in Table 2b below.
12
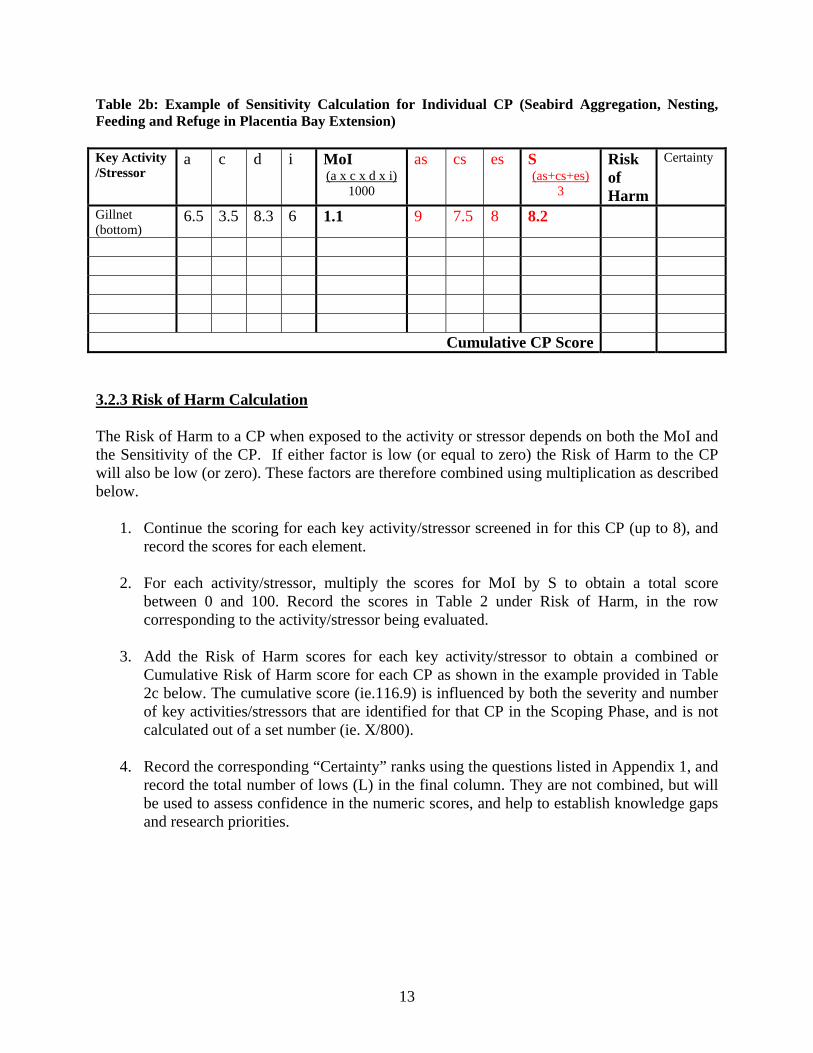
Table 2b: Example of Sensitivity Calculation for Individual CP (Seabird Aggregation, Nesting, Feeding and Refuge in Placentia Bay Extension) Key Activity /Stressor
a c d i MoI (a x c x d x i)
1000
as cs es S (as+cs+es)
3
Risk of Harm
Certainty
Gillnet (bottom)
6.5 3.5 8.3 6 1.1 9 7.5 8 8.2
Cumulative CP Score 3.2.3 Risk of Harm Calculation The Risk of Harm to a CP when exposed to the activity or stressor depends on both the MoI and the Sensitivity of the CP. If either factor is low (or equal to zero) the Risk of Harm to the CP will also be low (or zero). These factors are therefore combined using multiplication as described below.
1. Continue the scoring for each key activity/stressor screened in for this CP (up to 8), and record the scores for each element.
2. For each activity/stressor, multiply the scores for MoI by S to obtain a total score
between 0 and 100. Record the scores in Table 2 under Risk of Harm, in the row corresponding to the activity/stressor being evaluated.
3. Add the Risk of Harm scores for each key activity/stressor to obtain a combined or
Cumulative Risk of Harm score for each CP as shown in the example provided in Table 2c below. The cumulative score (ie.116.9) is influenced by both the severity and number of key activities/stressors that are identified for that CP in the Scoping Phase, and is not calculated out of a set number (ie. X/800).
4. Record the corresponding “Certainty” ranks using the questions listed in Appendix 1, and
record the total number of lows (L) in the final column. They are not combined, but will be used to assess confidence in the numeric scores, and help to establish knowledge gaps and research priorities.
13
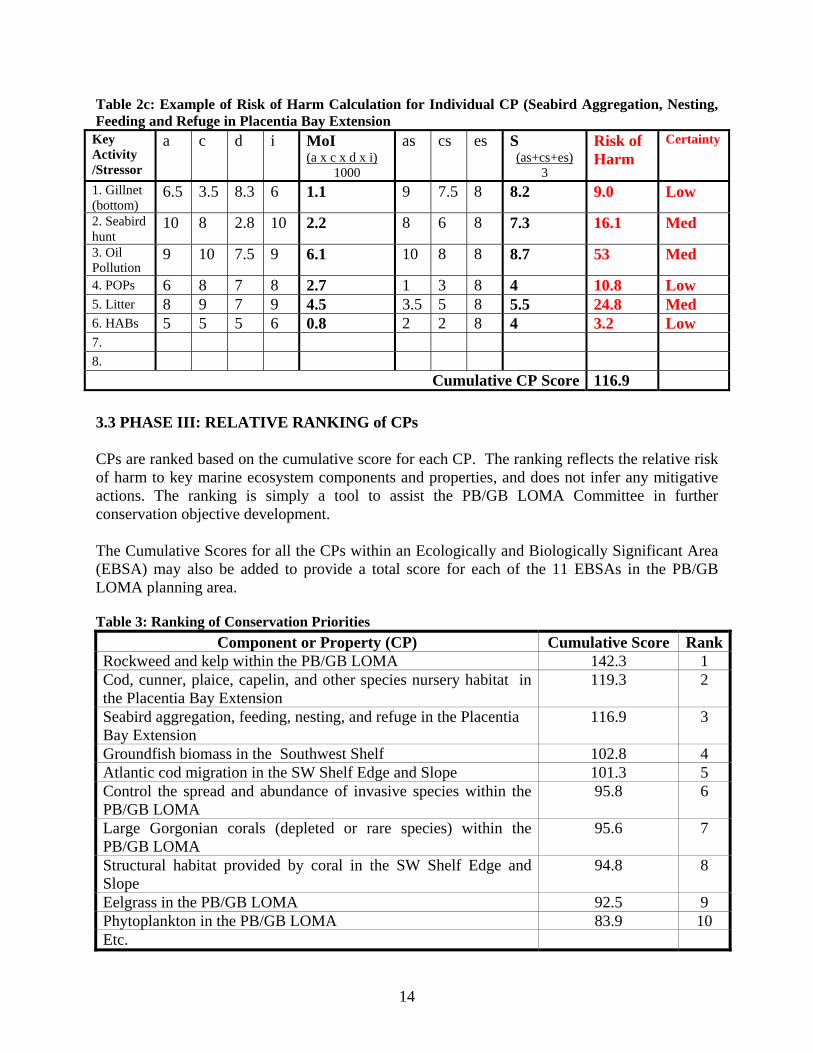
Table 2c: Example of Risk of Harm Calculation for Individual CP (Seabird Aggregation, Nesting, Feeding and Refuge in Placentia Bay Extension
Key Activity /Stressor
a c d i MoI (a x c x d x i)
1000
as cs es S (as+cs+es)
3
Risk of Harm
Certainty
1. Gillnet (bottom)
6.5 3.5 8.3 6 1.1 9 7.5 8 8.2 9.0 Low
2. Seabird hunt
10 8 2.8 10 2.2 8 6 8 7.3 16.1 Med
3. Oil Pollution
9 10 7.5 9 6.1 10 8 8 8.7 53 Med
4. POPs 6 8 7 8 2.7 1 3 8 4 10.8 Low 5. Litter 8 9 7 9 4.5 3.5 5 8 5.5 24.8 Med 6. HABs 5 5 5 6 0.8 2 2 8 4 3.2 Low 7. 8.
Cumulative CP Score 116.9
3.3 PHASE III: RELATIVE RANKING of CPs CPs are ranked based on the cumulative score for each CP. The ranking reflects the relative risk of harm to key marine ecosystem components and properties, and does not infer any mitigative actions. The ranking is simply a tool to assist the PB/GB LOMA Committee in further conservation objective development. The Cumulative Scores for all the CPs within an Ecologically and Biologically Significant Area (EBSA) may also be added to provide a total score for each of the 11 EBSAs in the PB/GB LOMA planning area. Table 3: Ranking of Conservation Priorities
Component or Property (CP) Cumulative Score RankRockweed and kelp within the PB/GB LOMA 142.3 1 Cod, cunner, plaice, capelin, and other species nursery habitat in the Placentia Bay Extension
119.3 2
Seabird aggregation, feeding, nesting, and refuge in the Placentia Bay Extension
116.9 3
Groundfish biomass in the Southwest Shelf 102.8 4 Atlantic cod migration in the SW Shelf Edge and Slope 101.3 5 Control the spread and abundance of invasive species within the PB/GB LOMA
95.8 6
Large Gorgonian corals (depleted or rare species) within the PB/GB LOMA
95.6 7
Structural habitat provided by coral in the SW Shelf Edge and Slope
94.8 8
Eelgrass in the PB/GB LOMA 92.5 9 Phytoplankton in the PB/GB LOMA 83.9 10 Etc.
14
4.0 REFERENCES Environment Canada 2007. Draft Guidelines on Identifying and Mitigating Threats to Species at Risk. Government of Canada internal guidance document.
Ervin, J. 2003. WWF: Rapid Assessment and Prioritization of Protected Area Management (RAPPAM) Methodology. pp.1-52. Gland, Switzerland, WWF.
Fisheries and Oceans Canada. 2007a Draft Proceedings of the Workshop on Qualitative Risk Assessment of Fishing Gears. Government of Canada.
Fisheries and Oceans Canada. 2007b. Placentia Bay-Grand Banks Large Ocean Management Area Conservation Objectives (Rep. No. 2007/042). Canadian Science Advisory Secretariat Science Advisory Report.
Fisheries and Oceans Canada. 2005. Practitioners Guide to the Risk Management Framework for DFO Marine Environment and Habitat Management Staff. Government of Canada internal guidance document.
Griffiths, S.P., Brewer, D.T., Heales, D.S., Milton, D.A. & Stobutzki, I.C. 2006. Validating ecological risk assessments for fisheries: assessing the impacts of turtle excluder devices on elasmobranch bycatch populations in an Australian trawl fishery. Mar. Freshw. Res. 57: 395-401.
Halpern, B.S., Selkoe, K.A., Micheli, F. & Kappel, C.V. 2007. Evaluating and Ranking the Vulnerability of Global Marine Ecosystems to Anthropogenic Threats. Conserv. Biol. 21: 1301-1315.
Hobday, A.J., Smith, A., Webb, H., Daley, R., Wayte, S., Bulman, C., Dowdney, J., Williams, A., Sporcic, M., Dambacher, J., Fuller, M. & Walker, T. 2007. Ecological Risk Assessment for the Effects of Fishing: Methodology. Report R04/1072. Canberra, Australian Fisheries Management Authority.
Melquist, W.E. & Dronkert, A.E. 1987. River Otter. Wild Furbearer Management and Conservation in North America (eds M. Novak, J. E. Baker, M. E. Obbard & B. Malloch). pp. 626-641. Ontario Ministry of Natural Resources, Toronto.
The Nature Conservancy. 2000. The Five-S Framework for Site Conservation: A Practitioner's Handbook for Site Conservation Planning and Measuring Conservation Success, Volume 1. pp.1-55. Arlington, Virginia, TNC.
The Nature Conservancy. 2000. The Five-S Framework for Site Conservation: A Practitioner's Handbook for Site Conservation Planning and Measuring Conservation Success - Appendices, Volume 2, pp.1-64. Arlington, Virginia, TNC.
OSPAR Commission. 2003. Criteria for the Identification of Species and Habitats in need of Protection and their Method of Application (The Texel-Faial Criteria). 1-13. OSPAR Convention for the Protection of the Marine Environment of the North-East Atlantic.
15
Roberts, C.M., Branch, G., Bustamante, R.H., Castilla, J.C., Dugan, J., Halpern, B.S., Lafferty, K.D., Leslie, H., Lubchenco, J., McArdle, D., Ruckelshaus, M. & Warner, R.R. 2003. Application of ecological criteria in selecting marine reserves and developing reserve networks. Ecol. Appl. 13: 215-228.
Roff, J.C. & Evans, S.M.J. 2002. Frameworks for marine conservation–non-hierarchical approaches and distinctive habitats. Aquat. Conserv: Mar. Freshw. Ecosyst. 12: 635-648.
Salafsky, N., Salzer, D., Ervin, J., Boucher, T. & Ostlie, W. 2003. Conventions for Defining, Naming, Measuring, Combining, and Mapping Threats in Conservation: An Initial Proposal for a Standard System, Draft Version. pp.1-35.
Smith, A.D.M., Hobday, A.J., Webb, H., Daley, R., Wayte, S., Bulman, C., Dowdney, J., Williams, A., Sporcic, M., Dambacher, J., Fuller, M., Furlani, D., Griffiths, S., Kenyon, R. & Walker, T. 2007. Ecological Risk Assessment for the Effects of Fishing: Final Report. R04/1072. Canberra, Australian Fisheries Management Authority.
Smith, A.D.M., Fulton, E.J., Hobday, A.J., Smith, D.C. & Shoulder, P. 2007. Scientific tools to support the practical implementation of ecosystem-based fisheries management. ICES J. Mar. Sci. 64: 633-639.
Transport Canada & RMRI (Canada) 2007. Quantitative Assessment of Oil Spill Risk for the South Coast of Newfoundland and Labrador. CAN/0179/R003, 1-329. Transport Canada.
Wilson, K., Pressey, R.L., Newton, A., Burgman, M., Possingham, H. & Weston, C. 2005. Measuring and Incorporating Vulnerability into Conservation Planning. Environ. Manag. 35: 527-543.
Smith, J.L., Lewis, K. & Laughren, J. 2006. A Policy and Planning Framework for Marine Protected Area Networks in Canada's Oceans. pp.1-105. Halifax, WWF-Canada.
16
APPENDIX 1: Certainty Checklist
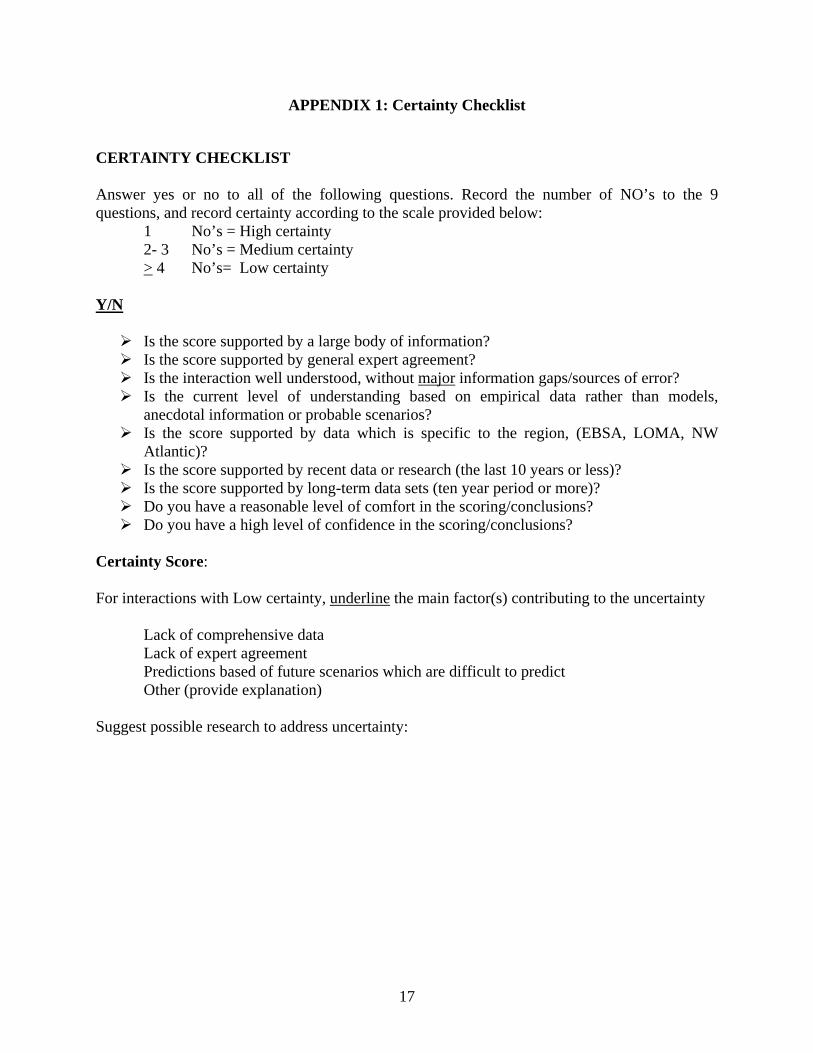
CERTAINTY CHECKLIST Answer yes or no to all of the following questions. Record the number of NO’s to the 9 questions, and record certainty according to the scale provided below:
1 No’s = High certainty 2- 3 No’s = Medium certainty > 4 No’s= Low certainty
Y/N Is the score supported by a large body of information? Is the score supported by general expert agreement? Is the interaction well understood, without major information gaps/sources of error? Is the current level of understanding based on empirical data rather than models,
anecdotal information or probable scenarios? Is the score supported by data which is specific to the region, (EBSA, LOMA, NW
Atlantic)? Is the score supported by recent data or research (the last 10 years or less)? Is the score supported by long-term data sets (ten year period or more)? Do you have a reasonable level of comfort in the scoring/conclusions? Do you have a high level of confidence in the scoring/conclusions?
Certainty Score: For interactions with Low certainty, underline the main factor(s) contributing to the uncertainty
Lack of comprehensive data Lack of expert agreement Predictions based of future scenarios which are difficult to predict Other (provide explanation)
Suggest possible research to address uncertainty:
17

18
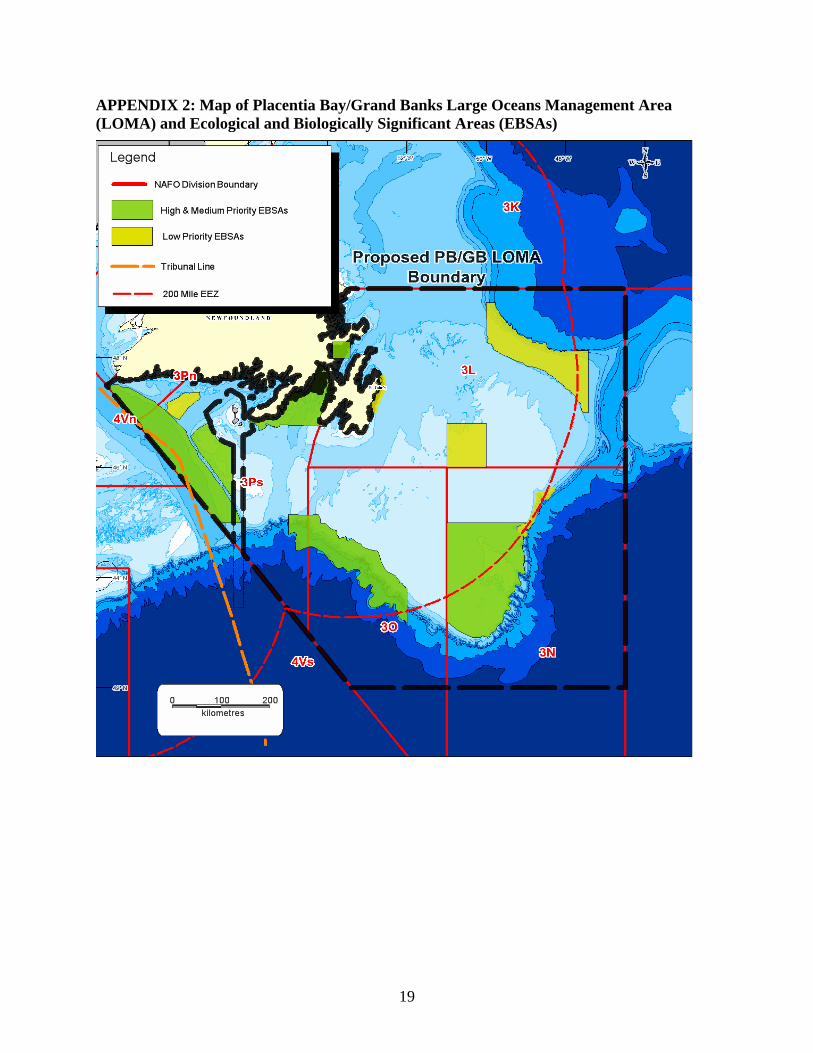
APPENDIX 2: Map of Placentia Bay/Grand Banks Large Oceans Management Area (LOMA) and Ecological and Biologically Significant Areas (EBSAs)
19