Embed Size (px)
Citation preview
ORIGINAL PAPER
Characteristics of Water Ingress in Norwegian Subsea Tunnels
Bjørn Nilsen
Received: 16 May 2012 / Accepted: 5 August 2012
� Springer-Verlag 2012
Abstract Water ingress represents one of the main
challenges in subsea tunnelling, particularly when this
occurs in sections with poor rock mass quality. This paper
is discussing the main characteristics of water ingress in
subsea hard rock tunnels based on the experience from
almost 50 such tunnels that have been built in Norway.
Following a brief description of the geological conditions
and the basic design of the subsea tunnels, pre-construction
investigations and investigations during excavation are
discussed with particular emphasis on prediction of water
ingress. Two cases with particularly difficult conditions;
the Bjorøy tunnel and the Atlantic Ocean tunnel, are dis-
cussed in detail. In these cases, large water inflow with
pressure of up to 2.4 MPa was encountered at major faults/
weakness zones during excavation, and special procedures
were required to cope with the problems. Based on the
experience from the Norwegian projects, it is concluded
that continuous follow-up by experienced engineering
geologists, probe drilling with the drilling jumbo and pre-
grouting where required are the most important factors for
coping with water ingress and ensuring stability.
Keywords Subsea tunnel � Water ingress �Pre-investigation � Probe drilling � Water sealing
1 Introduction
Since the early 1980s almost 50 subsea tunnels have been
built in Norway (Nilsen and Henning 2009; Nilsen 2011).
The majority of these are road tunnels, but there are also
subsea tunnels for oil and gas pipelines and for water
supply and sewerage. The tunnels are located in a variety
of geological conditions, ranging from hard, very good
quality Precambrian rock to less competent Paleozoic
(Caledonian) rocks such as shale, schist and phyllite.
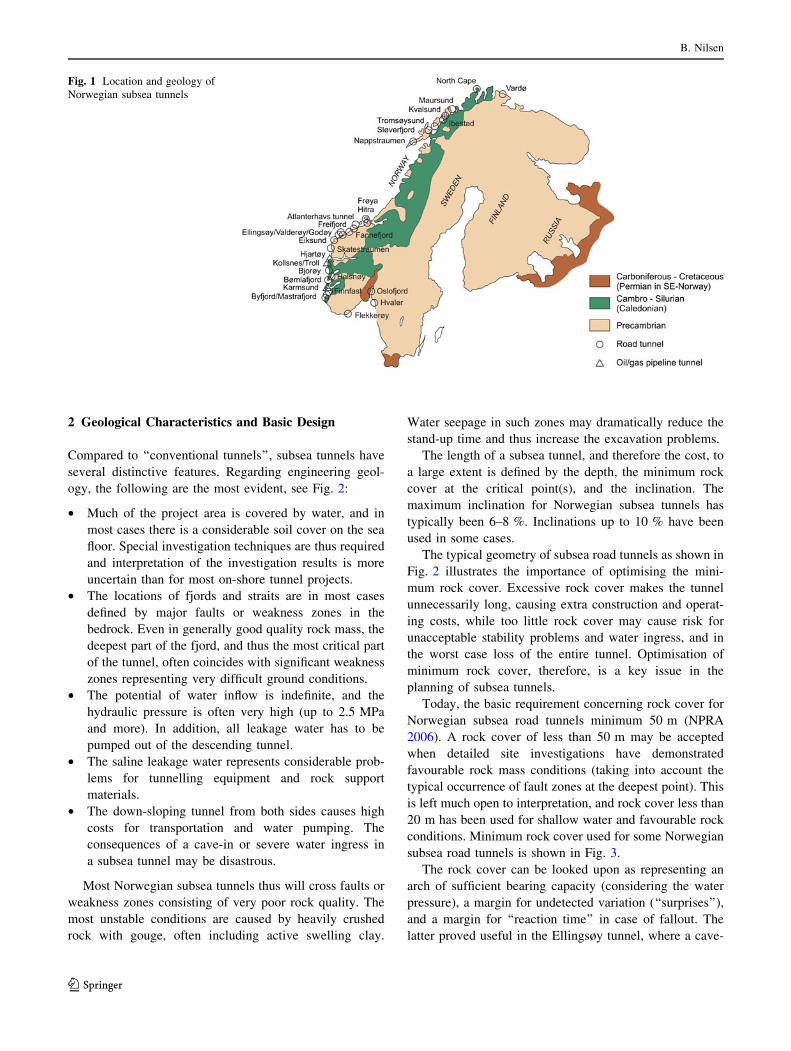
The locations of the main Norwegian subsea tunnels
are shown in Fig. 1, and key data for the projects are
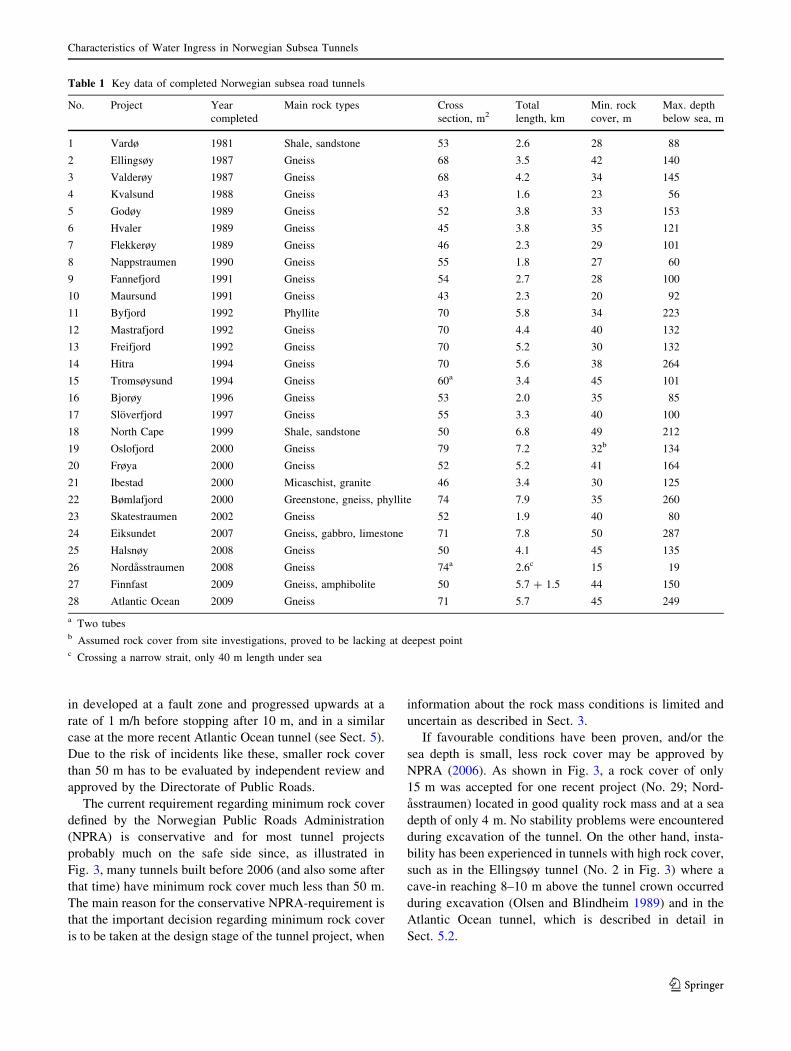
given in Tables 1 and 2. As can be seen from Table 1, the
7.9 km long Bømlafjord road tunnel is the longest of the
Norwegian subsea tunnels, and the Eiksundet road tunnel
is the deepest, with its lowest section 287 m below sea
level.
In most cases, tunnel excavation has been completed on
time and on schedule without major problems or surprises
during excavation. In some cases, very difficult conditions
have, however, been encountered. The greatest challenges
have been represented by weakness zones/faults, often
containing swelling clay, and by large water ingress (Dahl
Johansen 1995; Karlsson 2008; Nilsen and Palmstrøm
2009; Nilsen 2010). Combinations of very poor rock mass
quality and large water inflow, such as in the major faults/
weakness zones of the Bjorøy tunnel and the Atlantic
Ocean tunnel, have been particularly difficult.
The intention of this paper is, based on participation in
investigations and expert panel evaluations, to discuss the
characteristics of water problems in the Norwegian subsea
tunnels, and how such problems may be minimized through
investigations at the pre-construction stage as well as
during excavation, and through appropriate measures dur-
ing tunnelling.
B. Nilsen (&)
Department of Geology and Mineral Resources Engineering,
Norwegian University of Science and Technology (NTNU),
Sem Sælands vei 1, 7491, Trondheim, Norway
e-mail: [email protected]
123
Rock Mech Rock Eng
DOI 10.1007/s00603-012-0300-8
2 Geological Characteristics and Basic Design
Compared to ‘‘conventional tunnels’’, subsea tunnels have
several distinctive features. Regarding engineering geol-
ogy, the following are the most evident, see Fig. 2:
• Much of the project area is covered by water, and in
most cases there is a considerable soil cover on the sea
floor. Special investigation techniques are thus required
and interpretation of the investigation results is more
uncertain than for most on-shore tunnel projects.
• The locations of fjords and straits are in most cases
defined by major faults or weakness zones in the
bedrock. Even in generally good quality rock mass, the
deepest part of the fjord, and thus the most critical part
of the tunnel, often coincides with significant weakness
zones representing very difficult ground conditions.
• The potential of water inflow is indefinite, and the
hydraulic pressure is often very high (up to 2.5 MPa
and more). In addition, all leakage water has to be
pumped out of the descending tunnel.
• The saline leakage water represents considerable prob-
lems for tunnelling equipment and rock support
materials.
• The down-sloping tunnel from both sides causes high
costs for transportation and water pumping. The
consequences of a cave-in or severe water ingress in
a subsea tunnel may be disastrous.
Most Norwegian subsea tunnels thus will cross faults or
weakness zones consisting of very poor rock quality. The
most unstable conditions are caused by heavily crushed
rock with gouge, often including active swelling clay.
Water seepage in such zones may dramatically reduce the
stand-up time and thus increase the excavation problems.
The length of a subsea tunnel, and therefore the cost, to
a large extent is defined by the depth, the minimum rock
cover at the critical point(s), and the inclination. The
maximum inclination for Norwegian subsea tunnels has
typically been 6–8 %. Inclinations up to 10 % have been
used in some cases.
The typical geometry of subsea road tunnels as shown in
Fig. 2 illustrates the importance of optimising the mini-
mum rock cover. Excessive rock cover makes the tunnel
unnecessarily long, causing extra construction and operat-
ing costs, while too little rock cover may cause risk for
unacceptable stability problems and water ingress, and in
the worst case loss of the entire tunnel. Optimisation of
minimum rock cover, therefore, is a key issue in the
planning of subsea tunnels.
Today, the basic requirement concerning rock cover for
Norwegian subsea road tunnels minimum 50 m (NPRA
2006). A rock cover of less than 50 m may be accepted
when detailed site investigations have demonstrated
favourable rock mass conditions (taking into account the
typical occurrence of fault zones at the deepest point). This
is left much open to interpretation, and rock cover less than
20 m has been used for shallow water and favourable rock
conditions. Minimum rock cover used for some Norwegian
subsea road tunnels is shown in Fig. 3.
The rock cover can be looked upon as representing an
arch of sufficient bearing capacity (considering the water
pressure), a margin for undetected variation (‘‘surprises’’),
and a margin for ‘‘reaction time’’ in case of fallout. The
latter proved useful in the Ellingsøy tunnel, where a cave-
Fig. 1 Location and geology of
Norwegian subsea tunnels
B. Nilsen
123
in developed at a fault zone and progressed upwards at a
rate of 1 m/h before stopping after 10 m, and in a similar
case at the more recent Atlantic Ocean tunnel (see Sect. 5).
Due to the risk of incidents like these, smaller rock cover
than 50 m has to be evaluated by independent review and
approved by the Directorate of Public Roads.
The current requirement regarding minimum rock cover
defined by the Norwegian Public Roads Administration
(NPRA) is conservative and for most tunnel projects
probably much on the safe side since, as illustrated in
Fig. 3, many tunnels built before 2006 (and also some after
that time) have minimum rock cover much less than 50 m.
The main reason for the conservative NPRA-requirement is
that the important decision regarding minimum rock cover
is to be taken at the design stage of the tunnel project, when
information about the rock mass conditions is limited and
uncertain as described in Sect. 3.
If favourable conditions have been proven, and/or the
sea depth is small, less rock cover may be approved by
NPRA (2006). As shown in Fig. 3, a rock cover of only
15 m was accepted for one recent project (No. 29; Nord-
asstraumen) located in good quality rock mass and at a sea
depth of only 4 m. No stability problems were encountered
during excavation of the tunnel. On the other hand, insta-
bility has been experienced in tunnels with high rock cover,
such as in the Ellingsøy tunnel (No. 2 in Fig. 3) where a
cave-in reaching 8–10 m above the tunnel crown occurred
during excavation (Olsen and Blindheim 1989) and in the
Atlantic Ocean tunnel, which is described in detail in
Sect. 5.2.
Table 1 Key data of completed Norwegian subsea road tunnels
No. Project Year
completed
Main rock types Cross
section, m2Total
length, km
Min. rock
cover, m
Max. depth
below sea, m
1 Vardø 1981 Shale, sandstone 53 2.6 28 88
2 Ellingsøy 1987 Gneiss 68 3.5 42 140
3 Valderøy 1987 Gneiss 68 4.2 34 145
4 Kvalsund 1988 Gneiss 43 1.6 23 56
5 Godøy 1989 Gneiss 52 3.8 33 153
6 Hvaler 1989 Gneiss 45 3.8 35 121
7 Flekkerøy 1989 Gneiss 46 2.3 29 101
8 Nappstraumen 1990 Gneiss 55 1.8 27 60
9 Fannefjord 1991 Gneiss 54 2.7 28 100
10 Maursund 1991 Gneiss 43 2.3 20 92
11 Byfjord 1992 Phyllite 70 5.8 34 223
12 Mastrafjord 1992 Gneiss 70 4.4 40 132
13 Freifjord 1992 Gneiss 70 5.2 30 132
14 Hitra 1994 Gneiss 70 5.6 38 264
15 Tromsøysund 1994 Gneiss 60a 3.4 45 101
16 Bjorøy 1996 Gneiss 53 2.0 35 85
17 Sloverfjord 1997 Gneiss 55 3.3 40 100
18 North Cape 1999 Shale, sandstone 50 6.8 49 212
19 Oslofjord 2000 Gneiss 79 7.2 32b 134
20 Frøya 2000 Gneiss 52 5.2 41 164
21 Ibestad 2000 Micaschist, granite 46 3.4 30 125
22 Bømlafjord 2000 Greenstone, gneiss, phyllite 74 7.9 35 260
23 Skatestraumen 2002 Gneiss 52 1.9 40 80
24 Eiksundet 2007 Gneiss, gabbro, limestone 71 7.8 50 287
25 Halsnøy 2008 Gneiss 50 4.1 45 135
26 Nordasstraumen 2008 Gneiss 74a 2.6c 15 19
27 Finnfast 2009 Gneiss, amphibolite 50 5.7 ? 1.5 44 150
28 Atlantic Ocean 2009 Gneiss 71 5.7 45 249
a Two tubesb Assumed rock cover from site investigations, proved to be lacking at deepest pointc Crossing a narrow strait, only 40 m length under sea
Characteristics of Water Ingress in Norwegian Subsea Tunnels
123
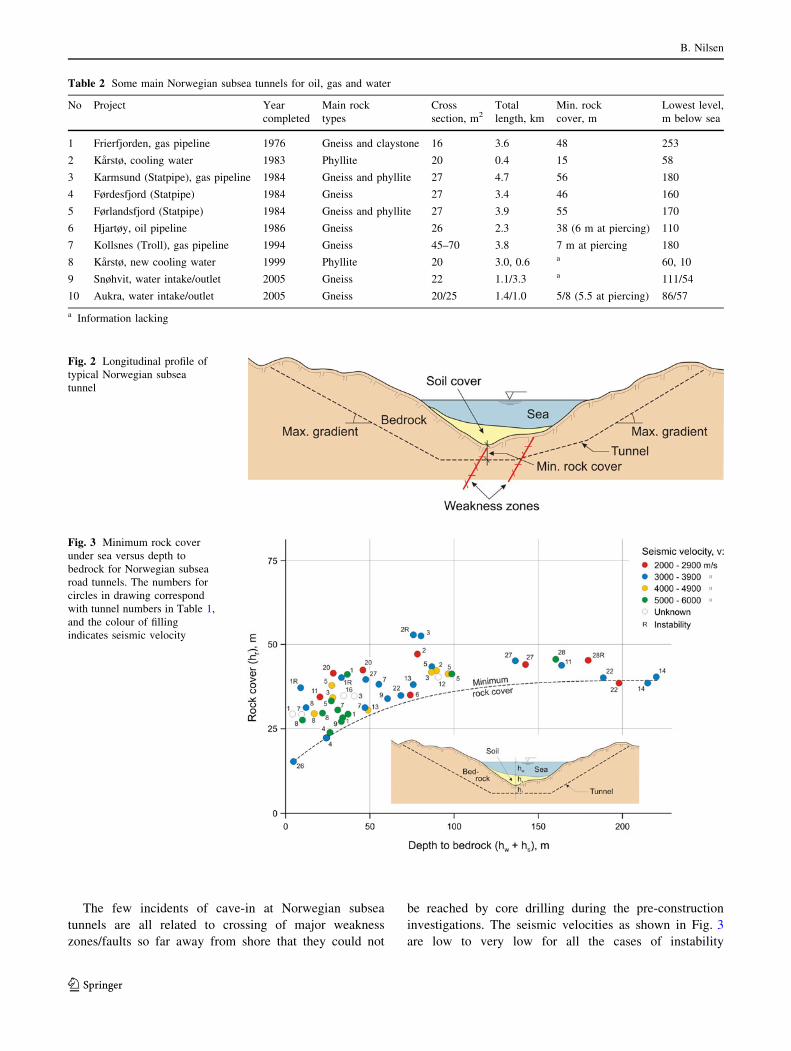
The few incidents of cave-in at Norwegian subsea
tunnels are all related to crossing of major weakness
zones/faults so far away from shore that they could not
be reached by core drilling during the pre-construction
investigations. The seismic velocities as shown in Fig. 3
are low to very low for all the cases of instability
Fig. 3 Minimum rock cover
under sea versus depth to
bedrock for Norwegian subsea
road tunnels. The numbers for
circles in drawing correspond
with tunnel numbers in Table 1,
and the colour of filling
indicates seismic velocity
Fig. 2 Longitudinal profile of
typical Norwegian subsea
tunnel
Table 2 Some main Norwegian subsea tunnels for oil, gas and water
No Project Year
completed
Main rock
types
Cross
section, m2Total
length, km
Min. rock
cover, m
Lowest level,
m below sea
1 Frierfjorden, gas pipeline 1976 Gneiss and claystone 16 3.6 48 253
2 Karstø, cooling water 1983 Phyllite 20 0.4 15 58
3 Karmsund (Statpipe), gas pipeline 1984 Gneiss and phyllite 27 4.7 56 180
4 Førdesfjord (Statpipe) 1984 Gneiss 27 3.4 46 160
5 Førlandsfjord (Statpipe) 1984 Gneiss and phyllite 27 3.9 55 170
6 Hjartøy, oil pipeline 1986 Gneiss 26 2.3 38 (6 m at piercing) 110
7 Kollsnes (Troll), gas pipeline 1994 Gneiss 45–70 3.8 7 m at piercing 180
8 Karstø, new cooling water 1999 Phyllite 20 3.0, 0.6 a 60, 10
9 Snøhvit, water intake/outlet 2005 Gneiss 22 1.1/3.3 a 111/54
10 Aukra, water intake/outlet 2005 Gneiss 20/25 1.4/1.0 5/8 (5.5 at piercing) 86/57
a Information lacking
B. Nilsen
123
(representing cave-ins that in all cases were stopped
from a few to up to 10 m above the tunnel crown).
However, correlations between seismic velocity and rock
mechanical parameters are very uncertain. Due to the
problem of defining reliable input parameters for ana-
lytical and numerical analyses, such analyses are not
carried out, and the decision regarding minimum rock
cover is rather based on empirical approach as described
above.
3 Information from pre-construction investigations
The Norwegian subsea tunnels, as shown in Fig. 1, are
located mainly in hard, Precambrian rocks (typically gra-
nitic gneiss). As described above, even in generally good
quality rock conditions, the deepest part of the fjord, and
hence the most critical part of the tunnel, however, often
coincides with weak zones or faults, which may cause
difficult excavation conditions. Thus, the geological con-
ditions are often challenging for these tunnels, and exten-
sive site investigations are needed.
In addition to normal geological surveys on both sides of
the fjord, and on any adjacent islands, the site investiga-
tions rely heavily on seismics in the first stage. Acoustic
profiling is first carried out to cover a large area to deter-
mine the most suitable corridor, extensive refraction seis-
mics is then carried out to select the best alignment and to
provide information about soil deposits above the bedrock
and about weakness (low velocity) zones in the bedrock. In
most cases, core drilling to further investigate major
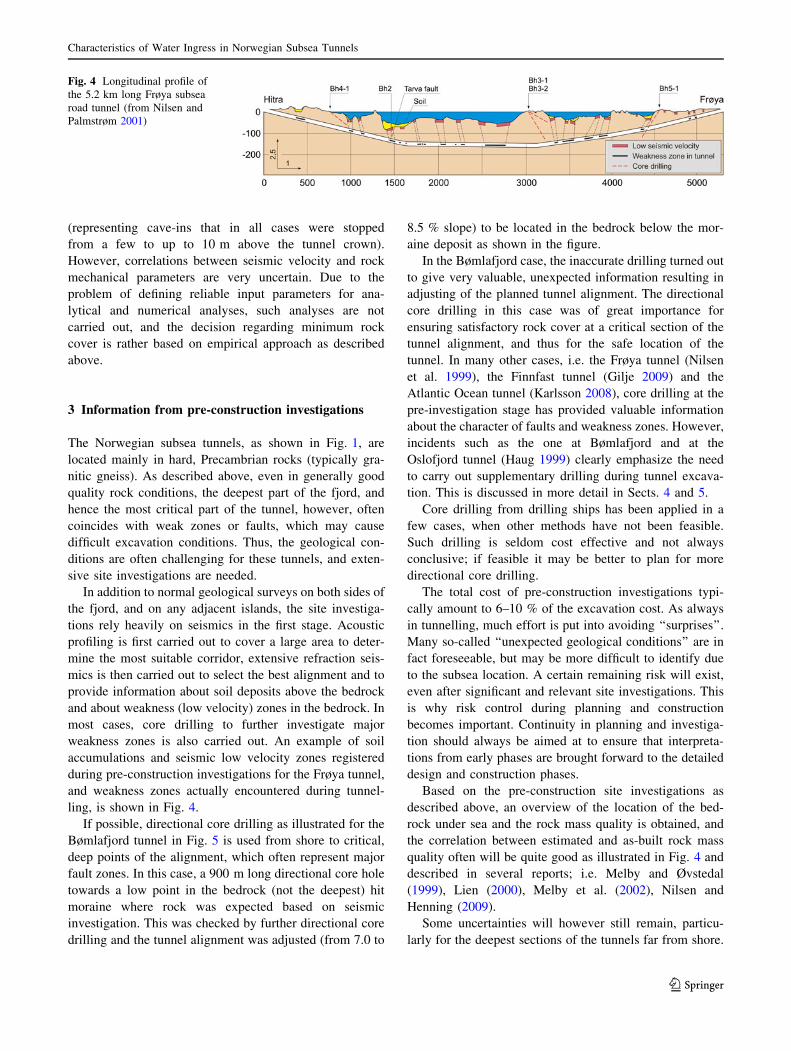
weakness zones is also carried out. An example of soil
accumulations and seismic low velocity zones registered
during pre-construction investigations for the Frøya tunnel,
and weakness zones actually encountered during tunnel-
ling, is shown in Fig. 4.
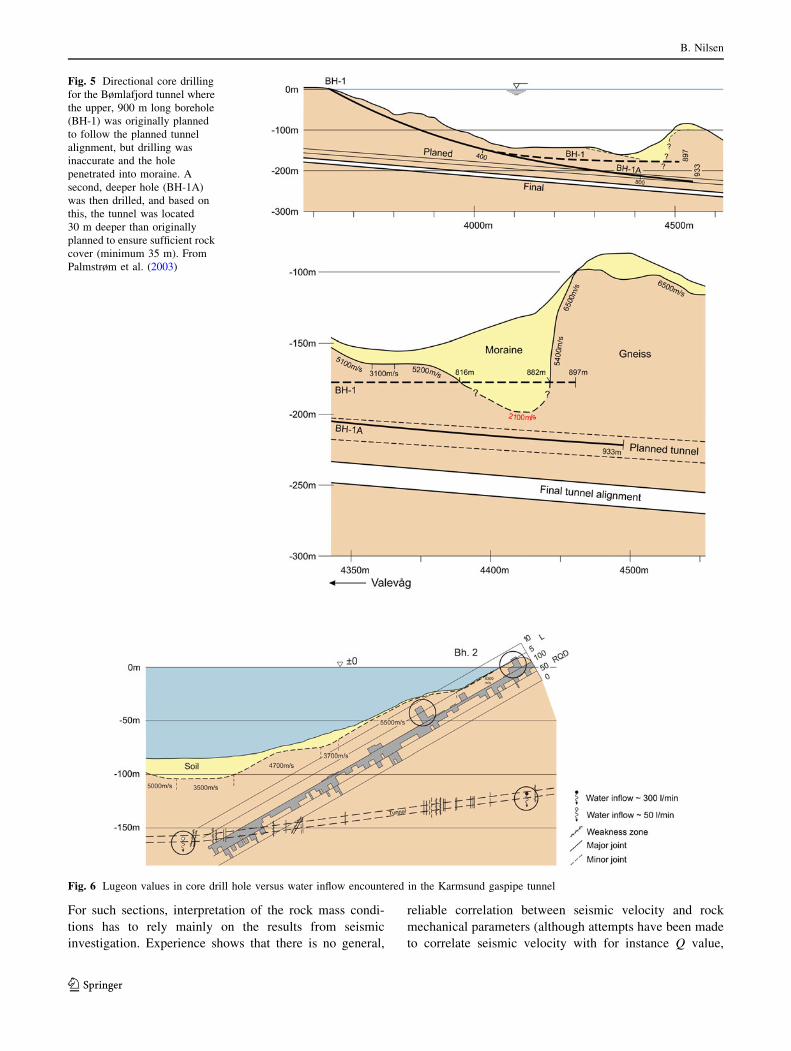
If possible, directional core drilling as illustrated for the
Bømlafjord tunnel in Fig. 5 is used from shore to critical,
deep points of the alignment, which often represent major
fault zones. In this case, a 900 m long directional core hole
towards a low point in the bedrock (not the deepest) hit
moraine where rock was expected based on seismic
investigation. This was checked by further directional core
drilling and the tunnel alignment was adjusted (from 7.0 to
8.5 % slope) to be located in the bedrock below the mor-
aine deposit as shown in the figure.
In the Bømlafjord case, the inaccurate drilling turned out
to give very valuable, unexpected information resulting in
adjusting of the planned tunnel alignment. The directional
core drilling in this case was of great importance for
ensuring satisfactory rock cover at a critical section of the
tunnel alignment, and thus for the safe location of the
tunnel. In many other cases, i.e. the Frøya tunnel (Nilsen
et al. 1999), the Finnfast tunnel (Gilje 2009) and the
Atlantic Ocean tunnel (Karlsson 2008), core drilling at the
pre-investigation stage has provided valuable information
about the character of faults and weakness zones. However,
incidents such as the one at Bømlafjord and at the
Oslofjord tunnel (Haug 1999) clearly emphasize the need
to carry out supplementary drilling during tunnel excava-
tion. This is discussed in more detail in Sects. 4 and 5.
Core drilling from drilling ships has been applied in a
few cases, when other methods have not been feasible.
Such drilling is seldom cost effective and not always
conclusive; if feasible it may be better to plan for more
directional core drilling.
The total cost of pre-construction investigations typi-
cally amount to 6–10 % of the excavation cost. As always
in tunnelling, much effort is put into avoiding ‘‘surprises’’.
Many so-called ‘‘unexpected geological conditions’’ are in
fact foreseeable, but may be more difficult to identify due
to the subsea location. A certain remaining risk will exist,
even after significant and relevant site investigations. This
is why risk control during planning and construction
becomes important. Continuity in planning and investiga-
tion should always be aimed at to ensure that interpreta-
tions from early phases are brought forward to the detailed
design and construction phases.
Based on the pre-construction site investigations as
described above, an overview of the location of the bed-
rock under sea and the rock mass quality is obtained, and
the correlation between estimated and as-built rock mass
quality often will be quite good as illustrated in Fig. 4 and
described in several reports; i.e. Melby and Øvstedal
(1999), Lien (2000), Melby et al. (2002), Nilsen and
Henning (2009).
Some uncertainties will however still remain, particu-
larly for the deepest sections of the tunnels far from shore.
Fig. 4 Longitudinal profile of
the 5.2 km long Frøya subsea
road tunnel (from Nilsen and
Palmstrøm 2001)
Characteristics of Water Ingress in Norwegian Subsea Tunnels
123
For such sections, interpretation of the rock mass condi-
tions has to rely mainly on the results from seismic
investigation. Experience shows that there is no general,
reliable correlation between seismic velocity and rock
mechanical parameters (although attempts have been made
to correlate seismic velocity with for instance Q value,
Fig. 5 Directional core drilling
for the Bømlafjord tunnel where
the upper, 900 m long borehole
(BH-1) was originally planned
to follow the planned tunnel
alignment, but drilling was
inaccurate and the hole
penetrated into moraine. A
second, deeper hole (BH-1A)
was then drilled, and based on
this, the tunnel was located
30 m deeper than originally
planned to ensure sufficient rock
cover (minimum 35 m). From
Palmstrøm et al. (2003)
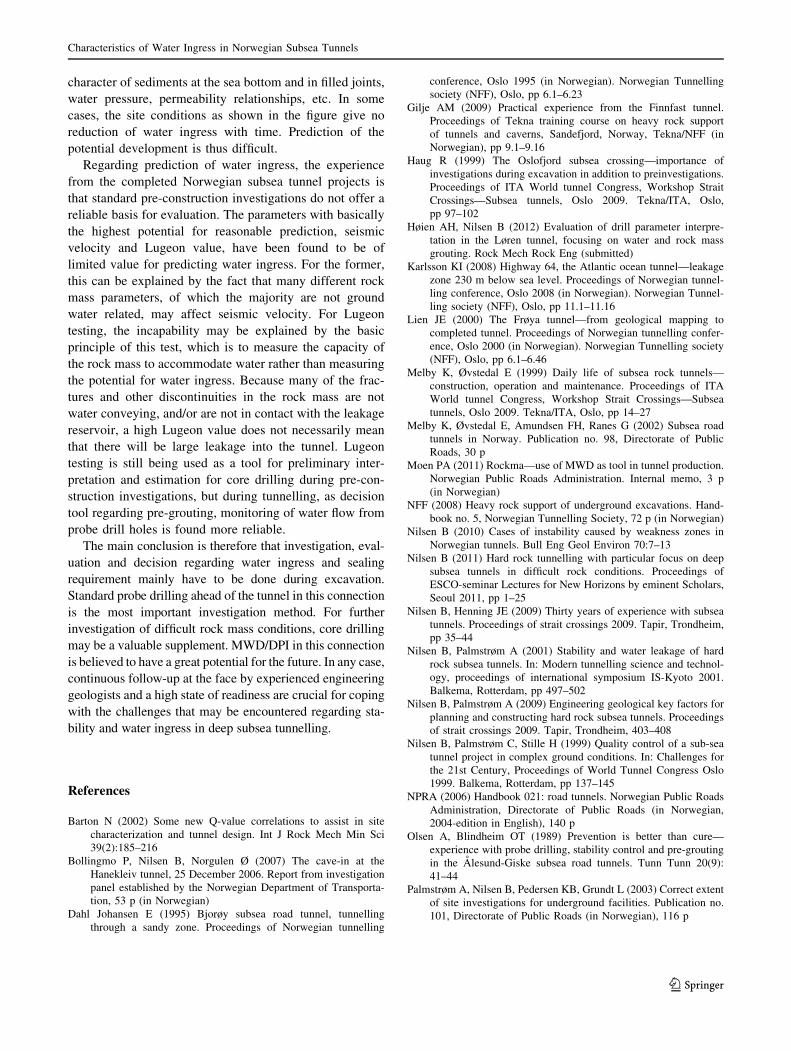
Fig. 6 Lugeon values in core drill hole versus water inflow encountered in the Karmsund gaspipe tunnel
B. Nilsen
123
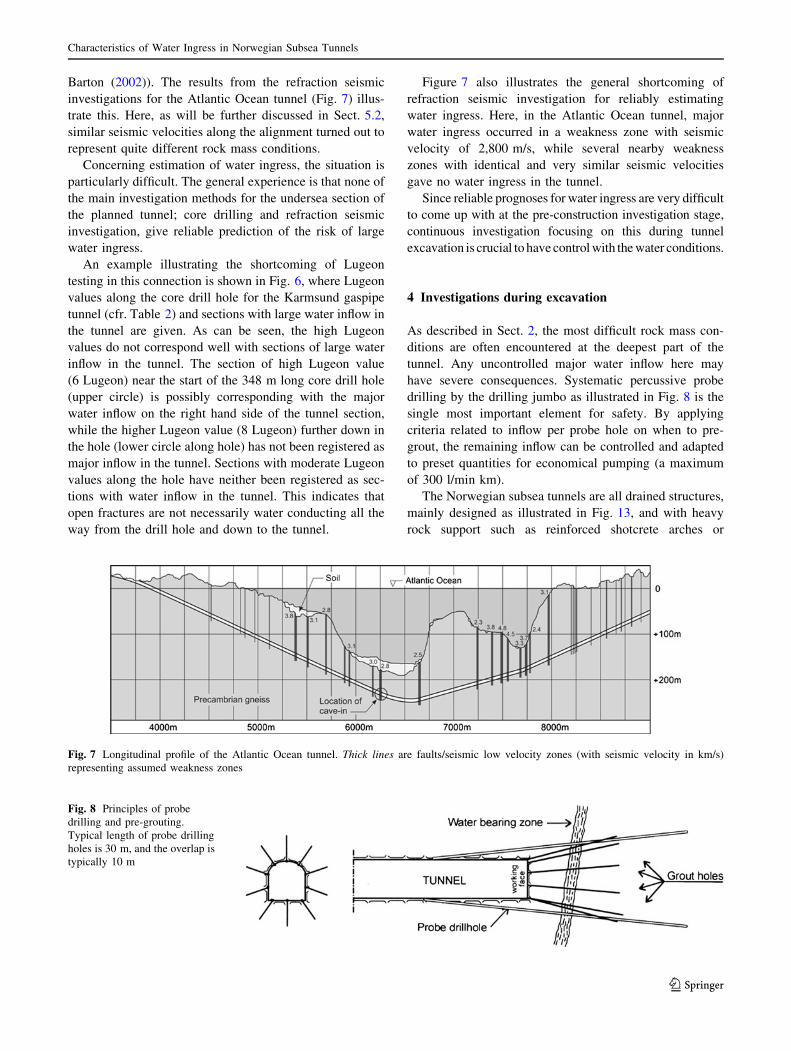
Barton (2002)). The results from the refraction seismic
investigations for the Atlantic Ocean tunnel (Fig. 7) illus-
trate this. Here, as will be further discussed in Sect. 5.2,
similar seismic velocities along the alignment turned out to
represent quite different rock mass conditions.
Concerning estimation of water ingress, the situation is
particularly difficult. The general experience is that none of
the main investigation methods for the undersea section of
the planned tunnel; core drilling and refraction seismic
investigation, give reliable prediction of the risk of large
water ingress.
An example illustrating the shortcoming of Lugeon
testing in this connection is shown in Fig. 6, where Lugeon
values along the core drill hole for the Karmsund gaspipe
tunnel (cfr. Table 2) and sections with large water inflow in
the tunnel are given. As can be seen, the high Lugeon
values do not correspond well with sections of large water
inflow in the tunnel. The section of high Lugeon value
(6 Lugeon) near the start of the 348 m long core drill hole
(upper circle) is possibly corresponding with the major
water inflow on the right hand side of the tunnel section,
while the higher Lugeon value (8 Lugeon) further down in
the hole (lower circle along hole) has not been registered as
major inflow in the tunnel. Sections with moderate Lugeon
values along the hole have neither been registered as sec-
tions with water inflow in the tunnel. This indicates that
open fractures are not necessarily water conducting all the
way from the drill hole and down to the tunnel.
Figure 7 also illustrates the general shortcoming of
refraction seismic investigation for reliably estimating
water ingress. Here, in the Atlantic Ocean tunnel, major
water ingress occurred in a weakness zone with seismic
velocity of 2,800 m/s, while several nearby weakness
zones with identical and very similar seismic velocities
gave no water ingress in the tunnel.
Since reliable prognoses for water ingress are very difficult
to come up with at the pre-construction investigation stage,
continuous investigation focusing on this during tunnel
excavation is crucial to have control with the water conditions.
4 Investigations during excavation
As described in Sect. 2, the most difficult rock mass con-
ditions are often encountered at the deepest part of the
tunnel. Any uncontrolled major water inflow here may
have severe consequences. Systematic percussive probe
drilling by the drilling jumbo as illustrated in Fig. 8 is the
single most important element for safety. By applying
criteria related to inflow per probe hole on when to pre-
grout, the remaining inflow can be controlled and adapted
to preset quantities for economical pumping (a maximum
of 300 l/min km).
The Norwegian subsea tunnels are all drained structures,
mainly designed as illustrated in Fig. 13, and with heavy
rock support such as reinforced shotcrete arches or
Fig. 7 Longitudinal profile of the Atlantic Ocean tunnel. Thick lines are faults/seismic low velocity zones (with seismic velocity in km/s)
representing assumed weakness zones
Fig. 8 Principles of probe
drilling and pre-grouting.
Typical length of probe drilling
holes is 30 m, and the overlap is
typically 10 m
Characteristics of Water Ingress in Norwegian Subsea Tunnels
123
concrete lining (also drained) only where very poor rock
conditions are encountered. Pre-grouting is used for water
sealing only when required. This is based on economical
optimization, since pumping out minor volume of leakage
water may be less expensive than to seal it with pre-gro-
uting. The decision whether to grout or not is based on the
result from probe drilling and the experience that a corre-
lation exists between water inflow from probe drill holes
and water ingress into the tunnel. For medium long subsea
tunnels (up to 3–5 km), maximum inflow of 3–5 l/min for
one probe drill hole and a total of approx. 10 l/min for 4–5
probe drill holes have been commonly used limits for pre-
grouting. Since all major leakage sections will be grouted
based on this basic principle, and since many sections will
be dry, this normally will give a final inflow of consider-
ably less than 300 l/min km (as illustrated in Fig. 21).
The final decisions regarding grouting have to be taken
at the face, and to be regularly adjusted according to the
results and experiences from tunnelling. Follow-up at the
tunnel face by well-qualified engineering geologists and
rock engineers is of great importance.
For recent projects (i.e. Finnfast (Gilje 2009) and the
Karmsund tunnel, presently under construction) instru-
mentation of the drilling jumbo; measurement while dril-
ling (MWD) and drill parameter interpretation (DPI) have
been applied for predicting rock mass conditions, including
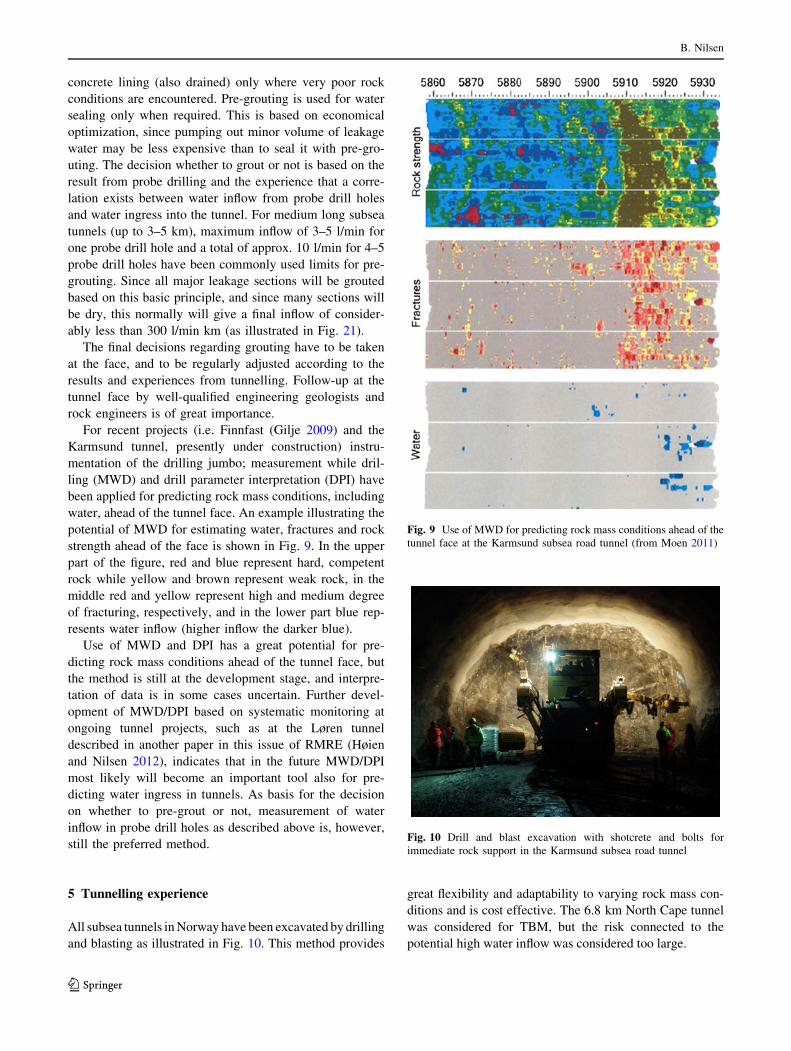
water, ahead of the tunnel face. An example illustrating the
potential of MWD for estimating water, fractures and rock
strength ahead of the face is shown in Fig. 9. In the upper
part of the figure, red and blue represent hard, competent
rock while yellow and brown represent weak rock, in the
middle red and yellow represent high and medium degree
of fracturing, respectively, and in the lower part blue rep-
resents water inflow (higher inflow the darker blue).
Use of MWD and DPI has a great potential for pre-
dicting rock mass conditions ahead of the tunnel face, but
the method is still at the development stage, and interpre-
tation of data is in some cases uncertain. Further devel-
opment of MWD/DPI based on systematic monitoring at
ongoing tunnel projects, such as at the Løren tunnel
described in another paper in this issue of RMRE (Høien
and Nilsen 2012), indicates that in the future MWD/DPI
most likely will become an important tool also for pre-
dicting water ingress in tunnels. As basis for the decision
on whether to pre-grout or not, measurement of water
inflow in probe drill holes as described above is, however,
still the preferred method.
5 Tunnelling experience
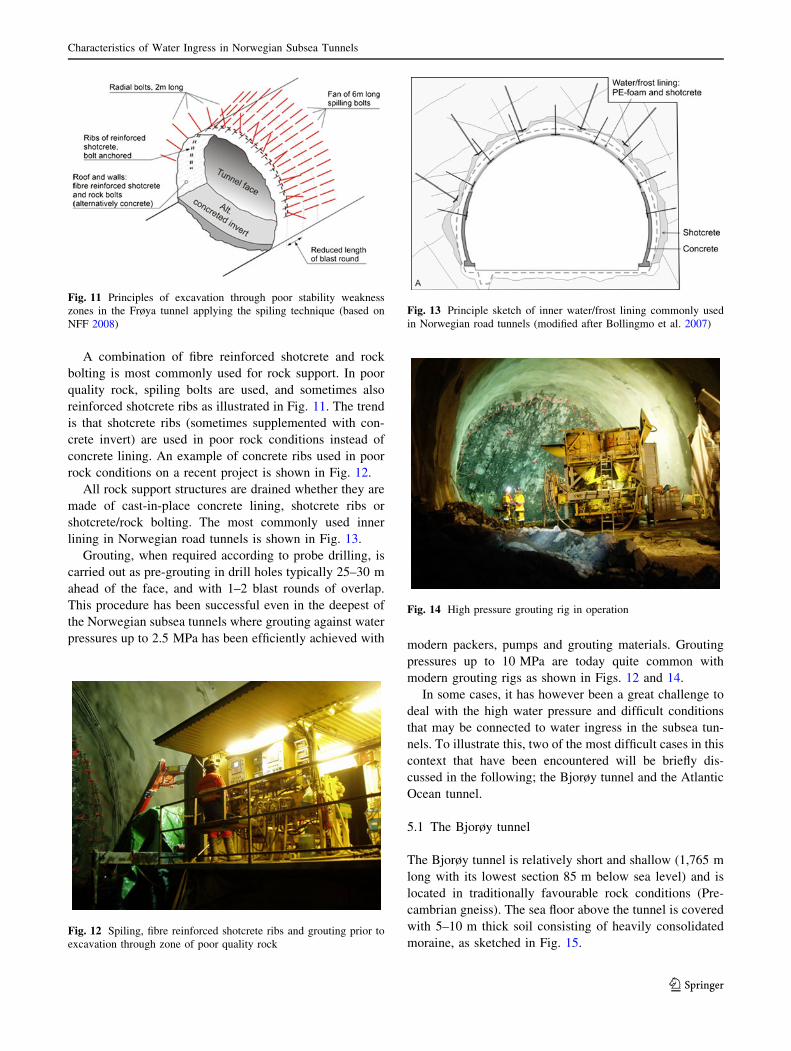
All subsea tunnels in Norway have been excavated by drilling
and blasting as illustrated in Fig. 10. This method provides
great flexibility and adaptability to varying rock mass con-
ditions and is cost effective. The 6.8 km North Cape tunnel
was considered for TBM, but the risk connected to the
potential high water inflow was considered too large.
Fig. 9 Use of MWD for predicting rock mass conditions ahead of the
tunnel face at the Karmsund subsea road tunnel (from Moen 2011)
Fig. 10 Drill and blast excavation with shotcrete and bolts for
immediate rock support in the Karmsund subsea road tunnel
B. Nilsen
123
A combination of fibre reinforced shotcrete and rock
bolting is most commonly used for rock support. In poor
quality rock, spiling bolts are used, and sometimes also
reinforced shotcrete ribs as illustrated in Fig. 11. The trend
is that shotcrete ribs (sometimes supplemented with con-
crete invert) are used in poor rock conditions instead of
concrete lining. An example of concrete ribs used in poor
rock conditions on a recent project is shown in Fig. 12.
All rock support structures are drained whether they are
made of cast-in-place concrete lining, shotcrete ribs or
shotcrete/rock bolting. The most commonly used inner
lining in Norwegian road tunnels is shown in Fig. 13.
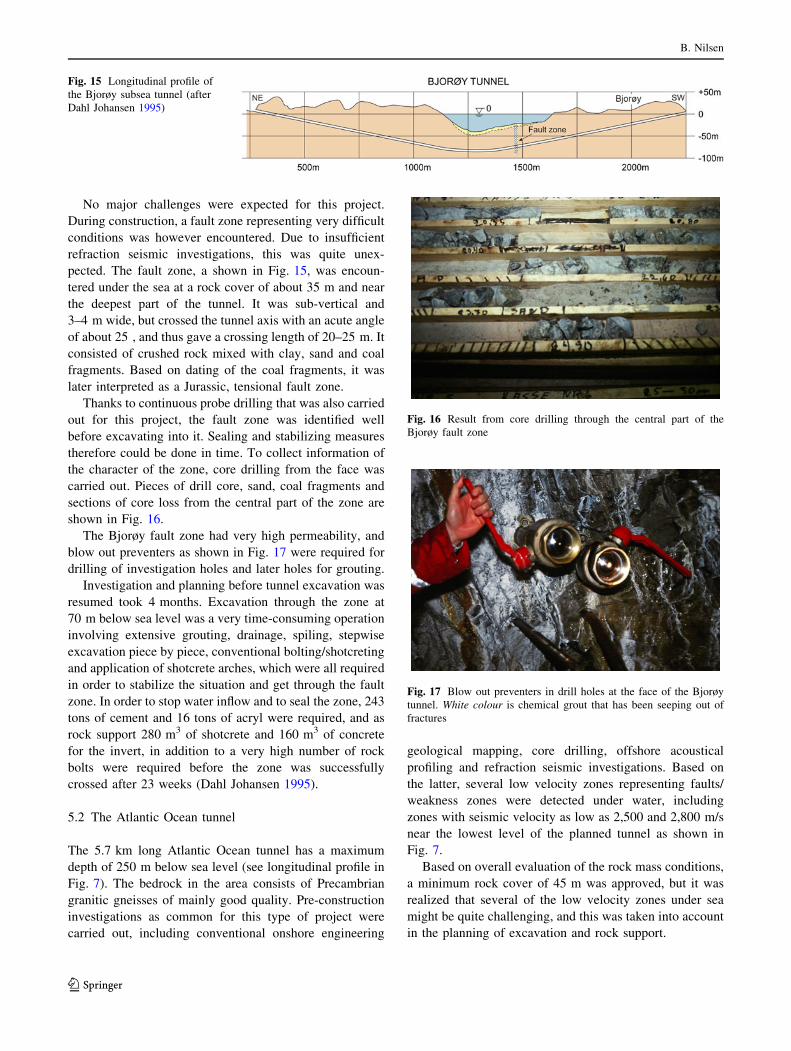
Grouting, when required according to probe drilling, is
carried out as pre-grouting in drill holes typically 25–30 m
ahead of the face, and with 1–2 blast rounds of overlap.
This procedure has been successful even in the deepest of
the Norwegian subsea tunnels where grouting against water
pressures up to 2.5 MPa has been efficiently achieved withmodern packers, pumps and grouting materials. Grouting
pressures up to 10 MPa are today quite common with
modern grouting rigs as shown in Figs. 12 and 14.
In some cases, it has however been a great challenge to
deal with the high water pressure and difficult conditions
that may be connected to water ingress in the subsea tun-
nels. To illustrate this, two of the most difficult cases in this
context that have been encountered will be briefly dis-
cussed in the following; the Bjorøy tunnel and the Atlantic
Ocean tunnel.
5.1 The Bjorøy tunnel
The Bjorøy tunnel is relatively short and shallow (1,765 m
long with its lowest section 85 m below sea level) and is
located in traditionally favourable rock conditions (Pre-
cambrian gneiss). The sea floor above the tunnel is covered
with 5–10 m thick soil consisting of heavily consolidated
moraine, as sketched in Fig. 15.
Fig. 11 Principles of excavation through poor stability weakness
zones in the Frøya tunnel applying the spiling technique (based on
NFF 2008)
Fig. 12 Spiling, fibre reinforced shotcrete ribs and grouting prior to
excavation through zone of poor quality rock
Fig. 13 Principle sketch of inner water/frost lining commonly used
in Norwegian road tunnels (modified after Bollingmo et al. 2007)
Fig. 14 High pressure grouting rig in operation
Characteristics of Water Ingress in Norwegian Subsea Tunnels
123
No major challenges were expected for this project.
During construction, a fault zone representing very difficult
conditions was however encountered. Due to insufficient
refraction seismic investigations, this was quite unex-
pected. The fault zone, a shown in Fig. 15, was encoun-
tered under the sea at a rock cover of about 35 m and near
the deepest part of the tunnel. It was sub-vertical and
3–4 m wide, but crossed the tunnel axis with an acute angle
of about 25 , and thus gave a crossing length of 20–25 m. It
consisted of crushed rock mixed with clay, sand and coal
fragments. Based on dating of the coal fragments, it was
later interpreted as a Jurassic, tensional fault zone.
Thanks to continuous probe drilling that was also carried
out for this project, the fault zone was identified well
before excavating into it. Sealing and stabilizing measures
therefore could be done in time. To collect information of
the character of the zone, core drilling from the face was
carried out. Pieces of drill core, sand, coal fragments and
sections of core loss from the central part of the zone are
shown in Fig. 16.
The Bjorøy fault zone had very high permeability, and
blow out preventers as shown in Fig. 17 were required for
drilling of investigation holes and later holes for grouting.
Investigation and planning before tunnel excavation was
resumed took 4 months. Excavation through the zone at
70 m below sea level was a very time-consuming operation
involving extensive grouting, drainage, spiling, stepwise
excavation piece by piece, conventional bolting/shotcreting
and application of shotcrete arches, which were all required
in order to stabilize the situation and get through the fault
zone. In order to stop water inflow and to seal the zone, 243
tons of cement and 16 tons of acryl were required, and as
rock support 280 m3 of shotcrete and 160 m3 of concrete
for the invert, in addition to a very high number of rock
bolts were required before the zone was successfully
crossed after 23 weeks (Dahl Johansen 1995).
5.2 The Atlantic Ocean tunnel
The 5.7 km long Atlantic Ocean tunnel has a maximum
depth of 250 m below sea level (see longitudinal profile in
Fig. 7). The bedrock in the area consists of Precambrian
granitic gneisses of mainly good quality. Pre-construction
investigations as common for this type of project were
carried out, including conventional onshore engineering
geological mapping, core drilling, offshore acoustical
profiling and refraction seismic investigations. Based on
the latter, several low velocity zones representing faults/
weakness zones were detected under water, including
zones with seismic velocity as low as 2,500 and 2,800 m/s
near the lowest level of the planned tunnel as shown in
Fig. 7.
Based on overall evaluation of the rock mass conditions,
a minimum rock cover of 45 m was approved, but it was
realized that several of the low velocity zones under sea
might be quite challenging, and this was taken into account
in the planning of excavation and rock support.
Fig. 15 Longitudinal profile of
the Bjorøy subsea tunnel (after
Dahl Johansen 1995)
Fig. 16 Result from core drilling through the central part of the
Bjorøy fault zone
Fig. 17 Blow out preventers in drill holes at the face of the Bjorøy
tunnel. White colour is chemical grout that has been seeping out of
fractures
B. Nilsen
123

At the end of February 2008, excavation had reached
Profile 6242 (see Fig. 18), located 2,380 m from the wes-
tern tunnel entrance. Mainly good rock conditions had been
encountered and only local, minor leakages requiring
grouting. Several nearby fault zones with seismic velocities
down to 2,800–3,100 m/s had been crossed without major
problems. These zones contained crushed rock and clay
gouge, and had little water leakage. Probe drilling, which
was carried out on a routine basis in the tunnel, indicated
poor quality rock in the 2.8 km/s zone near the bottom of
the tunnel (see Fig. 7), but little water leakage. Thus,
similar rock mass conditions as in the previous faults/
weakness zones were expected. As extra precaution, the
great water depth and limited rock cover taken into con-
sideration, grouting was however carried out in order to
seal the joints and also possibly improve the quality of the
zone material. Excavation was started with reduced round
length (3 m), shotcreting, systematic radial bolting and
installation of 6 m long spiling bolts.
The rock mass quality of the zone was found to be very
poor, and after blasting the reduced round length, there was
a tendency of small rock fragments coming down between
the spiling bolts. Attempts to stop this by applying shot-
crete were unsuccessful, and after a few hours a 5–6 m
high cave-in of the roof had developed, covering the full
tunnel width and the 3 m round length. Based on holes
drilled later, it was found likely that the cave-in progressed
about 10 m above the tunnel roof as illustrated in Fig. 18.
In order to stabilize the tunnel, excavated material was
filled up against the tunnel face. The area between the
tunnel roof and the fill material was sealed with shotcrete,
and concrete was pumped into the slide scar. Additional
rock support behind the unstable section was installed, and
an approximately 10 m long concrete plug was established
to seal the tunnel. This plug was completed 8 days after the
cave-in. Probe drilling through the plug indicated consid-
erable water leakage, and extensive grouting of the backfill
material and the surrounding rock past the slide scar was
required. Based on careful excavation/reduced round
lengths, shotcreting/radial bolting and spiling with self
drilling anchors, the tunnel face was re-established after
5.5 weeks at the same position as it was before the cave-in.
Core drilling through the weakness zone was carried out as
sketched in Fig. 18, and showed that the zone was more
than 25 m wide and had considerable water leakage.
Concrete lining was established past the cave-in area as
shown in Fig. 19, and resumed tunnelling was based on a
procedure including continuous pre-grouting, spiling,
excavation with reduced round lengths/piece by piece,
shotcreting/radial bolting and installation of reinforced
shotcrete arches. This process was very time consuming
due to extensive water leakages (up to 500 l/min in one
single drill hole) at very high pressure (up to 23 bar).
Installation of packers in the crushed rock mass was very
difficult and often required pre-installation of tubes in the
grout holes. In many cases, several round of pre-grouting
were required before a short advance of the tunnel face was
found to be safe. Tunnelling was continued approx. 20 m
ahead of the previous cave-in area from the west side. This
position was reached about 10 months after the date of the
cave-in. The rest of the fault zone was excavated from the
east side based on a similar procedure as described above.
Fig. 18 Cave-in situation approx. 225 m below sea level in the
Atlantic Ocean tunnel
Fig. 19 Excavation through the cave-in area of the Atlantic Ocean
tunnel
Characteristics of Water Ingress in Norwegian Subsea Tunnels
123
More than 1,000 tons of grout (mainly micro cement,
but also standard cement and polyurethane) was needed to
seal the leakages of the approximately 25 m wide fault/
weakness zone. After completion of the tunnel in Decem-
ber 2009, the total leakage was only 500 l/min (or 88 l/min
per km tunnel), which can be characterized as quite low for
this type of tunnels (Karlsson 2008).
6 Discussion and conclusions
As illustrated by the Bjorøy and Atlantic Ocean tunnel
cases, large water inflow is in some cases connected to
major fault zones. In other cases, and in fact even more
often, the largest water inflows are however not directly
connected to a major weakness zones, but rather to distinct,
continuous single joints or, in some cases, to the distal parts
of a weakness zone. This is most likely due to the high
content of low permeability gouge (clay) in the central part
of weakness zones.
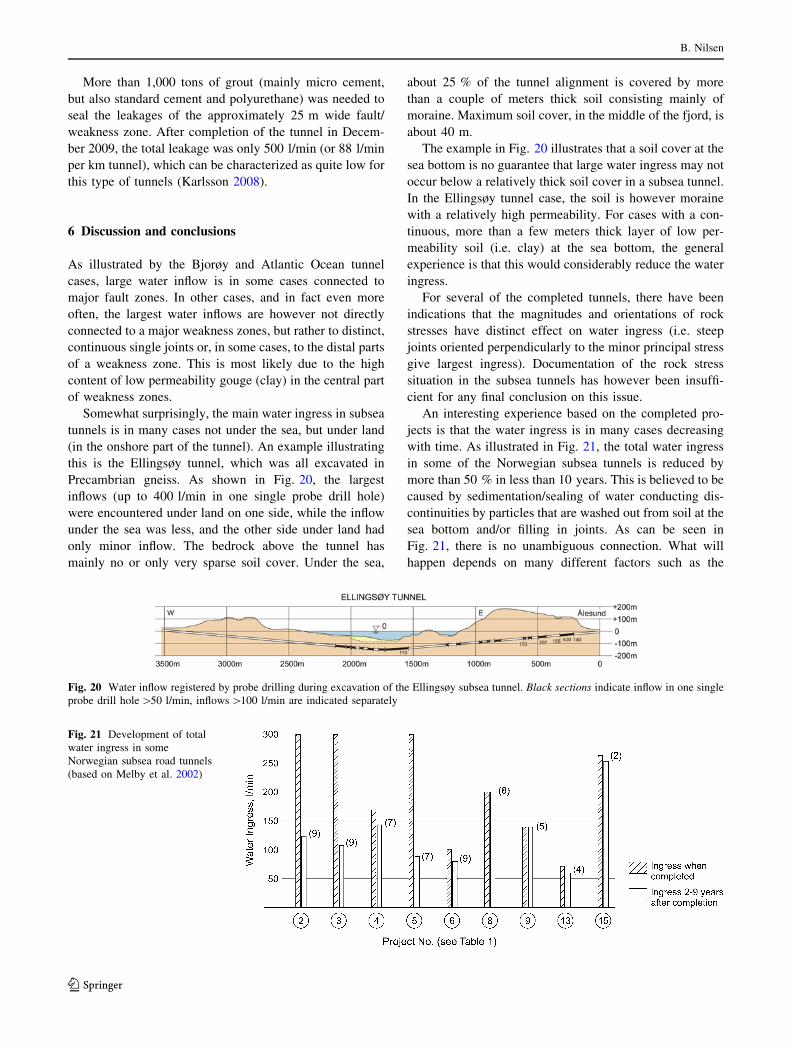
Somewhat surprisingly, the main water ingress in subsea
tunnels is in many cases not under the sea, but under land
(in the onshore part of the tunnel). An example illustrating
this is the Ellingsøy tunnel, which was all excavated in
Precambrian gneiss. As shown in Fig. 20, the largest
inflows (up to 400 l/min in one single probe drill hole)
were encountered under land on one side, while the inflow
under the sea was less, and the other side under land had
only minor inflow. The bedrock above the tunnel has
mainly no or only very sparse soil cover. Under the sea,
about 25 % of the tunnel alignment is covered by more
than a couple of meters thick soil consisting mainly of
moraine. Maximum soil cover, in the middle of the fjord, is
about 40 m.
The example in Fig. 20 illustrates that a soil cover at the
sea bottom is no guarantee that large water ingress may not
occur below a relatively thick soil cover in a subsea tunnel.
In the Ellingsøy tunnel case, the soil is however moraine
with a relatively high permeability. For cases with a con-
tinuous, more than a few meters thick layer of low per-
meability soil (i.e. clay) at the sea bottom, the general
experience is that this would considerably reduce the water
ingress.
For several of the completed tunnels, there have been
indications that the magnitudes and orientations of rock
stresses have distinct effect on water ingress (i.e. steep
joints oriented perpendicularly to the minor principal stress
give largest ingress). Documentation of the rock stress
situation in the subsea tunnels has however been insuffi-
cient for any final conclusion on this issue.
An interesting experience based on the completed pro-
jects is that the water ingress is in many cases decreasing
with time. As illustrated in Fig. 21, the total water ingress
in some of the Norwegian subsea tunnels is reduced by
more than 50 % in less than 10 years. This is believed to be
caused by sedimentation/sealing of water conducting dis-
continuities by particles that are washed out from soil at the
sea bottom and/or filling in joints. As can be seen in
Fig. 21, there is no unambiguous connection. What will
happen depends on many different factors such as the
Fig. 20 Water inflow registered by probe drilling during excavation of the Ellingsøy subsea tunnel. Black sections indicate inflow in one single
probe drill hole [50 l/min, inflows [100 l/min are indicated separately
Fig. 21 Development of total
water ingress in some
Norwegian subsea road tunnels
(based on Melby et al. 2002)
B. Nilsen
123
character of sediments at the sea bottom and in filled joints,
water pressure, permeability relationships, etc. In some
cases, the site conditions as shown in the figure give no
reduction of water ingress with time. Prediction of the
potential development is thus difficult.
Regarding prediction of water ingress, the experience
from the completed Norwegian subsea tunnel projects is
that standard pre-construction investigations do not offer a
reliable basis for evaluation. The parameters with basically
the highest potential for reasonable prediction, seismic
velocity and Lugeon value, have been found to be of
limited value for predicting water ingress. For the former,
this can be explained by the fact that many different rock
mass parameters, of which the majority are not ground
water related, may affect seismic velocity. For Lugeon
testing, the incapability may be explained by the basic
principle of this test, which is to measure the capacity of
the rock mass to accommodate water rather than measuring
the potential for water ingress. Because many of the frac-
tures and other discontinuities in the rock mass are not
water conveying, and/or are not in contact with the leakage
reservoir, a high Lugeon value does not necessarily mean
that there will be large leakage into the tunnel. Lugeon
testing is still being used as a tool for preliminary inter-
pretation and estimation for core drilling during pre-con-
struction investigations, but during tunnelling, as decision
tool regarding pre-grouting, monitoring of water flow from
probe drill holes is found more reliable.
The main conclusion is therefore that investigation, eval-
uation and decision regarding water ingress and sealing
requirement mainly have to be done during excavation.
Standard probe drilling ahead of the tunnel in this connection
is the most important investigation method. For further
investigation of difficult rock mass conditions, core drilling
may be a valuable supplement. MWD/DPI in this connection
is believed to have a great potential for the future. In any case,
continuous follow-up at the face by experienced engineering
geologists and a high state of readiness are crucial for coping
with the challenges that may be encountered regarding sta-
bility and water ingress in deep subsea tunnelling.
References
Barton N (2002) Some new Q-value correlations to assist in site
characterization and tunnel design. Int J Rock Mech Min Sci
39(2):185–216
Bollingmo P, Nilsen B, Norgulen Ø (2007) The cave-in at the
Hanekleiv tunnel, 25 December 2006. Report from investigation
panel established by the Norwegian Department of Transporta-
tion, 53 p (in Norwegian)
Dahl Johansen E (1995) Bjorøy subsea road tunnel, tunnelling
through a sandy zone. Proceedings of Norwegian tunnelling
conference, Oslo 1995 (in Norwegian). Norwegian Tunnelling
society (NFF), Oslo, pp 6.1–6.23
Gilje AM (2009) Practical experience from the Finnfast tunnel.
Proceedings of Tekna training course on heavy rock support
of tunnels and caverns, Sandefjord, Norway, Tekna/NFF (in
Norwegian), pp 9.1–9.16
Haug R (1999) The Oslofjord subsea crossing—importance of
investigations during excavation in addition to preinvestigations.
Proceedings of ITA World tunnel Congress, Workshop Strait
Crossings—Subsea tunnels, Oslo 2009. Tekna/ITA, Oslo,
pp 97–102
Høien AH, Nilsen B (2012) Evaluation of drill parameter interpre-
tation in the Løren tunnel, focusing on water and rock mass
grouting. Rock Mech Rock Eng (submitted)
Karlsson KI (2008) Highway 64, the Atlantic ocean tunnel—leakage
zone 230 m below sea level. Proceedings of Norwegian tunnel-
ling conference, Oslo 2008 (in Norwegian). Norwegian Tunnel-
ling society (NFF), Oslo, pp 11.1–11.16
Lien JE (2000) The Frøya tunnel—from geological mapping to
completed tunnel. Proceedings of Norwegian tunnelling confer-
ence, Oslo 2000 (in Norwegian). Norwegian Tunnelling society
(NFF), Oslo, pp 6.1–6.46
Melby K, Øvstedal E (1999) Daily life of subsea rock tunnels—
construction, operation and maintenance. Proceedings of ITA
World tunnel Congress, Workshop Strait Crossings—Subsea
tunnels, Oslo 2009. Tekna/ITA, Oslo, pp 14–27
Melby K, Øvstedal E, Amundsen FH, Ranes G (2002) Subsea road
tunnels in Norway. Publication no. 98, Directorate of Public
Roads, 30 p
Moen PA (2011) Rockma—use of MWD as tool in tunnel production.
Norwegian Public Roads Administration. Internal memo, 3 p
(in Norwegian)
NFF (2008) Heavy rock support of underground excavations. Hand-
book no. 5, Norwegian Tunnelling Society, 72 p (in Norwegian)
Nilsen B (2010) Cases of instability caused by weakness zones in
Norwegian tunnels. Bull Eng Geol Environ 70:7–13
Nilsen B (2011) Hard rock tunnelling with particular focus on deep
subsea tunnels in difficult rock conditions. Proceedings of
ESCO-seminar Lectures for New Horizons by eminent Scholars,
Seoul 2011, pp 1–25
Nilsen B, Henning JE (2009) Thirty years of experience with subsea
tunnels. Proceedings of strait crossings 2009. Tapir, Trondheim,
pp 35–44
Nilsen B, Palmstrøm A (2001) Stability and water leakage of hard
rock subsea tunnels. In: Modern tunnelling science and technol-
ogy, proceedings of international symposium IS-Kyoto 2001.
Balkema, Rotterdam, pp 497–502
Nilsen B, Palmstrøm A (2009) Engineering geological key factors for
planning and constructing hard rock subsea tunnels. Proceedings
of strait crossings 2009. Tapir, Trondheim, 403–408
Nilsen B, Palmstrøm C, Stille H (1999) Quality control of a sub-sea
tunnel project in complex ground conditions. In: Challenges for
the 21st Century, Proceedings of World Tunnel Congress Oslo
1999. Balkema, Rotterdam, pp 137–145
NPRA (2006) Handbook 021: road tunnels. Norwegian Public Roads
Administration, Directorate of Public Roads (in Norwegian,
2004-edition in English), 140 p
Olsen A, Blindheim OT (1989) Prevention is better than cure—
experience with probe drilling, stability control and pre-grouting
in the Alesund-Giske subsea road tunnels. Tunn Tunn 20(9):
41–44
Palmstrøm A, Nilsen B, Pedersen KB, Grundt L (2003) Correct extent
of site investigations for underground facilities. Publication no.
101, Directorate of Public Roads (in Norwegian), 116 p
Characteristics of Water Ingress in Norwegian Subsea Tunnels
123