Embed Size (px)
Citation preview

Ž .International Journal of Gynecology & Obstetrics 69 2000 37]46
Special Article
Characteristics of pregnant vs. non-pregnant womenphysicians: findings from the women physicians’ health
study
E. FrankU, K. Cone
Department of Family and Pre¨enti e Medicine, and Department of Medicine, Emory Uni ersity School of Medicine, Atlanta,GA, USA
Received 26 July 1999; received in revised form 25 November 1999; accepted 2 December 1999
Abstract
Objecti e: Many young physicians are women, and many are in their childbearing years. Knowing pregnantphysicians’ status is useful for epidemiological and workforce reasons, yet no studies have compared pregnant withsame-age, non-pregnant physicians, an especially appropriate comparison group. Study design: Data from the WomenPhysicians’ Health Study, a national questionnaire-based survey. We compare 87 pregnant with 1148 non-pregnantwomen physicians, ages 30]40. Results: Pregnant physicians ate more fat, fruits and vegetables, and cheese, but notmore dairy than non-pregnant women physicians. While nearly half consumed alcohol, they reported drinking anaverage of only 0.4 drinksrweek, and none smoked. Nearly all took vitamin supplements. Pregnant physiciansexercised as much as non-pregnant physicians, and pregnant physicians’ self-reported health status was better. Workamount, desire to work less, perceived work control, career satisfaction, and work stress did not significantly differ bypregnancy status. Conclusion: The prenatal period may be a time of especially healthy habits and considerableproductivity for female physicians. Q 2000 International Federation of Gynecology and Obstetrics.
Keywords: Physicians, Women; Pregnancy; Pregnancy complications; High-risk
U Corresponding author. Tel.: q1-404-616-5603; fax: q1-404-616-6847.Ž .E-mail address: [email protected] E. Frank
0020-7292r00r$20.00 Q 2000 International Federation of Gynecology and Obstetrics.Ž .PII: S 0 0 2 0 - 7 2 9 2 9 9 0 0 2 2 4 - 6

( )E. Frank, K. Cone r International Journal of Gynecology & Obstetrics 69 2000 37]4638
1. Introduction
Women constitute one-third of physicians un-w xder the age of 45 1 , and many of these women
are now, or are about to be in their childbearingyears. Pregnant physicians’ characteristics are ofinterest for three reasons. First, since womenphysicians have healthier habits than those of the
w xgeneral population 2 , and since pregnancy shouldbe a time of particularly optimized health habits,we wished to test the hypothesis that pregnantwomen physicians’ habits are even healthier thanthose of non-pregnant women physicians or ofpregnant women in the general population. Sec-ond, physicians may have considerable professio-nal responsibilities, and their health status, atti-tudes toward work, and work-related habits whilepregnant are of considerable interest to employ-ers and colleagues. Third, physicians’ personalpractices while pregnant may be of interest topregnant patients, and physicians’ personal healthhabits may influence their patient counseling
w xpractices 3]7 . While some studies have alreadyexamined issues concerning pregnant physiciansw x8]11 , none have had a large physician compar-ison population. To explore these questions, weused data from the Women Physicians’ HealthStudy, a national questionnaire-based survey of4501 women physicians, ages 30]70. In this paper,we compare two groups of 30]40-year-old womenphysicians: the 87 who said they were pregnant,with the 1148 who said they were not pregnant.
2. Material and methods
The design and methods of the Women Physi-Ž .cians’ Health Study WPHS has been more fully
described elsewhere, as have basic characteristicsw xof the population 2,12,13 . WPHS surveyed a
stratified random sample of US women M.D.s.;the sampling frame is based on the American
Ž .Medical Association’s AMAs Physician Master-file, a database intended to record all M.D.s resid-ing in the US and possessions. Using a samplingscheme stratified by decade of graduation frommedical school, we randomly selected 2500 womenfrom each of the last four decades graduating
Ž .classes 1950]1989 . We over-sampled olderwomen physicians, a population that would other-wise have been sparsely represented by proportio-nal allocation because of the recent increase innumbers of women physicians. We included ac-tive, part-time, professionally inactive, and retiredphysicians, aged 30]70, who were not in residencytraining programs in September 1993, when thesampling frame was constructed. In that month,the first of four mailings was sent out; each mail-ing contained a cover letter and a self-adminis-tered four-page questionnaire querying personaland professional characteristics. Enrollment was
Ž .closed in October 1994 final ns4501 .Of the potential respondents, an estimated 23%
were ineligible to participate because their ad-dresses were wrong, or they were men, deceased,living out of the country, or interns or residents.Our response rate is 59% of physicians eligible toparticipate. We compared respondents and non-respondents in three ways: we used our phone
Žsurvey comparing our phone-surveyed randomsample of 200 non-respondents with all the writ-
.ten survey respondents ; the AMA PhysicianŽMasterfile contrasting all respondents with all
.non-respondents ; and an examination of surveyŽ .mailing waves all respondents, from wave 1 to 4
to compare respondents and non-respondents re-garding a large number of key variables. Fromthese three investigations, we found that non-re-spondents were less likely than respondents wereto be board-certified. However, respondents andnon-respondents did not consistently or substan-tively differ on other tested measures, includingage, ethnicity, marital status, number of children,alcohol consumption, fat intake, exercise, smok-ing status, hours worked per week, frequency ofbeing a primary care practitioner, personal in-come, or percentage actively practicing medicine.
Based on these findings, we weighted the dataŽby decade of graduation to adjust for our strati-
.fied sampling scheme , and by decade-specific re-Žsponse rate and board-certification status to ad-
.just for our identified response bias , allowing usto make inference to the entire population ofwomen physicians graduating from medical schoolbetween 1950 and 1989. All analyses were con-ducted using SUDAAN.

( )E. Frank, K. Cone r International Journal of Gynecology & Obstetrics 69 2000 37]46 39
In this paper, we will contrast two groups of30]40-year-old women physicians: the 87 whosaid they were pregnant, and the 1148 who saidthey were not pregnant. We limit our analyses tothose physicians who are -40, so that differ-ences between the two groups are more likelyattributable to pregnancy status, and less likely tobe biased by age. The 40 physicians who said theymight be pregnant were excluded from theseanalyses. Coffee was our only specifically queried
caffeine source, and we did not distinguishbetween regular and decaffeinated coffee.
3. Results
3.1. Demographic characteristics
We compare 87 pregnant with 1148 non-preg-nant women physicians, ages 30]40. Even con-
Table 1aDemographic and personal characteristics of US women physicians
Pregnant Not pregnant
bŽ . Ž . Ž .Total % 6.9 "0.8 89.6 "0.9
UUŽ . Ž . Ž .Age average years 34.1 "0.3 35.4 "0.1
( )Ethnicity %Ž . Ž .African-AmericanrblackrHispanicrother 9.8 "4.0 13.1 "1.2Ž . Ž .Asian-AmericanrPacific Islander 6.3 "2.9 6.8 "0.8Ž . Ž .Whiternon-Hispanic 83.9 "4.7 80.1 "1.3
Ž . Ž . Ž .Born out of the US % 13.2 "4.6 15.0 "1.2
UU( )Current relationship status %c Ž . Ž .Married 97.4 "1.5 72.2 "1.5
Ž . Ž .All other 2.6 "1.5 27.8 "1.5
UUPre¨ious pregnanciesŽ . Ž .None 4.1 "2.5 30.7 "1.5Ž . Ž .One 38.1 "5.7 16.2 "1.2Ž . Ž .)One 57.7 "5.8 53.1 "1.6Ž . Ž .Mean 2.2 "0.2 1.8 "0.1
UNumber of children totalŽ . Ž .None 44.9 "5.9 36.8 "1.6Ž . Ž .One 26.7 "5.2 17.0 "1.2Ž . Ž .Two 18.2 "4.5 31.0 "1.5Ž . Ž .)Two 10.1 "3.5 15.3 "1.1
U Ž . Ž .Mean total children 0.9 "0.1 1.3 "0.04
Ž . Ž .Mean biological children 0.9 "0.1 1.2 "0.04
Sexual orientationŽ . Ž .Heterosexual 97.1 "1.7 97.0 "0.5Ž . Ž .Lesbianrbisexual 2.9 "1.7 3.0 "0.5
ax2-test for prevalences and t-test for means.
b Those who answered ‘maybe’ to the question ‘Are you now pregnant?’ are excluded from analyses.c Includes self-designated couples that are both married and unmarried. U PF0.05; UU PF0.0001. S.E. values in parentheses.

( )E. Frank, K. Cone r International Journal of Gynecology & Obstetrics 69 2000 37]4640
Table 2aPersonal health practices of US women physicians
Pregnant Not pregnant
UU( )General health status %Ž . Ž .Excellentrvery good 92.7 "3.4 83.1 "1.3Ž . Ž .Goodrfairrpoor 7.3 "3.4 16.9 "1.3
( )Current cigarette smoking %Ž . Ž .Yes 0 "0.0 2.6 "0.5Ž . Ž .No 100 "0.0 97.4 "0.5
UŽ . Ž . Ž .Block fat score median 26.2 "1.7 22.2 "0.6
UŽ . Ž . Ž .Fruits and vegetables servings per day median 3.3 "0.3 3.0 "0.04
Ž . Ž . Ž .Whole milk servings per week median 2.7 "1.1 2.3 "0.6
UŽ . Ž . Ž .Cheese servings per week median 2.7 "0.3 2.3 "0.1
Ž . Ž . Ž .Other dairy servings per week median 2.6 "0.5 2.2 "0.1
UUUCurrent alcohol drinkerŽ . Ž .Yes 43.5 "6.0 78.9 "1.3Ž . Ž .No 56.5 "6.0 21.1 "1.3
U Ž . Ž .Median number of drinks per week 0.4 "0.3 1.2 "0.2
Ž . Ž . Ž .Artificial sweetener servings per day median 0.1 "0.03 0.5 "0.1
Ž . Ž . Ž .Caffeine servings per day median 0.9 "0.08 1.1 "0.05
UUUMulti itaminrmineral supplement per dayŽ . Ž .None 8.9 "3.3 54.5 "1.7Ž . Ž .-1 10.0 "3.0 20.6 "1.4Ž . Ž .)1 81.1 "4.3 24.9 "1.4
UUUAny ¨itamin supplementŽ . Ž .Yes 93.4 "2.5 52.0 "1.7Ž . Ž .No 6.6 "2.5 48.0 "1.7
UUUIron supplement per dayŽ . Ž .None 56.3 "5.9 83.7 "1.3Ž . Ž .-1 6.6 "3.1 8.0 "0.9Ž . Ž .)1 37.2 "5.7 8.3 "0.9
UUCalcium supplement per dayŽ . Ž .None 52.9 "5.9 70.7 "1.5Ž . Ž .-1 11.3 "3.6 13.9 "1.1Ž . Ž .)1 35.8 "5.9 15.4 "1.23
UUAspirin useŽ . Ž .Never 90.2 "3.8 69.4 "1.5Ž . Ž .Any 9.8 "3.8 30.6 "1.5
ExerciseŽ . Ž .Yes 90.3 "3.5 96.1 "0.7Ž . Ž .G3 times per week 42.1 "5.8 47.4 "1.7
( )E. Frank, K. Cone r International Journal of Gynecology & Obstetrics 69 2000 37]46 41
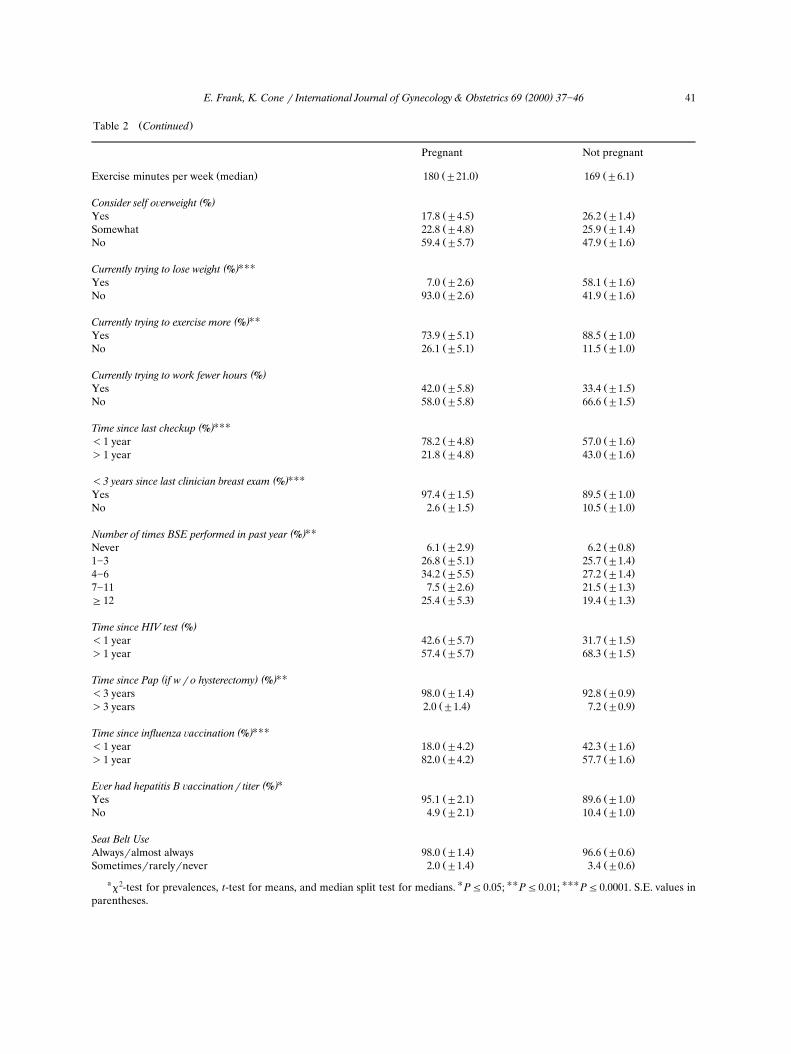
Ž .Table 2 Continued
Pregnant Not pregnant
Ž . Ž . Ž .Exercise minutes per week median 180 "21.0 169 "6.1
( )Consider self o¨erweight %Ž . Ž .Yes 17.8 "4.5 26.2 "1.4Ž . Ž .Somewhat 22.8 "4.8 25.9 "1.4Ž . Ž .No 59.4 "5.7 47.9 "1.6
UUU( )Currently trying to lose weight %Ž . Ž .Yes 7.0 "2.6 58.1 "1.6Ž . Ž .No 93.0 "2.6 41.9 "1.6
UU( )Currently trying to exercise more %Ž . Ž .Yes 73.9 "5.1 88.5 "1.0Ž . Ž .No 26.1 "5.1 11.5 "1.0
( )Currently trying to work fewer hours %Ž . Ž .Yes 42.0 "5.8 33.4 "1.5Ž . Ž .No 58.0 "5.8 66.6 "1.5
UUU( )Time since last checkup %Ž . Ž .-1 year 78.2 "4.8 57.0 "1.6Ž . Ž .)1 year 21.8 "4.8 43.0 "1.6
UUU( )-3 years since last clinician breast exam %Ž . Ž .Yes 97.4 "1.5 89.5 "1.0Ž . Ž .No 2.6 "1.5 10.5 "1.0
UU( )Number of times BSE performed in past year %Ž . Ž .Never 6.1 "2.9 6.2 "0.8Ž . Ž .1]3 26.8 "5.1 25.7 "1.4Ž . Ž .4]6 34.2 "5.5 27.2 "1.4Ž . Ž .7]11 7.5 "2.6 21.5 "1.3Ž . Ž .G12 25.4 "5.3 19.4 "1.3
( )Time since HIV test %Ž . Ž .-1 year 42.6 "5.7 31.7 "1.5Ž . Ž .)1 year 57.4 "5.7 68.3 "1.5
UU( ) ( )Time since Pap if wro hysterectomy %Ž . Ž .-3 years 98.0 "1.4 92.8 "0.9Ž . Ž .)3 years 2.0 "1.4 7.2 "0.9
UUU( )Time since influenza ¨accination %Ž . Ž .-1 year 18.0 "4.2 42.3 "1.6Ž . Ž .)1 year 82.0 "4.2 57.7 "1.6
U( )E¨er had hepatitis B ¨accinationr titer %Ž . Ž .Yes 95.1 "2.1 89.6 "1.0Ž . Ž .No 4.9 "2.1 10.4 "1.0
Seat Belt UseŽ . Ž .Alwaysralmost always 98.0 "1.4 96.6 "0.6Ž . Ž .Sometimesrrarelyrnever 2.0 "1.4 3.4 "0.6
ax2-test for prevalences, t-test for means, and median split test for medians. U PF0.05; UU PF0.01; UUU PF0.0001. S.E. values in
parentheses.
( )E. Frank, K. Cone r International Journal of Gynecology & Obstetrics 69 2000 37]4642
sidering only those 30]40 years old, pregnantwomen physicians were younger than those not
Ž .pregnant Table 1 . Pregnant physicians were alsomore likely to be married and to have beenpregnant before, but were less likely to havechildren already. Their ethnicity, birthplace, andsexual orientation did not differ from that ofnon-pregnant women physicians.
3.2. Personal health habits
None of those now pregnant reported smokingcigarettes. Pregnant physicians ate more fat, and
Ž .more fruits and vegetables Table 2 . They atemore cheese, but did not consume significantlygreater amounts of whole milk and other dairy.While nearly half of pregnant physicians reporteddrinking some alcohol, they reported drinking anaverage of 0.4 drinksrweek. They were extremely
Žunlikely to use artificial sweeteners we did not.differentiate between saccharine and Nutrasweet ,
but drank, on average, a cup of coffeerday.Among pregnant physicians, 44.0% drank -1cup of coffeerday, and only 7.2% drank G3 andonly 3.0% drank G4 cupsrday, lower consump-tion rates than their non-pregnant colleagues.Nearly all took a vitamin supplement; they wereespecially likely to take additional iron and cal-cium. While pregnant physicians were far lesslikely than others to take any aspirin, 10% stilldid so. Like those not pregnant, virtually all preg-nant women physicians wore their seatbelts al-ways or almost always.
Pregnant physicians were as likely as those notpregnant to be exercising, and they exercised asimilar number of minutes per week. Pregnantphysicians were less likely to do aerobics, cycling,or running than were non-pregnant women physi-cians; they were also slightly less likely to betrying to exercise more. Few of those now preg-nant considered themselves overweight, and virtu-
Ž .ally none 7% were trying to lose weight, vs.more than half of those not pregnant.
Pregnant physicians were more likely to have aregular personal physician, to have had a checkup
Žwithin the last year we do not know how ad-vanced these pregnancies were, nor exactly when
.their last checkups were , to have had a more
recent clinician breast exam or Pap smear, tohave had a hepatitis B vaccine, and to perform abreast self exam at least monthly. They were notsignificantly more likely to have had a recent HIVtest, were less likely to have had a flu vaccine inthe last year, and less likely to have ever had amammogram.
3.3. Personal health status
Pregnant physicians’ self-reported overallhealth status was better than that of non-preg-nant women physicians. They had similar num-bers of days of poor physical health per month,numbers of days of restricted activities, stress athome, and sleep hours on call or not on call, and
Žfewer days of bad mental health per month Ta-.ble 3 . Their personal histories of infertility, pulse
rates, systolic and diastolic blood pressures, andcholesterol levels were like those of non-pregnantphysicians.
3.4. Practice characteristics
Pregnant physicians’ median number of workhours per week, desire to work less, perceivedwork control, career satisfaction, work stress, andincome did not significantly differ from non-preg-
Ž .nant physicians’ Table 4 .
4. Comment
There are a number of interesting ways inwhich pregnant physicians differ from their non-pregnant, age and gender matched colleagues.
Of the 87 pregnant physicians, none reportedsmoking cigarettes. Since maternal smoking hasbeen associated with fetal and infant morbidity
w xand mortality 14 , these are encouraging findings,and supportive of studies showing that smokingduring pregnancy is rarer among older, higher
w xsocioeconomic status women 14 .Unlike the complete avoidance of cigarettes,
almost half of the pregnant physicians reportedcurrently consuming alcohol, although the aver-
Žage amount of consumption was very small 0.4.drinksrweek . Nonetheless, no ‘safe’ level of fetal

( )E. Frank, K. Cone r International Journal of Gynecology & Obstetrics 69 2000 37]46 43
Table 3aPersonal health status of US women physicians
Pregnant Not pregnant
( )Home stress %Ž . Ž .Severermoderate 46.4 "5.9 53.4 "1.6Ž . Ž .Light 53.6 "5.9 46.6 "1.6
Sleep hoursŽ . Ž .Mean on call 5.3 "0.2 5.5 "0.1Ž . Ž .Mean not on call 7.3 "0.1 7.1 "0.03
U( )General health %Ž . Ž .Excellentrvery good 92.7 "3.4 83.1 "1.3Ž . Ž .Goodrfairrpoor 7.3 "3.4 16.9 "1.3
Daysrmonth of bad physical healthŽ . Ž . Ž .0]6 % 92.9 "3.0 92.8 "0.9Ž . Ž . Ž .)6 % 7.1 "3.0 7.1 "0.9
Daysrmonth of bad mental healthŽ . Ž . Ž .0]6 % 89.5 "4.0 84.9 "1.2Ž . Ž . Ž .)6 % 10.5 "4.0 15.1 "1.2
Days acti ity restrictedŽ . Ž . Ž .-4 days % 96.1 "2.0 92.8 "0.9Ž . Ž . Ž .G4 days % 3.9 "2.0 7.2 "0.9
UHa¨e regular personal physicianŽ . Ž . Ž .Yes % 86.8 "4.0 75.1 "1.4Ž . Ž . Ž .No % 13.2 "4.0 24.9 "1.4
( )Personal history of infertility %Ž . Ž .Yes 15.7 "4.2 7.4 "0.8Ž . Ž .No 84.3 "4.2 92.6 "0.8
( )Physiologic outcomes mediansŽ . Ž .Pulse rate 70 "0.7 70 "0.7
Ž . Ž . Ž .Blood pressure systolic 109 "0.3 109 "0.05Ž . Ž . Ž .Blood pressure diastolic 67 "2.3 69 "0.05
CholesterolŽ . Ž .F200 83.4 "5.2 79.9 "1.6Ž . Ž .)200 16.6 "5.2 20.1 "1.6
ax2-test for prevalences, t-test for means, and median split
test for medians. U PF0.01; S.E. values in parentheses.
alcohol exposure has been determined, and theAmerican Medical Association has recommendedthat pregnant women should, therefore, abstain
w xfrom alcohol use 14 . Other studies have shownhigher abstinence levels among pregnant womenin the general population, with approximatelyone-quarter of pregnant women in the general
Žpopulation using alcohol in the past month vs.approx. half of non-pregnant women in the gen-
. w xeral population 14]16 . The median intake ofalcohol-consuming pregnant physicians was actu-ally somewhat less, though, than that of alcoholconsuming pregnant non-physicians: 1.7 vs. 4.2
w xdrinksrmonth 16 . These pregnant physicians re-flect other findings showing that while womenphysicians are less likely to abstain from alcoholthan are other women that they are also unlikely
w xto drink large amounts of alcohol 2 , and thatnon-abstinence from alcohol during pregnancymay be more prevalent among older, more edu-
w xcated women with higher incomes 14,16 .Pregnant physicians consumed more fat, cheese,
and fruits and vegetables than their non-pregnantcounterparts, consistent with the increased nutri-tional requirements of pregnancy. However, theydid not consume significantly more whole milkand other dairy products. Like their non-pregnantcounterparts, pregnant physicians used little arti-ficial sweetener, and the American Dietetic Asso-ciation considers moderate use of artificial sweet-eners during pregnancy safe, with the exceptionof aspartame intake by women with phenylke-
w xtonuria 17 .Pregnant and non-pregnant physicians drank,
on average, one cup of coffeerday, and -3% ofpregnant physicians drank G4 cupsrday. Theeffects of caffeine intake on maternal and fetalhealth are equivocal, and studies have both cor-roborated and refuted relationships between caf-feine consumption and subfecundity, spontaneous
w xabortion, and low birthweight 18,19 . Pregnantwomen in the general population are more likelyto be coffee abstainers than are our pregnant
w x Žphysicians 19 . However, heavy )300 mg or )3. w xcups of coffee 18 caffeine intake use was espe-
Ž .cially rare among these pregnant physicians 3% ;the prevalence of heavy caffeine intake in the
w xgeneral pregnant population is 5]10% 18]20 .Nearly all the pregnant physicians took at least
one multivitaminrmineral supplement daily, com-pared with less than half of the non-pregnantphysicians. However, less than half of the expec-tant physicians took additional iron or calciumsupplements daily, a surprising finding, given the

( )E. Frank, K. Cone r International Journal of Gynecology & Obstetrics 69 2000 37]4644
Table 4aPractice characteristics of US women physicians
Pregnant Not pregnant
Work hours per weekŽ . Ž .Median 48.2 "2.7 45.7 "1.1
( )Control of work en¨ironment %Ž . Ž .Alwaysralmost always 27.6 "5.6 22.7 "1.4Ž . Ž .Usually 37.0 "5.5 42.2 "1.6Ž . Ž .Sometimes 30.5 "5.4 28.3 "1.5Ž . Ž .Rarelyrnever 4.9 "2.2 6.9 "0.8
( )Career satisfaction %Ž . Ž .Alwaysralmost always 40.2 "5.8 45.6 "1.6Ž . Ž .Usually 39.0 "5.5 37.4 "1.6Ž . Ž .Sometimesrrarelyrnever 20.8 "4.7 17.1 "1.2
( )Work stress %Ž . Ž .Severe 12.3 "3.9 12.7 "1.1Ž . Ž .Moderate 75.7 "5.0 71.8 "1.5Ž . Ž .Light 12.0 "3.6 15.5 "1.2
Ž . Ž . Ž .Personal income, median $1000s 68 "5.4 67 "1.5UŽ . Ž . Ž .Household inc., median, $1000s 139 "10.5 121 "2.8
( )Income per hour $Ž . Ž .0]36 46.5 "6.1 45.6 "1.7Ž . Ž .37]59 31.1 "5.5 30.2 "1.6Ž . Ž .)59 22.4 "4.7 24.2 "1.4
ax2-test for prevalences, t-test for means, and median split test for medians. U PF0.05. S.E. values in parentheses.
recommendations of the American College ofŽ .Obstetricians and Gynecologists ACOG and
w xothers 21 . While pregnant physicians were farless likely than others to take aspirin, 10% re-ported doing so. This finding could be the resultof misinterpretation; since there were no ques-tions about intake of other analgesics, respon-dents might have misinterpreted this question toinclude analgesics other than aspirin. Alterna-tively, some may not be aware of or may notbelieve there to be a risk from taking aspirinduring pregnancy. The data are still debatableand can even be contradictory; for example, somehave found positive and others have found nega-tive relationships between aspirin use and low
w xbirthweight incidence 22 .Like non-pregnant physicians, nearly all the
Žpregnant respondents reported exercising 96.1%. Žand 90.3%, respectively , and pregnant like non-
.pregnant physicians exercised approximately 3hrweek. The chief difference was seen in thetypes of exercise performed. The pregnant physi-
Ž .cians were somewhat PF0.05 less likely to doaerobics, cycle, or run than non-pregnant physi-cians were, but were equally likely to swim, walk,or perform other forms of exercise. A 1988 studyof 9953 post-partum women showed that 55%exercised G3 timesrweek during pregnancy; a1987]1989 prospective study of 462 pregnantwomen showed that during each trimester of
w xpregnancy, approximately 40% exercised 23,24 .Our higher rates could simply be consistent withwomen physicians’ having healthier habits than
w xwomen in the general population do 2 ; it wouldnot be surprising that they would have healthyexercise habits during pregnancy. Alternatively, inthe 5 years between our study and the two cited,attitudes towards maternal exercise have become
( )E. Frank, K. Cone r International Journal of Gynecology & Obstetrics 69 2000 37]46 45
less restrictive, with ACOGs 1994 recommenda-tions having removed limits on intensity and du-
w xration of exercise given in the 1985 bulletin 23,25 .Another explanation for this, and other positivefindings, is that women physicians, especially thosewho are pregnant, may feel particular pressure torespond ‘correctly’ to questions about personalhealth practices, even on a confidential survey.
Pregnant physicians reported more recentcheckups, self and clinician breast exams, Papsmears, and hepatitis B vaccines than their non-pregnant counterparts. Much of this is likely at-tributable to their having prenatal visits. How-ever, expectant physicians were half as likely asnon-pregnant physicians to have had an influenzavaccination in the previous year, despite flu vac-cines being recommended for pregnant women at
w xany stage 26 . In addition, they were not signifi-cantly more likely to have had a recent HIV test.However, the Morbidity and Mortality Weekly Re-port linking a regimen of zidovudine to decreasedmaternal]fetal transmission of HIV was not pub-lished in JAMA until May of 1994, near the end
w xof our study 27 . Prior to this report, women mayhave believed that HIV testing was futile sincethe disease was both fatal and transmitted to thefetus without hope of effective pharmacologicalintervention.
Regarding personal health status, pregnantphysicians were even healthier than same-age,non-pregnant physicians; they reported betteroverall health, and better mental health, and hadsimilar physiologic parameters. It may be thatonly healthy women physicians are willing to un-dergo pregnancy. Alternatively, very ill pregnantphysicians may have been less likely to respond tothe questionnaire. However, prior studies havealso shown that physicians have good pregnancyoutcomes, very similar to that of other high so-
w xcioeconomic status women 8 .Pregnant physicians’ median number of work
hours per week, desire to work less, sleep hourson call and not on call, perceived work control,career satisfaction, and work stress did not sig-nificantly differ from non-pregnant physicians’.Prior studies have also found positive professional
w xoutcomes during physicians’ pregnancies 9 , al-though many authors have chosen to write pri-
marily about the conflicts raised by physicianw xpregnancies 10,11 . While both men and women
physicians will take varying lengths of time offfrom medicine for childbirth and childrearing, ourfindings about these pregnant physicians’ healthstatus suggest that the prenatal period may be avery healthy and productive time for many femalephysicians.
Acknowledgments
This study was funded by the American Medi-cal Association’s Education and Research Foun-dation, Chicago; the American Heart Association,Dallas; an institutional National Research Service
Ž .Award No. 5T32-HL-07034 from the NationalŽInstitutes of Health National Heart, Lung and
.Blood Institute , Bethesda, MD, USA; and theEmory Medical Care Foundation, Atlanta, GA,USA.
References
w x1 American Medical Association. Women in Medicine:1995 Data Source. Chicago, IL: American Medical As-sociation, 1995.
w x2 Frank E, Brogan DJ, Mokdad AH, Simoes EJ, Kahn HS,Greenberg RS. Health-related behaviors of womenphysicians vs other women in the United States. ArchIntern Med 1998;158:342]348.
w x3 Lewis CE, Wells KB, Ware J. A model for predictingwthe counseling practices of physicians published er-
Ž .ratum appears in J Gen Intern Med 1986 May]Jun;1 3 :x154 . J Gen Intern Med 1986;1:14]19.
w x4 Wells KB, Lewis CE, Leake B, Ware Jr. JE. Do physi-cians preach what they practice? A study of physicians’health habits and counseling practices. J Am Med Assoc1984;252:2846]2848.
w x5 Schwartz JS, Lewis CE, Clancy C, Kinosian MS, RadanyMH, Koplan JP. Internists’ practices in health promo-tion and disease prevention: a survey. Ann Intern Med1991;114:46]53.
w x6 Lewis CE, Clancy C, Leake B, Schwartz JS. The counsel-w xing practices of internists see comments . Ann Intern
Med 1991;114:54]58.w x7 Frank E, Kunovich-Frieze T. Physicians’ prevention
counseling behaviors: current status and future direc-tions. Prev Med 1995;24:543]545.
w x8 Klebanoff MA, Shiono PH, Rhoads GG. Outcomes ofpregnancy in a national sample of resident physicians. NEngl J Med 1990;323:1040]1045.

( )E. Frank, K. Cone r International Journal of Gynecology & Obstetrics 69 2000 37]4646
w x9 Sayres M, Wyshak G, Denterlein G, Apfel R, Shore E,Federman D. Pregnancy during residency. N Engl J Med1986;314:418]422.
w x10 Greganti MA, Fletcher SW. House staff pregnancy ininternal medicine residencies. Ann Intern Med 1985;102:123]125.
w x11 Franco K, Evans CL, Best AP, Zrull JP, Pizza GA.Conflicts associated with physicians’ pregnancies. Am JPsychiatry 1983;140:902]904.
w x12 Frank E. The Women Physicians’ Health Study: back-ground, objectives, and methods. J Am Med WomensAssoc 1995;50:64]66.
w x13 Frank E, Rothenberg R, Brown WV, Maibach H. Basicdemographic and professional characteristics of U.S.women physicians. West J Med 1997;166:179]184.
w x14 Vital and Health Statistics } Series 23, Data From theŽ .National Survey of Family Growth Aug 1995 I 8 :1]74.
w x15 CDC. Alcohol consumption among pregnant and child-bearing-aged women } United States, 1991 and 1995.
Ž .MMWR 1997;46 16 :346]350.w x16 Serdula M, Williamson DF, Kendrick JS, Anda RF,
Byers T. Trends in alcohol consumption by pregnantŽ .women. J Am Med Assoc 1991;265 7 :876]879.
w x17 Position of the American Dietetic Association: use ofnutritive and non-nutritive sweeteners. J Am Diet Assoc
Ž .1993;93 7 :816]821.w x18 Mills L, Holmes LB, Aarons JH, Simpson JL, Brown A,
Jovanovic-Peterson LG et al. Moderate caffeine use andthe risk of spontaneous abortion and intrauterine growth
Ž .retardation. J Am Med Assoc 1993;269 5 :593]597.
w x19 Dlugosz L, Bracken MB. Reproductive effects of caf-feine: a review and theoretical analysis. Epidemiol Rev1992;14:83]100.
w x20 Shu XO, Hatch MC, Mills J, Clemens J, Susser M.Maternal smoking, alcohol drinking, caffeine consump-tion, and fetal growth: results from a prospective study.
Ž .Epidemiology 1995;6 2 :115]120.w x21 American College of Obstetricians and Gynecologists:
Nutrition during pregnancy. ACOG Technical Bulletin179. Washington, DC: ACOG, 1993.
w x22 Hertz-Picciotto I, Hopenhayn-Rich C, Golub M, HooperK. The risks and benefits of taking aspirin during preg-nancy. Epidemiol Rev 1990;12:108]148.
w x23 Hatch MC, Shu XO, McLean DE, Levin B, Begg M,Reuss L et al. Maternal exercise during pregnancy,physical fitness, and fetal growth. Am J Epidemiol 1993;137:1105]1114.
w x24 Zhang J, Savitz D. Exercise during pregnancy among USwomen. Ann Epidemiol 1996;6:53]59.
w x25 American College of Obstetricians and Gynecologists:Exercise during pregnancy and the postpartum period.ACOG Technical Bulletin 189. Int J Gynecol Obstet1994;45:65]70.
w x26 Prevention and control of influenza: Part 1, Vaccines.Recommendations of the Advisory Committee on Im-
Ž . Žmunization Practices ACIP . MMWR 1994;43 RR-.9 :1]13.
w x27 CDC. Zidovudine for the prevention of HIV transmis-sion from mother to infant. J Am Med Assoc 1994;
Ž .271 20 :1567]1570.