Embed Size (px)
Citation preview
For questions about this report please contact Dr. Patricia Moulton or Dr. Mary Wakefield at 701-777-3848 or see our website http://medicine.nodak.edu/crh
Characteristics of Characteristics of North DakNorth Dakota’ota’s s
Nursing Nursing WWorkforkfororce: ce: A Status ReportA Status Report
North Dakota Nursing Needs StudyFall 2003
Patricia Moulton, Ph.D.Mary Wakefield, Ph.D., R.N.

i
About Nursing ....
Nursing as a profession needs to be able to attract thebest and the brightest . . . to be able to compete withthe other careers in healthcare that are currently attractingstudents who are proficient in sciences and mathematics.
North Dakota RN
We as RNs need to promote our profession.We are taught critical thinking...let’s use it!
Urban North Dakota RN
You hear all the time about teachers’ salaries in ND,but you never hear anything about nurses’ salaries.Maybe it’s our fault. We’re not being proactive.You work hard to save a life, for really, not a verygood salary. That’s unfortunate.
Rural North Dakota RN
Satisfaction comes from knowing you helped someone...just seeing them get better or making a procedure easierfor them.
Urban North Dakota RN
Grow your own—rural areas need to recruit promising candidates with roots in the community and provide the means to get the education needed.
North Dakota Nursing Faculty
We need to work on the image of nurses...not just bedpans and shots...and not just female.
North Dakota LPN student
Nursing is a very difficult job. There needs to be good pay for hard work.
North Dakota Director of Nursing
There’s a better nurse-patient relationship in a rural area, because you spend more time with them. You see them for everything, not just specialized Rx.
Rural North Dakota LPN

ii
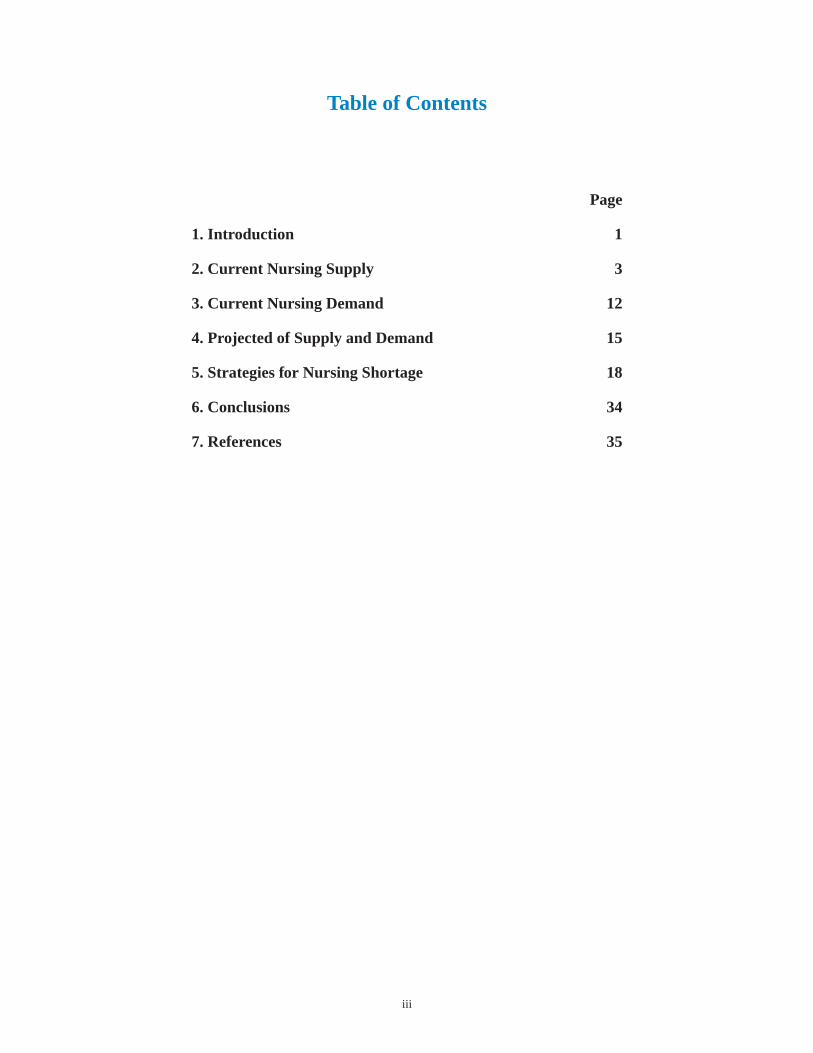
iii
Table of Contents
Page
1. Introduction 1
2. Current Nursing Supply 3
3. Current Nursing Demand 12
4. Projected of Supply and Demand 15
5. Strategies for Nursing Shortage 18
6. Conclusions 34
7. References 35

iv
1
Introduction
Health personnel shortages can negatively impact health care quality, through reduced health careaccess, increased stress on providers, and the use of under-qualified personnel. Also, shortages cancontribute to higher costs by raising compensation levels to attract and retain personnel and byincreasing the use of overtime pay and expensive temporary personnel. Workforce shortages, while aproblem for the entire health care system, are likely to be most severe for rural/frontier regions andmedically needy population groups such as the elderly. North Dakota has 41 designated medicallyunderserved areas (MUA) and 81% of ND counties are designated as partial or whole county healthprofessional shortage areas (HPSA). North Dakota also has the highest proportion of residents age 85and older, the age group with the greatest need for healthcare services. In North Dakota, this populationis predicted to double by 2020.
Nurses are an integral part of the heath care system providing nursing services to patients requiringassistance in recovering or maintaining their physical or mental health (North Dakota HealthcareAssociation, 2002). In the United States, nurses comprise the largest group of health care providersnumbering 2.7 million. They practice in settings ranging from public health to long term care. Theability to provide accessible, high quality care depends on the availability of a nursing workforce withthe requisite skills and knowledge. Over the past few years, research studies have identified clearrelationships between nurse staffing and patient outcomes. For example, lower nurse staffing inhospitals has been linked to longer hospital stays for patients, as well as a number of complications suchas pneumonia. Directly challenging the health care system’s ability to provide quality patient care is agrowing national and international disparity in nursing workforce supply and demand. North Dakota isnot immune to this trend.
The Nursing Needs study was recommended, in 2001, by the North Dakota State Legislature (NDCCNurse Practices Act 43-12.1-08.2) to address potential shortages in nursing supply. Specifically, theNorth Dakota Board of Nursing was directed to address issues of supply and demand for nurses,including issues of recruitment, retention and utilization of nurses. To respond to this request, the NorthDakota Board of Nursing contracted with the Center for Rural Health at the School of Medicine andHealth Sciences, University of North Dakota.
43-12.1-08.2. (EFFECTIVE THROUGH SEPTEMBER 30, 2006) NURSING NEEDS STUDY.The board may address issues of supply and demand for nurses, including issues of recruitment,retention, and utilization of nurses. The board:
1. May develop a strategic statewide plan to alleviate the nursing shortage in the state byestablishing and maintaining a database on nursing supply and demand in the state, includingcurrent supply and demand and future projections, and by selecting priorities from the plan tobe addressed.
2. May convene various groups representative of nurses, other healthcare providers, businessand industry, consumers, legislators, and educators to review and comment on data analysisprepared for the board; recommend systematic changes, including strategies forimplementation of recommended changes; and evaluate and report the results of these effortsto the legislative assembly and the public.
2
3. May review and study the nursing educational requirements in this state.4. May study the nursing shortage in this state and the implications for rural communities.5. May increase any license or registration fees imposed by the board up to fifteen dollars to
reimburse the board for actual expenses incurred under this section.6. May apply for, solicit, accept, and expend any contribution, grant, or gift made available from
public or private sources for the purpose of implementing this section.7. Shall report annually on the progress of the study, if undertaken, to the legislative council and
shall provide a final report to the sixtieth legislative assembly.
This study, initiated in 2002, is designed to collect and analyze data in order to obtain an accurate andcomplete picture of nurses in rural and urban areas of North Dakota. The study is also constructed tocompare state data with existing national data as well as to inform institutional and public policy.
Four projects were conducting during year one of the study. • A facility survey was sent to all hospitals, long-term care facilities, clinics, home health and
regional public health facilities in order to determine demand for nurses and recruitment andretention efforts.
• A survey of a sample of RNs and LPNs throughout North Dakota which focused onrecruitment and retention issues.
• Focus groups with a sample of nursing students and nurses were conducted throughout thestate and centered on job satisfaction and identifying changes that would encourage nurses towork in North Dakota facilities, especially in rural areas.
• A survey of nursing program faculty focusing on program capacity to educate a sufficientnumber of nurses, faculty demographics, job satisfaction and changes that may improve thenursing workforce as a whole.
The first year of the North Dakota Nursing Needs Study included input from 1,898 individualsthroughout North Dakota including 286 Directors of Nursing and healthcare facility administrators, 103nursing program faculty, 121 nursing students, and 1,388 licensed nurses providing a representativesample. Five reports were produced: Facility Survey Results, Licensed Nurse Survey Results, LicensedNurse Focus Group Results, Faculty Survey Results and Student Focus Group Results. These fivereports including methodology, introduction and background of the study can be found athttp://medicine.nodak.edu/crh.
In this report, the current and projected status of North Dakota nursing supply and demand is describedand related conclusions are presented. Data are presented at different levels (county, state and national)and do not always reflect comparable data sets. For example vacancy rate data and supply/demandprojections are based on different surveys and databases.
3
What Is the Current Supply of Nurses?
Supply is defined as the number of personnel working or available to work in health care settings at aparticular wage (U.S. Department of Health and Human Services, 2000).
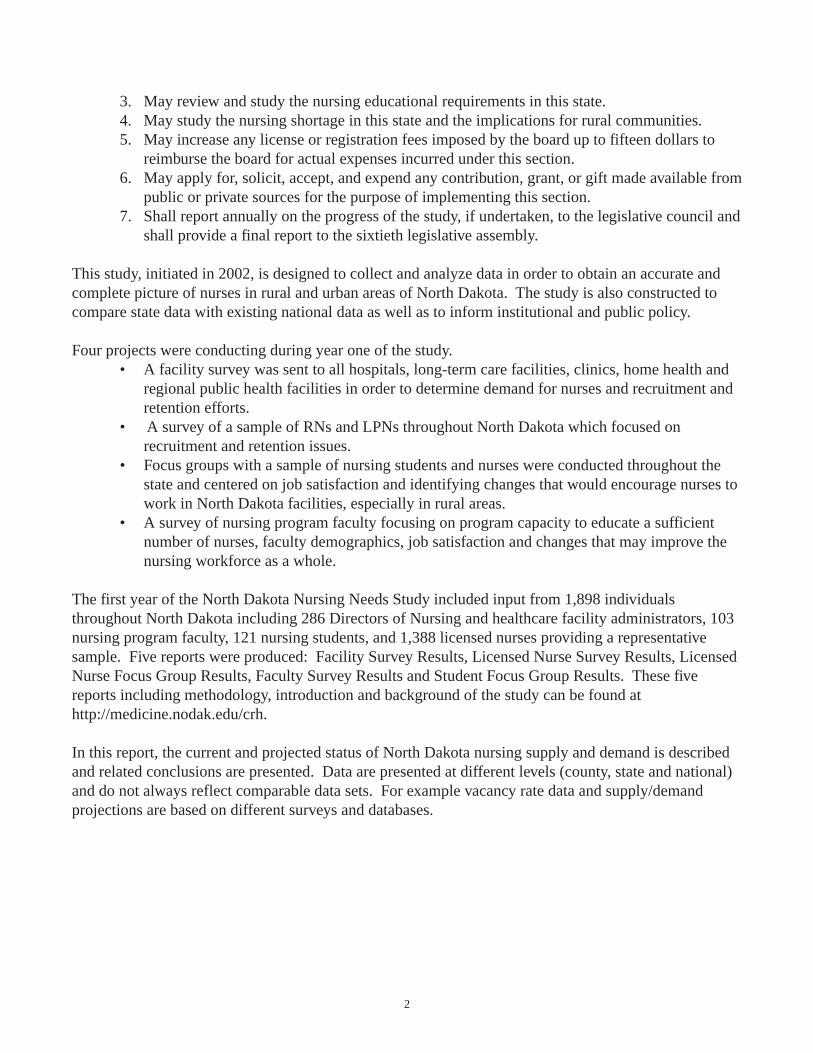
• In 2001, there were 8,392 RNs and 3,179 LPNs in North Dakota (North Dakota Board ofNursing Annual Report, 2002). 94% of RNs and 97% of LPNs were female. 96% of RNsand 95% of LPNs were employed (either part- or full-time). 32% of nurses worked part-time (less than 32 hours per week) in their primary nursing setting (North Dakota NursingNeeds Study: Licensed Nurse Survey Results, 2003).
While decreasing slightly over thelast four years, the vast majority ofRNs work in hospital settingsand over half of RNs work in med-ical-surgical and geriatric areas.
Source: Data from North Dakota Board of Nursing 2001 & 2002 Annual Reports.
Most LPNs work in extended careand hospitals with the number ofLPNs in hospital settings slightlydecreasing over the last four years.Most LPNs work in geriatrics, med-ical-surgical and primary care areas.
Source: Data from North Dakota Board of Nursing 2001 & 2002 Annual Reports.
0% 10% 20% 30% 40% 50% 60%
Ambulatory Care Clinic
GovernmentHome Health
Hospital
Nursing EducationExtended Care
Public Health
School HealthSocial ServicesOther Settings
Physician’s Office
RN Primary Employment Settings
2001 2000 1999 1998
Percentage
0% 5% 10% 15% 20% 25% 30% 35%
Percentage
2001 2000 1999 1998
Ambulatory Care Clinic
GovernmentHome Health
Hospital
Nursing EducationExtended Care
Public Health
School HealthSocial ServicesOther Settings
Physician’s Office
LPN Primary Employment Settings
4
How Are Nurses Distributed Throughout North Dakota?
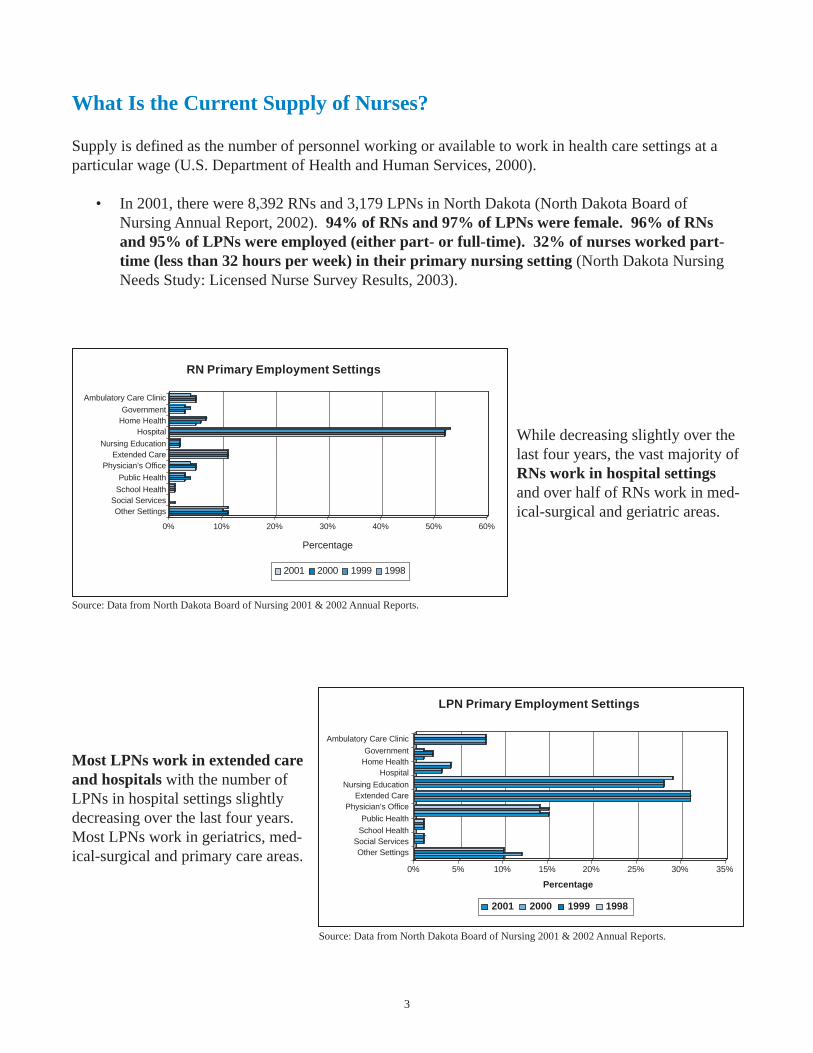
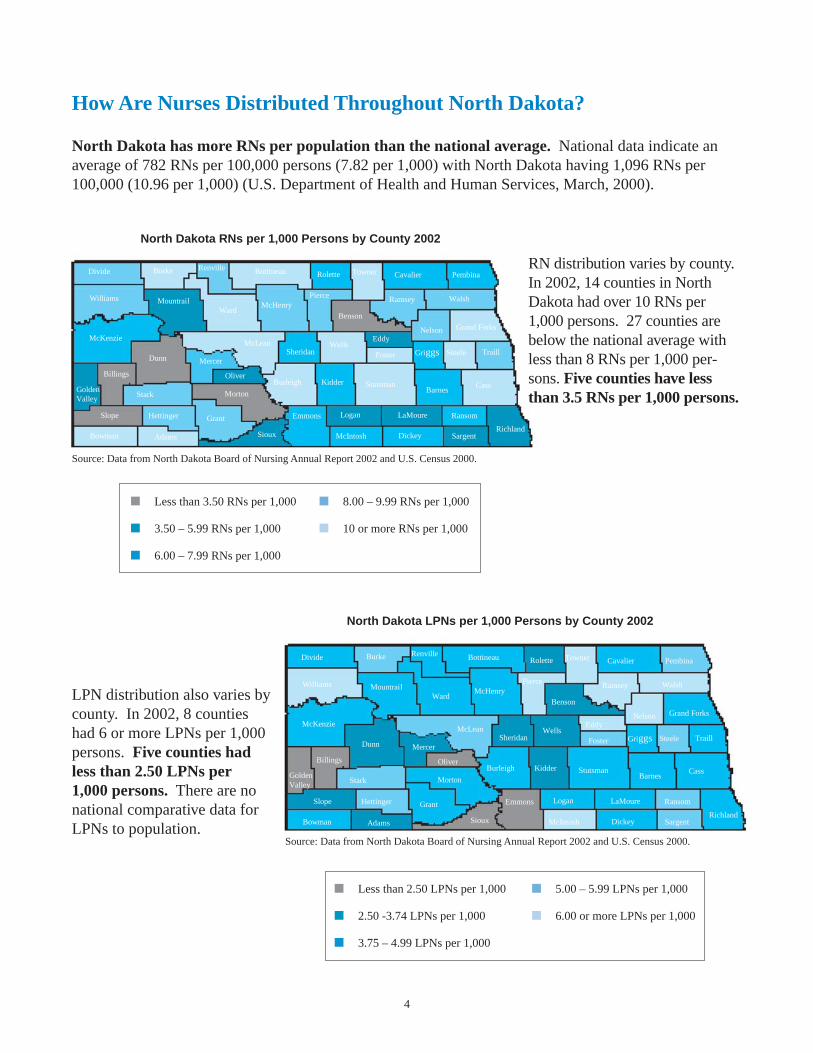
North Dakota has more RNs per population than the national average. National data indicate anaverage of 782 RNs per 100,000 persons (7.82 per 1,000) with North Dakota having 1,096 RNs per100,000 (10.96 per 1,000) (U.S. Department of Health and Human Services, March, 2000).
Griggs Steele Traill
CassBarnes
Stutsman
Logan LaMoure Ransom
RichlandSargentDickeyMcIntosh
Emmons
WalshWilliams
StarkGolden Valley
Billings
Slope
Foster
KidderBurleigh
Sioux
Grant
Morton
Mountrail
Oliver
Sheridan
Grand ForksNelson
Ramsey
Dunn
McKenzieMcLean
AdamsBowman
Hettinger
Mercer
WardMcHenry
Benson
Cavalier PembinaTownerRolette
Pierce
BottineauDivide Burke
Wells
Renville
Eddy
■ Less than 3.50 RNs per 1,000 ■ 8.00 – 9.99 RNs per 1,000
■ 3.50 – 5.99 RNs per 1,000 ■ 10 or more RNs per 1,000
■ 6.00 – 7.99 RNs per 1,000
North Dakota RNs per 1,000 Persons by County 2002
RN distribution varies by county.In 2002, 14 counties in NorthDakota had over 10 RNs per1,000 persons. 27 counties arebelow the national average withless than 8 RNs per 1,000 per-sons. Five counties have lessthan 3.5 RNs per 1,000 persons.
North Dakota LPNs per 1,000 Persons by County 2002
Griggs Steele Traill
CassBarnes
Stutsman
Logan LaMoure Ransom
RichlandSargentDickeyMcIntosh
Emmons
WalshWilliams
StarkGolden Valley
Billings
Slope
Foster
KidderBurleigh
Sioux
Grant
Morton
Mountrail
Oliver
Sheridan
Grand ForksNelson
Ramsey
Dunn
McKenzieMcLean
AdamsBowman
Hettinger
Mercer
WardMcHenry
Benson
Cavalier PembinaTownerRolette
Pierce
BottineauDivide Burke
Wells
Renville
Eddy
■ Less than 2.50 LPNs per 1,000 ■ 5.00 – 5.99 LPNs per 1,000
■ 2.50 -3.74 LPNs per 1,000 ■ 6.00 or more LPNs per 1,000
■ 3.75 – 4.99 LPNs per 1,000
LPN distribution also varies bycounty. In 2002, 8 countieshad 6 or more LPNs per 1,000persons. Five counties hadless than 2.50 LPNs per1,000 persons. There are nonational comparative data forLPNs to population.
Source: Data from North Dakota Board of Nursing Annual Report 2002 and U.S. Census 2000.
Source: Data from North Dakota Board of Nursing Annual Report 2002 and U.S. Census 2000.
5
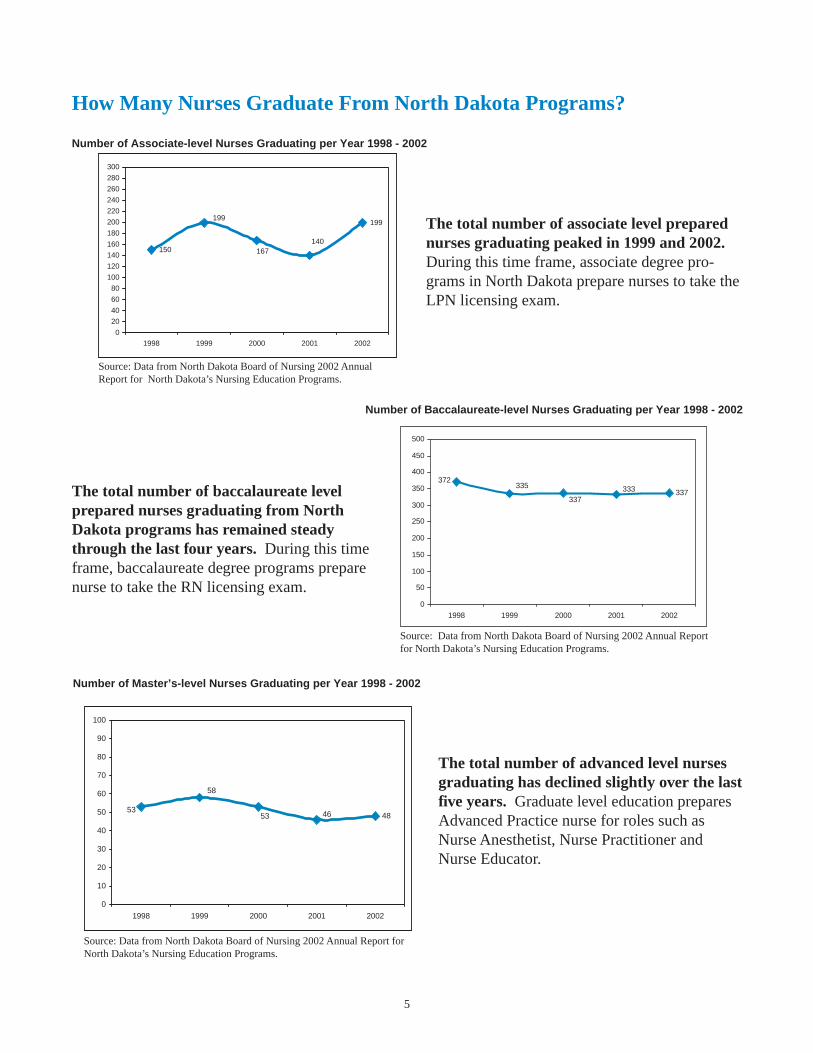
How Many Nurses Graduate From North Dakota Programs?
The total number of associate level preparednurses graduating peaked in 1999 and 2002.During this time frame, associate degree pro-grams in North Dakota prepare nurses to take theLPN licensing exam.
Source: Data from North Dakota Board of Nursing 2002 AnnualReport for North Dakota’s Nursing Education Programs.
The total number of baccalaureate levelprepared nurses graduating from NorthDakota programs has remained steadythrough the last four years. During this timeframe, baccalaureate degree programs preparenurse to take the RN licensing exam.
The total number of advanced level nursesgraduating has declined slightly over the lastfive years. Graduate level education preparesAdvanced Practice nurse for roles such asNurse Anesthetist, Nurse Practitioner andNurse Educator.
Number of Associate-level Nurses Graduating per Year 1998 - 2002
150
199
140167
199
0
20
40
60
80
100
120
140
160
180
200
220
240
260
280
300
1998 1999 2000 2001 2002
Number of Baccalaureate-level Nurses Graduating per Year 1998 - 2002
337
372333
337
335
0
50
100
150
200
250
300
350
400
450
500
1998 1999 2000 2001 2002
Number of Master’s-level Nurses Graduating per Year 1998 - 2002
484653
58
53
0
10
20
30
40
50
60
70
80
90
100
1998 1999 2000 2001 2002
Source: Data from North Dakota Board of Nursing 2002 Annual Report forNorth Dakota’s Nursing Education Programs.
Source: Data from North Dakota Board of Nursing 2002 Annual Reportfor North Dakota’s Nursing Education Programs.
6
What Do Nurses Think About the Adequacy of Supply of Nurses?
• Nurses were asked whether the supply of nurses working in patient care was adequate in their worksetting. 54% of LPNs, 48% of RNs and 46% of Advanced Practice Nurses felt supply waseither somewhat or very inadequate. Most of these nurses were from rural or semi-rural settings(North Dakota Nursing Needs Study: Licensed Nurse Survey Results, 2003).
• Nurses were asked whether they felt that there is a shortage of nurses in their clinical specialtywithin their work setting. 63% of LPNs, 62% of RNs and 56% of Advanced Practice Nursesresponded yes (North Dakota Nursing Needs Study: Licensed Nurse Survey Results, 2003).

7
How Many Nurses Are Projected to Retire?
With both an aging population and an aging workforce, anticipating nurse retirement trends andpotential strategies for delaying retirement can be important considerations for maintaining an adequateworkforce. Retention strategies include developing new roles (i.e. mentor) or career paths for agingnurses (Kimball & O’Neil, 2002; Nursing’s Agenda for the Future Steering Committee, 2002).
Between 2003 and 2012, the average rate ofLPN attrition due to retirement at age 65will be 1.3 % per year. Between 2013 and2022, the average rate of LPN attrition dueto retirement at age 65 will be 3.7% peryear.
Assuming retirement at age 65 (average age= 43), 8% of the current LPN workforce willretire by 2008, almost 1 in 5 (18%) by2013, 35% by 2018 and 49% by 2022.
Between 2003 and 2012, the average rate ofRN attrition due to retirement at age 65 willbe 1.23% per year. Between 2013 and 2022,the average rate of RN attrition due toretirement at age 65 will be 3.36% per year.
Assuming retirement at age 65 (average age= 44), 9% of the current RN workforce willretire by 2008, almost 1 in 5 (18%) by2013, 33% by 2018 and 49% by 2022.
Source: North Dakota Board of Nursing licensure database, 2003.
Cumulative Percent of LPNs Reaching Age 65
0
10
20
30
40
50
60
70
80
90
100
2003
2004
2005
2006
2007
2008
2009
2010
2011
2012
2013
2014
2015
2016
2017
2018
2019
2020
2021
2022
Source: North Dakota Board of Nursing licensure database, 2003.
Cumulative Percent of RNs Reaching Age 65
0
10
20
30
40
50
60
70
80
90
100
2003
2004
2005
2006
2007
2008
2009
2010
2011
2012
2013
2014
2015
2016
2017
2018
2019
2020
2021
2022
8
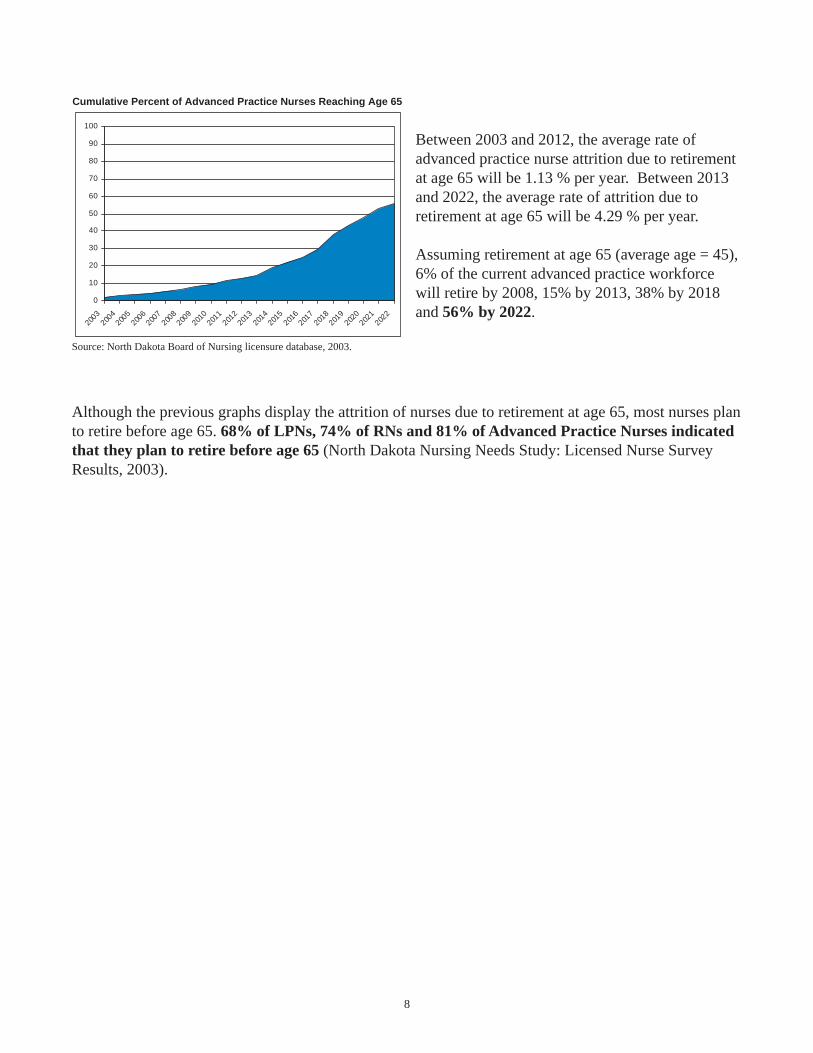
Between 2003 and 2012, the average rate ofadvanced practice nurse attrition due to retirementat age 65 will be 1.13 % per year. Between 2013and 2022, the average rate of attrition due toretirement at age 65 will be 4.29 % per year.
Assuming retirement at age 65 (average age = 45),6% of the current advanced practice workforcewill retire by 2008, 15% by 2013, 38% by 2018and 56% by 2022.
Source: North Dakota Board of Nursing licensure database, 2003.
Although the previous graphs display the attrition of nurses due to retirement at age 65, most nurses planto retire before age 65. 68% of LPNs, 74% of RNs and 81% of Advanced Practice Nurses indicatedthat they plan to retire before age 65 (North Dakota Nursing Needs Study: Licensed Nurse SurveyResults, 2003).
Cumulative Percent of Advanced Practice Nurses Reaching Age 65
0
10
20
30
40
50
60
70
80
90
100
2003
2004
2005
2006
2007
2008
2009
2010
2011
2012
2013
2014
2015
2016
2017
2018
2019
2020
2021
2022
9
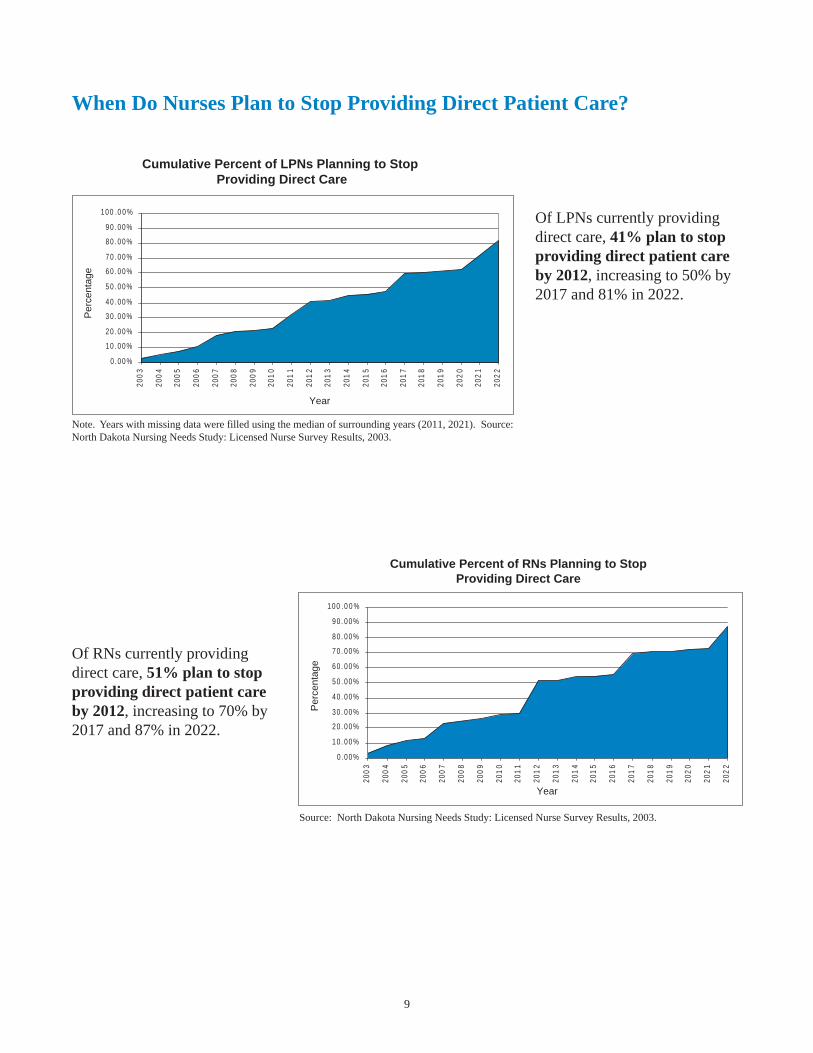
When Do Nurses Plan to Stop Providing Direct Patient Care?
Of LPNs currently providingdirect care, 41% plan to stopproviding direct patient careby 2012, increasing to 50% by2017 and 81% in 2022.
Note. Years with missing data were filled using the median of surrounding years (2011, 2021). Source:North Dakota Nursing Needs Study: Licensed Nurse Survey Results, 2003.
Of RNs currently providingdirect care, 51% plan to stopproviding direct patient careby 2012, increasing to 70% by2017 and 87% in 2022.
Source: North Dakota Nursing Needs Study: Licensed Nurse Survey Results, 2003.
Cumulative Percent of LPNs Planning to Stop Providing Direct Care
0 .00%
10 . 00%
20 . 00%
30 . 00%
40 . 00%
50 . 00%
60 . 00%
70 . 00%
80 . 00%
90 . 00%
100 .0 0 %
200
3
200
4
200
5
200
6
200
7
200
8
200
9
201
0
201
1
201
2
201
3
201
4
201
5
201
6
201
7
201
8
201
9
202
0
202
1
202
2
Year
Per
cent
age
Cumulative Percent of RNs Planning to StopProviding Direct Care
0 .00%
10 . 00%
20 . 00%
30 . 00%
40 . 00%
50 . 00%
60 . 00%
70 . 00%
80 . 00%
90 . 00%
100 .0 0 %
200
3
200
4
200
5
200
6
200
7
200
8
200
9
201
0
201
1
201
2
201
3
201
4
201
5
201
6
201
7
201
8
201
9
202
0
202
1
202
2
Year
Per
cent
age
10
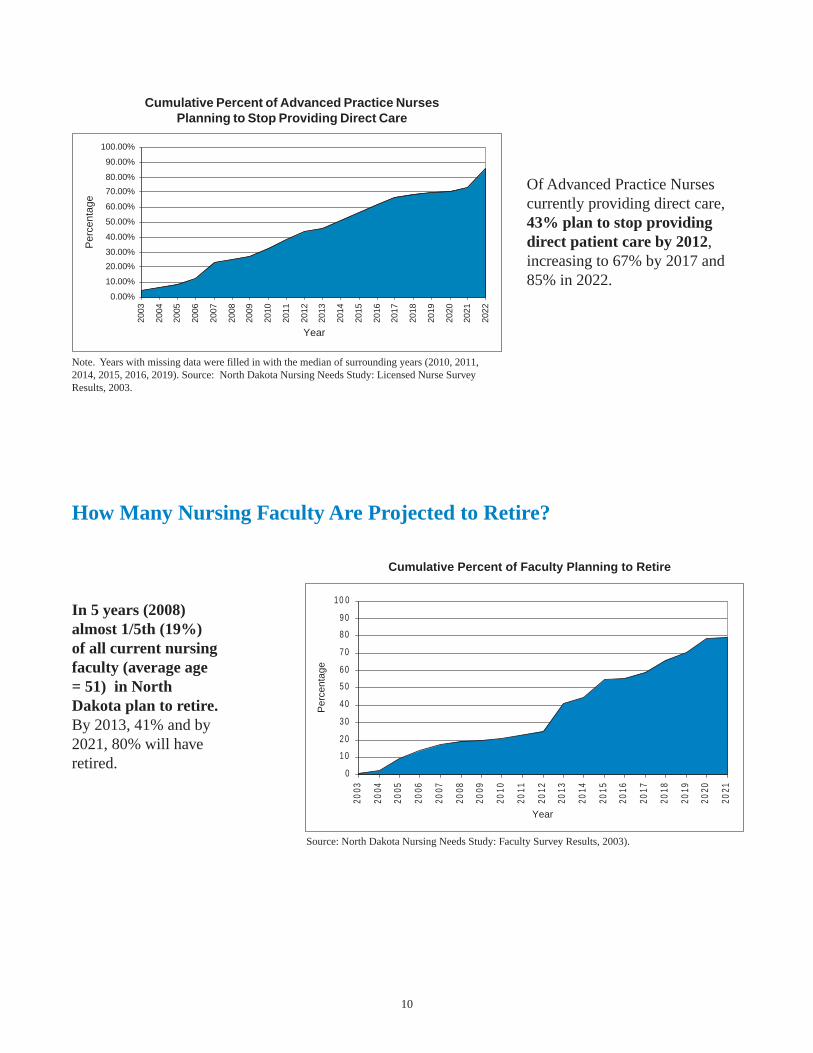
Of Advanced Practice Nursescurrently providing direct care,43% plan to stop providingdirect patient care by 2012,increasing to 67% by 2017 and85% in 2022.
Note. Years with missing data were filled in with the median of surrounding years (2010, 2011,2014, 2015, 2016, 2019). Source: North Dakota Nursing Needs Study: Licensed Nurse SurveyResults, 2003.
How Many Nursing Faculty Are Projected to Retire?
In 5 years (2008)almost 1/5th (19%)of all current nursingfaculty (average age= 51) in NorthDakota plan to retire.By 2013, 41% and by2021, 80% will haveretired.
Source: North Dakota Nursing Needs Study: Faculty Survey Results, 2003).
Cumulative Percent of Advanced Practice NursesPlanning to Stop Providing Direct Care
0.00%
10.00%
20.00%
30.00%
40.00%
50.00%
60.00%
70.00%
80.00%
90.00%
100.00%20
03
2004
2005
2006
2007
2008
2009
2010
2011
2012
2013
2014
2015
2016
2017
2018
2019
2020
2021
2022
Year
Per
cent
age
Cumulative Percent of Faculty Planning to Retire
0
10
20
30
40
50
60
70
80
90
10 0
2003
2004
2005
2006
2007
2008
2009
2010
2011
2012
2013
2014
2015
2016
2017
2018
2019
2020
2021
Year
Per
cent
age
11
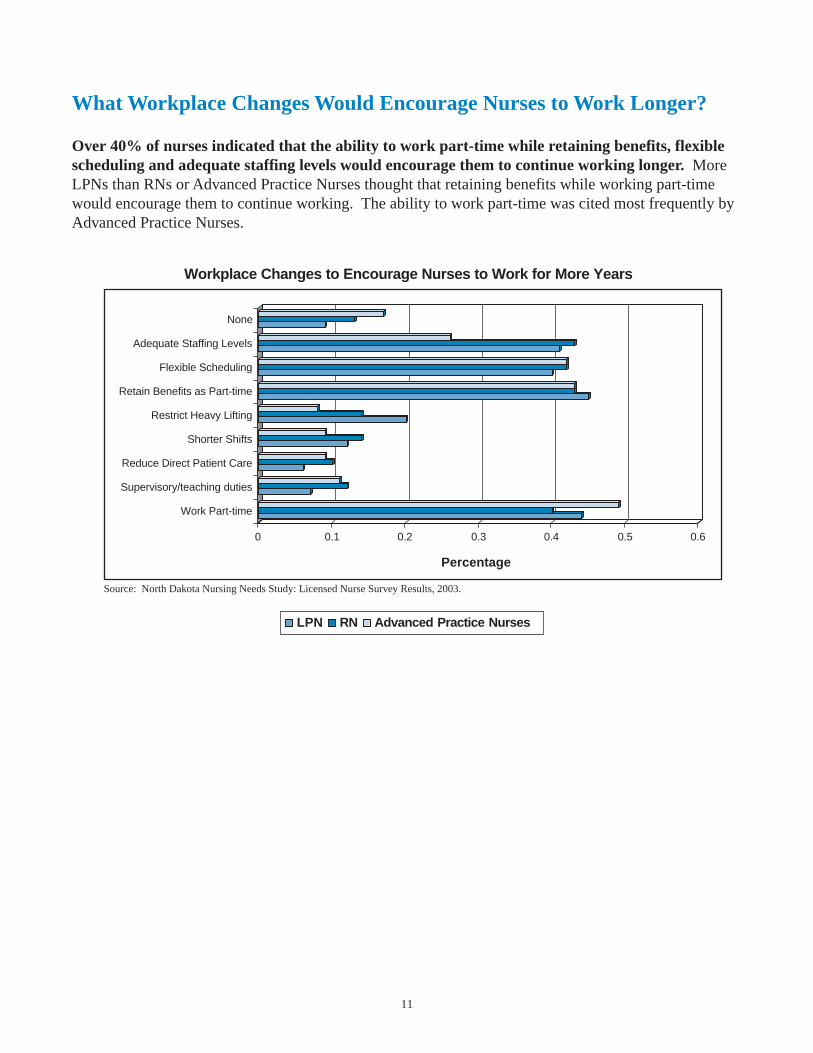
What Workplace Changes Would Encourage Nurses to Work Longer?
Over 40% of nurses indicated that the ability to work part-time while retaining benefits, flexiblescheduling and adequate staffing levels would encourage them to continue working longer. MoreLPNs than RNs or Advanced Practice Nurses thought that retaining benefits while working part-timewould encourage them to continue working. The ability to work part-time was cited most frequently byAdvanced Practice Nurses.
Source: North Dakota Nursing Needs Study: Licensed Nurse Survey Results, 2003.
0 0.1 0.2 0.3 0.4 0.5 0.6
Percentage
None
Adequate Staffing Levels
Flexible Scheduling
Retain Benefits as Part-time
Restrict Heavy Lifting
Shorter Shifts
Reduce Direct Patient Care
Supervisory/teaching duties
Work Part-time
Workplace Changes to Encourage Nurses to Work for More Years
LPN RN Advanced Practice Nurses

12
What Is the Current Demand For Nurses?
Demand is the willingness of employers to purchase services of healthcare personnel at a particularwage (U.S. Department of Health and Human Services, 2000). A full workforce in most industriesexists when vacancy rates do not exceed five to six percent (Prescott, 2000). A shortage is considered tobe present at a sustained vacancy rate above this level. Nationally, current nurse vacancy rates in hospi-tals average about 15% (AHA, 2002). The American Organization of Nursing Executives report anation-wide vacancy rate for RNs in hospitals as 10.2% (HSM Group, 2002). Six counties in NorthDakota have both RN and LPN vacancy rates above 6%.
North Dakota RN Health Care Facility Vacancy Rates
Eddy
Griggs Steele Traill
CassBarnes
Stutsman
Logan LaMoure Ransom
RichlandSargentDickeyMcIntosh
Emmons
WalshWilliams
StarkGolden Valley
Billings
Slope
Foster
KidderBurleigh
Sioux
Grant
Morton
Mountrail
Oliver
Sheridan
Grand ForksNelson
Ramsey
Dunn
McKenzieMcLean
AdamsBowman
Hettinger
Mercer
WardMcHenry
Benson
Cavalier PembinaTownerRolette
Pierce
BottineauDivide Burke
Wells
Renville
■ Less than 6%
■ 6% - 9% ■ 10% - 14% ■ 15% or greater
No data available.
Twelve counties in NorthDakota have RN vacancyrates above 6% includingtwo counties above 15%.
North Dakota LPN Health Care Facility Vacancy Rates
Eddy
Griggs Steele Traill
CassBarnes
Stutsman
Logan LaMoure Ransom
RichlandSargentDickeyMcIntosh
Emmons
WalshWilliams
StarkGolden Valley
Billings
Slope
Foster
KidderBurleigh
Sioux
Grant
Morton
Mountrail
Oliver
Sheridan
Grand ForksNelson
Ramsey
Dunn
McKenzieMcLean
AdamsBowman
Hettinger
Mercer
WardMcHenry
Benson
Cavalier PembinaTownerRolette
Pierce
BottineauDivide Burke
Wells
Renville
■ Less than 6%
■ 6% - 9% ■ 10% -14% ■ 15% or greater
❉ No data available
Nine counties in NorthDakota have LPN vacancyrates above 6% includingtwo counties above 15%.
Note: Vacancy rates are not sector specific (e.g. hospitals). They include all responding health care facilitieswithin each county (hospital, long-term care, clinic, home health and public health). Source: North DakotaNursing Needs Study: Facility Survey Results (2003).
13
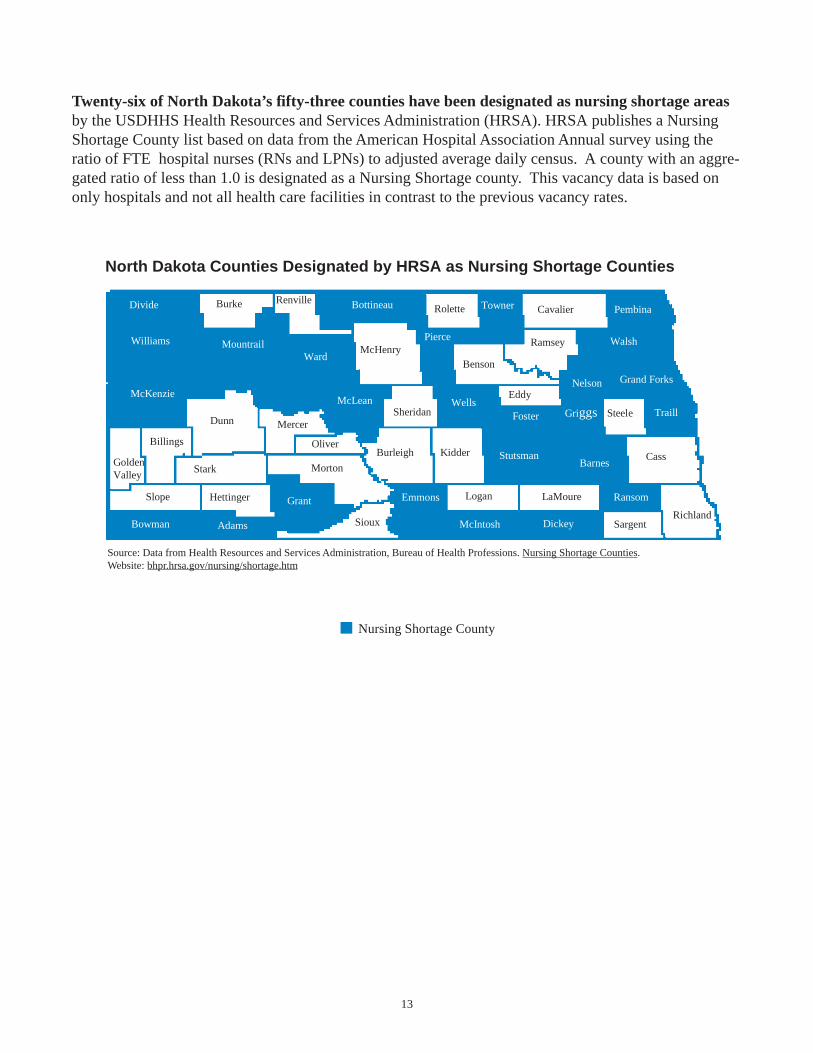
Twenty-six of North Dakota’s fifty-three counties have been designated as nursing shortage areasby the USDHHS Health Resources and Services Administration (HRSA). HRSA publishes a NursingShortage County list based on data from the American Hospital Association Annual survey using theratio of FTE hospital nurses (RNs and LPNs) to adjusted average daily census. A county with an aggre-gated ratio of less than 1.0 is designated as a Nursing Shortage county. This vacancy data is based ononly hospitals and not all health care facilities in contrast to the previous vacancy rates.
North Dakota Counties Designated by HRSA as Nursing Shortage Counties
Griggs Steele Traill
CassBarnes
Stutsman
Logan LaMoure Ransom
RichlandSargentDickeyMcIntosh
Emmons
WalshWilliams
StarkGolden Valley
Billings
Slope
Foster
KidderBurleigh
Sioux
Grant
Morton
Mountrail
Oliver
Sheridan
Grand ForksNelson
Ramsey
Dunn
McKenzieMcLean
AdamsBowman
Hettinger
Mercer
WardMcHenry
Benson
Cavalier PembinaTownerRolette
Pierce
BottineauDivide Burke
Wells
Renville
Eddy
■ Nursing Shortage County
Source: Data from Health Resources and Services Administration, Bureau of Health Professions. Nursing Shortage Counties. Website: bhpr.hrsa.gov/nursing/shortage.htm
14
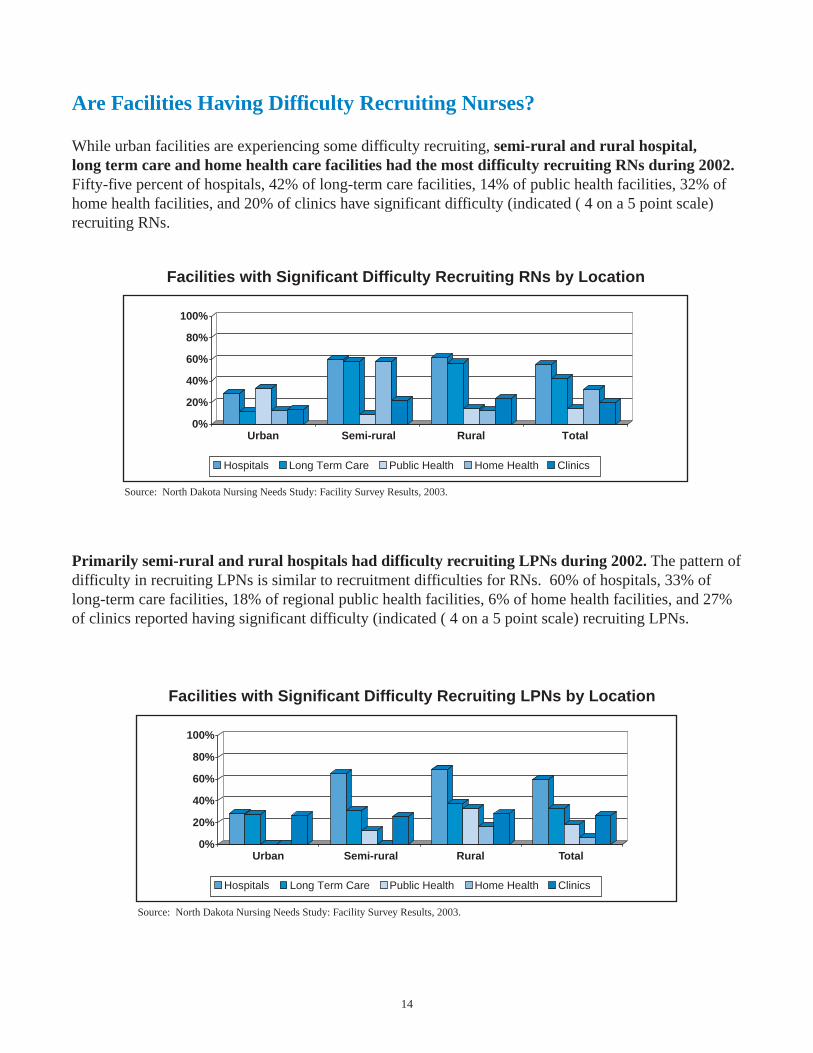
Are Facilities Having Difficulty Recruiting Nurses?
While urban facilities are experiencing some difficulty recruiting, semi-rural and rural hospital,long term care and home health care facilities had the most difficulty recruiting RNs during 2002.Fifty-five percent of hospitals, 42% of long-term care facilities, 14% of public health facilities, 32% ofhome health facilities, and 20% of clinics have significant difficulty (indicated ( 4 on a 5 point scale)recruiting RNs.
Facilities with Significant Difficulty Recruiting RNs by Location
0%
20%
40%
60%
80%
100%
Urban Semi-rural Rural Total
Hospitals Long Term Care Public Health Home Health Clinics
Source: North Dakota Nursing Needs Study: Facility Survey Results, 2003.
Primarily semi-rural and rural hospitals had difficulty recruiting LPNs during 2002. The pattern ofdifficulty in recruiting LPNs is similar to recruitment difficulties for RNs. 60% of hospitals, 33% oflong-term care facilities, 18% of regional public health facilities, 6% of home health facilities, and 27%of clinics reported having significant difficulty (indicated ( 4 on a 5 point scale) recruiting LPNs.
Facilities with Significant Difficulty Recruiting LPNs by Location
0%
20%
40%
60%
80%
100%
Urban Semi-rural Rural Total
Hospitals Long Term Care Public Health Home Health Clinics
Source: North Dakota Nursing Needs Study: Facility Survey Results, 2003.

15
What is the Projected Supply and Demand of Nurses?
An imbalance between the supply and demand of nurses may be characterized in three ways. First, thesupply of nurses may exceed demand. This can result in high unemployment rates and low wages. Thesecond imbalance may be a maldistribution of nurses. This is apparent in North Dakota in that themajority of nurses are in large population centers. The third imbalance, a nursing shortage, occurs whenthere are not enough nurses to meet demand. Current and predicted shortages are determined bycomparing the supply of nurses and the demand for nurses and projecting this comparison into thefuture. The resulting projections are estimates based on assumptions and several cautions are necessarywhen interpreting them.
Demand projections are based on selected national and state factors along with historical trends.Direct care supply projections are based on historical trends and estimates of when nurses willleave direct care nursing. These estimates may be influenced by a variety of factors, for example;a change in licensure laws, an aging population and variation in strength of the economy. Theimpact of all potentially influential factors on these estimates is not incorporated in theseprojections. Also, projections are statewide estimates and may not reflect city or county levelshortages. These estimates are based on the number of nurses and not the full-time equivalent ofnurses which would not reflect the impact of a large number of part-time nurses.
• Demand for RNs is expected to rise, whereas LPN demand is expected to remain stable. In1998, the labor category of registered nurse had the 9th most annual openings in North Dakotaand is projected to grow to the 5th or 6th occupation with the most annual openings by 2010.Licensed practical nurse was the 27th largest occupation in 1998 and will remain in the top 40occupations in North Dakota in 2010. (Source: Job Service of North Dakota (2001, 2003).Employment Projections 1998-2008, 2000-2010).
2000 2010 2000 2010
1000
1500
2000
2500
3000
3500
4000
4500
5000
5500
6000
6500
7000
7500
RN LPN
Estimated Nurse Employment
Source: Data from Job Service of North Dakota (2003). Employment Projections 2000-2010.

16
• Currently North Dakota has a shortage (not enough supply to meet demand) ofapproximately 500 RNs which is projected to increase to a shortage of about 2,000 RNs by2013.
• North Dakota has a shortage of approximately 200 LPNs. While not as great as the currentshortage of RNs, this shortage is projected to increase to about 700 LPNs by 2013.
Source. Demand projections derived from Job Service of North Dakota Employment Projections 2000-2010. Annual growth of 84.5 RNs/year assumed to continue at same rate through 2013. Supply projectionsare based on number of licensed nurses, lapsed licenses, newly licensed, number employed in nursing,number in direct care and number leaving direct care.
Source. Demand projections derived from Job Service of North Dakota Employment Projections 2000-2010.Annual growth of 7.7 LPNs/year assumed to continue at same rate through 2013. Supply projections arebased on number of licensed nurses, lapsed licenses, new licensed, number employed in nursing, number indirect care and number of nurses leaving direct care.
Direct Care RN Projection
0
1 0 0 0
2 0 0 0
3 0 0 0
4 0 0 0
5 0 0 0
6 0 0 0
7 0 0 0
8 0 0 0
9 0 0 0
2 0 0 3 2 0 0 8 2 0 1 3
Nu
mb
er o
f RN
s
Supply Demand
Direct Care LPN Projection
0
5 0 0
1 0 0 0
1 5 0 0
2 0 0 0
2 5 0 0
3 0 0 0
3 5 0 0
4 0 0 0
4 5 0 0
5 0 0 0
2 0 0 3 2 0 0 8 2 0 1 3
Nu
mb
er o
f LP
Ns
Supply Demand
17
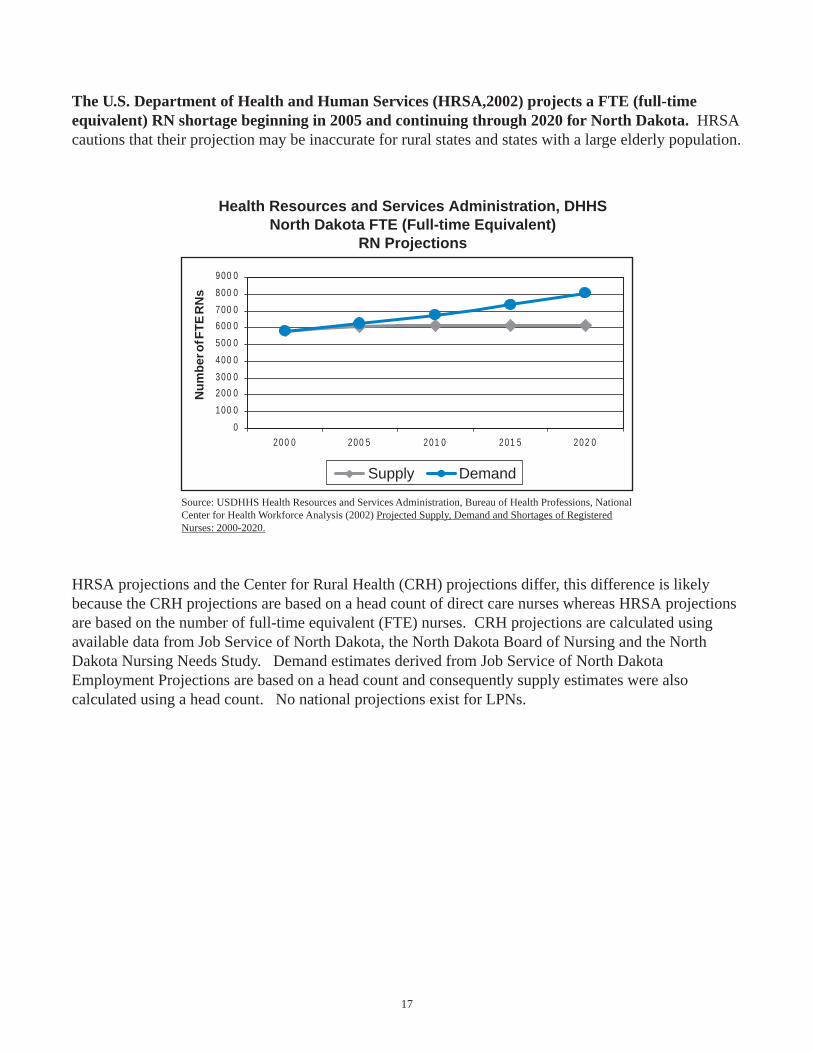
The U.S. Department of Health and Human Services (HRSA,2002) projects a FTE (full-timeequivalent) RN shortage beginning in 2005 and continuing through 2020 for North Dakota. HRSAcautions that their projection may be inaccurate for rural states and states with a large elderly population.
Source: USDHHS Health Resources and Services Administration, Bureau of Health Professions, NationalCenter for Health Workforce Analysis (2002) Projected Supply, Demand and Shortages of RegisteredNurses: 2000-2020.
HRSA projections and the Center for Rural Health (CRH) projections differ, this difference is likelybecause the CRH projections are based on a head count of direct care nurses whereas HRSA projectionsare based on the number of full-time equivalent (FTE) nurses. CRH projections are calculated usingavailable data from Job Service of North Dakota, the North Dakota Board of Nursing and the NorthDakota Nursing Needs Study. Demand estimates derived from Job Service of North DakotaEmployment Projections are based on a head count and consequently supply estimates were alsocalculated using a head count. No national projections exist for LPNs.
0
100 0
200 0
300 0
400 0
500 0
600 0
700 0
800 0
900 0
200 0 200 5 201 0 201 5 202 0
Nu
mb
er o
f FT
E R
Ns
Supply Demand
Health Resources and Services Administration, DHHSNorth Dakota FTE (Full-time Equivalent)
RN Projections
18
What Strategies Do Nurses Recommend to Address the Shortage?
Five major strategies were identified from the year one projects including salary, nursingeducation, nurse representation in decision making, staffing levels/work environment andrecruitment.
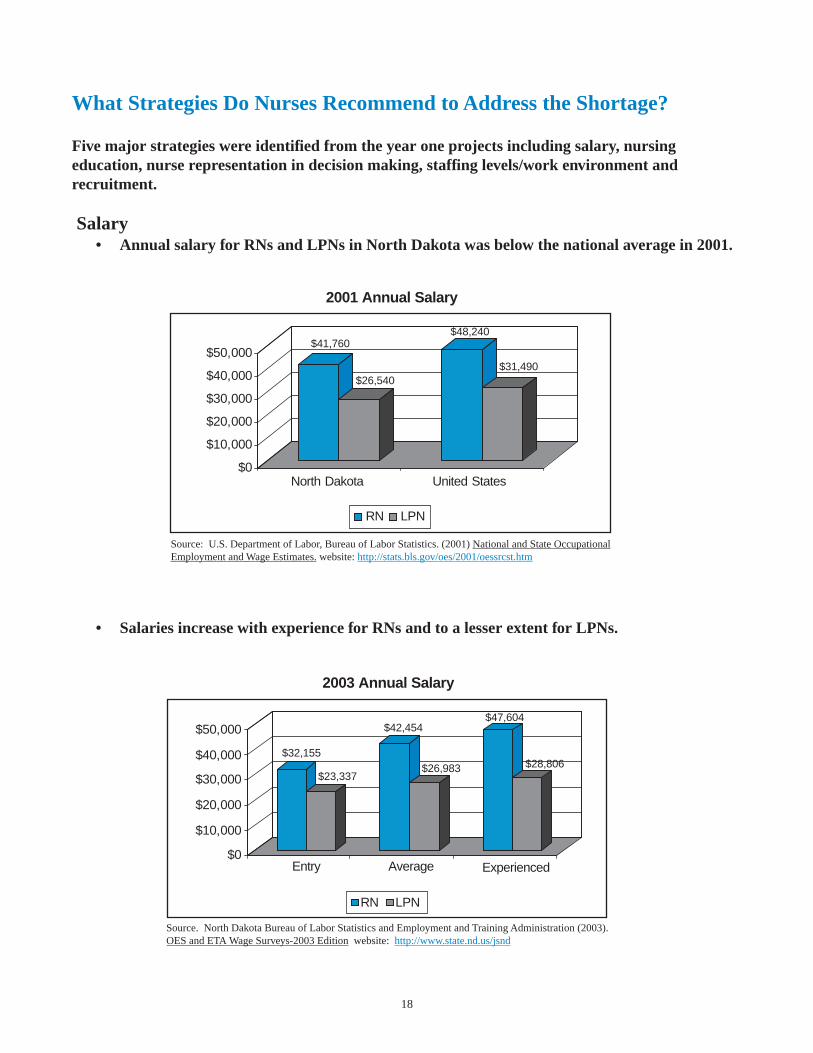
Salary• Annual salary for RNs and LPNs in North Dakota was below the national average in 2001.
• Salaries increase with experience for RNs and to a lesser extent for LPNs.
Source: U.S. Department of Labor, Bureau of Labor Statistics. (2001) National and State OccupationalEmployment and Wage Estimates. website: http://stats.bls.gov/oes/2001/oessrcst.htm
Source. North Dakota Bureau of Labor Statistics and Employment and Training Administration (2003).OES and ETA Wage Surveys-2003 Edition website: http://www.state.nd.us/jsnd
$41,760
$26,540
$48,240
$31,490
$0
$10,000
$20,000
$30,000
$40,000
$50,000
North Dakota United States
2001 Annual Salary
RN LPN
2003 Annual Salary
$0
$10,000
$20,000
$30,000
$40,000
$50,000
$32,155
$23,337
$42,454
$26,983
$47,604
$28,806
Entry Average Experienced
RN LPN

19
• 44% of a North Dakota sample of LPNs reported a gross income from their nursing positionsbetween $20,001 and $30,000. Most of these nurses were in rural and semi-rural areas.
• 28% of a North Dakota sample of RNs reported a gross income between $30,001-$40,000 withmost from urban and semi-rural settings. The average annual salary is $46,782 nationwide forRNs (Spratley et al., 2000).
Source: North Dakota Nursing Needs Study: Licensed Nurse Survey Results (2003)
Source: North Dakota Nursing Needs Study: Licensed Nurse Survey Results (2003).
LPN Gross Income from Nursing Position
3%
5%
23%
44%
14%
5%
3%
0.40%
2%
0.80%
0.40%
0.40%
0% 10% 20% 30% 40% 50%
More than $100,000
$90,001-$100,000
$80,001-$90,000
$70,001-$80,000
$60,001-$70,000
$50,001-$60,000
$40,001-$50,000
$30,001-$40,000
$20,001-$30,000
$10,001-$20,000
$5,001-$10,000
$0-$5,000
Percentage
11%
2%6%
17%28%
4%3%
2%1%
2%
10%20%
0% 10% 20% 30% 40% 50%
RN Gross Income from Nursing Position
More than $100,000$90,001-$100,000$80,001-$90,000$70,001-$80,000$60,001-$70,000$50,001-$60,000$40,001-$50,000$30,001-$40,000$20,001-$30,000$10,001-$20,000$5,001-$10,000
$0-$5,000
Percentage
20
• Improved salary and benefits is viewed as an important strategy to address the nursing shortage.This strategy was identified across a number of the Nursing Needs surveys.
More specifically:
– When asked to rank various solutions according to their impact on a nursing shortage, 81%of LPNs, 77% of RNs and 78% of Advanced Practice nurses indicated that improvedbenefits and pay were very important in alleviating a shortage (North Dakota NursingNeeds Study: Licensed Nurse Survey Results, 2003).
– 71% of nursing program faculty also indicated that improved wages and benefits wereof high importance in alleviating a nursing shortage (North Dakota Nursing Needs Study:Faculty Survey Results, 2003).
– 45% of nurses felt that paying nurses a wage comparable to others with similareducation and responsibilities would help to alleviate the nursing shortage (NorthDakota Nursing Needs Study: Licensed Nurse Survey Results & Licensed Nurse FocusGroup Results, 2003).
– 43% of Directors of Nursing and healthcare facility administrators suggested thatsalary and benefits should increase to become competitive with other states. Facilities inrural areas have a very difficult time recruiting and retaining nurses due to the combination oflower wages and fewer amenities. Also, pay differentials for weekends and other lessdesirable shifts were suggested. Many respondents thought that increased benefits, beyondsalary increases, is a key strategy to bolster job satisfaction. Benefits suggested include sign-on bonuses, tuition assistance and loan repayment programs (North Dakota Nursing NeedsStudy: Facility Survey Results, 2003).
– 45% of nursing students recommended increasing the amount of pay. Several studentsfelt that increased pay would lead to decreased shortage and thereby lighten workload,leading to a better work environment. 41% of nursing students suggested improving benefitssuch as bonuses, career ladder programs, more travel programs, more opportunities for LPNs,pay raises and a North Dakota-wide wage and benefits scale that is reflective of work (NorthDakota Nursing Needs Study: Student Focus Group Results, 2003).
21
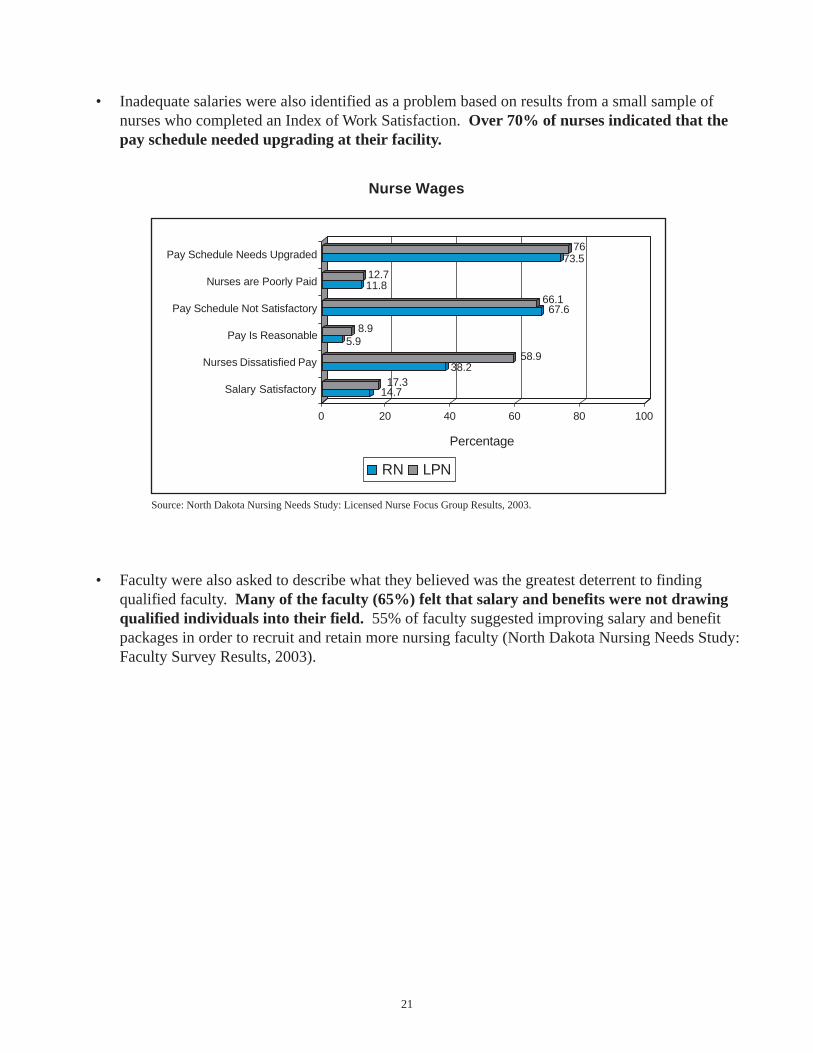
• Inadequate salaries were also identified as a problem based on results from a small sample ofnurses who completed an Index of Work Satisfaction. Over 70% of nurses indicated that thepay schedule needed upgrading at their facility.
• Faculty were also asked to describe what they believed was the greatest deterrent to findingqualified faculty. Many of the faculty (65%) felt that salary and benefits were not drawingqualified individuals into their field. 55% of faculty suggested improving salary and benefitpackages in order to recruit and retain more nursing faculty (North Dakota Nursing Needs Study:Faculty Survey Results, 2003).
Source: North Dakota Nursing Needs Study: Licensed Nurse Focus Group Results, 2003.
14.717.3
38.258.9
5.98.9
67.666.1
11.812.7
73.576
0 20 40 60 80 100
Percentage
Salary Satisfactory
Nurses Dissatisfied Pay
Pay Is Reasonable
Pay Schedule Not Satisfactory
Nurses are Poorly Paid
Pay Schedule Needs Upgraded
Nurse Wages
RN LPN
22
Nursing Education
Many states are exploring the expansion of nursing education programs in response to nursing shortages.A number of factors influence the ability to educate more nurses including adequate numbers of nursingfaculty, training opportunities in health care settings and classroom availability.
• Faculty were asked whether they thought they could increase the capacity of their educationprograms using current resources and if so, how many more students could be admitted eachyear. 37% of LPN program faculty indicated they could increase the number of studentsadmitted to their program by an average of 36 students per year. 33% of RN program facultythought they could increase student admissions by an average of 12 students per year. 41% ofAdvanced Practice/Graduate Education faculty thought they could increase student admissionsby an average of 23 students per year.
Faculty were also asked what factors prevented expanding admissions. 27% felt thatinadequate numbers of qualified faculty was the biggest constraint. 22% identified need formore clinical facilities as a limitation, while 10% cited the need for more physical classroom andoffice space. Lack of financial resources (7%), program flexibility (4%), and community andadministrative support (6%) were other noted restrictions (North Dakota Nursing Needs Study:Faculty Survey Results, 2003).
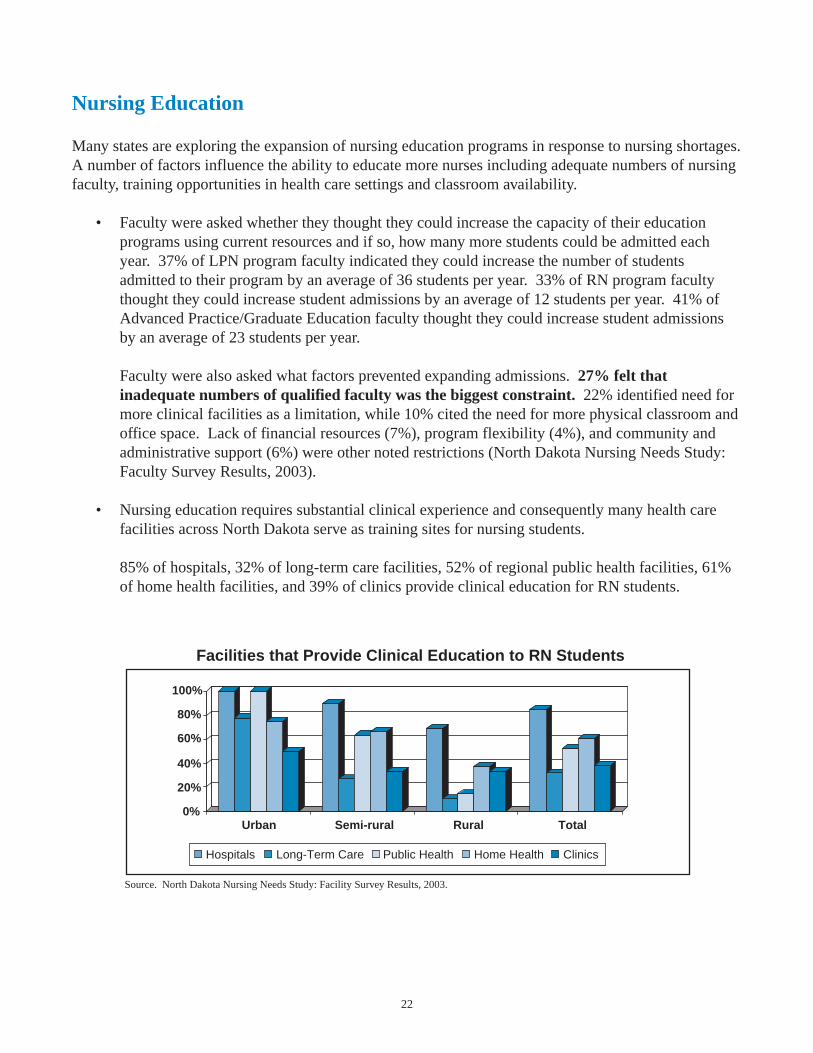
• Nursing education requires substantial clinical experience and consequently many health carefacilities across North Dakota serve as training sites for nursing students.
85% of hospitals, 32% of long-term care facilities, 52% of regional public health facilities, 61%of home health facilities, and 39% of clinics provide clinical education for RN students.
Source. North Dakota Nursing Needs Study: Facility Survey Results, 2003.
Facilities that Provide Clinical Education to RN Students
100%
80%
60%
40%
20%
0%Urban Semi-rural Rural Total
Hospitals Long-Term Care Public Health Home Health Clinics
23
Source. North Dakota Nursing Needs Study: Facility Survey Results, 2003.
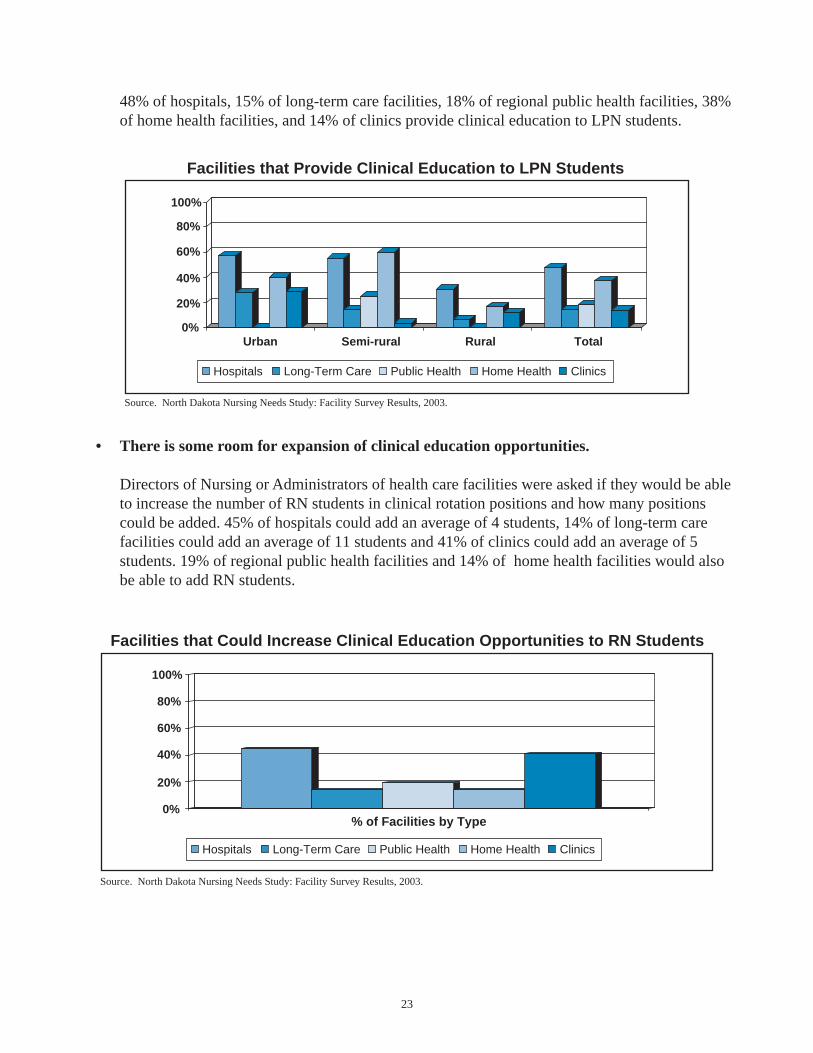
48% of hospitals, 15% of long-term care facilities, 18% of regional public health facilities, 38%of home health facilities, and 14% of clinics provide clinical education to LPN students.
• There is some room for expansion of clinical education opportunities.
Directors of Nursing or Administrators of health care facilities were asked if they would be ableto increase the number of RN students in clinical rotation positions and how many positionscould be added. 45% of hospitals could add an average of 4 students, 14% of long-term carefacilities could add an average of 11 students and 41% of clinics could add an average of 5students. 19% of regional public health facilities and 14% of home health facilities would alsobe able to add RN students.
Source. North Dakota Nursing Needs Study: Facility Survey Results, 2003.
% of Facilities by Type
Facilities that Could Increase Clinical Education Opportunities to RN Students
100%
80%
60%
40%
20%
0%
Hospitals Long-Term Care Public Health Home Health Clinics
Facilities that Provide Clinical Education to LPN Students
100%
80%
60%
40%
20%
0%
Hospitals Long-Term Care Public Health Home Health Clinics
Urban Semi-rural Rural Total
24
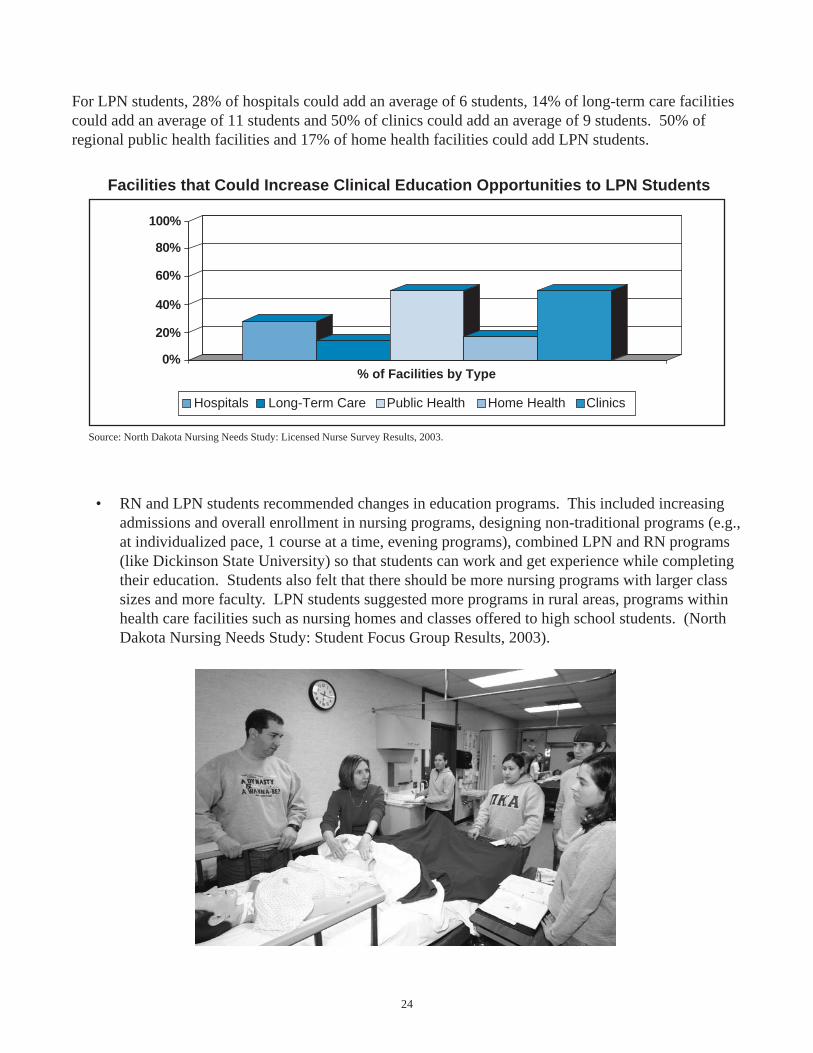
For LPN students, 28% of hospitals could add an average of 6 students, 14% of long-term care facilitiescould add an average of 11 students and 50% of clinics could add an average of 9 students. 50% ofregional public health facilities and 17% of home health facilities could add LPN students.
• RN and LPN students recommended changes in education programs. This included increasingadmissions and overall enrollment in nursing programs, designing non-traditional programs (e.g.,at individualized pace, 1 course at a time, evening programs), combined LPN and RN programs(like Dickinson State University) so that students can work and get experience while completingtheir education. Students also felt that there should be more nursing programs with larger classsizes and more faculty. LPN students suggested more programs in rural areas, programs withinhealth care facilities such as nursing homes and classes offered to high school students. (NorthDakota Nursing Needs Study: Student Focus Group Results, 2003).
Facilities that Could Increase Clinical Education Opportunities to LPN Students
100%
80%
60%
40%
20%
0%% of Facilities by Type
Hospitals Long-Term Care Public Health Home Health Clinicss
Source: North Dakota Nursing Needs Study: Licensed Nurse Survey Results, 2003.
25
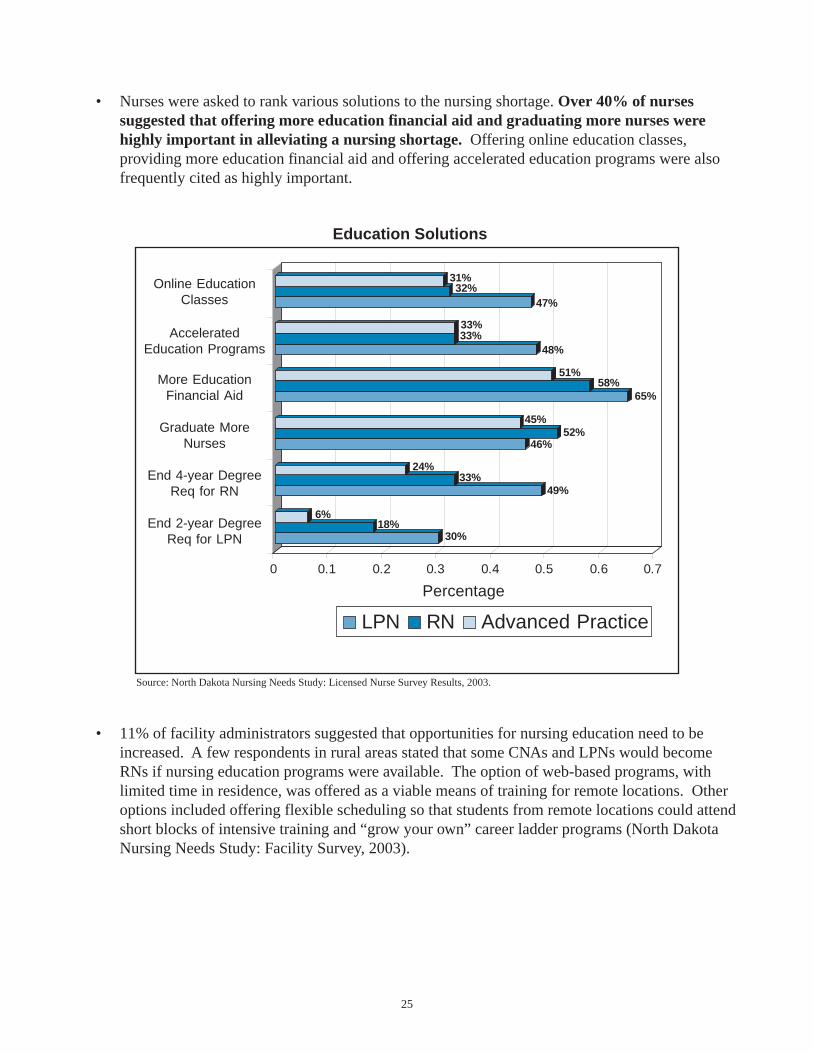
• Nurses were asked to rank various solutions to the nursing shortage. Over 40% of nursessuggested that offering more education financial aid and graduating more nurses werehighly important in alleviating a nursing shortage. Offering online education classes,providing more education financial aid and offering accelerated education programs were alsofrequently cited as highly important.
• 11% of facility administrators suggested that opportunities for nursing education need to beincreased. A few respondents in rural areas stated that some CNAs and LPNs would becomeRNs if nursing education programs were available. The option of web-based programs, withlimited time in residence, was offered as a viable means of training for remote locations. Otheroptions included offering flexible scheduling so that students from remote locations could attendshort blocks of intensive training and “grow your own” career ladder programs (North DakotaNursing Needs Study: Facility Survey, 2003).
Source: North Dakota Nursing Needs Study: Licensed Nurse Survey Results, 2003.
30%18%
6%
49%33%
24%
46%52%
45%
65%58%
51%
48%33%33%
47%32%
31%
0 0.1 0.2 0.3 0.4 0.5 0.6 0.7
Percentage
Online EducationClasses
AcceleratedEducation Programs
Graduate MoreNurses
End 4-year DegreeReq for RN
End 2-year DegreeReq for LPN
More EducationFinancial Aid
LPN RN Advanced Practice
Education Solutions
26
Nurse Representation in Decision Making
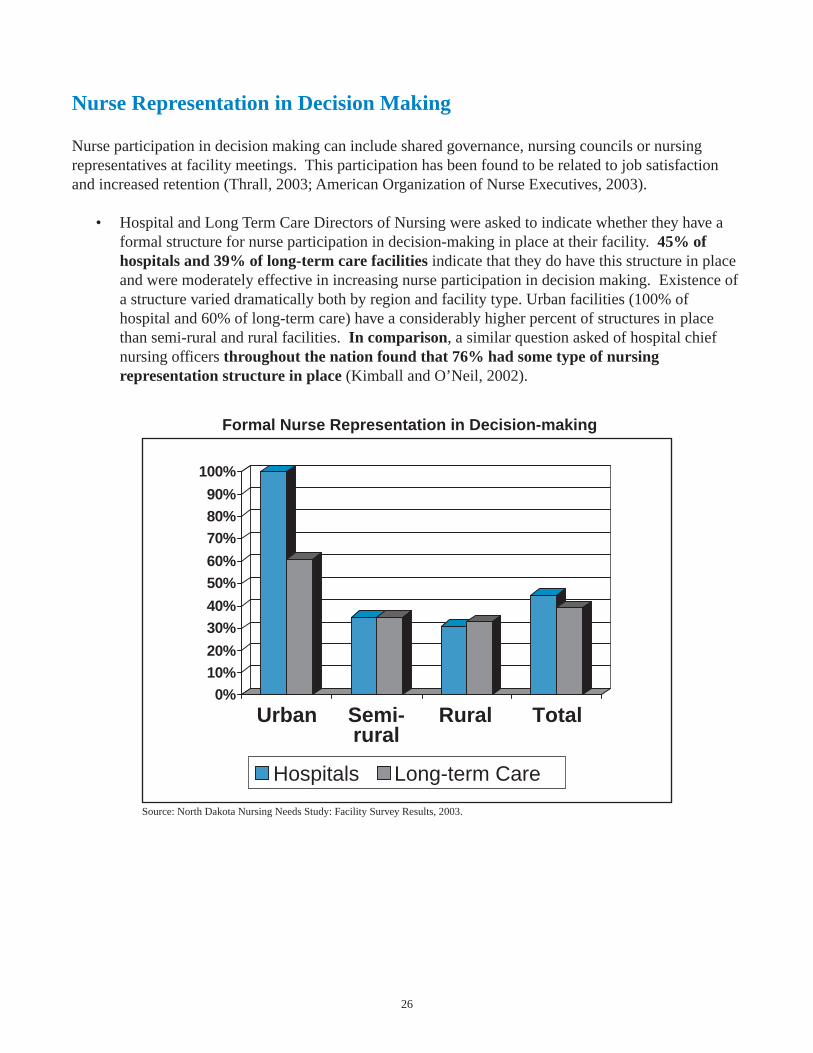
Nurse participation in decision making can include shared governance, nursing councils or nursingrepresentatives at facility meetings. This participation has been found to be related to job satisfactionand increased retention (Thrall, 2003; American Organization of Nurse Executives, 2003).
• Hospital and Long Term Care Directors of Nursing were asked to indicate whether they have aformal structure for nurse participation in decision-making in place at their facility. 45% ofhospitals and 39% of long-term care facilities indicate that they do have this structure in placeand were moderately effective in increasing nurse participation in decision making. Existence ofa structure varied dramatically both by region and facility type. Urban facilities (100% ofhospital and 60% of long-term care) have a considerably higher percent of structures in placethan semi-rural and rural facilities. In comparison, a similar question asked of hospital chiefnursing officers throughout the nation found that 76% had some type of nursingrepresentation structure in place (Kimball and O’Neil, 2002).
Source: North Dakota Nursing Needs Study: Facility Survey Results, 2003.
Formal Nurse Representation in Decision-making
0%10%20%
30%40%
50%60%
70%80%90%
100%
Urban Semi-rural
Rural Total
Hospitals Long-term Care

27
• A small sample of nurses were asked about the organizational policies at their healthcare facilityas part of an Index of Work Satisfaction. Less than 9% indicated that nurses participated indecision-making at their facility. Over 40% indicated that there is a gap between theadministration and daily problems within their facility.
• In focus group discussions, nurses were asked how responsive their employer is to nurses whenthey raise concerns or identify problems. Five out of 34 RNs and 7 out of 37 LPNs reported thattheir supervisors have listened to their concerns and were responsive and supportive. Nine out of34 RNs indicated that their employer’s responsiveness depends on how much money theresponse requires; if little or no money is involved they are very responsive. Ten out of 34 RNsand eleven out of 37 LPNs indicated that their supervisor is not responsive, that they experienceda feeling of “that is just how it is” (North Dakota Nursing Needs Study: Licensed Nurse FocusGroup Results, 2003).
Results of a published focus group study (Kimball and O’Neil, 2002) are similar to thesefindings. The majority could be grouped into two different perspectives. One group felt thatthere are opportunities for input and there administrators are empathetic but little action occurs.The second group felt that there is an expectation that they should do as they are told and thosethat do raise concerns are labeled troublemakers. Many nurses also felt that their managers(DON) have little influence with the administration.
Source: North Dakota Nursing Needs Study: Licensed Nurse Focus Group Results, 2003.
14. 716. 9
55. 140. 3
52. 946. 4
5.98.9
17. 632. 7
17. 617. 817. 617. 8
0 1 0 2 0 3 0 4 0 5 0 6 0 7 0 8 0 9 0 1 0 0
Percentage
Administrators Consult Staff
Participate in Planning
Administration Interferes with Patient Care
Nurse Participation in Decision-making
Lack of Advancement Opportunities
Administration Gap
Scheduling
RN LPN
Nurse Organizational Policies
28
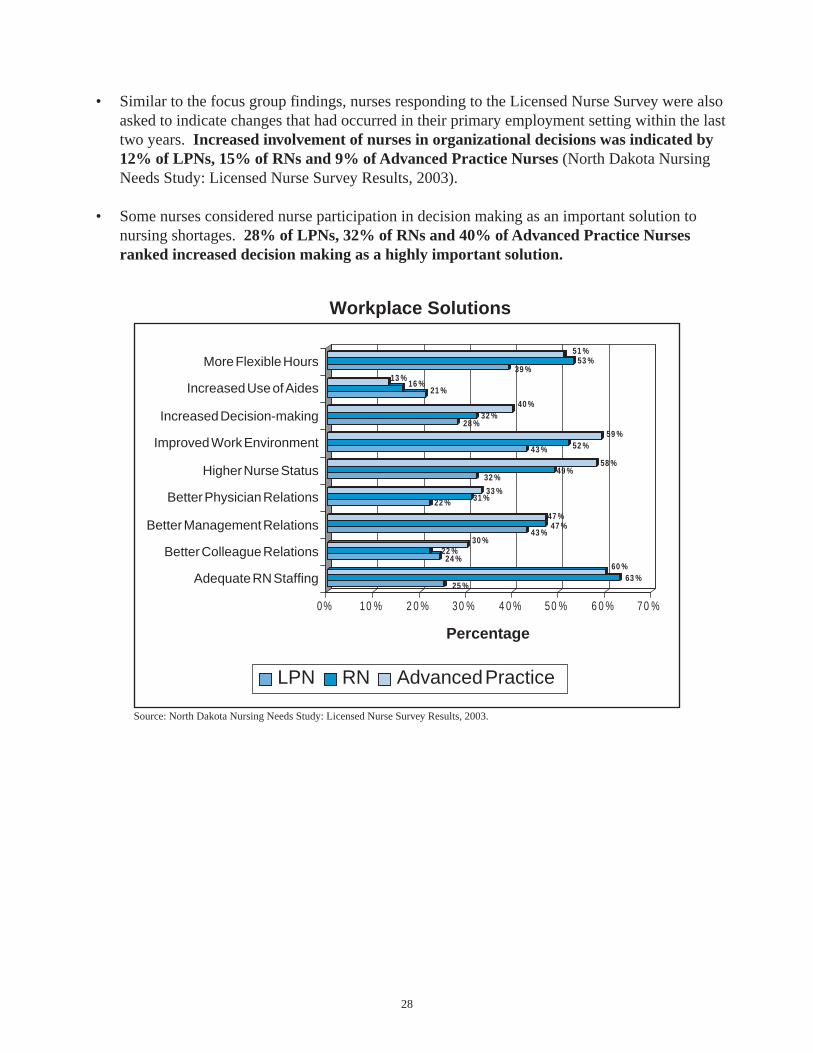
• Similar to the focus group findings, nurses responding to the Licensed Nurse Survey were alsoasked to indicate changes that had occurred in their primary employment setting within the lasttwo years. Increased involvement of nurses in organizational decisions was indicated by12% of LPNs, 15% of RNs and 9% of Advanced Practice Nurses (North Dakota NursingNeeds Study: Licensed Nurse Survey Results, 2003).
• Some nurses considered nurse participation in decision making as an important solution tonursing shortages. 28% of LPNs, 32% of RNs and 40% of Advanced Practice Nursesranked increased decision making as a highly important solution.
Source: North Dakota Nursing Needs Study: Licensed Nurse Survey Results, 2003.
25 %63 %
60 %24 %
22 %30 %
43 %47 %
47 %
22 % 31 %33 %
32 %49 %
58 %
43 % 52 %59 %
28 %32 %
40 %
21 %16 %
13 %39 %
53 %51 %
0% 10 % 2 0 % 30 % 4 0 % 50 % 6 0 % 70 %
Percentage
More Flexible Hours
Increased Use of Aides
Increased Decision-making
Improved Work Environment
Higher Nurse Status
Better Physician Relations
Better Management Relations
Better Colleague Relations
Adequate RN Staffing
Workplace Solutions
LPN RN Advanced Practice
29
Staffing Levels and Work Environment
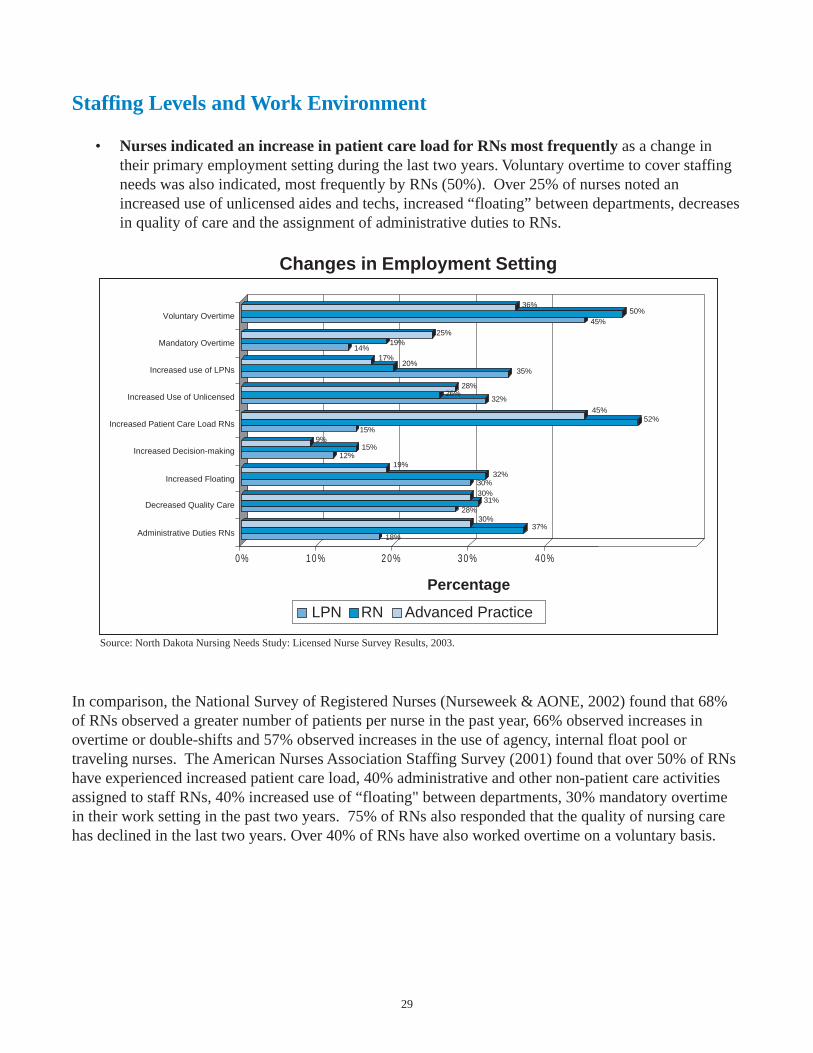
• Nurses indicated an increase in patient care load for RNs most frequently as a change intheir primary employment setting during the last two years. Voluntary overtime to cover staffingneeds was also indicated, most frequently by RNs (50%). Over 25% of nurses noted anincreased use of unlicensed aides and techs, increased “floating” between departments, decreasesin quality of care and the assignment of administrative duties to RNs.
In comparison, the National Survey of Registered Nurses (Nurseweek & AONE, 2002) found that 68%of RNs observed a greater number of patients per nurse in the past year, 66% observed increases inovertime or double-shifts and 57% observed increases in the use of agency, internal float pool ortraveling nurses. The American Nurses Association Staffing Survey (2001) found that over 50% of RNshave experienced increased patient care load, 40% administrative and other non-patient care activitiesassigned to staff RNs, 40% increased use of “floating" between departments, 30% mandatory overtimein their work setting in the past two years. 75% of RNs also responded that the quality of nursing carehas declined in the last two years. Over 40% of RNs have also worked overtime on a voluntary basis.
Source: North Dakota Nursing Needs Study: Licensed Nurse Survey Results, 2003.
18%37%
30%28%
31%30%30%
32%19%
12%15%
9%15%
45%
32%26%
28%
35%20%
17%14%
19%25%
45%
36%
Percentage
Voluntary Overtime
Mandatory Overtime
Increased use of LPNs
Increased Use of Unlicensed
Increased Patient Care Load RNs
Increased Decision-making
Increased Floating
Decreased Quality Care
Administrative Duties RNs
Changes in Employment Setting
LPN RN Advanced Practice
50%
52%
0% 10% 20% 30% 40%
30
• Directly relevant to retaining nurses in the workplace, 41% of LPNs, 43% of RNs and 26% ofAdvanced Practice Nurses indicated that adequate staffing levels would encourage them towork for more years (North Dakota Nursing Needs Study: Licensed Nurse Survey, 2003).
• Surprisingly, nursing students articulated observations about the nature and environment inwhich nurses work that parallel observations by seasoned nurses. 48% of RN and 47% of LPNstudents thought that improving the work environment would result in better retention andjob satisfaction. Problems with the work environment identified by nursing students includedtoo many patients assigned to a nurse resulting in increased stress and less direct patient care, astressful work environment, staffing concerns including working long shifts and mandatory stays,a physically demanding work environment, excessive paperwork and exposure to infectiousdiseases (North Dakota Nursing Needs Study: Student Focus Group Results, 2003).
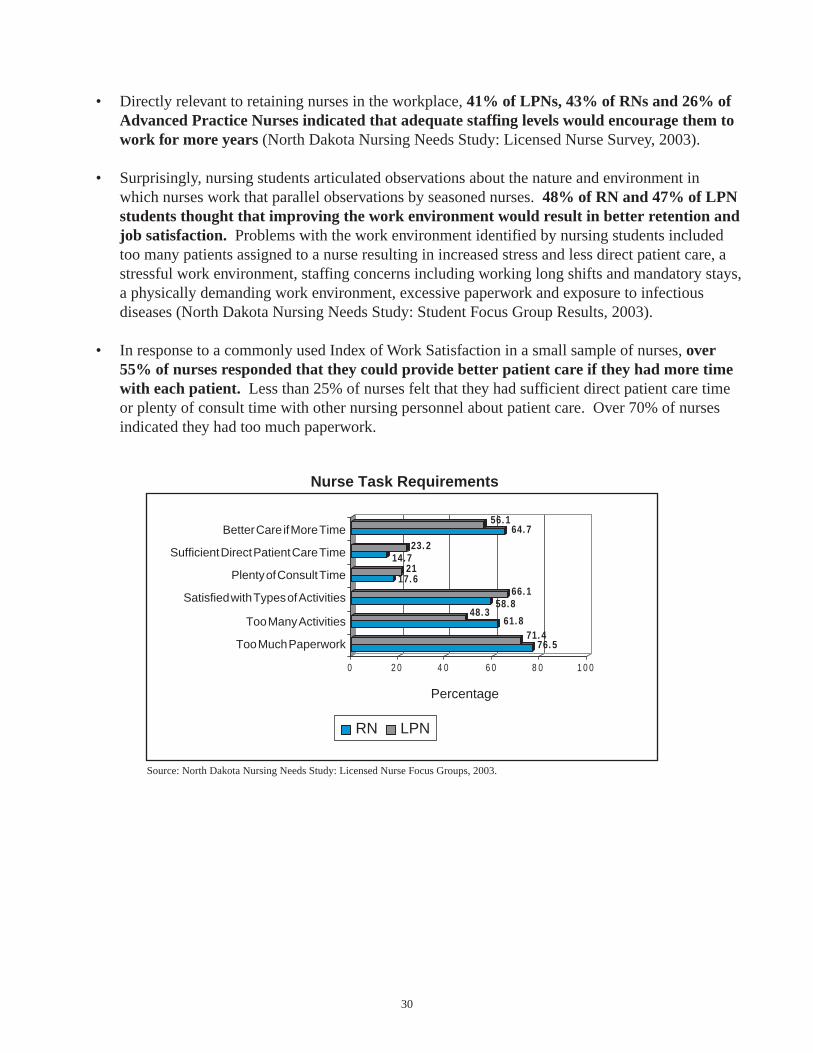
• In response to a commonly used Index of Work Satisfaction in a small sample of nurses, over55% of nurses responded that they could provide better patient care if they had more timewith each patient. Less than 25% of nurses felt that they had sufficient direct patient care timeor plenty of consult time with other nursing personnel about patient care. Over 70% of nursesindicated they had too much paperwork.
Source: North Dakota Nursing Needs Study: Licensed Nurse Focus Groups, 2003.
76. 571. 4
61. 848. 3
58. 866. 1
17. 621
14. 723. 2
64. 756. 1
0 2 0 4 0 6 0 8 0 1 0 0
Percentage
Better Care if More Time
Sufficient Direct Patient Care Time
Plenty of Consult Time
Satisfied with Types of Activities
Too Many Activities
Too Much Paperwork
Nurse Task Requirements
RN LPN
31
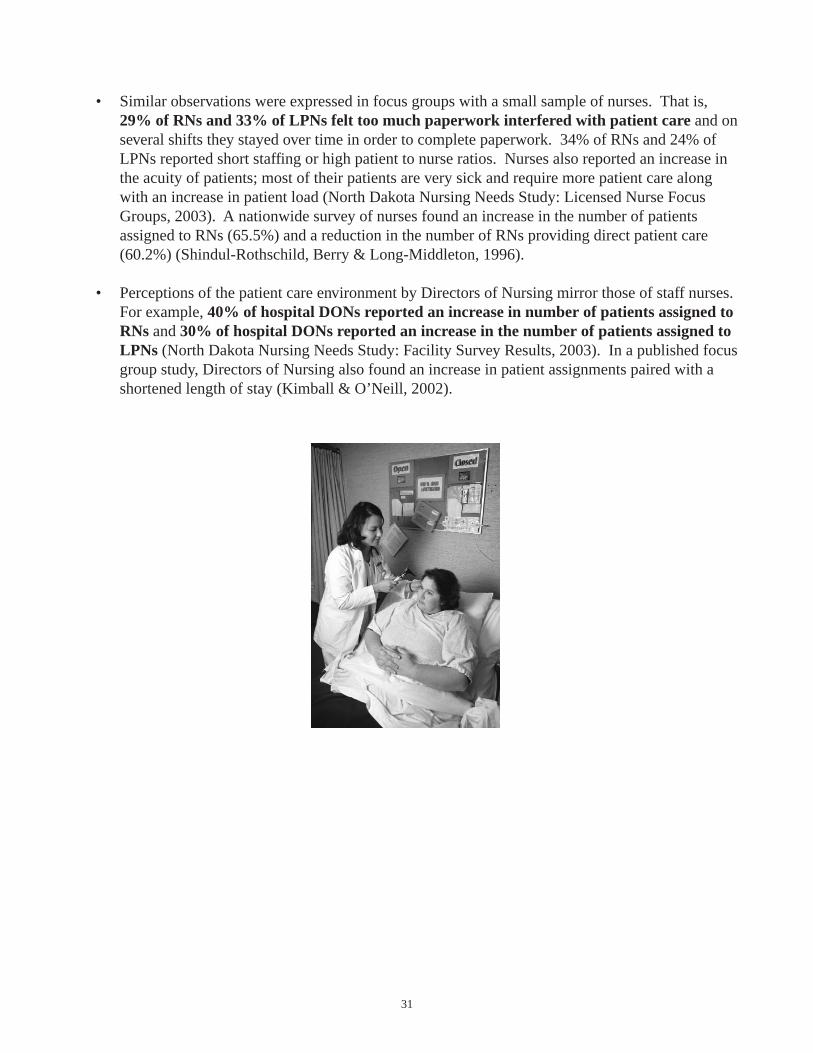
• Similar observations were expressed in focus groups with a small sample of nurses. That is,29% of RNs and 33% of LPNs felt too much paperwork interfered with patient care and onseveral shifts they stayed over time in order to complete paperwork. 34% of RNs and 24% ofLPNs reported short staffing or high patient to nurse ratios. Nurses also reported an increase inthe acuity of patients; most of their patients are very sick and require more patient care alongwith an increase in patient load (North Dakota Nursing Needs Study: Licensed Nurse FocusGroups, 2003). A nationwide survey of nurses found an increase in the number of patientsassigned to RNs (65.5%) and a reduction in the number of RNs providing direct patient care(60.2%) (Shindul-Rothschild, Berry & Long-Middleton, 1996).
• Perceptions of the patient care environment by Directors of Nursing mirror those of staff nurses.For example, 40% of hospital DONs reported an increase in number of patients assigned toRNs and 30% of hospital DONs reported an increase in the number of patients assigned toLPNs (North Dakota Nursing Needs Study: Facility Survey Results, 2003). In a published focusgroup study, Directors of Nursing also found an increase in patient assignments paired with ashortened length of stay (Kimball & O’Neill, 2002).

32
Recruitment
A number of strategies are utilized across the nation to encourage individuals to pursue nursing careers.These include strategies to increase the number of men, minorities, single mothers, workers displacedfrom other professions and older individuals (Kimball & O’Neil, 2002).
• As part of focus group discussions, 20% of RNs and 3% of LPNs suggested increasedrecruitment efforts including having more job fairs, high school certified nursing assistant(CNA) programs, nursing camps for kids, aptitude testing in high schools, educating careercounselors, and exposing junior high or younger children to the nursing field (North DakotaNursing Needs Study: Licensed Nurse Focus Groups, 2003).
• 40% of faculty recommended increased recruiting efforts and promotion of nursingprograms (North Dakota Nursing Needs Study: Faculty Survey Results, 2003).
• In focus group discussions, 29% of RN and 33% of LPN students felt that improving theimage of nursing was important in promotion and recruitment. Suggestions includedportrayal of male nurses in commercials, posters and television programs, making people awareof availability of many different types of nursing opportunities, and portraying the nursingprofession in a more positive fashion (i.e., less focus on impending shortages). Students alsosuggested that LPN level nurses should be included in advertising (e.g., commercials andposters). (North Dakota Nursing Needs Study: Student Focus Group Results, 2003).
In particular, nursing students indicated that the nursing profession should be promoted tostudents in elementary through high school. Suggestions included:– Have nurses visit elementary school classes to expose children early to the nursing profession
and continue this exposure in high school with career fairs (nurses representing a variety offields).
– Health career classes in which students could receive CNA training or "job shadow" nurses togain exposure.
– Tours of healthcare facilities including nursing homes.
A few students felt that high school counselors should receive training so they could encouragestudents to go into a wide variety of nursing fields and increases in the availability of schoolnurses would lead to more student exposure to the nursing field (North Dakota Nursing NeedsStudy: Student Focus Group Results, 2003).
33
Why Choose Nursing?
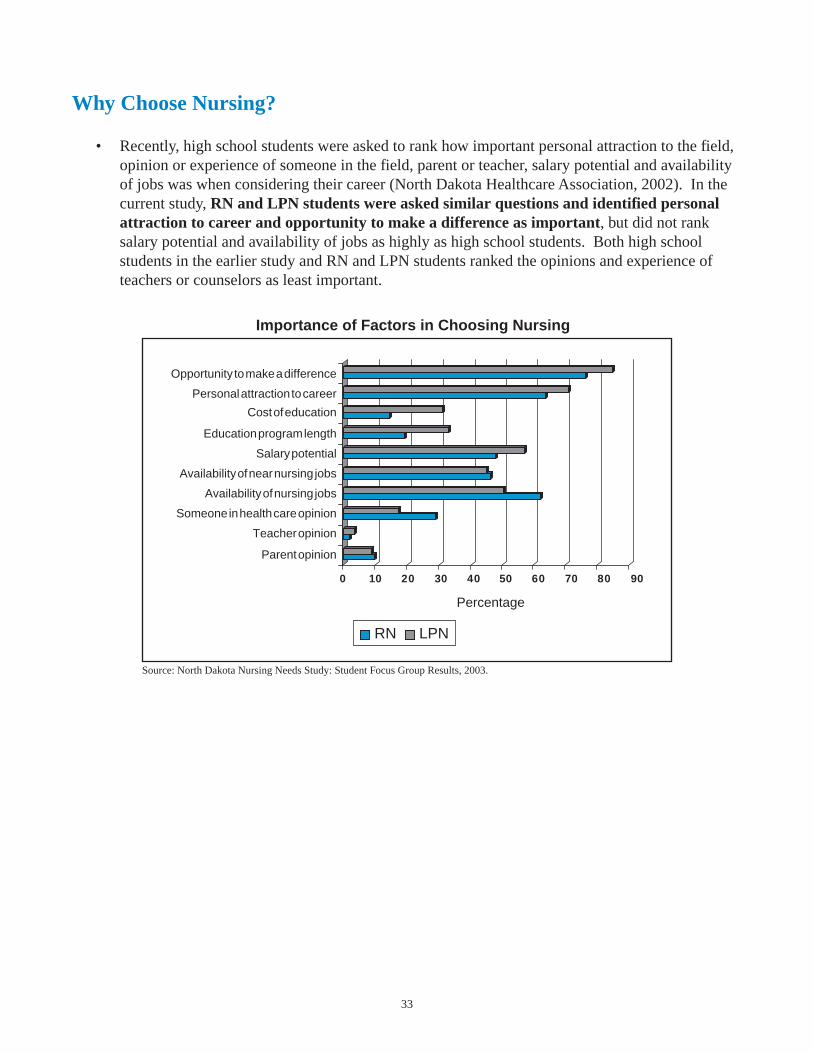
• Recently, high school students were asked to rank how important personal attraction to the field,opinion or experience of someone in the field, parent or teacher, salary potential and availabilityof jobs was when considering their career (North Dakota Healthcare Association, 2002). In thecurrent study, RN and LPN students were asked similar questions and identified personalattraction to career and opportunity to make a difference as important, but did not ranksalary potential and availability of jobs as highly as high school students. Both high schoolstudents in the earlier study and RN and LPN students ranked the opinions and experience ofteachers or counselors as least important.
Source: North Dakota Nursing Needs Study: Student Focus Group Results, 2003.
0 10 20 30 40 50 60 70 80 90
Importance of Factors in Choosing Nursing
RN LPN
Percentage
Opportunity to make a difference
Personal attraction to career
Cost of education
Education program length
Salary potential
Availability of near nursing jobs
Availability of nursing jobs
Someone in health care opinion
Teacher opinion
Parent opinion
34
Conclusions
The following conclusions are based on findings from year one of the North Dakota Nursing NeedsStudy.
1. Increase salary and benefits to reflect training and experience for both clinical nurses andnursing faculty.
2. Increase the number of students admitted to nursing education programs and offerdistance learning or alternative programs.
3. Improve the work environment by increasing nursing representation in decision making.
4. Adjust staffing levels to allow for more direct patient care and a less stressful workenvironment.
5. Increase recruitment efforts in order to increase interest in the nursing field.

35
References
AHA Commission on Workforce for Hospital and Health Systems (2002). In Our Hands: How HospitalLeaders Can Build a Thriving Workforce. Chicago: American Hospital Association.
American Nurses Association (2001) Analysis of American Nurses Association Staffing Survey.Cornerstone Communications Group: Warwick, RI.
American Organization of Nurse Executives (2003). Healthy Work Environments: Striving forExcellence, Volume II. Insights from a Key Informant Survey on Nursing Work EnvironmentImprovement and Innovation. McManis & Monslave Associates: Manasses Virginia.
HSM Group. (2002). Acute Care Hospital Survey of RN Vacancy and Turnover Rates. AmericanAssociation of Nurse Executives.
Job Service of North Dakota (2001). Employment Projections 1998-2008. Bismarck, ND.
Job Service of North Dakota (2003). Employment Projections 2000-2010. Bismarck, ND.
Kimball, B. & O’Neil, E. (2002). Health Care’s Human Crisis: The American Nursing Shortage.Robert Wood Johnson Foundation Health Workforce Solutions.
North Dakota Bureau of Labor Statistics and Employment and Training Administration (2003). OESand ETA Wage Surveys- 2003 Edition. Website: www.state.nd.us/jsnd
North Dakota Board of Nursing (2001). Annual Report Bismarck, ND.
North Dakota Board of Nursing (2002). Annual Report Bismarck, ND.
North Dakota Board of Nursing (2002). Annual Report for North Dakota’s Nursing EducationPrograms. Bismarck, ND
North Dakota Board of Nursing (2003). Data obtained from Nursing Licensure Database.Bismarck, ND
North Dakota Healthcare Association (2002). Glossary of Health Care Terms, 3rd Edition.
North Dakota Healthcare Association (Feb.-Apr 2002). Healthcare Career Perceptions High SchoolStudent Survey. Bismarck, ND.
Nurseweek & AONE (2002). National Survey of Registered Nurses. Harris Interactive.
Nursing’s Agenda for the Future Steering Committee (2002). A Call to the Nation: Nursing World:Washington, D.C.

36
Prescott. P. (2000). The Enigmatic Nursing Workforce. Journal of Nursing Administration. Volume 30.
Shindul-Rothschild, J., Berry, D. & Long-Middleton, E. (1996). Where have all the nurses gone? Finalresults of our patient care survey. American Journal of Nursing, 96. 25-39.
Spratley, E., Johnson, A., Sochalski, J., Fritz, M. & Spencer, W. (2000). The Registered NursePopulation: Findings from the National Sample Survey of Registered Nurses. U.S. Department ofHealth and Human Services, Health Resources and Services Administration, Bureau of HealthProfessions, Division of Nursing: Washington D.C.
Thrall, Terese. (2003). Work Redesign. Hospital and Health Networks, March. p. 34-40.
U.S. Census Bureau (2000). Population Estimates U.S. Department of Commerce, Economics andStatistics Administration.
U.S. Department of Health and Human Services. (March, 2000). Employed Nurses per 100,000Population. Bureau of Health Professions, National Center for Health Workforce Information andAnalysis: Washington, D.C.
U.S. Department of Health and Human Services. (2000). HRSA State Health Workforce Data ResourceGuide. Bureau of Health Professions, National Center for Health Workforce Information and Analysis:Washington, D.C.
U.S. Department of Health and Human Services. (March, 2000). Projected Supply, Demand andShortages of Registered Nurses: 2000-2010. Bureau of Health Professions, National Center for HealthWorkforce Information and Analysis: Washington, D.C.
U.S. Department of Health and Human Services. (2000). Nursing Shortage Counties. Bureau of HealthProfessions. Website: bhpr.hrsa.gov/nursing/shortage.htm
U.S. Department of Labor (2001). National and State Occupational Employment and Wage Estimates.Bureau of Labor Statistics. Website: stats.bls.gov/oes/2001/oessrcst.htm
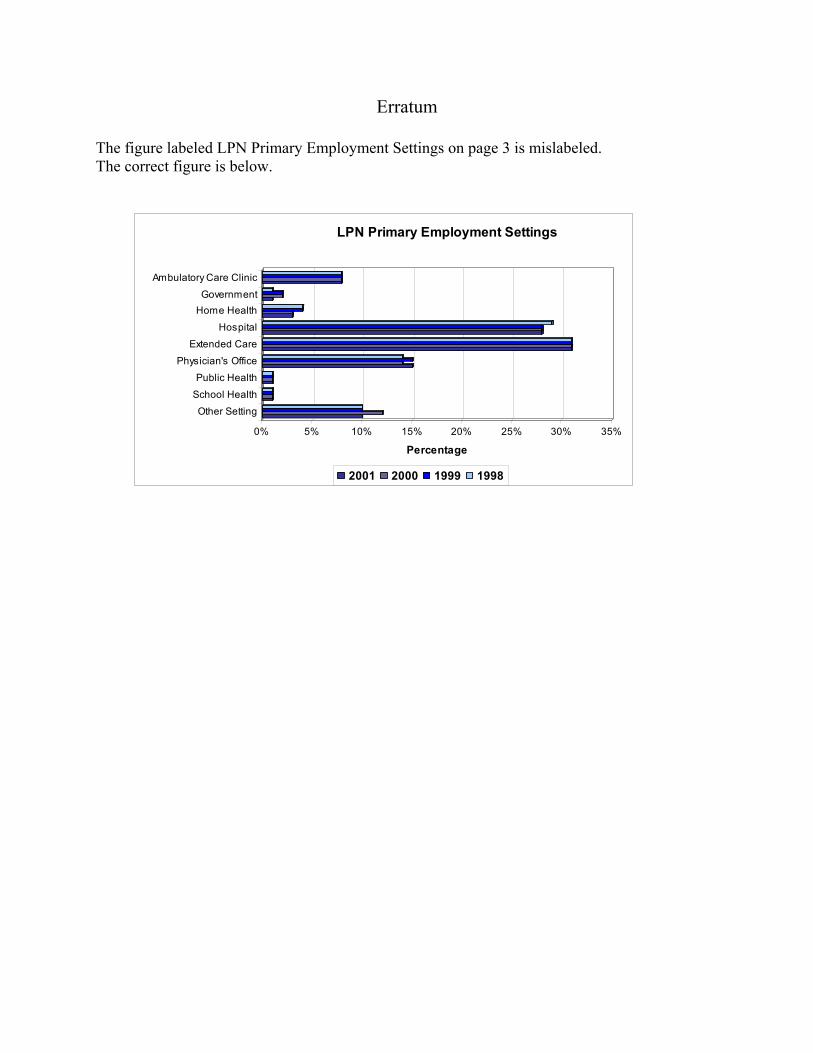
Erratum
The figure labeled LPN Primary Employment Settings on page 3 is mislabeled. The correct figure is below.
0% 5% 10% 15% 20% 25% 30% 35%
Percentage
Ambulatory Care Clinic
GovernmentHome Health
Hospital
Extended Care
Physician's OfficePublic Health
School Health
Other Setting
LPN Primary Employment Settings
2001 2000 1999 1998