Embed Size (px)
Citation preview

Indian Journal of Radio & Space Physics Vol. 28, August 1999, pp. 170-176
Characteristics of cloud drop spectra on rain and non-rain occasions
S K Paul Indian Institute of Tropical Meteorology, Pune 411 008
Received 5 April 1999. accepted 3 May 1999
Measurements on drop size spectra were made in cumulus clouds over Pune (inland) region on a large number of days during the summer monsoon seasons. The measurements of the cloud drop spectra on the days with rain and with no rain in the experimental area made in 1976, 1979 and 1980 (the rain being observed within the clouds) have been studied . The average spectra were broader and concentration of drops with diameter > 50 Jl m (Nd. liquid water content (LWC). mean volume diameter (MVD) and di spersion were found to be greater on the days with rain as compared to those on the days with no rain . Total concentration (NT) and concentration of drops < 20 '.un (Ns) were lower on the occas ions of rain with respect to those of no rain . The average drop size distributions were bimodal on the days with rain, while they were unimodal on the days with no rain. The variations of cloud drop spectra preceding the rain. at the initia l stage of rain and fo llowing the rain are di scussed .
1 Introduction
A knowledge of cloud drop size distribution is important for the study of cloud physics, cloud development and rain formation. The processes which determine droplet size ci istribution in cumulus clouds are not completely understood although CCN spectrum and the entrainment between the cloud and the surrounding clear air are known to be important factors ' . Weickmann and Aufm Kampe2 showed drop
size spectra ranging from 6 to 66 J.lm diameter in fair
weather cumulus clouds and from 6 to 200 J.lm in cumulonimbus clouds . Squires1 obtained drop spectra
of 4-92 J.lm and 4-165 J.lm diameter in dark stratus and Hawaiian orographic clouds, respectively. SkhirtTadze4 measured drops in the diameter range 2-
70 J.lm by photoelectric counter in cumulus clouds' over Cuba. Cloud droplet spectra were also measured with a forward scattering spectrometer probe
,,5. The
onset of precipitation in continental clouds containing a high nucleus concentration may be considerably accelerated, if the collectt ion efficiencies are increased by small-scale atmosphl~ric turbulence6
. The growth rate of rain drops during fall depends upon the cloud type which, in turn, is determined by the vertical wind shear7
. Takahashi et al.s observed that the summits of trade wind cumuli are regions of active raindrop growth .
In an earlier study, Paul and Pillai9 obtained broader droplet spectra ovei the Pune (in land) region than over the Arabian sea, and this was mentioned to be due to the presence of an industrial complex belt
upwind of the experimental site at Pune. In this paper, a comparative study of the cloud drop spectra in rain and non-rain situations and also at different stages of rain over the same region has been made .
2 Measurements Measurements on drop size spectra were made In
cumulus clouds from a DC-3 a ircraft at different levels over Pune (Iat. 18°32'N , long. 73 °5I'E, 559 m MSL) region during different summer monsoon seasons in the courses of warm cloud seeding experiments. The experimental s ite near Pune is about 150 km from the nearest west coast on the Arabian sea and is situated on the lee side of the Western Ghats. Winds are mostly westerly at different levels during the summer monsoon. The clouds over the Pune region are modified maritime during the period of observations. During the monsoon, the winds usually come from the Arabian sea and on the way get modified due to the presence of an industrial complex beltq. In this paper, the measurements on the drop size spectra in cumulus clouds (1-3 km thick) made in the years 1976, 1979 and 1980 on the days with rain in the experimental area have been compared with those on the days with no rain in the said area, the occurrence/non-occurrence of rain being noticed visually within the clouds on board the aircraft. The cloud-base level was about 1400 m MSL. ]n general , the measurements were made at 400 - 600m above the cloud-base and the samples were collected towards the centre of a horizontal cross-section of the cloud . For 24-h rainfall for each day, the average of
-'

PAUL : CLOUD DROP SPECTRA ON RAIN & NON-RAIN OCCASIONS 171
measurements from 40 raingauges in the experimental area of 40 km x 40 km was considered. The network of raingauges was installed in connection with warm cloud seeding experiments in the area lO
. On the days with rain, 37 samples were collected from 24 clouds for II days, while on the days with no rain, 27 samples were collected from 23 clouds for I I days. On a given day. cloud drop samples were usually collected from two or three neighbouring cumulus clouds or from clouds of the same cumulus cluster.
A mechanical semi-automatic cloud drop samplerll
containing magnesium oxide coated glass slides of size 3.5 cm x 0.6 cm (holder size 4.4 cm x 1.0 cm) was used for sampling the cloud drops. Each slide was exposed for 14.8 m s in the cloud at an impact
· 1 speed of 54 m s The crater sizes were measured using an optical microscope of magnification 80X and 400X for cloud drop sizes > 20 Jlm and < 20Jlm, respectively. The exposure was made in cloud air in a position away (about 50 cm) from the aircraft. The volume of cloud sampled for each exposure was about
300 cm3
. True drop sizes were obtained from proper calibrations, made earlier, of the ratio of actual to crater size for different cloud drop sizes in the oxide layer (15-20 Jlm thick). The craters in the oxide film with mean diameters 11.5, 34.5, 58.5, 84.8, 112.9, 149.1 and.241.2 Jlm corresponded to cloud drops of mean diameters 5.7, 16.1,25.7, 35 .2, 44 .8,57.4 and 90.0 Jlm, respectively. The details of calibrations were reported elsewhere12
. Corrections were made in respect of collection efficiencies for different drop sizes13
. The collection efficiencies were 43%, 73%, 85%, 93%, 98% and 100% for cloud drops of diameters 4 Jlm, 7Jlm, 10Jlm, 14Jlm, 18Jlm and > 18Jlm, respectively, at a true air speed of 54 m S- I.
3 Results and discussion The heights referred to in this paper are above the
mean sea level and the cloud drop sizes are in diameters. The standard deviations are shown in Figs. I and 2 and Tables I and 2. Microphysical parameters such as maximum size (MS), total cloud drop concentration (NT) , concentration of drops with diameter greater than 50 Jlm (N
L), concentration of
drops with diameter less than 20 Jlm (Ns) , liquid water content (L WC), mean volume diameter (MVD) and dispersion of drops were computed from the cloud drop size spectra. The term ' maximum size' here means the maximum drop diameter out of all the samples in a given set of data I:tnder study. The term
'dispersion' is the ratio of the standard deviation of the drop size distribution to the arithmetic mean of the same distribution . The values given in this paper for all the parameters are average values.
3.1 Variation of cloud drop spectra on the days with rain/no rain as observed within the clouds from the aircraft
During the hours of sampling, on certain days, sometimes rain was visually noticed on board the aircraft, within some clouds in the flight path, in the experimental area. The occurrence of rain could also be detected by the hitting sound of the rain drops falling from above and their splashing on the wind shield of the aircraft. However, at a given instant, one part of the cloud (that was sampled) was raining, while the other parts of the same cloud might be or might not be raining. The average cloud drop spectra on the days with rain and with no rain as observed within the clouds, in the experimental area, are presented in Fig. I . On the two occasions, nearby dates are compared. The values of the cloud physical parameters are given in Table I.
The maximum size (130 Jlm) on the days with rain was much greater than that (80 Jlm) on the days with no rain. The mean distribution in the former case was bimodal (primary and secondary peaks at 3 Jlm and 10 Jlm radius, respectively), while in the other case it was unimodal (peak at 3 Jlm). The bimodal distribution suggests the growth of some drops by coalesence process. The said drops grew by collisioncoalescence of smaller sized drops to the size hav ing the secondary peak concentration. Almost all maritime and some continental stratocumulus clouds contain biomodal populations of drops--one of cloud droplets and the other of drizzle-sized drops 14. The cloud droplet spectra in maritime cumulus clouds are often bimodal l
. On the days with rain, NL was seven times that on the days with no rain (highly significant at 0.24 % level), applying Wilcoxon-Mann Whitney test l 6
. The values of L WC, MVD and dispersion were greater (significant at 0.48 %, 2 % and 3 % levels, respectively), while NT and Ns to some extent smaller (not significant in either case) on the former occasion as compared to the latter. The values of L WC were about 0.42 and 0.23 g m-3 on the two occasions, i.e. with rain and no rain, respectively. A drizzle water content larger than 0.2 g m-3 near the cloud top is required if large drops are to form alld fall against the updraft7. The increase of the dispersion is partly a reflection of the increase in frequency of bimodal distribution in cumulus c1ouds ls
. The concentrations

600 r.-----------------------------------------------T
500
~ I t' 400
;:1
,.., I & t)
300 ... ... 8' ~ '0
~ 200 t-
100 I-
I 0 1()O
-
DAYS WITH RAIN OBSERVED (a)
o 1\
x S.D. FOR dn/dlogr •••• LOG NORMAL CURVE
y.~ . ,
'0'"
~" I
101 1()2 MEAN RADIUS, lJm
, 1 10
ANALYSED CLOUD VOLUME, em3
~ I
E! ;:1
,.., I Ii U
\oj
01 0 ~
'0
" c "0
600~f------------------------------------~
500
400
300
200
f .. 100
DAYS WITH NO RAIN OBSERVED o (b)
o
x S.D. FOR dn/dlogr •••• LOG NORMAL CURVE
o I 1 ()O ttl ..... mr.t?'vvrnn 101 1()2
MEAN RADIUS, lJm
r 1 10 ANALYSED CLOUD VOLUME, em3
Fig. I-{:Ioud drop spectra on the days with (a) rain and (b) no rain as observed within the clouds
\- "" ~ \..
z o ~ '-
~ o ~ [/) "'tl > (j tTl "'tl :I: -<
.[/)
> c: Cl c: [/}
-l
~
~

PAUL: CLOUD DROP SPECTRA ON RAIN & NON-RAIN OCCASIONS 173
Table l-{:Ioud drop characteristics on the days with rain/no rain observed within the clouds
Cloud MS NL NT Ns LWC MVD Dispersion
cm-3 cm-J cm-J - 3
height j.im gm j.im
(a.m.s. l) m
Days with rain 137 samples, sampled at 1533 hrs 1ST; II days; rainfall 5.528 (6.273) mm; rain noticed at 1544 hrs ISTI
1976 (540)
130 0.469 (0.696)
300 (15 I)
282 (154)
0.4223 (0.3367)
13 .7 (3 .9)
0.64 (0.18)
Days with no rain 127 samples, sampled at 1535 hrs 1ST; II days;rainfall 0.846 (1.407) mml
2008 (3 70)
80 0.067 (0.174)
318 (159)
311 (160)
0.2285 (0.1287)
11.2 (2 .0)
0.54 (0.15 )
Note : (i) Rainfall values are the mean 24-h rainfall per rainguage (total 40 rain-gauges) recorded at ground at 0830 hrs 1ST in the
experimental area on the following day. (ii) Values in the brackets are the standard deviations.
of drops of size 4-18 /lm were lower, while those of drops of all sizes > 18 /lm were higher on the days with rain (with respect to the days with no rain). The appreciably higher concentrations of drops > 18 /lm (particularly those > 50 /lm), much greater maximum size and significantly higher values of L WC, MVO and dispersion indicate active growth of cloud drops on the days with rain . The relatively lower concentrations of small-sized cloud drops (and hence the total number of drops) on the days with rain as compared to those with no rain suggest participation of small-sized drops in the growth of bigger drops . The larger drops grew by coalescence process at the cost of small-sized drops. Condensation can indirectly affect the growth rate of droplets larger than 25 /lm radius by enhancing the growth of the smaller droplets which are then captured more efficiently by the larger ones6
. The formation of warm rain from cumulus clouds of 2-3 km thickness, over the Hawaiian Islands, was facilitated by the low concentration of cloud droplets4
.
The values of NL on the days with rain were 0.153 , 0.959,0.300, 0.342, 0.124,0 .3 73,0.421 , 0.547, 0.63 5, 1.640 and 0.207 cm-J against the rainfall 0.18, 5.53 , 0.0, 0.84, 1.40; 5.73 , 5.99, 11.03,8.00, 21.94 and 0.17 mm, respectively (correlation coefficient 0.894; SO 0.209; highly significant at 0.02 % level). Those on the days with no rain observed were 0.365 , 0.093 , 0.015, 0.010, 0. 161 , 0.200, 0.0, 0.0, 0.0, 0.0 and 0.0 cm-3 against the rainfall 0.91, 0.36, 0.0, 0.20, 0.0, 5.02, 0.77, 0.0, 0.03, 1.65 and 0.37 mm, respectively (correlation coefficient 0.3 72; SO 0.117; significant at
26 % level, i.e. not significant). These indicate active growth of drops on the days with rain.
.l.2 ·C loud drop spectra at different stages of rain
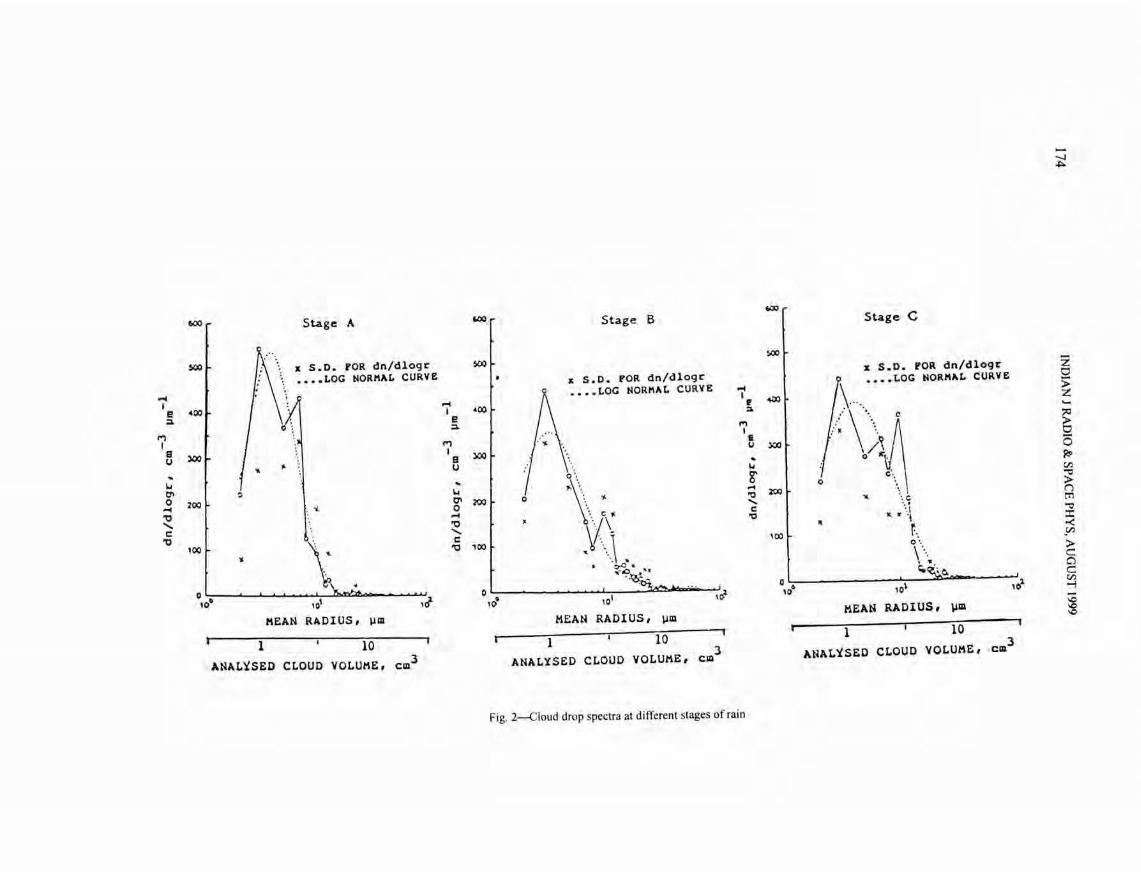
The average cloud drop spectra, on the days with rain observed within the clouds, over the experimental area, before the occurrence of rain (stage A), at the initial stage of rain (stage B) and after the occurrence of rain (stage C) are shown in Fig.2. On the average, the spectra obtained were 35 min before rain for stage A, 30 s before rain for stage Band 23 min after rain for stage C. For stage B, samples 0-2 min before/after rain (noticed). were considered. The average of different days ' values was taken as the number of cloud drop samples collected for all the three stages of rain on a single day which was very small. The va lues of different parameters are given in Table 2.
The maximum size increased much from 93 /lm at stage A to 130 /lm at stage B and then decreased much to 87 /lm at stage C. The mean distributions were trimodal (peaks at 3 /lm , 7 /lm, 13 /lm), trimodal (peaks at 3 /lm, 10 /lm , 24 /lm) anrl tetramodal (peaks at 3 /lm , 7 /lm, 10 /lm , 24 /lm) at the respective three stages under comparison . The values of NL, L we, MVO and dispersion increased much from stage A to stage B (highly significant at 0.007%, 0.1 %, 0.01%, and 0.03% levels, respectively) and then decreased much from stage B to stage C (significant at I % and 4% levels for NL and dispersion, respectively, and not significant for LWC and MVO). The values of Ns and NT decreased much from stage A to stage B (significant at 8% level for Ns and not significant for
600,. Stage A 600 Stage B
~I- /:\ ', x S.D. FOR dn/dlogr \000
•••• LOG NORMAL CURVE x S.D. FOR dn/dlogr
-4
:t / 0 •••• LOG NORMAL CURVE '""
I -4 I
e I -00 r
:1 e :>.
t"')
:1 I"l
I
I
a t"') ''j.
\" Ii
U I 300
u
a -. u ..
1.1
\oJ I 0 ', 8'
01
..
'\ ~ \oJ 0
'"" '"" '00 l 01 200 0
:i~ . "0
'0 . ... 0
.....
t\ '"" c
"- '0 ~ 'Q
c: "-'0 c:
100
\~ '0 '00
" . ~. o I
.... If? !. ....
, t , t .el 0 10
0 '0' ,J- 10· 101 ,r-2
MEAN RADIUS, \.lID MEAN RADIUS, \.lID
1 10
, 1 10
ANAL~SED CLOUD VOLUME, eID3 ANAL~SED CLOUD VOLUME, 3
em
Fig. 2--Cioud drop spectra at different stages of rain
1oQ)\ Stage C
\000
x S.D. FOR dn/dlogr •••• LOG NORMAL CURVE
400 \ ...
'< \\A 300
o JC'~ . c', \ o ~ ,
200 '~ I ... , c '. ' . \
~ \l • "j
r." 100 0'. , .... . " c:. ' , .0,
o $
'0 '0\ Itt
MEAN RADIUS, \lID
t' 1 10
ANAL~SED CLOUD VOLUME, eID3
-....I ~
Z 0 ;; Z
~ (3 p.o [/J
'" > (") tr1
'" :t 0<: .[/J
> c:: Cl c:: [/J
-l
'" '" '"

PAUL: CLOUD DROP SPECTRA ON RAIN & NON-RAIN OCCASIONS 175
Table 2 -{:Ioud drop characteristics with respect to rain on the days with rain observed (values in brackets are standard deviations)
Cloud MS NL NT Ns LWC MVD Dispersion height 11m cm-J cm-J cm-J g m-J llm (a. m.s.I)
m
Stage A : Before rain
1647 93 0.096 327 321 0.2353 10.7 0.53 (234) (0 .232) (154) (149) (0.1770) (1.6) (0. 12)
Stage B : Initial stage of rain
2078 130 0.968 266 242 0.6075 16.5 0.77 (507) (0 .860) (144) (145) (0.4079) (3.7) (0.18)
Stage C : After rain
2417 87 0.295 307 280 0.4485 14.6 0.62 (616) (0.387) ( 147) (159) (0.22 18) (3.3) (O.IOL
Note :(i) For stage A : 15 samples, sampled at 1513 Irs 1ST (29 min); 10 days; Rain noticed at 1548 hrs 1ST (44 min) (ii) For stage B : 14 samples, sampled at 1546 hrs 1ST (27 min); II days; Rain noticed at 1544 hrs 1ST (44 min): Samples 0-2 mi n before / after rain (noticed) were considered . (iii) For stage C: 8 samples, sampled at 1546 hrs 1ST (27 min); 6 days; Rain noticed at 1523 hrs 1ST (35 min)
NT) and then increased at stage C (not significant). The above observations indicate active growth of drops just before rain or in the beginning of rain. The concentrations of large-sized (>50 flm) , moderatesized (20-50 flm) and small-sized « 20 flm) drops were 0.096, 5.9 and 321 cm-3
, respectively, before rain; 0.968, 23 and 242 cm-3
, respectively, in the beginning of rain and 0.295, 27 and 280 cm-3
,
respectively, after rain. It appears that the number of large and moderate-sized drops increased much, while that of small-sized drops reduced much just before rain started and/or in the beginning of rain . Also, the large drops were mostly rained out, while the moderate and small-sized drops were not rained out at the end of rain . The concentration of small-sized drops increased again after the rain and this might probably be due to fresh condensation of water vapour on small-sized CCN particles (present in the cloud air), which were not washed out in the rain or this might be due to entrainment of sub-saturated air leading to evaporation and fresh activation or reactivation of CCN (Ref. 17). The concentrations of drops of size < 20 flm decreased, while those of size > 20 flm increased from stage A .to stage B. The concentrations of drops of size < 30 flm increased,
while those of size ~ 30 flm decreased from stage B to stage C. The giant aerosol particles are scavenged mainly at the beginning of a rain event' 8.
Acknowledgements The author is grateful to Dr A S R Murty for his
valuable help during the course of the work. The author is also thankful to Shri M I R Tinmaker for his help in the preparation of the manuscript.
References I Raga G B & Jonas P R, Q J R Me/eorol Soc (UK) , 11 9 ( 1993)
1399. 2 Weickmann H K & Aufm Kampe H J, J Mel (USA). 10
( 1953) 204 .
3 Squires P, Tel/us (Sweden), 10 (1958) 256. 4 SkhirtTadze G I, Sov Me/eorol & Hydrol (USA), 6 ( 1984) 26 . 5 Hallberg A, Wobrock W, Flossmann A I, Bower K N, Noone
K J, Wiedensohler A, Hansson H C, Wendisch M, Berner A, Kruisz C. Laj P, Facchini M C, Fuzzi S & Arends B G, A/m os Environ (UK), 31 ( 1997) 2453 .
6 Jonas P R & Mason B J, Q J R Me/eorol Soc (UK) , 100 (1974)286.
7 Takahashi T, J A /m os Sci (USA) , 38 ( 1981 ) 347. 8 Takahashi T, Yoneyama K & Tsubota Y, J A/mos Sci (USA),
46 ( 1989) 937. 9 Paul S K & Pillai A G, Maw'am (India), 43 (1992) 4 I 5.

176 INDIAN J RADIO & SPACE PHYS, AUGUST 1999
10 Krishna K, Kapoor R K, Murty A S R, Rajamani S, Selvam A M, Khemani L T, Kanuga K K, Mukherjee B K, Paul S K, Reddy R S, Manohar G K, Brij Mohan, Vijayakumar R & Ramana Murty Bh V, J Weather Modif(USA}, 8 (1976) 134.
II Srivastava R C & Kapoor R K, Indian J Meteorol & Geophys, II (1960) 157.
12 Paul S K, Sharma S K & Kapoor R K, J Indian Inst Sci, 62(B) (1980) 83.
13 Ranz W E & Wong J B, Ind Eng Chem (USA},44 (1952)
1371
14 Fox N I &. Illingworth A J, J Appl Meleorol (USA), 36 (1997) 485.
15 Warner J, J Atmos Sci (USA), 26 (1969) 1049.
16 Siegel S, Non-parametric Statistics for the Behavioral Sciences (Mc Graw-Hill Co. Inc .. N.Y.), 1956, p. 312.
17 Pontikis C & Hicks E, J Almos Sci (liSA) , 50 (1993) 1888.
18 Radke L F, Hobbs P V & Eltgroth M W, J Appl Meteorol (USA), 19 (1980)715.


![Global assessment of AMSR E and MODIS cloud liquid water path … · adjusted cloud liquid water path replacing the preliminary rain‐free value. [13] Thisspecific cloud‐rainpartitioning](https://img.pdfslide.us/doc/110x75/6010a3294556bb0fa07f4153/global-assessment-of-amsr-e-and-modis-cloud-liquid-water-path-adjusted-cloud-liquid.jpg)