Embed Size (px)
Citation preview

jofi˙673 JOFI.cls May 26, 2004 22:27
THE JOURNAL OF FINANCE • VOL. LIX, NO. 5 • OCTOBER 2004
Characteristics, Contracts, and Actions:Evidence from Venture Capitalist Analyses
STEVEN N. KAPLAN and PER STROMBERG∗
ABSTRACT
We study the investment analyses of 67 portfolio investments by 11 venture capital(VC) firms. VCs describe the strengths and risks of the investments as well as expectedpostinvestment actions. We classify the risks into three categories and relate them tothe allocation of cash flow rights, contingencies, control rights, and liquidation rightsbetween VCs and entrepreneurs. The risk results suggest that agency and hold-upproblems are important to contract design and monitoring, but that risk sharing isnot. Greater VC control is associated with increased management intervention, whilegreater VC equity incentives are associated with increased value-added support.
MOST FINANCIAL CONTRACTING THEORIES ADDRESS how conflicts between a principal/investor and an agent/entrepreneur affect ex ante information collection, con-tract design, and ex post monitoring. In this paper, we empirically test thepredictions of financial contracting theories using investments by venture cap-italists (VCs) in early stage entrepreneurs—real world entities that arguablyclosely approximate the principals and agents of theory.1
VCs face four generic (agency) problems in the investment process. First, theVC is concerned that the entrepreneur will not work hard to maximize valueafter the investment is made. In such a case, when the entrepreneur’s effort isunobservable to the VC, the traditional moral hazard approach, pioneered byHolmstrom (1979), predicts that the VC will make the entrepreneur’s compen-sation dependent on performance. The more severe the information problem,the more the contracts should be tied to performance.
∗University of Chicago Graduate School of Business and National Bureau of Economic Research.A previous version of this paper was titled “How Do Venture Capitalists Choose and Monitor Invest-ments?” We appreciate comments from Ulf Axelson, Douglas Baird, Francesca Cornelli, MathiasDewatripont, Douglas Diamond, Paul Gompers, Felda Hardymon, Josh Lerner; Frederic Martel,Bob McDonald (the editor), Kjell Nyborg, David Scharfstein, Jean Tirole, Lucy White, Luigi Zin-gales, an anonymous referee, and seminar participants at Amsterdam, Chicago, Columbia, ECARE,the 2001 European Finance Association meetings, Harvard Business School, HEC, INSEAD,London Business School, McGill, Michigan, New York University, North Carolina, Notre Dame,Ohio State, Purdue, Rochester, Stockholm School of Economics, Toulouse, Washington University,and Yale. This research has been supported by the Kauffman Foundation, by the Lynde and HarryBradley Foundation, and the Olin Foundation through grants to the Center for the Study of theEconomy and the State, and by the Center for Research in Security Prices. Alejandro Hajdenbergprovided outstanding research assistance. We are grateful to the venture capital partnerships forproviding data. Any errors are our own.
1 Hart (2001) concurs that this is a reasonable assumption.
2173

jofi˙673 JOFI.cls May 26, 2004 22:27
2174 The Journal of Finance
Second, the VC may also be concerned that the entrepreneur knows moreabout his or her quality/ability than the VC. The model in Lazear (1986) shows Q1that the VC can design contracts with greater pay-for-performance that goodentrepreneurs will be more willing to accept.2 Ross (1977) and Diamond (1991)show that investor liquidation rights—the ability to liquidate and the payoff inthe event of liquidation—can also be used to screen for good entrepreneurs.
Third, the VC also understands that after the investment, there will be cir-cumstances when the VC disagrees with the entrepreneur and the VC will wantthe right to make decisions. Control theories (such as Aghion and Bolton (1992)and Dessein (2002)) show that a solution to this problem is to give control tothe VC in some states and to the entrepreneur in others.
Fourth and finally, the VC is concerned that the entrepreneur can “hold-up”the VC by threatening to leave the venture when the entrepreneur’s humancapital is particularly valuable to the company. This is the hold-up problemanalyzed in Hart and Moore (1994). The VC can reduce the entrepreneur’sincentive to leave by vesting the entrepreneur’s shares.
The theories predict that characteristics of VC contracts will be related tothe extent of agency problems. As such problems increase, founder compensa-tion will be more performance sensitive, VCs will have stronger control andliquidation rights, and vesting will be more pronounced.
Most previous research, including our own, estimates the extent of agencyproblems using indirect measures, e.g., firm age, firm size, industry R&D inten-sity, and industry market-to-book ratio.3 These measures have two limitations.First, they may not measure the risks the VCs actually care about. Second, theymix different risks together when such risks may have different implicationsfor agency problems and therefore for the VC contracts and actions.
In this paper, we construct direct measures of risks and uncertainties thatVCs and entrepreneurs face, and then classify those risks depending on howthey relate to specific agency problems. We obtain these measures by readingand assessing the investment memoranda for investments in 67 companies by11 VC partnerships. We then consider whether the agency problems affect theVC contracts and actions in the ways predicted by the theories.
Most agency problems are directly related to asymmetric information, i.e.,uncertainties about which the entrepreneur is better informed than the VC.For example, agency problems will be more severe when the entrepreneur’sability is unknown because of inexperience, when the operations of the ventureare hard to observe and monitor, and when the entrepreneur has more discre-tion in actions and in the use of funds. We denote such types of uncertaintiesas internal risks. When internal risks are larger, moral hazard problems, ad-verse selection risks, and the likelihood of future conflicts of interest will alsobe larger. As a result, the theories predict that performance-sensitive and con-tingent compensation should be more pronounced, the VC should get control in
2 Hagerty and Siegel (1988) point out that the solution to the screening problem is observationallysimilar to that for the moral hazard problem.
3 Smith and Watts (1992), Gompers (1995), and Kaplan and Stromberg (2003), e.g., all use suchindirect measures.
jofi˙673 JOFI.cls May 26, 2004 22:27
Characteristics, Contracts, and Actions 2175
more states of the world, and the VC should have greater ability to liquidatethe venture upon poor performance.
VCs and founders also face risks that are equally uncertain for both parties.Examples are the extent of future demand for an undeveloped product, theresponse of competitors upon the product’s introduction, and the receptivity offinancial markets when investors try to sell the company or bring it public. Wedenote such uncertainties as external risks.
Unlike the clear predictions for internal risks, financial contracting theorieshave ambiguous predictions with respect to external risks. According to tra-ditional moral hazard theories like Holmstrom (1979), when risks—such asexternal risks—are not under the entrepreneur’s control, pay-for-performancecompensation and other contingent payoffs are less desirable because a risk-averse entrepreneur has to be compensated for taking on such risks.
Alternatively, in a world of incomplete contracting, external uncertaintiesmay increase the likelihood of unforeseen contingencies and the concomitantVC-entrepreneur conflicts. Theories such as Aghion and Bolton (1992) implythat the VC will get control in more states of the world. It also is plausible thatexternal uncertainty makes direct monitoring more difficult. For this reason,Prendergast (2002) predicts that pay-for-performance compensation should in-crease with external uncertainty, and Dessein (2002) implies that VC controlshould increase.
Finally, some uncertainties are neither solely internal (because they areequally uncertain for the VC and the entrepreneur), nor solely external (be-cause they are at least partly under the entrepreneur’s control). The VC maybe happy with the quality and work of the management team, and all partiesmay agree that there will be a great market for the product once developed,but it may be very difficult to make the technology or the strategy work. Wedenote such uncertainties, which are related to the venture’s complexity andthe importance of the entrepreneur’s human capital, as difficulty of executionrisks. The hold-up problem of Hart and Moore (1994) is likely to be greater insuch cases because the entrepreneur can credibly threaten to leave. As a result,we would expect to see greater use of vesting provisions in such ventures.4
In our empirical analysis, we first describe the strengths and risks of theinvestments as well as expected postinvestment monitoring. We then form em-pirical measures of the three different types of risks and relate those measuresto the contracts.
Consistent with the agency explanation, internal uncertainty is significantlyrelated to many of the incentive and control mechanisms in the contracts.Higher internal risk is associated with more VC control, more contingent
4 Another possibility is that for such complex ventures, it is difficult to find proper benchmarksor signals on which to base contingent compensation. Execution risks are likely to be present inventures where the tasks that the entrepreneur has to perform are very complex and multidimen-sional. Basing compensation on a signal correlated with a particular aspect of the task may lead theentrepreneur to put too much effort on this aspect, as opposed to other areas. Multitasking theoriessuch as Holmstrom and Milgrom (1991) and Baker (1992) predict that contingent compensationbased on performance benchmarks will be used less in these cases.

jofi˙673 JOFI.cls May 26, 2004 22:27
2176 The Journal of Finance
compensation for the entrepreneur, and more contingent financing in a givenround. The exceptions are that the overall fraction of founder cash flow rightsand some VC liquidation rights are not related to internal risk.
Similar to internal risks, external risk is associated with more VC controland more contingent compensation. External risk is also associated with in-creases in the strength of VC liquidation rights, and tighter staging, in thesense of a shorter period between financing rounds. These findings are highlyinconsistent with optimal risk-sharing between risk-averse entrepreneurs andrisk-neutral investors. In contrast, the results are supportive of the argumentsin Prendergast (2002) and Dessein (2002).
Risk related to difficulty of execution shows a (weakly) negative relation withmany contractual terms such as contingent compensation and VC liquidationrights. These results suggest that for highly complex environments, where thefounder’s human capital is particularly important, standard incentive mecha-nisms are less effective. Furthermore, consistent with hold-up theories, execu-tion risk is positively related to founder vesting provisions.
Next, we test two additional theoretical predictions by relating the financialcontracts to VC actions. First, control theories like Aghion and Bolton (1992)imply that intervening actions are more likely when the VC has greater controlrights. Second, the “double sided moral hazard” theories like Casamatta (2003)emphasize that VCs also provide value-added support activities. Since both theVC and the entrepreneur benefit from value-added services, these activities areless likely to be resisted by the entrepreneur. Rather, the problem is to providethe VC incentives to undertake supporting actions. These theories suggest thatsupporting actions will be more likely as the VC’s equity stake in the companyincreases.5
We use the investment analyses to measure actions that the VCs took beforeinvesting and expected to undertake afterward. We then classify these actionsinto intervening and supporting ones. In at least half of the investments, theVC expected to play a role in recruiting management or some other interveningaction that the entrepreneur is likely to view as a conflict. Consistent withthe control theories, VCs are more likely to intervene as VC control increases.Second, in more than one-third of the investments, the VC expects to providevalue-added services such as strategic advice or customer introductions. Aspredicted, we find that VC’s value-added services increase with the VC’s equitystake, but are not related to VC control.
Overall, we believe this paper makes three contributions. First, the paperis novel in using investors’ direct assessments of risks rather than the indi-rect proxies used in most previous research. The internal risk results suggestthat agency problems are very important to contract design. The external riskresults suggest that risk-sharing concerns are unimportant relative to otherconcerns such as monitoring. Second, we show that VCs expect to take actionswith their investments and those actions are related to the contracts. Expected
5 We are able to measure these effects separately because control rights in VC contracts areseparate and distinct from cash flow rights. See Kaplan and Stromberg (2003).

jofi˙673 JOFI.cls May 26, 2004 22:27
Characteristics, Contracts, and Actions 2177
VC intervention is related to VC board control, while VC support or advice isrelated to VC equity ownership. Finally, the paper adds to existing work bydescribing the characteristics and risks that VCs consider in actual deals. Ourresults are consistent with those in MacMillan, Siegel and Subbanarasimha(1985) and MacMillan, Zemann, and Subbanarasimha (1987) who rely largelyon survey evidence.
The paper proceeds as follows. Section I describes our sample. Section IIdescribes the VC analyses. Section III presents the relation between the con-tracts and the VC analyses. Section IV considers the relation between VC ac-tions and the contracts. Section V summarizes our results and discusses theirimplications.
I. Sample
A. Description
We analyze VC investments in 67 companies by 11 VC firms. This is a subsam-ple of the 119 companies from 14 VC firms analyzed in Kaplan and Stromberg(2003), who obtained their sample by asking the VCs to provide detailed infor-mation on their investments. For each company and for each financing roundfor the company, the VC was asked to provide the (1) term sheet; (2) stock andsecurity purchase agreements; (3) the company’s business plan; and (4) the VC’sinternal analysis of the investment.
Most VC firms have a process in which the partner responsible for a potentialinvestment writes up an analysis or memorandum for that investment. Theentire partnership group uses the analysis to help decide whether to make theinvestment. If the VC invests in the company, the memorandum then serves asa guide for postinvestment actions.
VCs at 11 of the 14 VC firms provided an investment analysis for at least onecompany investment. The analyses vary in detail. Some are brief, two-page,write-ups while others are in-depth descriptions exceeding twenty pages. Aconsequence of this is that our results may understate the extent of analysesthat the VCs perform.
Table I presents sample summary information. We study the first investmentmade by the VC in these companies. Panel A indicates that of the 67 invest-ments, 25 are prerevenue—the firms either did not have revenues or were notyet operating. We refer to these as early stage rounds. The remaining invest-ments are rounds in which the firms had revenues and were already operating.For 44 companies, the investment is the first investment any VC ever madein the company; in the remaining 23, another VC had invested before our VCacquired a stake.
Panel B shows that the sample investments were relatively recent when col-lected. All but 11 of the 67 companies were initially funded by the VCs between1996 and 1999.
Panel C indicates that the companies represent a wide range of industries.The largest group is in information technology and software (24 companies),

jofi˙673 JOFI.cls May 26, 2004 22:27
2178 The Journal of Finance
Tab
leI
Su
mm
ary
Info
rmat
ion
Su
mm
ary
info
rmat
ion
for
inve
stm
ents
in67
port
foli
oco
mpa
nie
sby
11ve
ntu
reca
pita
lpar
tner
ship
s.In
vest
men
tsw
ere
mad
ebe
twee
n19
87an
d19
99.P
rere
ven
ue
stag
ero
un
dsar
efi
nan
cin
gro
un
dsfo
rco
mpa
nie
sth
ath
adn
ore
ven
ues
befo
reth
efi
nan
cin
g.F
irst
VC
inve
stm
ents
refe
rto
obse
rvat
ion
sw
her
ew
eh
ave
the
inve
stm
entm
emor
andu
mfo
rth
efi
rstt
ime
any
ven
ture
capi
talf
un
din
vest
edin
the
com
pan
y.R
epea
ten
trep
ren
eur
refe
rsto
obse
rvat
ion
sw
her
e,be
fore
fou
ndi
ng
this
part
icu
lar
port
foli
oco
mpa
ny,
the
fou
nde
rh
adsu
cces
sfu
lly
gon
epu
blic
wit
ha
prev
iou
sve
ntu
reor
sold
such
ave
ntu
reto
apu
blic
com
pan
y.T
otal
fin
anci
ng
com
mit
ted
isth
eto
tala
mou
nto
fequ
ity
fin
anci
ng
com
mit
ted
toby
the
ven
ture
capi
tali
sts
atth
eti
me
ofth
efi
nan
cin
gro
un
d.V
Cfi
rmlo
cati
onin
clu
des
Cal
ifor
nia
(CA
),M
idw
este
rnU
nit
edS
tate
s(M
W),
Nor
thea
ster
nU
nit
edS
tate
s(N
E),
and
dive
rse
loca
tion
s(D
IV).
Dat
aon
capi
talm
anag
edan
dfu
nds
rais
edby
VC
firm
sco
me
from
Ven
ture
Eco
nom
ics.
A.
NN
um
ber
ofpo
rtfo
lio
com
pan
ies
67P
rere
ven
ue
25F
irst
VC
inve
stm
ents
44R
epea
ten
trep
ren
eur
14M
emo
wri
tten
byle
adin
vest
or57
Loc
ated
inC
alif
orn
ia25
Loc
ated
inN
orth
-Eas
tU
nit
edS
tate
s13
Loc
ated
inM
idw
est
11
B.B
yye
arin
itia
lro
un
dfi
nan
ced
:P
re-1
995
1996
1997
1998
1999
#co
mpa
nie
s11
1412
291
C.B
yin
du
stry
Bio
tech
Inte
rnet
IT/S
oftw
,Oth
erT
elec
omH
ealt
hca
reR
etai
lO
ther
Inds
.#
com
pan
ies
714
1010
1010
6
D.B
yV
Cfi
rm1
23
45
67
89
1011
#po
rtfo
lio
com
pan
ies
incu
rren
tdr
aft
73
315
44
210
210
7L
ocat
ion
CA
MW
NE
MW
CA
MW
CA
DIV
MW
DIV
DIV
Ran
kin
term
sof
capi
talm
anag
ed20
02,<
=to
p50
100
2515
015
050
550
2525
025
100
E.V
Cfi
rmch
arac
teri
stic
s:M
ean
Med
ian
By
fin
anci
ng
rou
nd
(N=
67):
VC
firm
age
atti
me
offi
nan
cin
gro
un
d,ye
ars
13.3
12.0
Nu
mbe
rof
fun
dsra
ised
byfi
rmsi
nce
fou
nda
tion
5.9
5.0
Am
oun
tra
ised
bypa
rtn
ersh
ipsi
nce
fou
nda
tion
($m
illi
ons)
448.
928
9.7
By
VC
firm
(N=
11):
VC
firm
age,
Nov
embe
r20
0216
.715
.0N
um
ber
offu
nds
rais
edby
Nov
embe
r20
0211
.28.
5C
apit
alu
nde
rm
anag
emen
t,N
ovem
ber
2002
($m
illi
ons)
1747
.284
6.7
F.F
inan
cin
gA
mou
nts
Mea
nM
edia
nT
otal
fin
anci
ng
com
mit
ted
($m
illi
ons)
9.7
6.0
Tot
alfi
nan
cin
gpr
ovid
ed($
mil
lion
s)5.
54.
8G
.Ou
tcom
esas
of10
/31/
02P
riva
teP
ubl
icS
old
Liq
uid
ated
#of
com
pan
ies
2315
1613

jofi˙673 JOFI.cls May 26, 2004 22:27
Characteristics, Contracts, and Actions 2179
with 14 internet-related and 10 noninternet related. The sample also includesbiotech, telecom, healthcare, and retail ventures.
Panel D shows that the portfolio companies were funded by 11 U.S.-basedVC firms with no more than 15 companies from any one VC. Three VCs arebased in California, four in the Midwest, one in the Northeast, and three havemultiple offices. Five VCs are among the top 50 VC firms in the United Statesin capital under management; all but two are among the top 150.
Panel E shows that at the time of financing, the VC for the median investmentin our sample was 12 years old and had raised five funds amounting to $290million.
Panel F reports the financing amounts. The VCs committed a median of$6.0 million with a median of $4.8 million disbursed at closing and the restcontingent on milestones.
Finally, panel G indicates that by October 31, 2002, 15 of the 67 companieswere public, 16 had been sold, and 13 had been liquidated. The remaining 23companies were still private.
B. Sample Selection Issues
In this section, we discuss potential selection issues. The sample is not ran-dom in that we obtained the data from VC firms with whom we have a rela-tionship.
One possible bias is that the three VCs from our previous paper that did notprovide investment memoranda are different from the others. While possible,the terms and the outcomes of the investments made by those VCs appearsimilar to those for the investments made by the other 11 VCs.
It is also possible that the VCs provided us with memos on their better invest-ments. Several factors suggest that this is not the case. Many of the investmentsthe VCs provided us were their most recent. In addition, 6 of the 11 VCs pro-vided all of their investments in the relevant period. The terms for the six VCsare similar to those for the entire sample. Finally, investments with memos areinsignificantly less likely to have gone public than those without memos.
Another possible bias is that memoranda are written only for more contro-versial investments. The results in the previous paragraph argue against this.Furthermore, four of the six VCs who gave us all their investments gave usmemoranda for all of them.
There do not appear to be industry or geographic biases as the industries andlocations of the sample companies are in line with those of all VC investmentsover the same period.
Finally, because we contacted successful VCs, it is possible that our VCsare of above-average ability. We do not think this bias is of much concern forour analyses because we are interested in understanding how VCs choose andstructure their investments rather than how well they perform. If anything,a bias towards more successful VCs would be helpful because we are morelikely to have identified the methods used by sophisticated, value-maximizingprincipals.
jofi˙673 JOFI.cls May 26, 2004 22:27
2180 The Journal of Finance
Overall, we acknowledge that the sample is selected, and it is difficult toknow the extent of any bias. We have discussed the more likely biases and havenot found any obvious red flags.
II. Description of VC Investment Analyses
In this section, we present our classification scheme for investment strengthsand risks, describe those strengths and risks, and describe the actions the VCstake and expect to take.
A. Classification Scheme
Previous work on VC company characteristics distinguishes among factorsthat relate to the opportunity (the company’s market, product/service, technol-ogy, strategy, and competition), the management team, the deal terms, and thefinancing environment.6 We include these factors, but group them into threecategories motivated by the theories described in the introduction.
The first category includes internal factors—management quality, perfor-mance to date, downside risk, influence of other investors, VC investment fitand monitoring costs, and valuation. These factors are related to managementactions and/or the quality of the management team. We believe these factorsare more likely to be subject to asymmetric information and moral hazard withrespect to the management team.
The second category includes those factors we view as external to the firm.We classify market size, customer adoption, competition, and exit conditionrisks as such factors. Because these are external to the firm and largely beyondthe control of the management team, we believe that the VC and the foundershould be more or less equally informed about these factors.
The third category measures factors related to difficulty of execution orimplementation—product/technology and business strategy/model. These fac-tors are designed to capture the complexity of the task and the reliance on theentrepreneur’s human capital.
We recognize that there are alternative interpretations of our categories. Wepostpone a discussion of these alternatives until later when we present ourresults.
Table II summarizes the classifications, investment theses, and risks.
B. Investment Strengths/Theses
Panel A confirms that internal factors are important. The VCs cite manage-ment quality as a reason for investing in almost 60% of the investments. The
6 MacMillan et al. (1987, 1987, 1988); Sapienza (1992); and Sapienza et al. (1996) rely largelyon survey evidence to obtain these results.

jofi˙673 JOFI.cls May 26, 2004 22:27
Characteristics, Contracts, and Actions 2181
Tab
leII
Inve
stm
ent
Th
eses
and
Ris
ks
inV
entu
reC
apit
alis
tA
nal
yses
Exp
lici
tly
men
tion
ed(1
)re
ason
sfo
rin
vest
ing
and
(2)
risk
sof
inve
stm
ent,
acco
rdin
gto
ven
ture
capi
tali
stan
alys
esfo
rin
vest
men
tsin
67po
rtfo
lio
com
pan
ies
by11
ven
ture
capi
talp
artn
ersh
ips.
Inve
stm
ents
wer
em
ade
betw
een
1987
and
1999
.
Rea
son
toIn
vest
/Str
engt
hR
isk
ofIn
vest
men
t/W
eakn
ess
N%
Exa
mpl
esN
%E
xam
ples
A.I
nte
rnal
Fact
ors:
Man
agem
ent,
Pre
viou
sP
erfo
rman
ce,F
un
dsat
Ris
k,O
ther
Inve
stor
s
Qu
alit
yof
man
agem
ent
4059
.7•
Man
agem
ent
team
has
exte
nsi
vein
tern
etan
dw
ebsi
tem
anag
emen
tex
peri
ence
.•
Man
agem
ent
team
isbe
liev
edto
bego
odin
scie
nce
,an
dat
rais
ing
and
con
serv
ing
mon
ey.
•E
xper
ien
ced
man
ager
sou
tof
succ
essf
ulv
entu
reba
cked
com
pan
y.•
Hig
hly
sou
ght-
afte
ren
trep
ren
eur/
fou
nde
r,w
ho
co-f
oun
ded
com
pan
yth
atw
ent
publ
ic.
•E
xper
ien
ced,
prov
enan
dh
igh
-pro
file
CE
O.
•F
oun
der
has
hig
hm
arks
from
exis
tin
gin
vest
ors
•K
now
nC
EO
for
alo
ng
tim
e.•
Tea
mh
asac
quir
edsi
gnif
ican
tle
velo
fpen
etra
tion
and
rela
tion
ship
sin
afa
irly
shor
tti
me.
•C
EO
/fou
nde
ris
capa
ble
ofat
trac
tin
gn
eces
sary
empl
oyee
s.H
asde
velo
ped
exce
llen
tpr
odu
ctw
hil
eco
nsu
min
gm
odes
tam
oun
tsof
capi
tal.
•C
EO
isve
ryfr
uga
lan
dw
illn
otsp
end
un
wis
ely.
•F
oun
der
very
com
mit
ted:
quit
job
atco
mpe
tito
ran
dm
ortg
aged
his
hou
se.
•T
eam
isw
ell-
bala
nce
d,yo
un
gan
dag
gres
sive
.
4161
.2•
CE
Ois
a“r
ath
erdi
ffic
ult
pers
on.”
Act
ive
invo
lvem
ent
ofch
airm
anw
illb
ecr
uci
al.
•C
EO
/fou
nde
rh
asa
stro
ng
desi
refo
rac
quis
itio
ns.
VC
sh
ave
tode
vote
subs
tan
tial
tim
eev
alu
ate.
•M
anag
emen
th
asn
otsh
own
inth
epa
stth
atit
can
effe
ctiv
ely
fore
cast
fin
anci
alpr
ogre
ss.
•C
ompa
ny
isin
man
yse
emin
gly
disp
arat
ebu
sin
esse
s;a
refl
ecti
onof
man
agem
ent’s
lack
offo
cus?
•W
illm
anag
emen
tbe
able
toin
tegr
ate
acqu
isit
ion
s?•
Th
eC
EO
’sch
oice
ofpa
stco
mpa
nie
squ
esti
onab
le.
•M
anag
emen
tis
you
ng
and
rela
tive
lyin
expe
rien
ced.
•M
anag
emen
tte
amis
inco
mpl
ete.
•C
ompa
ny
ish
igh
lyre
lian
ton
one
indi
vidu
al(t
he
CE
O).
•C
ompa
ny
nee
dsC
EO
,CF
O,C
OO
,an
dco
ntr
ol(o
pera
tin
g,re
port
ing,
and
bill
ing)
syst
ems.
•N
eed
seas
oned
indu
stry
exec
uti
ve.
•In
com
plet
em
anag
emen
tte
am.A
mil
esto
ne
for
furt
her
fun
din
gis
hir
ing
VP
ofsa
les
and
mar
keti
ng.
•M
ust
stre
ngt
hen
man
agem
ent
and
ensu
rein
volv
emen
tof
VC
asch
airm
an.W
illh
ave
toh
ire
CE
O.

jofi˙673 JOFI.cls May 26, 2004 22:27
2182 The Journal of Finance
Tab
leII
—C
onti
nu
ed
Rea
son
toIn
vest
/Str
engt
hR
isk
ofIn
vest
men
t/W
eakn
ess
N%
Exa
mpl
esN
%E
xam
ples
Per
form
ance
toda
te18
26.9
•D
emon
stra
ted
prof
itab
ilit
yof
busi
nes
sm
odel
.•
Com
pan
yh
asa
man
agea
ble
cash
burn
rate
and
isex
pect
edto
beca
sh-f
low
brea
k-ev
enin
12m
onth
s.•
Sig
nif
ican
tsa
les
grow
than
dm
omen
tum
.•
Has
deve
lope
dpr
odu
ct,w
ell-
posi
tion
edto
ach
ieve
reve
nu
eta
rget
.
57.
5•
Com
pan
yis
mak
ing
loss
esan
dpe
rfor
min
gbe
low
plan
.•
Bad
debt
prob
lem
,wh
ich
sign
ific
antl
ych
ange
dth
epr
ofit
abil
ity
ofth
eco
mpa
ny,
beca
use
ofpa
stbu
sin
ess
proc
edu
res.
Fu
nds
atri
sk/
dow
nsi
de13
19.4
•P
arti
cipa
tin
gpr
efer
red
prot
ects
VC
ifm
edio
cre
perf
orm
ance
.•
Equ
ipm
ent
can
befu
nde
dw
ith
debt
.•
Inve
stor
sh
ave
abil
ity
toco
ntr
olgr
owth
.•
Min
imiz
edo
wn
side
byon
lypr
ovid
ing
lim
ited
fun
dsu
nti
lmil
esto
nes
met
.•
VC
com
mit
men
tw
illb
ein
vest
edov
erti
me.
•C
ash
-eff
icie
nt
earl
yst
age
than
ksto
futu
reco
mpa
ny
acqu
isit
ion
sw
ith
stoc
k.•
Can
take
com
pan
yto
lead
ing
indu
stry
posi
tion
wit
ha
min
imu
mof
capi
tal.
913
.4•
Un
cert
ain
tyab
out
wh
atpr
oper
mil
esto
nes
shou
ldbe
.•
Lar
geam
oun
tof
capi
talf
ora
star
t-u
pen
terp
rise
.W
illr
equ
ire
stro
ng
man
agem
ent
over
sigh
t.•
Agg
ress
ive
ban
klo
anas
sum
ptio
ns.
Mig
ht
requ
ire
eith
ersl
ower
expa
nsi
onor
mor
eeq
uit
yca
pita
l.•
Com
pan
yh
asli
ttle
inth
ew
ayof
un
derl
yin
gas
set
valu
ean
dth
us
offe
rsli
mit
eddo
wn
side
prot
ecti
on.
•C
ompa
ny
expe
cts
ton
eed
addi
tion
alfi
nan
cin
gn
ext
year
.No
asse
tsof
valu
eex
cept
for
empl
oyee
s.•
Nee
dsu
ffic
ien
tch
ecks
and
bala
nce
sre
gard
ing
draw
dow
nof
fun
ds.
Infl
uen
ceof
oth
erin
vest
ors
46.
0•
Inve
stin
gpa
rtn
ers
incl
ude
inve
stor
sw
ho
prev
iou
sly
inve
sted
earl
yin
som
eex
trem
ely
succ
essf
ulc
ompa
nie
s.•
Co-
inve
stor
also
invo
lved
asac
tive
chai
rman
and
inte
rim
CE
O.
46.
0•
Lea
dV
Cw
illn
oth
ave
un
ilat
eral
con
trol
,bu
th
ave
tore
ach
agre
emen
tw
ith
thre
eot
her
VC
s.•
Pre
viou
sin
vest
or(w
ho
isse
llin
gal
lsh
ares
toV
Cs)
isan
xiou
sto
get
out
ata
deep
disc
oun
t.•
Oth
erV
Cpr
evio
usl
yde
cide
dn
otto
fin
ance
deal
.V
Cpo
rtfo
lio
fit
and
mon
itor
ing
cost
1217
.9•
Add
sad
diti
onal
brea
dth
toV
Cpo
rtfo
lio
wit
hin
this
mar
ket
segm
ent.
•V
Cis
stro
ng
inth
isge
ogra
phic
regi
on.
•G
ood
stra
tegi
cfi
tw
ith
VC
.•
VC
has
boar
dse
aton
com
pan
yin
com
plem
enta
rybu
sin
ess;
mar
keti
ng
part
ner
ship
poss
ible
.
1014
.9•
Com
plic
ated
lega
lan
dfi
nan
cial
due
dili
gen
cen
eede
d.•
May
requ
ire
too
mu
chti
me
from
VC
.•
Geo
grap
hic
alri
sk—
US
corp
orat
ean
dov
erse
asR
&D
.•
VC
sh
ave
tode
vote
subs
tan
tial
tim
eto
eval
uat
eac
quis
itio
ns.

jofi˙673 JOFI.cls May 26, 2004 22:27
Characteristics, Contracts, and Actions 2183
•N
ewm
arke
tse
gmen
tfo
rV
C,w
hic
hsh
ould
stim
ula
teso
me
addi
tion
alop
port
un
itie
s.•
Pot
enti
alfo
r(N
on-C
alif
orn
ia)
VC
tole
ada
Sil
icon
Val
ley
deal
.
•H
eavy
invo
lvem
ent
ofin
vest
oras
inte
rim
CE
O,
(rep
laci
ng
fou
nde
r)is
crit
ical
tosu
cces
s.•
Hav
eto
ensu
reac
tive
invo
lvem
ent
ofon
eof
VC
inve
stor
sas
chai
rman
.V
alu
atio
n14
20.9
•L
owva
luat
ion
:IR
Rof
46%
inco
nse
rvat
ive
case
.•
Exi
tm
ult
iple
sar
esh
ooti
ng
up.
1319
.4•
Are
the
valu
atio
nan
dfi
nan
cial
proj
ecti
ons
real
isti
c?•
Hig
hva
luat
ion
beca
use
ofco
mpe
titi
onbe
twee
nV
Cs.
B.E
xter
nal
Fact
ors:
Mar
ket
Siz
e,C
ompe
titi
on,C
ust
omer
s,F
inan
cial
Mar
kets
,an
dE
xit
Con
diti
ons.
Mar
ket
size
and
grow
th46
68.7
%•
Lar
gem
arke
tam
enab
leto
rapi
dgr
owth
.•
Ver
yla
rge
mar
ket
inw
hic
hin
cum
ben
tsea
rnh
igh
prof
itm
argi
ns.
•C
ompa
ny
cou
lddr
amat
ical
lyim
pact
the
evol
uti
onof
the
com
pute
rin
dust
ry.
2131
.3%
•R
egu
lato
ryu
nce
rtai
nty
.•
Cou
ntr
yri
sk.
•C
urr
ency
risk
.•
New
,lar
gely
un
prov
en,m
arke
tpla
ce.
•G
ener
aldo
wn
turn
inin
dust
ry.
Com
peti
tion
and
barr
iers
toen
try
2232
.8%
•S
tron
gpr
opri
etar
yan
dpa
ten
tpo
siti
on.
•C
ompa
ny
ista
rget
ing
asi
gnif
ican
tm
arke
tse
gmen
tth
atis
un
ders
erve
dby
incu
mbe
nts
.•
Ear
lym
over
adva
nta
ges
from
bein
gpi
onee
rof
con
cept
and
larg
est
play
er.
•H
igh
lyfr
agm
ente
din
dust
ry,w
hic
hm
akes
itri
pefo
rco
nso
lida
tion
.•
No
com
peti
tors
.•
Th
ere
ism
ore
than
enou
ghro
omfo
rse
vera
lco
mpe
tito
rs.
2740
.3%
•C
ust
omer
sm
igh
tbe
com
eco
mpe
tito
rson
ceth
eyle
arn
com
pan
y’s
busi
nes
sm
odel
•P
aten
tpr
otec
tion
alon
em
igh
tn
otpr
ovid
een
ough
barr
iers
toen
try.
•M
any
new
entr
ants
-pri
ceco
mpe
titi
onco
uld
driv
edo
wn
mar
gin
s.•
Com
peti
tive
and
tigh
tla
bor
mar
ket,
com
peti
ng
wit
hla
rger
esta
blis
hed
firm
sfo
rem
ploy
ees.
•N
ewte
chn
olog
ym
igh
tbe
lon
g-te
rmth
reat
.•
Low
barr
iers
toen
try.
Low
swit
chin
gco
sts.
•P
rodu
ctca
nbe
copi
edby
larg
een
tren
ched
firm
s.L
ikel
ihoo
dof
cust
omer
adop
tion
2029
.9%
•C
once
ptu
alac
cept
ance
bypr
ofes
sion
alco
mm
un
ity.
•B
eta
arra
nge
men
tsw
ith
larg
ecu
stom
ers.
•S
olid
base
ofcu
stom
ers.
•C
ust
omer
sar
epo
siti
vere
gard
ing
the
prod
uct
and
the
man
agem
ent
team
.
1522
.4%
•U
nce
rtai
nw
het
her
can
con
vin
cecu
stom
ers
tobe
ton
anu
npr
oven
tech
nol
ogy.
•C
ust
omer
sm
ayn
otw
ant
topa
yen
ough
ofa
prem
ium
for
prod
uct
.•
Tar
get
cust
omer
sh
ave
not
his
tori
call
ybe
ensp
eedy
adop
ters
.•
Fin
anci
alvi
abil
ity
ofcu
stom
ers
and
exis
tin
gco
ntr
acts
ques
tion
able
.•
Ch
alle
nge
isto
broa
den
the
prod
uct
beyo
nd
the
init
ialc
ust
omer
segm
ent.

jofi˙673 JOFI.cls May 26, 2004 22:27
2184 The Journal of Finance
Tab
leII
—C
onti
nu
ed
Rea
son
toIn
vest
/Str
engt
hR
isk
ofIn
vest
men
t/W
eakn
ess
N%
Exa
mpl
esN
%E
xam
ples
Fin
anci
alm
arke
tan
dex
itco
ndi
tion
s
1116
.4%
•If
succ
essf
ul,
poss
ibil
ity
for
earl
yex
itor
acqu
isit
ion
.•
Exp
ect
toh
ave
acce
ssto
both
publ
icde
btan
deq
uit
yon
attr
acti
vete
rms.
•Q
uic
kfl
ippo
ten
tial
for
the
inve
stm
ent.
•M
any
stra
tegi
cbu
yers
avai
labl
e.•
Rec
ent
publ
icm
arke
ten
thu
sias
mfo
re-
com
mer
ceco
mpa
nie
sm
igh
ten
able
publ
iceq
uit
yfi
nan
cin
gto
mit
igat
efu
ture
fin
anci
ng
risk
s.•
Giv
enth
esi
zeof
the
mar
ket
oppo
rtu
nit
yan
dco
mpa
ny’
sst
rate
gy,c
apit
alm
arke
tsw
illb
ere
cept
ive
give
nth
atco
mpa
ny
ach
ieve
sbu
sin
ess
plan
.Als
o,a
con
soli
dati
ontr
end
shou
ldem
erge
inin
dust
ryas
mor
eco
mpa
nie
sen
ter
mar
ket.
57.
5%•
Wh
atw
illt
he
leve
rage
bean
dw
hat
hap
pen
sto
leve
rage
ifth
eIP
Ois
dela
yed?
•W
ould
may
bebe
bett
erto
sell
com
pan
y.•
Fin
anci
alm
arke
tan
dpo
liti
calf
luct
uat
ion
s.•
How
wil
lpu
blic
mar
kets
trea
tth
eco
mpa
ny?
C.D
iffi
cult
yof
Exe
cuti
on:P
rodu
ctan
dT
ech
nol
ogy,
Str
ateg
y
Pro
duct
and/
orte
chn
olog
y27
40.3
•L
ate
stag
esof
prod
uct
deve
lopm
ent
(fir
stpr
odu
ctla
un
chpl
ann
edin
15–1
8m
onth
s).
•S
upe
rior
tech
nol
ogy
wit
hla
rge
mar
ket
pote
nti
al.
•R
evol
uti
onar
yn
ewte
chn
olog
y.•
Has
deve
lope
dex
cell
ent
prod
uct
.•
Has
buil
ta
robu
st,s
cala
ble
syst
emth
atca
nm
eet
the
curr
ent
mar
ket
dem
ands
.•
Bes
tpr
odu
cton
the
mar
ket.
•W
ellt
este
dte
chn
olog
y/pr
odu
ct.
•E
arly
-sta
geco
mpa
ny
wit
hpo
st-b
eta
prod
uct
wit
hco
mpe
ten
t/ex
peri
ence
dte
chn
olog
yte
am.
2131
.3•
Ou
tcom
eof
clin
ical
test
san
dde
velo
pmen
t:M
ust
prov
eth
atte
chn
olog
yis
supe
rior
toot
her
mar
kete
dal
tern
ativ
es,i
nte
rms
ofef
fici
ency
and
side
effe
cts.
•E
arly
stag
ere
sear
chpr
ojec
t:P
roje
ctis
eleg
ant,
ambi
tiou
san
d,co
nse
quen
tly,
diff
icu
lt.
•A
bili
tyto
mak
ete
chn
olog
yw
ork
atta
rget
cost
poin
t.•
No
guar
ante
epr
odu
ctw
illw
ork
ina
full
prod
uct
ion
envi
ron
men
t.•
Iden
tifi
cati
onan
dde
velo
pmen
tof
am
ore
com
pell
ing
prod
uct
.•
Pro
duct
scal
abil
ity
isto
befu
lly
test
ed.

jofi˙673 JOFI.cls May 26, 2004 22:27
Characteristics, Contracts, and Actions 2185
Bu
sin
ess
stra
tegy
/m
odel
3653
.7•
Com
pan
ysi
gnif
ican
tly
redu
ces
cost
sw
hil
em
ain
tain
ing
qual
ity.
•C
ompe
llin
gbu
sin
ess
stra
tegy
.Pre
sen
ceor
like
lih
ood
ofva
lida
tin
gco
rpor
ate
alli
ance
s.•
Ou
tsou
rcin
gm
ean
sle
ssfo
rco
mpa
ny
tom
anag
e.•
Att
ract
ive
and
dem
onst
rate
dpr
ofit
abil
ity
ofbu
sin
ess
mod
el.
•E
xcel
len
tn
ewco
nce
pt.
•Fa
vora
ble
acqu
isit
ion
oppo
rtu
nit
ies,
wh
ich
wil
lbe
driv
erof
grow
th.
•D
isti
nct
ive
stra
tegy
.•
Hig
hva
lue-
adde
d,h
igh
mar
gin
stra
tegy
for
very
litt
leca
pita
lupf
ron
t.•
“Lea
nan
dm
ean
”op
erat
ion
wit
hfe
wem
ploy
ees
and
good
cust
omer
focu
s.•
Pu
repl
ay/f
ocu
sed.
3450
.7•
Rea
lsal
esef
fort
nee
dsto
bem
oun
ted,
wh
ich
isve
ryre
lian
ton
man
agem
ent
team
’sex
peri
ence
tom
anag
epr
ofit
ably
.Tra
nsf
erab
ilit
yof
busi
nes
sm
odel
toot
her
mar
kets
?•
Are
ther
een
ough
can
dida
tes
avai
labl
efo
rac
quis
itio
n?
•W
illc
ompa
ny
beab
leto
ensu
requ
alit
yw
hil
epu
rsu
ing
agr
owth
-th
rou
gh-a
cqu
isit
ion
stra
tegy
?•
How
scal
able
isth
ebu
sin
ess?
Isth
ere
any
oper
atin
gle
vera
gein
the
busi
nes
sm
odel
?•
Lac
kof
focu
s.•
Vu
lner
able
stra
tegy
.•
Exe
cuti
onof
busi
nes
sm
odel
has
yet
tobe
prov
en.
•W
illc
ompa
ny
beab
leto
attr
act
empl
oyee
s?•
VC
due
dili
gen
cesh
owed
that
mar
gin
san
dex
pen
sepe
rcen
tage
sof
exis
tin
gst
ores
hav
eto
bebr
ough
tin
toli
ne
wit
hpr
otot
ype
mod
el.
•K
eypa
rtn
ersh
ips
not
nai
led
dow
n.
•G
eogr
aph
ical
risk
—U
.S.c
orpo
rate
and
fore
ign
R&
D.

jofi˙673 JOFI.cls May 26, 2004 22:27
2186 The Journal of Finance
VCs cite good performance to date in almost 27% and a favorable valuation ora low amount of capital at risk in roughly 20%.
Panel B shows that external factors are also important. VCs cite large andgrowing markets as attractive in almost 69% of the investments; a favorablecompetitive position and a high likelihood of customer adoption, in roughly30%; and favorable exit conditions, in 16%.
Panel C shows that factors related to execution are important as well. In atleast 40% of investments, VCs were attracted by the product/technology or bythe strategy/business model.
C. Investment Risks
While the VCs found the investments attractive on a number of dimensions,Table II also indicates that the VCs viewed the investments as having substan-tial risks.
Panel A shows that the primary internal risk was management, cited asrisky in 61% of the analyses. For example, one CEO was “difficult,” while sev-eral teams were incomplete. This 61% roughly equals the 60% of analysesfor which management was a reason to make the investment. The apparentcontradiction can be reconciled by observing that a VC might think highly ofthe founder, but be uncertain whether the founder can build the rest of theteam.
Panel A also indicates that the other internal factors of valuation, VC mon-itoring cost, downside risk, performance to date, and other investor influenceare concerns in, respectively, 19, 15, 13, 7.5, and 6% of the investments. Twoobservations are worth making about these risks. First, the risks of VC moni-toring costs show that in several instances, the VC worried that the investmentmight require too much time. This indicates that while VCs regularly play amonitoring and advisory role, they do not intend to become excessively involvedin the company. Second, because valuation is endogenous to the contracts, wewill not include it as a risk in the regressions.
Panel B reports external factors that the VCs viewed as risks. In 40, 31, and22%, of the investments, respectively, the VCs perceived competitive, marketsize, and customer adoption risks. Exit conditions were viewed as a risk in fewerthan 8% of the investments.
Panel C reports that execution difficulties are also important risks. In justover 50% of the investments, the VC viewed the strategy or business model asrisky. In 31%, the VC viewed the product and or technology as risky.
In general, the strengths and risks we identify are similar to those empha-sized in the VC strategy and management literature, as well as in anecdotalaccounts.
D. Relation of Strengths, Risks, and Firm Characteristics
Table III explores the relation of strengths and risks to each other and then toexogenous investment characteristics—pre- or postrevenue, first or subsequent

jofi˙673 JOFI.cls May 26, 2004 22:27
Characteristics, Contracts, and Actions 2187
Tab
leII
IR
elat
ion
sb
etw
een
VC
Str
engt
hs,
Ris
ks,
and
Fir
mC
har
acte
rist
ics
Exp
lici
tly
men
tion
edst
ren
gth
san
dri
sks
inin
vest
ing
acco
rdin
gto
ven
ture
capi
tali
stan
alys
esan
dth
eir
rela
tion
toex
ogen
ous
firm
char
acte
rist
ics
for
67po
rtfo
lio
com
pan
ies
by11
ven
ture
capi
tal
part
ner
ship
s.In
vest
men
tsw
ere
mad
ebe
twee
n19
87an
d19
99.
Inte
rnal
risk
isth
eav
erag
eof
the
dum
my
vari
able
sfo
rth
epr
esen
ceof
man
agem
ent
qual
ity,
prev
iou
spe
rfor
man
ce,
fun
ds-a
t-ri
sk/d
own
side
,in
flu
ence
ofot
her
inve
stor
s,an
dco
stly
mon
itor
ing
risk
s(s
tren
gth
s).
Ext
ern
alri
sks
(str
engt
hs)
isth
eav
erag
eof
the
dum
my
vari
able
sfo
rth
epr
esen
ceof
mar
ket,
com
peti
tion
,cu
stom
erad
opti
on,a
nd
fin
anci
alm
arke
t/ex
itri
sks
(str
engt
hs)
.Exe
cuti
onri
sks
(str
engt
hs)
isth
eav
erag
eof
the
dum
my
vari
able
sfo
rpr
odu
ct/t
ech
nol
ogy
and
busi
nes
sm
odel
/str
ateg
yri
sks
(str
engt
hs)
.S
um
ofri
sks
(str
engt
hs)
isth
esu
mof
all
11ri
sk(s
tren
gth
)du
mm
yva
riab
les.
Str
engt
hs
min
us
risk
sis
the
diff
eren
cebe
twee
nsu
mof
risk
san
dsu
mof
stre
ngt
hs.
Pre
reve
nu
est
age
rou
nds
are
fin
anci
ng
rou
nds
for
com
pan
ies
that
had
no
reve
nu
esat
the
tim
eof
the
fin
anci
ng.
Fir
stV
Cin
vest
men
tsre
fer
toth
ero
un
dsin
volv
ing
the
firs
tti
me
any
ven
ture
capi
tal
fun
din
vest
edin
the
com
pan
y.In
dust
ryR
&D
/Sal
esis
the
aggr
egat
eR
&D
expe
nse
tosa
les
for
publ
icfi
rms
inth
eve
ntu
re’s
thre
e-di
git
SIC
indu
stry
,acc
ordi
ng
toC
OM
PU
ST
AT.
CA
(Non
-CA
)in
vest
men
tin
dica
tes
that
the
port
foli
oco
mpa
ny
was
(not
)lo
cate
din
Cal
ifor
nia
atth
eti
me
offi
nan
cin
g.L
ead
inve
stor
indi
cate
dth
atth
em
emo
was
wri
tten
byth
eV
Cfi
rmpr
ovid
ing
the
larg
est
amou
nt
offi
nan
cin
gam
ong
the
VC
sin
vest
ing
inth
ero
un
d.D
ata
onfu
nds
rais
edby
VC
firm
sar
eta
ken
from
ven
ture
econ
omic
s.In
pan
elB
,ast
eris
ksin
dica
tesi
gnif
ican
tdi
ffer
ence
su
sin
gei
ther
aM
ann
–Wh
itn
eyor
aK
rusk
al–W
alli
s(f
orV
Cdu
mm
ies)
test
,wh
ile
inpa
nel
Aas
teri
sks
indi
cate
sign
ific
ant
corr
elat
ion
coef
fici
ents
at1%
∗∗∗ ,
5%∗∗
,an
d10
%∗
leve
ls.
A.C
orre
lati
ons
betw
een
Str
engt
hs
and
Ris
ks(B
ivar
iate
Pea
rson
Cor
rela
tion
Coe
ffic
ien
ts)
Str
engt
hs
No.
ofIn
tern
alIn
tern
alE
xter
nal
Ext
ern
alE
xecu
tion
Exe
cuti
onM
inu
sP
ages
inS
tren
gth
sR
isks
Str
engt
hs
Ris
ksS
tren
gth
sR
isks
Ris
ksM
emo
Inte
rnal
stre
ngt
hs
1.00
00.
051
0.02
2−0
.095
0.00
5−0
.038
0.52
7∗∗∗
0.13
2In
tern
alri
sks
0.05
11.
000
0.31
5∗∗∗
0.29
1∗∗
−0.1
25−0
.012
−0.4
7∗∗∗
0.55
8∗∗∗
Ext
ern
alst
ren
gth
s0.
022
0.31
5∗∗∗
1.00
00.
334∗
∗∗−0
.002
−0.0
060.
256∗
∗0.
442∗
∗∗E
xter
nal
risk
s−0
.095
0.29
1∗∗
0.33
4∗∗∗
1.00
00.
089
0.08
9−0
.45∗
∗∗0.
215∗
Exe
cuti
onst
ren
gth
s0.
005
−0.1
25−0
.002
0.08
91.
000
0.26
4∗∗
0.25
4∗∗
−0.0
25E
xecu
tion
risk
s−0
.038
−0.0
12−0
.006
0.08
90.
264∗
∗1.
000
−0.2
84∗∗
0.02
4S
tren
gth
sm
inu
sri
sks
0.52
7∗∗∗
−0.4
7∗∗∗
0.25
6∗∗
−0.4
5∗∗∗
0.25
4∗∗
−0.2
84∗∗
1.00
0−0
.085
No.
ofpa
ges
inm
emo
0.13
20.
558∗
∗∗0.
442∗
∗∗0.
215∗
−0.0
250.
024
−0.0
851.
000

jofi˙673 JOFI.cls May 26, 2004 22:27
2188 The Journal of Finance
Tab
leII
I—C
onti
nu
ed
B.R
elat
ion
ofR
isk
Fact
ors
and
Str
engt
hs
toD
ealC
har
acte
rist
ics
CA
Lea
d1st
(N=
44)/
Ind.
R&
D/
Bef
ore
(N=
25)/
(N=
57)/
VC
Rai
sed
Pre
-(N
=21
)/S
ubs
equ
ent
Sal
es<
9%(N
=37
)/N
on-C
AN
on-L
ead
>6
(N=
33)/
VC
All
Obs
.P
ost-
(N=
46)
(N=
23)
(N=
32)/
Aft
er(N
=30)
(N=
42)
(N=
10)
<=6
Fu
nds
Du
mm
ies
(N=
67)
Rev
enu
eR
oun
d>
=9%
(N=
34)
Jan
.1,1
998
Inve
stm
ent
Inve
stor
(N=
34)
χ2(1
0)=
Inte
rnal
stre
ngt
hs
26.0
26.7
/25.
624
.6/2
8.7
23.1
/28.
224
.1/2
8.6
27.2
/25.
225
.3/3
0.0
25.4
/26.
58.
6In
tern
alri
sks
20.9
22.9
/20.
023
.2/1
6.5
29.4
/12.
4∗∗∗
19.0
/23.
612
.8/2
5.7∗
∗22
.1/1
4.0
21.2
/20.
632
.4∗∗
∗E
xter
nal
stre
ngt
hs
36.9
38.1
/36.
439
.2/3
2.6
39.8
/34.
637
.8/3
5.7
28.0
/42.
3∗∗
38.2
/30.
039
.6/3
5.3
20.5
∗∗E
xter
nal
risk
s25
.021
.4/2
6.6
27.8
/19.
631
.2/1
9.8∗
∗25
.6/2
4.1
17.0
/29.
8∗∗∗
26.3
/17.
524
.2/2
5.7
27.1
∗∗∗
Exe
cuti
onst
ren
gth
s47
.033
.3/5
3.2∗
∗44
.3/5
2.2
37.5
/55.
9∗∗
46.2
/48.
252
.0/4
4.0
49.1
/35.
047
.0/4
7.1
7.7
Exe
cuti
onri
sks
41.0
31.0
/45.
6∗40
.9/4
1.3
35.9
/45.
641
.0/4
1.1
40.0
/41.
742
.1/3
5.0
43.9
/38.
213
.6
Su
mof
stre
ngt
hs
3.72
3.52
/3.8
03.
68/3
.78
3.50
/3.9
23.
64/3
.82
3.52
/3.8
33.
77/3
.40
3.76
/3.6
816
.1∗
Su
mof
risk
s2.
872.
62/2
.98
3.09
/2.4
33.
44/2
.32∗
∗∗2.
79/2
.96
2.12
/3.3
1∗∗∗
3.00
/2.1
02.
91/2
.82
37.8
∗∗∗
Str
engt
hs
min
us
risk
s0.
850.
90/0
.83
0.59
/1.3
5∗0.
06/1
.59∗
∗∗0.
85/0
.86
1.40
/0.5
20.
77/1
.30
0.85
/0.8
525
.2∗∗
∗N
o.of
page
sin
mem
o6.
237.
14/5
.82
6.91
/4.9
67.
66/4
.92
6.69
/5.6
14.
80/7
.10∗
∗6.
84/2
.80∗
∗5.
79/6
.68
43.7
∗∗∗

jofi˙673 JOFI.cls May 26, 2004 22:27
Characteristics, Contracts, and Actions 2189
round, industry research and development, pre- or post-1998, California or non-California investment, lead or nonlead investor, and VC firm experience.
We measure strengths and risks as the average of the dummy variables foreach type of strength and risk. Internal risk (strength) is the average of thedummy variables for the presence of management quality, previous perfor-mance, funds-at-risk/downside, influence of other investors, and costly mon-itoring risk (strength). External risk (strength) is the average of the dummyvariables for the presence of market, competition, customer adoption, and fi-nancial market/exit risk (strength). Execution risk (strength) is the averageof the dummy variables for product/technology and business model/strategyrisk (strength). These definitions normalize the measures to lie between zeroand one. While these variables may not capture all available information, theyreduce the extent to which we subjectively interpret the investment analyses.
Panel A shows that internal risks are correlated with external strengths andrisks. External strengths and risks are correlated with each other, as are exe-cution strengths and risks. While the length of the investment memo capturessome relevant information, it is significantly related to only half the risks andstrengths.
Panel B relates strengths and risks to other investment characteristics. Mostof the significant differences are found across different industries and geogra-phies. These effects are hard to disentangle from particular VCs because VCstend to concentrate in particular industries and in particular geographies.7 Insubsequent regressions, we control for these effects using the investment char-acteristic variables and VC dummies. Panel B also shows that memos are longerfor non-California investments and those in which the VC is the lead investor(57 investments.)
Finally, it is worth pointing out that measures of stage of development—pre-or postrevenue and first VC round—are not particularly correlated with ourrisk measures, suggesting that the risk measures pick up risks that are notdriven by stage.
E. VC Actions
Many papers have studied the role of VCs in assisting and monitoring theirportfolio companies. Gorman and Sahlman (1989), MacMillan, Kulow, andKhoylian (1988), Sapienza (1992), and Sapienza, Manigart, and Vermeir (1996)survey VCs and find that VCs spend substantial time and effort monitoring andsupporting their investments. Using data provided by start-ups, Hellman andPuri (2000 and 2002) find that firms financed by VCs bring products to mar-ket more quickly and are more likely to professionalize their human resourcefunctions. Lerner (1995) and Baker and Gompers (2001) find that VCs play animportant role on the board of directors.
7 For example, all our retail deals come from one VC who specializes in retail deals, and the sameis true for our healthcare ventures.

jofi˙673 JOFI.cls May 26, 2004 22:27
2190 The Journal of Finance
Table IVVenture Capitalist Actions
Venture capitalist (VC) actions before investment and anticipated at the time of investment forinvestments in 67 portfolio companies by 11 venture capital partnerships. Investments were madebetween 1987 and 1999.
Number (%)of Companies
ManagementVC active in recruiting or changing management team before investing 11 (16%)VC expects to be active in recruiting or changing management team after 29 (43%)
investingAny of the above 34 (51%)
Strategy/Business ModelVC explicitly active in shaping strategy/business model before investing 6 (9%)VC explicitly expects to be active in shaping strategy/business model after 20 (30%)
investingAny of the above 23 (34%)Examples:
Design employee compensationArrange vendor financing agreementsInstall information and internal accounting systemsHelp company exit noncore businessesImplement currency hedging programHire market research firm to help with new store locationsAssist with development of marketing planAssist with mergers and acquisitionsDevelop business plan, budget, financial forecastsMonitor R&D and product management effortsRefine pricing model and work on major account strategyAssist technical service teamLeverage VC strategic relationships
The results in previous work are all either survey-based or indirect. We usethe VC analyses to complement and corroborate that previous work by reportingthe actions that the VC took before investing and the actions the VC expectedto undertake after investing.
Table IV confirms that VCs help shape and recruit the management team.In 16% of the investments, the VC plays such a role before investing; in 43%,the VC expects to play such a role afterward. VCs also help shape the strat-egy and the business model before investing (in 9% of the investments) andexpect to be active in these areas afterward (in 30%). These actions includedesign of employee compensation, development of business plans and budgets,implementation of information and accounting systems, and assistance withacquisitions.8
8 Although not reported in a table, the extent of VC actions is highly correlated with the VCsand with industry.

jofi˙673 JOFI.cls May 26, 2004 22:27
Characteristics, Contracts, and Actions 2191
Our results likely understate the actions VCs take because we observe onlythose actions the VCs (a) reported as important and (b) had done or planned atthe time of investment. Even so, the results support and complement those inHellman and Puri (2002). In addition to actions traditionally associated withmonitoring (replacing management after poor performance), our results con-firm that VCs assist founders in running and professionalizing the business.
III. The Relationship between VC Risk Factorsand Contractual Terms
In this section, we compare the direct VC risk assessments to the financialcontracts. The regressions utilize our summary measures of internal, external,and execution risk as independent variables. In the regression analysis, wefocus on the (investment) risk measures defined above rather than the (invest-ment) strength measures because the predictions from the theories as well asprevious empirical work focus on risks.
One concern with only using the risk measures is that they might measurenegatives rather than uncertainty. Accordingly, the regressions attempt to con-trol for the overall attractiveness of an investment by including the average ofthe strengths less the risks in all the regressions.9
A. The Effect of Risk on the Provision of Founder Cash Flow Incentives
Table V investigates the relation of the risk measures to measures of foundercash flow incentives. The regressions use three different dependent variablesto measure founder cash flow incentives—the fraction of cash flow rights heldby the founder, the sensitivity of those rights to explicit benchmarks, and thesensitivity to time vesting.
The fraction of cash flow rights held by the founder equals the fully dilutedpercentage of equity the founder would own in a best case scenario in which allperformance benchmarks are met and full-time vesting occurs.
While the fraction of cash flow rights provides one measure of pay-for-performance, it is imperfect in that it also measures the division of value. Be-cause the founder is typically cash constrained, the VC is likely to requiregreater cash flow rights than would be optimal from an incentive perspec-tive.10 VCs can increase the pay-for-performance sensitivity in two alternativeways—using vesting based on explicit performance benchmarks and using timevesting.
The sensitivity of cash flow rights to explicit benchmarks measures the per-centage of a founder’s fully diluted equity stake that vests subject to explicit
9 The company’s premoney value also provides a possible measure of attractiveness. We do notinclude premoney value in the reported regressions because it is likely to be endogenous withrespect to the risks. In unreported regressions, we obtain qualitatively similar results when we doinclude premoney value.
10 Inderst and Mueller (2003) make this point in a model of venture capital.

jofi˙673 JOFI.cls May 26, 2004 22:27
2192 The Journal of Finance
Tab
leV
Rel
atio
nb
etw
een
Fou
nd
erP
ayP
erfo
rman
ceIn
cen
tive
san
dV
CR
isk
An
alys
es:M
ult
ivar
iate
An
alys
isR
elat
ion
ship
betw
een
ven
ture
capi
tali
st(V
C)
risk
anal
yses
and
con
trac
tual
term
sfo
rin
vest
men
tsin
67po
rtfo
lio
com
pan
ies
by11
ven
ture
capi
tal
part
ner
ship
s.In
vest
men
tsw
ere
mad
ebe
twee
n19
87an
d19
99.T
he
depe
nde
nt
vari
able
sar
em
easu
res
offo
un
der
pay
perf
orm
ance
ince
nti
ves:
Fou
nde
req
uit
y%
isth
epe
rcen
tage
ofeq
uit
yow
ned
byth
efo
un
ders
ifpe
rfor
man
cebe
nch
mar
ksar
em
etan
dal
lfou
nde
ran
dem
ploy
eeeq
uit
yve
st,f
ull
ydi
lute
d.T
he
%of
fou
nde
req
uit
ys.
t.be
nch
mar
ks(v
esti
ng)
isth
edi
ffer
ence
info
un
ders
’res
idu
alca
shfl
owri
ghts
(i.e
.equ
ity)
ifth
eym
eetp
erfo
rman
ce(t
ime
vest
ing)
ben
chm
arks
,as
ape
rcen
tage
ofth
efo
un
der
equ
ity
%.T
he
inde
pen
den
tva
riab
les
are
mea
sure
sas
foll
ows:
Deg
ree
ofex
tern
alri
skis
the
aver
age
ofth
edu
mm
yva
riab
les
for
the
pres
ence
ofm
arke
tri
sk,c
ompe
titi
onri
sk,c
ust
omer
adop
tion
risk
,an
dfi
nan
cial
mar
ket/
exit
risk
.Deg
ree
ofin
tern
alri
skis
the
aver
age
ofth
edu
mm
yva
riab
les
for
the
pres
ence
ofm
anag
emen
tqu
alit
yri
sk,q
ues
tion
able
perf
orm
ance
risk
,fu
nds
-at-
risk
/dow
nsi
de,n
egat
ive
infl
uen
ceof
oth
erin
vest
ors
risk
,an
dco
stly
mon
itor
ing
risk
.Deg
ree
ofex
ecu
tion
risk
isth
eav
erag
eof
the
dum
my
vari
able
sfo
rpr
odu
ct/t
ech
nol
ogy
risk
and
busi
nes
sm
odel
/str
ateg
yri
sk.S
um
ofri
sks
(str
engt
hs)
isth
esu
mof
all1
1ri
sk(s
tren
gth
)du
mm
yva
riab
les.
Str
engt
hs
min
us
risk
sis
the
sum
ofal
l11
risk
dum
my
vari
able
sm
inu
sth
esu
mof
all
11st
ren
gth
dum
my
vari
able
s.F
irst
VC
fin
anci
ng
rou
nd
take
sth
eva
lue
ofon
eif
no
VC
sh
adin
vest
edin
the
com
pan
ypr
evio
us
toth
isro
un
d,an
dze
root
her
wis
e.P
rere
ven
ue
ven
ture
take
sth
eva
lue
ofon
eif
the
ven
ture
isn
otge
ner
atin
gan
yre
ven
ues
atth
eti
me
offi
nan
cin
g,an
dze
root
her
wis
e.R
epea
ten
trep
ren
eur
take
sth
eva
lue
ofon
eif
the
fou
nde
r’s
prev
iou
sve
ntu
rew
asta
ken
publ
icor
sold
topu
blic
com
pan
y.In
dust
ryR
&D
/Sal
esis
the
aggr
egat
eR
&D
expe
nse
tosa
les
for
publ
icfi
rms
inth
eve
ntu
re’s
thre
e-di
git
SIC
indu
stry
,acc
ordi
ng
toC
OM
PU
ST
AT.
Cal
ifor
nia
deal
isa
dum
my
vari
able
indi
cati
ng
that
the
port
foli
oco
mpa
ny
was
loca
ted
inC
alif
orn
iaat
the
tim
eof
fin
anci
ng.
Wh
ite
(198
0)ro
bust
stan
dard
erro
rsar
ein
pare
nth
eses
.Ast
eris
ksin
dica
tesi
gnif
ican
tdi
ffer
ence
sat
1%∗∗
∗ ,5%
∗∗,a
nd
10%
∗le
vels
.
Dep
ende
nt
Var
iabl
e
Fou
nde
rF
oun
der
%of
Fou
nde
rE
quit
ys.
t.%
ofF
oun
der
Equ
ity
s.t.
%of
Fou
nde
rE
quit
ys.
t.%
ofF
oun
der
Equ
ity
s.t.
Equ
ity
%(O
LS
)E
quit
y%
(OL
S)
Ben
chm
arks
(OL
S)
Ben
chm
arks
(OL
S)
Ves
tin
g(O
LS
)V
esti
ng
(OL
S)
Deg
ree
ofin
tern
alri
sk−1
4.51
(10.
44)
−13.
48(9
.50)
34.8
(13.
7)∗∗
32.3
4(1
4.58
)∗∗2.
0(2
5.3)
21.0
8(2
6.50
)D
egre
eof
exte
rnal
risk
−10.
78(7
.54)
−10.
89(8
.21)
14.2
(5.8
)∗∗11
.63
(5.8
2)∗∗
17.8
(17.
4)25
.16
(21.
03)
Deg
ree
ofex
ecu
tion
risk
0.03
(7.1
4)−0
.70
(7.8
4)−2
.4(5
.0)
1.35
(4.7
6)24
.5(1
4.6)
∗31
.11
(15.
32)∗∗
Str
engt
hs
min
us
risk
s21
.52
(16.
16)
17.2
9(1
7.19
)23
.3(1
0.5)
∗∗23
.70
(13.
10)∗
7.7
(30.
5)16
.93
(29.
23)
Fir
stV
Cfi
n.r
oun
d16
.63
(4.8
9)∗∗
∗15
.08
(5.8
0)∗∗
1.7
(2.5
)4.
72(2
.58)
∗−4
.4(8
.9)
−1.0
7(9
.67)
Rep
eat
entr
epre
neu
r−3
.52
(6.2
2)−3
.40
(6.4
0)−5
.2(3
.3)
−2.9
7(2
.69)
−3.2
(11.
6)2.
06(1
2.22
)P
re-r
even
ue
ven
ture
4.77
(4.8
0)0.
64(6
.52)
11.3
(4.4
)∗∗9.
21(5
.49)
∗25
.4(1
1.6)
∗∗11
.55
(15.
22)
Indu
stry
R&
D/S
ales
,%−1
.61
(1.2
2)−0
.92
(0.5
3)∗
3.73
(2.1
3)∗
Cal
ifor
nia
deal
−0.6
3(3
.99)
−3.9
2(2
.49)
3.13
(10.
47)
1998
–99
dum
my
−5.0
9(4
.44)
−1.0
0(5
.85)
−9.2
5(1
1.28
)B
iote
ch17
.89
(11.
49)
5.67
(8.3
7)25
.53
(21.
66)
Inte
rnet
5.25
(6.8
0)4.
13(6
.81)
17.3
5(1
4.54
)O
ther
IT/S
oftw
are
7.34
(6.4
1)1.
89(4
.42)
16.3
7(1
8.18
)T
elec
om−4
.09
(8.6
8)11
.50
(9.4
5)69
.80
(21.
70)∗∗
∗
F-t
est
Indu
stry
[p-v
alu
e]0.
79[0
.54]
0.54
[0.7
1]2.
98[0
.03]
∗∗
VC
dum
mie
sYe
sYe
sYe
sYe
sYe
sYe
sF
-tes
tV
Cdu
m.[
p-va
lue]
4.05
[0.0
0]∗∗
∗3.
11[0
.016
]∗∗1.
29[0
.28]
1.58
[0.1
8]1.
67[0
.16]
2.14
[0.0
8]∗
Adj
ust
edR
20.
390.
380.
400.
450.
140.
17S
ampl
esi
ze67
6767
6767
67

jofi˙673 JOFI.cls May 26, 2004 22:27
Characteristics, Contracts, and Actions 2193
performance benchmarks. For example, if a founder owns 30% of a company’sequity and can earn an additional 10% if the founder meets the performancebenchmark, then this measure will equal 25% (10% divided by a total of 40%).We view this measure as a clearer indicator of pay-for-performance sensitivity.11
The sensitivity of cash flow rights to time vesting measures the percent-age of a founder’s fully diluted equity stake that vests subject to the founderremaining employed at the company for a stated period of time. This sensi-tivity is calculated in the same way as the sensitivity to explicit benchmarks.Time vesting makes it more costly for the entrepreneur to leave the firm, andtherefore should be used when the entrepreneur’s human capital is particularlyimportant.
There are two shortcomings to our analyses. First, we lack data on cashsalaries and bonuses. We do not view this as a major problem. Just as cashcompensation is relatively less important than equity-based compensation fortop executives of large public companies, it should be even less important for ex-ecutives of start-ups.12 Second, cash flow incentives are more complex than wecan measure. There is a complicated interaction between the entrepreneur’sincentives in the current round and incentives in future rounds. This is be-cause the entrepreneur’s performance will affect valuations in future roundsand therefore subsequent cash flow rights. We attempt to control for this by in-cluding dummy variables for whether the venture has revenues and for whetherthe round is the first VC financing.
The primary independent variables in the regressions are our three mea-sures of investment risk and our control for investment attractiveness. Theregressions also include a number of controls: industry R&D to sales; whetherany of the founders have founded a venture that was taken public or sold toa public company; whether the company is in California; and whether the fi-nancing takes place after 1997, industry, and VC.13 These controls are includedto increase the likelihood that we isolate the effects of the risk variables. Inunreported regressions, we also control for the annual level of commitments toVC partnerships, whether the VC was the lead investor, the number of pagesin the investment analysis, and industry market-to-book. None of those vari-ables is consistently significant, and our primary results are qualitatively andstatistically identical.
The first two regressions in Table V show that internal and external risks arenegatively related to founder equity percentage, but not significantly so. At thesame time, the net attractiveness of the investment (strengths minus risks) ispositively, but not significantly related to the founder equity percentage. Whenthe risk measures are excluded (in unreported regressions), net attractivenessis positive and highly significant (at the 1% level), suggesting that there is some
11 Our results are qualitatively similar when we use the raw percentage subject to performancebenchmark vesting.
12 On the other hand, because founders of VC backed start-ups are likely to have less outsidewealth than CEOs of large corporations, this measure of incentives may be “cleaner” than those inprevious CEO-compensation studies.
13 Because we only have a few observations for some of the VCs, we include a VC dummy onlyfor the five VCs who have more than four investments in the sample.

jofi˙673 JOFI.cls May 26, 2004 22:27
2194 The Journal of Finance
collinearity and that founder equity percentage is more a measure of value thana measure of pay-for-performance incentives.14
The next two regressions in Table V consider the use of explicit performancebenchmarks in equity compensation. Explicit performance benchmarks can bebased on financial performance (sales or profits), nonfinancial performance(obtaining a patent or a customer), and actions (hiring a CEO). Kaplan andStromberg (2003) describe these in greater detail.
The use of performance benchmarks increases strongly in internal risk. Thecoefficient on internal risk is the largest of the coefficients on the differentrisk variables. This is supportive of the agency predictions. We find a smaller,but significantly positive relation between external risk and benchmark com-pensation. This is contrary to the standard risk-sharing theoretical prediction,but consistent with the monitoring-related theories.15 Finally, the use of perfor-mance benchmarks also increases with the net attractiveness of the investment.Net attractiveness is included in this regression as a control, so the implica-tion of this result is theoretically less clear. The risk results are unaffected byremoving the net attractiveness variable.
The last two regressions of Table V analyze founder time vesting. Time vest-ing increases significantly with execution risk, but is not significantly relatedto internal and external risks. The positive relation between execution risk andvesting is consistent with the mitigation of hold-up problems along the lines ofHart and Moore (1994).16
B. The Effect of Risk on the Allocation of Control
We now relate the three risk variables to the allocation of board control be-tween the VC and the founder. We use two specifications of board control. First,we run a probit specification in which the dependent variable is a dummy forwhether the VCs control more than half of the board seats at the time of fi-nancing. Second, we run an ordered probit specification in which the depen-dent variable has three levels of VC control. The variable: (i) equals zero if thefounder always controls a majority; (ii) equals one if outside board members arealways pivotal or the VC controls the board only if the firms fail to meet somemilestone or covenant; and (iii) equals two if the VC always controls a majority.(We obtain similar results with four levels of VC control.)
Table VI displays the results using the two specifications. Internal and ex-ternal risk measures are associated with more VC board control and are highlysignificant. The coefficients are of roughly equal magnitudes. The internal risk
14 In unreported regressions, net attractiveness is significantly positively related to premoneyvalue—the implied value of the company’s prefinancing equity.
15 The positive relationship between incentives and idiosyncratic risk has also been found byAllen and Lueck (1992), Core and Guay (1999), and Lafontaine (1992). Aggarwal and Samwick(1998) is one of the few studies that find the predicted negative relationship. Bhattacharyya andLafontaine (1995) also discuss possible explanations for these conflicting results.
16 An alternative interpretation is that time vesting is used as an alternative to explicit bench-marks when multitasking problems inherent in more complicated circumstances make benchmarkcompensation inefficient.

jofi˙673 JOFI.cls May 26, 2004 22:27
Characteristics, Contracts, and Actions 2195
Tab
leV
IR
elat
ion
bet
wee
nA
lloc
atio
ns
ofB
oard
Con
trol
Rig
hts
and
VC
Ris
kA
nal
yses
:Mu
ltiv
aria
teA
nal
ysis
Rel
atio
nsh
ipbe
twee
nve
ntu
reca
pita
list
(VC
)ris
kan
alys
esan
dco
ntr
actu
alte
rms
for
inve
stm
ents
in67
port
foli
oco
mpa
nie
sby
11ve
ntu
reca
pita
lpar
tner
ship
s.In
vest
men
tsw
ere
mad
ebe
twee
n19
87an
d19
99.I
nth
efi
rst
fou
rre
gres
sion
sth
ede
pen
den
tva
riab
leta
kes
the
valu
eof
one
ifth
eV
Cal
way
sco
ntr
ols
mor
eth
anh
alft
he
boar
dse
ats,
and
zero
oth
erw
ise.
Inth
ela
sttw
ore
gres
sion
sth
ede
pen
den
tva
riab
leta
kes
the
valu
eof
zero
ifth
efo
un
der
alw
ays
con
trol
am
ajor
ity
ofth
ebo
ard
seat
s,on
eif
outs
ide
boar
dm
embe
rsar
eal
way
spi
vota
lor
ifth
eV
Cco
ntr
ols
the
boar
don
lyif
the
firm
sfa
ils
tom
eet
som
em
iles
ton
eor
cove
nan
t,an
dtw
oif
the
VC
alw
ays
con
trol
sm
ore
than
hal
fth
ebo
ard.
Deg
ree
ofex
tern
alri
skis
the
aver
age
ofth
edu
mm
yva
riab
les
for
the
pres
ence
ofm
arke
tri
sk,c
ompe
titi
onri
sk,c
ust
omer
adop
tion
risk
,an
dfi
nan
cial
mar
ket/
exit
risk
.Deg
ree
ofin
tern
alri
skis
the
aver
age
ofth
edu
mm
yva
riab
les
for
the
pres
ence
ofm
anag
emen
tqu
alit
yri
sk,q
ues
tion
able
perf
orm
ance
risk
,fu
nds
-at-
risk
/dow
nsi
de,
neg
ativ
ein
flu
ence
ofot
her
inve
stor
sri
sk,
and
cost
lym
onit
orin
gri
sk.
Deg
ree
ofex
ecu
tion
risk
isth
eav
erag
eof
the
dum
my
vari
able
sfo
rpr
odu
ct/t
ech
nol
ogy
risk
and
busi
nes
sm
odel
/str
ateg
yri
sk.S
um
ofri
sks
(str
engt
hs)
isth
esu
mof
all1
1ri
sk(s
tren
gth
)du
mm
yva
riab
les.
Str
engt
hs
min
us
risk
sis
the
sum
ofal
l11
risk
dum
my
vari
able
sm
inu
sth
esu
mof
all1
1st
ren
gth
dum
my
vari
able
s.F
irst
VC
fin
anci
ng
rou
nd
take
sth
eva
lue
ofon
eif
no
VC
sh
adin
vest
edin
the
com
pan
ypr
evio
us
toth
isro
un
d,an
dze
root
her
wis
e.P
rere
ven
ue
ven
ture
take
sth
eva
lue
ofon
eif
the
ven
ture
isn
otge
ner
atin
gan
yre
ven
ues
atth
eti
me
offi
nan
cin
g,an
dze
root
her
wis
e.R
epea
ten
trep
ren
eur
take
sth
eva
lue
ofon
eif
the
fou
nde
r’s
prev
iou
sve
ntu
rew
asta
ken
publ
icor
sold
toa
publ
icco
mpa
ny.
Indu
stry
R&
D/S
ales
isth
eag
greg
ate
R&
Dex
pen
seto
sale
sfo
rpu
blic
firm
sin
the
ven
ture
’sth
ree-
digi
tS
ICin
dust
ry,a
ccor
din
gto
CO
MP
US
TA
T.C
alif
orn
iade
alis
adu
mm
yva
riab
lein
dica
tin
gth
atth
epo
rtfo
lio
com
pan
yw
aslo
cate
din
Cal
ifor
nia
atth
eti
me
offi
nan
cin
g.S
tan
dard
erro
rsar
ein
pare
nth
eses
(for
the
sim
ple
prob
itre
gres
sion
s,W
hit
ero
bust
stan
dard
erro
rsar
esh
own
).A
ster
isks
indi
cate
sign
ific
ant
diff
eren
ces
at1%
∗∗∗ ,
5%∗∗
,an
d10
%∗
leve
ls.
Insp
ecif
icat
ion
3,10
obse
rvat
ion
sh
adto
bedr
oppe
dbe
cau
seof
coll
inea
rity
:on
eof
the
VC
fun
ds,
spec
iali
zin
gin
the
reta
ilin
dust
ry,d
idn
otin
itia
lly
hav
ea
maj
orit
yof
boar
dse
ats
for
any
ofth
eir
inve
stm
ents
inou
rsa
mpl
e.
Dep
ende
nt
Var
iabl
eV
Ch
asM
ajor
ity
ofV
Ch
asM
ajor
ity
ofV
Ch
asM
ajor
ity
ofV
Ch
asM
ajor
ity
ofD
egre
eof
VC
Boa
rdD
egre
eof
VC
Boa
rdB
oard
Sea
ts(p
robi
t)B
oard
Sea
ts(p
robi
t)B
oard
Sea
ts(p
robi
t)B
oard
Sea
ts(p
robi
t)C
ontr
ol(o
rd.p
robi
t)C
ontr
ol(o
rd.p
robi
t)
Con
stan
t−2
.34
(0.7
6)∗∗
∗−3
.4(1
.1)∗
∗∗−3
.19
(1.5
9)∗∗
Deg
ree
ofin
tern
alri
sk3.
12(1
.02)
∗∗∗
2.26
(0.9
7)∗∗
3.85
(1.3
9)∗∗
∗3.
22(1
.20)
∗∗∗
1.94
(0.9
7)∗∗
1.68
(0.9
8)∗
Deg
ree
ofex
tern
alri
sk2.
46(0
.96)
∗∗∗
2.08
(0.9
5)∗∗
3.02
(1.0
6)∗∗
∗3.
33(1
.43)
∗∗2.
06(0
.78)
∗∗∗
2.37
(0.8
4)∗∗
∗D
egre
eof
exec
uti
onri
sk−0
.29
(0.7
0)−0
.14
(0.7
0)−0
.93
(1.0
5)−1
.50
(0.9
0)∗
−0.1
8(0
.63)
−0.1
3(0
.65)
Str
engt
hs
min
us
risk
s1.
99(1
.60)
1.69
(1.5
5)−0
.76
(2.0
3)0.
89(1
.98)
0.59
(1.3
1)1.
37(1
.41)
Fir
stV
Cfi
n.r
oun
d−1
.47
(0.4
5)∗∗
∗−0
.94
(0.5
4)∗
−2.2
0(0
.57)
∗∗∗
−2.4
3(0
.78)
∗∗∗
−1.8
9(0
.50)
∗∗∗
−2.1
3(0
.57)
∗∗∗
Rep
eat
entr
epre
neu
r0.
91(0
.58)
0.78
(0.5
7)1.
07(0
.70)
0.91
(0.5
5)∗
0.63
(0.5
3)0.
48(0
.56)
Pre
reve
nu
eve
ntu
re1.
19(0
.51)
∗∗1.
06(0
.52)
∗∗1.
13(0
.54)
∗∗2.
45(0
.82)
∗∗∗
1.13
(0.4
7)2.
40(0
.65)
∗∗∗
%V
Ceq
uit
y2.
38(1
.29)
∗∗∗
Indu
stry
R&
D/S
ales
,%0.
05(0
.11)
0.02
(0.0
6)C
alif
orn
iade
al−1
.44
(0.5
8)∗∗
−0.7
0(0
.46)
1998
–99
dum
my
1.13
(0.6
1)∗
1.43
(0.5
4)∗∗
∗B
iote
ch−1
.15
(1.5
6)−1
.17
(0.9
9)In
tern
et1.
29(0
.96)
0.10
(0.6
5)O
ther
IT/S
oftw
are
0.79
(1.1
3)0.
20(0
.65)
Tel
ecom
−0.0
8(0
.97)
−0.3
9(0
.66)
χ2-t
est
Indu
stry
[p-v
alu
e]6.
14[0
.189
]2.
93[0
.570
]V
Cdu
mm
ies
No
No
Yes
No
Yes
No
χ2-t
est
VC
dum
.[p-
valu
e]1.
34[0
.854
]4.
72[0
.451
]P
seu
doR
20.
330.
360.
390.
490.
310.
37O
rder
edpr
obit
cut-
offs
:0
to1
−1.5
9(1
.24)
−0.3
3(1
.14)
1to
21.
40(1
.19)
2.98
(1.1
9)S
ampl
esi
ze66
6656
6666
66

jofi˙673 JOFI.cls May 26, 2004 22:27
2196 The Journal of Finance
result is supportive of the agency models focusing on control such as Aghion–Bolton (1992). The external risk result again is supportive of the monitoring-related theories, such as Dessein (2001), rather than the risk-sharing theories.
Execution risk has a negative sign and is statistically significant in one spec-ification. One explanation is that it would be inefficient for the VC to exercisecontrol (e.g., by replacing management) because so much of the firm value istied up in the founder’s human capital.
We obtain qualitatively similar results (that we do not report) when we usevoting control rather than board control. We believe that for most corporatedecisions, board control is the more important measure (see Lerner (1995)).
C. The Effect of Risk on Staging of Funds and the Allocationof Liquidation Rights
In this section, we investigate the relationship of staging and liquidationrights to the VC risk factors. First, we address staging and distinguish be-tween two types: ex ante (within-round) and ex post (between-round) staging.In an ex ante staged deal, part of the VC’s funding in the round is contingenton explicit financial or nonfinancial performance milestones, giving the VC theability to liquidate if the milestones are not met. We measure ex ante stagingas the fraction of the funds in a round contingent on milestones. In an ex poststaged deal, the venture will require more funding in a subsequent (and newlynegotiated) round. The number of months until the next financing round mea-sures the VC’s ability to liquidate if performance is unsatisfactory. The abilityto liquidate declines as the months until the next round increases.
The regressions in Table VII present our staging results. Ex ante stagingusing explicit milestones is related to internal risk. This is consistent with exante staging being a way for good firms to signal their type (or for VCs to screenout bad firms), similar to the way short-term debt is used in the models of Ross(1977) and Diamond (1991).
Ex post staging increases in internal risk, but not significantly so. Ex poststaging however increases significantly in external risk–the months until thenext VC round decreases with external risk—suggesting that agency problemsmay not be the key driver of ex post staging.
Table VIII investigates the relation of risks to debt-like contract features:(i) redemption rights; (ii) the VCs claim in redemption or liquidation; and(iii) antidilution provisions.
The dependent variable in the first two regressions is whether the VC hasredemption rights. Redemption rights give the VC the right to demand that thefirm repay the VC’s claim at a stated liquidation value at a stated time afterthe investment. Redemption rights are increasing in external risk and in thenet attractiveness of the investment, but are not related to internal risk. Again,this does not seem consistent with an agency explanation.
The dependent variable in the next two regressions in Table VIII measureswhether the VC’s liquidation claim exceeds the VC’s cumulative investment.This is therefore a measure of the strength of the liquidation claim. This
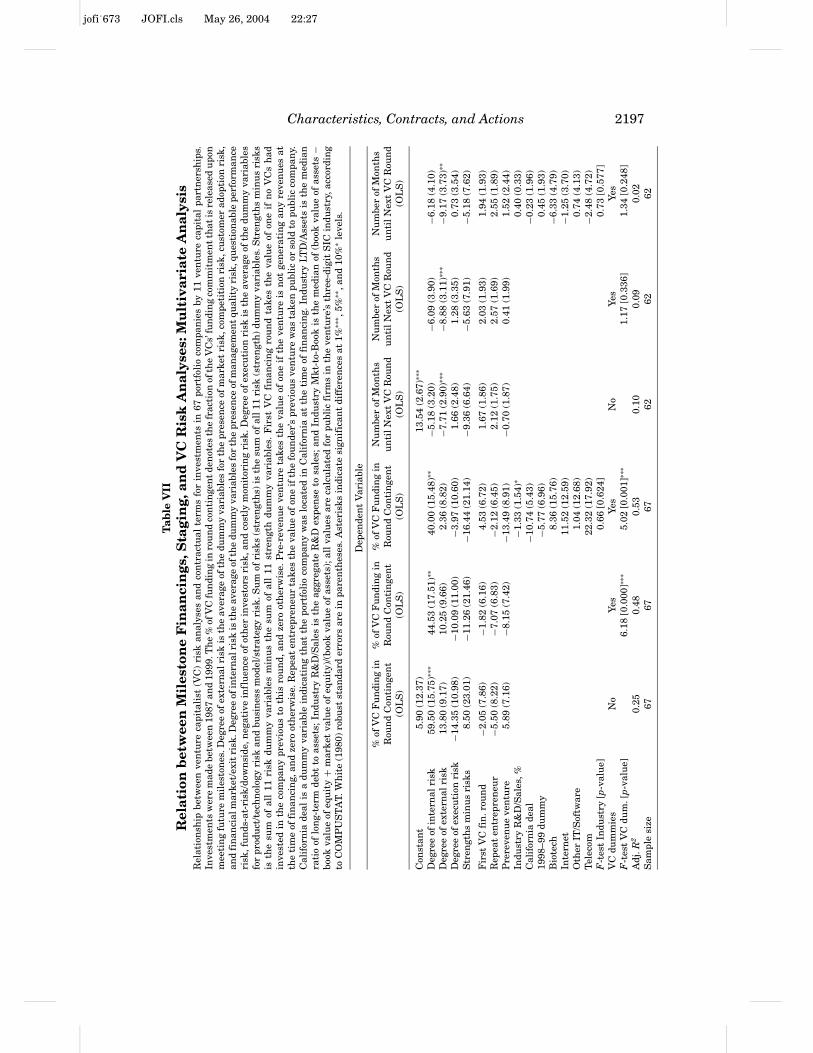
jofi˙673 JOFI.cls May 26, 2004 22:27
Characteristics, Contracts, and Actions 2197
Tab
leV
IIR
elat
ion
bet
wee
nM
iles
ton
eF
inan
cin
gs,S
tagi
ng,
and
VC
Ris
kA
nal
yses
:Mu
ltiv
aria
teA
nal
ysis
Rel
atio
nsh
ipbe
twee
nve
ntu
reca
pita
list
(VC
)ri
skan
alys
esan
dco
ntr
actu
alte
rms
for
inve
stm
ents
in67
port
foli
oco
mpa
nie
sby
11ve
ntu
reca
pita
lpa
rtn
ersh
ips.
Inve
stm
ents
wer
em
ade
betw
een
1987
and
1999
.Th
e%
ofV
Cfu
ndi
ng
inro
un
dco
nti
nge
ntd
enot
esth
efr
acti
onof
the
VC
s’fu
ndi
ng
com
mit
men
tth
atis
rele
ased
upo
nm
eeti
ng
futu
rem
iles
ton
es.D
egre
eof
exte
rnal
risk
isth
eav
erag
eof
the
dum
my
vari
able
sfo
rth
epr
esen
ceof
mar
ket
risk
,com
peti
tion
risk
,cu
stom
erad
opti
onri
sk,
and
fin
anci
alm
arke
t/ex
itri
sk.D
egre
eof
inte
rnal
risk
isth
eav
erag
eof
the
dum
my
vari
able
sfo
rth
epr
esen
ceof
man
agem
ent
qual
ity
risk
,qu
esti
onab
lepe
rfor
man
ceri
sk,f
un
ds-a
t-ri
sk/d
own
side
,neg
ativ
ein
flu
ence
ofot
her
inve
stor
sri
sk,a
nd
cost
lym
onit
orin
gri
sk.D
egre
eof
exec
uti
onri
skis
the
aver
age
ofth
edu
mm
yva
riab
les
for
prod
uct
/tec
hn
olog
yri
skan
dbu
sin
ess
mod
el/s
trat
egy
risk
.Su
mof
risk
s(s
tren
gth
s)is
the
sum
ofal
l11
risk
(str
engt
h)
dum
my
vari
able
s.S
tren
gth
sm
inu
sri
sks
isth
esu
mof
all
11ri
skdu
mm
yva
riab
les
min
us
the
sum
ofal
l11
stre
ngt
hdu
mm
yva
riab
les.
Fir
stV
Cfi
nan
cin
gro
un
dta
kes
the
valu
eof
one
ifn
oV
Cs
had
inve
sted
inth
eco
mpa
ny
prev
iou
sto
this
rou
nd,
and
zero
oth
erw
ise.
Pre
-rev
enu
eve
ntu
reta
kes
the
valu
eof
one
ifth
eve
ntu
reis
not
gen
erat
ing
any
reve
nu
esat
the
tim
eof
fin
anci
ng,
and
zero
oth
erw
ise.
Rep
eat
entr
epre
neu
rta
kes
the
valu
eof
one
ifth
efo
un
der’
spr
evio
us
ven
ture
was
take
npu
blic
orso
ldto
publ
icco
mpa
ny.
Cal
ifor
nia
deal
isa
dum
my
vari
able
indi
cati
ng
that
the
port
foli
oco
mpa
ny
was
loca
ted
inC
alif
orn
iaat
the
tim
eof
fin
anci
ng.
Indu
stry
LTD
/Ass
ets
isth
em
edia
nra
tio
oflo
ng-
term
debt
toas
sets
;In
dust
ryR
&D
/Sal
esis
the
aggr
egat
eR
&D
expe
nse
tosa
les;
and
Indu
stry
Mkt
-to-
Boo
kis
the
med
ian
of(b
ook
valu
eof
asse
ts−
book
valu
eof
equ
ity
+m
arke
tva
lue
ofeq
uit
y)/(
book
valu
eof
asse
ts);
allv
alu
esar
eca
lcu
late
dfo
rpu
blic
firm
sin
the
ven
ture
’sth
ree-
digi
tS
ICin
dust
ry,a
ccor
din
gto
CO
MP
US
TA
T.W
hit
e(1
980)
robu
stst
anda
rder
rors
are
inpa
ren
thes
es.A
ster
isks
indi
cate
sign
ific
ant
diff
eren
ces
at1%
∗∗∗ ,
5%∗∗
,an
d10
%∗
leve
ls.
Dep
ende
nt
Var
iabl
e
%of
VC
Fu
ndi
ng
in%
ofV
CF
un
din
gin
%of
VC
Fu
ndi
ng
inN
um
ber
ofM
onth
sN
um
ber
ofM
onth
sN
um
ber
ofM
onth
sR
oun
dC
onti
nge
nt
Rou
nd
Con
tin
gen
tR
oun
dC
onti
nge
nt
un
tilN
ext
VC
Rou
nd
un
tilN
ext
VC
Rou
nd
un
tilN
ext
VC
Rou
nd
(OL
S)
(OL
S)
(OL
S)
(OL
S)
(OL
S)
(OL
S)
Con
stan
t5.
90(1
2.37
)13
.54
(2.6
7)∗∗
∗
Deg
ree
ofin
tern
alri
sk59
.50
(15.
75)∗∗
∗44
.53
(17.
51)∗∗
40.0
0(1
5.48
)∗∗−5
.18
(3.2
0)−6
.09
(3.9
0)−6
.18
(4.1
0)D
egre
eof
exte
rnal
risk
13.8
0(9
.17)
10.2
5(9
.66)
2.36
(8.8
2)−7
.71
(2.9
0)∗∗
∗−8
.88
(3.1
1)∗∗
∗−9
.17
(3.7
3)∗∗
Deg
ree
ofex
ecu
tion
risk
−14.
35(1
0.98
)−1
0.09
(11.
00)
−3.9
7(1
0.60
)1.
66(2
.48)
1.28
(3.3
5)0.
73(3
.54)
Str
engt
hs
min
us
risk
s8.
50(2
3.01
)−1
1.26
(21.
46)
−16.
44(2
1.14
)−9
.36
(6.6
4)−5
.63
(7.9
1)−5
.18
(7.6
2)
Fir
stV
Cfi
n.r
oun
d−2
.05
(7.8
6)−1
.82
(6.1
6)4.
53(6
.72)
1.67
(1.8
6)2.
03(1
.93)
1.94
(1.9
3)R
epea
ten
trep
ren
eur
−5.5
0(8
.22)
−7.0
7(6
.83)
−2.1
2(6
.45)
2.12
(1.7
5)2.
57(1
.69)
2.55
(1.8
9)P
rere
ven
ue
ven
ture
5.89
(7.1
6)−8
.15
(7.4
2)−1
3.49
(8.9
1)−0
.70
(1.8
7)0.
41(1
.99)
1.52
(2.4
4)In
dust
ryR
&D
/Sal
es,%
−1.3
3(1
.54)
∗0.
40(0
.33)
Cal
ifor
nia
deal
−10.
74(5
.43)
−0.2
3(1
.96)
1998
–99
dum
my
−5.7
7(6
.96)
0.45
(1.9
3)B
iote
ch8.
36(1
5.76
)−6
.33
(4.7
9)In
tern
et11
.52
(12.
59)
−1.2
5(3
.70)
Oth
erIT
/Sof
twar
e1.
04(1
2.68
)0.
74(4
.13)
Tel
ecom
22.3
2(1
7.92
)−2
.48
(4.7
2)F
-tes
tIn
dust
ry[p
-val
ue]
0.66
[0.6
24]
0.73
[0.5
77]
VC
dum
mie
sN
oYe
sYe
sN
oYe
sYe
sF
-tes
tV
Cdu
m.[
p-va
lue]
6.18
[0.0
00]∗∗
∗5.
02[0
.001
]∗∗∗
1.17
[0.3
36]
1.34
[0.2
48]
Adj
.R2
0.25
0.48
0.53
0.10
0.09
0.02
Sam
ple
size
6767
6762
6262

jofi˙673 JOFI.cls May 26, 2004 22:27
2198 The Journal of Finance
Tab
leV
III
Rel
atio
nb
etw
een
All
ocat
ion
sof
Liq
uid
atio
nR
igh
ts,A
nti
-dil
uti
on,a
nd
VC
Ris
kA
nal
yses
:Mu
ltiv
aria
teA
nal
ysis
Rel
atio
nsh
ipbe
twee
nve
ntu
reca
pita
list
(VC
)ris
kan
alys
esan
dco
ntr
actu
alte
rms
for
inve
stm
ents
in67
port
foli
oco
mpa
nie
sby
11ve
ntu
reca
pita
lpar
tner
ship
s.In
vest
men
tsw
ere
mad
ebe
twee
n19
87an
d19
99.V
Cli
quid
atio
ncl
aim
>cu
mu
lati
vein
vest
men
tis
adu
mm
yva
riab
lefo
rw
het
her
the
VC
sli
quid
atio
ncl
aim
isla
rger
than
the
accu
mu
late
dV
Cin
vest
men
t,th
rou
ghcu
mu
lati
vedi
vide
nds
,pa
rtic
ipat
ing
pref
erre
d,or
oth
erli
quid
atio
npr
efer
ence
prov
isio
ns.
Deg
ree
ofex
tern
alri
skis
the
aver
age
ofth
edu
mm
yva
riab
les
for
the
pres
ence
ofm
arke
tri
sk,c
ompe
titi
onri
sk,c
ust
omer
adop
tion
risk
,an
dfi
nan
cial
mar
ket/
exit
risk
.Deg
ree
ofin
tern
alri
skis
the
aver
age
ofth
edu
mm
yva
riab
les
for
the
pres
ence
ofm
anag
emen
tqu
alit
yri
sk,
ques
tion
able
perf
orm
ance
risk
,fu
nds
-at-
risk
/dow
nsi
de,
neg
ativ
ein
flu
ence
ofot
her
inve
stor
sri
sk,
and
cost
lym
onit
orin
gri
sk.D
egre
eof
exec
uti
onri
skis
the
aver
age
ofth
edu
mm
yva
riab
les
for
prod
uct
/tec
hn
olog
yri
skan
dbu
sin
ess
mod
el/s
trat
egy
risk
.Su
mof
risk
s(s
tren
gth
s)is
the
sum
ofal
l11
risk
(str
engt
h)
dum
my
vari
able
s.S
tren
gth
sm
inu
sri
sks
isth
esu
mof
all
11ri
skdu
mm
yva
riab
les
min
us
the
sum
ofal
l11
stre
ngt
hdu
mm
yva
riab
les.
Fir
stV
Cfi
nan
cin
gro
un
dta
kes
the
valu
eof
one
ifn
oV
Cs
had
inve
sted
inth
eco
mpa
ny
prev
iou
sto
this
rou
nd,
and
zero
oth
erw
ise.
Pre
reve
nu
eve
ntu
reta
kes
the
valu
eof
one
ifth
eve
ntu
reis
not
gen
erat
ing
any
reve
nu
esat
the
tim
eof
fin
anci
ng,
and
zero
oth
erw
ise.
Rep
eat
entr
epre
neu
rta
kes
the
valu
eof
one
ifth
efo
un
der’
spr
evio
us
ven
ture
was
take
npu
blic
orso
ldto
apu
blic
com
pan
y.C
alif
orn
iade
alis
adu
mm
yva
riab
lein
dica
tin
gth
atth
epo
rtfo
lio
com
pan
yw
aslo
cate
din
Cal
ifor
nia
atth
eti
me
offi
nan
cin
g.In
dust
ryLT
D/A
sset
sis
the
med
ian
rati
oof
lon
g-te
rmde
btto
asse
ts;I
ndu
stry
R&
D/S
ales
isth
eag
greg
ate
R&
Dex
pen
seto
sale
s;an
dIn
dust
ryM
kt-t
o-B
ook
isth
em
edia
nof
(boo
kva
lue
ofas
sets
−bo
okva
lue
ofeq
uit
y+
mar
ket
valu
eof
equ
ity)
/(bo
okva
lue
ofas
sets
);al
lval
ues
are
calc
ula
ted
for
publ
icfi
rms
inth
eve
ntu
re’s
thre
e-di
git
SIC
indu
stry
,acc
ordi
ng
toC
OM
PU
ST
AT.
Wh
ite
(198
0)ro
bust
stan
dard
erro
rsar
ein
pare
nth
eses
.Ast
eris
ksin
dica
tesi
gnif
ican
tdi
ffer
ence
sat
1%∗∗
∗ ;5%
∗∗,a
nd
10%
∗le
vels
.
Dep
ende
nt
Var
iabl
e
VC
has
VC
has
VC
Liq
.Cla
im>
VC
Liq
.Cla
im>
VC
has
Fu
ll-R
atch
etV
Ch
asF
ull
-Rat
chet
Red
empt
ion
Rig
hts
Red
empt
ion
Rig
hts
Cu
mu
lati
veIn
vest
men
tC
um
ula
tive
Inve
stm
ent
An
tidi
luti
onA
nti
dilu
tion
(Pro
bit)
(Pro
bit)
(Pro
bit)
(Pro
bit)
(Pro
bit)
(Pro
bit)
Con
stan
t0.
30(0
.66)
0.96
(0.6
7)−1
.78
(0.6
8)D
egre
eof
inte
rnal
risk
0.03
(1.0
4)2.
44(1
.80)
1.18
(0.9
1)2.
59(1
.32)
∗∗1.
52(0
.80)
∗4.
81(1
.67)
∗∗∗
Deg
ree
ofex
tern
alri
sk2.
00(0
.95)
∗∗4.
75(2
.20)
∗∗1.
68(0
.95)
∗2.
28(1
.02)
∗∗0.
18(0
.70)
1.24
(0.9
1)D
egre
eof
exec
uti
onri
sk0.
03(0
.74)
1.92
(1.4
2)−1
.13
(0.6
8)∗
−1.5
6(0
.95)
∗0.
45(0
.63)
0.86
(0.8
5)S
tren
gth
sm
inu
sri
sks
3.04
(1.2
5)∗∗
6.64
(3.1
9)∗∗
2.48
(1.3
3)∗
2.15
(1.1
6)∗
1.99
(1.1
5)∗
5.26
(1.9
9)∗∗
∗F
irst
VC
fin
.rou
nd
0.37
(0.4
6)1.
09(0
.72)
−0.3
5(0
.44)
−0.4
0(0
.52)
0.61
(0.4
2)0.
54(0
.60)
Rep
eat
entr
epre
neu
r−0
.68
(0.4
6)−0
.78
(0.5
1)−0
.74
(0.4
9)−0
.69
(0.6
9)−0
.58
(0.6
4)0.
38(0
.82)
Pre
reve
nu
eve
ntu
re−0
.35
(0.5
0)1.
37(0
.88)
−0.4
3(0
.48)
−1.6
5(0
.71)
∗∗−0
.19
(0.4
3)−0
.69
(0.7
6)In
dust
ryR
&D
/Sal
es,%
0.03
(0.1
3)−0
.11
(0.1
4)0.
14(0
.23)
Cal
ifor
nia
deal
1.59
(0.8
3)∗
−0.3
0(0
.45)
0.82
(0.5
9)19
98–9
9du
mm
y−0
.78
(0.7
0)−1
.09
(0.5
5)∗∗
−1.8
3(0
.77)
∗∗B
iote
ch0.
26(1
.21)
3.16
(1.4
4)D
ropp
eddu
eto
coll
inea
rity
Inte
rnet
2.43
(1.1
9)∗∗
1.22
(1.0
0)0.
89(0
.82)
Oth
erIT
/Sof
twar
eD
ropp
eddu
eto
0.80
(0.8
8)0.
17(0
.82)
coll
inea
rity
:pre
dict
edsu
cces
spe
rfec
tly
Tel
ecom
1.19
(1.5
9)3.
76(1
.82)
Dro
pped
due
toco
llin
eari
tyχ
2-t
est
Indu
stry
[p-v
alu
e]6.
13[0
.106
]6.
49[0
.165
]1.
40[0
.498
]V
Cdu
mm
ies
No
Yes
No
Yes
No
Yes
χ2-t
est
VC
dum
.[p-
valu
e]9.
78[0
.281
]7.
79[0
.555
]13
.11
[0.0
11]
Pse
udo
R2
0.18
0.40
0.23
0.38
0.13
0.35
Sam
ple
size
6757
6666
6748

jofi˙673 JOFI.cls May 26, 2004 22:27
Characteristics, Contracts, and Actions 2199
variable increases in external risk. It also increases in internal risk in the moregeneral regression. In addition, the size of the liquidation claim decreases sig-nificantly with execution risk.
The dependent variable in the last two regressions in Table VIII is the pres-ence of full-ratchet antidilution protection. Antidilution provisions increase theshares the VC receives if the company subsequently raises money at a lowervaluation. Similar to liquidation claims, antidilution provisions protect the VCin bad states and are relatively less attractive to low quality founders. The de-pendent variable equals one if the investment has the strongest antidilutionprotection—full ratchet. Under a full ratchet, if the firm subsequently raisesmoney at a lower value, the entire VC investment is repriced at that lowervalue. The last two regressions show that antidilution protection increases ininternal risk.
Overall, the results for staging and liquidation rights are mixed. Agencyproblems, as measured by internal risk, clearly play a role, but not uniformly.Certain liquidation rights also increase in external risk. One possible explana-tion, particularly for ex post staging, is that external risk increases the valueof the option to abandon the project.17 Finally, the decrease in the liquidationclaim with execution risk is supportive of hold-up theories. Collateral value islikely to be lower for companies with execution risk, where more of the firmvalue is tied up in the founder’s intangible human capital.
D. Implications
In this section, we have studied the relation of VC risk assessments to the rel-evant financial contracts. Internal uncertainty is significantly related to manyof the incentive and control mechanisms in the financial contracts. Higher in-ternal risk is associated with more VC control, more contingent compensation tothe entrepreneur, and more contingent financing in a given round. The primaryexceptions are that the overall fraction of founder cash flow rights (arguablya noisier measure of pay-for-performance sensitivity) and some VC liquidationrights are not related to internal risk. Overall, we interpret these results asvery positive for the agency theories. The results for performance benchmarks,VC control rights, and ex ante staging are very strong, as are the theoreticalpredictions for them.
External uncertainty is also related to many contractual features. Like in-ternal risk, higher external risk is associated with more VC control and morecontingent compensation. Moreover, higher external risk is associated with in-creases in VC liquidation rights and tighter staging (shorter time betweenfinancing rounds). These findings are highly inconsistent with optimal risk-sharing between risk-averse entrepreneurs and risk-neutral investors. Instead,these results are more consistent with the theories of Prendergast (2002) andDessein (2001), in which external uncertainty makes monitoring more difficult.
17 Berger, Ofek, and Swary (1996), Cornelli and Yosha (2003) and Gompers (1995) argue thatthis option is valuable.
jofi˙673 JOFI.cls May 26, 2004 22:27
2200 The Journal of Finance
Execution risk is significantly positively related to founder time vesting pro-visions and negatively related to contingent compensation and VC liquidationrights. These results suggest that hold-up concerns matter in complex envi-ronments where the manager’s human capital is particularly important andstandard incentive mechanisms are less effective.
E. Alternative Interpretations
In interpreting our results, we believe that internal risks are more likely tobe associated with asymmetric information and moral hazard problems, whileexternal risks are more likely to be associated with general or two-sided uncer-tainty. We believe the results are consistent with this interpretation. Neverthe-less, one can argue that our classification of risks is inappropriate or inexact.In this section, we address several of those arguments.
Perhaps, the risks we classify as external are instead internal. For example,management may have better information on customer adoption, competition,or the market than the VC. We think this argument is unpersuasive. VCs typ-ically undertake due diligence with respect to those risks that are external tothe firm—like customer adoption, competition, and the market—and should beable to obtain the same information as the founders. In fact, for some of theserisks, the VCs may even be better informed.18 It is for risks internal to the firm,that the VCs are more likely to be at a disadvantage on average.
Alternatively, it is possible that the risks we classify as internal are notrelated to asymmetric information and moral hazard problems. For example,management risk may also measure managerial overconfidence as ascertainedby the VC, or simply differences of opinion. We are more sympathetic to thisargument. Although our results on internal risk are consistent with agencyexplanations, we suspect that theories of differences of opinion would makesimilar predictions, particularly with respect to contingencies. It also seemspossible that differences of opinion might generate similar predictions for ex-ternal risk.
Finally, it is possible to question whether our three risk variables measure thesame things. This does not seem to be an issue for execution risk, which consis-tently has very different coefficients from those for internal and external risk.Internal and external risk however are significantly correlated (in Table III)and almost always have similar signs in the regressions. While true, the mag-nitude and significance of the coefficients on internal and external risk differsufficiently often that we think it likely that they measure separate economicfactors. Q2
IV. The Relationship between Contracting and Monitoring
In this section, we consider the relation between the contracts and VC actions.As we showed in Table IV, the VC evaluation process identifies areas where the
18 Garmaise (2000) presents a model that makes exactly this assumption.

jofi˙673 JOFI.cls May 26, 2004 22:27
Characteristics, Contracts, and Actions 2201
VC expects to add value through intervention and support activities. The designof the financial contracts may affect the VC’s ability and incentives to actuallycarry out such activities. For example, the founder might not agree with theactions that the VC would like to implement. In such cases, the control theoriespredict that VCs will need formal control to carry out those actions againstthe will of the entrepreneur. In addition, monitoring and support activitiescan require substantial VC time and effort (see, e.g., Gorman and Sahlman,1989). The VC will undertake them only if sufficiently compensated. Recent“double moral hazard” theories have shown that the VC contract must have asubstantial equity component to provide incentives for support activities.19
Similar to Hellman and Puri (2002), we distinguish between VC actions thatare more likely to be adversarial to founders and actions that VCs and foundersare likely to agree on. Actions related to strengthening and replacing manage-ment are more likely to lead to conflict, while actions related to developingthe strategy and business model are less likely to lead to conflict. BecauseVC financings are often syndicated, with several different VC funds investingtogether in a given portfolio company, we also consider the possibility of free-riding behavior among VCs that decrease the incentives to provide monitoringand support.20
Table IX reports the results of regressions of VC intervention and supportactivities on contract characteristics. Panel A considers management team in-terventions as a function of VC board control.21 The regressions indicate thatmanagement interventions strongly increase in VC board control. Managementinterventions are also more likely when the VC is the lead investor and af-ter 1997. The last regression in panel A regresses management interventionagainst VC equity ownership. Management intervention is not related to VCequity ownership, confirming that VC control and equity ownership are likelytwo separate factors.
The regressions in panel B of Table IX analyze expected value-added supportactivities as a function of the VC’s equity stake. VC value-added support in-creases in the VC’s equity stake.22 The last regression shows that value-addedsupport is unrelated to board control. In other words, board control does notexplain the extent of value-added support, and the VC equity stake does notexplain management interventions.
To conclude, the analysis in Table IX yields two results. First, board controlis associated with a greater ability and tendency for the VC to intervene in
19 Casamatta (2003), Cestone (2002), Dessi (2001), Inderst and Muller (2003), Renucci (2000),Repullo and Suarez (1999), and Schmidt (1999) all study models of venture capital which includedouble-sided moral hazard.
20 Lerner (1994) and Sorensen and Stuart (2001) study venture capital syndication empiricallyand find that such syndication is quite common.
21 The board control variable is the same one used in the control regressions, but scaled to varybetween 0 and 1.
22 Syndication size is positive, while the interaction of VC equity stake and syndicate sizeis always negative. The effect of syndication size on incentives to provide support is thereforeambiguous.

jofi˙673 JOFI.cls May 26, 2004 22:27
2202 The Journal of Finance
Tab
leIX
Rel
atio
nb
etw
een
Con
trac
tsan
dV
CM
onit
orin
gan
dS
up
por
tR
elat
ion
ship
betw
een
ven
ture
capi
tali
st(V
C)
mon
itor
ing
and
supp
ort
acti
ons,
un
dert
aken
and
anti
cipa
ted,
and
con
trac
tual
term
sfo
rin
vest
men
tsin
67po
rtfo
lio
com
pan
ies
by11
ven
ture
capi
tal
part
ner
ship
s.In
vest
men
tsw
ere
mad
ebe
twee
n19
87an
d19
99.D
egre
eof
boar
dco
ntr
olta
kes
the
valu
eof
0if
the
fou
nde
ral
way
sco
ntr
ola
maj
orit
yof
the
boar
dse
ats,
0.5
if(a
)ou
tsid
ebo
ard
mem
bers
are
alw
ays
pivo
tal
or(b
)th
eV
Cco
ntr
ols
the
boar
don
lyif
the
firm
sfa
ilto
mee
ta
mil
esto
ne,
and
1if
the
VC
alw
ays
has
boar
dm
ajor
ity.
VC
equ
ity
stak
eis
mea
sure
das
sum
ing
all
perf
orm
ance
ben
chm
arks
are
met
and
all
fou
nde
ran
dem
ploy
eeeq
uit
yve
st.S
yndi
cate
size
isth
en
um
ber
ofdi
ffer
ent
ven
ture
capi
talf
un
dsth
atar
ein
vest
ing
inth
isor
any
prev
iou
sro
un
d.F
irst
VC
inve
stm
ents
refe
rto
the
rou
nds
invo
lvin
gth
efi
rst
tim
ean
yve
ntu
reca
pita
lfu
nd
inve
sted
inth
eco
mpa
ny.
Indu
stry
R&
D/S
ales
isth
eag
greg
ate
R&
Dex
pen
seto
sale
sfo
rpu
blic
firm
sin
the
ven
ture
’sth
ree-
digi
tS
ICin
dust
ry,a
ccor
din
gto
CO
MP
US
TA
T.C
alif
orn
iade
alin
dica
tes
that
the
port
foli
oco
mpa
ny
was
loca
ted
inC
alif
orn
iaat
the
tim
eof
fin
anci
ng.
Lea
din
vest
orin
dica
ted
that
the
mem
ow
asw
ritt
enby
the
VC
firm
prov
idin
gth
ela
rges
tam
oun
tof
fin
anci
ng
amon
gth
eV
Cs
inve
stin
gin
the
rou
nd.
Wh
ite
(198
0)ro
bust
stan
dard
erro
rsar
ein
pare
nth
eses
.Ast
eris
ksin
dica
tesi
gnif
ican
tdi
ffer
ence
sat
1%∗∗
∗ ,5%
∗∗,a
nd
10%
∗
leve
ls.I
nre
gres
sion
s2
and
4,n
ine
obse
rvat
ion
sh
adto
bedr
oppe
d,si
nce
one
VC
dum
my
(for
afu
nd
spec
iali
zed
inh
ealt
hca
rein
vest
men
ts)p
redi
cted
succ
ess
perf
ectl
y.In
the
two-
stag
ele
ast
squ
are
spec
ific
atio
ns
the
con
trac
tin
gva
riab
les
are
inst
rum
ente
dby
Pre
reve
nu
e,re
peat
entr
epre
neu
r,fi
rst
VC
rou
nd,
degr
eeof
exte
rnal
risk
,deg
ree
ofin
tern
alri
sk,a
nd
degr
eeof
exec
uti
onri
sk. D
epen
den
tV
aria
ble
VC
Inte
rven
ing
VC
Inte
rven
ing
VC
Inte
rven
ing
VC
Inte
rven
ing
VC
Inte
rven
ing
VC
Inte
rven
ing
inm
gtT
eam
inm
gtT
eam
inm
gtT
eam
inm
gtT
eam
inm
gtT
eam
inm
gtT
eam
(Pro
bit)
(Pro
bit)
(Pro
bit)
(Pro
bit)
(2S
LS
)(P
robi
t)
Con
stan
t−0
.53
(0.2
9)−2
.91
(1.2
9)∗∗
−0.1
8(0
.44)
Deg
ree
ofbo
ard
con
trol
1.77
(0.7
2)∗∗
2.40
(0.9
0)∗∗
∗2.
18(0
.92)
∗∗4.
43(1
.30)
∗∗∗
1.57
(0.9
1)∗
Boa
rdct
l∗syn
dic.
size
−0.1
5(0
.10)
−0.2
1(0
.12)
∗−0
.11
(0.1
7)−0
.12
(0.2
2)−0
.19
(0.1
6)V
Ceq
uit
yst
ake
−0.1
7(1
.60)
0.91
(3.2
0)0.
95(1
.12)
VC
equ
ity∗
syn
dic.
size
−0.2
0(0
.32)
−0.7
8(0
.45)
∗−0
.12
(0.1
0)S
yndi
cate
size
0.29
(0.2
0)0.
78(0
.38)
∗
VC
isle
adin
vest
or1.
02(0
.60)
∗2.
18(1
.22)
∗
Pre
-rev
enu
eve
ntu
re−0
.45
(0.4
2)−0
.07
(1.0
3)R
epea
ten
trep
ren
eur
−0.1
2(0
.42)
−0.5
0(0
.58)
Fir
stV
Cfi
n.r
oun
d1.
14(0
.57)
∗∗2.
51(1
.40)
∗
Ind.
R&
D/S
ales
,%0.
31(0
.15)
∗∗
Cal
ifor
nia
deal
1.20
(0.6
5)∗
1998
–99
dum
my
1.06
(0.5
4)∗∗
Bio
tech
0.23
(0.8
4)−1
.89
(1.2
3)0.
14(0
.34)
Inte
rnet
0.07
(0.6
3)−1
.48
(0.8
1)∗
−0.0
9(0
.27)
Oth
erIT
/Sof
twar
e−0
.03
(0.6
6)−0
.67
(0.8
4)−0
.02
(0.2
7)T
elec
om−1
.32
(0.8
2)−1
.79
(1.2
8)0.
14(0
.34)

jofi˙673 JOFI.cls May 26, 2004 22:27
Characteristics, Contracts, and Actions 2203
χ2-t
est
Indu
stry
[p-v
alu
e]4.
67[0
.332
]4.
58[0
.333
]1.
47[0
.224
]V
Cdu
mm
ies
No
Yes
No
Yes
Yes
No
χ2-t
est
VC
dum
.[p-
valu
e]0.
90[0
.924
]5.
14[0
.273
]0.
26[0
.932
](P
seu
do)
R2
0.08
0.15
0.16
0.45
0.05
0.02
Sam
ple
size
6657
6657
6767
VC
Val
ue-
Add
edV
CV
alu
e-A
dded
VC
Val
ue-
Add
edV
CV
alu
e-A
dded
VC
Val
ue-
Add
edV
CV
alu
e-A
dded
Su
ppor
tS
upp
ort
Su
ppor
tS
upp
ort
Su
ppor
tS
upp
ort
(Pro
bit)
(Pro
bit)
(Pro
bit)
(Pro
bit)
(2S
LS
)(P
robi
t)
Con
stan
t−1
.03
(0.4
7)∗∗
−3.6
7(1
.47)
∗∗∗
−0.7
2(0
.30)
∗∗
Deg
ree
ofbo
ard
con
trol
−0.9
8(0
.96)
−1.1
6(1
.09)
0.76
(0.6
3)B
oard
ctl∗s
yndi
c.si
ze0.
47(0
.21)
∗∗0.
50(0
.18)
∗∗∗
−0.0
4(0
.09)
VC
equ
ity
stak
e2.
06(1
.17)
∗2.
39(1
.44)
∗4.
86(1
.85)
∗∗∗
6.23
(2.6
7)∗∗
3.94
(1.7
1)∗∗
VC
equ
ity∗
syn
dic.
size
−0.1
7(0
.10)
∗−0
.17
(0.1
2)−1
.10
(0.4
5)∗∗
−1.6
0(0
.57)
∗∗∗
−0.2
4(0
.12)
∗∗
Syn
dica
tesi
ze0.
38(0
.24)
0.71
(0.3
4)∗∗
VC
isle
adin
vest
or0.
97(0
.76)
0.84
(0.7
5)P
rere
ven
ue
ven
ture
−1.0
0(0
.47)
∗∗−0
.84
(0.9
4)R
epea
ten
trep
ren
eur
0.41
(0.4
4)0.
84(0
.46)
∗
Fir
stV
Cfi
n.r
oun
d0.
82(0
.63)
0.35
(0.8
5)In
d.R
&D
/Sal
es,%
−0.0
2(0
.09)
Cal
ifor
nia
deal
−0.1
4(0
.50)
1998
–99
dum
my
0.85
(0.4
8)B
iote
ch0.
59(0
.91)
0.66
(0.8
9)0.
53(0
.52)
Inte
rnet
0.14
(0.6
7)−1
.04
(0.7
8)0.
27(0
.39)
Oth
erIT
/Sof
twar
e0.
31(0
.71)
0.47
(0.7
4)0.
50(0
.43)
Tel
ecom
−0.2
2(0
.78)
−0.6
0(1
.03)
−0.1
6(0
.47)
χ2-t
est
Indu
stry
[p-v
alu
e]1.
27[0
.866
]6.
79[0
.148
]1.
08[0
.377
]V
Cdu
mm
ies
No
Yes
No
Yes
Yes
No
χ2-t
est
VC
dum
.[p-
valu
e]6.
00[0
.306
]6.
29[0
.279
]1.
13[0
.356
](P
seu
do)
R2
0.04
0.11
0.17
0.32
–0.
02S
ampl
esi
ze67
6766
6667
66

jofi˙673 JOFI.cls May 26, 2004 22:27
2204 The Journal of Finance
management, consistent with control theories such as Aghion and Bolton (1992)and Hellman (1998). Second, consistent with the double-sided moral hazardtheories, equity incentives are associated with an increase in the likelihoodthat VCs perform value-added support activities.
V. Summary and Discussion
In this paper, we study the contemporaneous investment analyses by 11 VCfirms for investments in 67 companies. We relate these analyses to the contractsfor those investments.
Overall, we believe this paper makes three contributions. First, it adds toexisting survey-based work by describing the characteristics and risks thatVCs consider in actual deals.
Second, the paper is novel in relating investors’ direct assessments of risksrather than the indirect proxies used in most previous work to actual contrac-tual terms. The internal risk results suggest that agency problems are im-portant to contract design. The external risk results suggest that risk-sharingconcerns are unimportant relative to other concerns such as monitoring. Theresults for execution risk suggest that VCs consider the issues described inhold-up theories.
Finally, we show that VCs expect to take actions with their investments andthose actions are related to the contracts. VC management intervention is re-lated to VC board control, while VC support or advice is related to VC equityownership. These results highlight and expand on the differences between in-tervening and supporting actions analyzed in Hellman and Puri (2002).
We recognize that the risk variables (and the action variables to a lesser ex-tent) are subject to different interpretations and may not measure preciselywhat we have assumed. We believe however that the direct assessments im-prove upon the indirect measures used in previous work. Fertile areas for futureresearch include improving upon the direct measures for investors as well ascreating similar measures for other actors, particularly entrepreneurs.
REFERENCESAggarwal, Rajesh, and Andrew Samwick, 1999, The other side of the tradeoff: The impact of risk
on executive compensation, Journal of Political Economy 107, 65–105.Aghion, Phillippe, and Patrick Bolton, 1992, An incomplete contracts approach to financial con-
tracting, Review of Economic Studies 77, 338–401.Allen, Douglas, and Dean Lueck, 1993, Transaction costs and the design of crop share contracts,
RAND Journal of Economics 24, 78–100.Allen, Franklin, and Andrew Winton, 1995, Corporate financial structure, incentives, and optimal
contracting, in R. Jarrow, V. Maksimovic, and W. T. Ziemba, eds.: Handbooks in OperationsResearch and Management Science, Vol 9 (North-Holland, Amsterdam).
Baker, George, 1992, Incentive contracts and performance measurement, Journal of Political Econ-omy 100, 598–614.
Baker, Malcolm, and Paul Gompers, 2001, The determinants of board structure at the initial publicoffering, Working paper, Harvard Business School.

jofi˙673 JOFI.cls May 26, 2004 22:27
Characteristics, Contracts, and Actions 2205
Bartlett, Joseph, 1995, Equity Finance: Venture Capital, Buyouts, Restructurings and Reorganiza- Q3tions (John Wiley & Sons, New York).
Berger, Philip, Eli Ofek, and Itzhak Swary, 1996, The valuation of the abandonment option, Journalof Financial Economics 42, 257–287.
Bhattacharyya, Sugato, and Francine Lafontaine, 1995, The role of risk in franchising, Journal ofCorporate Finance 2, 39–74.
Black, Bernard, and Ronald Gilson, 1998, Venture capital and the structure of capital markets:Banks versus stock markets, Journal of Financial Economics 47, 243–277.
Casamatta, Catherine, 2003, Financing and advising: Optimal financial contracts with venturecapitalists, Jounral of Finance 58, 2059–2086.
Cestone, Giacinta, 2001, Venture capital meets contract theory: Risky claims or formal control?Working paper, University of Toulouse.
Core, John, and Wayne Guay, 1999, The use of equity grants to manage optimal equity incentivelevels, Journal of Accounting and Economics 28, 151–184.
Cornelli, Francesca, and Oded Yosha, 2003, Stage financing and the role of convertible securities,Review of Economic Studies 70, 1–32.
Dessein, Wouter, 2002, Information and control in alliances and ventures, Working paper, Univer-sity of Chicago.
Dessi, Roberta, 2001, Start-up finance, monitoring and collusion, Working paper, IDEI, Universityof Toulouse.
Dewatripont, Matthias, and Jean Tirole, 1994, A theory of debt and equity: Diversity of securitiesand manager-shareholder congruence, Quarterly Journal of Economics 109, 1027–1054.
Diamond, Douglas, 1984, Financial intermediation and delegated monitoring, Review of EconomicStudies 51, 393–414.
Diamond, Douglas, 1991, Debt maturity structure and liquidity risk, Quarterly Journal of Eco-nomics 106, 709–737.
Garmaise, Mark, 2000, Informed investors and the financing of entrepreneurial projects, Workingpaper, University of Chicago.
Gladstone, David, 1988, Venture Capital Handbook (Prentice Hall, Englewood Cliffs, NJ).Gompers, Paul, 1995, Optimal investment, monitoring, and the staging of venture capital, Journal
of Finance 50, 1461–1490.Gompers, Paul, 1998, An examination of convertible securities in venture capital investments,
Working paper, Harvard Business School.Gompers, Paul, and Josh Lerner, 1999, The Venture Capital Cycle (MIT Press, Cambridge, MA).Gorman, Michael, and William Sahlman, 1989, What do venture capitalists do? Journal of Business
Venturing 4, 231–248.Hagerty, Kathleen, and Daniel Siegel, 1988, On the observational equivalence of managerial con-
tracts under conditions of moral hazard and self-selection, Quarterly Journal of Economics103, 425–428.
Hart, Oliver, 2001, Financial contracting, Journal of Economic Literature 39, 1079–1100.Hart, Oliver, and John Moore, 1994, A theory of debt based on the inalienability of human capital,
Quarterly Journal of Economics 109, 841–879.Hellman, Thomas, 1998, The allocation of control rights in venture capital contracts, RAND Journal
of Economics 29, 57–76.Hellman, Thomas, and Manju Puri, 2000, The interaction between product market and financial
strategy: The role of venture capital, Review of Financial Studies 13, 959–984.Hellman, Thomas, and Manju Puri, 2002, Venture capital and the professionalization of start-up
firms: Empirical evidence, Journal of Finance 57, 169–197.Holmstrom, Bengt, 1979, Moral hazard and observability, Bell Journal of Economics 10, 74–91.Holmstrom, Bengt, and Paul Milgrom, 1991, Multitask principal agent analyses: Incentive con-
tracts, asset ownership, and job design, Journal of Law, Economics, and Organization 7, 24–92.Inderst, Roman, and Holger Mueller, 2003, The Effect of capital market characteristics on the value
of start-up firms, Journal of Financial Economics, forthcoming.Jensen, Michael, and William Meckling, 1976, The theory of the firm: Managerial behavior, agency
costs, and ownership structure, Journal of Financial Economics 3, 305–360.

jofi˙673 JOFI.cls May 26, 2004 22:27
2206 The Journal of Finance
Kaplan, Steven, and Per Stromberg, 2003, Financial contracting theory meets the real world: Anempirical analysis of venture capital contracts, Review of Economic Studies 70, 281–316.
Lafontaine, Francine, 1992, Agency theory and franchising: Some empirical results, RAND Journalof Economics 23, 263–283.
Lerner, Joshua, 1994, The syndication of venture capital investments, Financial Management 23,16–27.
Lerner, Joshua, 1995, Venture capitalists and the oversight of private firms, Journal of Finance50, 301–318.
Levin, Jack, 1998, Structuring Venture Capital, Private Equity and Entrepreneurial Transactions(Aspen Law and Business Series, Aspen Publishers, New York).
MacMillan, Ian, D. Kulow, and R. Khoylian, 1988, Venture capitalists’ involvement in their invest-ments: Extent and performance, Journal of Business Venturing 4, 27–47.
MacMillan Ian, R. Siegel and P.N. Subbanarasimha, 1985, Criteria used by venture capitalists toevaluate new venture proposals, Journal of Business Venturing 1, 119–128.
MacMillan, I., L. Zemann, and P.N. Subbanarasimha, 1987, Criteria distinguishing successful fromunsuccessful ventures in the venture screening process, Journal of Business Venturing 2, 123–137
Myers, Stewart, 2000, Outside equity financing, Journal of Finance 55, 1005–1034.Myers, Stewart and Nicholas Majluf, 1984, Corporate financing and investment decisions when
firms have information that investors do not have, Journal of Financial Economic 13, 187–221.Prendergast, Canice, 2002, The tenuous tradeoff between risk and incentives, Journal of Political
Economy 110, 1071–1102.Renucci, Antoine, 2000, Optimal contracts between entrepreneurs and value-enhancing financiers,
Working paper, University of Toulouse.Repullo, Rafael, and Javier Suarez, 1999, Venture capital finance: A security design approach,
Working paper, CEMFI.Ross, Stephen, 1977, The Determination of financial structure: The incentive signaling approach,
Bell Journal of Economics 8, 23–40.Sahlman, William, 1990, The structure and governance of venture capital organizations, Journal
of Financial Economics 27, 473–521.Sapienza, Harry, 1992, When do venture capitalists add value? Journal of Business Venturing 7,
9–27.Sapienza, Harry, Sophie Manigart, and W. Vermeir, 1996, Venture capitalist governance and value
added in four countries, Journal of Business Venturing 11, 439–469.Schmidt, Klaus, 1999, Convertible securities and venture capital finance, Working paper, Univer-
sitat Munchen.Smith, Clifford W. Jr, and Ross L. Watts, 1992, The investment opportunity set and corporate
financing, dividend, and compensation policies, Journal of Financial Economics 32, 263–292.Sorensen, Olav, and Toby Stuart, 2001, Syndication networks and the spatial distribution of venture
capital investments, American Journal of Sociology 106, 1546–1586.