Embed Size (px)
Citation preview
1
Characteristics and Variability of the Indonesian Throughflow Water at1
the Outflow Straits2
3
Agus Atmadipoera1,5, Robert Molcard1, Gurvan Madec1, Susan Wijffels2, Janet Sprintall3,4
Ariane Koch-Larrouy1, Indra Jaya5, Agus Supangat45
6
7
1. LOCEAN-IPSL, UPMC Paris 6, Paris France8
2. Centre for Australian Weather and Climate Research, CSIRO Marine and9
Atmospheric Research, Hobart, Australia10
3. Scripps Institution of Oceanography, University of California, USA11
4. BRKP, Ministry of Marine Affairs and Fisheries, Jakarta Indonesia12
5. Department of Marine Sciences and Technology, Bogor Agricultural13
University, Indonesia14
15
16
17
18
19
20
21
22
23
_______________________________Corresponding Author address: Agus Atmadipoera, Laboratoire d’Océanographie et du
Climat: Expérimentation et Approches Numériques (LOCEAN-IPSL), Université Pierre et
Marie Curie, Boîte 100, 4, Place Jussieu, Paris Cedex 05, 75252, France
Email : [email protected]
Phone : +33144277074 ; Fax : +33144273805
2
Abstract24
25
Property structure and variability of the Indonesian Throughflow Water in the major outflow26
straits (Lombok, Ombai and Timor) are revised from newly available data sets and output27
from a numerical model. Emphasis is put on the upper layers of the Indonesian Throughflow28
which impacts the heat and fresh water fluxes of the South Equatorial Current in the Indian29
Ocean. It is shown that during the April-June monsoon transition period the salinity30
maximum signature of the North Pacific thermocline water is strongly attenuated. This31
freshening of the thermocline layer, more intense in Ombai, is related to the supply of fresh32
near surface Java Sea water, drawn eastward by surface monsoon currents and subject to33
strong diapycnal mixing. The fresh water mass exits to the Indian Ocean first through34
Lombok Strait and later through Ombai and Timor, with an advective phase lag between one35
and five months. Because of these phase lags, the fresher surface and thermocline water is36
found in the southeast Indian Ocean from the beginning of the monsoon transition period37
(April) through until the end of the southeast monsoon (September), a much longer time than38
previously estimated.39
40
Keywords: Indonesian Throughflow Water, seasonal cycles, freshening thermocline, Java41
Sea.42
3
1. Introduction43
44
The Indonesian Throughflow (ITF), from its Pacific Ocean entrances to its exits into the45
Indian Ocean, follows different pathways within the Indonesian archipelago, along which it46
undergoes modification through air-sea interaction and mixing of water masses (Gordon and47
Fine, 1996). As a result, as the ITF exits into the Indian Ocean through the major outflow48
straits of Lombok, Ombai and the Timor Passage (Figure 1) it attains different hydrographic49
characteristics.50
51
During the INSTANT (International Nusantara Stratification and Transport) program, in52
addition to 11 moorings deployed in the major straits from December 2003 to December 200653
(Gordon et al., 2008; Van Aken et al., 2008; Sprintall et al., 2009) three intensive54
hydrographic surveys were conducted. The analysis of this new CTD data set, together with55
the historical CTD data and Argo profiling data, complemented by the output of a numerical56
model leads to a more accurate description of the hydrographic characteristics of the ITF57
water masses and their variability. In particular this study reveals the importance of the input58
of the Java Sea Water that freshens not only the surface layer of the ITF, but also the lower59
thermocline.60
61
The Indonesian Throughflow Water (ITW) is composed of two water mass components, one62
of North Pacific origin, and the other of South Pacific origin (Wyrtki, 1961; Gordon and Fine,63
1996; Ilahude and Gordon, 1996). The North Pacific water is drawn by the Mindanao64
Current, following the western path from its entrance in the northeastern Sulawesi Sea to the65
Makassar Strait then to the Flores Sea (Figure 1). From here, about 20% of the throughflow66
exits directly to the Indian Ocean via Lombok Strait (Murray and Arief, 1988) and the bulk67

4
continues eastward to the Banda Sea, before outflowing to the Indian Ocean through Ombai68
and Timor straits. The North Pacific water is characterized by a salinity maximum in the69
thermocline layer (North Pacific Subtropical Water, NPSW), and a salinity minimum in the70
lower thermocline layer (North Pacific Intermediate Water, NPIW). The South Pacific water71
is a minor component in the throughflow water (Gordon and Fine, 1996). This water consists72
of South Pacific Subtropical Lower Thermocline Water (SPSLTW) that appears at lower73
thermocline depths along the eastern path, from Halmahera Sea and Maluku Sea to the Seram74
Sea then to the Banda Sea (Wyrtki, 1961; Ilahude and Gordon, 1996).75
76
Surface salinity exhibits strong annual variation in the Indonesian seas associated with a huge77
supply of fresh water from the Java Sea during the rainy northwest monsoon from December78
to March (Wyrtki, 1961). Conductivity-Temperature-Depth (CTD) surveys were taken during79
the Arus Lintas Indonesia (ARLINDO) experiment during both the peak rainy and dry80
monsoon periods in 1993 and 1994 (Gordon and Fine, 1996; Ilahude and Gordon, 1996).81
These data confirmed Wyrtki’s (1961) results within the internal Indonesian seas, but did not82
extensively sample in the outflow straits. Less salty water occupied the surface to upper83
thermocline in southern Makassar Strait during the peak northwest monsoon period during84
ARLINDO. Furthermore, near-surface salinity near the outflow straits remained relatively85
high during both monsoon phases (Gordon and Fine, 1996). Murray et al. (1991) found a86
near-surface fresh layer in Lombok strait in June 1988, spreading from northern Lombok87
strait into the Indian Ocean. Similarly during the Java-Australia Dynamics Experiment88
(JADE) survey in April to May 1993, a fresh near-surface layer of ITW was observed in89
Ombai Strait (Molcard et al., 2001). Sprintall et al., (2003) showed a distinct freshening of90
near-surface salinity during the April-June monsoon transition season (hereafter referred to as91
transition-1) in the outflow straits. We will show that this low salinity surface water, carried92
5
by the monsoon current and subject to strong tidal mixing along its pathway inside the93
internal Indonesian seas modifies the thermocline layer of the ITF as it exits into the Indian94
Ocean. These characteristics and their variability give clues to the heat and fresh water95
budgets of the internal Indonesian Seas and also affect the Indian Ocean downstream.96
97
This paper is organized as follows. In Section 2 we describe the new data set and model,98
Section 3 compares the different hydrographic characteristics of the water masses in each exit99
strait. In Section 4, variability in the upper and thermocline layers in the observations are100
compared with the output of a regional numerical model, as well as the Argo data set, which101
allows a dynamic interpretation of the larger spatial context of the changes observed in the102
straits. Conclusions are given in Section 5.103
104
105
2. Observational and Model Data Sets106
CTD measurements in the outflow straits (Lombok Strait, Ombai Strait and Timor Passage)107
were collected during the deployment and servicing of INSTANT mooring arrays in August108
2003, December 2003/January 2004, and June 2005 (Figure 2). In Lombok Strait, the RV109
Baruna Jaya VIII (BJ8) obtained 24 casts in January 2004 and June 2005. Fifteen additional110
CTD-oxygen casts were obtained from the RV Umitaka-Maru in December 2003 from central111
South Java coast to south of Lombok Strait. In Ombai Strait, CTD measurements were112
collected from the RV Southern Surveyor in August 2003 and the BJ8 in January 2004 and113
June 2005 to give a total of 32 casts. In Timor Passage, two CTD sections were completed by114
the BJ8 during all three INSTANT cruises in the western passage, near the Timor sill, and one115
section was done by the Southern Surveyor in the eastern passage in August 2003, giving a116
total of 31 CTD casts (Figure 2). Five CTD stations were also made in Dao Strait, just north117

6
of Timor sill in June 2005. In addition, we used 12 CTD archive data collected from the BJ8118
during the southeast monsoon (July-September) in Sulawesi Sea, Makassar Strait, Halmahera119
Sea, southern Maluku Sea, northwestern Banda Sea, and during the transition-1 in the central120
Flores Sea.121
122
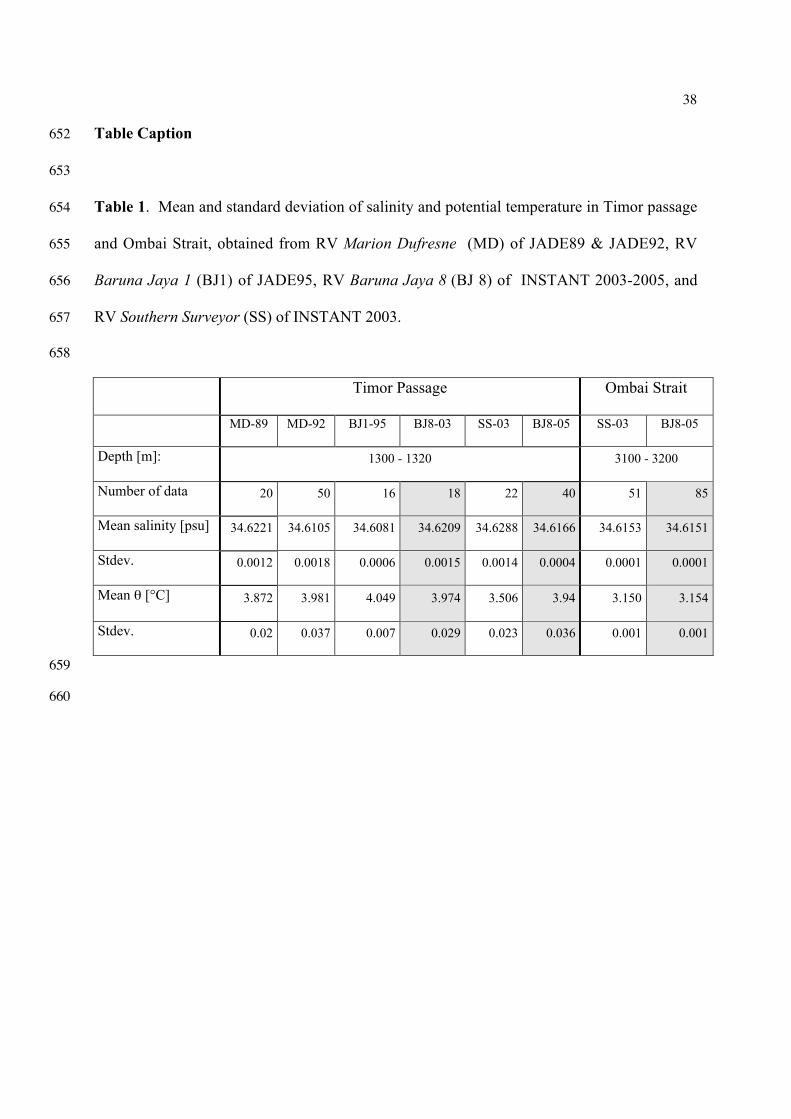
CTD profiles taken from the BJ8 were not complemented by bottle measurements for123
calibration purposes. Thus, the performance of the BJ8 CTD sensor was assessed by124
comparing the mean and standard deviation of salinity and potential temperature from all the125
different cruises at depths of 1,300-1,320 m in western Timor Passage and depths of 3,100-126
3,200 m in Ombai Strait. These layers contain a diluted ITW of Banda Sea origin with127
relatively homogeneous salinity (Fieux et al., 1994, 1996; Molcard et al., 1996, 2001). In128
Timor Passage the mean salinity obtained from the BJ8 CTD is within 0.01 psu of the129
calibrated values of the other cruise salinity data (Table 1). In Ombai Strait, the deep salinity130
of BJ8 CTD measurements is within 0.0002 psu of the well-calibrated Southern Surveyor131
values (CSIRO Division of Marine Research, 2003) (Table 1). Mean temperatures also are132
within 0.01°C of the other cruise temperatures (Table 1). These differences are much smaller133
than the large signals we describe below.134
135
We also used monthly means of salinity derived from Argo profile T-S data downstream of136
the outflow straits in the Indo-Australian Basin (IAB) to complement the INSTANT CTD137
data, by focusing on seasonality of the upper-ocean (0-200 m) fresh layer. The Argo data138
were obtained from Global Data Assembly Center (GDAC) at Scripps Institution of139
Oceanography, USA. Salinity anomaly is calculated as the departure from the mean gridded140
(1° latitude by 1° longitude) Argo data, spanning from 2004 to 2007, which covers the141
INSTANT measurement period. In particular, we analyzed time series of monthly salinity142

7
anomaly in the eastern IAB box 9°S-14°S; 109°E-122°E (Figure 1).143
144
Model output from a 1/4° horizontal resolution Ocean General Circulation Model (OGCM)145
simulation with seasonal climatology forcing was used. The model formulation and tuning are146
described by Koch-Larrouy et al. (2007) (hereafter referred to as KL07). KL07’s model147
differs from conventional formulations in that tidal vertical mixing is explicitly taken into148
account using an energy constrained parameterization. This means that the vertical diffusivity149
resulting from internal tide breaking (ktides) is expressed by a function of the energy transfer150
from barotrophic tides to baroclinic tides which is a function of space and stratification151
(KL07):152
ktides = (1)153
where Γ = 0.2 is the mixing efficiency, N the Brünt-Vaisala frequency, ρ the density, q the154
tidal dissipation efficiency, E(x,y) the energy transfer per unit of area from barotropic tides to155
baroclinic tides and F(z) its vertical structure. Model bathymetry is carefully checked by156
adjusting the depth and the width of each passage in the model domain to allow the major157
flow pathways of the ITF. The resulting simulation has annual mean transports, paths and158
water masses characteristics in good agreement with observations (KL07). In particular, the159
homogeneous salinity profile in Timor Passage is well reproduced along with other observed160
water mass changes.161
162
163
3. Results from CTD Observations164
165
3.1 Characteristics of the ITW166
8
a. Along the throughflow paths167
168
Pacific water enters the interior Indonesian seas from different entrances and follows different169
paths before exiting to the Indian Ocean via the outflow straits. Along the western path the170
temperature-salinity relationship (flow is from dark-red to green locations in Figure 3) clearly171
shows the reduction of the salinity extremes of the NPSW, centered near σθ=24.5, and the172
NPIW, centered near σθ=26.5. The observed salinity maximum of NPSW is reduced from173
34.90 psu near the entrance to 34.53 psu at the exit channels – a salinity change of > 0.4 psu.174
The NPIW minimum is 34.35 psu at the entrance and is modified to 34.47 psu on exit.175
Previous observation and model studies indicate that strong tidal mixing in the interior seas176
erodes the salinity extremes of the Pacific water (e.g., Ffield and Gordon, 1992; Hautala et al.,177
1996; Hatayama, 2004; KL07).178
179
South Pacific water penetrates the interior seas through an eastern pathway (dark-blue to180
violet in Figure 3), and is particularly evident at intermediate levels between σθ=26-27.181
However, high-salinity lower thermocline water of SPSLTW may be very strongly mixed by182
tides along this path with peak salinities changing from 34.60 to 34.25 psu. In eastern Timor183
passage (light violet) salinity is nearly homogeneous in the thermocline and intermediate184
waters derived from the Banda Sea.185
186
Property structure of ITW north of 5°S (Figure 3) sampled during the southeast monsoon187
(July-August) is in good agreement with that found previously (Gordon and Fine,1996;188
Ilahude and Gordon, 1996). However, during the transition-1 cruise, the ITW characteristics189
near Lombok Strait (orange), in central Flores Sea (green), and near Ombai Strait (violet)190
9
exhibit much fresher near-surface and thermocline water, compared to those observed during191
the rainy northwest monsoon (Figure 3). The near-surface fresh layer is confined to southern192
Makassar Strait during the rainy season (Ilahude and Gordon, 1996).193
194
195
b. Contrasts between the outflow straits196
197
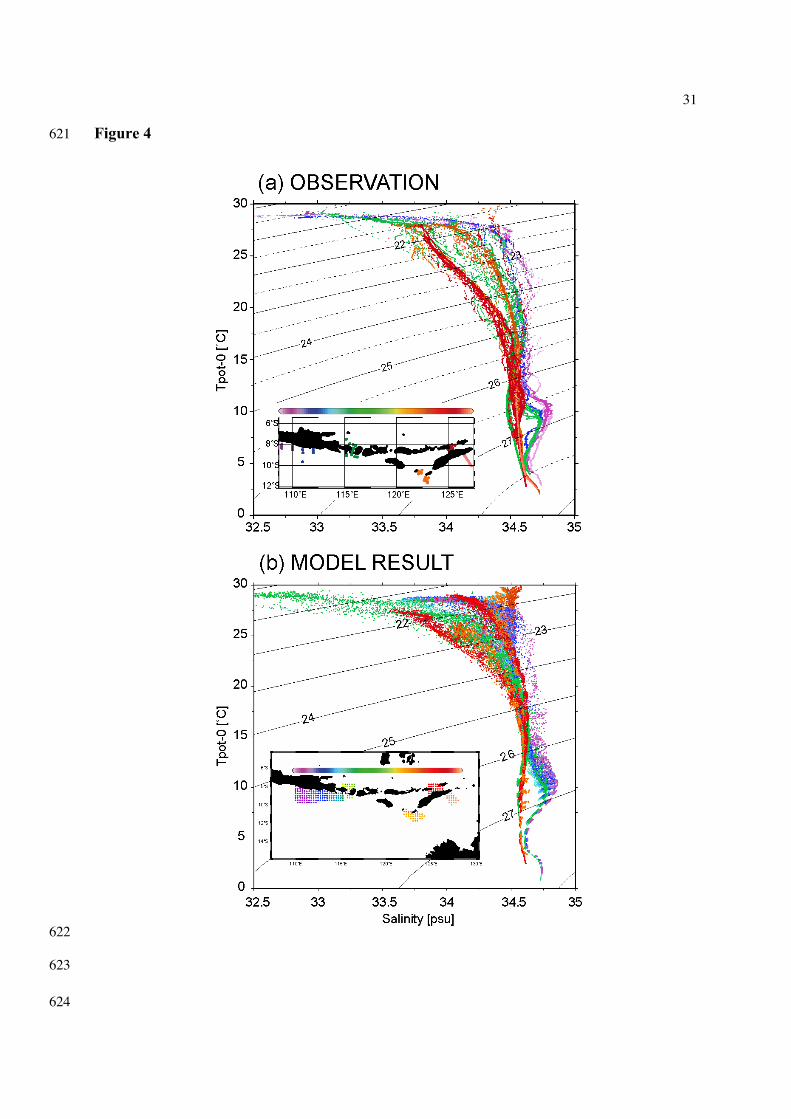
The T-S relation of the observed ITW at the various outflow straits (Lombok, Ombai, Dao,198
and Timor) with respect to longitude is shown in Figure 4a. For comparison results from199
KL07’s model are also presented (Figure 4b). The warm near-surface layer from 20-22 σθ200
consists of Java Sea water (green), water from south of Java (violet, blue) and near-surface201
more saline (~34.40 psu) and warmer (29.0 °C) surface waters found at Timor Passage202
(orange). Fresher surface water is also observed at Ombai between 20-22 σθ (red). Some203
surface salinity changes are likely due to monsoonal freshwater forcing. All straits show204
variations during the different monsoon periods, although Ombai Strait (red) shows the205
strongest variability between cruises.206
207
Along the 22-25 σθ surfaces, large salinity contrasts between the straits appear: a relatively208
fresh thermocline at Ombai (red) and Dao (orange) Straits; homogeneous (across209
temperatures) saline water at Timor (orange); an evident salinity maximum of NPSW near210
σθ=24.5 at Lombok (green); and high saline North Indian Subtropical Water south of Java and211
Bali (violet, blue). At intermediate depths, NPIW with a salinity minimum at σθ=26.5 around212
Lombok Strait (green) contrasts with the relatively homogeneous and saline water of Timor213
Passage (orange). At Ombai, relatively saline SPSLTW is found at σθ=26.5 (red) and North214
10
Indian Intermediate Water (NIIW) at σθ=26.8 (green, blue, violet) lies off southern Java-215
Bali with the core layer at the western section being much saltier than that in the eastern216
section. Below σθ=27.5, saline and cold upper Indian Ocean Deep Water (IDW) is dominant217
south of Java (violet) and in Timor Passage (orange, red).218
219
The contrasts between the water masses in the outflow straits are related to the length of the220
pathway from the Pacific inflow and the different residence times within the internal221
Indonesian seas. Lombok Strait (green – Figure 4), with the most direct connection with222
Makassar Strait, features much stronger salinity extremes of NPSW and NPIW. In contrast,223
Timor Passage, with the longest connection to Makassar Strait, features relatively224
homogeneous and saline water at thermocline and intermediate depth (orange – Figure 4).225
The Timor throughflow is drawn from the Banda Sea basin, where local surface fresh water226
and Pacific water mix over long residence times, and thus carries the most modified waters of227
all the outflow straits. Below σθ=27.6 (depth > 1400 m to the bottom) more saline (S>34.60228
psu) and colder (T<4 °C) upper IDW is observed, which fills the Timor Trough as shown by229
the similar T-S values between eastern (red light) and western Passage (orange).230
231
Most ITW features described above confirm the previous observations (Gordon et al., 1994;232
Ilahude and Gordon, 1996; Fieux et al., 1994; 1996). However, our new data (Figure 4)233
clearly show the formation of a very fresh layer not only in the near-surface, but extending to234
lower thermocline depths where it acts to attenuate the salty NPSW thermocline water. This235
is most obvious in Ombai Strait (red, Figure 4), where salinity at the near-surface falls from236
34.3 psu to 33.8 psu, and at thermocline depths falls from 34.65 psu to 34.25 psu.237
238
11
239
c. Temporal Variability240
241
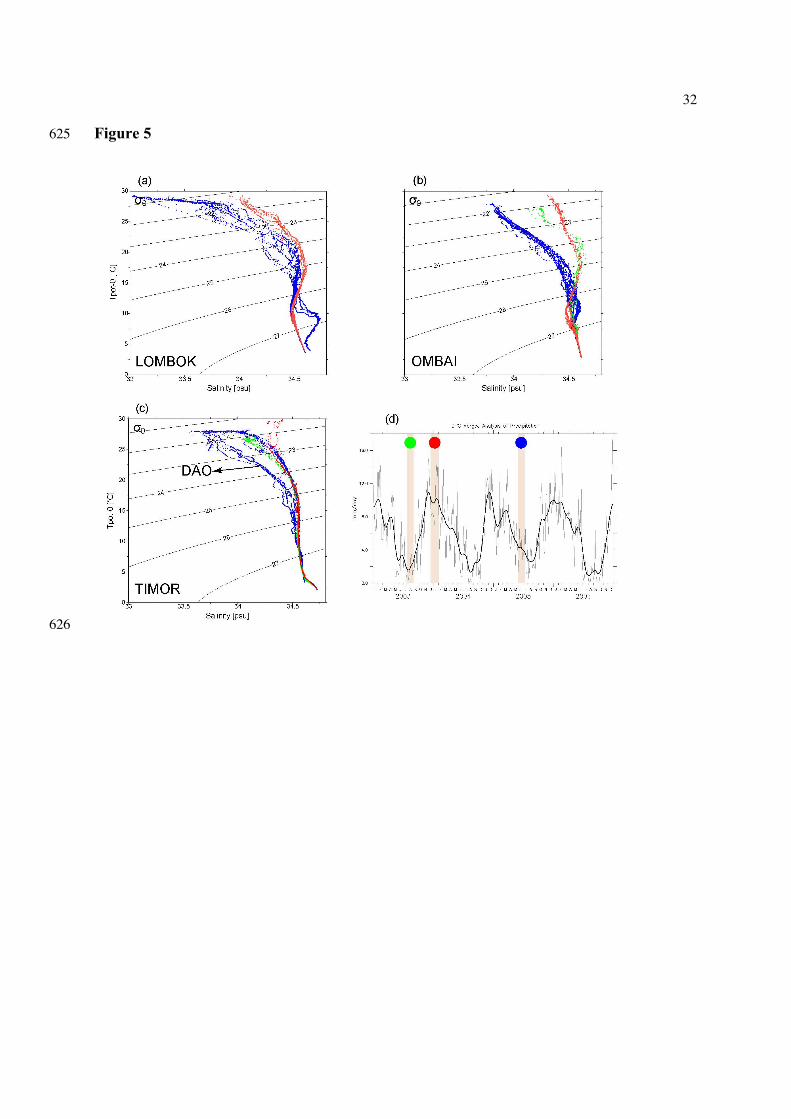
On monsoonal time scales, the largest change in property structure of ITW in the outflow242
straits take place during the transition-1. The changes are likely due to phase lags between the243
inflow (e.g. Makassar Strait, Java Sea) and outflow straits (Figure 5). During June 2005, at244
the transition-1, very fresh water (S< 33.75 psu) is evident in Lombok Strait extending down245
into the upper thermocline, near σθ=23.5 (blue) (Figure 5a). A remnant salinity maximum of246
NPSW is evident at σθ=24.5, and the minimum of NPIW at σθ=26.5 are detectable for both247
the June 2005 and December 2003 cruises. During December 2003, the NPIW south of248
Lombok Strait is emphasized by the sharp elbow caused by the salinity maximum of the249
NIIW at σθ=26.8.250
251
The strong freshening of the near-surface to lower thermocline layers in June 2005 is also252
observed in Ombai Strait (Figure 5b). By comparison, the cruise data during both the dry253
southeast monsoon (August 2003) and the northwest monsoon (December 2003-January254
2004) show a much saltier surface and thermocline, which is consistent with Gordon et al.255
(1994) and Ilahude and Gordon (1996). Near-surface freshening in the outflow straits was256
previously reported by Sprintall et al. (2003), but Figure 5 clearly shows the freshening layer257
is not only confined to the near-surface layer, but extends down to the upper thermocline in258
Lombok Strait, and to the lower thermocline in Ombai and Dao Straits.259
260
It is likely that this freshening occurs annually in the ITW with the near-surface and261
thermocline in the outflow straits lagging the monsoon-forced freshening in the Java Sea and262
12
southern Makassar Strait by several months. Precipitation data over the Java Sea show the263
contrast between the dry southeast monsoon and the rainy northwest monsoon, whereas the264
June 2005 survey was during the transition-1 from the rainy to the dry season (Figure 5d).265
Since the freshening reaches thermocline depths, this suggests that strong vertical mixing266
must take place between the near-surface fresh water from the Java Sea and the inflowing267
NPSW/NPIW via Makassar Strait as suggested by Gordon et al. (2003). The model will be268
used to investigate this idea below (Section 4).269
270
Another striking feature in June 2005 is the presence of high salinity water at intermediate271
depths in Ombai Strait (26.5 σθ) that, during the peak monsoon periods of August 2003 and272
January 2004, is dominated by the salinity minimum of NPIW (Figure 5b). This high salinity273
core layer may originate from lower thermocline water of South Pacific origin, which enters274
from the Halmahera to Seram Seas, and then flows to the Banda Sea to reach Ombai Strait (as275
shown in section 3.1a). At this time SPSLTW occupies most of southern Ombai Strait, while276
less salty intermediate water is confined to northern Ombai Strait along southern Alor Island.277
This less salty intermediate water suggests an intrusion of upper NIIW via weak eastward278
flow in the South Java Undercurrent as observed by the INSTANT mooring located at North279
Ombai (Sprintall et al., 2009).280
281
In Timor Passage, salinity changes are largely confined to the near-surface layer. Higher282
salinity occurs in August 2003 and January 2004 than during the transition-1 period of June283
2005 (Figure 5c). During June 2005 a fresh layer is observed above σθ=22. However, in Dao284
Strait, just north of the western Timor Passage, the surface and thermocline are distinctly285
fresher in June 2005 (Figure 5c), similar to that observed in Ombai Strait during June 2005286
13
(Figure 5b). This confirms that part of the Ombai ITW is exiting into the Indian Ocean via287
Dao Strait between Sumba and Roti, while the rest may outflow through Sumba Strait288
between Sumbawa and Sawu Islands (Fieux et al., 1996). The relatively saline (S> 34.30289
psu) and warm near-surface waters in the Timor Passage are probably derived from the290
northern coast of Australia, as reported by Cresswell et al. (1993) and Fieux et al. (1994).291
Below the surface layer, only small salinity changes are evident at thermocline and292
intermediate levels between the eastern and western Timor sections.293
294
295
4. Variability of ITW: Model output and Argo Data296
297
4.1 Near-surface fresh water298
299
Our snapshot cruise data are not sufficient to describe the complete spatial and temporal300
variability of the surface to lower thermocline fresh layer observed in the outflow straits.301
Here, we use the OGCM results from KL07 to assess the seasonal changes of ITW and302
understand the origin of the fresh water flux, as well as the monsoonal phase lags between the303
inflow and outflow straits.304
305
We examine 5-day averages of temperature and salinity at the 46 depth levels from the model,306
and form a climatology based on 5 years of model output forced by a mean seasonal307
climatology of surface fluxes (Molines et al., 2007; KL07). The T-S relationship from the308
model at the outflow straits and along the southern coasts of Java and Bali agree well with the309
INSTANT CTD data (Figure 4b). Near-surface and thermocline fresh layers are represented310
well in the model at Lombok (green) and Ombai (red). In particular, the large observed311

14
salinity changes from the surface through the thermocline in Ombai Strait (red, Figure 4b)312
between January and June is replicated well by the model. At intermediate and deep levels,313
the model T-S relationships are also quite realistic.314
315
The mean annual cycle of the surface salinity in the model does a remarkable job of316
reproducing the available observed salinity data from the outflow straits (Figure 6). The317
available observations in the respective sampling boxes shown in Figure 1 are monthly318
averaged: in the eastern Java Sea there are 5 months of available, in Lombok Strait there are 9319
months, in Ombai Strait there are 10 months, and in western Timor Passage there are 11320
months. In most cases the modeled and observed mean monthly salinities agree within their321
respective error bars (gray lines on Figure 6), and show a similar amplitude and phase for the322
seasonal cycle (Figure 6).323
324
Strong annual variation of near-surface salinity is evident in eastern Java Sea and Lombok325
Strait with a minimum (~32.2 psu and ~32.7 psu, respectively) between February and April326
and a maximum (>34.3 psu) in August-September (Figure 6a, b). The salinity decrease of 1.7327
psu from November to March in these regions is due to heavy precipitation during the328
northwest monsoon (see Figure 5 d). A salinity maximum (~34.3 psu) during the southeast329
monsoon period August-September, may correspond to much stronger inflow of relatively330
high salinity water from Makassar Strait and the eastern internal Indonesian seas. Gordon et331
al. (1999) found the surface Makassar throughflow is stronger during the southeast monsoon.332
333
Annual salinity variations are much smaller (~0.9 psu) in Ombai Strait and Timor Passage334
(Figure 6 c-d) compared to Lombok Strait and the Java Sea. This suggests that either strong335
vertical mixing in the Flores Sea causes an increase of surface salinity or that much of the336
15
freshest Java Sea water is diverted through Lombok Strait. The size of the annual surface337
salinity variation appears to erode with distance from the Java Sea (Figure 6-d).338
339
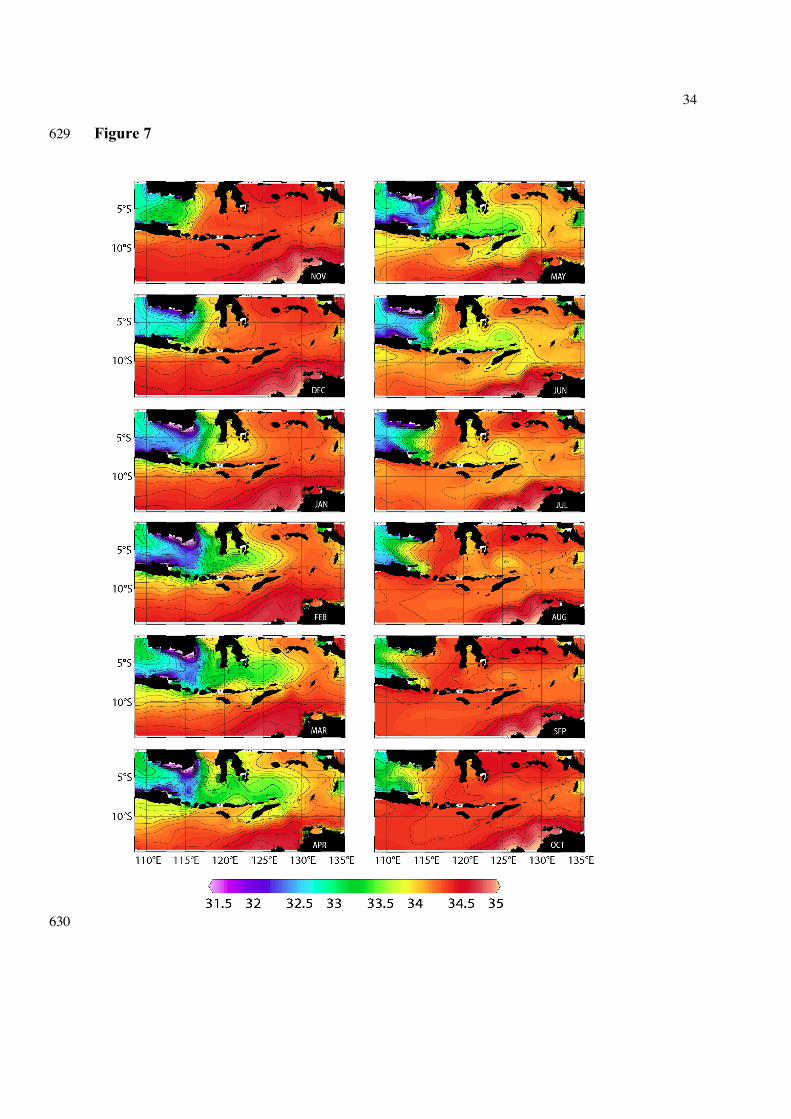
Evolution of monthly mean near-surface salinity from November to May in the model clearly340
shows an eastward propagation of fresh surface waters from the eastern Java Sea, then to the341
Flores Sea and the Banda Sea, before reaching the outflow straits (Figure 7). During the342
southeast monsoon from July to September, the Makassar throughflow supplies saltier surface343
water to the Java and Flores Seas, displacing the northwest monsoon fresh layer. Also salty344
water from the western Seram Sea and eastern Banda Sea replaces the fresh surface water in345
that region during this phase of the monsoon.346
347
During the peak rainy season in January, fresh water is confined only to the eastern Java Sea,348
southern Makassar Strait, and central Flores Sea (Figure 7). At the outflow straits salty water349
is dominant at this time. Lombok Strait is the first outflow strait that experiences the350
subsequent fresh water pulse from the Java Sea. The maximum extent of fresh water351
incursion into the Banda Sea takes place in April. In May, the fresh layer moves eastward352
covering central/eastern Flores Sea, the western Banda Sea, and subsequently enters Ombai353
Strait, southern Savu Sea, Dao Strait, and along Timor Passage. Meanwhile, more saline354
water from Makassar throughflow begins to block the eastward fresh water flow from the355
Java Sea. During the peak southeast monsoon in September, the fresh layer drains from the356
outflow straits into the Indian Ocean, and salinity of ~34.2 psu is visible near Ombai, southern357
Savu Sea, and western Timor Passage (Figure 7). At this time, most of the upper Makassar358
throughflow passes directly to the Lombok Strait, and the remnant continues eastward into359
Flores Sea. The maximum extent of salty water in the Java and western Banda Seas takes360
place in September. The near-surface salinity maps in Figure 7, suggest it takes about 1–5361

16
months for the freshwater formed in the Java Sea during the northwest monsoon to reach362
the outflow straits: about one month to Lombok, 3 months to Ombai and 5 months to Timor.363
The evolution of the surface fresh water from the Java Sea and the southern Makassar ITW,364
described in Figure 7, is consistent with the results of Gordon et al. (2003). During the365
northwest monsoon, the Ekman drift pushes the near-surface fresh water from the Java Sea366
into the southern Makassar Strait. In contrast, the southeast monsoon facilitates southward367
flow from the Makassar Strait.368
369
Strong diapycnal mixing in the interior seas, mainly in Dewakang sill in southern Makassar370
Strait, central Flores Sea, and the exit straits (KL07), leads to a vertical penetration of near-371
surface fresh water from the Java Sea into deeper layers. The freshening of the upper372
thermocline layer is shown by model salinity on surface potential density 23 σθ (Figure 8), as373
part of the upper throughflow component flowing into the IAB. Here, the freshwater from374
Lombok Strait appears between February and May, and from Ombai and Timor in May-375
September. Thus, freshening in the IAB takes place around February-September (Figure 8).376
In July-August, the freshening of the IAB corresponds to a saltier Flores Sea, and conversely,377
in March-April the freshening in the Flores Sea coincides with a saltier IAB. This suggests, a378
migration time of freshwater from Flores Sea to the IAB of about 5-6 months.379
380
381
4.2 Near-surface and thermocline fresh layer in the IAB382
383
To follow the temporal and spatial variation of the near-surface fresh layer of throughflow384
water into the IAB, we performed an EOF analysis on the monthly average (0-50 m) salinity385
anomaly from the mapped Argo profile T-S data over the INSTANT time period from 2004-386

17
2007. The two leading EOF modes explain 68% and 20% of the variance respectively, and387
account for 88% of the total monthly salinity variance. Figure 9 shows the spatial pattern and388
associated temporal variation of these modes. The first mode (EOF1) is strong over the entire389
IAB, but lessens near the western IAB boundary (Figure 9a). The associated temporal390
variation illustrates the seasonal fluctuation in salinity, with negative expansion coefficients391
from May to September and positive coefficients from October to April (Figure 9a, right392
panel). The second mode (EOF2) displays a dipole pattern between the northern and southern393
IAB (Figure 9b). The associated temporal variation also indicates seasonal fluctuations with394
the EOF2 time series leading EOF1 by 3 months. The third mode with 3% of variance, has a395
weak spatial pattern in the central and eastern/western IAB with associated higher temporal396
fluctuation on 3-7 months (not shown).397
398
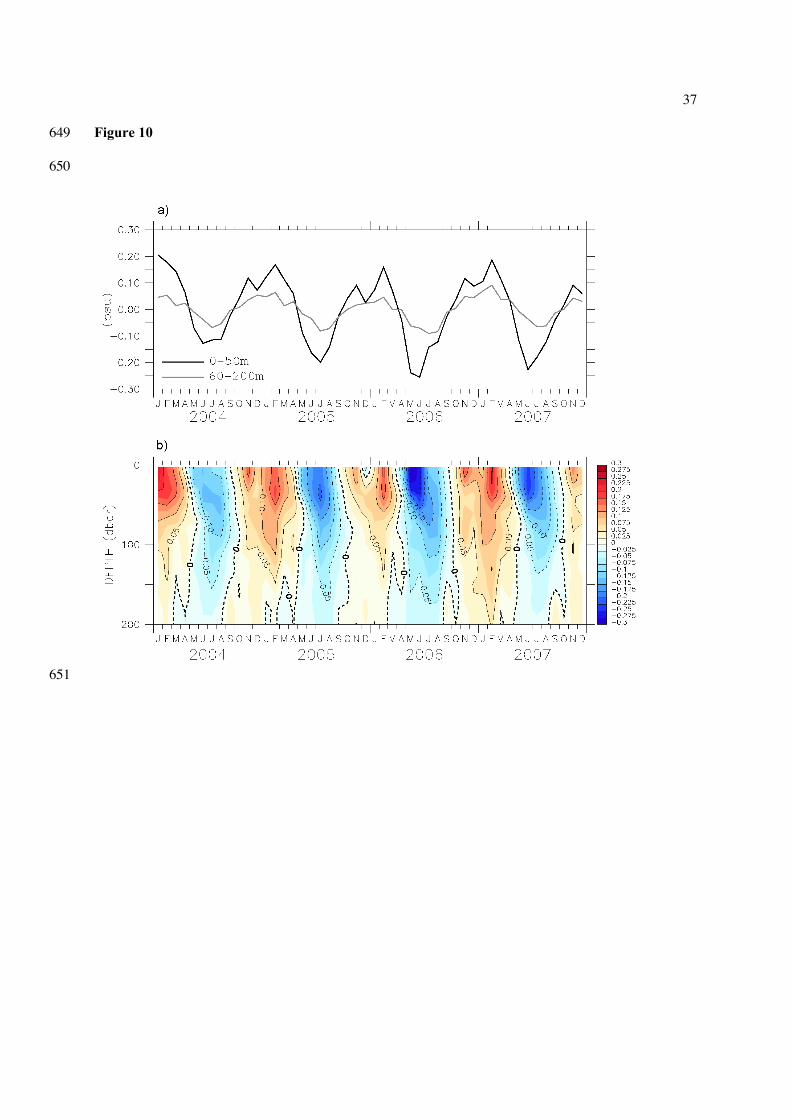
We wish to examine the cause of the variability in the EOF1, and average the salinity399
anomaly in the box (9°S-14°S; 109°E-122°E). The time series of the monthly salinity400
anomaly in this box reveals prominent seasonal fluctuation in the upper 200m with freshening401
(negative anomaly) in May-September, and becoming saltier (positive anomaly) in October-402
April (Figure 10). These periods represent the transition-1 to the southeast monsoon, and the403
monsoon transition (transition-2) to the northwest monsoon, respectively. The amplitude of404
variation (Figure 10a) is much stronger in the upper 50 m (about 0.45 psu) than that between405
60-200 m (about 0.15 psu).406
407
The fresh layer observed in the IAB between the transition-1 and the southeast monsoon408
period (Figure 10), is supplied by the throughflow from the interior Indonesian seas. During409
the southeast monsoon the throughflow transport is maximum in the IAB (Meyer et al., 1995;410
Fieux et al., 1994, 2005), and in the exit straits (Molcard et al., 1996, 2001; Sprintall et al.,411
18
2009). The upper component of throughflow water north of 12°S in the IAB between Java-412
Australia has salinity less than 34.5 psu (Fieux et al., 1994, 2005). Recirculation of the fresh413
South Java water in the northern IAB may also contribute to the salinity variation in this414
region (Fieux et al., 1994; Sprintall et al., 1999; Wijffels et al., 2002). For example, the salty415
surface layer during the northwest monsoon is persistently perturbed by weak fresh water in416
the upper 50 m in December (Figure 10b), and this is probably related to the circulation of the417
fresh South Java Water.418
419
As shown in the data and model results (e.g. Figures 5 and 6), freshening of the near-surface420
and thermocline waters in the outflow straits are evident during transition-1 around April-421
June. This fresh water is derived from the fresh Java Sea water with phase lags of several422
months. Lombok Strait is expected to allow the fresh Java Sea water to outflow into the423
Indian Ocean earlier than from Ombai and Timor straits. Different timing in the export of424
fresh water through each outflow strait may result in a longer freshening episode within the425
IAB reservoir, as shown in Figure 10. The event commenced from transition-1 (April-June)426
through the southeast monsoon (July-September), with a minimum around July-August. The427
salty period, with its peak in February in the IAB (Figure 10) is dominated by local Indian428
Ocean saltier water due to a relaxation of throughflow transport, and is consistent with429
hydrographic data collected during the JADE experiment (Fieux et al., 2005).430
431
432
5. Conclusion433
434
We have described the characteristics and variability of ITW at the outflow straits (Lombok,435
Ombai, Timor) using INSTANT CTD data collected during cruises between 2003 and 2005,436

19
complemented with T-S output from a numerical model and Argo profiling data to assess437
the larger spatial and temporal context of the changes found in the straits. This more precise438
description offers one necessary step to assess the impact of the ITF on the heat and fresh439
water fluxes as it flows into the Indian Ocean and is part of the objectives of the INSTANT440
program.441
442
Each outflow strait features a distinct variant of ITW. Lombok Strait, with the shortest443
conduit to the Pacific via Makassar Strait, has a much stronger North Pacific water signature.444
In contrast, Timor Passage, with the longest conduit to the Pacific via the Banda Sea and445
Flores Sea features ITW that is most strongly modified from the inflow waters. Below ~1400446
m depth in the Timor Passage, upper IDW is dominant, which corroborates a deep447
inflow/outflow, as observed from the INSTANT mooring data in this passage (Sprintall et al.,448
2009). All these ITW features largely confirm what is found in previous studies.449
450
Water masses present in both Ombai and Lombok Straits suggest changing sources during the451
annual cycle. North Pacific water at thermocline and intermediate depths is found during the452
peak of both the northwest and southeast monsoons in agreement with previous studies.453
However, during the April-June monsoon transition, there is a large freshening by the Java454
Sea water, that is not only confined to the near-surface as reported before, but extends to455
thermocline depths, and therefore acts to attenuate the signature of the North Pacific waters.456
The freshening deepens throughout the thermocline layer as the ITW progresses along the457
pathway from the Java Sea. The freshening is maximum in Ombai Strait, where intermediate458
water of SPSLW origin also appears at this time, drawn to the strait through the eastern459
throughflow pathway.460
461
20
Model results from KL07 suggest that excess precipitation and river run-off in the Java Sea462
supplies the near-surface very fresh water to the outflow straits, but with an advective phase463
lag between one and five months. During the dry southeast monsoon, the surface fresh water464
is flushed out of the internal seas through the straits to the Indian Ocean, but is partially mixed465
down into the main thermocline by the strong tidal mixing in the region. In this way the466
excess precipitation over the internal seas is distributed into the thermocline of the South467
Indian Ocean. Here, salinity anomaly derived from Argo T-S profile data in the IAB indicates468
the strong seasonal fluctuation of the fresh layer at the surface and thermocline depths from469
transition-1 to the southeast monsoon period. The freshening of this layer lasts much longer470
than previously estimated, and is related to different phase lags between the IAB and outflow471
straits.472

21
473
Acknowledgements. Strong support and fruitful cooperation for the INSTANT program from474
Center Research for Marine and Fisheries (BRKP) Jakarta are highly acknowledged. We475
thank captain and crews of RV Baruna Jaya VIII and I for their valuable support and keen476
interest of works. We are very grateful to Dr. Suharsono and Dr. Hadikusumah of P2O-LIPI,477
Dr. Y.S. Djajadihardja of BPPT, Dr. Irsan S. Brodjonegoro, Dr. Duto Nugroho of BRKP, and478
Prof. Takafumi Arimoto of TUMST for using their CTD archives data. ARGO profiler data479
were obtained from GDAC of Scripps Institution of Oceanography, University of California480
San Diego. AA has received beneficial French BGF scholarship and partly from the Ministry481
of National Education of Indonesia. JS contribution is supported by the National Science482
Foundation Award OCE0725476.483
22
References484
485
CSIRO Division of Marine Research (2003). FRV Southern Surveyor (as National Facility)486
Voyage Summary No. 06/2003.487
Cresswell, G., Frische A., Peterson J., Quadfasel D., (1993). Circulation in the Timor Sea.488
Journal of Geophysical Research 98, 14,379-14,389.489
Ffield, A., Gordon A.L., (1992). Vertical mixing in the Indonesian Thermocline. Journal of490
Physical Oceanography 22, 184-195.491
Fieux, M., Andrié, C., Delecluse, P., Ilahude, A.G., Kartavtseff, A., Mantisi, F., Molcard, R.,492
Swallow, J.C., (1994). Measurements within the Pacific-Indian oceans throughflow493
region. Deep-Sea Research I 41, 1,091–1,130.494
Fieux, M., Andrié, C., Charriaud, E., Ilahude, A.G., Metzl, N., Molcard, R., Swallow, J.C.,495
(1996). Hydrological and chlorofluoromethane measurements of the Indonesian496
throughflow entering the Indian Ocean. Journal of Geophysical Research 101,497
12,433–12,454.498
Fieux, M., Molcard, R., Morrow, R., Kartavtseff, A., Ilahude, A.G., (2005). Variability of the499
throughflow at its exit in the Indian Ocean. Geophysical Research Letter 32, L14616.500
Gordon, A.L., Ffield A., Ilahude A.G. (1994). Thermocline of the Flores and Banda Seas.501
Journal of Geophysical Research 99, 18,235-18,242.502
Gordon, A. L., Fine, R. A., (1996). Pathways of water between the Pacific and Indian Oceans503
in the Indonesian seas. Nature 379, 146-149.504
Gordon, A.L., Susanto, R.D., Ffield, A., (1999). Throughflow within Makassar Strait.505
Geophysical Research Letter 26, 3,325-3,328.506
Gordon, A.L., Susanto, R.D., Vranes, K., (2003). Cool Indonesian Throughflow as507
consequence of restricted surface layer flow. Nature 425, 824-828.508
23
Gordon A. L., R. D. Susanto, A. Ffield, B. A. Huber, W. Pranowo, S. Wirasantosa, (2008).509
Makassar Strait throughflow, 2004 to 2006. Geophysical Research Letter, 35, L24605,510
doi:10.1029/2008GL036372.511
Hautala, S. L., Reid, J. L., Bray, N., (1996). The distribution and mixing of Pacific water512
masses in the Indonesian Seas. Journal of Geophysical Research 101, 12,375-12,389.513
Hatayama, T., (2004). Transformation of the Indonesian throughflow water by vertical514
mixing and its relation to tidally generated internal waves. Journal of Oceanography515
60, 569-585.516
Ilahude, A.G, Gordon, A.L., (1996). Thermocline stratification within the Indonesian Seas.517
Journal of Geophysical Research 101, 12,401-12,409.518
Koch-Larrouy, A., Madec, G., Bouruet-Aubertot, P., Gerkema, T., Bessiéres, L., Molcard, R.,519
(2007). On the transformation of Pacific Water into Indonesian ITW by internal tidal520
mixing. Geophysical Research Letter 10.1029/ 2006GL028405.521
Meyer, G., Bailey, R.J., Worby, A.P., (1995). Geostrophic transport of Indonesian522
throughflow. Deep-Sea Research I 42, 1,163-1,174.523
Molcard, R., Fieux, M., Ilahude, A.G., (1996). The Indo-Pacific Throughflow in the Timor524
Passage. Journal of Geophysical Research 101, 12,411-12,420.525
Molcard, R., Fieux, M., Syamsudin, F., (2001). The Throughflow within the Ombai Strait.526
Deep-Sea Research I 48, 1,237-1,253.527
Molines, J.M., Barnier, B., Penduff, T., Brodeau, L., Treguier, A.M., Theetten, S., Madec, G.,528
(2007). Definition of the interannual experiment ORCA025-G70, 1958-2004. LEGI529
Report. 34pp.530
Murray, S.P., Arief, D., (1988). Throughflow into the Indian Ocean through the Lombok531
Strait January 1985-January 1986. Nature 333, 444-447.532
Murray, S.P., Arief, D., Kindle, J.C., Hurlburt, H.E., (1991). Characteristics of circulation in533
24
an Indonesian archipelago strait from hydrography, current measurement and534
modeling results, in The physical oceanography of Sea straits, edited by L.J. Pratt.535
NATO ASI Series, p. 3-23.536
Schlitzer, R., (2005). Ocean Data View, http://www.awi-bremerhaven.de/GEO/ODV.537
Sprintall, J., Chong, J., Syamsudin, F., Morowitz, W., Hautala, S., Bray, N., Wijffels, S.,538
(1999). Dynamics of the South Java Current in the Indo-Australian Basin. Geophysical539
Research Letter 26, 2,493-2,496.540
Sprintall, J., Potemra, J. T., Hautala, S.L., Bray, N. A., (2003). Temperature and salinity541
variability in the exit passages of the Indonesian Throughflow. Deep-Sea Research II542
50, 2,183-2,204.543
Sprintall, J., Wijffels, S., Molcard, R., and Jaya, I., (2009). Direct estimates of the Indonesian544
Throughflow entering the Indian Ocean: 2004-2006. Submitted to Journal of545
Geophysical Research.546
Van Aken, H.M., Brodjonegoro, I.S., Jaya I., (2008). The deep-water motion through the547
Lifamatola Passage and its contribution to the Indonesian throughflow. Deep-Sea548
Research I, doi: 10.1016/j.dsr.2009.02.001549
Wijffels, S., Sprintall, J., Fieux, M., Bray, N., (2002). The JADE and WOCE I10/IR6550
Throughflow section in the southeast Indian Ocean. Part 1: water mass distribution and551
variability. Deep-Sea Research II 49, 1,341-1,362.552
Wyrtki, K., (1961). Physical oceanography of the Southeast Asian waters. NAGA Report553
Volume 2, Scripps Institution of Oceanography, 195 pp.554

25
Figure Captions555
556
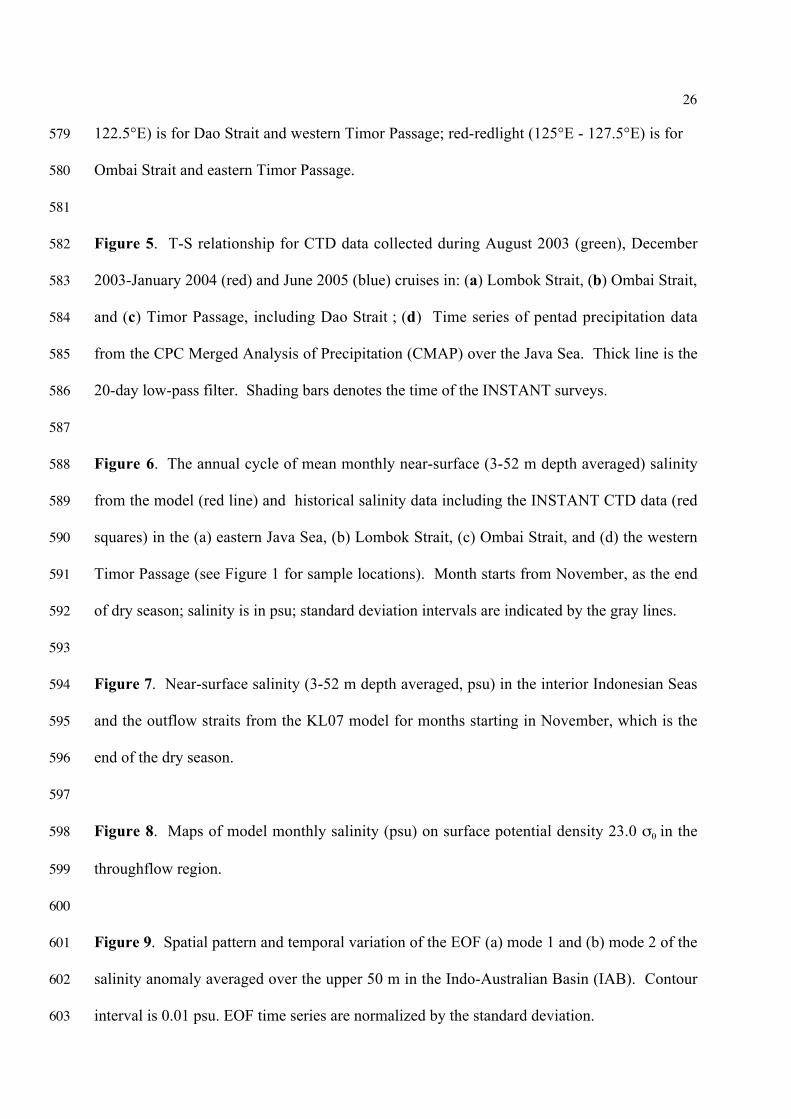
Figure 1. Schematic circulation of the Indonesian Throughflow near the outflow straits. Part557
of Makassar throughflow passes directly to Lombok Strait (LS) and the remnant continues558
eastward to Flores Sea, then Banda Sea, before outflowing into both Ombai Strait (OS) and559
Timor Passage (TP). Seram throughflow enters into western Banda Sea that brings South560
Pacific lower thermocline water. Near-surface circulation along northern and southern Java is561
indicated by grey arrow. During northern winter (December-February), this eastward562
monsoonal coastal current in north of Java brings near-surface fresh and warmer water.563
Sample box in the Indo-Australian Basin (IAB) is for averaging Argo T-S profiling data.564
Bathymetry contours are for 100 and 1000 m depths.565
566
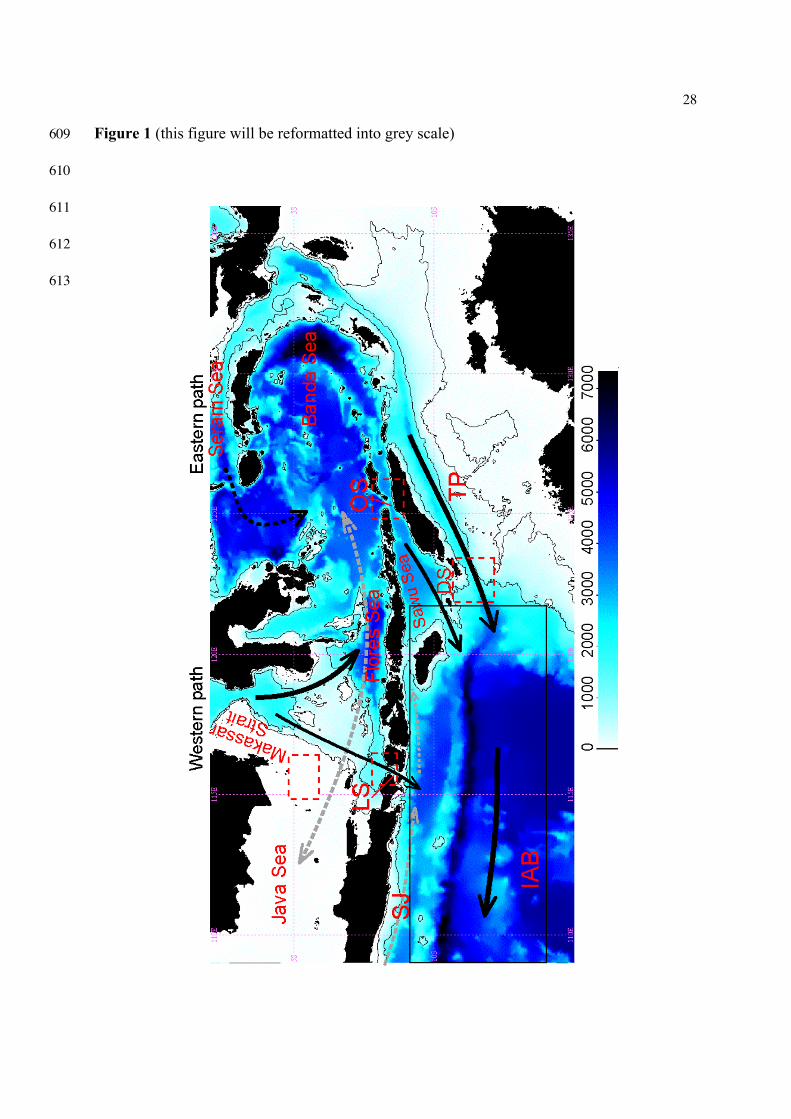
Figure 2. Map of CTD stations in the outflow straits during deployment (2003) and567
redeployment (2005) of INSTANT mooring arrays. Additional CTD stations along south568
Java-Bali waters were obtained during the Deepsea Trawling Experiment in December 2003.569
570
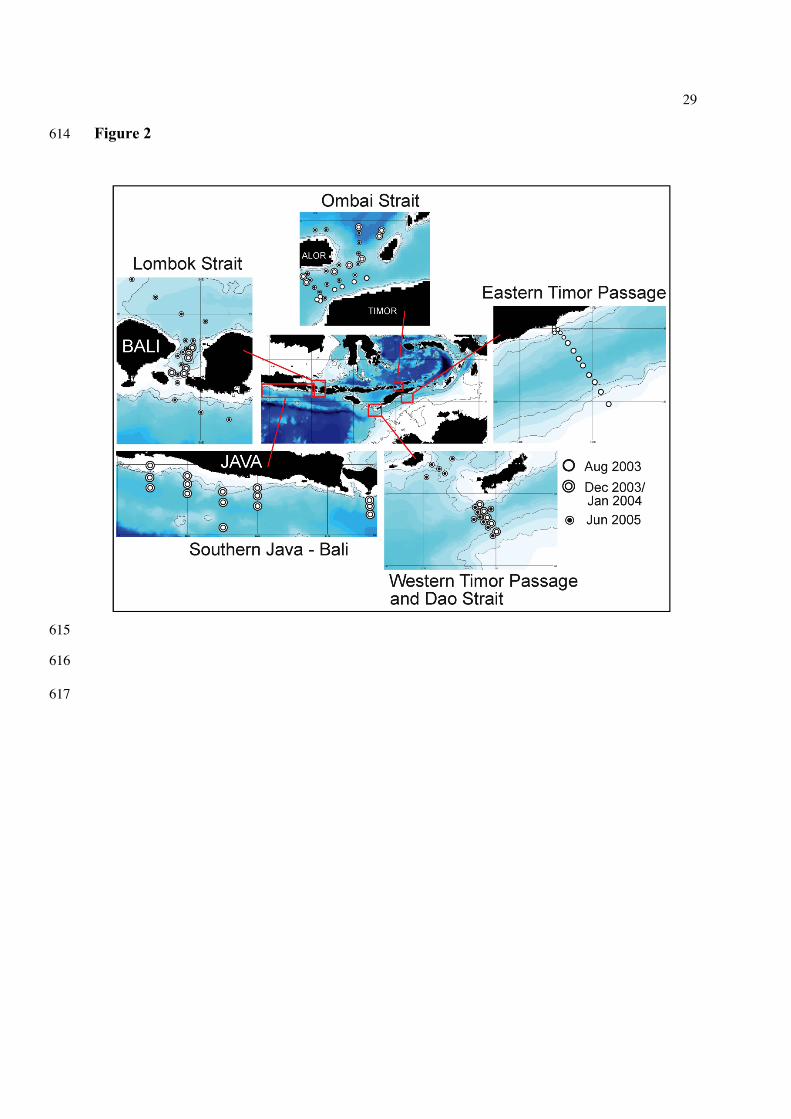
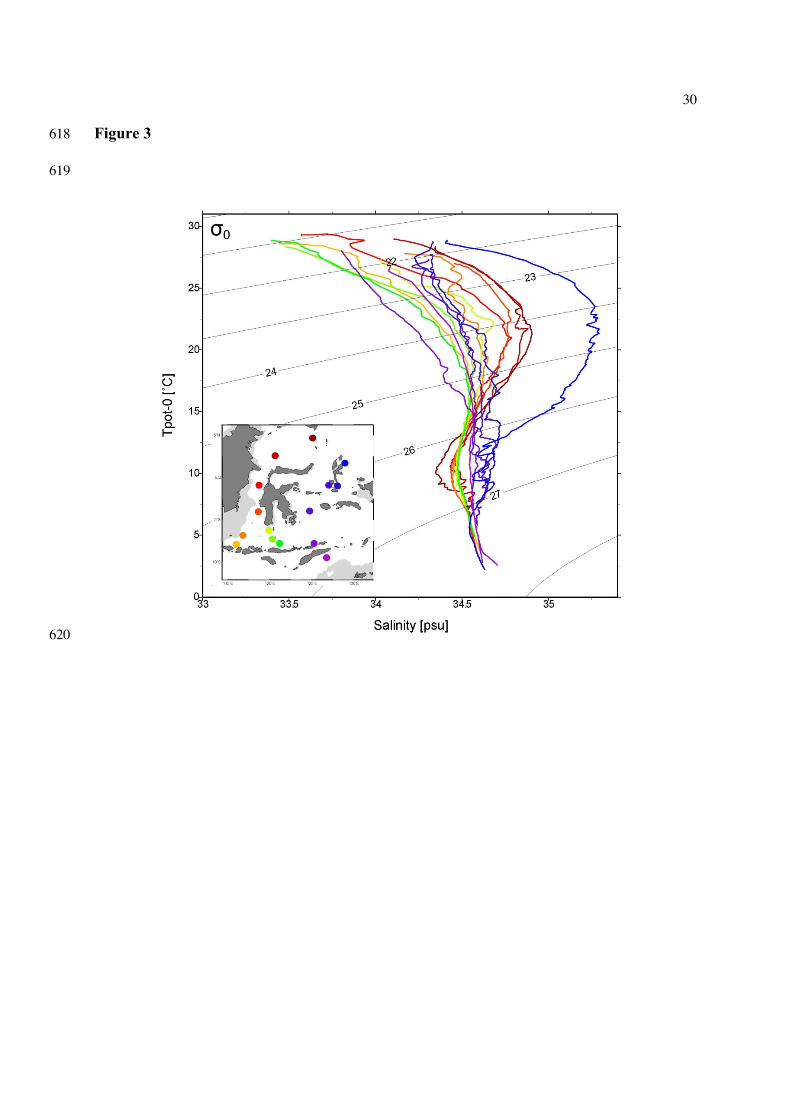
Figure 3. T-S relationship along the primary throughflow paths: the western path (dark red to571
green) and eastern path (dark blue to violet), obtained from recent CTD survey stations572
between 2003 and 2005 (inset).573
574
Figure 4. T-S relationship in the outflow straits and southern Java-Bali waters from: (a)575
INSTANT surveys 2003-2005, and (b) from the KL07 model result. The color key indicates576
the longitude of the CTD stations shown in the inset. Violet and blue colors (109°E - 112.5°E)577
represent southern Java-Bali; green (115°E - 117.5°E) is for Lombok Strait; orange (120°E -578
26
122.5°E) is for Dao Strait and western Timor Passage; red-redlight (125°E - 127.5°E) is for579
Ombai Strait and eastern Timor Passage.580
581
Figure 5. T-S relationship for CTD data collected during August 2003 (green), December582
2003-January 2004 (red) and June 2005 (blue) cruises in: (a) Lombok Strait, (b) Ombai Strait,583
and (c) Timor Passage, including Dao Strait ; (d) Time series of pentad precipitation data584
from the CPC Merged Analysis of Precipitation (CMAP) over the Java Sea. Thick line is the585
20-day low-pass filter. Shading bars denotes the time of the INSTANT surveys.586
587
Figure 6. The annual cycle of mean monthly near-surface (3-52 m depth averaged) salinity588
from the model (red line) and historical salinity data including the INSTANT CTD data (red589
squares) in the (a) eastern Java Sea, (b) Lombok Strait, (c) Ombai Strait, and (d) the western590
Timor Passage (see Figure 1 for sample locations). Month starts from November, as the end591
of dry season; salinity is in psu; standard deviation intervals are indicated by the gray lines.592
593
Figure 7. Near-surface salinity (3-52 m depth averaged, psu) in the interior Indonesian Seas594
and the outflow straits from the KL07 model for months starting in November, which is the595
end of the dry season.596
597
Figure 8. Maps of model monthly salinity (psu) on surface potential density 23.0 σθ in the598
throughflow region.599
600
Figure 9. Spatial pattern and temporal variation of the EOF (a) mode 1 and (b) mode 2 of the601
salinity anomaly averaged over the upper 50 m in the Indo-Australian Basin (IAB). Contour602
interval is 0.01 psu. EOF time series are normalized by the standard deviation.603

27
604
Figure 10. Time series of the monthly average (a) 0-50 m (black line) and 60-200 m (gray605
line) EOF1 salinity anomaly, and (b) full-depth EOF1 salinity anomaly in the IAB (see Figure606
1 for sample box), determined from Argo data between 2004-2007.607
608
28
Figure 1 (this figure will be reformatted into grey scale)609
610
611
612
613
29
Figure 2614
615
616
617
30
Figure 3618
619
620
31
Figure 4621
622
623
624
32
Figure 5625
626

33
Figure 6627
628
34
Figure 7629
630

35
Figure 8631
632

36
Figure 9633
634
635
636
637
638
639
640
641
642
643
644
645
646
647
648
37
Figure 10649
650
651
38
Table Caption652
653
Table 1. Mean and standard deviation of salinity and potential temperature in Timor passage654
and Ombai Strait, obtained from RV Marion Dufresne (MD) of JADE89 & JADE92, RV655
Baruna Jaya 1 (BJ1) of JADE95, RV Baruna Jaya 8 (BJ 8) of INSTANT 2003-2005, and656
RV Southern Surveyor (SS) of INSTANT 2003.657
658
Timor Passage Ombai Strait
MD-89 MD-92 BJ1-95 BJ8-03 SS-03 BJ8-05 SS-03 BJ8-05
Depth [m]: 1300 - 1320 3100 - 3200
Number of data 20 50 16 18 22 40 51 85
Mean salinity [psu] 34.6221 34.6105 34.6081 34.6209 34.6288 34.6166 34.6153 34.6151
Stdev. 0.0012 0.0018 0.0006 0.0015 0.0014 0.0004 0.0001 0.0001
Mean θ [°C] 3.872 3.981 4.049 3.974 3.506 3.94 3.150 3.154
Stdev. 0.02 0.037 0.007 0.029 0.023 0.036 0.001 0.001
659
660