Embed Size (px)
Citation preview
TEP
Principle
In a PEM electrolyser, the electrolyte consists of a protonconducting membrane and water(PEM = Proton-Exchange-Membrane). When an electric voltage is applied, hydrogen andoxygen are formed. The PEM fuel cell generates electrical energy from hydrogen andoxygen. The electrical properties of the electrolyser and the fuel cell are investigatedrecording a current-voltage characteristic line. The efficiency is determined measuring thequantities of the gases generated or consumed.
Related topics
Electrolysis, electrode polarisation, decomposition voltage, galvanic elements, Faraday’s law.
Tasks
1. Record the characteristic line of the PEM electrolyser.
2. Record the characteristic line of the PEM fuel cell.
3. Determine the efficiency of the PEM electrolysis unit.
4. Determine the efficiency of the PEM fuel cell.
P2411100 PHYWE Systeme GmbH & Co. KG © All rights reserved 1
Characteristics and efficiency of PEM fuel cell
and PEM electrolyser
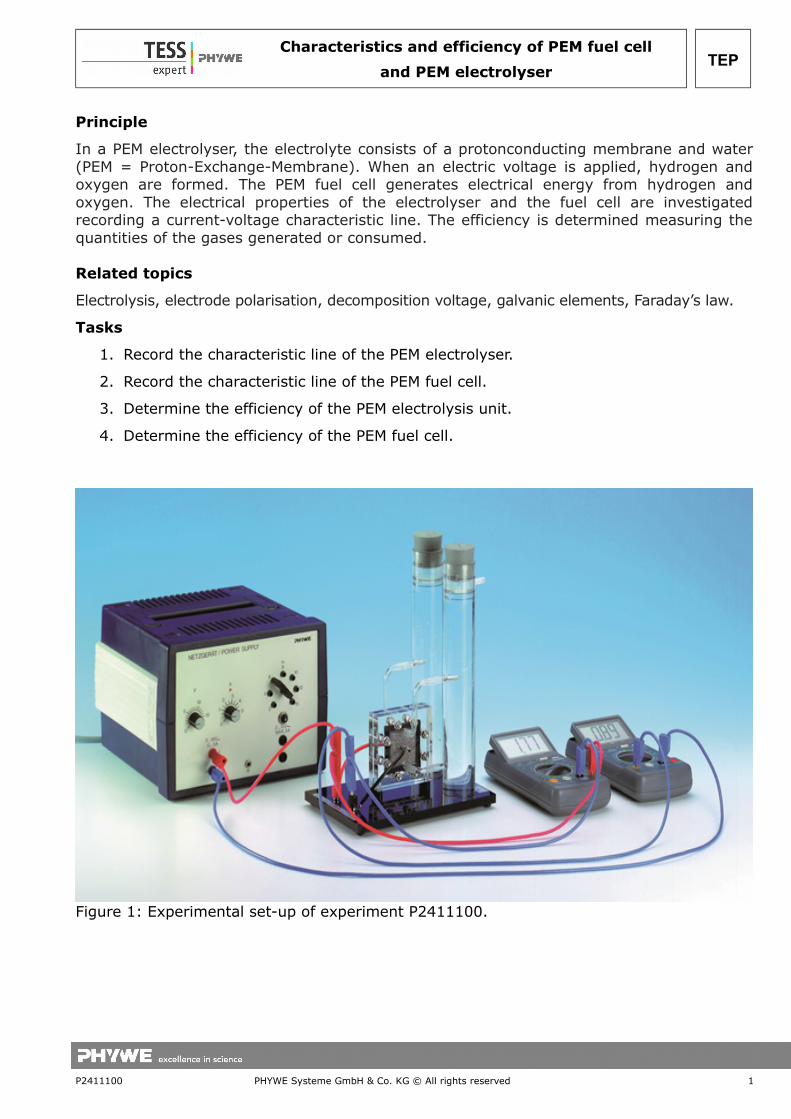
Figure 1: Experimental set-up of experiment P2411100.
Equipment
1 PEM fuel cell 06747-00 1 PEM electrolyser 06748-00 1 Connection box 06030-23 2 Resistor in plug-in box 10 Ohm 06056-10 1 Resistor in plug-in box 5 Ohm 06055-50 1 Resistor in plug-in box 2 Ohm 06055-20 2 Resistor in plug-in box 1 Ohm 06055-10 2 Short-circuit plug, black 06027-05 1 Gas bar 40466-00 1 Graduated cylinder,100 ml. plastic 36629-01 1 Rubber tubing, i.d. 4 mm 39280-00 1 Rubber tubing, i.d. 6 mm 39282-00 4 Pinchcock. width 10 mm 43631-10 2 Tubing adaptor, ID 3-6/7-11 mm 47517-01 1 Wash bottle, plastic, 500 ml 33931-00 1 Beaker, 250 ml, bw form, plastic 36013-01 1 Stopwatch, digital, 1/100 sec. 03071-01 1 Barometer/Manometer. hand-held 07136-00 1 Lab thermometer, -10...+100°C 38056-00 2 Digital multimeter 07134-00 1 Power supply, universal 13500-93 3 Connecting cord, l = 500 mm, red 07361-01 2 Connecting cord, l = 500 mm, blue 07361-04 1 Connecting cord. l = 750 mm, red 07362-01 1 Connecting cord, l = 750 mm, blue 07362-04 1 Water, distilled, 5 l 31246-81
Set-up and procedure
1. Characteristic line of the PEMelectrolyser
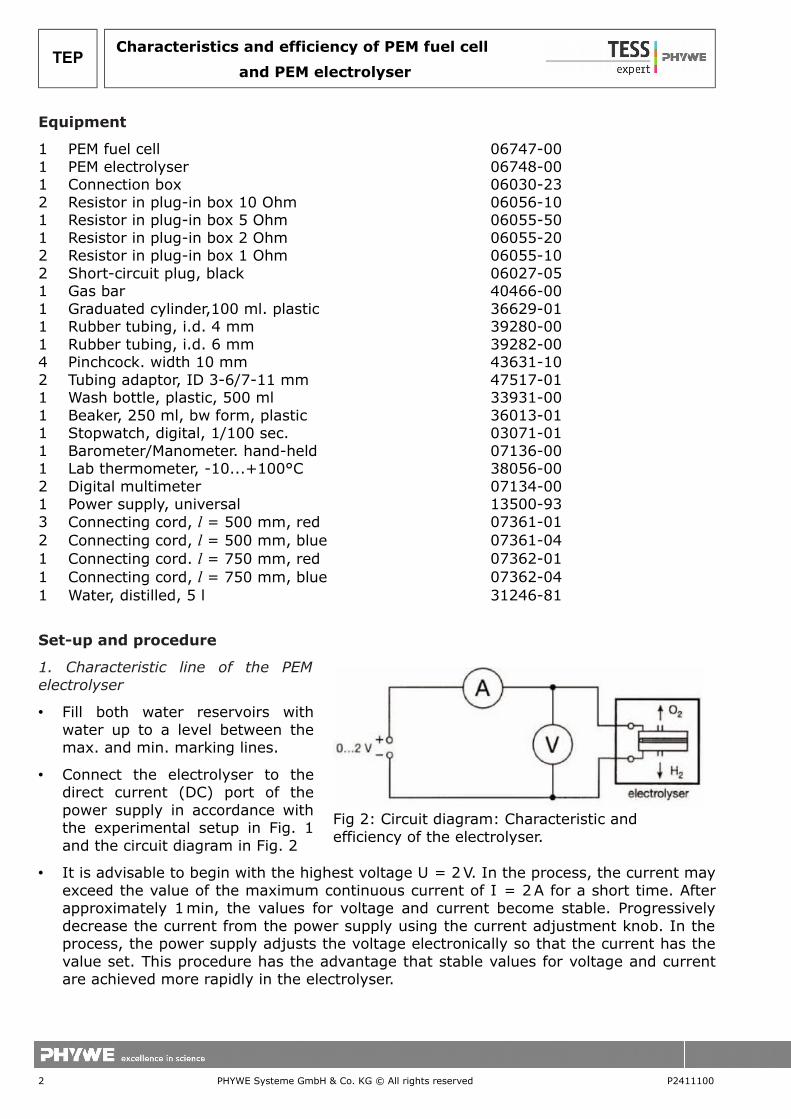
• Fill both water reservoirs withwater up to a level between themax. and min. marking lines.
• Connect the electrolyser to thedirect current (DC) port of thepower supply in accordance withthe experimental setup in Fig. 1and the circuit diagram in Fig. 2
• It is advisable to begin with the highest voltage U = 2 V. In the process, the current mayexceed the value of the maximum continuous current of I = 2 A for a short time. Afterapproximately 1 min, the values for voltage and current become stable. Progressivelydecrease the current from the power supply using the current adjustment knob. In theprocess, the power supply adjusts the voltage electronically so that the current has thevalue set. This procedure has the advantage that stable values for voltage and currentare achieved more rapidly in the electrolyser.
2 PHYWE Systeme GmbH & Co. KG © All rights reserved P2411100
TEPCharacteristics and efficiency of PEM fuel cell
and PEM electrolyser
Fig 2: Circuit diagram: Characteristic and efficiency of the electrolyser.

TEP
When the current adjustment knob has reached its minimum, even smaller values canbe selected with the aid of the voltage adjustment knob. Before recording a measuredvalue, wait approximately 1 min until the current and voltage values have again becomestable.
2. Characteristic line of the PEM fuel cell• To record the characteristic line, the most simple method of providing the fuel cell with
gas is to connect it directly with the electrolyser. However, it is also possible to take thegas from the gas bar, as described inthe measurement of efficiency section.
• The experimental set-up is performedaccording to Fig. 3 and the circuitdiagram Fig. 4.
• Preparation of the electrolyser:Connect pieces of thin rubber tubing,which are approximately 40 cm long,(di = 4 mm) to the upper outletconnections of the storage container onthe electrolyser. Fill both waterreservoirs up the “Gas test” line withdistilled water. While doing so, hold upthe tubing so that it also fills with water. Put the rubber stoppers onto the storagecontainers in a manner such that no air bubbles form under them and then press themin tightly. Hold the water-filled pieces of rubber tubing into a beaker filled with distilledwater. Connect the electrolyser to the power supply as shown in Fig. 2 and set a currentof max. 2 A or an operating voltage of max 2 V.
P2411100 PHYWE Systeme GmbH & Co. KG © All rights reserved 3
Characteristics and efficiency of PEM fuel cell
and PEM electrolyser
Figure 3: Experimental set-up: Characteristic line of the fuel cell.
Figure 4: Circuit diagram: Characteristic andefficiency of the fuel cell.
• When hydrogen and oxygen escape from the pieces of rubber tubing into the beaker,press the ends of the tubing briefly together; remove them from the water, and connectthem to the upper inlet connections of the fuel cell.
• Drops of water which could perhaps still be present in the tubes can interrupt the gassupply to the fuel cell. If this happens, the output voltage will drop. Lift the pieces oftubing briefly to allow the water to run out.
• The electrical data of the fuel cell are dependent on the gas throughput and themoistness of the membrane. To create a stable condition in the fuel cell, it should beallowed to run for approximately 5 min under no-load conditions and then operated forapproximately 5 min with a fixed load resistor of, e.g., 2 Ω.
• Connect load resistors of different sizes to the fuel cell according to the circuit diagramin Fig. 4. In each case measure the voltage U and the current I. First, measure the no-load voltage and then begin the measuring series with the largest resistance values.Since the internal resistance of the ammeter can not be neglected with respect to theload resistor, always use the 10-A measuring range. For resistance values smaller than1 Ω the values for current and voltage may not always be stable when an insufficientquantity of gas is supplied. Before making a measurement, the electric circuit should beopened for approximately 30 s, to ensure a good gas supply. Avoid short circuiting thefuel cell (max 10 s)!
3. Efficiency of the PEM electrolyser
• Preparation of the gas bar with 2 gasometers: A gasometer consists of an Erlenmeyerflask with a cylindrical funnel and a bent glass tube mounted on it.
• Connect the reducing adapters with a short piece of rubber tubing ( di = 6 mm) to eachof the glass tubes on the gasometer. Fill each of the gasometers via its cylindrical funnelwith distilled water until the Erlenmeyer flask and the right-angled glass tube are filledand contain nearly no bubbles. Excess water then flows out via the glass tube and iscollected in a beaker. The filling heights of the cylindrical funnels are calibrated. It isadvisable to check the exactness of these markings by filling the entire funnel withdistilled water and then allowing it to flow into a volumetric measuring device.
• The experimental set-up for the determination of the electrolyser’s efficiency isperformed according to Fig. 5.
• Connect an approximately 40-cm-long piece of thin rubber tubing ( di = 4 mm) to theupper outlet connection of the storage container of the electrolyser.
• Fill both water reservoirs up the “Gas test” line with distilled water. While doing so holdup the tubing so that it also fills with water.
• Seal the water-filled pieces of rubber tubing with a hose clamp approximately 2 cm fromtheir ends and attach them to the gasometers.
• Put the rubber stoppers onto the storage containers in a manner such that no airbubbles form under them and then press them in tightly so that no gas can escape.
• Open the hose clamps.
• Connect the electrolyser to the power supply according to Fig. 2, and set a current ofapproximately 1 A with the current adjustment knob.
4 PHYWE Systeme GmbH & Co. KG © All rights reserved P2411100
TEPCharacteristics and efficiency of PEM fuel cell
and PEM electrolyser
TEP
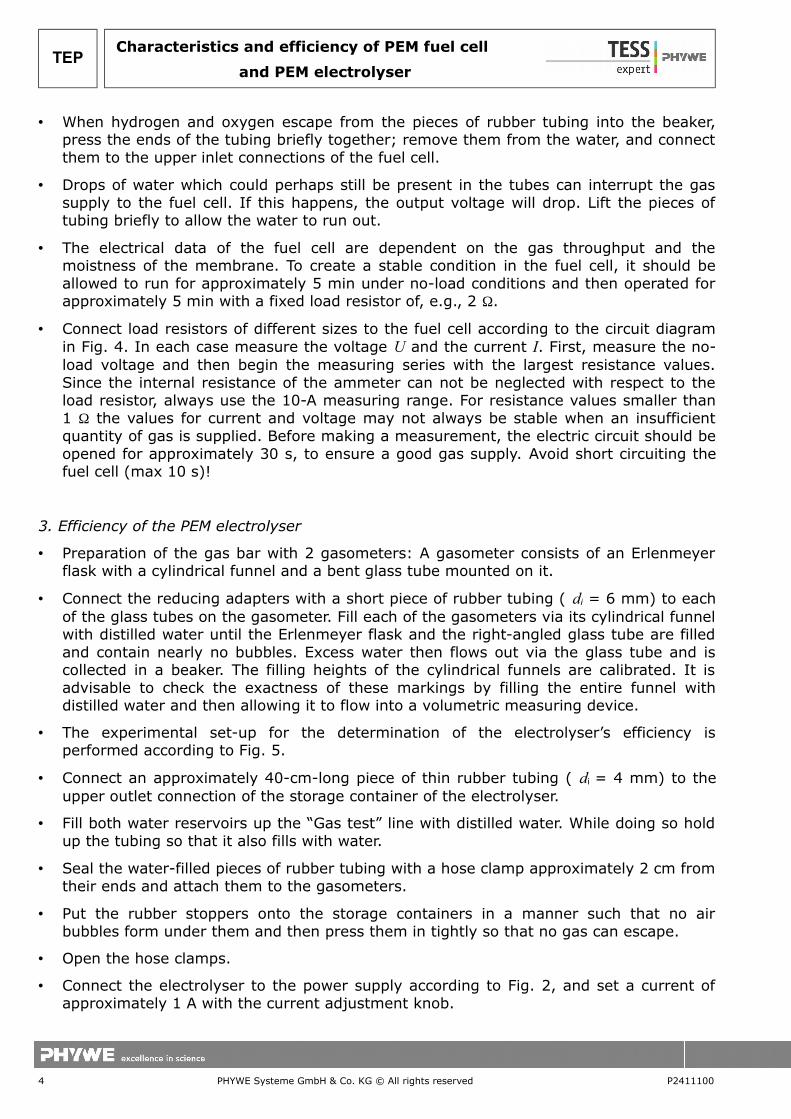
• The electrolyser generates hydrogen and oxygen in a ratio of 2 :1. The volume VH2 ofthe hydrogen generated is measured as a function of the time t. Start the timemeasurement when the water in the cylindrical funnel (H2) passes the lower mark.Measure the voltage U and the current I during electrolysis.
• Measure the room temperature R and the ambient pressure pamb.
• To conclude the experiment, switch off the electrolyser and close the tubes to thegasometers with the clamps.
• A repetition of this experiment with another current (e.g. 2 A) is facilitated, when, e.g.,the gasometers must again be refilled for experiments with the fuel cell.
4. Efficiency of the PEM fuel cell
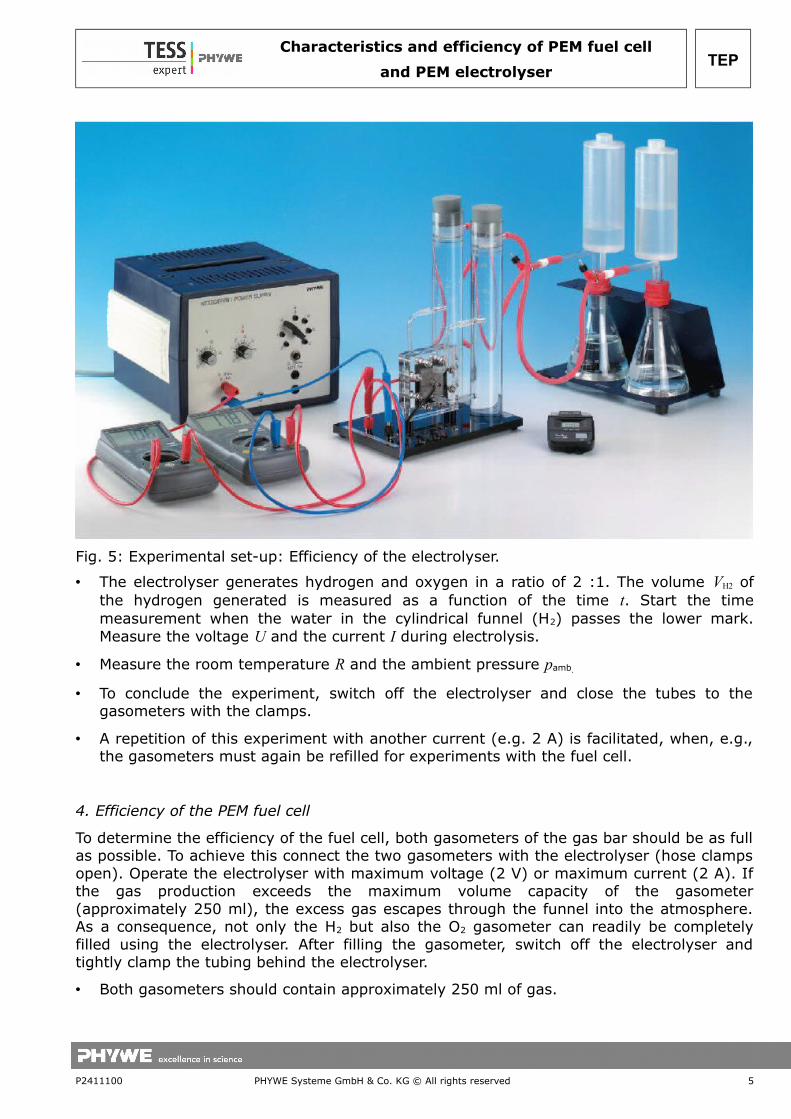
To determine the efficiency of the fuel cell, both gasometers of the gas bar should be as fullas possible. To achieve this connect the two gasometers with the electrolyser (hose clampsopen). Operate the electrolyser with maximum voltage (2 V) or maximum current (2 A). Ifthe gas production exceeds the maximum volume capacity of the gasometer(approximately 250 ml), the excess gas escapes through the funnel into the atmosphere.As a consequence, not only the H2 but also the O2 gasometer can readily be completelyfilled using the electrolyser. After filling the gasometer, switch off the electrolyser andtightly clamp the tubing behind the electrolyser.
• Both gasometers should contain approximately 250 ml of gas.
P2411100 PHYWE Systeme GmbH & Co. KG © All rights reserved 5
Characteristics and efficiency of PEM fuel cell
and PEM electrolyser
Fig. 5: Experimental set-up: Efficiency of the electrolyser.
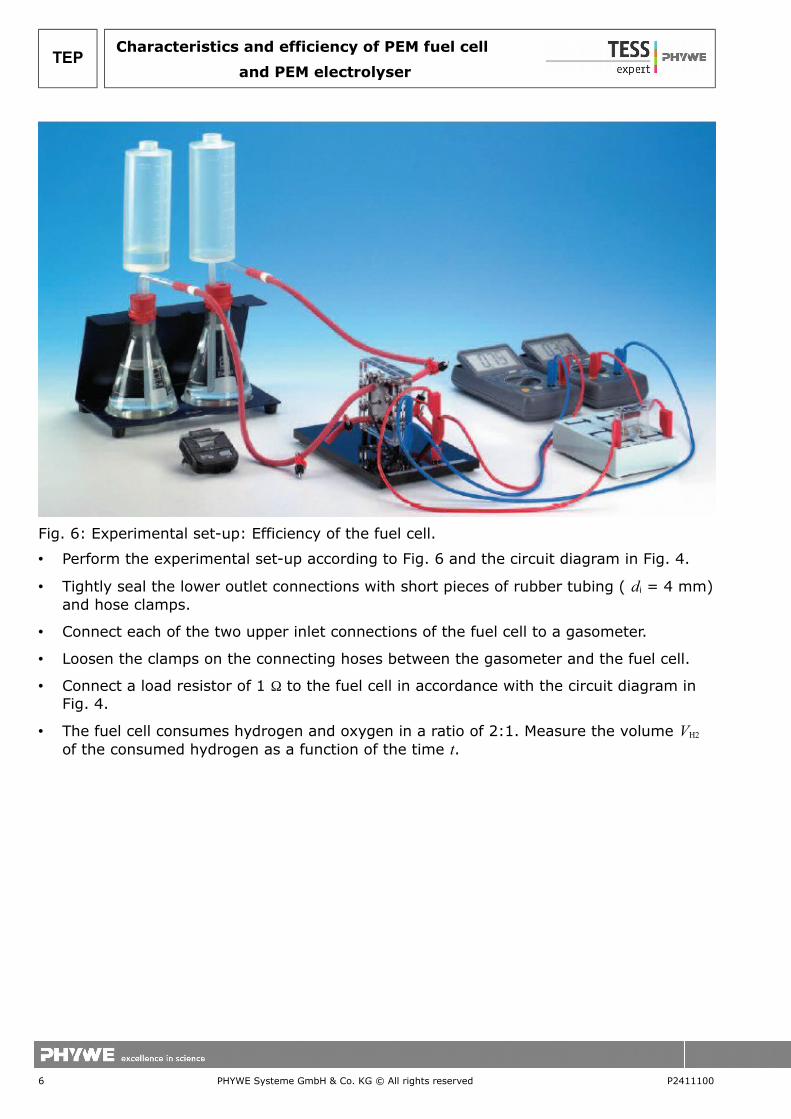
• Perform the experimental set-up according to Fig. 6 and the circuit diagram in Fig. 4.
• Tightly seal the lower outlet connections with short pieces of rubber tubing ( di = 4 mm)and hose clamps.
• Connect each of the two upper inlet connections of the fuel cell to a gasometer.
• Loosen the clamps on the connecting hoses between the gasometer and the fuel cell.
• Connect a load resistor of 1 Ω to the fuel cell in accordance with the circuit diagram in Fig. 4.
• The fuel cell consumes hydrogen and oxygen in a ratio of 2:1. Measure the volume VH2 of the consumed hydrogen as a function of the time t.
6 PHYWE Systeme GmbH & Co. KG © All rights reserved P2411100
TEPCharacteristics and efficiency of PEM fuel cell
and PEM electrolyser
Fig. 6: Experimental set-up: Efficiency of the fuel cell.
TEP
Note:
The values for voltage and current are not constant for longer periods of time, since thegas supply to the electrodes becomes poorer. Therefore, it is advisable to measure the timefor the consumption of 25 ml of hydrogen in each case, and to flush the fuel cell withhydrogen and oxygen between measurements.
• Loosen the hose clamp on the lower outlet connection on the oxygen side of the fuel cellcautiously and allow approximately 25 ml of oxygen to flow through the cell. Tighten theclamp.
• Then allow hydrogen to flow through in the same manner until the water level in thecylindrical funnel is approximately 1 mm above a calibration mark and retighten theclamp. Start measuring the time when the water level passes the calibration mark andstop measuring it when 25 ml of hydrogen have been used.
• Measure the voltage U and the current I at the beginning and at the end of the timeinterval.
• Again flush the fuel cell with oxygen and hydrogen, and perform a new timemeasurement for the consumption of 25 ml of hydrogen.
• Measure the room temperature TR and the ambient pressure pamb.
• A repetition of this experiment with another load resistor (e.g. 2 Ω ) is facilitated, when,e.g., the gasometers have been refilled for another experiment with the electrolyser.
P2411100 PHYWE Systeme GmbH & Co. KG © All rights reserved 7
Characteristics and efficiency of PEM fuel cell
and PEM electrolyser
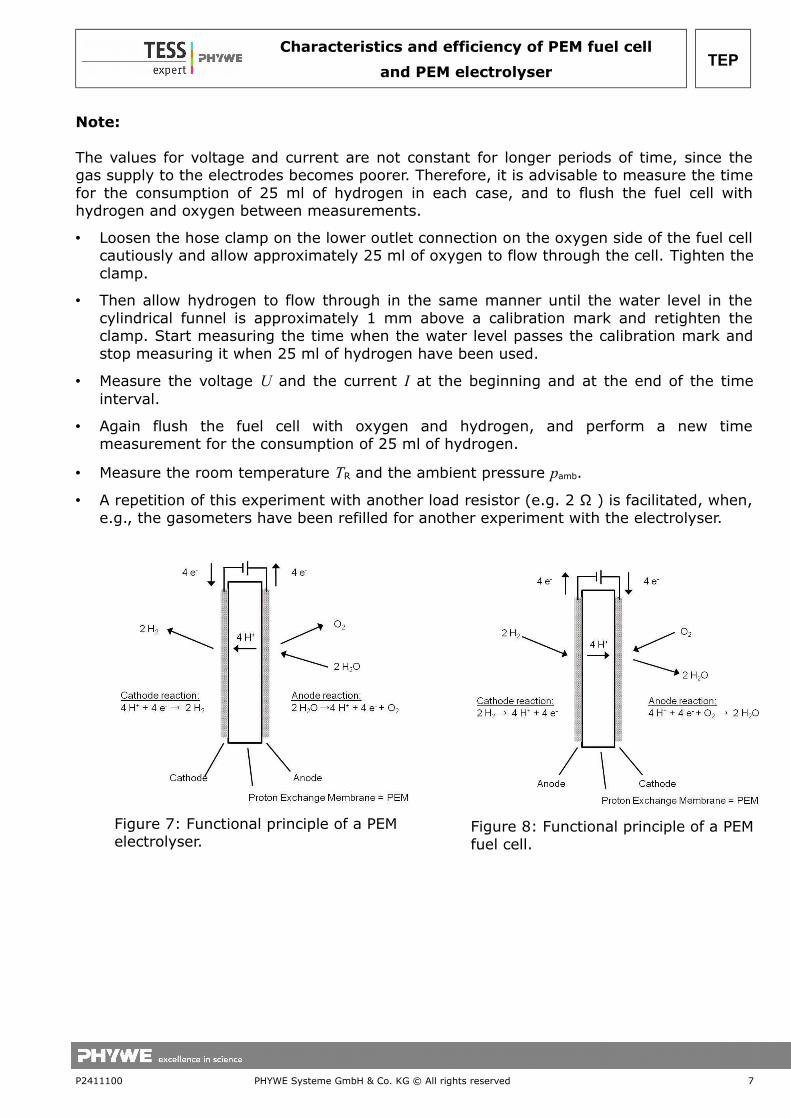
Figure 7: Functional principle of a PEM electrolyser.
Figure 8: Functional principle of a PEM fuel cell.
Theory and evaluation
The principal part of the PEM electrolysis unit and the PEM fuel cell is a membrane-electrode unit. A layer of catalyst material has been applied to both sides of the thinprotonconducting membrane (PEM = proton exchange membrane). These two layers formthe anode and cathode of the electrochemical cell.
In the electrolyser the following reaction occurs (Fig. 7):
Anode 2 H2O → 4 e– + 4 H+ + O2
Cathode 4 H+ + 4 e– → 2 H2
Total reaction 2 H2O → 2 H2 + O2
On the anode side gaseous oxygen, electrons and H+ ions are formed when an externalvoltage is applied. The H+ ions pass through the proton-conduction membrane to thecathode and form gaseous hydrogen there with the electrons flowing through the externalconducting circuit.The fuel cell functions by the inverse principle. In electrolysis electrical energy istransformed into chemical energy and stored in the form of hydrogen and oxygen; in thefuel cell chemical energy in the form of hydrogen and oxygen is directly converted, i.e.without a combustion process, into electrical energy. Hydrogen and oxygen react to formwater, giving up electricity and heat.
In the fuel cell the following reaction occurs (Fig. 8):
Anode 2 H2 →4 H+ + 4 e–
Cathode 4 e– + 4 H+ + O2 →2 H2O
Total reaction 2 H2 + O2 →2 H2O
Since the gaseous hydrogen which is supplied to the anode is oxidised, it decomposes dueto the catalytic action of the electrode (e.g. platinum) into protons and electrons. The H+
ions pass through the proton-conducting membrane to the cathode side. The electrons passthrough the closed outer electrical circuit to the cathode and do electrical work in thismanner. The gaseous oxygen which is supplied to the cathode is reduced. In the processwater is formed in addition to the protons and electrons. If a hydrogen and an oxygenelectrode are located in an electrolyser or a fuel cell, there is a potential difference ΔEbetween the two electrodes. It is temperature dependent; its theoretical value can becalculated from the free enthalpy of reaction ΔG and is equal to
Δ E = 1.23V at 25 °C .
In electrolysis, the applied voltage must be at least as large as this theoretical cell voltagein order for a current to be able to flow. In the fuel cell the maximum terminal voltage can
8 PHYWE Systeme GmbH & Co. KG © All rights reserved P2411100
TEPCharacteristics and efficiency of PEM fuel cell
and PEM electrolyser
TEP
be as large as this theoretical value. In both the electrolyser and the fuel cell, additionalpotentials occur at the electrodes.In the electrochemical equilibrium, phase boundary potentials between the electrode andthe membrane also occur at the electrodes. In the process, there is a continuous exchangeof charges between the two, but the gross reaction is equal to zero.
If, in addition, a current flows through the electrolyser or the fuel cell, the electrochemicalequilibrium at the electrodes is disturbed. The electrode potential takes on another value,which is dependent on the current density, due to various reactions at the electrode. Thisdeviation from the equilibrium value is termed “electric polarization”, i.e. the electrodebecomes polarised.
The characteristic lines of the electrolyser and the fuel cell thus exhibit a nearly linearcourse only at larger values of current; in this region the movement of the ions through themembrane
is decisive. The quantity of substance n liberated at an electrode can be calculated usingFaraday’s law.
n =I⋅tz⋅F
(1)
where I = current, t = time, z = number of electrons required to liberate a molecule, F =Faraday’s constant, F = 96485 As/molIn this experiment gases are evolved. The volume of a substance quantity n can bedetermined using the general gas equation.
V =n⋅R⋅Tp
(2)
where T = absolute temperature, p = pressure, R = general gas constant R = 8.31 J/(mol K)If a current I flows in an electrolyser, the following gas volume per unit time is generatedaccording to Equations (1) and (2):
Vt
=I⋅R⋅Tz⋅F⋅p
(3)
In the fuel cell, this gas volume per unit time is required in order that the current I canflow.To determine the efficiency of the electrolyser and the fuel cell, the electrical Wel and thechemical WH2 energies of the generated or required hydrogen are calculated.
W el =U⋅I⋅t (4)W H2 =n⋅H (5)
where U = voltage, I = current, t = time, n = quantity of hydrogen, H = molar caloriccontent (molar reaction enthalpy) of hydrogenOne differentiates between the lower caloric content Hlow and the upper caloric content Hup.
Molar caloric content of hydrogen:
H low = 242.0kJ/molH up = 266.1kJ/mol
The difference between the two is the molar enthalpy of vaporization (condensationenthalpy) q of water.
P2411100 PHYWE Systeme GmbH & Co. KG © All rights reserved 9
Characteristics and efficiency of PEM fuel cell
and PEM electrolyser
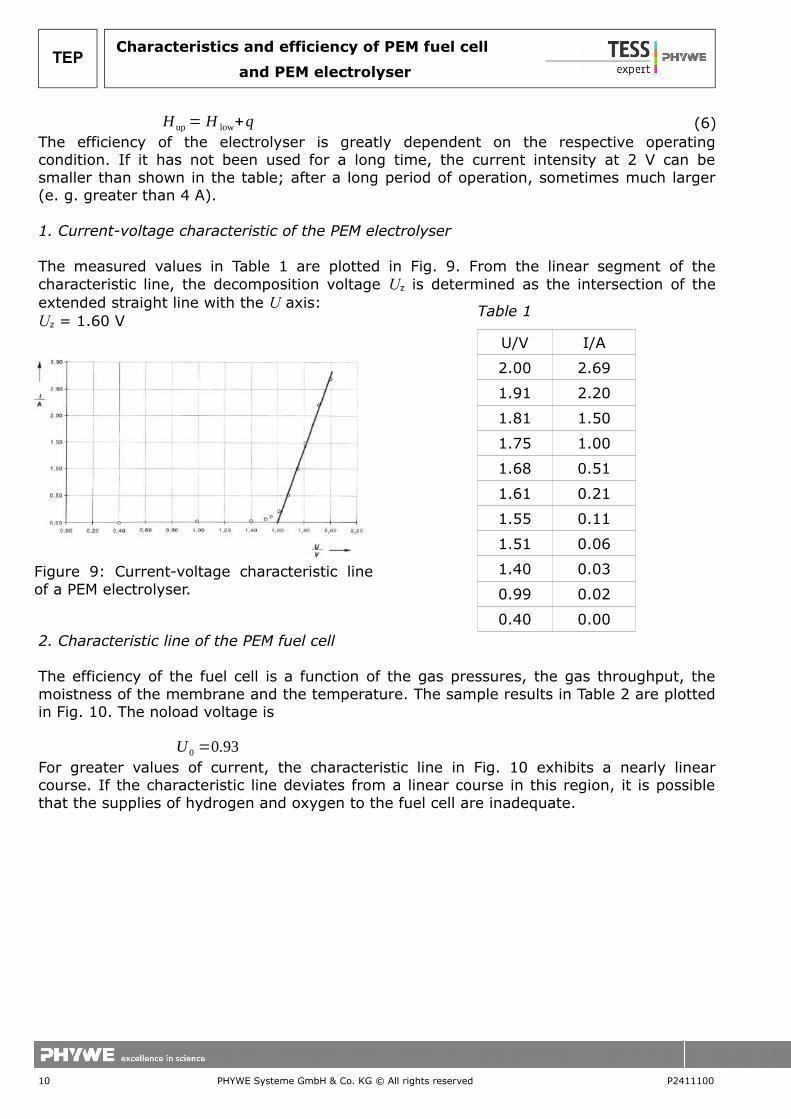
H up = H low+q (6)The efficiency of the electrolyser is greatly dependent on the respective operatingcondition. If it has not been used for a long time, the current intensity at 2 V can besmaller than shown in the table; after a long period of operation, sometimes much larger(e. g. greater than 4 A).
1. Current-voltage characteristic of the PEM electrolyser
The measured values in Table 1 are plotted in Fig. 9. From the linear segment of thecharacteristic line, the decomposition voltage Uz is determined as the intersection of theextended straight line with the U axis:Uz = 1.60 V
U/V I/A
2.00 2.69
1.91 2.20
1.81 1.50
1.75 1.00
1.68 0.51
1.61 0.21
1.55 0.11
1.51 0.06
1.40 0.03
0.99 0.02
0.40 0.002. Characteristic line of the PEM fuel cell
The efficiency of the fuel cell is a function of the gas pressures, the gas throughput, themoistness of the membrane and the temperature. The sample results in Table 2 are plottedin Fig. 10. The noload voltage is
U 0 =0.93For greater values of current, the characteristic line in Fig. 10 exhibits a nearly linearcourse. If the characteristic line deviates from a linear course in this region, it is possiblethat the supplies of hydrogen and oxygen to the fuel cell are inadequate.
10 PHYWE Systeme GmbH & Co. KG © All rights reserved P2411100
TEPCharacteristics and efficiency of PEM fuel cell
and PEM electrolyser
Figure 9: Current-voltage characteristic lineof a PEM electrolyser.
Table 1

TEP
Table 2R/Ω Combination U/V I/A
Infinite 0.93 0.00
28 = 10 + 10 + 5 + 2 + 1 0.83 0.02
25 = 10 + 10 + 5 0.82 0.03
20 = 10 + 10 0.81 0.04
15 = 10 + 5 0.80 0.05
10 0.79 0.97
7 = 5 + 2 0.78 0.11
5 0.76 0.14
4 = 2 + 2 0.75 0.18
3 = 2 + 1 0.74 0.24
2 0.72 0.35
1 0.68 0.71
0.83 = 1 // 5 0.67 0.71
0.67 = 1 // 1 0.63 1.10
0.40 = 1 // 1 // 2 0.62 1.30
0.37 = 1 // 1 // 2 // 5 0.61 1.41
P2411100 PHYWE Systeme GmbH & Co. KG © All rights reserved 11
Characteristics and efficiency of PEM fuel cell
and PEM electrolyser
Figure 10: Current-voltage characteristic line of a PEM fuel cell.
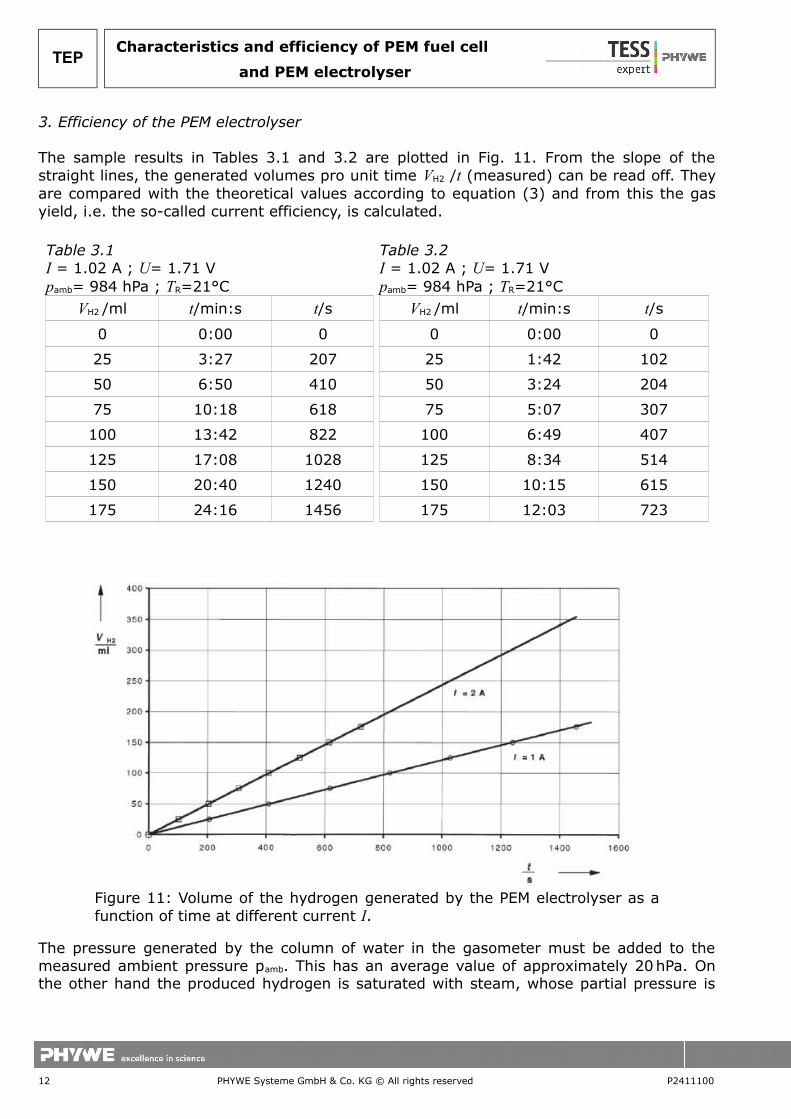
3. Efficiency of the PEM electrolyser
The sample results in Tables 3.1 and 3.2 are plotted in Fig. 11. From the slope of thestraight lines, the generated volumes pro unit time VH2 /t (measured) can be read off. Theyare compared with the theoretical values according to equation (3) and from this the gasyield, i.e. the so-called current efficiency, is calculated.
The pressure generated by the column of water in the gasometer must be added to themeasured ambient pressure pamb. This has an average value of approximately 20 hPa. Onthe other hand the produced hydrogen is saturated with steam, whose partial pressure is
12 PHYWE Systeme GmbH & Co. KG © All rights reserved P2411100
TEPCharacteristics and efficiency of PEM fuel cell
and PEM electrolyser
Table 3.1I = 1.02 A ; U= 1.71 Vpamb= 984 hPa ; TR=21°C
VH2 /ml t/min:s t/s
0 0:00 0
25 3:27 207
50 6:50 410
75 10:18 618
100 13:42 822
125 17:08 1028
150 20:40 1240
175 24:16 1456
Figure 11: Volume of the hydrogen generated by the PEM electrolyser as afunction of time at different current I.
Table 3.2I = 1.02 A ; U= 1.71 Vpamb= 984 hPa ; TR=21°C
VH2 /ml t/min:s t/s
0 0:00 0
25 1:42 102
50 3:24 204
75 5:07 307
100 6:49 407
125 8:34 514
150 10:15 615
175 12:03 723
TEP
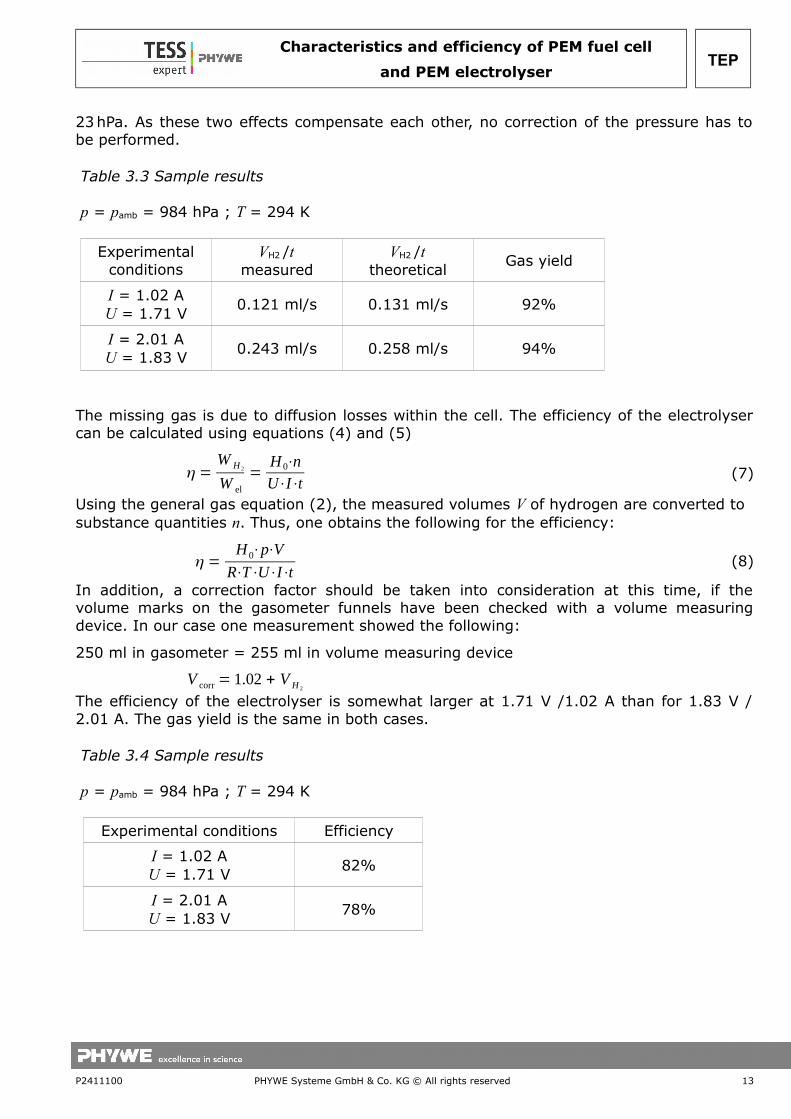
23 hPa. As these two effects compensate each other, no correction of the pressure has tobe performed.
The missing gas is due to diffusion losses within the cell. The efficiency of the electrolysercan be calculated using equations (4) and (5)
η =W H 2
W el
=H 0⋅nU⋅I⋅t
(7)
Using the general gas equation (2), the measured volumes V of hydrogen are converted to substance quantities n. Thus, one obtains the following for the efficiency:
η =H 0⋅p⋅V
R⋅T⋅U⋅I⋅t(8)
In addition, a correction factor should be taken into consideration at this time, if thevolume marks on the gasometer funnels have been checked with a volume measuringdevice. In our case one measurement showed the following:
250 ml in gasometer = 255 ml in volume measuring device
V corr = 1.02 + V H 2
The efficiency of the electrolyser is somewhat larger at 1.71 V /1.02 A than for 1.83 V /2.01 A. The gas yield is the same in both cases.
P2411100 PHYWE Systeme GmbH & Co. KG © All rights reserved 13
Characteristics and efficiency of PEM fuel cell
and PEM electrolyser
Table 3.3 Sample results
p = pamb = 984 hPa ; T = 294 K
Experimentalconditions
VH2 /tmeasured
VH2 /ttheoretical
Gas yield
I = 1.02 AU = 1.71 V
0.121 ml/s 0.131 ml/s 92%
I = 2.01 AU = 1.83 V
0.243 ml/s 0.258 ml/s 94%
Table 3.4 Sample results
p = pamb = 984 hPa ; T = 294 K
Experimental conditions Efficiency
I = 1.02 AU = 1.71 V
82%
I = 2.01 AU = 1.83 V
78%

4. Efficiency of the PEM fuel cell
The pressure generated by the column of water in the gasometer must be added to themeasured ambient pressure pamb. This has an average value of approximately 20 hPa.
On the other hand the produced hydrogen is saturated with steam, whose partial pressureis 23 hPa.
As these two effects compensate each other, no correction of the pressure has to beperformed.
p= pamb
The theoretically required gas volume, determined according to equation (3), is comparedwith the measured one, and from this the gas utilisation is calculated.
14 PHYWE Systeme GmbH & Co. KG © All rights reserved P2411100
TEPCharacteristics and efficiency of PEM fuel cell
and PEM electrolyser
Table 4.1 (load resistance 1 Ω) sample resultsp = pamb = 984 hPa ; R = 22°C
Mark VH2 /ml t/min:s U/V I/A
225200
25 0:004:42
0.680.66
0.670.65
175150
25 0:004:47
0.670.66
0.660.64
125100
25 0:004:57
0.670.65
0.650.64
7550
25 0:004:42
0.670.65
0.650.63
Mean values: t = 287 s, U = 0.66 V, I = 0.65 A
Table 4.1 (load resistance 1 Ω) sample resultsp = pamb = 984 hPa ; R = 22°C
Mark VH2 /ml t/min:s U/V I/A
225200
25 0:004:42
0.680.66
0.670.65
175150
25 0:004:47
0.670.66
0.660.64
125100
25 0:004:57
0.670.65
0.650.64
7550
25 0:004:42
0.670.65
0.650.63
Mean values: t = 287 s, U = 0.66 V, I = 0.65 A
Table 4.1 (load resistance 1 Ω) sample resultsp = pamb = 984 hPa ; TR = 22°C
Mark VH2 /ml t/min:s U/V I/A
225200
25 0:004:42
0.680.66
0.670.65
175150
25 0:004:47
0.670.66
0.660.64
125100
25 0:004:57
0.670.65
0.650.64
7550
25 0:004:42
0.670.65
0.650.63
Mean values: t = 287 s, U = 0.66 V, I = 0.65 A
Table 4.1 (load resistance 1 Ω) sample resultsp = pamb = 984 hPa ; TR = 23°C
Mark VH2 /ml t/min:s U/V I/A
225200
250:009:05
0.750.75
0.350.35
175150
25 0:009:07
0.750.73
0.350.34
125100
250:008:57
0.750.75
0.350.35
7550
25 0:008:51
0.750.74
0.350.35
Mean values: t = 540 s, U = 0.75 V, I = 0.35 A

TEP
The missing gas is due to diffusion losses within the cell. The efficiency of the fuel cell iscalculated using equations (4) and (5).
η =W el
W H 2
=U⋅I⋅tH⋅n
(9)
Due to the reaction occurring in the fuel cell, the upper caloric content Hup must be used tocalculate the efficiency. In industry, it is however normal to calculate with the lower caloriccontent Hlow because the heat of condensation only generates heat and no electrical energy.The two results are compared in Table 4.4.
The measured volumes V of hydrogen are converted to substance quantities n using thegeneral gas equation (2). In this way one obtains the following for the efficiency:
η =R⋅T⋅U⋅I⋅tH up⋅p⋅V
(10)
In addition, a correction factor should be taken into consideration at this time, if thevolume marks on the gasometer funnels have been checked with a volume measuringdevice. In our case one measurement showed the following: 250 ml in gasometer = 255 mlin volume measuring device
V corr = 1.02 + V H 2
The efficiency of the fuel cell is somewhat larger at 0.75 V / 0.35 A than at 0.66 V / 0.65 A.The gas yield is the same in both cases.
P2411100 PHYWE Systeme GmbH & Co. KG © All rights reserved 15
Characteristics and efficiency of PEM fuel cell
and PEM electrolyser
Table 4.3 Sample results
Experimentalconditions
VH2 /tmeasured
VH2 /ttheoretical
Gas utilisation
I = 1.02 AU = 1.71 V
pamb = 998 hPa ;T = 295 K
0.0871 ml/s 0.0832 ml/s 96%
I = 2.01 AU = 1.83 V
pamb = 998 hPa ;T = 296 K
0.0463 ml/s 0.0447 ml/s 97%
Table 4.3 Sample results
Experimental conditionsEfficiency
(using Hup)Efficiency
(using Hlow)
I = 1.02 A;U = 1.71 Vp = 998 hPa ; T = 295 K
42% 49%
I = 2.01 A;U = 1.83 Vp = 998 hPa ; T = 296 K
48% 57%