Embed Size (px)
Citation preview
ORIGINAL PAPER
Characteristics and composition of the falling dustin urban environment
M. AL-Harbi
Received: 22 June 2012 / Revised: 22 May 2013 / Accepted: 20 November 2013 / Published online: 18 December 2013
� Islamic Azad University (IAU) 2013
Abstract The monthly total amount of dust fall, as well
as its chemical and physical characteristics, was system-
atically investigated in Shuwaikh city, Kuwait. Dust sam-
ples were collected on a monthly basis for the entire year of
2009 and analyzed in the laboratory for water-soluble and
water-insoluble matter. Water-insoluble matter represented
the major portion of the total annual dust. ANOVAs
showed significant temporal variation in the concentration
of dust fall over the months (p \ 0.05). Higher dust
deposits were encountered between June and August and
ranged from 76.4 to 97.6 ± 2.5 (SD) ton km-2 month-1,
where dusty winds and low humidity are a common attri-
bute in such arid areas. The main three soluble matter
species measured are nitrate, sulfate, and chloride, and
sulfate was found to be the most abundant inorganic spe-
cies, ranging from 0.72 ± 0.13 to 4.1 ± 0.3 ton km-2 -
month-1. Major insoluble matter species measured are ash,
silica, combustible, and tarry. Ash, silica, and combustible
account for 63, 19, and 17.8 % of total insoluble dust, and
58.4, 17.7, and 16.6 % of total dust, respectively. Particle
size distribution was also investigated, and results showed
that dust particles[7 lm were the highest concentration of
falling dust. Metrological conditions were found to play a
vital role in temporal variations in falling dust.
Keywords Dust fall � Seasonal variation � Water-soluble
and water-insoluble matter
Introduction
Dust storms are one of the most noticeable environmental
phenomena in arid and semi-arid regions. Kuwait is located in
an arid and semi-arid region, and it is within one of the five
major regions where dust originates (Modaihsh 1997). Con-
sequently, dust has been a common natural phenomenon in this
area. Dust storms arise when a gust front or other strong wind
blows loose sand and dirt from a dry surface. Dust storms have
significant influence on global geochemical mass cycles,
atmospheric radiation transfer, marine ecosystem, and human
health (Gao et al. 1997; Yang 2005; Wang et al. 2005). In recent
years, the effects of particles on human health are of greatest
concern in urban areas. Epidemiological studies revealed
relationships between fine particle concentration and both
respiratory and cardiovascular diseases (Pope 2000; Samet
et al. 2000). Numerous studies have reported that the adverse
health effects caused by concentrations of ultrafine particles are
stronger than those created by the mass concentration of the
fine particles (Peters et al. 1997; Penttinen et al. 2001). Dust
storms can affect climate directly by scattering and absorbing
solar radiation (Charlson et al. 1992). Additionally, coagulation
and condensation of pollutants on dust particles during trans-
port can further complicate the problem by changing their
optical properties (Chou et al. 2003). It was strongly shown that
dust particles can react with pollution gases such as SO2 and
NOX or pollution aerosol by gas/particle interactions during
transport, which may alter the nitrogen and sulfur cycles, as
well as the acid/base balance (Parungo et al. 1996; Iwasaka
et al. 2003; Chung et al. 2003; Li and Shao 2009).
Several studies have investigated the compositions of falling
dust. Okada et al. (1990) reported that individual Asian dust
particles collected over Japanese islands sometimes had an
internal mixture of water-soluble and water-insoluble material,
and the water-soluble material mainly contained Ca and S.
M. AL-Harbi (&)
Department of Environmental Technology Management,
College of Life Sciences, Kuwait University, P.O. Box 5969,
13060 Safat, Kuwait, Kuwait
e-mail: [email protected]
123
Int. J. Environ. Sci. Technol. (2015) 12:641–652
DOI 10.1007/s13762-013-0440-8

Krueger et al. (2004) also found high yields of nitrate formation
on calcite and dolomite among individual dust particles from
different dust source regions. Traffic and coal burning,
accountable for the high levels of NOx and SO2, are also the
main producers of soil and coal ash mineral particles (Hien et al.
2001, 2004; Begum et al. 2004; Gwilliam et al. 2004). Previous
comparative studies of dust particles collected in China and
Japan during similar dust storm episodes show that sea salt and
sulfur accumulate on dust particles during the transportation
from China to Japan (Zhou et al. 1994; Fan et al. 1996). Zhang
et al. (2003) studied the mixture of Asian dust particles col-
lected in southwestern Japan in the spring of 2000 by SEM–
EDX. They found that mineral materials could enhance par-
ticulate sulfate and nitrate formation and restrain chlorine
depletion from the sea salt components in mixture particles. Li
et al. (2011) has recently investigated aerosol particles col-
lected at a high-elevation mountain site in the North China plain
(NCP) during April 2010. The study revealed that sulfate par-
ticles can coagulate with dust particles through the physical
movement (long-range transport). Additionally, the authors
reported the heterogeneous reactions between dust particles
and SO2/NO2 or their acids, which could result in internally
mixed particles. In urban cities, organic compounds are the
major constituents of dust after sulfate and nitrates. Tarry
matter represents the total organic matter in ambient carbona-
ceous aerosols, while combustible or unburnt hydrocarbons are
a measure of non-volatile compounds in the atmospheric
aerosols (Lighty et al. 2000; Johansson et al. 2003).
Particle size distribution measurements have been taken in
several European and US cities, e.g., Birmingham (Harrison
et al. 1999), Atlanta (Woo et al. 2001), Helsinki (Hussein et al.
2004), Leipzig (Wehner and Wiedensohler 2003), Pittsburgh
(Stanier et al. 2004). In terms of seasonal variations, particle
number concentrations were slightly lower in summer and
higher in winter (Wehner and Wiedensohler 2003; Hussein
et al. 2004). In the context of diurnal patterns, particle number
concentrations were found to be strongly influenced by the
traffic density in the urban area (Tuch et al. 2003; Wehner and
Wiedensohler 2003; Hussein et al. 2004; Stanier et al. 2004).
Substantial increases of particle number concentration, espe-
cially the Aitken mode particles, were observed during traffic
peak hours (e.g., Shi and Harrison 1999). Thus, traffic emis-
sions were considered to be one of the most important sources
of particles in the urban atmosphere. Tang and Wang (2006)
investigated vehicle gaseous emissions (NO, CO, CO2, and
HC) and driver’s particle exposures (PM1, PM2.5, and PM10)
under very heavy traffic in the urban hot spots in Macao. The
measurements were carried out in close proximity to the
vehicles, and the inlets of the particle analyzers were posi-
tioned at the height of the driver’s breathing point. Results
showed that motorcycles were higher contributor of particle
exposures compared with passenger cars for petrol vehicles,
while trucks and buses resulted in higher particle exposures
compared with taxis for diesel vehicles. The authors ascribed
that to both poor maintenance and the incompetent combustion
of fuel or lubricant in motorcycles. Similar trends were also
observed in California vehicles (Fruin et al. 2004), New York
vehicles (Canagaratna et al. 2004), and Denmark vehicles
(Ntziachristos et al. 2000). Tang and Wang (2007) studied the
impact of different urban forms, existing currently on the
Macao Peninsula, on vehicle transport and street environment
using various modeling systems. Results revealed that urban
forms 1 and 2, which are characterized with a high percentage
([48.7 %) of narrow roads (B10 m wide), high density of
intersections, and complex road network, restrict the traffic and
parking capacities and thus result in reduction in passenger car
and motorcycle volumes. This reduction in traffic volumes led
to lower noise pollution. With regard to CO emission, the
greater street canyon effects in urban forms 1 and 2 resulted in
higher CO concentrations. In recent study (Li et al. 2011), it
was suggested that dust particles may absorb the acidic gases
during the long-range transport and scavenge the fine particles,
which ultimately reduce the particle and particle number
concentrations and grown particle size.
The impact of meteorological parameters, such as wind
speed, wind direction, solar radiation, and precipitation, on the
dust constituents and size distributions has gain a least atten-
tion in the literature. In one study (Vakeva et al. 2000), it was
found that the wind direction weighs heavily in shaping par-
ticle number size distributions in the urban background area of
Helsinki, Finland. Other studies have reported that long-range
transport also plays a vital role in changing the particle number
concentrations (Tiitta et al. 2002; Niemi et al. 2004).
Several studies focused on measurement of falling dust
included identifying its physical, chemical, and size distri-
bution. Most, if not all, previous studies were conducted in
developed countries, with only few observations in Asian
countries, including India, Beijing, Korea, and Taiwan. To
the author’s knowledge, none of these detailed studies were
conducted in Middle East countries, which are located in
major regions where dust originates. Therefore, the current
paper is aimed to systematically study the chemical and
physical characteristics of falling dust in Kuwait. Moreover,
the relationship between the nature of falling dust and
metrological conditions is statistically investigated.
Materials and methods
Site location and sampling method
Dust particles were collected on a monthly basis for the entire
year of 2009 in Shuwaikh city, Kuwait. This area (coordinates
29�210900N 47�5503100E) is partly industrial and partly rural. It
contains several businesses, including car mechanics, car
dealerships, and furniture stores. The Kuwait University
642 Int. J. Environ. Sci. Technol. (2015) 12:641–652
123

Campus, as well as residential houses, is also located in this
area. Therefore, the observation site was quite interesting
regarding the measurements of falling dust. Dust fall was
collected using open plastic buckets filled with distilled water.
These buckets were placed about 3 m above the ground and
exposed to the atmosphere for 1 month. All analyses were
conducted in duplicate, and each value measured is a mean of
at least three replicate determinations. Data on dust fall and its
constituents are expressed in ton km-2 month-1.
Dust fall determination and chemical analysis
Collected dust samples at monthly intervals are analyzed in
the laboratory. Insoluble matter, soluble matter, and ash were
determined gravimetrically (Lodge 1988). Briefly, all col-
lected samples were filtered using Whatman glass microfiber
filters (GF/C) to determine the composition of insoluble
matter. Subsequently, the filter paper was dried in an oven at
108 �C for 2.5 h, and afterward kept in a desiccator prior
being weighed at least three replicates until the weight of
filter paper and insoluble materials became constant. Insol-
uble matter concentration was quantified using the method
by Norela et al. (2009), which is based on the weight dif-
ferences of filter papers, the area of the dust fall container
opening mouth, and number of days (in 1 month); as Eq. (1):
Concentration of insoluble matter g=m2=day� �
¼ ðWf �WiÞAT
ð1Þ
where Wi, weight of the filter without sample (g); Wf,
weight of the filter with dry insoluble solids after filtration
(g); A, area of dust fall container opening mouth (m2); T,
period of sampling days (days).
For the estimation of soluble matter concentration, the
collected samples were placed on the preweighed evapo-
rating dish and then dried in the oven at 108 �C for 2.5 h
and subsequently cooled in a desiccator before being
weighed. Soluble matter concentration was quantified
using the method followed by Latif and Rozali (1991),
which is based on the weights differences of the evapo-
rating dish (before and after the drying of the sample), the
ratio between volume of water collected and the water used
for analysis, the area of the dust fall container opening
mouth, and the number of days (in 1 month); as Eq. (2):
Concentration of soluble matter g=m2=day� �
¼ðWf �WiÞ V1
V2
� �h i
ATð2Þ
where Wi, weight of empty evaporating dish (g); Wf, weight of
the evaporating dish with soluble matter (g); A, area of dust fall
container opening mouth (m2); T, period of sampling days
(days); V1, volume of liquid transported to the laboratory (L);
V2, volume of liquid dispensed into the crucible (L).
Total dust deposition was calculated as the sum of insoluble
and soluble matter. Tarry matter is an organic matter that has
the characteristic of tar or pitch. Tarry content in the water-
insoluble matter was determined via acetone extraction. The
acetone residue weight represents the tarry matter content. Ash
defined as a powdery residue of matter that remains after
burning. To determine the ash content, the extracted insoluble
matter was then heated in an oven at 850 �C. The residue
matter was the ash content, while combustible matter was
obtained as the difference between insoluble matter and ash.
Silica contents were determined using FT-IR spectro-
photometer (model 510P). The spectrophotometers were
checked for malfunctioning by passing standard solutions
of all the parameters to be measured; blank samples were
passed between measurements to check for any eventual
contamination or abnormal response of equipment. Nitrate,
sulfate, and chloride contents were analyzed using ion
chromatography (DIONEX-600).
Dust particle size
Dust particle size distributions were measured using
Andersen hi-vol fractionating samplers (Model 65-000,
Andersen 2000, Inc., Atlanta, GA, USA). These consist of
a series of 30-cm-diameter (12 in.) aluminum plates with
holes offset from the plates and filters in succession. They
were designed for placement on the top of an ordinary hi-
vol sampler (GMW 2000H, General Metal Works, Cleves,
OH, USA) and were operated at the recommended flow
rate of 0.57 m3 min-1 (20 cfm).
Dust samples were collected in five separate aerodynamic
size ranges as follows: 0.01–1.1 lm (backup), 1.1–2.0 lm,
2.0–3.3 lm, 3.3–7.0 lm, and larger than 7.0 lm. The four
upper stages use perforated, circular, Gelman Type A glass
fiber filters, as supplied commercially (Andersen 2000, Inc.,
Atlanta, GA, USA). The backup filter was 20 9 25 cm
(8 9 10 in.). Gelman Spectro Grade filters were used
throughout the present study.
Results and discussion
Metrological conditions
Temporal variations in meteorological parameters such as wind
speed (m s-1), precipitation (mm), temperature (�C), and rel-
ative humidity (%) during the study period are shown in
Fig. 1a, b. The most frequent meteorological parameters
determining the horizontal transport and dispersion of air par-
ticles are the mean wind speed and the wind direction (Ziomas
et al. 1995). The average monthly wind speed was 4.4 m s-1,
with values ranging from 2.9 to 6 m s-1. Northwesterly winds
were the most predominant throughout the year, but more so in
Int. J. Environ. Sci. Technol. (2015) 12:641–652 643
123

0
20
40
60
80
100
0
2
4
6
8
10P
recipitation (mm
) Win
d Sp
eed
(m/s
)
Wind Speed Precipitation (a)
0
20
40
60
80
100
0
20
40
60
80
100
Relative H
umdity (%
)Tem
pera
ture
(°C
)
Temperature (°C) Relative Humidity(%) (b)
0
20
40
60
80
100
120
Tot
al D
ust
(Ton
Km
-1 m
onth
-1) (c)
0
1
2
3
4
5
6
0
40
80
120
160
200
0 1 2 3 4 5 6 7 8 9 10 11 12 13
Soluble Matter (T
on Km
-1 month
-1)
Non
-sol
uble
Mat
ter
(Ton
Km
-1 m
onth
-1)
Month
Non-soluble Matte Soluble Matte (d)
Fig. 1 Temporal variations in
monthly average dust fall and
metrological parameters
644 Int. J. Environ. Sci. Technol. (2015) 12:641–652
123

the months of June–August. After northwesterly winds, the
most common were southeasterly, which were experienced
more often from February to April. This area received
approximately 122 mm of rainfall (precipitation) in the year of
2009 (study time), and 53 % (65.2 mm) of the total rainfall was
during the month of November. The average monthly relative
humidity was 33.7 %, with values ranging from 11.5 to 66.5 %
during the investigated period. The maximum relative
humidity records were obtained between November and
December, while minimum records attained were in June and
July. The average temperatures ranged from 11 to 28 �C
between October and January, 17–33 �C between February and
May, and 35–39 �C between June and September.
Seasonal variations in dust fall
Figure 1c shows the average monthly variation in the dust fall
during the period of June through December 2009. The analysis
of variance (ANOVA) showed significant temporal variation in
theconcentrationofdust fallover themonths (p\0.05).Highest
levels of dust deposits were observed between June and August
and ranged from 76.4 to 97.6 ± 2.5 (SD) ton km-2 month-1,
where these months are characterized by dusty winds and low
humidity in such arid areas. Additionally, the dust levels rose
furtherbysurfaceerosionanddust resuspension due toprolonged
high winds (up to 6 m s-1) and thermal turbulence caused by
high temperatures. Minimum dust deposits wereobserved during
October and November and ranged from 14 ± 1.2 to
19. ± 1.4 ton km-2 month-1. These lowest valuesare attrib-
uted to heavy rainfall during these months, in which it washed out
the dust. Falling rain captures aerosol particles via inertial
impaction, diffusiophoresis, Brownian and turbulent shear dif-
fusion, thermophoresis, and electric charge effects (Chate and
Pranesha 2004). Intermediate values were observed in the
months of December, January, and February, with a range of
25.5 ± 1.3–30.5 ± 1.5 ton km-2 month-1, which could be
ascribed to climatic inversions, as well as constantly changing
wind speeds and directions (Lyons and Scott 1990).
Chemical constituents of dust fall
All monthly average measurements of dust-soluble and dust-
insoluble matters during the year of 2009 are shown in Fig. 1d. It
is evident from Fig. 1d that the water-insoluble matter
was comparatively higher (range 11.7 ± 1.9–94 ± 2.1 ton
km-2 month-1) than the water-soluble matter (range
2.16 ± 0.5–5.2 ± 0.55 ton km-2 month-1) over all tested
periods. The coefficient of variation (CV) of water-insoluble
matter was relatively high (CV = 0.6) compared with water-
soluble matter (CV = 0.25) over all tested periods, for the same
reasons mentioned in previous sections.
Temporal variation and distribution of chemical com-
ponents of dust fall, as well as soluble and insoluble matter
during the tested period, are shown in Figs. 2 and 3.
Descriptive statistics of chemical components of dust fall
during the tested period are also shown in Table 1. The
main three soluble matter species measured are nitrate,
sulfate, and chloride, while the major insoluble matter
species measured are ash, silica, combustible, and tarry.
In dust-soluble matter, sulfate was found to be the most
abundant inorganic species. The sulfate amount ranged from
0.72 ± 0.13 to 4.1 ± 0.3 ton km-2 month-1 (average
2.37 ± 0.2 ton km-2 month-1) and accounted for 5 and 68 %
of the total dust fall and its soluble matter, respectively, during
the year of 2009. Another major soluble species is chloride, one
of the sea salt’s aerosol components. The chloride concentra-
tions ranged from 0.165 ± 0.1 to 0.383 ± 0.11 ton km-2 -
month-1 (average 0.257 ton km-2 month-1) and were 0.52
and 7.5 % of the total dust fall and its soluble matter, respec-
tively, during the year of 2009. No significant fluctuations were
observed for chloride with respect to month (Tripathi et al.
1991). Nitratewas found to have low concentrations among
water-soluble components. The maximum amount detected
was 0.012 ± 0.001 ton km-2 month-1, with an average of
0.004 ton km-2 month-1. On average, three major anthro-
pogenic soluble matter species (sulfate, chloride, and nitrate)
accounted for 5.52 and 75.5 % of the total dust fall and its
soluble matter, respectively, during the year of 2009.
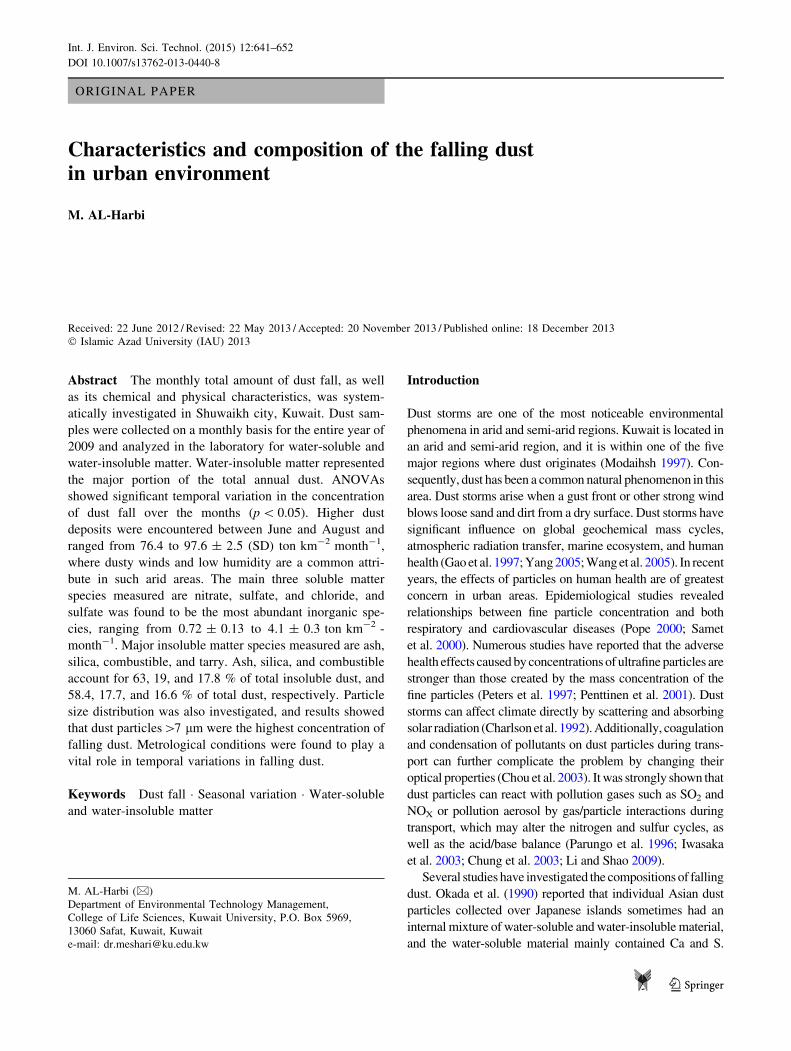
Among dust-insoluble species, the ash content of dust was
highest, ranging from 7.81 ± 0.7 to 57.82 ± 0.92 ton km-2 -
month-1, with an average of 28.327 ton km-2 month-1. The
maximum amount was observed in the summer, due to dusty
winds having a favorable direction. As for the tracers of soil/dust
(Maxwell-Meier et al. 2004), silica were frequently observed
in higher concentrations, ranging from 1.39 ± 0.2 to
25.136 ± 0.3 ton km-2 month-1, and with an average of
8.613 ton km-2 month-1. Significant variations (CV = 0.97)
were observed in the amount of silica permonth. The combustible
fraction of insoluble matter also showed higher values, with an
average of 8.03 ± 0.4 ton km-2 month-1 and with an interme-
diate variation per month (CV = 0.51). Tarry matter deposition
was the lowest (average = 0.011 ± 0.009 ton km-2 month-1)
amongthe insolublematter. Itwas in thegreatestamount inwinter
(0.022 ± 0.007) and relatively lower in the summer months
because of the high frequency of ground inversions in winter and
high wind velocity in summer. Overall, ash, silica, and combus-
tible account for 63, 19, and 17.8 % of total insoluble dust, and
58.4, 17.7, and 16.6 % of total dust, respectively.
Source of chemical constituents of dust fall
The source of chemical constituents in falling dust and the
impact of metrological conditions on the distribution of
chemical constituents were also investigated. Table 2 pre-
sents the Spearman correlation coefficient matrices
between the amount of chemical components of dust fall
Int. J. Environ. Sci. Technol. (2015) 12:641–652 645
123

and metrological conditions, including wind speed, tem-
perature, relative humidity, and precipitation.
Numerous previous studies have suggested that sulfate
and nitrate in dust formed in the atmosphere through
homogeneous and heterogeneous reactions (McArdle and
Hoffmann 1983; Martin 1984; Hoffmann 1986; Seinfeld
1986; Yang et al. 1991; Quan 1995; Fenter et al. 1995; Zhang
1996; Li and Shao 2009). Heterogeneous reactions involved
the transformation of pollution gases, SO2/NOX, to sulfate
and nitrate, which might take place on the suspended crustal
particles remaining in the atmosphere (McArdle and Hoff-
mann 1983; Martin 1984; Hoffmann 1986). However, het-
erogeneous conversion is sensitive to relative humidity, and
its efficiency decreases with the decrease in humidity. In line
with correlation analysis (Table 2), the correlations between
sulfate and nitrate concentration and relative humidity were
very small, R = -0.17 and 0.03, respectively. The findings
diminish the possible that nitrate and sulfate species were
formed via heterogeneous reactions between mineral dust
particles and acidic gases (e.g., NOX and SO2). Another
possible mechanism of sulfate and nitrate formation is that
dust particles absorbed sulfuric and nitric acid (gas or
droplets), which were formed through homogeneous reac-
tions of SO2, OH, O2, H2O; and NOx and OH or N2O5 and
H2O occurring in the atmosphere (Seinfeld 1986). Such
reactions are independent of the humidity of ambient air
(Fenter et al. 1995). This possibility, however, cannot
exclude the occurrence of other heterogeneous reactions
between mineral dust and aqueous acids once the mineral
dust particles absorb the acids. In the tested area, SO2 and
NOx (NO and NO2) emissions are usually high, as it is sur-
rounded by various industries. To further investigate the
relationship between the emissions of SO2 and NOX per
month, as well as dust sulfate and nitrate, SO2 is plotted
versus dust sulfate and NOX isplotted versus dust nitrate, as
shown in Fig. 4a, b. Spearman’s correlation analysis showed
a significant relationship (R = 0.66 and p \ 0.05) between
the emission of SO2 and dust sulfate, which could be the
precursor of sulfate formation. Conversely, the Spearman
correlation coefficient was low between the emissions of
NOX and dust nitrate. This discrepancy could show that
emissions of NOX are not merely the source of dust nitrate.
Fig. 2 Temporal variations in monthly average soluble matter in dust fall
646 Int. J. Environ. Sci. Technol. (2015) 12:641–652
123
Previous studies repeatedly reported that the formations of
particulate sulfate and nitrate on sea salt particles (Eriksson
1959; McInnes et al. 1994) and dust particles enhanced the
production of particulate sulfate and nitrate in the down-
stream atmosphere (Nishikawa et al. 1991; Dentener 1996;
Tang 2004). The sea is about 2–3 km from the tested area,
which is where the particles could have originated from, and
the wind could have induced the transportation. Temperature
and precipitation showed weak correlation in the formation
of either nitrate or sulfate, as shown in Table 2. The quan-
titative estimation revealed that the chloride amount (Fig. 2)
was appreciable compared to the amount of sulfate. Chloride
is thought to be primarily derived from sea salt aerosols,
especially in a marine environment (Zhuang and Chan 1997).
Chloride could deposit onto dust particles through the
absorption of chlorine-containing gases or sea salt aerosol
when the particles passed through the marine atmosphere.
Wind speed can induce such transportation. As shown in
Table 2, there wasa significant correlation (R = 0.85 and
p \ 0.05) between wind speed and dust chloride.
Silica was found in substantial amount in the falling dust,
where it accounted for 19 % of total insoluble dust and
17.7 % of total dust. Silica is more likely to be a product of
soil erosion or road dust aerosolized by traffic. Wind speed
exhibited a significant correlation with silica (R = 0.73 and
p \ 0.05). Higher wind speed also causes greater release of
dust particles due to erosion and resuspension. The tem-
perature had a consistent pattern, with relative humidity
(R = 0.89 and p \ 0.05), and the temperature was inversely
Fig. 3 Temporal variations in monthly average insoluble matter in dust fall
Table 1 Descriptive statistics of dust fall, ton km-2 month-1
Solubility Constituents Mean Min. Max. SD CV
Soluble
matter
Nitrate 0.004 0.001 0.012 0.003 0.83
Sulfate 2.374 0.724 4.111 0.91 0.38
Chloride 0.257 0.165 0.383 0.080 0.31
Insoluble
matter
Tarry 0.011 0.000 0.022 0.008 0.72
Combustible 8.03 2.020 12.751 4.071 0.51
Ash 28.327 7.812 57.822 16.27 0.51
Silica 8.613 1.391 25.136 8.35 0.97
Int. J. Environ. Sci. Technol. (2015) 12:641–652 647
123

proportional to relative humidity. Both temperature and
relative humidity showed a strong correlation with wind
speed, using Spearman’s correlation coefficient (R) at 0.65
and 0.78, respectively. Accordingly, both temperature and
relative humidity induced wind speed, which ultimately
enhanced the release of dust particles due to erosion and
resuspension; this is consistent with the Mirme and Ru-
uskanen (1996) study. The ash content was the highest
among the soluble and insoluble matters of the falling dust,
with an average of 28.327 ton km-2 month-1. The likely
source of ash is flying ash from the petroleum industry and a
power station, as it is increased in summer, which elimi-
nates the possibility from burning coal from adjacent
camping activities. It should be mentioned that the dust
collection area was far away from the petroleum industry,
but in the close vicinity of a power station. In either case,
wind speed was very high in summer, reaching 6.1 m s-1.
This would, in turn, easily induce the transportation and
resuspension of flying ash. A significant correlation was
found between wind speed and ash in dust fall (R = 0.79
and p \ 0.05). Additionally, both temperature and relative
humidity showed a strong correlation with wind speed, as
observed with silica. The combustible fraction showed
higher values, with an average of 8.03 ± 0.4 ton km-2 -
month-1, which accounted for 17.8 % of total insoluble
dust and 16.6 % of total dust, respectively. These highest
amounts of combustible fractions are the result of frequent
running of heavy vehicles and movement of heavy earth-
moving machines. Again, strong correlation was found
between wind speed and combustible fractions (R = 0.74
and p \ 0.05). The temperature and relative humidity had
little effect on the amount of combustible fractions.
Tarry matter showed the lowest amount detected among
insoluble matter. In contrast to most species, tarry was found in
maximumamountduring the winter. This finding may increase
the possibility that the source of tarry matter in dust could be
the products of burning activities from coal burning, petroleum
industry, and power station, as these activities are usually
increased in winter months. Another possible source of tarry
matter is vehicular exhaust (Li et al. 2009; Zheng et al. 1997).
The effect of wind speed and relative humidity was insignifi-
cant. It should be emphasized that precipitation exhibited
slightly low impact on all the constituents of falling dust.
Comparison of dust fall levels with other cities
The average concentrations of dust fall (ton km-2 month-1) for
urban city of Shuwaikh, a central location in Kuwait, was
compared with those found in urban areas in other cities (Fig. 5).
As shown in Fig. 5, the highest dust fall was found in an
opencast coalmine area in Bina of India, with an annual amount
of dust fall of 96.2 ton km-2 month-1 (Pandey et al. 2008),
while the lowest average dust fall was 0.83 ton km-2 month-1
and reported in Southern Nevada (USA), with values ranged
between 0.36 and 1.3 ton km-2 month-1 (Reheis and Kihl
Table 2 Correlation matrices for selected metrological parameters and dust fall constituents
Parameters Dust fall constituents (ton km-2 month-1)
Nitrate Sulfate Chloride Tarry Combustible Ash Silica
Wind speed (m s-1) 0.03 0.47 0.85 0.16 0.74 0.79 0.73
Temperature (�C) -0.07 -0.15 0.39 0.67 0.41 0.72 0.69
RH (%) 0.03 -0.17 20.58 -0.44 -0.53 20.78 20.71
Precipitation (mm) 0.08 -0.30 -0.39 -0.34 -0.35 -0.30 -0.42
Values denote Spearman’s coefficient of correlation (R). Significant correlation (p \ 0.05) is bolded
Fig. 4 Correlation analysis between a Sulfate and SO2, b nitrate and
NOX
648 Int. J. Environ. Sci. Technol. (2015) 12:641–652
123

1995). The dust fall in Gansu province (China) shows a large
annual range of 18.23–69.4 ton km-2 month-1 in the desert
and Gobi area and 9.7–34.84 ton km-2 month-1 in the loess
area (Ta et al. 2004). Shuwaikh city (Kuwait), based on this
study, followed Bina of India in dust fall with an average amount
of 53.7 ton km-2 month-1, which is indeed expected as it is
located in an arid region, and it is located within one of the five
major regions where dust originates. Areas in North and
Northwest India exhibited intermediate value (21 ton km-2 -
month-1) of dust fall (Yadav and Rajamani 2006), followed by
Nagev desert (Offer and Goossen 2001), Lanzhou (Liu et al.
2004), Texas (Crabtree 2005), Yazd (Naddafi et al. 2006),
Arizona (Crabtree 2005), California (Crabtree 2005), and
Southern Nevada (Reheis and Kihl 1995), as shown in Fig. 5.
The discrepancies of dust fall level among these cities showed
that their industrial types and traffic compositions in addition to
geographic locations are different from each other. In general,
dust fall profile described in Fig. 5 shows that Kuwait is one
among the highest urban cities.
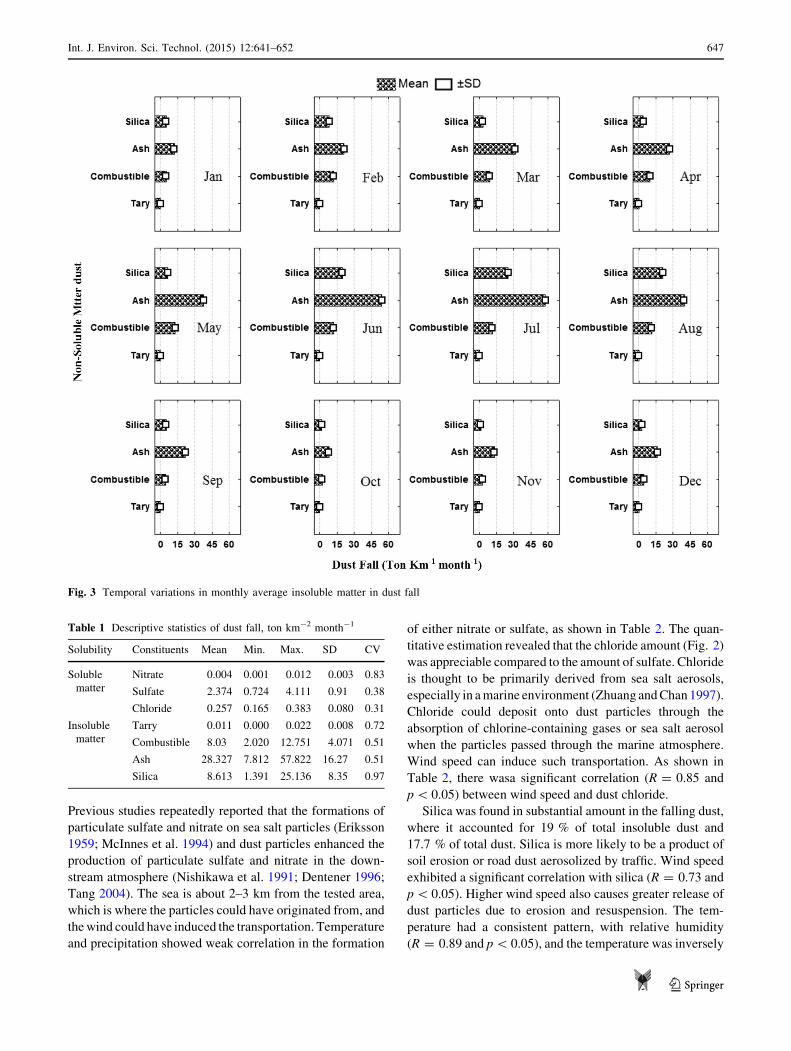
Particle size concentration of dust fall
Temporal variations in dust fall concentration as a function of
particle size are shown in Fig. 6, and descriptive statistics are
also shown in Table 3. As seen from Fig. 6 and Table 3, dust
particle size[7 lm showed the highest concentration of fall-
ing dust, which accounted for approximately 44 % of total dust
particle sizes. The average concentration of particle size
[7 lm, as shown in Table 3, was 263.43 ± 76.5 lg m-3.
The concentration of particle size[7 lm was found to be 2,
2.5, 4, and 7.5 times greater than particle sizes of 0.01–1.1,
3.3–7, 2–3.3, and 1.1–2.2 lm, respectively. The concentration
of particle size of 0.01–1.1 lm was the second highest, where
its average was 115.20 ± 53.8 lg m-3 and accounted for
21.6 % of total dust particle sizes. This observation is consis-
tent with Baik et al. (1996) in Seoul city, where peak
concentration was determined at 0.8 lm. The lowest concen-
trations (31.62 ± 12.63 lg m-3) detected were for particle
size of 1.1–2 lm, where it accounted for only 6 % of total dust
particle sizes.
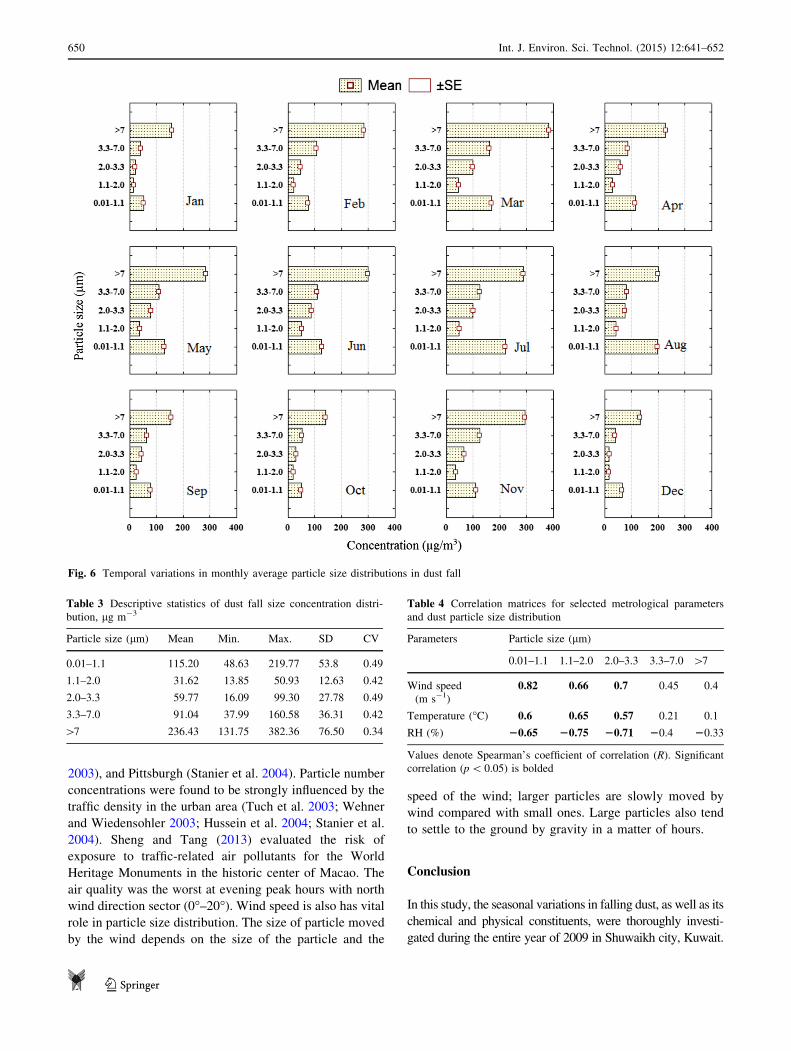
The impact of metrological conditions on dust fall particle
size concentration was also investigated. Spearman’s cor-
relation coefficient matrices between metrological condi-
tions and particle size concentration are shown in Table 4.
Results in Table 4 present a clear association between the
concentration of particle size\3 lm and metrological con-
ditions (wind speed, temperature, and humidity). The con-
centration of particle size [3 lm is less dependent on
metrological conditions, as Spearman’s correlation coeffi-
cients varies between low and intermediates values.
The likelihood of any particle entering the atmosphere
depends upon its size, density, and shape. Additionally, the
rate at which particles are deposited from the atmosphere
by turbulent deposition can be presented in terms of a
deposition velocity, which is a function of the aerodynamic
diameter (Nicholson 1988). Meteorological variables affect
the initial release of this material and its dispersal once
airborne, and the influence increases with decreasing par-
ticle sizes. The inert release of material from a surface will
be contingent upon the balance between two groups of
forces. Bonding forces, such as the electrostatic force if the
particle and surface are differently charged or surface
tension if the surface is wet, will tend to retain the particle
on the surface, as will happen for any physical attachment.
Bonding effects are most likely to be affected by the
temperature and moisture at the surface that the particle
rests on. These conditions will be determined by the tem-
perature and humidity of the surrounding air and by the
radiation balance of the surface. Particle size distributions
have been studied in numerous cities, e.g., Birmingham
(Harrison et al. 1999), Atlanta (Woo et al. 2001), Helsinki
(Hussein et al. 2004), Leipzig (Wehner and Wiedensohler
Fig. 5 Comparison of dust fall concentrations for ten cities including Shuwaikh (Kuwait)
Int. J. Environ. Sci. Technol. (2015) 12:641–652 649
123
2003), and Pittsburgh (Stanier et al. 2004). Particle number
concentrations were found to be strongly influenced by the
traffic density in the urban area (Tuch et al. 2003; Wehner
and Wiedensohler 2003; Hussein et al. 2004; Stanier et al.
2004). Sheng and Tang (2013) evaluated the risk of
exposure to traffic-related air pollutants for the World
Heritage Monuments in the historic center of Macao. The
air quality was the worst at evening peak hours with north
wind direction sector (0�–20�). Wind speed is also has vital
role in particle size distribution. The size of particle moved
by the wind depends on the size of the particle and the
speed of the wind; larger particles are slowly moved by
wind compared with small ones. Large particles also tend
to settle to the ground by gravity in a matter of hours.
Conclusion
In this study, the seasonal variations in falling dust, as well as its
chemical and physical constituents, were thoroughly investi-
gated during the entire year of 2009 in Shuwaikh city, Kuwait.
Fig. 6 Temporal variations in monthly average particle size distributions in dust fall
Table 3 Descriptive statistics of dust fall size concentration distri-
bution, lg m-3
Particle size (lm) Mean Min. Max. SD CV
0.01–1.1 115.20 48.63 219.77 53.8 0.49
1.1–2.0 31.62 13.85 50.93 12.63 0.42
2.0–3.3 59.77 16.09 99.30 27.78 0.49
3.3–7.0 91.04 37.99 160.58 36.31 0.42
[7 236.43 131.75 382.36 76.50 0.34
Table 4 Correlation matrices for selected metrological parameters
and dust particle size distribution
Parameters Particle size (lm)
0.01–1.1 1.1–2.0 2.0–3.3 3.3–7.0 [7
Wind speed
(m s-1)
0.82 0.66 0.7 0.45 0.4
Temperature (�C) 0.6 0.65 0.57 0.21 0.1
RH (%) 20.65 20.75 20.71 20.4 20.33
Values denote Spearman’s coefficient of correlation (R). Significant
correlation (p \ 0.05) is bolded
650 Int. J. Environ. Sci. Technol. (2015) 12:641–652
123

Representative monthly dust samples were collected and studied
in the laboratory. Dust fractions, in both water-soluble and water-
insoluble matter, were identified, and it was found that water-
insoluble matter constituents the major fraction of the total
annual dust. ANOVAs showed significant seasonal variation in
the concentration of dust fall over the months (p\0.05).
Maximum dust deposits were observed between June and
August and ranged from 76.4 to 97.6 ± 2.5 ton km-2 month-1,
where dusty winds and low humidity are a common attribute in
such arid areas. Major soluble matter species measured were
nitrate, sulfate, and chloride, and sulfate was found to be the most
abundant inorganic species,averaging 2.37 ± 0.2 ton km-2 -
month-1. Major insoluble matter species measured were ash,
silica, combustible, and tarry. Ash, silica, and combustible
accounted for63,19, and 17.8 %of total insolubledust, and58.4,
17.7, and 16.6 % of total dust, respectively. Dust particle size
[7 lm represented the highest concentration of falling dust.
Both chemical characteristics and size distributions of falling
dust were influenced by metrological conditions.
Acknowledgments The author would like to thank Kuwait Uni-
versity and KUEPA for dust characterization and continuous support
through the course of study.
References
Baik NJ, Kim YP, Moon KC (1996) Visibility study in Seoul, 1993.
Atmos Environ 30:2319–2328
Begum B, Kim E, Biswas SK, Hopke PK (2004) Investigation of
sources of atmospheric aerosol at urban and semi-urban areas in
Bangladesh. Atmos Environ 38:3025–3038
Canagaratna M, Jayne J, Ghertner D, Herndon S, Shi Q, Jimenez J,
Silva P, Williams P, Lanni T, Drewnick F, Demerjian K, Kolb C,
Worsnop D (2004) Chase studies of particulate emissions from
in-use New York city vehicles. Aerosol Sci Technol 38:555–573
Charlson RJ, Schwartz SE, Hales JM, Cess RD, Coakley JA, Hansen
JE, Hofmann DJ (1992) Climate forcing by anthropogenic
aerosols. Science 255:423–430
Chate DM, Pranesha TS (2004) Field studies of scavenging of
aerosols by rain events. J Aerosol Sci 35:695–706
Chou CCK, Chen TK, Huang SH, Liu SC (2003) Radiative absorption
capability of Asian dust with black carbon contamination.
Geophys Res Lett 30:1616
Chung Y, Kim H, Dulam J, Harris J (2003) On heavy dust fall
observed with explosive sandstorms in Chongwon–Chongju,
Korea in 2002. Atmos Environ 37:3425–3433
Crabtree GW (2005) Dust fall on the southern high plains of Texas:
Faculty of Texas Tech University in partial fulfillment of the
requirements for the Degree of Master of Science
Dentener F (1996) Role of mineral aerosol as a reactive surface in the
global troposphere. J Geophys Res 101(D17):22869–22890
Eriksson E (1959) The yearly circulation of chlorine and sulfur in
nature: meteorological, geochemical and pedological implica-
tions. Tellus 11:375–403
Fan X, Okada K, Niimura N, Kai K, Arao K, Shi G, Qin Y, Mitsuta Y
(1996) Mineral particles collected in China and Japan during the
same Asian dust-storm event. Atmos Environ 30:347–351
Fenter FF, Caloz F, Rossi MJ (1995) Experimental evidences for the
efficient ‘‘dry deposition’’ of nitric acid on calcite. Atmos
Environ 29:3365–3372
Fruin S, Winer A, Rodes C (2004) Black carbon concentrations in
California vehicles and estimation of in-vehicle diesel exhaust
particulate matter exposures. Atmos Environ 38(25):4123–4133
Gao Y, Arimoto R, Duce RA, Zhang XY, Zhang GY, An ZS, Chen
LQ, Zhou MY, Gu DY (1997) Temporal and spatial distribution
of dust and its deposition to the China Sea. Tellus B 49:172–189
Gwilliam K, Kojima M, Johnson T (2004) Reducing air pollution
from urban transport. The World Bank, Washington, DC
Harrison RM, Jones M, Collins G (1999) Measurements of the
physical properties of particles in the urban atmosphere. Atmos
Environ 33:309–321
Hien PD, Binh NT, Truong Y, Ngo NT, Sieu LN (2001) Comparative
receptor modeling study of TSP, PM2 and PM10 in Ho Chi Minh
City. Atmos Environ 35:2669–2678
Hien PD, Bac VT, Lam DT, Thinh NTHT (2004) PMF receptor modeling
of fine and coarse PM10 in air masses governing monsoon
conditions in Hanoi, northern Vietnam. Atmos Environ 38:189–201
Hoffmann MR (1986) On the kinetics and mechanism of oxidation of
aquated sulfur dioxide by ozone. Atmos Environ 20:1145–1154
Hussein T, Puustinen A, Aalto PP, Makela JM, Hameri K, Kulmala M
(2004) Urban aerosol number size distributions. Atmos Chem
Phys 4:391–411
Iwasaka Y, Shi G, Shen Z, Kim Y, Trochkine D, Matsuki A, Zhang D,
Shibata T, Nagatani M, Nakata H (2003) Nature of atmospheric
aerosols over the desert areas in the Asian continent: chemical
state and number concentration of particles measured at Dun-
huang, China. Water Air Soil Pollut Focus 3(2):129–145
Johansson LS, Tullin C, Leckner B, Sjovall P (2003) Particle
emissions from biomass combustion in small combustors.
Biomass Bioenergy 25(12):435–446
Krueger BJ, Grassian VH, Cowin JP, Laskin A (2004) Heterogeneous
chemistry of individual mineral dust particles from different dust
source regions: the importance of particle mineralogy. Atmos
Environ 38:6253–6261
Latif M, Rozali M (1991) Dust fall at air Keroh (Melaka) and Teluk
Kalung (Terengganu) industrial areas. Malays J Anal Sci 5:137–146
Li W, Shao L (2009) Observation of nitrate coatings on atmospheric
mineral dust particles. Atmos Chem Phys 9(6):1863–1871
Li X, Guo X, Liu X, Liu C, Zhang S, Wang Y (2009) Distribution and
sources of solvent extractable organic compounds in PM2.5
during 2007 Chinese Spring Festival in Beijing. J Environ Sci
21(2):142–149
Li W, Zhang D, Shao L, Zhou S, Wang W (2011) Individual particle
analysis of aerosols collected under haze and non-haze condi-
tions at a high-elevation mountain site in the North China plain.
Atmos Chem Phys 11(22):11733–11744
Lighty JS, Veranth JM, Sarofim AF (2000) Combustion aerosols:
factors governing their size and composition and implications to
human health. J Air Waste Manag Assoc 50:1565–1618
Liu LY, Brauning A, Zhand Z, Dong Z, Esper J (2004) Dust fall in
China’s western loess plateau as influenced by dust storm and
haze events. Atmos Environ 38:1699–1703
Lodge JP Jr (1988) Methods of air sampling and analysis, 3rd edn.
CRC Press, Boca Raton, FL, pp 440–443
Lyons TJ, Scott WD (1990) Principles of air pollution meteorology.
Belhaven Press, London
Martin LR (1984) Kinetic studies of sulfite oxidation in aqueous solution,
SO2, NO, NO2 oxidation mechanisms. In: Calvert JG (ed)
Atmospheric considerations. Butterworth Press, Boston, pp 63–100
Maxwell-Meier K, Weber R, Song C, Orsini D, Ma Y, Carmichael
GR, Streets DG (2004) Inorganic composition of fine particles in
mixed mineral dust-pollution plumes observed from airborne
measurements during ACE-Asia. J Geophys Res 109:D19S07
McArdle JV, Hoffmann MR (1983) Kinetics and mechanism of the
oxidation of aquated sulfur dioxide by hydrogen peroxide at low
pH. J Phys Chem 87:5425–5429
Int. J. Environ. Sci. Technol. (2015) 12:641–652 651
123

McInnes LM, Covert DS, Quinn PK, Germani MS (1994) Measure-
ments of chloride depletion and sulfur enrichment in individual
sea-salt particles collected from the remote marine boundary
layer. J Geophys Res 99:8257–8268
Mirme A, Ruuskanen J (1996) Comparison of aerosol measurements
in urban environment. Aerosol Sci Technol 27:S23–S24
Modaihsh AS (1997) Characteristics and composition of the falling dust
sediments on Riyadh city, Saudi Arabia. J Arid Environ 36:211–223
Nicholson KW (1988) The dry deposition of small particles: a review
of experimental measurements. Atmos Environ 22:2653–2666
Niemi JV, Tervahattu H, Vehkamaki H, Kulmala M, Koskentalo T,
Sillanpaa M, Rantamaki M (2004) Characterization and source
identification of a fine particle episode in Finland. Atmos
Environ 38:5003–5012
Nishikawa M, Kanamori S, Kanamori N, Mizoguchi T (1991) Kosa
aerosol as eolian carrier of anthropogenic material. Sci Total
Environ 107:13–27
Naddafi K, Nabizadeh R, Soltanianzadeh Z, Ehrampoosh MH (2006)
Evaluation of dustfall in the air of Yazd. Iran J Environ Health
Sci Eng 3(3):161–168
Norela S, Nurfatiha M, Maimon A, Ismail B (2009) Wet deposition in
the residential area of the Nilai Industrial Park in Negeri
Sembilan, Malaysia. World Appl Sci J 7:170–179
Ntziachristos L, Samaras Z, Eggleston S, Goriben N, Hassel D,
Hickman A, Joumard R, Rijkeboer R, White L, Zierock K (2000)
COPERT III computer programme to calculate emissions from
road transport: methodology and emission factors (version 2.1).
In: Technical report prepared by the European Environment
Agency, Copenhagen, Report 49. http://reports.eea.europa.eu/
Technical_report_No_49/en/tech49.pdf
Offer ZY, Goossen D (2001) Ten years of Aeolian dust dynamics in a
desert region (Negev desert, Israel): analysis of airborne dust
events. J Arid Environ 47(2):211–249
Okada K, Naruse H, Tanaka T, Nemoto O, Iwasaka Y, Wu P, Ono A,
Duce R, Uematsu M, Merrill J (1990) X-ray spectrometry of
individual Asian dust-storm particles over the Japanese islands
and the North Pacific Ocean. Atmos Environ 24:1369–1378
Pandey SK, Tripathi BD, Mishra VK (2008) Dust deposition in a sub-tropical
opencast coalmine area, India. J Environ Manag 86(1):132–138
Parungo F, Kim Y, Zhu C, Harris J, Schnell R, Li X, Yang D, Fang X,
Yan P, Yu X Zhou M, Chen Z, Qian F, Park K (1996) Asian dust
storms and their effects on radiation and climate. Part II. STC
Technical Report 2959, pp 34
Penttinen P, Timonen KL, Tiittanen P, Mirme A, Ruuskanen J,
Pekkanen J (2001) Number concentration and size of particles in
urban air: effects on spirometric lung function in adult asthmatic
subjects. Environ Health Perspect 109:319–323
Peters A, Wichmann HE, Tuch T, Heinrich J, Heyder J (1997)
Respiratory effects are associated with the number of ultrafine
particles. Am J Respir Crit Care Med 155:1376–1383
Pope CA (2000) Review: epidemiological basis for particulate air
pollution health standards. Aerosol Sci Technol 32:4–14
Quan H (1995) Dust transport and modification. Doctoral degree
dissertation of Saitama University, Saitama, pp 49–90
Reheis MC, Kihl R (1995) Dust deposition in Southern Nevada and
California, 1984–1989: relations to climate, source area and
source lithology. J Geophys Res 100:8893–8918
Samet JM, Dominici F, Curriero FC, Coursac I, Zeger SL (2000) Fine
particulate air pollution and mortality in 20 US Cities,
1987–1994. N Engl J Med 343:1742–1749
Seinfeld JH (1986) Atmospheric chemistry and physics of air
pollution. Wiley, New York, p 738
Sheng N, Tang U (2013) Risk assessment of traffic-related air pollution
in a world heritage city. Int J Environ Sci Technol 10:11–18
Shi JP, Harrison RM (1999) Investigation of ultrafine particle formation
during diesel exhaust dilution. Environ Sci Technol 33:3730–3736
Stanier CO, Khlystov AY, Pandis SN (2004) Ambient aerosol size
distributions and number concentrations measured during the
Pittsburgh Air Quality Study (PAQS). Atmos Environ 38:3275–3284
Ta W, Xiao H, Qu J, Xiao Z, Yang G, Wang T, Zhang X (2004)
Measurements of dust deposition in Gansu Province, China,
1986–2000. Geomorphology 57:41–51
Tang Y (2004) Three-dimensional simulations of inorganic aerosol
distributions in East Asia during spring 2001. J Geophys Res
109:D19S2
Tang UW, Wang ZS (2006) Determining gaseous emission factors
and driver’s particle exposures during traffic congestion by
vehicle-following measurement techniques. J Air Waste Manag
Assoc 56:1532–1539
Tang UW, Wang ZS (2007) Influences of urban forms on traffic-
induced noise and air pollution: Results from a modelling
system. Environ Model Softw 22:1750–1764
Tiitta P, Raunemaa T, Tissari J, Yli-Tuomi T, Leskinen A, Kukkonen
J, Harkonen J, Karppinen A (2002) Measurements and modeling
of PM2.5 concentrations near a major road in Kuopio, Finland.
Atmos Environ 36:4057–4068
Tripathi BD, Tripathi A, Mishra K (1991) Atmospheric dust fall
deposits in Varanasi city. Atmos Environ B 25(1):109–112
Tuch TM, Wehner B, Pitz M, Cyrys J, Heinrich J, Kreyling WG,
Wichmann HE, Wiedensohler A (2003) Long-term measure-
ments of size-segregated ambient aerosol in two German cities
located 100 km apart. Atmos Environ 37:4687–4700
Vakeva M, Hameri K, Puhakka T, Nilsson ED, Hohti H, Makela JM
(2000) Effects of meteorological processes on aerosol particle
size distribution in an urban background area. J Geophys Res
Atmos 105:9807–9821
Wang Y, Zhuang G, Sun Y, An Z (2005) Water-soluble part of the
aerosol in the dust storm season-evidence of the mixing between
mineral and pollution aerosols. Atmos Environ 39:7020–7029
Wehner B, Wiedensohler A (2003) Long term measurements of
submicrometer urban aerosols: statistical analysis for correla-
tions with meteorological conditions and trace gases. Atmos
Chem Phys 3:867–879
Woo KS, Chen DR, Pui DYH, McMurry PH (2001) Measurement of
Atlanta aerosol size distributions: observations of ultrafine
particle events. Aerosol Sci Technol 34:75–87
Yadav S, Rajamani V (2006) Air quality and trace metal chemistry of
different size fractions of aerosols in N-NW India-implications
for source diversity. Atmos Environ 40(4):698–712
Yang D, Ji X, Xu X, Fu J, Wen Y (1991) An analysis of a sandstorm
weather. Acta Meteorologica Sinica 49:334–342 (in Chinese)
Yang CY, Chen YS, Chiu HF, Goggins WB (2005) Effects of Asian
dust storm events on daily stroke admissions in Taipei, Taiwan.
Environ Res 99:79–84
Zhang D (1996) Features of nitrate-containing particles in urban
atmosphere over Beijing. Scientia Atmospherica Sinica
20:408–415
Zhang X, Gong S, Shen Z, Mei F, Xi X, Liu L, Zhou Z, Wang D,
Wang Y, Cheng Y (2003) Characterization of soil dust aerosol in
China and its transport and distribution during 2001 ACE-Asia:
1. Network observations. J Geophys Res 108:4261–4274
Zheng M, Wana TSM, Fang M, Wang F (1997) Characterization of the
nonvolatile organic compounds in the aerosols of Hong Kong-
identification, abundance and origin. Atmos Environ 31(2):227–237
Zhou M, Chen Z, Huang R, Wang Q, Arimoto R, Parungo F, Lenschow D,
Okada K, Wu P (1994) Effects of two dust storms on solar radiation
in the Beijing–Tianjin area. Geophys Res Lett 21:2697–2700
Zhuang H, Chan CK (1997) Size distribution of inorganic aerosols at
a coastal site. J Aerosol Sci 28:S213–S214
Ziomas IC, Melas D, Zerefos ChS, Bais AF (1995) Forecasting peak
pollutant levels from meteorological variables. Atmos Environ
29:3703–3711
652 Int. J. Environ. Sci. Technol. (2015) 12:641–652
123