Embed Size (px)
Citation preview

Research Methods TOM The aim of research in OM is often related to good practice, a close connect to practice makes relevance a major criterion for good OM research. The aim and scope of the research can be (1) con>irmation, (2) falsi>ication, or (3) exploration. !Chain of evidence make sure your research is repeatable for others. Thus are your steps logical and explained and do they measure what you want them to measure. !Theory an attempt to explain how a system or phenomenon works by identifying the constituent elements of the system and how they interact and relate to each other. Theories consist of a collection of logically interrelated propositions that aim to explain a set of phenomena. It are statements in which some relationship between two or more concepts or variables is proposed. !Concept is a mental image or perception, either of real things or of things that cannot be observed. It consists of one or multiple variables !Construct a special kind of concept in that they are abstract and deliberately invented for a special scienti>ic purpose, and they often change their meaning or are discarded as theories develop. It often includes a hypotheses which consists of simple propositions that state a prediction or an assumed relationship between two or more variables. !Quantitative use of mathematical and statistical tools to manage the analysis of numerical data. It is setting out a hypotheses in order to build upon an existing body of knowledge in the particular sphere of interest. Testing a causality between variables is achieved through controlled measurement, using laid down procedures and protocols. The quality in this kind of researches is proven by looking at a level of signi>icance. !Qualitative Concerned with constructvism, interpretation and perception, rather than with identi>ication of a rational, objective truth. The emphases is upon a socially constructed nature of reality. Qualitative research in essences does not need to mean that there will be no quantitative research. !Method refers to the technique of data collection and analysis rather than the interoperation of empirical >indings:
• Surveys: used to obtain both quantitative and qualitative data. Which can consists of an analytical survey (investigating a substantive area), or descriptive survey (identi>ication of characteristics of the sample under investigation).
• Case Research: is a detailed description of an organisation, incident or phenomenon. Case studies can also obtain both quantitative and qualitative methods; a hybrid form. Data generated from cases can be triangulated with data from other sources.
• Longitudinal research: researching behaviour of individuals or organisations through the use of observations and participation over an extended time period.
• Action research: involves the researcher as an active participant in the resolution of the management problem, alongside the observers members of the organisation.
• Modelling and simulation: are developed to examine the behaviour of systems under controlled or bounded conditions using abstract data.
• True experiments: highly controlled situations in which to test relationships between variables as a trait to the true experiment. Thus manipulate in some way the variable in order to observe the in>luences.
• Quasi-‐experiments: to counter some of the problems faced in constructing experiments, it is still possible to conduct a quasi experiment. !
A table is developed to help you determine which research method to select based on some practical implications. These characteristics helps choose the appropriate method that can best guarantee quality of the research.

See page 72 in Karlsson !In order to contribute to knowledge, the research project must demonstrate that it has characteristics of good theory which enlists three basic rules: (1) theory must be consistent, to ensure validity, (2) theories must be testable, by setting-‐up hypotheses and conducting investigations to test them, and (3) theories are never proven to be true, but they can be falsi>ied. See page 74-‐75 for a table overview. !Validity Internal validity refers to the extent to which the conclusions regarding dependency between factors of a relationship are certi>iable (cause and effect). Strategies: methods triangulation, data triangulation, or researcher-‐as-‐detective !External validity relates to the general applicability of the conclusions, in other words do they truly re>lect reality and consequently can they be demonstrated elsewhere? Population validity ability to generalise about particular phenomena from surveying or examining a sample and extrapolating the observed causal relationship to the whole population. Ecological validity the degree that a result generalises across different settings, this proven in one situations try to prove the mirrored situation as well. Temporal validity the degree that a research >inding generalises across time, provide supporting evidence over a period of time repeating it at an annual base. !Construct validity the extent to which an observation measures the concept that it is intended to measure. With the use of multiple sources of data, this can more easier !Descriptive validity the degree that the account reported by the researcher is accurate, use a number of investigators in the collection, interpretation and analysis of data. !Interpretive validity the degree that the researcher accurately portrays the meaning given by the participants to what is being studied. See if participants understands what is required from them, and repeat their answers to verify it with them. !Theoretical validity the degree that a theoretical explanation provided by the researcher >its the data. Extended ;ieldwork, theory triangulation, pattern matching, peer review.
Characteristics Axiomatic Research Survey Case Study
Presence of the researcher in data collection Possible Unusual / Dif>icult Usual
Small sample size Possible Unusual Usual
Variables dif>icult to quantify Possible Possible Possible
Perceptive measures Possible Possible Possible
Constructs not prede>ined Unusual Dif>icult Adequate
Causality is central Adequate Possible Adequate
Need to build theory -‐ to answer how question Possible Dif>icult Adequate
In-‐depth understanding of decision-‐making process Dif>icult Dif>icult Adequate
Non-‐active role of researcher Possible Possible Possible
Lack of control over variables Dif>icult Possible Possible

Survey (written by Cipriano Forza) A survey involves the collection of information from individuals (questionnaires, telephone calls) about themselves or about social units to which they belong. Often only a sample of the researched population is asked, the sample must comply to a certain level of accuracy. There are three types: ! Explorative survey Takes place during the early stages of research on a phenomenon, when the objective is to gina preliminary insights into a topic and provides the basis for in-‐depth analysis. It is used to uncover or provide preliminary evidence of association among concepts. It can also be used to gather a lot of data to get new insights ! ConGirmatory survey (theory testing) When knowledge of a phenomenon has been articulated in a theoretical form using well-‐ de>ined concepts, models and propositions. Data collection in this aim is about testing the concepts develop in relation to the phenomenon. This is different from explorative since the data and theory are familiarised. ! Descriptive survey aimed at understanding the relevance of a phenomenon and describing the incidence or distribution of the phenomenon in a population. It is not theory development, it can provide useful hints both for theory building and theory re>inement. Best practices or investigation on the performance objectives can be a scope. !When to use survey Survey is not the best choice to be combined with other methods. • Limited available knowledge, with not well de>ined concepts and measures: explorative or descriptive surveys for gaining new insights. Surveys however do not support discovery of subtle or complex new relations or aspects.
• Widely available knowledge: theory testing survey (con>irmatory) is preferred as it allows for testing if the hypothesised relationships or differences hop in different contexts. !
!When research needs depart from these conditions, survey research needs to be complemented by other methods if it needs detailed empirical validation. Page 92 provides great insights in previous research conducted for survey (Quality management, supply chain management, operations strategy), if it has not been performed yet does not automatically mean it cannot be a survey method. !Improvement to survey research can be performed with the following general issues: (1) frame the survey in terms of theoretical contribution, (2) use of scienti>ic measurement instruments, (3) clarity and explicitness in reporting information on the survey exception, and (4) rigour in survey design. !The set-‐up of a survey research depends on the kind of survey you want to perform. Depending on the method it requires some additional emphasis on particular phases or steps since this requires more attention. For instance the link to theoretical level is more present with a theory testing survey. !For survey it is of the essence to really specify what you want to investigate, because recovering missing information or data is not possible.
Advantages Disadvantages
Generalisation capabilities Falls short on precision
Relatively limited effort required to collect and analyse data Risks super>iciality
Complementary to case study

Requirements for the theoretical model • Construct names and nominal deGinitions: clear identi>ication, labels and de>initions. Try to eliminate overlap as much as possible, thus unique statements on its own.
• Propositions: the role of the constructs, linkage between them, and direction of relationships • Explanation: why the researcher would expect to observe these relationships and linkages • Boundary conditions: de>inition of conditions under which the researcher might expect these relationships to hold. !
Once the construct, their relationships and their boundary conditions have been articulated, then the propositions that specify the relationships among the constructs have to be translated into hypotheses. !Unit of Analysis Refers to the level of data aggregation during analysis; it can be individuals, groups, plants, divisions, companies, projects, systems. It is essential to speci>ically mention your unit of analysis since the data collection method, sample size are based on it. * De>initions need to be properly de>ined and aligned with operative de>initions, because otherwise that what you measure is not good applicable in the real-‐world !Face validity assessing whether the measure on its face seems a good translation of the theoretical concept. It is a matter of judgement and needs to be done before data collection. For instance ask a group of experts if they think that the questions aims for its goal !Hypotheses is a logically conjectured relationship between two or more variables (measures) expressed in the form of testable statements. Common words used to express an hypotheses: positive, negative, more than, less than, like. The null-‐hypotheses states a de>initive, exact relationship between two variables and has nog (signi>icant) relationship. !Survey design all the activities that precede data collection, which also entails the consideration of possible shortcomings and dif>iculties and should >ind the right compromise between rigour and feasibility. In survey there is a trade-‐off between time and cost constraints & the minimisation of 4 types of errors: • Sampling error: a sample with no (or unknown) capability of representing the population, which excludes the possibility of generalising the results.
• Measurement error: data derived from the use of measurement which do no match the theoretical dimensions
• Statistical conclusion error: performing statistical tests, there is a probability of accepting a conclusion that the investigated relationship does not exist even when it does exist.
• Internal validity error: explanation of what has been observed is less plausible than rival ones. It is important to match the capabilities and the limitations of the data processing methods (phone, mail etc) with the sample and instrumentation. !Population the entire group of people, >irms, groups, plants Element is a single member of the population Population frame a listing of all the elements in the population from which the sample is drawn. The industry often provides information about speci>ic populations that can be used to frame the population Sample is a subset of the population, it comprises some members selected Subject a single member of the sample Sampling the process of selecting a suf>icient number of elements from the population that eventually allows the researcher to generalise the properties. Randomness the ability of the sample to represent the population of interest Sample size the requirement of the statistical procedure used for assessment of measurement quality and hypotheses testing. Is linked to signi>icance level. Type I error reject the null-‐hypthesis when it is true Type II error H0 is not rejected when the alternative hypothesis is true

Probabilistic sampling Is used to ensure the representativeness of the sample when the researcher is interested in generalising the results. Assess different parameters in subgroups of population, localised areas, subset of the sample. !Non-‐probabilistic sampling Is usually chosen when time or other factors prevail on generalisability considerations and representativeness is not essential to your study. This mean that you can obtain quick and even possible (unreliable) information. !StratiGied random sampling involves the division of the population into strata and a random selection of subjects from each stratum. Strata are identi>ied on the basis of meaningful criteria (type, performance, size). This procedures ensures high homogeneity within each stratum and heterogeneity between strata. It allows for comparison of population subgroups and allows control for factors. !Survey can have a lot of different methods for data collection; phone, e-‐mail, face-‐to-‐face, questionnaire. Each has its merits and shortcomings, different methods can be used in the same survey to compensate for the weakness of each method. This could however lead to contradiction answers by participants. !
!Measurement instruments Wording de>ining how questions are to be formulated to collect the information Language, (open)-‐ended questions Scaling decide the scale for each question on which answers are to be placed Nominal, Ordinal, Interval, ratio, Respondent identiGication identify the appropriate respondents to each question when Unit of Analysis is company, how many to select out of a company Rules questionnaire design putting questions together that facilitate and motivate the respondents lay-‐out of the questionnaire !Pilot testing Test if what has been designed, tells and measures what you have developed as measurement properties, samples. By sending it to colleagues, industry experts and target respondents.
Advantage Disadvantage
E-‐mail Cost-‐savings Respondent convenience No time constraints Authorative impression Anonymity Reduce interview bias
Low response rate Longer time periods Affected by self-‐selection Lack of interviewer involvement Lack of open-‐ended questions
Face-‐to-‐face Flexibility in sequencing questions Details and explanation Possibility of administering highly complex questionnaires improved ability to contact hard to reach populations Higher response rate
higher costs interviewer bias respondent’s reluctance to co-‐operate greater stress for both respondents and interviewer less anonymity
Telephone Rapid data collection lower costs anonymity large-‐scale accessibility higher con>idence that instructions are followed
Less control over the interview situation less credibility lack of visual materials
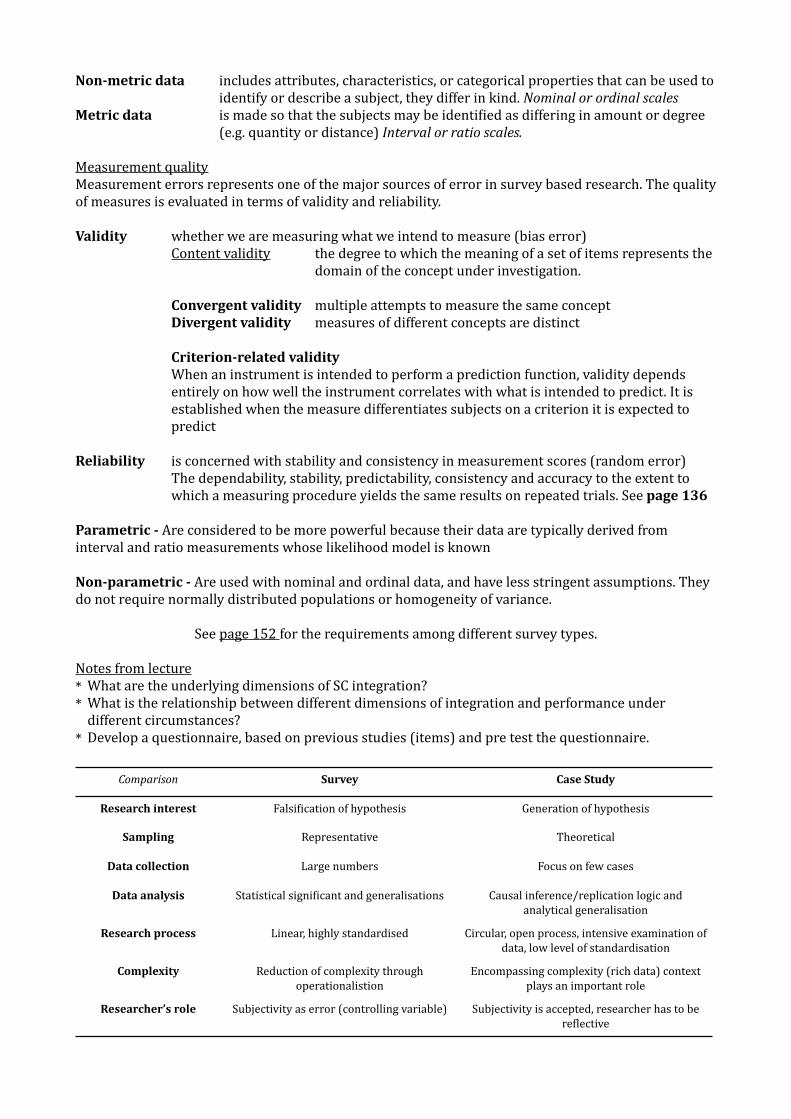
Non-‐metric data includes attributes, characteristics, or categorical properties that can be used to identify or describe a subject, they differ in kind. Nominal or ordinal scales Metric data is made so that the subjects may be identi>ied as differing in amount or degree (e.g. quantity or distance) Interval or ratio scales. !Measurement quality Measurement errors represents one of the major sources of error in survey based research. The quality of measures is evaluated in terms of validity and reliability. !Validity whether we are measuring what we intend to measure (bias error) Content validity the degree to which the meaning of a set of items represents the domain of the concept under investigation. Convergent validity multiple attempts to measure the same concept Divergent validity measures of different concepts are distinct Criterion-‐related validity When an instrument is intended to perform a prediction function, validity depends entirely on how well the instrument correlates with what is intended to predict. It is established when the measure differentiates subjects on a criterion it is expected to predict !Reliability is concerned with stability and consistency in measurement scores (random error) The dependability, stability, predictability, consistency and accuracy to the extent to which a measuring procedure yields the same results on repeated trials. See page 136 !Parametric -‐ Are considered to be more powerful because their data are typically derived from interval and ratio measurements whose likelihood model is known !Non-‐parametric -‐ Are used with nominal and ordinal data, and have less stringent assumptions. They do not require normally distributed populations or homogeneity of variance. !
See page 152 for the requirements among different survey types. !Notes from lecture * What are the underlying dimensions of SC integration? * What is the relationship between different dimensions of integration and performance under different circumstances?
* Develop a questionnaire, based on previous studies (items) and pre test the questionnaire. !Comparison Survey Case Study
Research interest Falsi>ication of hypothesis Generation of hypothesis
Sampling Representative Theoretical
Data collection Large numbers Focus on few cases
Data analysis Statistical signi>icant and generalisations Causal inference/replication logic and analytical generalisation
Research process Linear, highly standardised Circular, open process, intensive examination of data, low level of standardisation
Complexity Reduction of complexity through operationalistion
Encompassing complexity (rich data) context plays an important role
Researcher’s role Subjectivity as error (controlling variable) Subjectivity is accepted, researcher has to be re>lective

Case Study Implementing problems in real-‐life with a small number of cases to re>lect on what needs to be improved. Case study is a history of a past or current phenomenon, drawn from multiple sources of evidence (observations, interviewing, archives), in the end the context is the most important. !
!A case study is a unit of analysis, it is possible to use different cases from the same >irm. Case study ca be used for different types of research purposes (see page 166): • Exploration: needed to develop research ideas and questions • Theory building: a particular areas where cases are strong in theory building. A large and rich amount of cases provide a good source of primary data.
• Theory testing: used in conjunction with survey based research in order to achieve triangulation • Theory extension: as a follow-‐up to survey based research to examen more deeply and validate previous results !
!Aims particularly at how and why questions, that often leads to theory testing or theory development. A conceptual framework is the basics of a case study research since this de>ines all the constructs. !Number of cases -‐ the fewer the case studies, the greater the opportunity for depth observation is. Single cases are possible and often used to in vestige several contexts within the cases. 1 case: limits the generalisability and misjudgement of the case, exaggerating data Multiple cases: reduce the in-‐depth analysis, bot lifts the external validity & observer bias. Retrospective case: more controlled case selection and identify cases re>lecting on simple effect Longitudinal case: identify relation with cause and effect by investigation of a longer period of time
Advantages Disadvantages
New and creative insights & development of new theory Time consuming
Phenomenon can be studied in natural setting Requires skilled interviewers
Lends itself easy for explortaive research Generalisation from a limited set of cases
Allows the questions of why, what, how to be answered
high validity
Purpose Research question Research structure
Exploration Uncover areas for research and
theory development
Is there something interesting enough to justify research?
In-‐depth case studies Unfocused, longitudinal >ield study
Theory building Identify/describe key variables. Identify links between variables. Identify why these relationships
exists
What are the key variables? What are the patterns or linkages
between variables? Why should these relationships
exists?
Few focused case studies In-‐depth >ield studies Multi-‐site case studies Best-‐in-‐class case studies
Theory testing Test the theories developed in the
previous stages Predict future outcomes
Are the theories we have generated able to survive the test of empirical
data? Did we get the behaviour that was predicted or did we observe
another unanticipated behaviour?
Experiment Quasi-‐experiment Multple case studies
Large scale sample of population
Theory extension/reGinement To better structure the theories in light of the observed results
How generalisable is the theory? Where does the theory apply?
Experiment Quasi-‐experiment Case studies
Large-‐scale sample of population

Case selection: establish boundaries of variables so that cases can directly be linked to the research questions. Cases are selected on predicts of similar results (literal replication) or produces contrary results but for predictable reasons (theoretical replication). (see page 172) Add selection table to exam !
!The instruments for case research can be (semi)structured interviews, observations, information conversations, attendance, surveys, archival sources. The reliability and validity of a case research is ensured through a research protocol. It pertains the procedures and general rules that were applied, how the cases were selected, what were the different information sources come from, the number of interviews, site tours, what questions are asked. Increase reliability by using multiple sources of data. !The use of multiple investigators can have advantages over just a single one. It can enhance creative potential of teams and convergence in interesting >indings. Using multiple methods in your case study is helping the validation of your research thus performing in addition a questionnaire can contribute to the data collection. Recording can contribute to the reduction of observer bias. !When to stop -‐ is when you have enough cases and the data is satisfactory, thus when the redundancy and saturation kicks in, meaning that it does not provide any new case insight to your research. !
Case narrative documentation of everything, typing notes up and transcriptions. !Preference is to perform a within case analysis above a cross case analysis. Within case analysis analyses the patterns that can be discovered in a case. Researchers should than be looking for explanations and causality. Between cases speaks for itself.
Choice Advantages Disadvantages
Single cases Greater depth Limits on generalisabilty of drawn conclusions. Biases as misjudgement /
exaggerating data
Multiple cases Augmented external validity, help guard against observer bias
More resources needed, less depth per case
Retrospective cases Allow collection of data on historical events
May be dif>icult to determine cause and effect, participants may not recall
important events
Longitudinal cases Overcome the problems of retrospective cases
Have long elapsed time and thus may be dif>icult to do
Tactic Phase Examples
Construct validity the extent to which we establish the correct operational measures for the concepts being studied
use multiple sources of evidence Establish chain of evidence
Have key informants review draft case study report Seek triangulation
Evidence of discriminant validity
Data collection Data collection Composition
Review draft transcriptions Peer debrie>ing Interviews with
experts
Internal validity The extent to which we can establish a causal relationship whereby certain conditions are shown to lead to other conditions
Do pattern matching explanation building time-‐series analysis
Address rival explanation Use logic models
Data analysis
Theoretical and literal replication
Within case analysis Between case analysis Time-‐series analysis Two researchers
External validity Knowing whether a study’s ;inding can be generalised beyond the immediate case
Use replication logic in multiple-‐case studies Research design Gerenalisation of
>indings
Reliability To which a study’s operations can be repeated, with the same results.
Use case study protocol Develop case study database Data collection
Interview protocol Case narrative
Review and revision

Case study from lecture: * unit of analysis = buyer-‐supplier link * Questions: Is integration really needed in supply chains? * What types of integration are employed? * What barriers might prevent integration to happen?
* Population (NEVAT), sample (Reputed suppliers in the north of the Netherlands and not to small) !Protocol consists of description of the different entities in the research that are investigated with their de>inition in how they are used. Specify e.g. production resources (layout, batch size, capacity). !Perform a data reduction in your within case analysis: bring the number of variables down to a overview number and give them a score to what they score. !Case study sources: databases, persons, teams, meetings Case study methods: (group)interviews, observations, questionnaire, >ield notes, content analysis !First perform within case analysis, than continue to cross-‐case analysis that will allow you for pattern matching and >ind the underlying mechanism. !!

Analytical Quantitative Research Quantitative models are based on a set of variables that vary over a speci>ic domain, while quantitate and causal relationships have been de>ined between these variables. They cope with idealised problems: management problems such as inventory control problem or sequencing that is an abstraction from reality in the sense that not the entire reality is included. The trade-‐offs become very explicit with only one or two dimensions. Actually stating that other variables do not in>luence the variable you want to measure, just to keep it simple. !The idealised models have provided valuable insights in basic trade-‐offs, at a managerial level but cannot be characterised as explanatory or predictive models of operational processes. A model is developed, solved and the answers are often implemented in real life. It intends to include all aspects of operational processes that are relevant for explaining the behaviour and actual performance of the process. However due to the simplicity of the model(s), operations research often lacks construct validity. Only industrial (system) dynamics, queuing theory, and the learning curve research are widely validated throughout the years. !Current models have a strong focus on model-‐based analysis and managerial insight of simpli>ied models and solution methodologies for complex but formalised models. !Quantitative modelling Aimed to obtain generic results towards theory building in operations management rather than results of solutions to speci>ic problems without this generic contribution. It is based on the assumption that we can build objective models that explain the behaviour of real-‐life operational processes or that can capture the decision making problems that are faced by managers in real-‐life. • the relationship between the variables are described as causal, it is explicitly recognised that a change in one variable will lead to a change of another variable
• can be used to predict the future state • all claims are unambiguous and veri>iable !
Axiomatic research Is driven by the idealised model itself, primary aim is to obtain solutions within the de>ined model and make sure that these solutions provide insights into the structure of the problem as de>ined in the model. a prescriptive, descriptive research aimed at understanding the process that has been modelled. Queuing theory, mathematical optimisation • produces knowledge about the behaviour of certain variables in the model based on assumptions about the behaviour of other variables in the model.
• produce knowledge about how to manipulate certain variables in the model !Prescriptive research aims at developing policies and actions to improve over the results available in existing literature to >ind an optimal solution. Thus, developing tools and rules for managerial decision making. Descriptive research is interested in analysing a model, which leads to understanding and explanation of the characteristics of the model and creating managerial insights into behaviour of operational processes. Studying a process can be considered a descriptive, whereas studying a problem can be considered as prescriptive. !Types of researches: Axiomatic Descriptive: Analytical & Numerical Generally what is studies is a variant of a process or a problem that has been studied before. Validity here means that the model captures some of the characteristics of each of the real life occurrences. Proof and results are generated from mathematical analysis. It makes the management more aware of the nature of processes that they manage. !Axiomatic Prescriptive: Decision Rules The goal is to provide the manager with decision rules that when applied achieve optimal or near optimal performance with respect to some criterion function and within the assumptions of the model. !
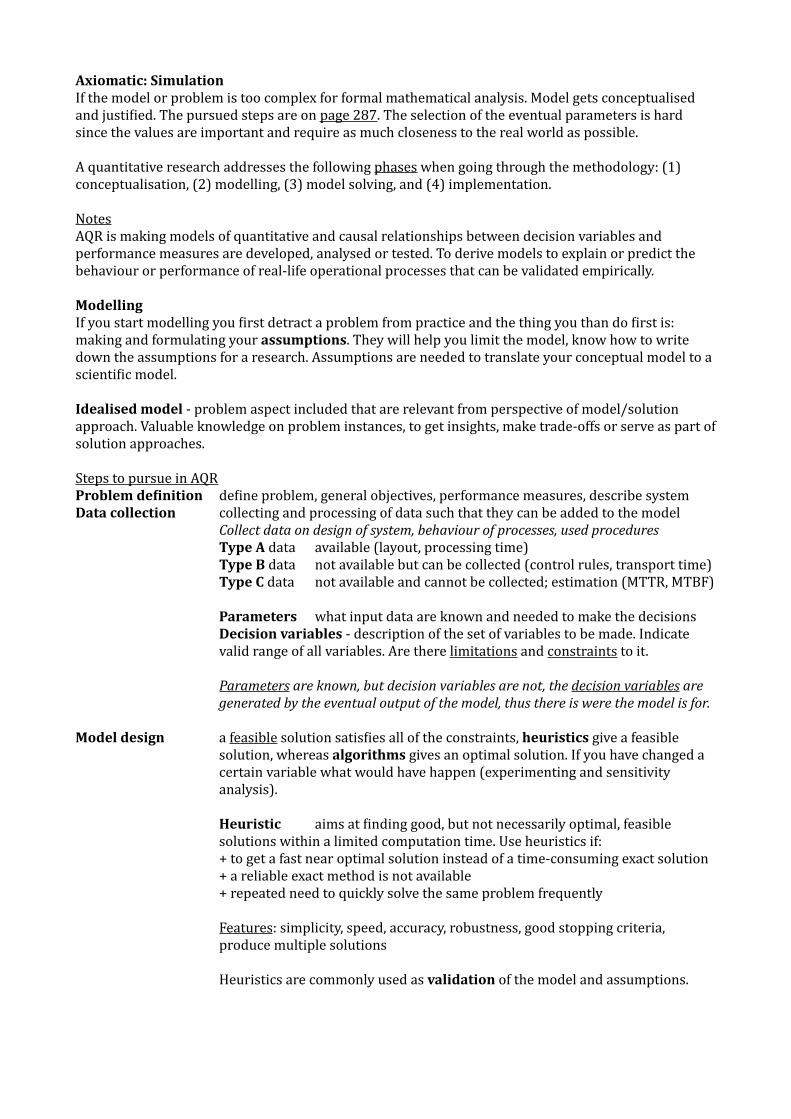
Axiomatic: Simulation If the model or problem is too complex for formal mathematical analysis. Model gets conceptualised and justi>ied. The pursued steps are on page 287. The selection of the eventual parameters is hard since the values are important and require as much closeness to the real world as possible. !A quantitative research addresses the following phases when going through the methodology: (1) conceptualisation, (2) modelling, (3) model solving, and (4) implementation. !Notes AQR is making models of quantitative and causal relationships between decision variables and performance measures are developed, analysed or tested. To derive models to explain or predict the behaviour or performance of real-‐life operational processes that can be validated empirically. !Modelling If you start modelling you >irst detract a problem from practice and the thing you than do >irst is: making and formulating your assumptions. They will help you limit the model, know how to write down the assumptions for a research. Assumptions are needed to translate your conceptual model to a scienti>ic model. !Idealised model -‐ problem aspect included that are relevant from perspective of model/solution approach. Valuable knowledge on problem instances, to get insights, make trade-‐offs or serve as part of solution approaches. !Steps to pursue in AQR Problem deGinition de>ine problem, general objectives, performance measures, describe system Data collection collecting and processing of data such that they can be added to the model Collect data on design of system, behaviour of processes, used procedures Type A data available (layout, processing time) Type B data not available but can be collected (control rules, transport time) Type C data not available and cannot be collected; estimation (MTTR, MTBF) ! Parameters what input data are known and needed to make the decisions Decision variables -‐ description of the set of variables to be made. Indicate valid range of all variables. Are there limitations and constraints to it. ! Parameters are known, but decision variables are not, the decision variables are generated by the eventual output of the model, thus there is were the model is for. !Model design a feasible solution satis>ies all of the constraints, heuristics give a feasible solution, whereas algorithms gives an optimal solution. If you have changed a certain variable what would have happen (experimenting and sensitivity analysis). ! Heuristic aims at >inding good, but not necessarily optimal, feasible solutions within a limited computation time. Use heuristics if: + to get a fast near optimal solution instead of a time-‐consuming exact solution + a reliable exact method is not available + repeated need to quickly solve the same problem frequently Features: simplicity, speed, accuracy, robustness, good stopping criteria, produce multiple solutions ! Heuristics are commonly used as validation of the model and assumptions. !!!

Tutorials AQR is mainly axiomatic prescriptive research aimed at developing policies and provide insights into the structure of the problem as de>ined within the model. In most cases AQ methods will be an aid to the decision-‐making process and will be combined with other information. !5 model steps 1. understand the real problem 2. formulate a model of the problem 3. input data collection and analysis 4. solving or running the model 5. implement & interpret the solution to the real world !EOQ Assumptions 1. costs are limited to: ordering costs and holding costs 2. demand is known and constant 3. lead time is known and constant 4. ordering cost is constant 5. receipt of ordered products is in one batch 6. purchase cost per unit is constant 7. products are of perfect quality
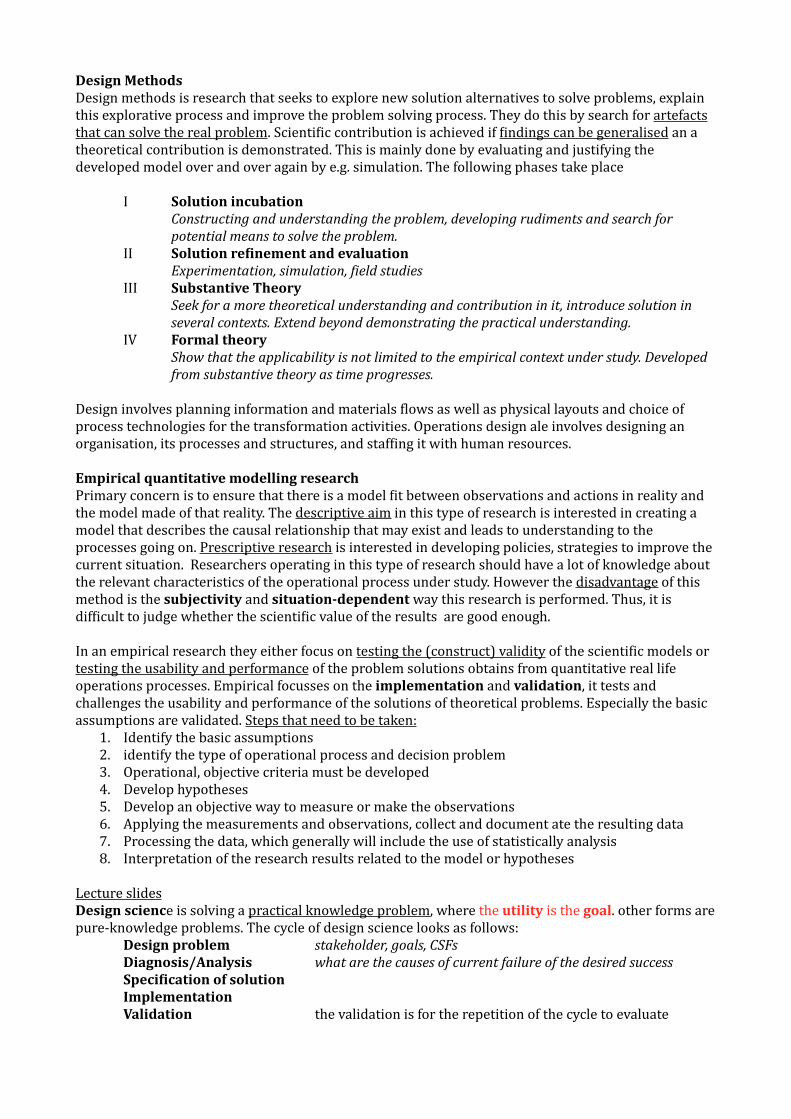
Design Methods Design methods is research that seeks to explore new solution alternatives to solve problems, explain this explorative process and improve the problem solving process. They do this by search for artefacts that can solve the real problem. Scienti>ic contribution is achieved if >indings can be generalised an a theoretical contribution is demonstrated. This is mainly done by evaluating and justifying the developed model over and over again by e.g. simulation. The following phases take place ! I Solution incubation Constructing and understanding the problem, developing rudiments and search for potential means to solve the problem. II Solution reGinement and evaluation Experimentation, simulation, ;ield studies III Substantive Theory Seek for a more theoretical understanding and contribution in it, introduce solution in several contexts. Extend beyond demonstrating the practical understanding. IV Formal theory Show that the applicability is not limited to the empirical context under study. Developed from substantive theory as time progresses. !Design involves planning information and materials >lows as well as physical layouts and choice of process technologies for the transformation activities. Operations design ale involves designing an organisation, its processes and structures, and staf>ing it with human resources. !Empirical quantitative modelling research Primary concern is to ensure that there is a model >it between observations and actions in reality and the model made of that reality. The descriptive aim in this type of research is interested in creating a model that describes the causal relationship that may exist and leads to understanding to the processes going on. Prescriptive research is interested in developing policies, strategies to improve the current situation. Researchers operating in this type of research should have a lot of knowledge about the relevant characteristics of the operational process under study. However the disadvantage of this method is the subjectivity and situation-‐dependent way this research is performed. Thus, it is dif>icult to judge whether the scienti>ic value of the results are good enough. !In an empirical research they either focus on testing the (construct) validity of the scienti>ic models or testing the usability and performance of the problem solutions obtains from quantitative real life operations processes. Empirical focusses on the implementation and validation, it tests and challenges the usability and performance of the solutions of theoretical problems. Especially the basic assumptions are validated. Steps that need to be taken:
1. Identify the basic assumptions 2. identify the type of operational process and decision problem 3. Operational, objective criteria must be developed 4. Develop hypotheses 5. Develop an objective way to measure or make the observations 6. Applying the measurements and observations, collect and document ate the resulting data 7. Processing the data, which generally will include the use of statistically analysis 8. Interpretation of the research results related to the model or hypotheses !
Lecture slides Design science is solving a practical knowledge problem, where the utility is the goal. other forms are pure-‐knowledge problems. The cycle of design science looks as follows: Design problem stakeholder, goals, CSFs Diagnosis/Analysis what are the causes of current failure of the desired success SpeciGication of solution Implementation Validation the validation is for the repetition of the cycle to evaluate !

Design science is a problem solving paradigm, that constructs innovative solutions to practical problems. Example of design science is an information system (IS), it is man-‐built, involves people and organisations, is complex, and hard to design that it will work properly. !Artefacts -‐ arti>icial information system build to solve real-‐world problems. It involves people technology and organisations. It is a complex build-‐up and provides no guarantee. The artefact is there to in>luence and improve the problem context. It is something that needs to be designed: process, model, service, project, method, organisation, technical system. !Artefact interacts with the problem statement. Abstraction from the artefact leads to design principles for a class of artefacts (bridges, rockets, IS) by validated resources, CSFs and rules. Leading up to validated design principles for speci>ic building sorts. !Practical knowledge -‐ problem aims at resolving a difference between the way stakeholders experience the world and the way they would like to experience the world. You use practical knowledge to change the world. !
!To answer a design problem the problem solver needs to: 1. investigate the problem: (1) who are stakeholder, (2) what are the goals, (3) what are the CSFs 2. Ask diagnostic questions: what are the causes of current failure of the desired success? 3. Propose possible solutions 4. Validate the solutions: does it satisfy the success-‐criteria !Critical Success Factors (CSFs) Functional What shall the system do? exchange data between Non-‐functional What shall the system be? reliable, fast, secure !Description of a design research problem ! In [context], we build [artefact] to attain [goal] In the requirements engineering community, we build a CNL to attain correct integration of requirement speci;ications. ! EPD: What needs to change/improve: old data exchange (phone, fax, mail, courier) is to be replaced by a new from of digital exchange. Goal: privacy of data and the help for patients to get better & receive high quality care. !Acceptance -‐ of a new design model is the most important aspect of all. Because if the stakeholder does not want to use the IS, it will fail. The free will of people needs to be accepted.
Pure knowledge problems Practical knowledge problem
Find the truth Do something useful (is it useful?)
Avoid interfering with the world (observation) Interfere with the world (solving)
Goal is attaining pure knowledge (one answer) Goal is changing the state of the world (multiple answers)
Any change in the world is a side effect (minimised) Any knowledge gained is a side effect (cherished)
Ethical rules do not apply Ethical rules apply (accountable changing world)
Evaluated by truth Evaluated by utility
Many degree of truth uncertainty Many degrees of utility

!Problem context: something that is there that you do not like (you make an artefact) * ICT Stakeholders got to much freedom which caused them to loose control over the end-‐user use * Complete information and authorisation * No customisations > only standardised format: scalability !Stakeholders: if he or she has interest in the IS and is affected by it, it is a stakeholder. A stakeholder can in>luence the system. You can also wonder who is in>luenced by the system? !Goal: cannot contain non-‐function things (better, faster, ef>icient) * they have to be more speci>ic * Functional: effectiveness * (Main goal EPD: lower costs & quality improvement) ! Goal: main function, most important (in context (we do, to attain a goal) Regulative Cycle 1) Design problem = the context Who are your stakeholders? (a party affected by solving the design problem) What are the goals of each stakeholder? (a desired change in the current state) What are the Critical Success Factors? (has to be met, because otherwise any solution not resolving that success factor will fail to attain the CSFs original goal 2) Diagnosis/Analysis What are possible causes of the dif>iculty of resolving the CSF Test cause of a CSF by checking quality attributes (how expensive, easy to implement, quick available. robust, reliable, understandable, maintainable, complex, fast secure, safe must the solution be) -‐ Precision, express ability, automatable, easy to read or write Is there an order-‐dependency in which the CSFs must be treated? 3) Design solution = designing the artefact Which solution alternatives are available? (knowledge problem) Can we assemble old solutions to build new solutions? (creative problem) Can we and must we invent a new solution completely from scratch? 4) Implementation 5) Validation How to design test methods for each CSF Did we meet all the CSFs What is the trade-‐off? (Which of possible more possibilities is preferred, by which criteria) How scalable is the solution/implementation? (will a design solution also work in an environment where we need to produce more, faster, better, cheaper?) How well does the solution perform? (quality attributes) Have we encountered new CSFs in the implementation result? !Very often on can validate the correctness of the design solution without implementation. By the use of mathematics, simulation, wind tunnel, scale-‐down model, consistency tests. !!!!!!!!!!!!

Article -‐ Hevner Acquiring knowledge about the application of IS in organisations involves two complementary things: behavioural science, and design science. Behavioural science is justifying theories that explain and predict phenomena which ultimately inform researchers of the interactions with people, organisations and technologies that must be managed if information system is achieved. The design science has its roots in engineering and the sciences of the arti>icial, it seeks to create innovations that de>ine the ideas, practices, implementation etc that can effectively be achieved. Design science, creates and evaluates IT artefacts intended to solve identi>ied organisational problems. Designing useful artefacts is complex due to the need for creative advances in domain areas in which existing theory is often insufGicient. The fast growth of IT, causes also to implementation in sector we did not expect. !
It is all about understanding, executing, and evaluating design sciences !Tow design processes (build and evaluate) and four design artefacts (constructs, models, methods, instantiations) are produced within design-‐science research. The artefacts are built to address unsolved problems. Constructs provide the language in which problem and solutions are de;ined, models use the constructs to represent the real world. Methods de;ine processes and help guidance on how to solve the problems, and instantiations show that construct, models or method can be implemented in a working system. ! Design science problems are considered to be wicked problems that are characterised by: • unstable requirements and constrains based upon ill-‐de>ined environmental contexts • complex interactions among subcomponents of the problem and its solution • inherent >lexibility to change design process as well as design artefacts • a critical dependence upon human cognitive abilities to produce effective solutions • a critical depends upon human social abilities to produce effective solutions !
Guidelines for Design Science
!What utility does the new artefact provide? and what demonstrates that utility? Evidence must be presented to address these two questions, that is the essence of design science. !!
Guideline Description
Design as an artefact Design science research must produce a viable artefact in the form of a construct, a model, a method, or an instantiation.
Problem relevance Objective of science science research is to develop technology-‐based solutions to important and relevant business problems.
Design evaluation The utility, quality, and ef>icacy of a design artefact must be rigorously demonstrated via well-‐executed evaluation methods (functionality,
effectiveness, consistency). A crucial component, which includes integration of the artefact within the technical infrastructure of the business environment
Research contributions Effective design science research must provide clear and veri>iable contributions in the areas of the design artefact, design foundations, and/or
design methodologies
Research rigour Design science relies upon the application of rigorous methods in both the construction and evaluation of the design artefact.
Design as a search process Search for an effective artefact requires utilising available means to reach desired ends while satisfying laws in the problem environment
Communication of research Design science must be presented effectively both to technology-‐oriented as well as management oriented audiences.

Article -‐ Holmstrom There is a considerable bias in the extant methodology literature toward problems and research questions that are well de>ined. Design science and exploration research can best be understood by juxtaposition with the more familiar research approaches. !
!In explanatory research the phenomenon studied already exists and the goal is to develop an understanding of it. In explorative research, the phenomenon must be created before it can be evaluated. Although they look mutually exclusive, they are complementary, without design science evaluative research would have nothing to evaluate, and they in turn complement exploration by evaluating the merits of various artefacts in different contexts. !Mean ends analysis method through which goal-‐directed scienti>ic inquiry can be conducted and is based on representations of present states, desired states, differences between the states. The goals of mean-‐ends is to move toward the desired state. There are 4 phases !
Exploratory research (design science)
Explanatory Research (theoretical science)
The phenomenon arti>icial phenomena have to be created by the researcher out there
Data created, collected, and analysed collected and analysed
End product solving a problem explanatory theory, prediction
Knowledge interest pragmatic cognitive, theoretical
Disciplinary basis engineering, fundamentally multidisciplinary
natural and social science, primarily undisciplinary
Type Exploration Explanation
Phase 1. Solution incubation 2. Solution ReGinement 3. Explanation I Substantive theory
4. Explanation II Formal theory
Objective Development of an initial solution design
Re>inement of the initial solution design
Development of substantive theory: establish relevance
Development of formal theory; strengthen
theoretical and generalisability
Means • identi>ication of interesting goals, situations or solutions
• Scanning of parallel knowledge domains
• Abductive cross-‐disciplinary reasoning
• Implementation of solutions designs
• Con>irmation of intended consequences
• co-‐optation of unintended consequences
• Iterations between solutions designs, implementation and evaluations
• inductive and deductive reasoning
• theoretical re>lection of the re>ined solution design
• Linking the solution design to a research program and theoretical discourse
• inductive and deductive reasoning; hypothesis building
• Theoretical and empirical examination of relevant contingencies
• development of formal representations of the solution design
• Implementation and re>inement of solution design in multiple context
Knowledge/interest
Pragmatic Action research Subjective
Pragmatic Action research Subjective and intersubjective
Cognitive/Pragmatic
Evaluative research Intersubjective
Cognitive Evaluative research Intersubjective

Exam Lectures !Case Study What would be the Unit of Analysis (p.106) Since the UoA is based on a research question, the answer should also contain a possible research question on which you can base your reasoning. What factors in;luence the performance of …. Explain why a certain UoA is picked and what you are expected to >ind: the underlying mechanism. * What, how or why questions * 2 UoA are oke, but more than two can be a problem !Select three variables and elaborate (p.166-‐171) It is of the essence to relate your main questions and literature to your variables, translate theoretical concepts and constructs into observable and measurable elements. Elaborate on your variables. * Also explain how they can possibly in>luence each other * Do not mention anything about the positive or negative effect that is expected * Establish a conceptual framework (169) and set boundaries to what you study !Case selection criteria (p.171-‐172) Purposely choose and select your cases, to get similar results (literal) and expected different results (theoretical). Mention if you do a multiple or single case study and explain why. Describe possible investigations in the end (replication logic) * Mention Eisenhardt (1989) with the minimal number of cases to be 4 * Place also the table to which you selected your cases, helps for understanding * 1 UoA = 1 case * In case study the selection of the sample cannot be randomly!! !How would the data gathering be done? (p.175-‐180) By observation, interviews, documents, statistics that are available to you. Be speci>ic in what you are doing in this process. Thus what are your sources, what do you need (# of investigators, recording devices, kwalitan, questionnaires). Expert interview? * When, how (how many interviews) !Quality criteria (p73-‐78 and 181-‐182) Specify and elaborate about the quality constructs and how can it be related to your research. First give the deGinition from the book and than speci>ic to the case. !
!! Different questions, variables need to be developed for either survey or case study, cannot be the same, otherwise you will not get points. !!!!!!!!!!
Examples
Construct validity Used multiple sources of evidence from employees and managers All informants reviewed their draft case study
Internal validity When analysing the data we did pattern matching and/or explanation building
External validity Cases were selected based on theoretical and literal replication based on variables
Reliability We used a case study protocol that outlined all procedures for data collection

Survey Unit of Analysis Since the UoA is based on a research question, the answer should also contain a possible research question on which you can base your reasoning. What factors in;luence the performance of …. Explain why a certain UoA is picked and refer to positive or negative in>luence. !!Variables: elaborate and perform the same as in case study only with other variables or other way around measured. Variables in survey can be more speci>ic than, case study (e.g. output). Variables are de>ined through items that you can base your survey on different short descriptions: experience > level of education / years of the job/ previous experience / age * use previous used questionnaires * Translate them in to observable and measurable constructs (p.107) !What is the population/sample? (p.170-‐174) Note that the population is everyone in a speci>ic sector and sample is the one you investigate. The describe the population and sample in a small paragraph. Population: all elements from which sample will be drawn Sample: subset of the entire group of people, >irms, plants or things you investigate (p.85) * (non)-‐probabilistic sample (P.117), * sample size (1 or 2 companies) (p.118) !Data gathering Interviews and questionnaires that can either be face-‐to-‐face, telephone, mail, web. Elaborate on your answers, thus state it is based on literature. Describe the process. * mention some advantages of a particular method regarding costs for instance. * What kind of questions do you want to ask !Quality criteria (p.134-‐140) Specify and elaborate using it in a structured way what the book suggests on research quality. It refers to the reliability and validity of the research. Face validity before data collection. !
!Dependent and independent variable? !!!!
deGinition Example
construct unidimensionality Indicator must be associated with an underlying variable (construct)
It can be associated with one and only one latent variable We will perform con>irmatory factor
analysis on the different items to make sure that they are not too highly correlated and or are in fact related
discriminant validity Extent to which theoretically distinct constructs are not highly correlated
convergent validity Degree to which two measures of constructs that theoretically should
be related are in fact related
Criterion related validity How well does the instrument correlate with what is intended to
predict.
We will perform a multiple correlation test
Reliability Indicates dependability, stability, predictability and consistency. Will
they show the same results.
Check the face validity of all constructs to make sure that they represent what they are intended to.

Comparison survey and case study + include table on page 72! * If you look for a new phenomenon survey cannot really effectively support the discovery of subtle or complex relations (90)
* If there is much theoretical knowledge already available, there can be pre-‐de>ined constructs that are quanti>iable, as the in>luence can be industry wide a survey can than >it better !
AQR Objective for a question about AQR is that you 1. De>ine routes from starting to ending 2. Determin the time to handle all requests and minimise it !Than the >irst main thing you do is formulate important assumptions, that are de>ining a heuristic for the problem mentioned. Assumptions are there for the sake of the model, you start with a simple model and develop it from there. Assumptions are limitations. In the exam 4-‐5 assumptions * carrier cannot switch from columns (movement) * carrier can only take one container at the time * speed of carrier is constant * carrier can work continually (how long can he work) * We know the different forms of demand * Containers can be picked up/delivered at any in or output point * There is no limit on the working time * depot is known * No additional movements are required of containers * There is suf>icient capacity !Parameters: those have the information we know before hand, before we start the model • which container to pick up • Total demand • Number of requests • Numbers of container spots • Distances for travelling • Location of containers • Speed • Number(s) of carrier • Number(s) of in-‐ and output points • Numbers of sea and land sides !!!
Survey Case Study
Advantage • Generalisation capability of results (90) • Relatively limited effort to collect and
analyse data
• Phenomenon can be studied in natural setting
• Guide early exploratory studies where variables are unknown (164)
• Allows for RQ to evolve over time (170)
Disadvantage • Falls short on precision (90) • Requires detailed information on the
context or relevant variables (90) • Cannot recover missing information (101) • Relies on diligence, goodwill and level of
understanding from respondents (91)
• Time consuming (163) • Requires skilled interviewers
Risk You need a large number of responses (sample)
Super>iciality (91) Single respondents from one organisation
Needs care for drawing generalisable conclusions from limited cases (163)

Decisions: we should solve the model >irst to know this information regarding decisions. Decision variables are there to de>ine the routes (= de>ining routes). * Which container to handle >irst/second (sequence) * How to move the carrier (where to start, which row, and how to continue) * Number of times you enter a row * Order of jobs or rows * What to do after a speci>ic activity !Provide a description that can be used to derive routes for a single carrier. Just write down in words with the heuristics and rule of thumb * provide a schematic description that includes detailed information such that everyone only can interpret in just one way and can apply in general
* Detailed strategy of your heuristics for the aspects: (1) which row to start, (2) which way to handle requests, (3) what way do you enter?, (4) what is the next row, (5) check if all request are being handled, (6) how do you return!.
* Do not forget the last step, return to the beginning point. * Explain relations between steps that you determined * Describe trade-‐offs if two items are at the same distance or decision variable. !Three important questions in description: 1. Where to start 2. How to proceed (Follow to the nearest containter to perform the >irst task (shortest distance). Can
be one criteria. If two containters have same distance, which should you do >irst? Randomise? Perform the different forms of demand as a role (thus >irst request landside and than …) Per column. Don’t Gind the optimal way but a feasible way
3. When to stop !Show and draw your model, with the steps and conclusions written in the previous question. * Show the solution * explain in detail the information on validation * Explain expected results. * Keep linking it to your pre written heuristics, otherwise no points for drawing a better solution. !Design Methods Formulate speciGic research questions you would like to tackle to get a good understanding of the problem context and solve the problem? * What are relevant CSFs available in literature * What are relevant … available in literature? * What is the current stage of … at the organisation? * What is the current performance of …? * What cause the lack of performance of past projects? * What solutions can be implemented and what model can be used? * How should a … be designed in general to get accepted? !Sketch of design Provide a sketch of your research design following the guidelines for design science to show how you can solve the problem, seek for more theoretical understanding of solution proposed. 1. literature review on change models, and CSFs 2. Make a selection of relevant ones (How do we develop a procedure that helps the company) 3. Perform analysis of past projects (by means of interviews, and data analysis) 4. Diagnose problems in past projects 5. Propose solutions and evaluate/validate them (Design phase: propose solutions and expert
interviews to validate) 6. Generalisation (how can de lessons learned be extended to others (organisations) !Model validation: real-‐life data, simulation or numerical study. Apply regulative cycles here!