Embed Size (px)
Citation preview

International Journal of Multimedia and Ubiquitous Engineering
Vol.10, No.10 (2015), pp.315-328
http://dx.doi.org/10.14257/ijmue.2015.10.10.31
ISSN: 1975-0080 IJMUE
Copyright ⓒ 2015 SERSC
Characteristic Analysis of Auditory Stimuli Utilizing the Sound
Source of Ultrasonic Band and the Audible Frequency Band and
Cerebral Activation State Changes
Jeonghoon Shin¹, Minji Kim¹ and Sojeong Lee²
¹Dept. of Information Technology Engineering, Catholic University of Daegu,
Hayang-ro 13-13, Hayang-eup, Gyeongsan-si, Gyeongbuk 712-702, Korea
{only4you, sky11123}@cu.ac.kr
²Bugil Academy GLP
61 Dandae-ro Shinbu-dong, Dongnam-gu, Cheonan-si, Chungnam-do, 330-941
Bugil Academy, Korea
Abstract
Neurofeedback, which is considered an alternative medicine, is a training that changes
the cerebral activation state by a patient's own efforts. New Neurofeedback users often
have a hard time learning to control their own brain waves. For this reason, many users
give up on Neurofeedback therapy prematurely. Neurofeedback advocates have been
studying a variety of brain activation state control methods to develop
easier Neurofeedback therapies to overcome this defect. Humans receive a variety of
external information with the help of various sensory organs such as the eyes and ears.
This information is recognized by the cerebrum, and as a result it induces changes in the
activation state of the brain. Auditory stimulation of external stimuli is perceived as sound
by stimulating the brain through air conduction. In general, the auditory stimulus
bandwidth from 20Hz to 20KHz is used. Auditory stimulus of ultrasound higher than
22KHz is not used as an external stimulus to induce the brain activation state change,
since humans cannot hear beyond this bandwidth. It is known that auditory stimulus of
ultrasound bandwidth directly stimulates the cochlea of the inner ear and can induce
changes in the brain activation state. However, no specific research results that compare
the difference between the audible and the ultrasound stimulus has been presented, so
there are limitations utilizing the ultrasound bandwidths in practical applications. For
this reason, this study has analyzed changes in brain activation utilizing the auditory
stimulation in audible and in ultrasound frequency. The research result of this study can
be applied in a variety of applications, which uses ultrasound auditory stimulus.
Keywords: Neurofeedback, Auditory Stimulus, Ultrasound Bandwidth
1. Introduction
The need for controlling diseases using modern medical scientific methods is a very
important matter. New treatments for various diseases are continuously being suggested.
However, the vast majority of treatments currently being proposed require the use of
drugs and surgery. These treatments are often subject to numerous side effects, while at
the same time offering relief for many patients. To deal with these issues, a variety of
alternative medicines have been, over the years, utilized for the treatment of these
diseases and conditions. [1-2]
As an example, in the field of psychiatry, Neurofeedback is being used as a therapeutic
technique to minimize the side effects of treatment using drugs and surgery, and various
clinical results have been suggested for this treatment. In these trials, patients attempt to

International Journal of Multimedia and Ubiquitous Engineering
Vol.10, No.10 (2015)
316 Copyright ⓒ 2015 SERSC
treat themselves by attempting to learn how to bring their brain activity back to a
“normal” state using their own efforts. However, people who use Neurofeedback for the
first time tend to have trouble mastering the way to control the activation state of their
brains and the treatment tends not to go smoothly, thus, the need to find a solution to this
problem is evident [3-8]. In this regard, various studies are underway to find improved
therapeutic methods like Neurofeedback therapy techniques that utilize external stimuli,
such as audio-visual stimulation. External stimuli, such as light and sound, are recognized
in the brain through the sensory organs and induce a change in the activation state of the
brain. If the changes in the brain after having been activated by light and sound can be
analyzed accurately, they could be used systematically as a method to change and control
the brain activation states in many other fields, not only Neurofeedback. The external
stimulus approach utilizing light and sound has two problems. First, light and sound
might not only be exposed to the patient in need of treatment, but also to others nearby
who do not welcome this stimuli. Second, since light and sound passes through the sense
organs before being recognized in the cerebrum, the same stimulation can induce various
forms of brain activation states in response to the patient. The sensory organ
characteristics of each person are different, and when these properties are in conjunction
with external stimuli, there are bound to be variations. In addition to the limitations of
application fields and available places, it is difficult to select the external stimulus to draw
results with uniform algorithms due to these problems. These elements inhibit practical
applications like commercialization. In this paper, in order to solve these problems
fundamentally, we have conducted experiments and analyzed utilizing stimuli in the
ultrasound bandwidth that can minimize the effect of human sensory organs, and can
induce changes in the brain activation state directly. There has been research that has
shown auditory stimulation of the ultrasound bandwidth directly stimulates the inner ear
and affects the activation state changes to the cerebrum, but there are no specific research
results that have been compared and analyzed with auditory stimulus in the audible
frequency [9-13]. If comparative study and analysis of the specific characteristics
associated with auditory stimuli of ultrasonic and audible frequency bands is conducted
successfully, the research could suggest auditory stimuli that could replace audible
auditory stimuli and could solve various problems caused by using the audible auditory
stimuli. In this paper, in order to fundamentally solve changes in cerebral activation state
due to differences in sound sources, we have converted sound sources, recorded in audio
and ultrasound frequencies and provided to the subjects, and analyzed the similarity and
differentiation of the changes in the activation state of the user’s brain. We have
thoroughly designed this research to ensure that the results can be practically used in a
variety of different fields.
2. Experimental Design
2.1. Experimental Environments
In this study, in order to analyze the changes of cerebral activation states using a sound
source of an audio frequency band and the ultrasonic bandwidth, we have conFigured an
experimental environment as shown in Figure 1 below. The ultrasound sources which
were used in the experiment were prepared by converting audible sound sources into 3
ranges (20, 30, and 40KHz) and were sequentially presented to the subjects who
participated in the experiment described in Figure 1 below.
International Journal of Multimedia and Ubiquitous Engineering
Vol.10, No.10 (2015)
Copyright ⓒ 2015 SERSC 317
(a) Auditory Stimulation in the Audio Frequency Band (b) Auditory Stimulation in the Ultrasonic Band
Figure 1. Experimental Environment
In order to analyze the effect of auditory stimulation on the changes in the brain
activity of subjects, this study has selected healthy men and women in their 20's as subject
groups. The experiment was conducted with a total of 150 subjects, so that statistical
reliability was ensured. First, we analyzed changes in the cerebrum activation condition
after participants (there were 45 men and 46 women used in this particular experiment)
listened to sounds in the audio frequency band. Sixty subjects (evenly divided between
male and female) were recruited and participated in the experiment to analyze the changes
in the cerebrum activation condition, and they listened to the same sound, but which had
been converted into the ultrasonic bandwidth. This group was further divided into three
groups based on bandwidth (20, 30, and 40KHz) (10 men and 10 women for each group).
2.2. Stimulus Sound Source Selection and Electroencephalogram Extraction
The type of auditory stimulus that was used in the experiment is popular. To prevent
losses owing to lyrics damaged during tempo conversion, the selected music was played
with a single instrument. In order to analyze the stable state in the relaxed state,
Beethoven's Pathetique 2nd Movement was selected, since it was composed in a major
key, and has a tempo similar to that of a human heartbeat. The original music which was
used in this experiment has been converted from a major key to a minor key to induce
changes in the emotions of the listeners, and a comparative analysis has also been carried
out. In order to analyze the effect of tension through tempo change, we had the subjects
listen to music 20% faster than normal, and 20% slower than normal.
We used the same sound source in the audible frequency bandwidth for ultrasound
bandwidth in order to minimize the variables of the changes in emotion emanating from
changes in stimuli. In addition, in order to induce mood swings, nervousness, and other
emotions, conversion between major and minor keys, and tempo changes, were performed
in the same manner as the sound source of the audio frequency band. Table 1 indicates the
auditory stimulation sources used in this experiment.
Table 1. Sound Source of Audible Frequency Band and Ultrasound Band
Sound Source of Audible Frequency Band Sound Source of
Ultrasound Band
Music (Sound) Conversion Pattern Tempo (BPM) Ultrasound frequency
Beethoven's Pathetique 2nd
movement
Major 70 to 90
(Maintain the speed
of the original song)
20KHz
30KHz
40KHz Minor
Major 110 to 130
(20% faster than
the original song)
20KHz
30KHz
40KHz Minor
Major 30 to 50 20KHz
International Journal of Multimedia and Ubiquitous Engineering
Vol.10, No.10 (2015)
318 Copyright ⓒ 2015 SERSC
When converting the original sound source into the ultrasonic band, we used a sound
generator and an oscilloscope to ensure accuracy. After converting the 100hz signal
output from the sound generator to the ultrasonic bandwidth, the conversion to the output
value of the oscilloscope 20khz, 30khz, and 40khz sharp was performed to the stimulation
source of the audible frequency band.
Electrode arrangement for the electroencephalogram extraction follows the 10-20
international electrode placement. In this experiment, the electroencephalogram signal
was extracted from 8 points (F7, F8, T3, T4, T5, T6, O1, O2) at a sampling of 256Hz and
brain waves from 4 points (T3, T4, O1, O2) in a close correlation with audio-visual
stimulus were analyzed.
3. Experiments and Results
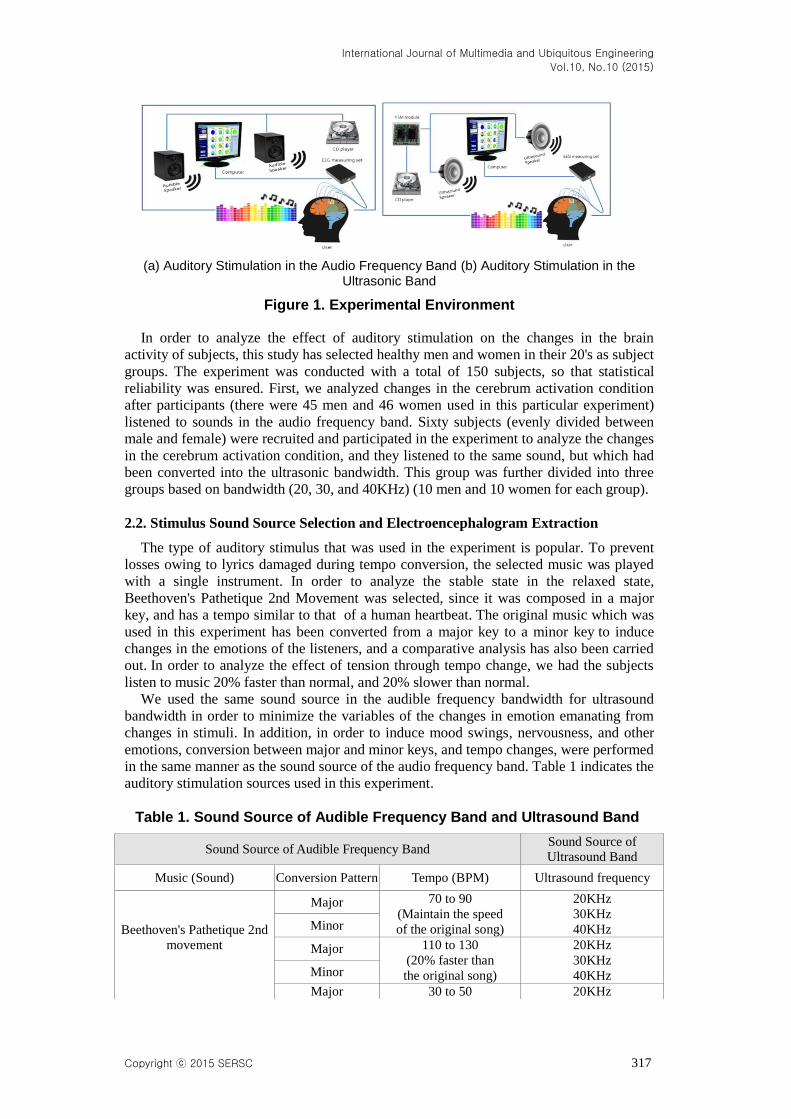
In this study, we have suggested a new analysis method based on frequency
characteristics of EEG spectra in the emotions, which analyzed the four emotional states
of humans, by M. B. Kostyunina and M. A. Kulikov [14-15] to analyze the impact of
auditory stimulation sources in the audible frequency band and the ultrasound band on the
cerebrum activation state. According to the reference, to classify the four emotional states
(Joy, Anger, Fear, Sorrow) in humans, the frequency bandwidth value with the peak
energy value among the EEG spectrum, belonging to the alpha band, and the distribution
of the baseline state were analyzed and the results show that frequency bandwidth where
peak energy is placed changes depending on the changes of emotional state. For the
classification of emotional states, the reference measured the brain waves at 10 points of
F3, F4, C3, C4, T3, T4, P3, P4, O1, O2 and was utilized in the analysis. In this study, we
have utilized frequency bandwidth location, which has peak energy in the alpha band, at
4-points of T3, T4, O1, and O2 strongly correlated with audio-visual stimulus, and energy
value in baseline. Figure 2 shows the classification criteria of the emotional state which is
newly proposed in this study.
Minor (20% slower than the
original song)
30KHz
40KHz
International Journal of Multimedia and Ubiquitous Engineering
Vol.10, No.10 (2015)
Copyright ⓒ 2015 SERSC 319
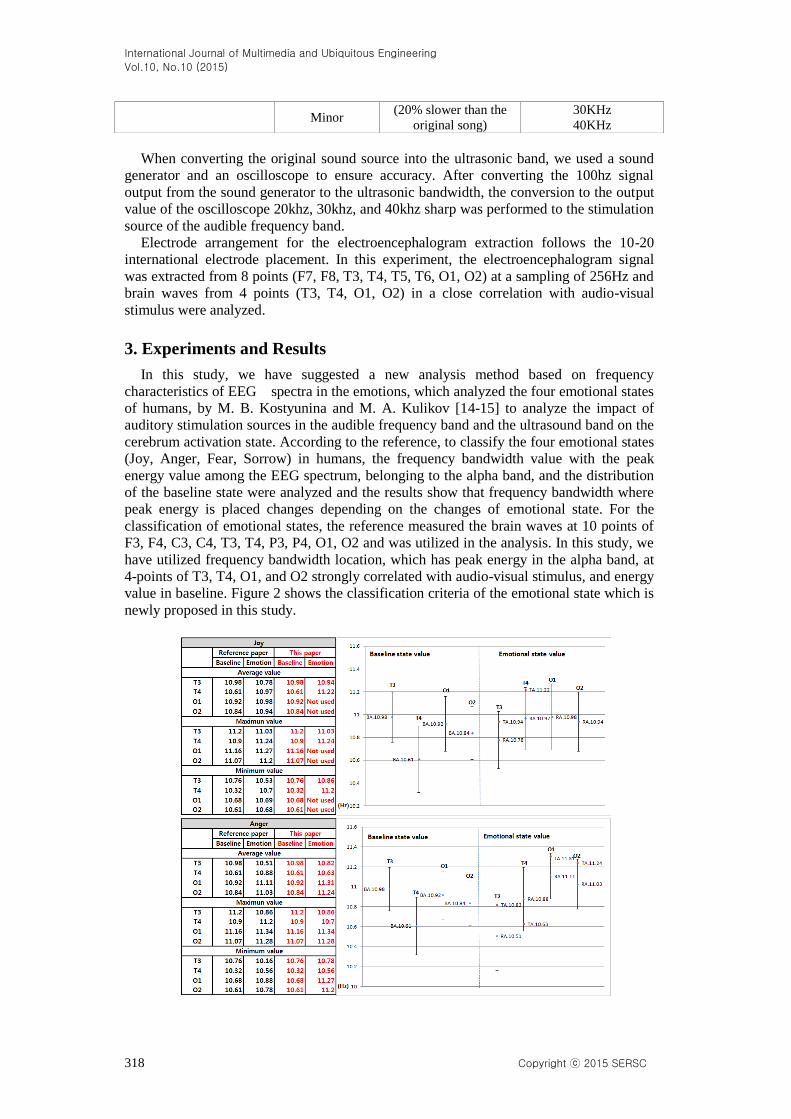
TA: Electrode Value (This Paper), RA: Electrode Average Value (Freference Paper), BA: Baseline Average
Figure 2. Classification Criteria of Emotional State in Accordance with the Frequency Bandwidth Where the Peak Energy of the Alpha band Is Located
Figure 2 shows the frequency band where the alpha-band peak energy is located and
frequency band in the steady-state for classifying emotional state proposed in this paper.
As shown in Figure 2, in this study, if the frequency bandwidths where the baseline peak
energy is located, they are included from 10.76 to 11.2 for T3, from 10.32 to 10.9 for T4,
from 10.68 to 11.16 for O1, from 10.61 to 11.07 for O2, classification of the four
emotional states is carried out. If the frequency band of the baseline peak energy does not
exist in the range, the classification of the emotional state is not carried out. Taking as an
example joy, among the four emotions from Figure 3, after the frequency band of the
baseline peak energy has satisfied the condition, if the alpha-band peak energy of the
subject at T3 point has been included from 10.86 to 11.03Hz and that of T4 point has also
been included from 11.2 to 11.24Hz, the emotion of the subject will be classified as joy in
this study. Similarly, in the case of anger, after the frequency band of the baseline peak
energy has satisfied the condition, if the alpha-band peak energy of the subject at four
points has been included in the right range, the emotion of the subject will be classified as
anger (10.78 ≤ T3 ≤10.86, 10.56 ≤ T4 ≤10.7, 11.27 ≤ O1 ≤11.34, 11.2 ≤ O2 ≤11.28). For
fear, T4 and O1 points are used for the classification. The alpha-band peak energy of the
subject at T4 point should be included from 10.02 to 10.47Hz and that of O1 should be
included from 10.47 to 10.69Hz. For sorrow, 3 points, except T3, are used (9.32 ≤ T4
≤9.63, 8.29 ≤ O1 ≤10.35, 10.07 ≤ O2 ≤10.32) For both fear and sorrow, the frequency
band location of the baseline peak energy must satisfy the condition.
The analysis results of the brain waves, which were collected using the above
algorithm proposed in this study shows that some distributions of the alpha-band peak
energy in the baseline condition have not satisfied the conditions. In order to compensate
for this condition, correction values corresponding to the deviation have been used. For
the correction value, the reciprocal of the distance value between the alpha-band peak
distribution in the baseline condition and the alpha-band peak distribution of the subjects

International Journal of Multimedia and Ubiquitous Engineering
Vol.10, No.10 (2015)
320 Copyright ⓒ 2015 SERSC
who participated in this study was used. The reciprocal of the distance value of a
logarithmic scale, known as suitable for characteristics of the human sense organs has
been used and the analysis has been performed simultaneously. Through the comparative
analysis of the classification using common distance values and a log scale, this study has
tried to present an auditory stimulation technique that can lead to changes in the cerebral
activation state by minimizing the deviation of the human senses.
Table 2. Emotional State Classification Results of Subjects According to the Stimulus Sound Source in Audible Frequency Bandwidth (Scale Applies to
Major-Minor Conversion, Tempo Conversion, and Reciprocal of the Distance Value)
Major Minor
slower joy 2 4.44%
45 people anger 5 11.11%
fear 10 22.22%
sorrow 28 62.22%
Original joy 2 4.44%
45 people anger 3 6.67%
fear 20 44.44%
sorrow 20 44.44%
faster joy 2 4.44%
45 people anger 2 4.44%
fear 9 20.00%
sorrow 32 71.11%
slower joy 0 0.00%
45 people anger 2 4.44%
fear 12 26.67%
sorrow 31 68.89%
Original joy 0 0.00%
45 people anger 2 4.44%
fear 9 20.00%
sorrow 34 75.56%
faster joy 1 2.22%
45 people anger 1 2.22%
fear 19 42.22%
sorrow 24 53.33%
(a) Emotional state classification of male subject according to the stimulus sound source in audible
frequency bandwidth (Scale applies to major-minor conversion, tempo conversion, and reciprocal
of the distance value)
Major Minor
slower Joy 4 8.70%
46 people Anger 4 8.70%
Fear 24 52.17%
sorrow 14 30.43%
Original Joy 1 2.17%
46 people anger 5 10.87%
fear 28 60.87%
sorrow 12 26.09%
faster joy 1 2.17%
46 people anger 4 8.70%
Fear 23 50.00%
sorrow 18 39.13%
slower joy 1 2.17%
46 people anger 3 6.52%
fear 22 47.83%
sorrow 20 43.48%
Original joy 0 0.00%
46 people anger 3 6.52%
fear 22 47.83%
sorrow 21 45.65%
faster joy 0 0.00%
46 people anger 3 6.52%
fear 27 58.70%
sorrow 16 34.78%
(b) Emotional state classification of female subject according to the stimulus sound source in
audible frequency bandwidth (Scale applies to major-minor conversion, tempo conversion, and
reciprocal of the distance value)
Table 2 shows the classification results of men and women subject’s emotions. The
subjects listened to sound stimulation in the audible frequency bandwidth, and emotional
state classification methods and the reciprocal correction of the distance values in the
baseline state were used to obtain the results. According to the experimental results, the
emotional states of 45 male subjects were classified into joy, anger, fear, and sorrow,
respectively 2, 5, 10, and 28, when they listened to the music, which was played at a rate
20% slower than the original. When they listened to the original music, the results were
classified into 2, 3, 20, and 20 respectively. After they listened to the original song 20%
faster, the results were classified into 2, 3, 20, and 20 respectively. When they listened to
the music, which was converted from a major key to a minor key in 3 different tempos,
International Journal of Multimedia and Ubiquitous Engineering
Vol.10, No.10 (2015)
Copyright ⓒ 2015 SERSC 321
the results were classified as follows (20% slower: 0, 2,12, and 31, Original: 0, 2, 9, and
34, 20% faster: 1, 1, 19, and 24). In addition, the same experiment was performed on
female subjects in the same way as male subjects, and the results were classified as
follows (Major-20% slower: 4, 4, 24, and 14, Major-original: 1, 5, 28, and 12, Major-
20% faster: 1, 4, 23, and 18). (Minor-20% slower: 1, 3, 22, and 20, Minor-original: 0, 3,
22, and 21, Minor-20% faster: 0, 3, 27, and 16).
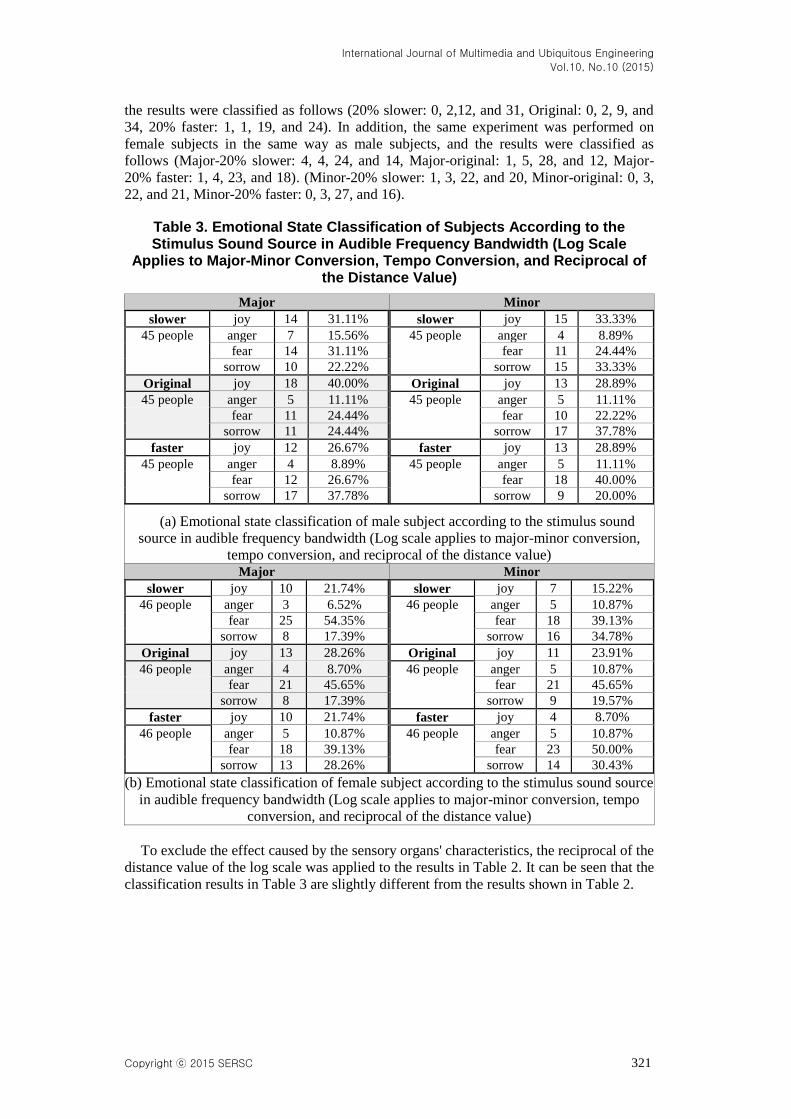
Table 3. Emotional State Classification of Subjects According to the Stimulus Sound Source in Audible Frequency Bandwidth (Log Scale
Applies to Major-Minor Conversion, Tempo Conversion, and Reciprocal of the Distance Value)
Major Minor
slower joy 14 31.11%
45 people anger 7 15.56%
fear 14 31.11%
sorrow 10 22.22%
Original joy 18 40.00%
45 people anger 5 11.11%
fear 11 24.44%
sorrow 11 24.44%
faster joy 12 26.67%
45 people anger 4 8.89%
fear 12 26.67%
sorrow 17 37.78%
slower joy 15 33.33%
45 people anger 4 8.89%
fear 11 24.44%
sorrow 15 33.33%
Original joy 13 28.89%
45 people anger 5 11.11%
fear 10 22.22%
sorrow 17 37.78%
faster joy 13 28.89%
45 people anger 5 11.11%
fear 18 40.00%
sorrow 9 20.00%
(a) Emotional state classification of male subject according to the stimulus sound
source in audible frequency bandwidth (Log scale applies to major-minor conversion,
tempo conversion, and reciprocal of the distance value) Major Minor
slower joy 10 21.74%
46 people anger 3 6.52%
fear 25 54.35%
sorrow 8 17.39%
Original joy 13 28.26%
46 people anger 4 8.70%
fear 21 45.65%
sorrow 8 17.39%
faster joy 10 21.74%
46 people anger 5 10.87%
fear 18 39.13%
sorrow 13 28.26%
slower joy 7 15.22%
46 people anger 5 10.87%
fear 18 39.13%
sorrow 16 34.78%
Original joy 11 23.91%
46 people anger 5 10.87%
fear 21 45.65%
sorrow 9 19.57%
faster joy 4 8.70%
46 people anger 5 10.87%
fear 23 50.00%
sorrow 14 30.43%
(b) Emotional state classification of female subject according to the stimulus sound source
in audible frequency bandwidth (Log scale applies to major-minor conversion, tempo
conversion, and reciprocal of the distance value)
To exclude the effect caused by the sensory organs' characteristics, the reciprocal of the
distance value of the log scale was applied to the results in Table 2. It can be seen that the
classification results in Table 3 are slightly different from the results shown in Table 2.

International Journal of Multimedia and Ubiquitous Engineering
Vol.10, No.10 (2015)
322 Copyright ⓒ 2015 SERSC
Figure 3. Rate of Changes in the Emotional State According to the Major-Minor Conversion, and Playback Speed Changes (Scale Applied to
Reciprocal of the Distance Value)
Figure 4. Rate of Changes in the Emotional State According to the Major-Minor Conversion, and Playback Speed Changes (Log Scale Applied to
Reciprocal of the Distance Value)
Figures 3 and 4 show the rate of emotional state changes according to the Major/Minor
conversion and playback speed changes based on the classification results for the audible
stimulus of the original song. Figure 3 shows the rate of change of the correction results
using the reciprocal of the distance value and Figure 4 indicates the rate of change of the
correction results using the log scale for the reciprocal of the distance value.
Table 4. Emotional State Classification of Subjects According to the Stimulus Sound Source in Ultrasound Bandwidth (Scale Applies to Major-
Minor Conversion, Tempo Conversion, and Reciprocal of the Distance Value)
Major Minor
20KHz
slower joy 0 0%
20people anger 0 0%
fear 5 25%
sorrow 15 75%
Original joy 0 0%
slower joy 2 10%
20people anger 0 0%
fear 3 15%
sorrow 15 75%
Original joy 0 0%
International Journal of Multimedia and Ubiquitous Engineering
Vol.10, No.10 (2015)
Copyright ⓒ 2015 SERSC 323
20people anger 0 0%
fear 3 15%
sorrow 17 85%
faster joy 0 0%
20people anger 0 0%
fear 6 30%
sorrow 14 70%
20people anger 0 0%
fear 4 20%
sorrow 16 80%
faster joy 0 0%
20people anger 0 0%
fear 4 20%
sorrow 16 80%
Major Minor
30KHz
slower joy 1 5%
20people anger 1 5%
fear 3 15%
sorrow 15 75%
Original joy 1 5%
20people anger 2 10%
fear 5 25%
sorrow 12 60%
faster joy 2 10%
20people anger 0 0%
fear 6 30%
sorrow 12 60%
slower joy 0 0%
20people anger 0 0%
fear 7 35%
sorrow 13 65%
Original joy 0 0%
20people anger 0 0%
fear 6 30%
sorrow 14 70%
faster joy 0 0%
20people anger 2 10%
fear 5 25%
sorrow 13 65%
Major Minor
40KHz
slower joy 0 0%
20people anger 0 0%
fear 4 20%
sorrow 16 80%
Original joy 1 5%
20people anger 0 0%
fear 2 10%
sorrow 17 85%
faster joy 0 0%
20people anger 1 5%
fear 4 20%
sorrow 15 75%
slower joy 0 0%
20people anger 0 0%
fear 5 25%
sorrow 15 75%
Original joy 1 5%
20people anger 1 5%
fear 5 25%
sorrow 13 65%
faster joy 1 5%
20people anger 1 5%
fear 7 35%
sorrow 11 55%
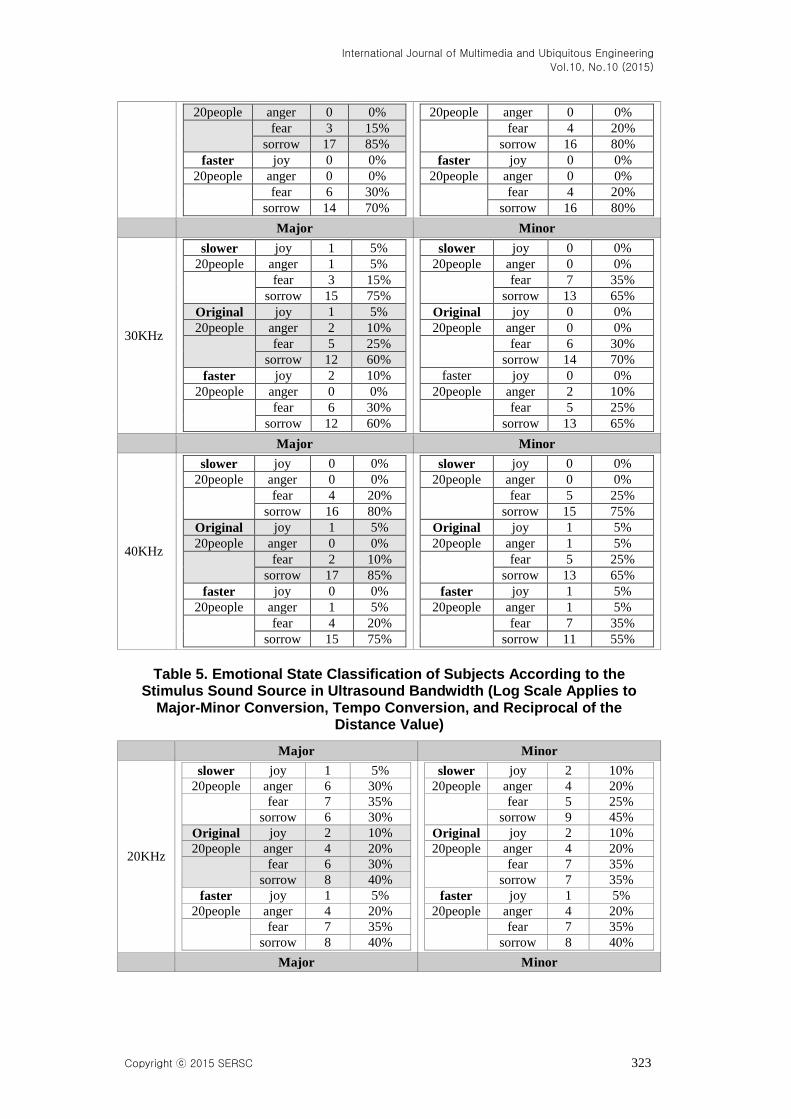
Table 5. Emotional State Classification of Subjects According to the Stimulus Sound Source in Ultrasound Bandwidth (Log Scale Applies to
Major-Minor Conversion, Tempo Conversion, and Reciprocal of the Distance Value)
Major Minor
20KHz
slower joy 1 5%
20people anger 6 30%
fear 7 35%
sorrow 6 30%
Original joy 2 10%
20people anger 4 20%
fear 6 30%
sorrow 8 40%
faster joy 1 5%
20people anger 4 20%
fear 7 35%
sorrow 8 40%
slower joy 2 10%
20people anger 4 20%
fear 5 25%
sorrow 9 45%
Original joy 2 10%
20people anger 4 20%
fear 7 35%
sorrow 7 35%
faster joy 1 5%
20people anger 4 20%
fear 7 35%
sorrow 8 40%
Major Minor
International Journal of Multimedia and Ubiquitous Engineering
Vol.10, No.10 (2015)
324 Copyright ⓒ 2015 SERSC
30KHz
slower joy 1 5%
20people anger 1 5%
fear 3 15%
sorrow 15 75%
Original joy 1 5%
20people anger 2 10%
fear 5 25%
sorrow 12 60%
faster joy 2 10%
20people anger 0 0%
fear 6 30%
sorrow 12 60%
slower joy 0 0%
20people anger 0 0%
fear 7 35%
sorrow 13 65%
Original joy 0 0%
20people anger 0 0%
fear 6 30%
sorrow 14 70%
faster joy 0 0%
20people anger 2 10%
fear 5 25%
sorrow 13 65%
Major Minor
40KHz
slower joy 0 0%
20people anger 0 0%
fear 4 20%
sorrow 16 80%
Original joy 1 5%
20people anger 0 0%
fear 2 10%
sorrow 17 85%
faster joy 0 0%
20people anger 1 5%
fear 4 20%
sorrow 15 75%
slower joy 0 0%
20people anger 0 0%
fear 5 25%
sorrow 15 75%
Original joy 1 5%
20people anger 1 5%
fear 5 25%
sorrow 13 65%
faster joy 1 5%
20people anger 1 5%
fear 7 35%
sorrow 11 55%
Table 4 shows the emotional state classification of male and female subjects, after
listening to ultrasonic stimulus sound sources, which were converted into 3 types (lowest
auditory frequency band: 20 kHz, 30 kHz, and 40 kHz) by using the same stimulus sound
source in the audible frequency bandwidth used in the experiment of Table 2. Table 4
shows the classification results that used the emotional state classification method, and the
reciprocal correction of the distance value in the baseline state, which were suggested in
this study. To exclude the effect caused by the sensory organs' characteristics, the
reciprocal of the distance value of the log scale was applied to the results in Table 4 and
the results are shown in Table 5.
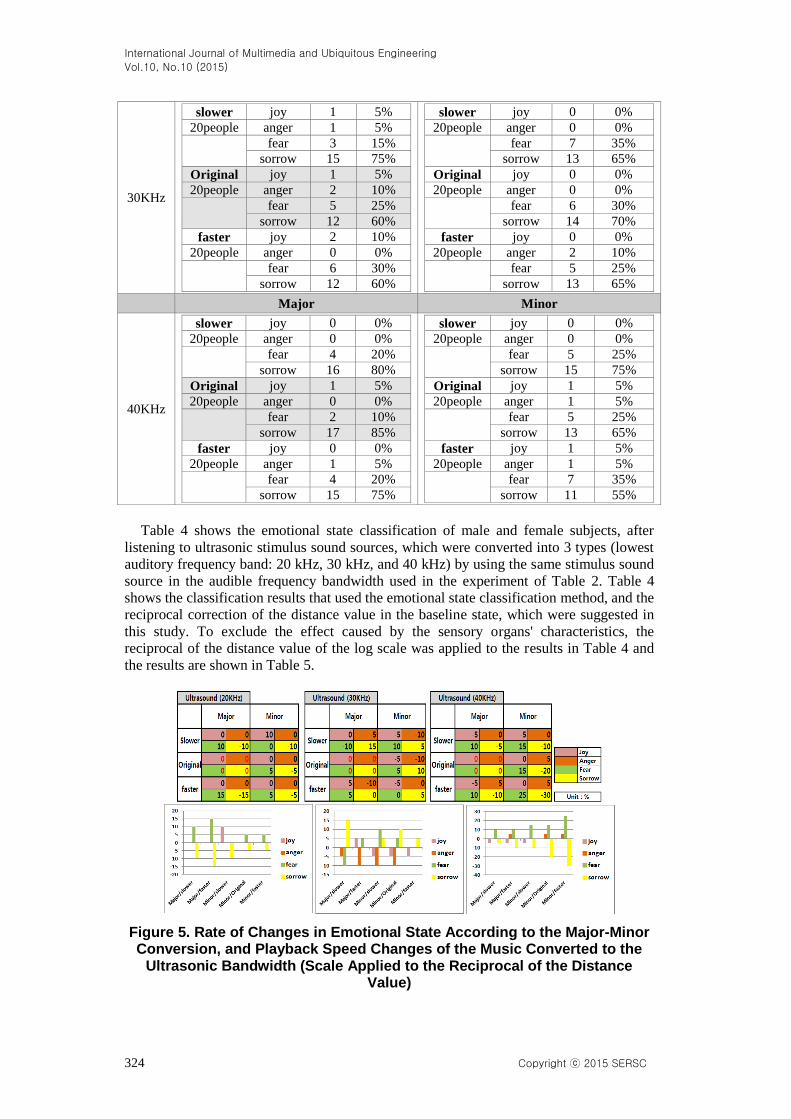
Figure 5. Rate of Changes in Emotional State According to the Major-Minor Conversion, and Playback Speed Changes of the Music Converted to the
Ultrasonic Bandwidth (Scale Applied to the Reciprocal of the Distance Value)
International Journal of Multimedia and Ubiquitous Engineering
Vol.10, No.10 (2015)
Copyright ⓒ 2015 SERSC 325
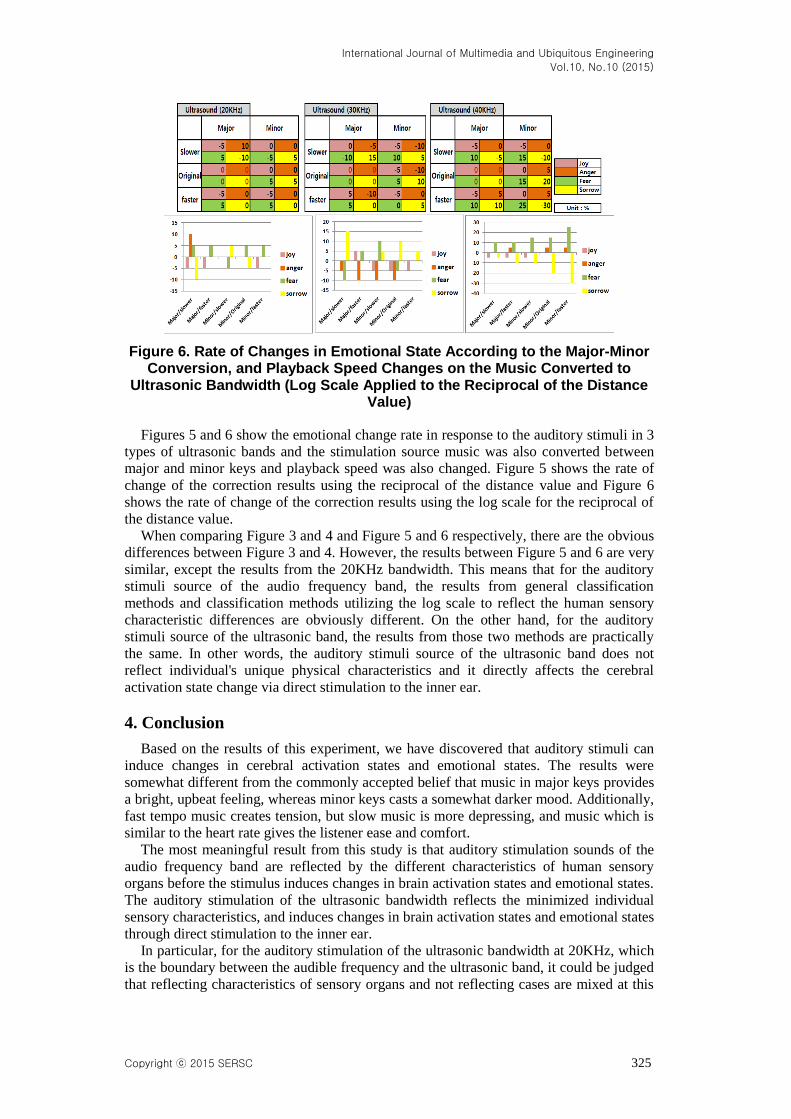
Figure 6. Rate of Changes in Emotional State According to the Major-Minor Conversion, and Playback Speed Changes on the Music Converted to
Ultrasonic Bandwidth (Log Scale Applied to the Reciprocal of the Distance Value)
Figures 5 and 6 show the emotional change rate in response to the auditory stimuli in 3
types of ultrasonic bands and the stimulation source music was also converted between
major and minor keys and playback speed was also changed. Figure 5 shows the rate of
change of the correction results using the reciprocal of the distance value and Figure 6
shows the rate of change of the correction results using the log scale for the reciprocal of
the distance value.
When comparing Figure 3 and 4 and Figure 5 and 6 respectively, there are the obvious
differences between Figure 3 and 4. However, the results between Figure 5 and 6 are very
similar, except the results from the 20KHz bandwidth. This means that for the auditory
stimuli source of the audio frequency band, the results from general classification
methods and classification methods utilizing the log scale to reflect the human sensory
characteristic differences are obviously different. On the other hand, for the auditory
stimuli source of the ultrasonic band, the results from those two methods are practically
the same. In other words, the auditory stimuli source of the ultrasonic band does not
reflect individual's unique physical characteristics and it directly affects the cerebral
activation state change via direct stimulation to the inner ear.
4. Conclusion
Based on the results of this experiment, we have discovered that auditory stimuli can
induce changes in cerebral activation states and emotional states. The results were
somewhat different from the commonly accepted belief that music in major keys provides
a bright, upbeat feeling, whereas minor keys casts a somewhat darker mood. Additionally,
fast tempo music creates tension, but slow music is more depressing, and music which is
similar to the heart rate gives the listener ease and comfort.
The most meaningful result from this study is that auditory stimulation sounds of the
audio frequency band are reflected by the different characteristics of human sensory
organs before the stimulus induces changes in brain activation states and emotional states.
The auditory stimulation of the ultrasonic bandwidth reflects the minimized individual
sensory characteristics, and induces changes in brain activation states and emotional states
through direct stimulation to the inner ear.
In particular, for the auditory stimulation of the ultrasonic bandwidth at 20KHz, which
is the boundary between the audible frequency and the ultrasonic band, it could be judged
that reflecting characteristics of sensory organs and not reflecting cases are mixed at this
International Journal of Multimedia and Ubiquitous Engineering
Vol.10, No.10 (2015)
326 Copyright ⓒ 2015 SERSC
20KHz bandwidth. These results clearly appear through the change rate of emotional
states influenced by auditory stimuli of the ultrasonic bandwidth at 20 KHz in Figures 5
and 6.
Considering the results of this study, when implementing a service to induce changes
in brain activation states and emotional states by using auditory stimuli, it would be more
effective to use auditory stimuli in the ultrasonic band rather than in the audio frequency
band. Since the auditory stimuli in ultrasonic band can be delivered to the brain without
reflecting sensory organ characteristics of each individuals, it does not require
implementing the characteristic functions of a variety of forms and uniform outcomes can
be achieved with consistent algorithms.
Acknowledgements
This work was supported by research grants from the Catholic University of Daegu in
2013
References
[1] E. Ernst, “Intangible risks of complementary and alternative medicine”, J Clin Oncol, vol. 19, no. 8,
(2001), pp. 2365–2366.
[2] C. Xue, A. Zhang, V. Lin, C. Da Costa and D. Story, “Complementary and alternative medicine use in
Australia: a national population-based survey”, J Altern Complement Med, vol. 13 no. 6, (2007), pp.
643–650.
[3] S. W. Anderson, A. Bechara, H. Damasio, D. Tranel and A. R. Damasio, “Impairment of social and
moral behavior related to early damage in human prefrontal cortex”, Nature Neuroscience, vol. 2, no. 11,
(1999), pp. 1032-1037.
[4] S. Park, H. Sim and W. Lee, “Dynamic Game Difficulty Control by Using EEG-based Emotion
Recognition”, IJCA, vol. 7, no. 3, (2014), pp. 267-272.
[5] Davidsin R. J., “Thalamic metabolic rate predicts EEG alpha power in healthy control subjects but not in
depressed patients”, Biological Psychiatry, vol. 45, no. 8, (1999), pp. 943-952.
[6] Hodges J. R., Patterson K., Oxbury S. and Funnell E., “Semantic dementia”, Brain, vol. 115, no. 6,
(1992), pp. 1783-1806.
[7] V. Roy and S. Shukla, “A Survey on Artifacts Detection Techniques for Electro-Encephalography
(EEG) Signals”, IJMUE, vol. 10, no. 3, (2015), pp. 425-442.
[8] Towle V. L., Bolanos J., Suarez D., Tan K., Grzeszczuk R. and Levin D. N., “The spatial location of
EEG electrodes: locating the best-fitting sphere relative to cortical anatomy”, Electroencephalography
and Clinical Neurophysiology, vol. 86, no. 1, (1993), pp. 1-6.
[9] R. Bellucci and D. Schuneider, “Some observations on ultrasonic perception in man”, Ann. Otol. Rhinol.
Laryngol, vol. 71, no. 3, (1962), pp. 719–726.
[10] J. Lim, B. Seo and S. Chun, “Suggestion of a New Brain Reaction Index for the EEG Signal
Identification and Analysis”, IJBSBT, vol. 6, no. 4, (2014), pp. 123-132.
[11] A. V. Haeff and C. Knox, “Perception of ultrasound”, Science, vol. 139, no. 3555, (1963), pp. 590–592.
[12] K. Ohyama, J. Kusakari and K. Kawamoto, “Sound perception in the ultrasonic region”, Acta
Otolaryngologica, vol. 104, no.435, (1987), pp. 73–77.
[13] H. Hosoi, S. Imaizumi, T. Sakaguchi, M. Tonoike and K. Murata, “Activation of the auditory cortex by
ultrasound”, Lancet, vol. 351, no. 9101, (1998), pp. 496–497.
[14] M. B. Kostyunina and M. A. Kulikov, “Frequency characteristics of EEG spectra in the emotions”,
Neuroscience and Behavioral Physiology, vol. 26, no. 4, (1996), pp. 340-343.
[15] J. Shin, M. Kim and S. Lee, “Characteristic Analysis of Auditory Stimulation”, Ubiquitous Science and
Engineering 2015, Jeju, Korea, August 19-21, (2015).
International Journal of Multimedia and Ubiquitous Engineering
Vol.10, No.10 (2015)
Copyright ⓒ 2015 SERSC 327
Authors
Jeonghoon Shin, Address: Dept. of Information Technology
Engineering, Catholic University of Dae-Gu, 330 Geumrak-1Ri
Hauang-Eup Gyeonsan-Si Gyeongbuk, Korea. He received a B.S and
M.S and ph.D.in Electronics Engineering from Sung-kyunkwan
University, Korea in 1991, 1993 and 2004. From 1994 to 2002, Mr.
Shin was an engineer at DACOM R&D Center, where he was
involved in the design and performance analysis of wired and
wireless communication network. From 2003 to 2004, he was an
extraordinary professor at Induk-college, Seoul, Korea. Since March
2006, he has been a professor at Catholic University of Daegu,
Kyungsan, Korea. His current research focuses on Brain Computer
Interface, the five senses recognition and synthesis. He is a member
of TTA, KDISS and ASK. And he is also a member of valuation
committee in IITA. Tel:+82-53-850-2748 E-mail:
Minji Kim, Address: Dept. of Information Technology
Engineering, Catholic University of Dae-Gu, 330 Geumrak-1Ri
Hauang-Eup Gyeonsan-Si Gyeongbuk, Korea. She is at catholic
university of Deagu. She is interested in Human Computer
Interaction.
Tel:+82-10-4474-8566 E-mail : [email protected]
Sojeong Lee, Address: Bugil Academy GLP, 61 Dandae-ro
Shinbu-dong, Dongnam-gu, Cheonan-si, Chungnam-do, 330-941
Bugil Academy, Korea
Education & Work experience: Sojeong Lee is a student at Bugil
Academy GLP in Cheonan, Korea. She is interested in brain
engineering.
Tel: +82-10-8571-7124 E-mail: [email protected]

International Journal of Multimedia and Ubiquitous Engineering
Vol.10, No.10 (2015)
328 Copyright ⓒ 2015 SERSC