Embed Size (px)
Citation preview
Characterising the energy performance of centralised HVAC&R systems in the UK
Article
Accepted Version
Shahrestani, M., Yao, R. and Cook, G. (2013) Characterising the energy performance of centralised HVAC&R systems in the UK. Energy and Buildings, 62. pp. 239-247. ISSN 0378-7788 doi: https://doi.org/10.1016/j.enbuild.2013.03.016 Available at http://centaur.reading.ac.uk/31924/
It is advisable to refer to the publisher’s version if you intend to cite from the work. See Guidance on citing .Published version at: http://dx.doi.org/10.1016/j.enbuild.2013.03.016
To link to this article DOI: http://dx.doi.org/10.1016/j.enbuild.2013.03.016
Publisher: Elsevier
All outputs in CentAUR are protected by Intellectual Property Rights law, including copyright law. Copyright and IPR is retained by the creators or other copyright holders. Terms and conditions for use of this material are defined in the End User Agreement .
www.reading.ac.uk/centaur

CentAUR
Central Archive at the University of Reading
Reading’s research outputs online

1
Characterising the energy performance of centralised HVAC&R
systems in the UK
Mehdi Shahrestania, Runming Yaoa*, Geoffrey K Cooka
aSchool of Construction Management and Engineering, University of Reading,
Whiteknights, PO Box 219, Reading, Berkshire, UK
*Corresponding author: Runming Yaoa
Abstract
Heating, ventilation, air conditioning and refrigeration (HVAC&R) systems account for
more than 60% of the energy consumption of buildings in the UK. However, the effect
of the variety of HVAC&R systems on building energy performance has not yet been
taken into account within the existing building energy benchmarks. In addition, the
existing building energy benchmarks are not able to assist decision-makers with
HVAC&R system selection. This study attempts to overcome these two deficiencies
through the performance characterisation of 36 HVAC&R systems based on the
simultaneous dynamic simulation of a building and a variety of HVAC&R systems
using TRNSYS software. To characterise the performance of HVAC&R systems, four
criteria are considered; energy consumption, CO2 emissions, thermal comfort and
indoor air quality. The results of the simulations show that, all the studied systems are
able to provide an acceptable level of indoor air quality and thermal comfort. However,
the energy consumption and amount of CO2 emissions vary. One of the significant
outcomes of this study reveals that combined heating, cooling and power systems
(CCHP) have the highest energy consumption with the lowest energy related CO2
emissions among the studied HVAC&R systems.
Keywords: HVAC&R system performance, Building energy benchmark, Building
energy modelling, HVAC&R systems, TRNSYS simulation
To cite this article: Mehdi. Shahrestani, Runming. Yao, and Geoffrey K. Cook, Characterising the energy
performance of centralised HVAC&R systems in the UK. Energy and Buildings, 2013. 62(0): p. 239-247.
Link: http://dx.doi.org/10.1016/j.enbuild.2013.03.016

2
1. Introduction
According to the international Kyoto protocol (1997), the UK government is committed
to reduce greenhouse gas emissions by 30% and 80% below the 1990 level respectively
by 2020 and 2050 [1]. It is worth noting that, in the UK, buildings account for more
than 38% and 45% of energy consumption and CO2 emissions respectively [2-4].
Therefore, to achieve these commitments, all new domestic buildings are planned to be
zero carbon by 2016 and non-domestic buildings from 2019 [5]. HVAC&R systems are
responsible for more than 60% of the UK building energy consumption [6]; which
underlines the importance of HVAC&R systems in achieving these commitments.
The national concern regarding the environmental impact of building energy related
CO2 emissions along with increasing demands for indoor environmental quality in one
hand and the variety of HVAC&R systems on the other, highlights the importance of
choosing the most appropriate system for a building. In the building design process,
HVAC&R system selection is conducted in the early stages of a project [7-9]. Decisions
within these stages significantly influence the total building energy performance and
establishes up to 90% of the life time occupants' satisfaction and building running costs
[10]. This strategic decision requires a broad insight into the performance characteristics
of a variety of HVAC&R systems. It should be noted that this study is focused on the
technical aspects of HVAC&R systems and economic aspects are not within the scope
of work in this research.
The open literature reveals the gap in holistic studies on HVAC&R system performance
characterisation [11, 12]. Despite many studies with a very narrow scope which
examined individual topics e.g. the optimisation of HVAC&R control systems and the
simulation/integration of some elements of HVAC&R systems [13-15], few holistic

3
studies have been conducted on HVAC&R system performance characterisation [16-
18]. Energy consumption guide 19 (ECG-19), is one the most cited references on the
characterisation of the building energy consumption and their corresponding CO2
emissions [18]. ECG-19 categorised the office buildings into four main groups. For
each category a breakdown of energy consumption and CO2 emissions are introduced
for both "typical" and "good practice" cases based on surveys of a large number of
occupied buildings. In one study the Chartered Institution of Building Services
Engineers (CIBSE) extended the approach of ECG-19 to other non-domestic buildings
in order to support the requirements of display energy certificates [16]. This was
subsequently updated to the "energy benchmark technical memorandum 46" (TM46) to
simplify the allocation of buildings into different categories [17]. The existing UK
building energy benchmark (TM46) has been reviewed based on the latest Display
Energy Certificate (DEC) records [19]. Despite the valuable results drawn from real
buildings within these three building energy benchmarks [16-18] and also the latest UK
energy benchmark review based on the DEC results [19], none of them effectively
addresses the influence of different HVAC&R systems on building energy performance.
This deficiency has also been observed in other building energy performance
characterisation studies [20, 21]. In most of these studies, survey results did not provide
sufficient details to make a clear distinction between surveyed HVAC&R systems and
their energy consumption [20-22]. Consequently, this deficiency has been coarsely
overcome by assuming a typical HVAC&R system for each building category [18, 20].
Therefore, the aim of this study is to overcome this deficiency through an investigation
of the performance of a variety of HVAC&R systems within a robust framework based
on dynamic simulation of a prototypical office building.
4
2. Research design
In this study, simultaneous dynamic simulation of a typical office building and
HVAC&R systems are adopted to analysis the energy performance of different parts of
HVAC&R systems. The open literature introduces more than twenty simulation
packages for building dynamic performance simulations [23, 24]. Several researches are
conducted using different simulation packages such as TRNSYS, ESP-r, EnergyPlus
and other dynamic simulation tools [23, 24], but in general terms, all of these tools are
validated by well-recognised academic organisations. Crawley et al. [23, 24] have
conducted a comprehensive comparison study for the existing simulation tools. It shows
that Transient System Simulation Tool (TRNSYS) is one of the best options for
HVAC&R system studies by providing more features for HVAC&R systems. In
TRNSYS the components are configured and assembled using a fully integrated visual
interface with ability to develop new components [23, 24]. In terms of software
validation, TRNSYS is one of the listed simulation programs in the Building Energy
Software Tools Directory of the US Department of Energy (DoE) and International
Energy Agency (IEA) [25]. Moreover, several successful studies have been conducted
using this tool [26-30]. Hence, the last Version of TRNSYS simulation package
(Version 17.00.0019) is selected to analyse the dynamic performance of a variety of
HVAC&R systems in this study. In performance evaluation of HVAC&R systems using
TRNSYS, four major criteria are considered within the scope of work in this research.
These criteria include energy consumption, CO2 emissions, thermal comfort and indoor
air quality. In the following sections, a prototypical office building and HVAC&R
systems that are investigated in this research are described in detail.

5
3. Building descriptions
In this study a prototypical daylit cellular office building has been selected to form a
basis for the performance evaluation of a variety of HVAC&R systems. This built form
is chosen because it accounts for more than 67% of office buildings in England and
Wales [31]. The building has four floors with a total floor area of 1920 m2. Room depth
(distance from windows) is considered less than 6m to comply with the definition of
daylit cellular office buildings [32].
To identify the amount of glazing area within the case study building, the ratio of
glazing per floor area (G/F) is assumed as the average values of G/F for cellular office
buildings with different building structures as reported by NDBS project [33]. An
isometric model and typical plan of the case study office building is shown in
.
Figure 1: Isometric model and typical plan of the case study office building. (All
dimensions in meters)
Overall heat transfer coefficient of walls, roof and windows are respectively assumed as
0.28, 0.18 and 1.8 (W/m2.C) [34] and the infiltration rate is set to 0.3 air change per
hour [35]. To achieve an acceptable indoor air quality level, the ventilation rate is set to
10 (L/s.person) [36]. Occupancy density of the prototypical building is assumed to be
10 (m2/person) [35]. For typical office activities, human body sensible and latent heat
rejection are respectively defined as 75 and 55 (W/person) [35]. To achieve an
405
2
4
12

6
illuminance of 300-500 (lx), a power load of 15 (W/m2) is assumed [37]. Finally, the
electrical equipment load is assumed as 200 (W/person) [35]. With regard to the
occupancy pattern, the building is in use only during weekdays between 8 am to 6 pm.
Indoor design temperature is set to 23°C in cooling mode and 22°C during heating
mode. In heating mode, the humidity control is set to 45% relative humidity [35]. It
should be noted that considering a variety of profiles for internal energy loads and
delighting control along with different forms of possible shadings is not within the
scope of this research. The prototypical building and the HVAC&R systems are created
in TRNSYS and simulated using the London-Gatwick weather data file. This data file
has been developed based on a comprehensive meteorological reference (Meteonorm)
used by TRNSYS simulation package [33].
4. HVAC&R systems
In the open literature, there are several different approaches to the categorisation of
HVAC&R systems [16, 38-41]. Among them, CIBSE categorised HVAC&R systems
into three main groups; centralised air systems, partially centralised air/water systems
and local systems [16]. This study is mostly concerned with the energy performance
characterisation of a variety of centralised HVAC&R systems as applied to the case
study building. Three primary and 12 secondary systems which in total form 36
permutations of primary and secondary systems are investigated within this study. The
primary systems include three combinations of heating and cooling systems (Table.1).
The secondary systems include constant air volume (CAV) and variable air volume
(VAV) distribution systems with heat recovery, economiser and terminal reheat units
and provide 12 permutations which are described in Table 2.

7
Table 1: Primary systems.
No. Heating and cooling parts
1 Gas boiler with reciprocating air cooled chiller
2 Gas boiler with absorption chiller with cooling tower
3 Combined heat and power (CHP) with absorption chiller and cooling
tower (CCHP)
Table 2: Secondary systems.
No. Part 1 part 2 part 3
1 Constant air volume (CAV) - -
2 Variable air volume (VAV) - -
3 Constant air volume (CAV) Heat recovery -
4 Variable air volume (VAV) Heat recovery -
5 Constant air volume (CAV) Economiser -
6 Variable air volume (VAV) Economiser -
7 Constant air volume (CAV) - Reheat coil
8 Variable air volume (VAV) - Reheat coil
9 Constant air volume (CAV) Heat recovery Reheat coil
10 Variable air volume (VAV) Heat recovery Reheat coil
11 Constant air volume (CAV) Economiser Reheat coil
12 Variable air volume (VAV) Economiser Reheat coil
The temperature of the supply chilled water (Tschw) and supply hot water (Tshw) for all
primary systems are respectively set to 6°C and 80°C [16] (Figure 2). The energy
efficiency of primary systems are defined based on actual manufacturer information
within the recommended range according to ASHRAE standard 90.1 and British
standard BS/EN:15316 [42, 43]. Table shows the recommended minimum efficiency of
the main primary systems along with the assumed values (based on manufacturer's

8
product specifications) that are taken into account in this study. It should be noted that
the efficiencies mentioned in Table 3 are compulsory indicators that proves the
compliance of equipment with the existing standards [42, 43] and TRNSYS simulates
the HVAC&R systems based on actual full/partial loads.
Boiler
Air
cooled
chiller
Pump
Pump
Tschw
Tshw
Ch
ille
d w
ater
flo
w/r
etu
rnH
ot
wat
er
flo
w/r
etu
rn
C
C
Boiler
Direct fire
absorption
chiller
Pump
Pump
Tschw
Tshw
Ch
ille
d w
ater
flo
w/r
etu
rnH
ot
wat
er
flo
w/r
etu
rnC
C
Pump
coolingtower
C
Back up
Absorption
chiller
Pump
PumpTschw
Tshw
Ch
ille
d w
ater
flo
w/r
etu
rn
Ho
t w
ater
flo
w/r
etu
rn
C
C
Pump
coolingtower
C
PumpTshw
C
TcwTcw
CHP
Boiler
C
Heat DumpPump
Figure 2: Primary systems a) boiler with air cooled chiller, b) boiler with absorption
chiller and cooling tower, c) CHP with absorption chiller and cooling tower
(CCHP).
Table 3: Recommended minimum energy efficiency required and the values assumed in
this study.
System Energy efficiency *
Min requirements [42, 43] This study
Air cooled reciprocating chiller COP≥2.802 COP=3.2
Double effect absorption chiller COP≥1 COP=1.2
Gas boiler Et≥80% Et=85%
Combined heat and power (CHP) Te=73%-95% Te=80%
Notes- Et: Thermal efficiency ; COP: Coefficient of performance, Te: Total
efficiency, *:Energy efficiency under test conditions [42, 43]
In the secondary systems, the air distribution in VAV arrangement provides the required
indoor air temperature by changing the amount of delivered air (Figure a). Heating and
cooling coils control the supply air temperature (Tsa) while the VAV fan changes the air
a) b) c)

9
flow rate. The Indoor temperature moves towards the desired indoor design temperature
by changing the opening fraction of the supply air damper. These changes directly
influence the performance curve of the air distribution system; therefore to avoid either
over or under delivery of the air into the distribution system, the VAV fan keeps the air
distribution system pressure at a set level (Pset). Due to the design pressure loss of the
VAV system, Pset is defined as 450 (Pa) to ensure that required amount of air would be
available in the distribution system at all partial load circumstances. In the case of
utilising reheat coils, additional control would be available to cover the rapid changes
on heating and cooling demands which can not be tracked by the VAV fan. Also, the
heat recovery between exhaust and fresh air streams is an option which has been
investigated within the heating mode. Heat recovery efficiency of the heat recovery unit
is assumed equal to 70%. It should be noted that the performance of heat recovery units
is simulated based on recovery efficiency of the unit together with both the temperature
and the humidity of air streams. Also, an economiser with temperature control
capability is another energy saving option which is used in the cooling mode. A
temperature control economiser achieves the predefined mixed air temperature (Tma)
through the maximum use of the outdoor air when its temperature (Tfa) is below the
return air temperature (Tre). In this study the economiser mixed air temperature (Tma) is
set to 15°C to make use of the free cooling opportunity in the UK.
In the CAV air distribution system (Figure 3b); the fan operates at constant speed. In
order to maintain the desired indoor temperature; heating and cooling coils change the
supply air temperature (Tsa) according to the temperature feedback from the return air
(Tra) (Figure b). Similar to the VAV system, a heat recovery and an economiser option
have been investigated. For both air distribution systems (CAV and VAV), an electrical
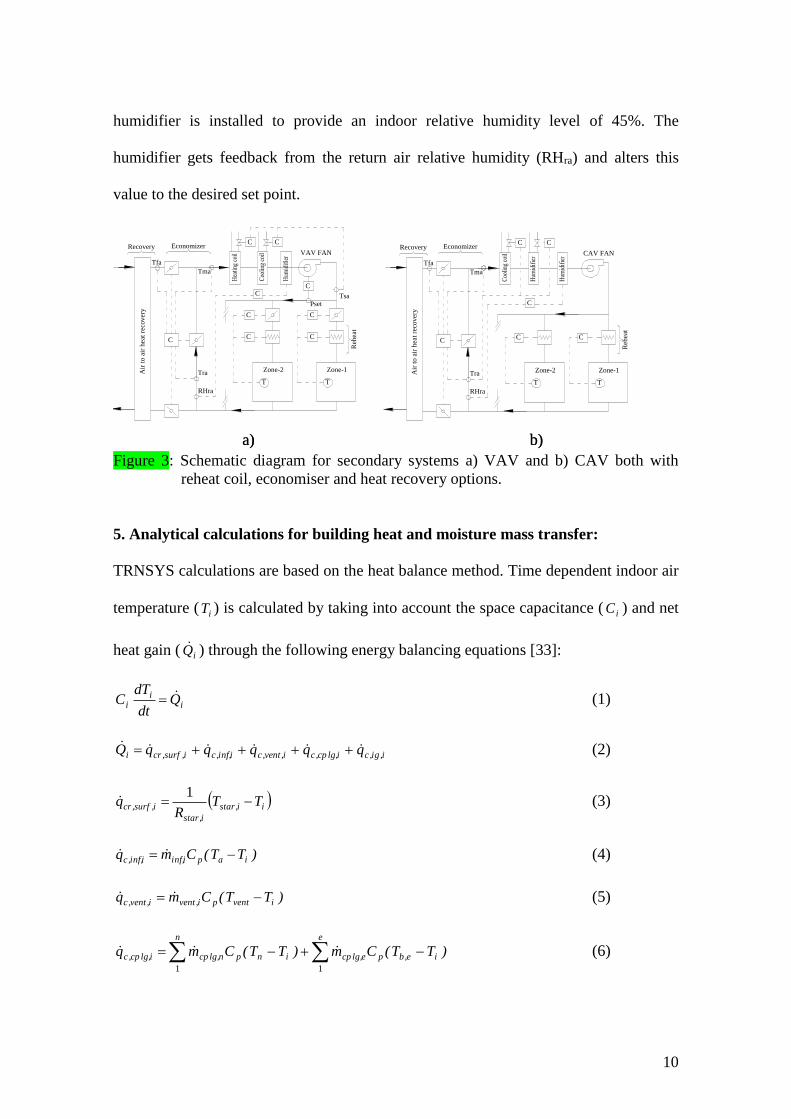
10
humidifier is installed to provide an indoor relative humidity level of 45%. The
humidifier gets feedback from the return air relative humidity (RHra) and alters this
value to the desired set point.
T
VAV FAN
Zone-1
C
C
Tsa
Tma
Air
to
air
hea
t re
cov
ery
C
C
T
Zone-2
C
C
Recovery Economizer
Reh
eat
C
Pset
T
Zone-1
C
C
Tma
Air
to
air
hea
t re
cov
ery
C
C
T
Zone-2
C
Recovery Economizer
Reh
eat
CAV FAN
Tra
Tfa
Tra
Tfa
C
RHra
C
RHra
C
Figure 3: Schematic diagram for secondary systems a) VAV and b) CAV both with
reheat coil, economiser and heat recovery options.
5. Analytical calculations for building heat and moisture mass transfer:
TRNSYS calculations are based on the heat balance method. Time dependent indoor air
temperature ( iT ) is calculated by taking into account the space capacitance ( iC ) and net
heat gain ( iQ ) through the following energy balancing equations [33]:
ii
i Qdt
dTC (1)
i,ig,cilg,cp,ci,vent,ciinf,,ci,surf,cri qqqqqQ (2)
ii,star
i,star
i,surf,cr TTR
q 1
(3)
)TT(Cmq iapiinf,iinf,,c (4)
)TT(Cmq iventpi,venti,vent,c (5)
e
ie,bpelg,cp
n
inpnlg,cpilg,cp,c )TT(Cm)TT(Cmq11
(6)
a) b) a) b)

11
Where, i,surf,crq , iinf,,cq , i,vent,cq , ilg,cp,cq and i,ig,cq represent, the combined (convection
and radiation) heat gain from inside surfaces, the convection heat gain corresponding to
air infiltration, the convection heat gain corresponding to ventilation, the convective
gain due to the air flow from the adjacent airnode or boundary conditions and internal
convective gain respectively. iinf,m , i,ventm , nlg,cpm and elg,cpm are the infiltration mass flow
rate, the ventilation mass flow rate, the air mass flow rate from adjacent spaces and the
air mass flow rate from known boundary surfaces. Finally, Tstar is an artificial
temperature node to calculate parallel energy flow from an internal surface by
convection to the airnode and by radiation to the other surfaces. Also, Rstar is an artificial
conduction resistance to calculate the energy flow from an internal surface to the
airnode [33]. These two parameters are calculated in each simulation time step by taking
into account the following radiation heat flow equation:
gainwall,rw,longw,solig,rw,r qqqqq (7)
Where, w,rq , ig,rq , w,solq , w,longq and gainwall,rq represent, the radiation gain from wall
surfaces, the radiation internal gain, the radiation solar gain, the long-wave radiation
between internal surfaces and the user-specified heat flow to the wall or windows.
The time dependent indoor air humidity ( ) is calculated through the following
moisture balancing equations in an effective capacitance humidity model [33]:
)(mW)(m)(mdt
dM in
n
nlg,cpi,igii,venti,ventiaiinf,i
i,eff
1
(8)
i,airi,eff MRatioM (9)
Where, i,effM and i,airM represent the effective moisture capacitance of the entire room
and the moisture capacitance of the room air respectively. Also, ' Ratio ' represents the

12
ratio between room effective moisture capacitance and room air moisture capacitance
and finally, i,igW represents the internal moisture gain.
6. Mathematical approach for HVAC&R systems performance evaluation:
The mathematical approach for performance evaluation of HVAC&R systems is
introduced here. Firstly, the energy consumption of the systems are evaluated using the
outcome of simultaneous simulation of the HVAC&R systems and the building. It is
defined according to the following equation:
j
jECTEC1
(11)
Where TEC is the annual energy consumption of the entire HVAC&R system and ECJ
represents the energy consumption of the jth HVAC&R process. Also, the energy
related CO2 emissions of HVAC&R systems are calculated by considering CO2
emission factors of gas and electricity from the UK National Grid, equal to 0.19 and
0.55 (kg CO2/kWh) respectively [17].
Essentially the main goal of utilising HVAC&R systems is to provide acceptable indoor
environmental quality. In this study user satisfaction is measured by considering the
thermal comfort and the indoor air quality according to the model introduced by
TRNSYS [33] based on the Standard BS EN 15251 [44] . This standard categorised the
indoor air quality and thermal comfort into four main groups (Table 4). The first three
groups are recommended; but, the forth category is only acceptable if it occurs for a
limited time in a year [44].

13
Table 4: Thermal comfort and indoor air quality categories [44].
Category
(Rating grades)
Thermal comfort Indoor air quality
Predicted Percentage
Dissatisfied (PPD)
Predictive mean
vote (PMV)
CO2 concentration
(PPM)
1 PPD< 6% -0.2<PMV<+0.2 PPM<750
2 PPD < 10% -0.5<PMV<+0.5 PPM<900
3 PPD < 15% -0.7<PMV<+0.7 PPM<1200
4 PPD >= 15% -0.7>=PMV>=0.7 PPM>=1200
Total grade of thermal comfort (TGTC) for all spaces in a year is taken into account to
measure the level of comfort according to the following equations:
i h
h,i
i
h,i
h
h,i
X
)XTRG(
TGTC
1 1
1 1 (12)
Where TRGi,h and Xi,h respectively represents the thermal comfort rating grade
(according to Table 4) and the number of occupants in the space i at hour h. Using a
similar approach, the total grade for indoor air quality (TGIAQ) for all spaces in a year
is used to measure the level of indoor air quality according to the following equations:
i h
h,i
i
h,i
h
h,i
X
)XIRG(
TGIAQ
1 1
1 1 (13)
Where IRGi,h and Xi,h respectively represent the indoor air quality rating grade
(according to Table 4), and the number of occupants in the space i at hour h.

14
7. Results
The simultaneous dynamic simulation of the building and a variety of HVAC&R
systems culminated in a series of results giving the breakdown of end-use energy
consumption and amount of energy related CO2 emissions produced by the different
HVAC&R systems. Also, it provides measures for thermal comfort and indoor air
quality associated with HVAC&R systems which are shown in Table 5.
Table 5 demonstrates the annual occurrence percentage of the studied HVAC&R
systems in each category of thermal comfort and indoor air quality as introduced in BS
EN 15251 [44]. This table highlights that the studied HVAC&R systems performed
within the first three recommended categories of thermal comfort and indoor air quality
for 96-100% of the time within a year (Table 5). Therefore, the energy consumption and
CO2 emissions analyses would be more indicative for the characterisation of the variety
of HVAC&R systems.
Table 5: Annual occurrence percentage of the HVAC&R systems performance under
each category of thermal comfort and indoor air quality.
Category
(Rating grades)
BS EN 15251[44]
Total grade thermal comfort
(TGTC) occurrence percentage
in each category
Total grade indoor air quality
(TGIAQ) occurrence
percentage in each category
1 61-73% 31-52%
2 84-100% 94-100%
3 96-100% 96-100%
4 0-4% 0-4%
In order to present the results in a format similar to the breakdown of energy used in the
UK building energy benchmarks [16, 18], the energy consumption of HVAC&R
systems are classified into five main groups:

15
1. Energy use for cooling
2. Central heating energy consumption
3. Humidification energy use
4. Auxiliary energy including energy required for running fans and pumps
5. Energy consumption for reheat process
Figures 4, 5 and 6 demonstrate the energy consumption and energy related CO2
emissions of the 36 permutations of primary and secondary HVAC&R systems. These
results are normalised with respect to building floor area in order to be comparable with
existing building energy benchmarks [16-18]. For the same reason, these energy
consumptions results represent the real demand of building to natural gas and electricity
rather than representing the equivalent primary energy used in building.
a) b)
Figure 4: First primary systems (gas boiler with reciprocating chiller) a: energy
consumption b: energy related CO2 emissions.

16
a) b)
Figure 5: Second primary systems (gas boiler with absorption chiller) a: energy
consumption b: energy related CO2 emissions.
a) b)
Figure 6: Third primary systems-CCHP (absorption chiller with CHP) a: energy
consumption b: energy related CO2 emissions.
To validate the results, ECG-19 [18] has been used because it is a widely cited reference
in the most of the building energy benchmarking studies in the UK [16, 17, 45]. In this
benchmark, energy consumption and CO2 emissions of a standard air conditioned
building are described as two levels "good practice" and "typical". The reference
building is assumed to be equipped with an air cooled chiller, a gas boiler and a VAV
air distribution system [18]. This assumption is similar to the combination of the first

17
primary system (Table ) and the second secondary system (Table 2) which has been
investigated in this study.
Simulation results reveal that both the energy consumption and CO2 emissions of this
system are within the ECG-19 [18] ranges and about 15% higher than the good practice
(Figures 4).
According to the recommendation of building energy benchmarking references [16,
18], performance of office buildings with a HVAC&R systems other than the mentioned
standard system, should be appraised by their total CO2 emissions. This approach has
been adopted in this study to compare the simulated performance of a variety of
HVAC&R systems with the standard benchmark building in Figures 4b, 5b and 8.
For HVAC&R systems which are linked to a CCHP system (third primary system), the
amount of generated electricity (Figure 7) is also needed to compare the results. It
should be noted that, regarding to the variation of building energy demand under
different secondary systems, the CHP unit works with different partial load regimes and
generates different amount of electricity.
The CHP unit of the CCHP system reduces the dependency of the building on the
National Grid because of the amount of generated electricity. Consequently, the
corresponding amount of CO2 emissions from national grid electricity should be
extracted from the CO2 emissions of the systems linked to the CCHP system (Figure 6b)
to provide the actual CO2 emissions which is shown in (Figure 8).

18
Figure 7: The generated electricity by the third primary system (CCHP)
Figure 8: The actual energy related CO2 emissions of the third primary system (CCHP)
by considering the amount of generated electricity.
8. Discussions
To analysis the results, two approaches are adopted; a detailed comparison and a holistic
approach. In the detailed approach, when comparing the total energy consumption of
systems (Figures 4a, 5a and 6a) it is revealed that, apart from the type of primary
systems, auxiliary and total energy consumption of the HVAC&R system equipped with
VAV air distribution (even secondary systems) are respectively 15-35% and 5-15%
lower than corresponding CAV air distribution (odd secondary systems). This trend is

19
also true for secondary systems linked to the CCHP system after taking into account the
amount of electricity generation by the CHP unit (Figure 7). In addition, systems
connected to the VAV air distribution system use slightly higher energy to meet the
required heating and cooling demands compared with CAV air distribution. This has
also been observed by Korolija et al. [45]. It is believed that this trend is mainly because
of the higher air flow rate in CAV systems which results in higher heat dissipation to
the supply air from fan units [45]. In addition, this study reveals that VAV systems are
able to track the desired indoor temperature better than CAV systems. In the other
words, the closer to the indoor desired temperature, the more energy would be used.
In Figures 4a, 5a and 6a, comparing the energy consumption of secondary systems
numbers 3, 4, 9 and 10 respectively with numbers 1, 2, 7 and 8 demonstrates that
HVAC&R systems which are equipped with a heat recovery unit use 12-28% less
energy to provide the required heating regardless of the type of primary systems. Using
the same approach, when comparing the energy consumption of the secondary systems
numbers 5, 6, 11 and 12 respectively with systems numbers 1, 2, 7 and 8 reveals that
using an economiser in the secondary systems reduces the energy consumption for
cooling by 33-65%. This is mainly because of the mild weather condition for London in
summer. Also, Figures 4a, 5a and 6a reveal that using reheat coil does not significantly
affect the total energy use when comparing systems number 1-6 with systems number 7-
12 regardless of the type of primary system.
Analysis of the results using a holistic approach, comparison of energy consumption
results (Figures 4a, 5a and 6a) reveals that reciprocating chillers with boiler (first
primary system) has the lowest and the CCHP system (third primary system) has the
highest total energy demand when connected to an identical secondary system. Also, the

20
energy related CO2 emissions of HVAC&R systems (Figures 4b and 5b) shows that,
even though the energy consumption of secondary systems linked to an absorption
chiller with a gas boiler is higher than the corresponding secondary systems linked to a
reciprocating chiller with a gas boiler (Figure 4a and 5a), the CO2 emissions of the
former are not significantly higher than the latter (Figure 4b and 5b).
The CO2 emissions shown in Figure 8 reveal that utilising a CCHP system reduces the
amount of CO2 emissions up to 30% compared to the other systems by the simultaneous
generation of heating, cooling and power. This is based on the difference between the
CO2 emission factor of natural gas and electricity delivered by National Grid [17].
In summary, among the studied systems, higher and lower energy demands are
associated with the CCHP system (Figure 6a) when linked to the VAV system with
reheat (eighth secondary system) and reciprocating chiller with a gas boiler (Figure 4a)
when linked to the VAV system with heat recovery unit (fourth secondary system)
respectively.
In terms of CO2 emissions, the best performance is delivered by the CCHP system
(Figure 8) when linked to the VAV system with heat recovery (fourth secondary
system); whereas, the highest pollution is produced by the absorption chiller and boiler
(Figure 5b) when linked to the CAV system with terminal reheat coils (seventh
secondary system).
With the same approach proposed in the ECG19 [18], the outcomes of this research
could be extended into the other climates using degree day theory [46, 47]. This
provides the opportunity to use the outcome of this research to the other cities
regardless of their geographical location.

21
8. Conclusions
The aim of this study was to enhance the existing building energy benchmarks approach
in the performance characterisation of a variety of HVAC&R systems. The
investigation of the energy consumption and CO2 emissions of different HVAC&R
systems together with the consideration of the achieved levels of indoor air quality and
thermal comfort, are further strengths of this study.
A prototypical office building has been used as a case study; specifications of the
building are defined based on the outcome of previous studies of non-domestic building
stock in the UK and the latest regulations. Results of this study show that, in the
secondary part of HVAC&R systems, utilising the VAV system (instead of CAV
system) reduces the auxiliary energy consumption by 15-35% which is equal to a 5-15%
reduction in the total energy consumption of the building. In addition, the amount of
energy used to meet the heating and cooling demands in VAV systems is slightly higher
than in CAV systems. It has also shown that utilising a heat recovery unit and an
economiser respectively reduces the energy used for heating by 12-28% and the energy
used for the required cooling by 33-65%.
In the primary part of HVAC&R systems, the reciprocating air cooled chiller with a gas
boiler provides the lowest total energy consumption and the CCHP system has the
highest energy demand. Despite the highest energy demand of the CCHP system, the
total CO2 emissions of the system is significantly lower than the other two primary
systems.
Finally, the results of this study on the performance evaluation of 36 HVAC&R systems
can be used as a complementary part of the existing building energy benchmarks in
order to enhance the performance characterisation assessment of a variety of HVAC&R

22
systems. This is especially applicable to the decision making involved in HVAC&R
system selection carried out in the early stages of a project design process.
Nomenclature
C : Space capacitance (kJ/K)
pC : Specific heat capacity (kJ/kg.K)
IRG : Indoor air quality rating grade (-)
M : Moisture capacitance (kg)
m : Mass flow rate (kg/hr)
P : Pressure (pa)
Q : Net heat gain (kJ/hr)
q : Heat transfer (kJ/hr)
R : Thermal resistance (K.hr/kJ)
Ratio : Moisture of air to total moisture of space 1-10 (kg/kg)
RH : Relative humidity (Percent)
T : Temperature (°C)
t : Time(s)
TEC : Total energy consumption (kJ/hr)
TGIAQ : Total rating grade for indoor air quality (-)
TGTC : Total rating grade for thermal comfort (-)
TRG : Thermal comfort rating grade (-)
W : Moisture flow (kg/hr)
X : Number of occupants (No.)

23
Greek style
: Humidity ratio (kg/kg)
Subscripts
a: Ambient
b: Boundary surface
c: Convection
cr: Convection and radiation
cplg: Internal zone/air node coupling
e: Number of adjacent boundary surfaces
eff: Effective
fa: Fresh air
gr: Internal gain
h: Hour 'h'
i: Space 'i'
ig: Internal gain
inf: Infiltration
j: the jth energy consuming process within HVAC&R system
long: Long-wave radiation
ma: Mixed air
n: Number of adjacent space/air node
r: Radiation heat transfer
re: Return air
sa: Supply air

24
schw: Supply chilled water
set: Set-point
shw: Supply hot water
sol: Solar radiation gain through zone windows
star: An artificial node to calculate parallel energy flow
surf: Surface
vent: Ventilation
w: Wall
wall-gain: Predefined wall/win gain
25
References
1. DECC, Climate change act 2008. 2008, London: Department of Energy and
Climate Change.
2. DECC, Digest of UK energy statistic. 2010, London: Department of Energy and
Climate Change.
3. CT, Building the future, today. 2009, Carbon Trust: London.
4. HC, Programmes to reduce household energy consumption. 2009, House of
Commons: London.
5. DCLG, Definition of zero caron home and non-domestic buildings. 2008,
Department of Communities and Local Government: London.
6. DTI, Energy consumption in the UK. 2010, Department of trade and industry:
London.
7. Parsloe, C. and L.J. Wild, Project management handbook for building services.
1998, Bracknell: Building Services Research and Information Association.
8. Phillips, R., Plan of work: Multi-disciplinary services. RIBA. 2008, London: Royal
Institute of British Architects.
9. Potter, M., Planning to build? 1995, London: Construction Industry Research and
Information Association.
10. Elovitz, D.M., Selecting the right HVAC system. ASHARE Journal, 2002. 44(1): p.
24-30.
11. Bichiou, Y. and M. Krarti, Optimization of envelope and HVAC systems selection
for residential buildings. Energy and Buildings, 2011. 43(12): p. 3373-3382.
12. Lombard, L.P., J. Ortiz, and I.R. Maestro, The map of energy flow in HVAC
systems. Applied energy, 2011. 88(12): p. 5020-5031.

26
13. Fong, K., V. Hanby, and T. Chowa, HVAC system optimization for energy
management by evolutionary programming. Energy and Buildings, 2006. 38(3): p.
220-231.
14. Mossolly, M., K. Ghali, and N. Ghaddar, Optimal control strategy for a multizone
air conditioning system using a genetic algorithm. Energy 2009. 34(1): p. 58-66.
15. Shahrestani, M. and R. Yao. An integrated dynamic whole life costing analysis for
air distribution systems. in ICAE 2011. 2011. Perugia, Itally: Third International
Conference on Applied Energy.
16. CIBSE, Energy efficiency in buildings-Guide F. 2004, Chartered Institution of
Building Services Engineers: London.
17. CIBSE-TM46, Energy benchmarks. 2008, London: Chartered Institution of
Building Services Engineers.
18. ECG-19, Energy consumption guide 19: Energy use in offices. 2000, London: The
Government's Energy Efficiency Best Practice programme.
19. Bruhuns, H., et al., CIBSE review of energy benchmarks for display energy
certificates. 2011, Chartered Institution of Building Services Engineers: London.
20. Brigges, R.S., D.B. Crawley, and J.S. Schliesing, Energy requirements of office
buildings, vol-1. 1992, Battelle: Pacific Northwest Laboratory for Gas Research
Institute.
21. Torcellini, P., et al., DOE Commercial building benchmark models. 2008,
California: National Renewable Energy Laboratory.
22. Huang, J., et al., 481 prototypical commercial buildings for 20 urban market areas.
1991, Berkeley, California: Lawrence Berkeley National Laboratory.

27
23. Crawley, D.B., et al., Contrasting the capabilities of building energy performance
simulation programs. Building and Environment, 2008. 43: p. 661-673.
24. Crawley, D., et al., Contrasting the capabilities of building energy performance
simulation programs. 2005: US Department of Energy,University of Strathclyde
Energy Systems Research Unit, University of Wisconsin Solar Energy Laboratory,
National Renewable Energy Laboratory.
25. Neymark, J. and R. Judkoff, Building Energy Simulation Test and Diagnostic
Method for Heating, Ventilation, Air Conditioning Equipment Models-HVAC
BESTEST. 2004, International Energy Agency SHC Task22: Building Energy
Analysis Tools, NREL Report TP-550-36754.
26. Cuadros, F., et al., A simple procedure to size active solar heating schemes for low-
energy building design. Energy and Buildings, 2007. 39(1): p. 96-104.
27. Macias, M., et al., Application of night cooling concept to social housing design in
dry hot climate. Energy and Buildings, 2006. 38(9): p. 1104-1110.
28. Pakanen, J. and S. Karjalainen, Estimating static heat flows in buildings for energy
allocation systems. Energy and Buildings, 2006. 38(9): p. 1044-1052.
29. Martı́nez, P.J., A. Garcı́a, and J.M. Pinazo, Performance analysis of an air
conditioning system driven by natural gas. Energy and Buildings, 2003. 35(7): p.
669-674.
30. Hasan, A. and K. Sirén, Theoretical and computational analysis of closed wet
cooling towers and its applications in cooling of buildings. Energy and Buildings,
2002. 34(5): p. 477-486.

28
31. Steadman, P., The non-domestic building stock of England and Wales: type,
numbers, sizes and ages, in Structure and style conserving 20th century buildings,
M. Stratton, Editor. 1997, E & FN Spon: York. p. 49-72.
32. Steadman, P., et al., A classification of built forms. Environmental and Planning B:
Planning and Design, 2000. 27(1): p. 73-91.
33. Klein, S., et al., TRNSYS 17: A Transient System Simulation Program. 2009, Solar
Energy Laboratory, University of Wisconsin: Wisconsin.
34. DCLG, Building regulations-conservation of fuel and power: Part L. 1995,
London: Department for Communities and Local Government.
35. CIBSE, Environment design-CIBSE guide A. 2006, Chartered Institution of
Building Services Engineers: London.
36. HMGovernment, Building regulations-ventilation: Part F. 2010, Her Majesty’s
Stationery Office: London.
37. SLL, Code for lighting CD-ROM. Vol. CIBSE. 2009, London: Society of Light and
Lighting.
38. ASHRAE, ASHRAE handbook-HVAC systems and equipment. 2008, Atlanta:
American Society of Heating, Refrigeration and Air-conditioning Engineers.
39. Greeno, R., Building services, technology and design. 1997, London: Longman &
CIOB.
40. GPG-71, Selecting air conditioning systems: A guide for building clients and their
advisers. 1993, London: Building Research Energy Conservation Support Unit.
41. Jones, W.P., Air conditioning applications and design. Second ed. 1998, Oxford:
Butterworth Heinemann.

29
42. BS/EN:15316-4-4, Heating systems in buildings-Method for calculation of system
energy requirements and system efficiencies-Part 4-4: Heat generation
systems,building-integrated cogeneration systems BS EN 15316-4-4. 2007,
British/European Standard.
43. ASHRAE, ANSI/ASHRAE/IESNA Standard-90.1, Energy standard for buildings
except low-rise residential buildings. ANSI/ASHRAE/IESNA 2010, Atlanta:
American Society of Heating Refrigerating and Air-conditioning Engineers.
44. BS/EN:15251, Indoor environmental input parameters for design and assessment
of energy performance of buildings addressing indoor air quality, thermal
environment, lighting and acoustics. 2007, London: British/European Standard.
45. Korolija, I., et al., Influence of building parameters and HVAC systems coupling on
building energy performance. Energy and Buildings, 2011. 43(6): p. 1247-1253.
46. DETR, Introduction of energy efficiency in offices. 1998, Department of the
Environment, Transport and the Regions, Best Practice Programme: London.
47. CIBSE-TM41, Degree-days theory and application. 2006, London: Chartered
Institution of Building Services Engineers.