Embed Size (px)
Citation preview

Simona Regenspurg
Characterisation of Schwertmannite -
Geochemical Interactions with Arsenate and Chromate
and Significance in Sediments of Lignite Opencast Lakes
Charakterisierung von Schwertmannit –
Geochemische Wechselwirkungen mit Arsenat und Chromat
und Bedeutung in Sedimenten von Restseen des Braunkohletagebaus

Simona Regenspurg
Characterisation of Schwertmannite -
Geochemical Interactions with Arsenate and Chromate
and Significance in Sediments of Lignite Opencast Lakes
Dissertation aus dem
Lehrstuhl für Hydrologie
der Fakultät für Chemie, Biologie und Geowissenschaften,
der Universität Bayreuth

Promotionsgesuch eingereicht am 10.04.2002
Vollständiger Abdruck der von der Fakultät für Biologie, Chemie undGeowissenschaften der Universität Bayreuth zur Erlangung des akademischen
Grades eines Doktors des Naturwissenschaften eingereichte Dissertation.
Wissenschaftliches Kolloquium am 31.10.2002
1. Gutachter Professor Dr. S. Peiffer2. Gutachter Professor Dr. F. Seifert
Table of Contents
I
TABLE OF CONTENTS
LIST OF TABLES IV
LIST OF FIGURES V
LIST OF ABBREVIATIONS AND DEFINITIONS VII
ABSTRACT VIII
KURZFASSUNG XI
I. INTRODUCTION1. STATE OF THE ART 1
2. OBJECTIVES 3
3. ARRANGEMENT OF THIS WORK 3
II. GEOCHEMICAL INTERACTIONS BETWEENSCHWERTMANNITE, CHROMATE AND ARSENATE
1. MOTIVATION TO INVESTIGATE ARSENATE AND CHROMATE 6
2. EFFECTS OF ARSENATE AND CHROMATE INCORPORATION ON THE
SCHWERTMANNITE STRUCTURE 8
2.1. Introduction 82.1.1. Schwertmannite Structure and Formation 82.1.2. Investigated Oxyanions 11
2.2. Materials and Methods 132.2.1. Mineral Synthesis 132.2.2. Analytical Methods 142.2.3. Stability Experiment 142.2.4. Adsorption Experiment 152.2.5. Natural Specimens 16
2.3. Results 172.3.1. X-Ray Diffraction Data 172.3.2. Processes and Products of Schwertmannite Synthesis 192.3.3. Changes in Schwertmannite Suspensions over Time at pH 2 and 4 24
- Release of Iron, Sulfate, Arsenate and Chromate 24- Variation of the Crystal Structure 24
2.3.4. Adsorption Capacity for Arsenate and Chromate 262.3.5. Enrichment of As and Cr in Natural Schwertmannite 27
2.4. Discussion 282.4.1. Tunnel -Sulfate, -Arsenate or -Chromate in Schwertmannite 282.4.2. Solid Solution or Coprecipitation of a Secondary Phase 29
- Substitution of Sulfur in Minerals 29- Structure and Structural Changes of Schwertmannite and its Solid Solutions 29- Formation of Schwertmannite and Substitution Affinities 31
2.4.3. Influence of Arsenate and Chromate on Schwertmannite Stability 332.4.4. Adsorption Process 36
2.5. Conclusions 38

Table of Contents
II
3. A FTIR SPECTROSCOPICAL STUDY TO EXPLAIN BONDING STRUCTURES
OF OXYANIONS IN SCHWERTMANNITE
3.1. Introduction 393.2. Materials and Methods 413.3. Results 433.4. Discussion 46
3.4.1. Sulfate bound to Schwertmannite 463.4.2. Chromate bound to Schwertmannite 473.4.3. Arsenate bound to Schwertmannite 48
3.5. Conclusions 50
4. INCORPORATION OF AS(III) IN SCHWERTMANNITE
4.1. Introduction: Significance of Arsenite 514.2. Materials and Methods 524.3. Results and Discussion 53
4.3.1. Arsenite in the AMD Water of the Saalfelder-Feengrotten 534.3.2. Arsenite associated with Schwertmannite: Coprecipitation and Adsorption 534.3.3. Distinction of the Oxidation State of Arsenic by FTIR Spectroscopy 54
5. MOBILIZATION OF ARSENATE AND CHROMATE DURING
MICROBIAL REDUCTION OF SCHWERTMANNITE
5.1. Introduction 565.2. Materials and Methods 57
5.2.1. Preparation of Schwertmannite Specimens 575.2.2. Microbial Reduction of Schwertmannite Samples 575.2.3. Analytical Techniques 58
5.3. Results 585.3.1. Characterization of uninoculated Schwertmannite Samples 585.3.2. Microbial Reduction of Schwertmannite Samples 615.3.3. Effect of microbial Fe(III) Reduction on the Release of Oxyanions 62
5.4. Discussion 625.5. Conclusions 64
6. SURFACE CHARACTERISTICS OF SCHWERTMANNITE
6.1. Surface- Size, -Morphology and -Charge 656.1.1. Introduction 656.1.2. Materials and Methods 666.1.3. Results and Interpretation 68
- Particle Morphologie and Surface Size 68- Surface Charge and Point of Zero Charge 69
6.2. Acid-Base Titration 716.2.1. Introduction: Adsorption of Arsenate and Chromate 716.2.2. Method: Batch Experiment 736.2.3. Results and Discussion 74
- Titration Curves 76- Adsorption Isotherms 80
6.3. Summary and Discussion 81

Table of Contents
III
III. FORMATION AND TRANSFORMATION OFSCHWERTMANNITE IN SEDIMENTS OF ACIDLIGNITE OPENCAST LAKES
1. INTRODUCTION 83
2. MATERIALS AND METHODS 852.1 Study Sites 852.2. Sampling 862.3. Analytical Methods 872.4. Geochemical Modeling 892.5. Synthetic Samples 902.6. Stability Experiment 90
3. RESULTS 913.1. Hydrochemistry of Acidic Mining Lakes (AML) 913.2. Composition of the Upper Sediment Layers 933.3. Colloid Analysis of Surface Waters 963.4. Depth-Dependent Alteration of the Sediment Composition (ML 77) 963.5. Synthetic Schwertmannite 973.6. Stability of Schwertmannite in Dependence on Time 97
4. DISCUSSION 994.1. Occurrence of Schwertmannite in Acidic Mining Lakes (AML) 994.2. Processes regulating the mineralogy of iron in AML 994.3. The Regulation of the pH in AML 104
5. CONCLUSIONS 106
IV. SUMMARY AND CONCLUSIONS 107
V. REFERENCES 109
ACKNOWLEDGEMENTS 115
APPENDIX
A) XRD-pattern Fe(III) hydroxides containing sulfate and/ or phosphate
B) As and Cr in precipitates and in water samples of 2 former mines
C) FTIR spectra of the schwertmannite-stability experiments (II.2 and III.)
D) Scanning electron micrographs of synthetic Fe(III) precipitates
E) Acid-base titration: data of II.6.2
F) Surface water analysis of the mining lakes
G) PhreeqC: some calculated species in surface waters of the mining lakes
H) Ultrafiltration
I) Schwertmannite stability: Release of sulfate and iron during 362 days

List of Tables
IV
LIST OF TABLES
Tab. II.1-1 Selection of some ecological-relevant characteristics of arsenic and chromium. 7Tab. II.2-1 Crystallographic cell parameters of schwertmannite, akaganéite, goethite and
chromated schwertmannite (sample Sh-Cr-10). 10Tab. II.2-2 X-ray diffraction data of akaganéite and schwertmannite (Cornell & Schwertmann,
1996) compared to chromated schwertmannite (Sh-Cr-10); measured by H. Stanjek (TU-München). 11
Tab. II.2-3 Ionic charge and radius of certain anions (Wilkinson, 1987; Gmelin, 1954). 12Tab. II.2-4 Schwertmannite-synthesis experiments:
A) Precipitates with schwertmannite structure produced by “synthesis in Fe(III)solutions”.B) Precipitates with no definable structure produced by “synthesis in Fe(III)solutions”.C) Precipitates with schwertmannite structure produced by the “oxidative synthesis”.
222223
Tab. II.2-5 Composition of the suspensions kept at constant pH of 2 or 4 in the beginning and inthe end of the stability experiment. 24
Tab. II.2-6 Schwertmannite adsorption-capacity (maximum value) for arsenate and chromate,corresponding pH and release of sulfate in dependence on the concentrations of adsorbateand adsorbent. 26
Tab. II.2-7 Range of As- and Cr-concentrations determined in AMD waters and in associatedschwertmannite containing precipitates sampled in 2 former mines. 27
Tab. II.2-8 Surface complexation constants of anions complexed with hydrous ferric oxide(Dzombak & Morel, 1990). 33
Tab. II.2-9 Calculation of the ionic activity product (IAP) of schwertmannite in dependence onits composition (reaction based on Bigham et al., 1996). 35
Tab. II.3-1 Position of absorption bands in the FTIR spectrum of schwertmannite: Measureddata compared to literature data (Bigham et al., 1990). 40
Tab. II.3-2 Composition of the sample-synthesis solution. 41Tab. II.3-3 IR absorption-band position of sulphate, arsenate and chromate in different phases.
Measured data compared to literature data and interpretation. 50
Tab. II.4-1 As(III) and As(V) concentrations in the AMD water of the Saalfelder-Feengrotten. 53Tab. II.5-1 Composition of the synthesis solution and of the solid schwertmannite specimens. 57Tab. II.6-1 Specific surface area (mean value and standard deviation s) of schwertmannite (Sh)
in dependence on the oxyanion content and of goethite (Gt). 68Tab. II.6-2 pHiep of schwertmannite and goethite in dependence on the oxyanion content. 71Tab. II.6-3 pHpzc of goethite determined from curves of acid-base titration (appendix E) in
dependence on adsorbate- and adsorbent-concentration. 76
Tab. III-1 Site description of 18 AML (Peine, 1998; LMBV, 1997, Brand, 2001). 86Tab. III-2 Equations to determine the solubility-product and the Fe(III) activity of
schwertmannite (Sh), ferrihydrite (Fh), K-jarosite (Jt) and goethite (Gt).90
Tab. III-3 Hydrochemical parameter of ML surface water samples, taken 1 m below surface insummer 2000 (Brand, 2001) and in summer 1997 (ML 77, Peine, 1998).
91
Tab. III-4 Identification of iron minerals in the upper sediment layer of AML by XRD, FTIRspectroscopy and Fe:S ratio in the oxalate-extractable fraction.
95
Tab. III-5 Calculation of pε-values of the minerals ferrihydrite (Fh), K-jarosite (Jt) andgoethite (Gt). The formula were created by equating the mineral-dissolution formula (TableIII-2) and the oxidation of Fe2+ (Fe2+ à Fe3+ + e- log K = -13).
100
Tab. III-6 Calculation of pH as result of an oxidation of a Fe(II) solution. 105

List of Figures
V
LIST OF FIGURES
Fig. II.1-1 Coordination of the molecules chromate (or sulfate) and arsenate (or phosphate). 6Fig. II.2-1 Powder X-ray diffraction pattern of synthetic schwertmannite and akaganéite. 8Fig. II.2-2 Schematic structure model of akaganéite (Stanjek, unpubl. in Cornell &
Schwertmann, 1996) and schwertmannite. 9Fig. II.2-3 Location map of the sampling sites: The two former mines “Saalfelder Feengrotten”
in Germany (D) and “Prybyslav” in Czech Republic (Cz). 16Fig. II.2-4 X-ray powder diffraction pattern of samples, synthesised with increased As:S ratio
in the synthesis solutions. 17Fig. II.2-5 X-ray powder diffraction pattern of schwertmannite containing sulphate (above) and
chromate (below) in its structure. 18
Fig. II.2-6 X-ray powder diffraction pattern of an iron(III)-molybdate precipitate. 19Fig. II.2-7 Variation of pH as a function of time during the formation of the samples Sh, Sh-S-
As-1, S-As-5, Sh-S-Cr-1, Sh-S-Cr-5, Sh-S-P-1, S-P-10 in the synthesis suspensions insidethe dialysis bags. 20
Fig. II.2-8 Variation of the oxyanion content as a function of time during the formation of thesamples Sh-S-As-1, Sh-S-Cr-1 and Sh in the synthesis suspensions inside the dialysis bags. 20
Fig. II.2-9 X-ray powder diffraction pattern of two evolution phases of schwertmanniteformation. 21
Fig. II.2-10Variation of arsenate- and chromate- concentration as a function of time (362 days)during suspending of schwertmannite samples (Sh-S-As-1, Sh-S-Cr-1, Sh-Cr-10) at constantpH of 2 and 4. 25
Fig. II.2-11X-ray powder diffraction pattern of pure-, arsenated- and chromated schwertmanniteafter reaction time of 362 days kept at constant pH of 4. 34
Fig. II.2-12 Variation of the ionic activity product (IAP) as a function of time calculated forschwertmannite with different anionic contents (Sh-S-As-1, Sh-S-Cr-1, Sh-Cr-10) at pH 2. 35
Fig. II.3-1 X-ray powder diffraction pattern of schwertmannite (Sh), chromatedschwertmannite (Sh-Cr-10), arsenated schwertmannite(Sh-S-As-1) and X-ray amorphousiron(III)-arsenate (As-10). 43
Fig. II.3-2 FTIR difference-spectra of chromated schwertmannite (chromate addition duringmineral synthesis) with different amounts of chromate and sulphate (Tab. II.3-2). 44
Fig II.3-3 FTIR spectrum of pure schwertmannite and of schwertmannite with chromateadorbed after mineral synthesis (Sh-ads-Cr, difference spectrum). 45
Fig. II.3-4 FTIR spectra of schwertmannite and samples which were synthesised withincreasing As:S ratio in the synthesis solutions. 46
Fig. II.3-5 FTIR difference-spectra of arsenated schwertmannite (Sh-S-As-1) and arsenateadsorbed to schwertmannite after synthesis (Sh-As-ads). 49
Fig. II.4-1 Redox-stability diagram and arsenic speciation (Cullen & Reimer, 1989). 51
Fig. II.4-2 FTIR difference-spectra of arsenite bound to schwertmannite. 54Fig. II.5-1 XRD patterns of the three synthesised samples: schwertmannite, arsenated
schwertmannite and chromated schwertmannite (Sh-Cr). 59Fig. II.5-2 Release of sulfate, chromate and arsenate (% of total) from autoclaved and non-autoclaved samples of pure (Sh), chromated (Sh-Cr) and arsenated (Sh-As) schwertmannite,respectively, in uninoculated media. 59

List of Figures
VI
Fig. II.5-3 Effect of heat on the FTIR-spectra obtained from non-autoclaved (A) andautoclaved (B) pure schwertmannite (Sh) in uninoculated media. 60
Fig. II.5-4 Formation of Fe(II) from non-autoclaved (A) and autoclaved (B) pureschwertmannite (Sh), arsenated schwertmannite (Sh-As), and chromated schwertmannite(Sh-Cr) by A. cryptum JF-5 incubated in anoxic, acidic TSB-medium supplemented withglucose at 30 °C. 61
Fig. II.6-1 Distribution of ions within the electric double layer (model of Stern-Graham,Cornell & Schwertmann, 1996). 65
Fig. II.6-2 ζ-potential curves of schwertmannite to determine the pHiep. 69
Fig. II.6-3 Schematic illustration of the surface structure of As(V) and Cr(VI) on goethite(Fendorf et al., 1997). 73
Fig. II.6-4 Titration curve of goethite to determine the pHpzc. 74
Fig. II.6-5 Titration curve of schwertmannite to determine the pHpzc. 73Fig. II.6-6 Titration curve of schwertmannite in arsenate- and chromate- solutions. 77Fig. II.6-7 Adsorption of chromate and arsenate to schwertmannite and goethite and desorption
of sulfate from schwertmannite, in dependence of the pH. 80Fig. III-1 Study sites in eastern Germany: 18 acidic mining lakes (AML). 85Fig. III-2 Plot of the logarithm of Fe3+ activity against pH for surface waters of 18 AML with
solubility lines for goethite, ferrihydrite, K-jarosite and schwertmannite. 92
Fig. III-3 pε-pH-diagram for the system K-Fe-SO4. 93
Fig. III-4 X-ray diffraction pattern of synthetic schwertmannite and of sediment samples takenfrom ML “Skado” and “Murnersee”. 94
Fig. III-5 FTIR spectrum of the sediment sample “Skado” and the difference spectrum of“Skado” compared to the spectrum of synthetic schwertmannite. 95
Fig. III-6 Ratio of schwertmannite to goethite in the sediment of an acidic mining lake (ML77) in dependence on depth (Tritschler, 1997). 96
Fig. III-7 SEM of schwertmannite samples produced by slow formation in dialysis bags andby quick formation by oxidation of FeSO4 compared to a natural sample. 97
Fig. III-8 Sulfate activity in schwertmannite suspensions after 362 days at constant pH. 98Fig. III-9 X-ray diffraction pattern of solids in the end (after 362 days) of the stability
experiment kept at a constant pH-value of 4 and 7. 98Fig. III-10 Correlation of the change of the relative schwertmannite content with the pH-value
in the pore water and age of the sediment. Data obtained from Peine et al. (2000). 103Fig. III-11 Oxidation of Fe(II): Calculations of the SI and pH with the geochemical modelling
program PhreeqC.
A) Saturation index (SI) of schwertmannite, goethite and jarosite after oxidation of thedump water “Meuro” (Landesumweltamt Brandenburg, 1995).
B) Saturation index (SI) of schwertmannite in dependence on Fe(II) concentration. 105
List of Abbreviations and Definitions
VII
LIST OF ABBREVIATIONS AND DEFINITIONS
AAS atom-absorption spectroscopy
adsorbent on the surface of this (solid) material adsorption takes place
adsorbate material, which adsorbs (in this study: anions)
AMD acid mine drainage
AML acidic mining lake
BET method to determine the surface area (Brunauer-Emmett-Teller)
dl detection limit
d-value (nm) net plane distance of a crystal
EXAFS extended X-ray absorption fine structure
FTIR Fourier-Transform infrared
IAP Ionic-activity product
IC ionic chromatography
ICP inductive-coupled plasma
incorporation in this study (non-specific) expression for the molecule „uptake“ of amineral
hkl Miller indices: the smallest, whole-numbered multiple of the reciprocalaxis-segments of a crystal net plane
metastable thermodynamic unstable
minerals Fh ferrihydriteGt goethiteJt jarositeKt kaoliniteQz quartzSh schwertmannite
ML mining lake
n.d. not determinable
n.m. not measured
ppb
ppm
parts per billion
parts per million
pHiep point of zero charge, determined by electrophoresis
pHpzc point of zero charge, determined by acid-base titration
SEM scanning electron microscopy
SI saturation index
wt.-% weight-%
XRD X-ray diffraction
ζζ-Potential electric potential in the diffuse layer of a surface
θθ (°) diffraction angle (X-ray diffractometry)
λλ (nm) Wavelength
≡≡ surface group
{≡≡X} surface concentration (X is any ion)

Abstract
VIII
ABSTRACT
Fe(III) oxyhydroxysulfate schwertmannite [idealised formula: Fe8O8(OH)6SO4], frequently
precipitates as a product of sulphide weathering in acidic, sulfate-rich waters. In order to
investigate the environmental importance of schwertmannite, geochemical and mineralogical
methods were applied in field- and laboratory-experiments. Thereby this thesis focussed on
two consequential questions: The first (1) was if schwertmannite could enrich toxic
compounds and therefore act as a sink in natural systems. By means of the anions arsenate
and chromate, the uptake capacity by adsorption or substitution and consequential changes in
crystal structure were characterised. Additionally, a possible re-mobilisation of these
compounds was investigated because the metastable schwertmannite easily dissolves or
transforms into other minerals. Predominantly, experiments with synthetically produced
schwertmannite took place. The other main focus (2) comprised examinations of
schwertmannite formation in the chemical environment of acidic lignite mining opencast
lakes. Thereby its importance as pH-buffer, its formation probability and its variation by
ageing were to be characterised.
(1) Schwertmannite, as contained in precipitates of former ore mines, featured extraordinary
high amounts of arsenic (up to 6700 ppm) and chromium (up to 800 ppm). Since there was
hardly any detection of these elements in the corresponding drainage waters, the hypothesis
arose that schwertmannite acts as a scavenger for these compounds. Assuming that in the
redox environment of schwertmannite formation, arsenic and chromium are mostly present in
their highest oxidation-level (as arsenate and chromate) these oxyanions were used for
coprecipitation-, adsorption- and stability-investigations with synthetic schwertmannite, to
characterise its geochemical interactions. Synthesis (or coprecipitation) experiments proved
that schwertmannite, normally containing 12 to 14 wt.-% sulfate (both, structurally and
adsorptively bound), incorporates up to 10.4 wt.- % arsenate and up to 15.4 wt.-% chromate.
While the complete substitution of sulfate by chromate was possible without substantial
variation of the crystal structure, the incorporation of arsenate only took place in presence of
sulfate or chromate. Oxyanion uptake resulted in an advanced stability of schwertmannite as
confirmed in long-term experiments at constant pH. This means that the transformation (due
to ageing) to the mineral goethite, as well as mineral dissolution as a consequence of acid
addition, was decelerated and toxic compounds were released in lower concentrations
compared to sulfate.

Abstract
IX
Activity of Fe(III)-reducing bacteria also results in the dissolution of schwertmannite. A
combination of microbiological and geochemical methods was used to quantify the influence
of oxyanion incorporation on Fe(III) reduction in schwertmannite and the associated
mobilisation of oxyanions. Microbiological experiments were performed in co-operation with
the Department of Ecological Microbiology (BITÖK). Peine et al. (1998) have already
described that acidophilic bacteria reduce the well available Fe(III) of schwertmannite. (This
reduction is a requirement for the immobilisation of iron as Fe(II) sulfide and therefore an
important step to neutralise acidic waters). The bacteria Acidiphilium cryptum JF-5
(acidophile, facultative anaerobic, non-fermentative Fe(III) reducer) were added to a medium
of synthetic schwertmannite, partly consisting of arsenate and chromate. It was shown that
Fe(III) reduction of schwertmannite was twice as high as in arsenated schwertmannite and
that the mobilisation of arsenate was very low, compared to that of sulfate. Chromate was
proven to be toxic for these micro-organisms. As a side effect of this research it was observed
that autoclavation of schwertmannite (heating up to 121 °C for 20 min), a common method
for micro-biological experiments, results in transformation to goethite. The presence of
arsenate and chromate prevents this effect, indicating once more the stabilising effect of these
oxyanions compared to sulfate.
Adsorption experiments confirmed that schwertmannite, even after its synthesis, is able to
take up high amounts of arsenate and chromate. FTIR spectroscopy was used to differentiate
bonding structures (adsorptive or structural) of anions in schwertmannite. Thereby it was
shown that oxyanions predominantly bind to the iron hydroxide by specific bidentate sorption
(complexes of Fe-O-X(O2)-O-Fe where X is either S, Cr or As). This method did not yet
differentiate between structural and adsorptive binding.
Synthesis and adsorption experiments showed that both, arsenate and arsenite, can be
enriched in similar concentrations in schwertmannite. FTIR analysis demonstrated, that
during the As(III) incorporation the redox state of arsenite did not change.
Due to the crucial importance of the schwertmannite surface which influences its solubility as
well as its adsorption capacity, the mineral surface was characterised in various experiments.
Results suggest an extraordinary high surface of the crypto-crystalline mineral (< 300 m2·g-1)
which is always positively charged within the pH range of its formation (= metastability
range: pH 2.3 to 4.5) and contains high amounts of adsorbed sulfate (at least 35 wt.-% of the
total mineral sulfate). The electrophoretic determined pH point-of–zero-charge was 6.6.
Adsorption experiments of arsenate and chromate to schwertmannite as a function of pH

Abstract
X
demonstrated a relatively pH-independent adsorption. As opposed to adsorption, the
simultaneously occurring desorption of sulfate strongly depends on the pH-value and
increases with increasing pH.
(2) The chemical environment in opencast lakes of lignite mining frequently shows perfect
optimal requirements for schwertmannite formation. Hydrochemistry of surface waters, as
well as the sediment composition and partly the colloids were examined in 18 acidic mining
lakes (AML) located in Lusatia, Middle-Germany and Upper-Palatinate. In order to predict
the formation of solid phases in the lakes, chemical processes in surface waters were modelled
by chemical equilibrium calculations. Surface-water composition (measured data) served as
input for calculations of chemical reactions by the computer program “PhreeqC”. The results
showed that nearly all investigated lignite mining lakes are saturated with schwertmannite.
Moreover, this mineral is the Fe(III)-controlling solid-phase and it is in a redox equilibrium
with most surface waters. These theoretical results were confirmed by mineralogical and
chemical analysis of sediment samples which proved that schwertmannite is the primary
crystalline phase forming in the acidic lakes.
It was supposed that a steady supply of ferrous iron (caused by groundwater inflow from
pyrite containing lignite-dumps) into the oxygen-rich lake water provokes schwertmannite
precipitation as consequence of Fe(II) oxidation. The associated release of protons debases the
pH of lake water to a value of ~ 3. Due to the high solubility of schwertmannite, further
acidification results in mineral dissolution, a reaction which is associated with a release of
hydroxide or an increasing pH-value, respectively. Therefore, the cycle of precipitation and
mineral dissolution adjusts the pH in the surface waters of these lignite mining lakes to a
constant value and in this way schwertmannite acts as pH-buffer.
The orange-coloured layer of several centimetres frequently found at the sediment-water
interface of AML, mostly consists of schwertmannite and goethite. It was shown that with
increasing sediment-depth the proportion of schwertmannite to goethite decreases in this
layer. According to equilibrium calculations, schwertmannite is thermodynamically unstable
with respect to goethite, signifying a mineral transformation by time. Sediment analysis
confirmed the model assumption that goethite forms with increasing age (or sediment-depth)
as a stable transformation product. Enhanced ageing can be achieved by increasing pH found
in further depth due to microbial sulfate-reduction. Experimental confirmation of these field
observations was obtained by a long-term stability experiment (1 year) with synthetic
schwertmannite in dependence on pH. Even at low pH (3-4) transformation to goethite
occurred which was accelerated at high pH (5-7).

Kurzfassung
XI
KURZFASSUNG
Das Eisenoxyhydroxysulfat Schwertmannit [Fe8O8(OH)6SO4] bildet sich in sauren und
sulfatreichen Gewässern, die meist in Folge von Sulfidverwitterung entstehen. Im Rahmen
dieser Arbeit wurde Schwertmannit mit geochemischen und mineralogischen Methoden
charakterisiert. Ziel war es, seine umweltrelevanten Funktionen zu bestimmen. Die
Untersuchungen basierten auf Beobachtungen im Gelände und auf Laborexperimenten. Zwei
Fragestellungen standen dabei im Vordergrund. Zum einen (1) sollte untersucht werden, ob
das Mineral Schwertmannit toxische Stoffe in sich anreichern kann und somit als
Giftstoffsenke in natürlichen Systemen fungiert. Anhand der Anionen Arsenat und Chromat
wurde die Aufnahmekapazität und der Aufnahmeprozess durch oberflächliche Adsorption
oder strukturellen Einbau untersucht. Ferner sind mögliche kristalline Veränderungen von
synthetischem Schwertmannit analysiert worden. Auch eine potentielle Remobilisierung
dieser Stoffe im Zuge einer Auflösung oder Umwandlung des metastabilen Minerals wurde
untersucht. Der andere Schwerpunkt (2) umfasst die Bildung von Schwertmannit im
chemischen Milieu saurer Braunkohle-Tagebau-Restlochseen. Dabei sollte seine Bedeutung
als pH-Wert Puffer, seine Bildungswahrscheinlichkeit und seine Zeit-abhängigen
Veränderungen erklärt werden.
(1) Schwertmannit-Präzipitate, die in ehemaligen Erzbergwerken entnommen wurden, wiesen
außergewöhnlich hohe Gehalte an Arsen (bis zu 6700 ppm) und Chrom (bis zu 800 ppm) auf.
Da diese Elemente in den dazugehörigen Drainage-Wässern kaum nachgewiesen werden
konnten, wurde die Hypothese aufgestellt, daß Schwertmannit sie „herausfiltert“. Unter der
Annahme, daß Arsen und Chrom im Redoxmilieu des Schwertmannits vorwiegend in ihrer
höchsten Oxidationsstufe als Arsenat und Chromat vorliegen, wurden Kopräzipitations-,
Adsorptions- und Stabilitäts-Untersuchungen dieser Anionen mit synthetischem
Schwertmannit durchgeführt, Damit sollen stattfindende Wechselwirkungen charakterisiert
werden. In den Synthese-, (=Kopräzipitations-) Experimenten zeigte sich, daß Schwertmannit,
der normalerweise etwa 12 bis 14 Gew.-% Sulfat enthält (strukturell und adsorptiv gebunden),
bis zu 10.4 Gew.-% Arsenat und bis zu 15.4 Gew.-% Chromat inkorporieren konnte. Während
eine komplette Substitution des Sulfats durch Chromat ohne wesentliche Veränderung seiner
Kristallstruktur möglich war, konnte die Inkorporation von Arsenat nur in Anwesenheit von
Sulfat oder Chromat erfolgen. Die Aufnahme der Oxoanionen führte zu einer erhöhten
Stabilität des Schwertmannits. Das wurde in Langzeitversuchen unter konstanten pH-
Bedingungen nachgewiesen. Sowohl die alterungsbedingte Transformation von
Schwertmannit in Goethit, als auch die Auflösung in Folge von Säure-Addition verlangsamte

Kurzfassung
XII
sich mit dieser wachsenden Stabilität und die toxischen Substanzen wurden in geringeren
Konzentrationen (verglichen mit Sulfat) freigesetzt.
Die Aktivität Fe(III)-reduzierender Bakterien führt ebenfalls zur Auflösung von
Schwertmannit. Eine Kombination mikrobiologisch und geochemischer Methoden sollte den
Einfluss der Oxoanionen-Inkorporation auf die Fe(III)-Reduzierung von Schwertmannit und
die damit verbundene Mobilisierung der Oxoanionen quantifizieren. Peine et al. (1998),
beschrieben die bakterielle Reduktion des gut verfügbaren Fe(III) des Schwertmannits in
Sedimenten und die anschließende Festlegung des Eisens als Fe(II)-Sulfid. Für die hier
vorliegende Studie erfolgten die mikrobiologischen Versuche in Zusammenarbeit mit dem
Bayreuther Institut für Terrestrische Ökosystemforschung (BITÖK). Die Bakterien
Acidiphilium cryptum JF-5 (azidophile, fakultativ anaerobe, nicht-fermentative Fe(III)
Reduzierer) wurden in ein Medium, das synthetischen, z.T. Arsenat- oder Chromat-haltigen
Schwertmannit enthielt, gegeben. Es zeigte sich, daß die Fe(III)-Reduktion des
Schwertmannits doppelt so hoch war, wie die des arsenatisiertem Schwertmannits. Eine
Mobilisierung von Arsen war kaum nachzuweisen. Chromat erwies sich als toxisch für die
Mikroorganismen. Als Nebeneffekt dieser Untersuchungen wurde festgestellt, daß die zur
Erforschung mikrobiologischer Prozesse übliche Methode des Autoklavierens, also das
Erhitzen auf 121 C (20 min) bei Schwertmannit zu einer Umwandlung zum Goethit führt und
diese in Anwesenheit von Chromat oder Arsenat verhindert wird. Diese Ergebnisse
bestätigten den stabilisierenden Einfluss von Arsenat und Chromat verglichen mit Sulfat.
Adsorptionsuntersuchungen zeigen, daß Schwertmannit auch nach seiner Synthese hohe
Konzentrationen Arsenat und Chromat aufnehmen kann. Zur Unterscheidung der Bindungsart
der Anionen in Schwertmannit (adsorptiv oder strukturell) wurden FTIR-spektroskopischen
Messungen durchgeführt. Dabei ergab sich, daß sich die Oxoanionen vorwiegend über
spezifische bidentate Sorption d.h. als Fe-O-X(O2)-O-Fe-Komplex (X = S, Cr, As) an das Fe-
Hydroxid binden. Mit dieser Methode konnte jedoch nicht zwischen struktureller und
adsorptiver Bindung differenziert werden.
Synthese und Adsorptionsexperimente weisen nach, daß Arsen nicht nur in seiner 5-wertigen
Oxidationsstufe als Arsenat, sondern auch als 3-wertiges Arsenit von Schwertmannit in
vergleichbaren Konzentrationen aufgenommen wird. FTIR-Analysen bestätigten eine
Bindung von Arsenit an Schwertmannit.
Aufgrund der großen Bedeutung der Schwertmannit-Oberfläche, die sowohl die Löslichkeit
als auch die Adsorptionskapazität des Minerals beeinflusst, wurde die Oberfläche in

Kurzfassung
XIII
unterschiedlichen Experimenten charakterisiert. Es zeigte sich, daß der kryptokristalline
Schwertmannit eine sehr hohe Oberfläche besitzt (< 300 m2·g-1), die innerhalb seines
Stabilitätsbereiches (pH 2.5 bis 4.5) stets positiv geladen ist und mit hohen Konzentrationen
adsorbierten Sulfats angereichert ist (mind. 35 Gew.-% des Gesamtsulfats). Eine
elektrophoretische Bestimmung des Ladungsnullpunktes ergab einen Wert von 6.6.
Adsorptionsisothermen von Arsenat und Chromat, eine relativ pH-Wert unabhängige
Adsorptionsreaktion. Demgegenüber ist die gleichzeitig erfolgende Desorption von
Oberflächensulfat stark pH-Wert abhängig.
(2) Restlochseen des Braunkohletagebaus besitzen häufig das optimale chemische Milieu, das
die Vorraussetzung für die Bildung von Schwertmannit ist. Daher wurden im Rahmen dieser
Arbeit insgesamt 18 Seen (in der Lausitz, Mitteldeutschland und der Oberpfalz) hinsichtlich
der Hydrochemie ihrer Oberflächenwässer sowie der eisenmineralischen Zusammensetzung
ihrer Sedimente und teilweise der Kolloide im Seewasser untersucht. Durch eine
Modellierung der chemischen Prozesse im Seewasser sollten letztlich Aussagen getroffen
werden, welche eisenmineralische Phase sich am wahrscheinlichsten bildet, bzw. welche
Festphasen im Gleichgewicht mit der Wasserchemie im See vorliegen. Die hydrochemische
Analyse der Oberflächenwässer lieferte dabei die Eingabe-Daten für die chemischen
Reaktionen die in den einzelnen Seen stattfinden. Sie werden mit dem geochemischen
Modellierungsprogramm „PhreeqC“ berechnet. In nahezu allen untersuchten Restlochseen
liegt Sättigung von Schwertmannit vor. Er stellt die Fe(III)-kontrollierende Festphase dar
befindet sich im Redox-Geichgewicht mit den Gewässern. Eine Bestätigung dieses Modells
durch die Festphasenanalytik konnte für einen Großteil der untersuchten Sediment-Proben
erbracht werden. D.h. Schwertmannit stellt die primäre kristalline Phase dar, die sich im
Wasser der Restseen bildet und daher für den Eisen-Schwefel-Kreislauf eine tragende Rolle
spielt. D.h. bei steter Zulieferung von Fe(II) (durch Grundwasserzuflüsse aus den Pyrit-
haltigen Abraum der Braunkohle) in das O2-reiche Seewasser fällt Schwertmannit bei der
Oxidation des Eisens aus. Durch die gleichzeitige Freisetzung von Protonen sinkt der pH-
Wert des Seewassers auf ungefähr 3. Aufgrund der hohen Löslichkeit von Schwertmannit,
bewirkt eine pH-Wert Erniedrigung unter 2.5 seine mit der Freisetzung von OH- -Ionen
verbundene Auflösung. Somit bewirkt der Kreislauf von Schwertmannit-Fällung und -
Auflösung eine Pufferung des pH-Wertes in den Seen.
An der Sediment-Wasser-Grenze bildet Schwertmannit eine meist mehrere Zentimeter dicke,
orangerote Schicht, die proportional mit der Tiefe einen zunehmenden Anteil Goethit enthält.
Wie Gleichgewichtsberechnungen zeigten, ist Schwertmannit gegenüber den Eisenmineralen

Kurzfassung
XIV
Jarosit und Goethit thermodynamisch instabil. Das bedeutet, daß in älteren Sedimenten und in
Abhängigkeit des chemischen Milieus diese Minerale zu erwarten sind. Beobachtungen im
Sediment bestätigten die Modellvorstellung, daß mit zunehmendem Alter Goethit als stabiles
Produkt der Transformation entsteht. Eine Beschleunigung dieses Alterungsprozesses von
Schwertmannit kann durch ansteigende pH-Werte in der Tiefe, aufgrund Sulfat-reduzierender
Prozesse, erreicht werden. Eine experimentelle Bestätigung erfolgte durch einen 1 Jahr
dauernden Laborversuch, bei dem die Umwandlung bzw. Auflösung des Minerals in
Abhängigkeit des pH-Wertes quantifiziert wurde. Es zeigte sich, daß auch bei niedrigen pH-
Werten (3 bis 4) Transformation zum Goethit stattfindet. Bei hohen pH-Werten (5-7) wird
dieser Prozess beschleunigt.

I. Introduction
1
I. INTRODUCTION
1. STATE OF THE ART
Occurrence
In the surroundings of former mines an orange coloured deposit consisting of an iron(III) and
sulfate containing material can be frequently found which precipitates from waters influenced
by acid mine drainage (AMD). Until a few years ago these precipitates were scarcely noticed
and considered to be amorphous. Though Glockner described the new "Eisensinter"
discovered in a mine as early as 1853, its mineral characteristic was only recognised, and an
appropriate crystal structure characterised, in 1990 (Bigham et al., 1990). A few years later
the compound with the idealised chemical formula Fe8O8(OH)6SO4 was named
"Schwertmannite" by the "Commission of New Minerals and Mineral Names" in honour to
Prof. Dr. U. Schwertmann.
In a natural environment this mineral normally forms as a product of iron sulfide or pyrite
weathering. This complex process of the FeS2 oxidation was investigated in numerous works
(Evangelou & Zang, 1995; Nordstrom et al, 1998) and can be described by several chemical
equations. Ultimately the reaction [1-1] of one mol pyrite (FeS2) with water and oxygen
results in the formation of one mol iron hydroxide and two mol sulfuric acid.
FeS2 + 3.75 O2 + 3.5 H2O ↔ Fe(OH)3 + 2 H2SO4 [1-1]
Thereby the expression "Fe(OH)3" represents a collective term for various Fe(III) oxides,
hydroxides and (in the case of simultaneously precipitated sulfate) Fe(III) sulfates which are
considered as “secondary minerals of the pyrite oxidation”. Depending on the chemical
environment, e.g. the minerals goethite, jarosite, akaganéite, ferrihydrite or schwertmannite
can crystallise.
During the last 12 years schwertmannite has been discovered in numerous natural and
anthropogenically affected systems. Predominantly, it has been proven in AMD deposits (e.g.
Bigham et al., 1994; Yu et al., 1999, Childs et al., 1998). In addition, schwertmannite has
been identified in some Australian soils (Cat Clays) by Fitzpatrick & Self (1997) as well as in
sediments of an alpine stream in the Zillertaler Alps of Austria (Schwertmann et al., 1995,
Ruede et al., 2000). Even assumptions that the red soils of the planet Mars contain
schwertmannite can found (Bishop, 1996). In 1998 Peine and Peiffer proved the existence of
this mineral in the sediment of an acidic lignite open-cast lake (ML 77, Lausitz) and set up the

I. Introduction
2
hypothesis that it has great importance in this lake as a buffer for the pH value. Among other
things this assumption is questioned in this study.
Characteristics
Schwertmannite is a mineral of "weak crystallinity" which affects its difficult identification.
This can be explained by its crystal structure as described by Bigham et al. (1990) which was
found to be isostructural to the mineral akaganéite (β-FeOOH). This structure consists of
chains of iron(III)oxide- and hydroxide-octahedra which are partly connected in a certain
manner to form cavities between them. (An exact description of the crystal structure is
presented in the introduction of chapter II.2, pp. 8-10.) In these cavities anions are stored
which predominantly consist of chloride in the case of akaganéite and of sulfate in the case of
schwertmannite. The storage of sulfate causes a small shift in lattice constants or in
preferential crystal growth direction, respectively. Thereby a "new" mineral forms which can
be distinguished from akaganéite (in chapter II.2 of this thesis, the crystal structure of
schwertmannite is described in detail).
The specific characteristics of schwertmannite, enumerated in the following section can be
explained by its crystal structure (Bigham et al., 1990). They form the basis for the questions
and interpretations in my thesis.
• Sulfate Substitution: The cavities within the structure of schwertmannite are
normally occupied by sulfate which can (probably) be exchanged by other oxyanions.
• Morphology and Surface: Due to the preferred crystal growth direction, the
schwertmannite crystals are extremely thin and needle shaped. They agglomerate to "hedge-
hog" particles with a diameter of ~ 200 nm and a large surface area of 125 to 250 m2·g-1.
• Adsorption Capacity and Solubility: The high surface area and small particle size
result in a high surface reactivity. About 30 % of schwertmannite sulfate is surfacially bound.
• Chemical Environment: The formation of schwertmannite in a Fe(III) solution
requires a sulfate rich (> 5 mmol·l-1) as well as an oxic and acidic (pH 2.5 to 4.5) milieu.
• Metastability: Depending on both, time and pH of a schwertmannite suspension, this
mineral either dissolves [1-2] or transforms into the thermodynamically more stable mineral
goethite [1-3] (Bigham et al., 1996). Therefore, in natural systems, schwertmannite is usually
associated with goethite (FeOOH) and is not be found in older sediments (> 10 a).
Fe8O8(OH)6SO4 + 22 H+ à 8 Fe3+ + SO42- + 14 H2O [1-2]
Fe8O8(OH)6SO4 + 2 H2O à 8 FeOOH + 2 H+ + SO42- [1-3]

I. Introduction
3
The denotation “stability range” of schwertmannite marks the pH range within which
schwertmannite can form and within which this mineral is most stable for a long period of
time (few years).
2. OBJECTIVES
In this dissertation the mineral schwertmannite is characterised with respect to the following
aspects:
• It can be assumed that schwertmannite is able to enrich a multiplicity of (potentially
toxic) compounds by sulfate substitution and/or adsorption. Thus this mineral could be
of great importance as a sink in acidic waters. However, as a consequence of ageing or
due to changes of the hydrochemical environment, schwertmannite dissolves or
transforms into another mineral. Thereby schwertmannite could release the previously
enriched elements and thus (also) act as source for these potentially toxic compounds.
Consequently, a neutralisation of acidic waters could entail an increase of their toxicity.
Therefore one object of this study was to describe and quantify the geochemical
interactions between schwertmannite and the toxic anions arsenate and chromate.
• Schwertmannite forms in the hydrochemical environment of acidic iron- and sulfate-
containing waters. These conditions frequently exist in lignite mining opencast lakes. In
Germany large areas are confronted with the consequences of lignite mining. Therefore
for some years the exploration of the processes in these lakes have been the object of
many research projects. The goal of my study was to characterise the formation process
and the formation probability of schwertmannite in these acidic mining lakes (ML). In a
broader sense the general processes of crystallisation, dissolution and transformation of
schwertmannite should be analysed.

I. Introduction
4
3. ARRANGEMENT OF THIS WORK
This thesis consists of two sections (II. and III.) in which different aspects of the
schwertmannite characterisation are considered.
Section II concerns itself with the geochemical interactions between schwertmannite and the
oxyanions chromate and arsenate. Firstly, the general importance of arsenate and chromate
(chapter II.1) are introduced. Subsequently, (chapter II.2) the extent to which arsenate and
chromate can be taken up from schwertmannite and the corresponding effects and changes on
its crystal structure and stability are considered. These investigations were accomplished
almost exclusively in the laboratory using synthetic schwertmannite. The characterisation of
schwertmannite is predominantly based on measurements of powder X-ray diffraction.
In coprecipitation- and adsorption-experiments the enrichment of arsenate and chromate in
schwertmannite was examined and long-term stability experiments should supply evidence
about the release of toxic oxyanions. In order to investigate the significance of
schwertmannite as sink or source for arsenic and chromium in the environment,
schwertmannite precipitates were sampled from acidic mine drainage waters of two former
ore mines and analysed for their arsenic and chromium content.
Chapter II.3 monitors investigations about the mode of the oxyanion binding to
schwertmannite using the method of FTIR spectroscopy. Chapter II.4 presents the results of
a preliminary study which examined the incorporation of arsenite into schwertmannite.
The research presented in chapter II.5 concerns the reduction of Fe(III) in schwertmannite
under anoxic conditions by micro-organisms. In former studies bacteria (acidiphilium cryptum
JF-5) were isolated from sediment samples and schwertmannite reduction in the natural
environment was investigated (Kuesel et al., 1999 and Peine et al., 2000). It has been stated
that these bacteria use the easily available Fe(III) of schwertmannite as an energy supplier. In
my examinations the influence of arsenate and chromate incorporation in schwertmannite on
the bacterial Fe(III) reduction of the mineral were analysed.
Investigations on the surface properties of schwertmannite are presented in chapter II.6. For
comparison, most experiments in this study were performed with synthetic goethite, too. The
mineral surfaces were characterised using different methods as BET-surface measurements,
scanning electron microscopy (SEM) and electrophoretic measurements of surface potential.
Additionally acid-base titration in batch attempts were performed. Thereby adsorption
isotherms were constructed as a function of adsorbate and adsorbent concentrations as well as
depending on the pH value.

I. Introduction
5
The second focus of my work which involves investigations on the formation and stability of
schwertmannite in the geochemical environment of acidic lignite opencast lakes, is presented
in section III.
Based on the thesis of Ariane Peine (1998) in which schwertmannite was proven for the first
time in one lignite mining lake (ML 77, Lausitz), in my study a multiplicity of mining lakes
(18) were examined for schwertmannite.
Thereby the object was to find out under which conditions schwertmannite forms, which
mechanisms control its crystallisation, how frequently it occurs in the mining lakes and which
importance schwertmannite possesses as a buffer for the pH-value in nature. Beside extensive
sampling and the analysis of water and sediment, this part of my thesis contains a
geochemical modelling to calculate the (expected) iron(III) solid phase.
The metastability of schwertmannite referring to goethite has been characterised in the
sediment of one lake ("ML 77") and compared to results of a long-term stability experiment
with synthetic schwertmannite in order to contrive information about the kinetics of
schwertmannite transformation.
Finally (IV), a summary and a conclusion of all obtained results, including a short outlook for
future necessities and suggestions of research, are presented.

II.1. Motivation to investigate Arsenate and Chromate
6
II. GEOCHEMICAL INTERACTIONS BETWEEN
SCHWERTMANNITE, CHROMATE AND ARSENATE
1. MOTIVATION TO INVESTIGATE ARSENATE ANDCHROMATE
Part II of this thesis illustrates the geochemical interactions between the mineral
schwertmannite and the oxyanions arsenate and chromate. This chapter (II.1.) gives a short
characterisation of these ions and explains thereby the motivation why arsenate and chromate
were chosen for investigations referring to schwertmannite.
It is well known that hydrous oxides of iron are important sorbents for toxic anions in soils
and water. As will be explained in the following, schwertmannite probably is one of the most
significant immobilisers of some of these hazards. The Fe(III)-sulfate mineral schwertmannite
approximately contains 12 wt.-% of sulfate (Bigham et al., 1990). Two thirds of this amount
are directly incorporated into its crystal lattice, i.e. it is covalently bound to the iron hydroxide
and called “structural sulfate”. The other third is specifically and/or unspecifically adsorbed to
the mineral surface. This study is bound to answer the question if the structural and the
surface bound sulfate, respectively, can be exchanged with other oxyanions by substitution or
adsorption. In case of an enrichment of the toxic oxyanions arsenate and chromate,
schwertmannite could function as a sink for these substances and by inhibiting their mobility,
it would have great significance in natural waters.
Arsenic and chromium are two important poisons that enter the environment primarily due
to anthropogenic activities. In Table II.1-1 some characteristics of As and Cr are listed. As
schwertmannite they frequently occur in the environment of acid mine drainage. In
oxygenated systems they dominante as AsO43- and CrO4
2- and thus are as tetrahedrally
coordinated (Fig. II-1) as sulfate which is, as mentioned above, a part of the crystal structure
of schwertmannite. Since they have a similar ionic radius as sulfate (0.23 nm, Tab. II-1), it
was assumed that these ions can substitute the sulfate in schwertmannite.
A sOO
O
H
H
H
As
O
O
O
O
H
HH
Cr O
O
O
O
H
H
H2CrO4 H3AsO4 H3AsO3
Fig. II.1-1 Coordination of the moleculeschromate (or sulfate) and arsenate (orphosphate).

II.1. Motivation to investigate Arsenate and Chromate
7
Because of the hazards invoked by arsenate and chromate - both oxyanions are potentially
carcinogen - processes that remove these species from the aqueous phase and limiting their
bioavailability are desirable.
Table II.1-1 Selection of some ecological-relevant characteristics of arsenic and chromium.
As Cr Reference
mean content inthe earth crust
1.8 (ppm) 100 (ppm) Mason &Moore, 1990
occurrence inminerals
arsenopyrite (FeAsS), realgar(As4S4), oripiment (As2S3),
frequently contained in pyrite (FeS2)
chromite (FeCr2O4), frequentlyCr3+ substitutes Fe3+ in iron
minerals
Matthes, 1996
background valuefor soils
20 (ppm) 100 (ppm) Hollandliste(1988)
limit in water 0.01 (ppm) 0.05 (ppm) TrinkwV (1990)
damage forhumans
carcinogenic for skin, lung (liver,mark), enrichment in the body
carcinogenic for skin, lung(liver, mark)
Fendorf et al.,1997
environmentalinput
pesticides, AMD, geogen industries of paints and textiles,AMD
toxic oxyanions AsO43- (arsenate), AsO3
3- (arsenite,∼10-fold more toxic than arsenate)
CrO42- (chromate),
Cr2O72- (dichromate)
Ionic radius AsO43-: 0.248 nm CrO4
2-: 0.24 nm Wilkinson, 1987
mobility ofoxyanions in soils
arsenate: low mobile; increasedmobility during reduction to arsenite
very mobile: low retention insoils, hardly biologic. degradable
Fendorf et al.,1997
miscellaneous strong oxidant, corrosive WHO, 2000
Other oxyanions of As and Cr occurring in natural environments
At a low pH chromate partly dissociates to dichromate (Cr2O72-) and in the environment of
schwertmannite formation (pH 2.5-4) about 50 % of Cr(VI) is present as dichromate. The
dichromate molecule consists of 2 chromate tetrahedra, linked by a joint oxygen atom
(Holleman & Wiberg, 1985). Both anions are strongly toxic (WHO, 2000), form hardly
soluble complexes with divalent cations and act as oxidising agents in acidic solutions. In this
study the two anions of Cr are not distinguished because they differ only slightly and it was
not possible to quantify Cr2O72- (by photometry) in schwertmannite extracts. Therefore results
represented in this study concerning chromate, include always the sum of both Cr(VI)-salts.
In As-polluted systems, additionally to arsenate, the more toxic and very mobile, trivalent
arsenite (AsO33-) is of great importance. In the oxic environment of schwertmannite-
formation, arsenate should actually dominate. However, due to the slow oxidation kinetics of
arsenite, it possibly could occur together with schwertmannite. Therefore, it was considered in
some experiments of this study. The results are summarised in chapter II.4.

II.2. Effects of Arsenate and Chromate Incorporation on the Schwertmannite Structure
8
2. EFFECTS OF ARSENATE AND CHROMATE INCORPORATION
ON THE SCHWERTMANNITE STRUCTURE
2.1 Introduction
Iron(III)oxides and hydroxides in soils and sediments are of major environmental importance,
because they often bind toxic elements and thus reduce their mobility and availability
(Scheffer & Schachtschabel, 1992). This is why they are frequently present as very small
crystals (< 100 nm in size) with a large and reactive surface area (Schwertmann & Fitzpatrick,
1992). At their surface they carry functional groups which can adsorb lots of ions and
molecules (Stumm & Morgan, 1996) and thus function as a filter for hazardous materials.
Schwertmannite, an oxyhydroxysulfate of iron, is particularly suitable for acting as a sink for
toxic oxyanions, because additionally to its large surface (100-200 m2·g-1, Bigham et al.,
1994) it has a special crystal structure which could favour their incorporation.
2.1.1. Schwertmannite Structure and Formation
Schwertmannite is of weak crystallinity and therefore difficult to identify and was therefore
unknown until few years ago. Based on X-ray diffraction (XRD), Mössbauer and Infrared
spectroscopy, Bigham et al. (1990) described its structure as isostructural to the mineral
akaganéite (β-FeOOH). This seems obvious when the XRD patterns of schwertmannite and
akaganéite are compared (Fig. II.2-1).
Fig. II.2-1 Powder X-raydiffraction pattern of syntheticakaganéite and schwertmannite.Arrows mark the positions ofthe eight XRD-peaks ofschwertmannite as described byBigham et al. (1990).
20
40
60
80
100
0,830,500,360,280,230,200,170,150,13
d-value (nm)
20
40
60
80
100
Inte
nsi
ty (
%)
akaganéite
schwertmannite

II.2. Effects of Arsenate and Chromate Incorporation on the Schwertmannite Structure
9
The diffractogram of schwertmannite consists of eight broad peaks which are located at the
same positions as those of akaganéite. Therefore, it was assumed that the structure for both
minerals is almost the same (Bigham et al., 1990). The akaganéite structure is well known and
was described by Murad (1979) based on a crystallographic tetragonal unit cell (cell
parameters: a0=1.054, c0= 0.303 nm). Other authors described the unit cell as monoclinic
(Table II.2-1) with a monoclinic angle of 90.63° (Cornell & Schwertmann, 1996). Anyway,
the unit cell consists of 8 FeO3(OH)3-octahedra forming double chains which are shared over
edges and run parallel to the b-axis. They share corners with adjacent chains and thus enclose
cavities (Fig. II.2-2). There is one tunnel cave per unit cell with a diameter of 0.5 nm2 into
which anions with a maximum diameter of 0.35 nm (normally chloride) are incorporated.
However, also large sulfate molecules (0.46 nm in diameter) can be incorporated as confirmed
by infrared studies. By this method the formation of bridged bidentate complexes (-Fe-O-SO2-
O-Fe-) inside these structures were proven. It was assumed (Bigham et al., 1990) that two of
the oxygen atoms of sulfate get directly connected to the oxygen atoms of the Fe octahedra
(Fig.II.2-2), whereas sulfur and the two “free” oxygen atoms occupy consecutive cavities
parallel to the tunnel axis (b-axis) (Bigham et al., 1994).
Due to the larger size of the sulfate the structure distorts in the a-dimension and consequently
the c0-unit in the tetragonal unit cell doubles from the b0-unit 0.303 nm in monoclinic
akaganéite and becomes a 0.604 nm c0- unit in tetragonal schwertmannite, as shown in Table
II.2-1. The unit cell distortion also results in a limited crystal growth direction which affects a
length growth (up to 200 nm) parallel to the c-axis and perpendicular to a thickness of only
ClOFeS
Fig. II.2-2 Schematic structure model of akaganéite(left; Stanjek, unpubl. in Cornell & Schwertmann,1996) and schwertmannite (right).

II.2. Effects of Arsenate and Chromate Incorporation on the Schwertmannite Structure
10
some nm. Accordingly, the habit of schwertmannite crystals is marked by long, thin needles
which agglomerate to “hedgehog” -similar particles with the mentioned very high surface area
and corresponding high reactivity. This results in the characteristic features of schwertmannite
as high adsorption capacity, good solubility and metastability. Sulfate is as well bound into
the structure of schwertmannite (“tunnel sulfate”) as adsorbed onto its surface in a ratio of
~ 3:1 (Bigham et al., 1990).
Table II.2-1 Crystallographic cell parameters of schwertmannite, akaganéite, goethite and chromatedschwertmannite (sample Sh-Cr-10).
dimension of the unit cell (nm)mineral crystallographicsystem a b c
reference
schwertmannite tetragonal 1.066 1.066 0.604 Bigham et al. (1994)
akaganéite monoclinic (β: 90.63°)tetragonal
1.0561.054
0.3031.054
1.0480.303
Cornell & Schwertmann (1996)Murad (1979)
goethite orthorhombic 0.461 0.996 0.302 Cornell & Schwertmann (1996)
Sh-Cr-10 tetragonal 1.044 1.044 0.302 this study
The XRD pattern of schwertmannite reflects its weak crystallinity which is caused by its
limited crystal growth. Compared to the pattern of akaganéite, the total peak intensity (or the
X-ray diffraction interferences) in the schwertmannite pattern is much lower and the width of
the peaks is broader. Moreover, some differences in peak location (the d-values) between the
two minerals can be observed in their X-ray diffraction patterns (Table II.2- 2, Fig.II.2-1).
Bigham et al. (1990) interpreted these changes as a consequence of sulfate incorporation in
the akaganéite structure. Thereby the akaganéite characteristic peak at the d-value of 0.739
nm disappears and the peak located at 0.53 nm in akaganéite shifts to 0.471 nm in
schwertmannite.
Other ions instead of and in addition to sulfate can be enriched in schwertmannite. This has
been previously established for the high adsorption capacity of heavy metals by Webster et al.
(1998). Anions probably adsorb in higher amounts due to the generally positive charge of iron
minerals (Cornell & Schwertmann, 1996).
Bigham et al. (1990) showed that a total substitution of selenate, an oxyanion similar to
sulfate in ionic radius and charge, is possible. Therefore it was hypothesised that other
comparable oxyanions have the same effect. In this study the exchange of structural and
adsorbed sulfate by the toxic oxyanions arsenate and chromate is investigated.

II.2. Effects of Arsenate and Chromate Incorporation on the Schwertmannite Structure
11
Table II.2-2 X-ray diffraction data of akaganéite and schwertmannite (Cornell & Schwertmann, 1996)compared to chromated schwertmannite (Sh-Cr-10), measured by H. Stanjek (TU-Munich). Peak
position: d-value (d ) in nm, crystallographic interpretation (hkl) and relative peak intensity (I) in %.
akaganéite schwertmannite sample Sh-Cr-10
d hkl I d hkl I d hkl I d hkl I
0.740 110 100 0.194 411 60 0.738 110 56.70.525 200 40 0.185 440 10 0.486 200,
11137 0.522 200 43.5
0.370 220 10 0.175 600 40 0.339 310 46 0.330 310 1000.331 310 100 0.172 501,
43110 0.255 212 100 0.247 400 49.1
0.262 400 40 0.163 521 100 0.228 302 23 0.228 212 97.80.254 211 80 0.151 002 40 0.195 412 12 0.194 301 34.60.234 420 20 0.149 611 20 0.166 522 21 0.163 521 29.30.228 301 40 0.148 112,
71020 0.151 004 24 0.151 002 11.1
0.209 321 20 0.146 640 10 0.146 204,542
18 0.143 541 5.6
0.206 510 20 0.142 541 80
0.137 730 40
Schwertmannite forms under oxic, acid, sulfate- and iron- rich conditions (Bigham et al.,
1994). At pH values between 2.5 and 4.5 the Fe(III) in water is predominantly available as a
Fe(III)sulfate complex (Music et al., 1981) promoting the crystallisation of schwertmannite.
The requirements for schwertmannite formation are frequently given in environments
influenced by acid mine drainage, because their chemical conditions are a consequence of
pyrite (FeS2) oxidation (Evangelou & Zhang, 1995). Schwertmannite is a metastable mineral
which means that by time or in consequence to changes in pH a dissolution or transformation
to goethite can be expected (Bigham et al., 1996). Thereby, potentially enriched toxic
elements will be released.
2.1.2. Investigated Oxyanions
Arsenic and chromium are two environmental poisons, frequently occurring in combination
with acid mine drainage, in natural systems. Both are often found included in pyrite. Arsenic
additionally forms sulfidic minerals associated to pyrite, such as arsenopyrite (FeAsS), realgar
(As4S4) or orpiment (As2S3) (Matthes, 1996) which oxidise in a similar way as described for
pyrite. Sulfide weathering results in a release of incorporated toxic elements. Arsenic and
chromium occur in the redox environment of schwertmannite mostly in their highest
oxidation level as AsO43- and CrO4
2-. In these forms they are tetrahedrally coordinated and
their ionic radius and charge is similar to SO42- (Table II.2-3).

II.2. Effects of Arsenate and Chromate Incorporation on the Schwertmannite Structure
12
Due to this similarity they could either completely or partly substitute the sulfate in
schwertmannite. It has been hypothesised that schwertmannite immobilises these oxyanions
by adsorption or substitution. In addition to chromate and arsenate, some experiments were
performed with phosphate (PO43-) and molybdate (MoO4
2-) to gain more exact information on
the influence of ionic radius and charge for the substitution. The geometric features of these
ions are presented in Table II.2-3.
Table II.2-3 Ionic charge and radius of certain anions (Wilkinson, 1987; Gmelin, 1954).
anion Cl- SO42- CrO4
2- AsO43- PO4
3- MoO42-
charge -1 -2 -2 -3 -3 -2
ionic radius (nm) 0.18 0.23 0.24 0.248 0.238 0.246
However, arsenate and chromate were predominantly investigated because of their high
toxicity to organisms (both are highly carcinogenic). Chromate is very mobile, only slightly
retentionable in soils and it is hardly available for micro organisms. Its input is mainly caused
by industries of paints and lacquers or mining activities (WHO, 2000). In the environment
arsenate frequently occurs due to human activities (pesticides, paints or mining) or in a
consequence to geogen conditions. Arsenic represents an acute problem for the drinking water
quality in many countries as described for lots of regions world wide, for example Western
India, Bangladesh or Taiwan (Chatterjee, et al., 1995; Chowdhuri et al., 2000; Lu, 1990).
The object of this study is to characterise the geochemical interactions between
schwertmannite and the anions arsenate and chromate with regard to their substitution,
adsorption and time depending stability. Arsenate and chromate incorporation in
schwertmannite should have been quantified and compared to resulting changes in crystal
structure. Examinations of the processes during schwertmannite formation and changes of its
structure over time in dependence to the incorporated oxyanions, should explain the type
(structural or adsorptive) and influence of the oxyanion bonding on schwertmannite stability.

II.2. Effects of Arsenate and Chromate Incorporation on the Schwertmannite Structure
13
2.2. Materials and Methods
2.2.1. Mineral Synthesis
Schwertmannite was synthesised by two methods: (1) According to Bigham et al. (1990), 2 L
of deionised water were heated in an oven to 60°C. After adding 10.8 g FeCl3⋅6H2O (~ 40
mM Fe3+) and 3 g Na2SO4 (~ 10 mM SO42-) the solution was kept for further 12 minutes at 60
°C. The suspension was cooled down to room temperature and dialysed (Serva dialysis bags,
pore radius of 2.4 nm) against deionised water (~ 4 L) which was renewed on a daily basis
over a period of 33 days. After this time the measured electric conductivity in this “dialysis
water” was constantly < 5 µS indicating that no further ionic exchange had taken place. The
produced amount of schwertmannite, weighed after freeze drying, was 1.9 g. In this study this
technique was termed “synthesis in Fe(III)-solutions ”. The other schwertmannite synthesis-
method (2) after Pentinghaus (pers. commun.) was termed the “oxidative synthesis”. FeSO4
was dissolved in deionised water (several grams per L) and some mL of H2O2 (32 %) were
added to accelerate the oxidation of Fe2+ to Fe3+. The precipitated orange coloured solid
consisted of pure schwertmannite. Variation of the two synthesis methods was reached by the
addition of different concentrated oxyanions (Na2CrO4, Na3PO4⋅12 H2O und Na2HAsO4⋅7
H2O) into the synthesis solution. In Table II.2-4A, -4B and -4C the different synthesis
solutions are presented.
The mineral formation process for the “synthesis in Fe(III) solutions” was observed in several
samples over time by continuously measuring the pH and the concentrations of iron(tot),
sulfate, arsenic, chromium and phosphate in the synthesis solution. Thereto each few days
aliquots of 5 mL were taken from the suspensions in the dialysis bags and analysed. After 10
and after 18 days volumes of 50 mL were removed, filtrated and the filter residue was
examined by X-ray diffraction (see below).
Synthetic goethite (α-FeOOH) was produced by adding 180 mL 5 M KOH to 100 mL 1 M
Fe(NO3)3 solution (Cornell & Schwertmann, 1996). Thereafter the suspension was diluted to
2 L with bidestilled water and held in a closed glass vessel in an oven at 70 °C for 60 h.
Finally the yellow precipitate was washed twice and dried at 50 °C.
To precipitate akaganéite (β-FeOOH) 2 L of a 0.1 M FeCl3 solution were kept in a closed
vessel at 70°C for 48 h. During this time the pH value dropped from 1.7 to 1.3 and ~5 g of the
yellow mineral akaganéite was formed (Cornell & Schwertmann, 1996).

II.2. Effects of Arsenate and Chromate Incorporation on the Schwertmannite Structure
14
Bigham et al. (1994) determined the water content in schwertmannite to ~ 0.63 mol H2O per
mol Fe. This amount is not constant and could disturb some measurements. Therefore, it was
completely eliminated by freeze drying all samples in my experiments. A comparison of the
XRD patterns showed no differences between the water free and the hydrated samples.
2.2.2. Analytical methods
The synthesised samples, ground to a homogeneous powder, were mineralogically identified
by powder X-ray diffraction (XRD) using a Co-Kα1,2 radiation with a Siemens D 5000 X-ray
goniometer (40 kV, 40 mA) and with silicon as internal standard. The specimen were step
scanned from 10° or 20° to 80° 2θ in increments of usually 0.02° θ with 2 or 8 s counting
time. The peak maxima were directly read from the diffractogram. Mineral components were
determined by the library evaluation programme DiffracAT Vers. 3.3. Schwertmannite was
identified by comparison with a synthetic schwertmannite standard. This reference-
diffractogram was identical to the one described for schwertmannite according to Bigham et
al. (1990). The program winfit (beta release 1.2.1) was used for further processing of the
diffractograms. The unit cell edge-lengths of the sample Sh-Cr-10 were calculated by H.
Stanjek, TU Munich with the program GITTER.
Scanning electron micrographs (SEM) were obtained by a Leo 1530 electron microscope
(zircon oxide radiation source on wolfram wire) which had an optical resolution of few nm.
The samples were covered with a platinum layer before measurement.
The chemical composition of the solid samples with the crystal structure of schwertmannite
was determined after extraction in 1 M HCl (1 g·L-1). In the extracts and in the aquatic phase
Fe(tot) was measured by flame atomic absorption spectrometry (Varian/Spectr-AA-20), S(tot)
and P(tot) by ICP-AES (Integra-XMP-GBC) and As(tot) and Cr(tot) by graphite tube AAS
(Varian/Spectr-AA-30, GTA-96). Detection limits were 0.5 ppm for Fe(tot), 0.2 ppm for
S(tot), 0.3 ppm for P(tot) and each 5 ppb for As(tot) and Cr(tot). In the aquatic phase sulfate
and phosphate were determined by ionic chromatography (Metrohm IC Separation Center
733) with a detection limit of 30 µmol·L-1.
2.2.3. Stability Experiment
Samples of schwertmannite and of schwertmannite containing arsenate, chromate and
phosphate (Sh, Sh-S-As-1, Sh-S-P-1, Sh-S-Cr-1, Sh-Cr-10) were prepared by the synthesis in

II.2. Effects of Arsenate and Chromate Incorporation on the Schwertmannite Structure
15
Fe(III)-solutions (the compositions are presented in Table II.2-4A). After 30 days of dialysis,
the suspensions were filled from the dialysis bags into glass vessels. Each two parallels of the
five different suspensions were produced. Subsequently, pH values of 2 and 4, respectively,
were adjusted by adding of different amounts of HNO3 or NaOH in each of the parallels.
Table II.2-5 (page 24) shows the titrated concentrations and the pH for each sample. The
closed vessels were homogeneously stirred at 20 °C (± 0.1 °C). On a daily basis the pH was
controlled and adjusted to constant values of 2 or 4 by adding of acid or base. The added
concentrations were reported. Occasionally (every few days) certain volumes of the
suspensions (either 10 or 50 mL) were taken for analysis. After the defiltration of the solid
part (blue ribbon filter), sulfate, iron, arsenic and chromium were measured in the filtrate.
Ionic activities were calculated by the Davies approximation. The crystallinity of the ten
samples was analysed by XRD at the end of the experiment. About every two weeks FTIR-
spectra of the filtrated solid were recorded with a Fourier Transform infrared (FTIR)
spectrometer between 7500 and 370 cm-1 and with 1 cm-1 resolution. Samples were measured
as KBr pellets (1 % sample).
Measured concentrations obtained during this study at pH 2 were used to determine the ionic
activity product (IAP) of schwertmannite in dependence on its composition. It was calculated
(eq. 2-1) in analogy to the solubility window according to Bigham et al. (1996).
Fe8O8(OH)x(SO4)y +(24-2y)H+ à 8 Fe3+ + y SO42- + (24-2y+x)/2 H2O [2-1]
Log KSh = 8 Log aFe3+ + y log aSO42- + (24-2y)⋅⋅pH ; IAPSh= 18.0 ± 2.5
2.2.4. Adsorption Experiment
The specific surface area of the synthetic samples was measured by N2 adsorption with a
Gemini 2370 V1.02. according to the BET-method (Brunauer et al., 1938).
In order to investigate the adsorption capacity of schwertmannite, aliquots (25 mL) were
produced containing 10-4 M or 10-3 M chromate or 10-4 M, 10-3 M or 5·10-3 M arsenate and
KNO3 (c=0.1 M) as inert electrolyte. Therein 1 or 4 g·L-1 freeze dried schwertmannite samples
were suspended. Subsequently different pH values were adjusted by addiing of HNO3 or
NaOH. During the addition of the components the vessels were gazed with N2 to prevent
sorption of carbonate or hydrogencarbonate to the surfaces. Samples were constantly shaken
at 20 °C over 24 h. Finally, the suspensions were filtrated (0.45 µm) and sulfate, arsenate and
chromate were measured in the filtrate.

II.2. Effects of Arsenate and Chromate Incorporation on the Schwertmannite Structure
16
2.2.5. Natural Specimens
Samples of water and precipitate were collected in the summer 2000 from two different mines
in which ores were exploited over centuries. The geology of both mines is marked by
palaeozoic, crystalline rocks with veins of sulfidic ores such as pyrite, chalkopyrite or
arsenopyrite. As secondary minerals in high concentrations sulfates were found, such as
gypsum, diadochite or barite (Rüger, et al., 1994, Maly, 1999).
The former alaun-schist mine “Saalfelder Feengrotten” is located in Thuringia (Germany) in
the south of Saalfeld/ Saale (Fig.II.2-3). The pyrite rich schists (under silur) are located as
inter-bedded strata with quartzite. The mining area “Prybyslav” where predominantly silver
has been exploited during the middle ages is located 50 km NE of Jihlava (Czech Republic,
Fig. II.2-3). The sulfidic ores are contained in moldanubic tectonically stressed paragneisses
(Maly, 1999).
Samples of orange-red precipitates occurring as crusts and stalactites, as well as drainage
water, were taken in each mine at about 10 different locations.
In the laboratory precipitates were freeze dried and their mineralogical composition analysed
by XRD. In case of the schwertmannite identification, the samples were extracted over 15 min
with NH4 oxalate (pH = 3) in the absence of UV radiation of light in order to dissolve solely
the weak crystalline Fe(III) mineral (Carlson & Schwertmann, 1981, Bigham et al., 1990). In
the extracts the total concentrations of Fe, S, As and Cr were measured.
Fig. II.2-3 Location map of the sampling sites: The two former mines“Saalfelder Feengrotten” in Germany and “Prybyslav” in the Czech Republic.
CzechRepublicGermany
SaalfelderFeengrotten
Prybyslslav
N
150 km Jihlava
SaalfeldPraha

II.2. Effects of Arsenate and Chromate Incorporation on the Schwertmannite Structure
17
2.3. Results
2.3.1. X-Ray Diffraction Data
The method of powder X-ray diffraction (XRD) was used to prove schwertmannite formation
and to describe changes in its crystal structure which could be a result either of the used
synthesis method or the different synthesis solution composition. No differences were
observed between samples produced by the “oxidative synthesis” and the “synthesis in
Fe(III)-solutions”. Both diffractograms showed the characteristic schwertmannite pattern,
marked by eight broad peaks (Fig. II.2-1).
Variation in the sample composition was reached by adding of different amounts of arsenate,
chromate, phosphate and molybdate into the synthesis solution. In Table II.2-4 these
compositions are presented. Incorporation of arsenate during the precipitation of
schwertmannite strongly influenced the XRD pattern of the resulting sample. As shown in
Fig. II.2-4, an increasing ratio of As:S in the synthesis solution or in the resulting solid sample
(Sh-S-As-1, S-As-2.5, S-As-5 and As-10) effected the disappearance of all schwertmannite-
characteristic peaks.
Fig. II.2-4 X-ray powder diffraction pattern of samples,synthesized with increased As:S-ratio in the synthesis solutions.
increasing As
0,500,360,280,230,190,170,150,13
d-value (nm)
Sh-S-As-1
S-As-2.5
S-As-5
As-10
While the diffraction pattern
of the sample Sh-S-As-1 (with
5.6 wt-% As and 2.77 wt.-%
S) was still identical to pure
(As-free) schwertmannite,
sample S-As-2.5 already
showed some differences:
the XRD-peaks were broader,
the background noise were
stronger and a new broad peak
with a maximum at 0.32 nm
formed. Further addition of
arsenate enhanced this effect:
the schwertmannite structure
disappeared and two new
peaks (0.32 and 0.16 nm)
developed.

II.2. Effects of Arsenate and Chromate Incorporation on the Schwertmannite Structure
18
This indicated the formation of a new solid iron-arsenate phase of very low crystallinity.
Therefore, the prefix “Sh” in front of the sample name which indicated an evidence of
schwertmannite crystallinity by XRD, was not used for samples with high arsenic content.
The maximum content of arsenate in a synthesis solutions still resulting in the formation of
schwertmannite probably amounts to between 0.8 and 1 mmol·L-1.
An increased phosphate concentration in the synthesis solution of schwertmannite had the
same effect in the XRD pattern as demonstrated for arsenate. The schwertmannite crystallinity
decreased and two new peaks formed at the same location as demonstrated for the arsenated
samples (see appendix A).
In contrast to phosphate and arsenate, a complete exchange of sulfate by chromate in the
synthesis solution of schwertmannite provoked the characteristic XRD pattern of
schwertmannite (Fig. II.2-5). Merely a slightly increasing background noise in the chromated
samples was observed.
Unit-cell edge lengths were calculated with the program “winfit” (H. Stanjek, Technical
University of Munich) of the sample Sh-Cr-10 which contained chromate instead of sulfate.
In Table II.2-1, the calculated results are compared to the cell parameters of pure
schwertmannite. Both are of tetragonal symmetry, but the unit cell parameter of c0 in
chromated schwertmannite was with 0.3 nm only half as long as that observed in pure
schwertmannite.
0,510,420,360,320,280,250,230,210,200,180,170,160,150,140,13
d-value (nm)
Sh
Sh-Cr-10
Fig. II.2-5 X-ray powder diffraction pattern of schwertmannite containing sulfate (above)and chromate (below) in its structure.

II.2. Effects of Arsenate and Chromate Incorporation on the Schwertmannite Structure
19
A complete exchange of sulfate by molybdate, another tetrahedrally coordinated oxyanion
with a hexavalent cation (similar to chromium and sulfur) in schwertmannite was not possible
as XRD measurements demonstrated (Fig. II.2-6).
2.3.2. Processes and Products of Schwertmannite Synthesis
The chemical processes which occurred during schwertmannite synthesis were examined for
both methods: the “synthesis in Fe(III)-solutions” and the “oxidative synthesis”.
Synthesis in Fe(III)-solutions
The formation of schwertmannite by the reaction of 40 mM iron(III) and 10 mM sulfate in a
dialysis bag was completed after ∼ four weeks. The precipitate had a dry weight of 1.93 g.
The analysis of its chemical composition (Table II.2-4A) suggested that the total amount of
iron, but only 40 % of the sulfate, were consumed for the schwertmannite production.
Equation II.2-2 quantifies this reaction (data in mM).
40 FeCl3·6 H2O + 10 Na2SO4 à 2.5 Fe16O16(OH)10.9(SO4)2.55
+20 Na+ + 120 Cl-+3.6 SO42- + 107 H+ + 172 H2O [II.2-2]
During the dialysis Na+, Cl-, a bulk of SO42- and protons gradually diffused out of the dialysis
bag into the deionised and daily changed water which surrounds the bags. After the electric
conductivity in this water was constantly < 5 µS, the reaction was completed.
The suspensions inside the dialysis bags were analysed (from the samples Sh, Sh-S-As-1, S-
As-5, Sh-S-Cr-1, Sh-S-Cr-5, Sh-S-P-1, and P10) by periodic measurements of pH, Fe(tot),
SO42- As(tot) and Cr(tot) and the precipitated solid phase was examined after 10 and 18 days
by XRD.
1,010,630,460,360,300,250,220,200,180,160,150,13
d-value (nm)
Fig. II.2-6 X-ray powderdiffraction pattern of aniron(III)-molybdateprecipitate. The synthesisoccurred analogue toschwertmannite withmolybdate instead ofsulfate in the synthesis-solution.

II.2. Effects of Arsenate and Chromate Incorporation on the Schwertmannite Structure
20
In all synthesis solutions the dissolution of FeCl3 salt or the hydrolysis of iron(III) resulted in
a similar release of acid. The starting pH was 1.5 and during the following weeks of dialysis it
increased up to 4 (Fig. II.2-7).
The precipitation rate of the oxyanions (from solution into solid) was highest for arsenate,
because after 5 to 6 days 99 % were displaced from solution. The removal of chromate lasted
2 - and that of sulfate about 10 more days (Fig.II.2- 8). Dissolved iron was in all suspensions
below the detection limit.
1,E-02
1,E-01
1,E+00
1,E+01
1,E+02
1,E+03
1,E+04
0 2 4 6 8 10 12 14 16 18 20 22 24 26 28 30
days
c (A
sO4,
CrO
4)
(µm
ol/L
)
1,E+00
1,E+01
1,E+02
1,E+03
1,E+04
1,E+05
c (S
O4)
(µ
mo
l/L)
chromate (Sh-S-Cr-1) arsenate (Sh-S-As-1) sulfate(Sh-S-As-1)
sulfate(Sh-S-Cr-1) sulfate(Sh)
1,0
1,5
2,0
2,5
3,0
3,5
4,0
4,5
5,0
1 3 5 7 9 11 13 15 17 19 21 23 25 27 29 31 33
days
pH
-val
ue
Sh Sh-S-Cr-1 Sh-Cr-S-5 Sh-As-S-1 As-S-5 Sh-P-S-1 P-S-10
Fig. II.2-7 Variationof pH as a function oftime during theformation of thesamples Sh, Sh-S-As-1, S-As-5, Sh-S-Cr-1,Sh-S-Cr-5, Sh-S-P-1,S-P-10 in thesynthesis-suspensionsinside the dialysis-bags.
Fig. II.2-8 Variationof the oxyanion-content as a functionof time during theformation of thesamples Sh, Sh-S-As-1, Sh-S-Cr-1 in thesynthesis-suspensionsinside the dialysis-bags.

II.2. Effects of Arsenate and Chromate Incorporation on the Schwertmannite Structure
21
The XRD pattern of the filtrated solid (sample Sh) hardly showed the characteristic peaks of
schwertmannite after ten days. After 18 days the complete schwertmannite pattern was visible
(Fig. II.2-8).
Depending on the composition of the synthesis solution, differently composed solids with the
crystallinity of schwertmannite (mineralogical evidence by XRD) were produced.
Table II.2-4A shows the concentrations of the dissolved salts added to the synthesis solutions
and the composition of the resulting schwertmannite solids. Besides the calculated chemical
formulas, the ratio of iron to the sum of the oxyanions is presented which is a characteristic
value for iron-sulfate minerals. Pure schwertmannite has a value of eight, if no oxyanions are
adsorbed to its surface. Accordingly, a value of five in schwertmannite means that 33 % of
total sulfate is adsorbed and a value of eight that no sulfate is adsorbed but only structurally
incorporated. The calculated chemical formulas of the resulting schwertmannite samples
demonstrate a competition of the oxyanions to incorporate into the structure. E.g., in sample
Sh-S-Cr-10, similar amounts of sulfate (10 mmol L-1) and chromate (8.6 mmol L-1) were
added to the solution and in the end more chromate was incorporated in schwertmannite (unit
cell formula: Fe16O16(OH)11.5(SO4)0.7 (CrO4)1.5). The affinity is highest for arsenate and
phosphate, followed by chromate and finally sulfate.
40
60
80
100
0,510,380,310,260,230,200,180,160,150,14
d-value (nm)
Inte
nsi
ty (
%)10 days
18 days
Fig. II.2-8 X-ray powder diffraction pattern of two evolution phases of schwertmannite formation(after 10 and 18 days of dialysis-start).

II.2. Effects of Arsenate and Chromate Incorporation on the Schwertmannite Structure
22
Table II.2-4 Schwertmannite-synthesis experiments
A) Precipitates with schwertmannite structure (evidence by XRD), produced by “synthesis in Fe(III)solutions”. Composition of the synthesis solution and the formed solid (ref. to dry weight) after 30 days.
composition of thesynthesis solution(mmol·L-1)
composition of the schwertmannite solid(wt. %)
chemical formula Ratio ofFe/Oxyanion
sample name
Fe ±± s S ±± s As/P/Cr ±± s
Sh 40 Fe + 10 SO4 44.1 0.8 4.1 1.1 - - Fe16O16(OH)10.9(SO4)2.6 6.3Sh-S-As-1 40 Fe + 10 SO4 + 0.72 AsO4 43.3 1.2 2.8 0.6 5.6 0.3 Fe16O16(OH)7.8(SO4)1.8 (AsO4)1.5 4.8Sh-S-P-1 40 Fe + 10 SO4 +1.05 PO4 33.3 1.7 1.5 0.7 3.7 0.9 Fe16O16(OH)10.3(SO4)1.2(PO4)1.1 6.9Sh-S-Cr-1 40 Fe + 10 SO4 + 0.86 CrO4 32.9 0.5 2.4 1.4 0.8 0.7 Fe16O16(OH)11(SO4)2(CrO4)0.4 6.5Sh-S-Cr-2.5 40 Fe + 10 SO4 +4.15 CrO4 31.5 1.9 1.9 1.6 1.1 0.4 Fe16O16(OH)11.5(SO4)1.6(CrO4)0.6 7.2Sh-S-Cr-5 40 Fe + 10 SO4 + 4.31 CrO4 36.3 3.6 2.1 0.8 2.5 1.1 Fe16O16(OH)10.43(SO4)1.6(CrO4)1.2 5.7Sh-S-Cr-10 40 Fe + 10 SO4 + 8.62 CrO4 39.6 1.1 1 0.7 3.6 1.4 Fe16O16(OH)11.5(SO4)0.7 (CrO4)1.5 7.2Sh-Cr-10 40 Fe + 8.62 CrO4 41.2 1.8 0 0 6.9 0.5 Fe16O16(OH)10.2(CrO4)2.9 5.7Sh-S-As-Cr 40 Fe + 10 SO4 + 0.72 AsO4
+ 0.86 CrO4
40.3 - 2.6 - As: 5.2Cr: 0.9
- Fe16O16(OH)7.2(SO4)1.8(AsO4)1.5 (CrO4)0.4 4.6
Sh-S-As-P 40 Fe + 10 SO4 +0.72 AsO4 + 1.05 PO4
40.4 - 2.2 - As: 3.8P: 2.8
- Fe16O16(OH)9.6(SO4)1.5(AsO4)1.1 (PO4) 6.1
Sh-S-As-P-Cr 40 Fe +10 SO4 +0.72 AsO4 + 1.05 PO4 +0.86 CrO4
41.9 - 1.9 - As:3.7Cr:0.8
- Fe16O16(OH)9,6(SO4)1.3(AsO4)1.1
(CrO4)0.3(PO4)5.9
Sh-As-Cr 40 Fe+0.72 AsO4+8.6 CrO4
42.9 - 0 - As: 3.8Cr: 5.8
- Fe16O16(OH)8.2(AsO4)1.04(CrO4)2.3 4.8
In Table II.2-4B the compositions of the synthesis solutions are presented which did not form
schwertmannite after dialysis, as XRD measurements prove (demonstrated for example in
Fig.II.2-4). The synthesis solutions of these X-ray amorphous samples contained high
amounts of arsenate, phosphate or molybdate.
Table II.2-4 Schwertmannite synthesis experiments
B) Precipitates with no definable structure (evidence by XRD) produced by “synthesis in Fe(III)solutions”.Composition of the synthesis solution after 30 days.
samplename
composition of the synthesis solution(mmol·L-1)
As-S-2.5 40 Fe + 10 SO4 + 1.8 AsO4
As-S-5 40 Fe + 10 SO4 + 4.6 AsO4
As-10 40 Fe + 7.2 AsO4
P-S-4.4 40 Fe + 10 SO4 + 4.63 PO4
P-10 40 Fe + 10.52 PO4
Mo-10 40 Fe + 10 MoO4
Synthetic schwertmannite with different amounts of sulfate and arsenate is of orange-red
colour. Increasing amounts of chromate darken the solid insofar as Sh-Cr-10 which consists
of chromate as single oxyanion is coloured in dark brown.
The surface area of the produced schwertmannite samples varied with the chemical
composition between 160 m2·g-1 and 300 m2·g-1. However, no direct dependency of the
surface area on the mineral composition was observed (more exact results are presented in
II.6.1). Similarly, no significant differences of the precipitates were observed by the analysis

II.2. Effects of Arsenate and Chromate Incorporation on the Schwertmannite Structure
23
of the particle morphology using SEM: all the graphs showed spherical and fluffy
schwertmannite particles with a size of ~ 0.5 µm in diameter (see appendix D).
Oxidative synthesis
Schwertmannite formation in a solution of Fe(II) sulfate with H2O2 as oxidant was
approximately quantified by the equation II.2-3 (data in mM):
20 FeSO4+11.85 H2O2 à Fe16O16(OH)7.7(SO4)4.1+15.9 SO42-+ 16 H++4 Fe3+ [II.2-3]
After several hours a constant pH value of 2.4 was measured.
The resulting precipitate of schwertmannite contained more sulfate compared to
schwertmannite produced by dialysis (Table II.2-4C and II.2-4A). This was explained by the
higher input of sulfate (the ratio of Fe:S is 1:1) and the reaction in a closed system. Due to the
sulfate excess, no exchange experiments with other oxyanions as described for the “synthesis
in Fe(III)-solutions ” were possible. Addition of arsenate into the iron-sulfate solution resulted
in a similar high arsenic incorporation into schwertmannite (4.99 wt.-%) as described for the
synthesis in Fe(III)-solutions (5.6 wt.-%). The incorporation capacity for chromate was more
limited (< 1.6 wt.-% Cr).
Table II.2-4 Schwertmannite synthesis experiments
C) Precipitates with schwertmannite structure (evidence by XRD) produced by the “oxidative synthesis”.Composition of the synthesis solution and the resulting solid (ref. to dry weight).
composition of the schwertmannite solid(wt.-%)
samplename
composition of thesynthesis solution(mmol·L-1)
Fe ±± s S ±± s As/Cr ±± s
chemical formula Ratio ofFe/Oxyanion
Sh-H2O2 20 FeSO4 41 1.06 5.9 1.7 - - Fe16O16(OH)7.7(SO4)4.1 4.8Sh-H2O2-As 20 FeSO4 + 1AsO4 40.7 - 6.7 1.9 As: 4.99 1.1 Fe16O16(OH)4.14(SO4)4.62 (AsO4)0.87 4.9Sh-H2O2-Cr 20 FeSO4 + 1CrO4 38.7 - 6.4 2.0 Cr: 1.56 0.9 Fe16O16(OH)6.78(SO4)4.61(CrO4)0.69 4.0
Compared to the samples produced by the “synthesis in Fe(III) solutions”, a big difference
was found by measurements of the surface area. This turned out to be nearly 10 times smaller
for samples synthesised by “oxidative synthesis” (~ 25 m2·g-1). Investigations by SEM
confirmed this observation, because the particles were formed (or agglomerated) to smooth
nuggets with no crystalline shape (shown in appendix D).
Due to these differences, all further examinations of schwertmannite (adsorption, stability)
were conducted with samples produced by “synthesis in Fe(III) solutions”.

II.2. Effects of Arsenate and Chromate Incorporation on the Schwertmannite Structure
24
2.3.3. Changes in Schwertmannite Suspensions over Time at pH 2 and 4
Release of Iron, Sulfate, Arsenate and Chromate
Suspensions of arsenated, chromated, phosphated and pure schwertmannite (samples Sh-S-
As-1, Sh-S-Cr-1, Sh-Cr-10, Sh-S-P-1, Sh) were kept at constant temperature (20 °C) and
constant pH (each at 2 and 4) in closed vessels over 362 days. The release of iron, sulfate and
the other oxyanions from the solid to the aqueous phase were continuously determined. Table
II.2-5 is representing the activities of these ions (except of phosphate which was not
measured) in the end of the experiment.
Table II.2-5 Composition of the suspensions kept at constant pH of 2 or 4 in the beginning and in theend of the stability experiment. In the beginning, the solid dry weight in all samples was 0.75 g⋅L-1
with an iron content of c = 7.76 mM.
release after 360 days (activity)Samplename
pH SO42- in solid
(mmol⋅⋅g-1)CrO4
2-, AsO43-, PO4
3-,in solid (mmol ⋅⋅g-1)
added NaOH(mM)
added HNO3
(mM)Fe (mM) SO4
2-(mM) ∑∑ Ox.(mM)1
Sh 2 1.281 - - 9.88 2.913 0.737 0.737
Sh 4 1.281 - 1.11 0.05 < 0.01 0.213 0.213
Sh-S-As-1 2 0.838 AsO43-: 0.756 - 10.51 2.603 0.425 0.571
Sh-S-As-1 4 0.838 AsO43-: 0.756 0.11 0.005 < 0.01 0.236 0.236
Sh-S-P-1 2 0.464 PO43-: 1.201 - 11.9 1.985 0.481 n.m.2
Sh-S-P-1 4 0.464 PO43-:: 1.201 0.06 - < 0.01 0.184 n.m.2
Sh-S-Cr-1 2 0.755 CrO42-: 0.016 - 10.24 3.132 0.427 0.496
Sh-S-Cr-1 4 0.755 CrO42-: 0.016 0.035 - < 0.01 0.246 0.257
Sh-Cr-10 2 - CrO42-: 1.333 - 9.60 3.042 - 0.354
Sh-Cr-10 4 - CrO42-: 1.333 0.008 - < 0.01 - 0.155
1 total amount of released oxyanions (sulfate + arsenate + chromate); 2 phosphate was not measured
At pH 2 high activities of iron in all suspensions indicated a dissolution of the solid. The
highest dissolution was observed for pure and chromated schwertmannite (release of 2900-
3100 µM Fe), whereas dissolution of arsenated and phosphated schwertmannite was
obviously minor (1900-2600 µM Fe). The total release of oxyanions (sulfate + chromate +
arsenate) was lowest for chromated schwertmannite (without sulfate) as shown in Table II.2-
5. However, arsenate is the lowest concentrated oxyanion (Fig. II.2-10). Moreover, the
releasing rates of arsenate and chromate differed: while at pH 2 the released arsenate
gradually amounted until ~ 120 days after the beginning of the experiment and finally reached
a maximum of 150 µM, the released concentrations of chromate were at the same pH already
after ~100 days at a constant maximum of about 350 µM (Fig. II.2-10). In all solutions kept at
pH 4 no iron, small amounts of sulfate (200 –250 µM) and chromate (< 120 µM) and hardly
any arsenate (< 0.1 µM) were detected over time (Table II.2-5 and Fig. II.2-10).

II.2. Effects of Arsenate and Chromate Incorporation on the Schwertmannite Structure
25
Variation in Crystal Structure
All XRD patterns of precipitates obtained from the suspensions kept at pH 4 showed the
characteristic features of schwertmannite in the end of the experiment after 362 days (Fig.II.2-
11). As opposed to arsenated, chromated and phosphated schwertmannite solely in the sample
of pure schwertmannite other peaks (e.g. at 0.418 nm) appeared and the intensity of the peak
at 0.156 nm increased. In chromated, arsenated and phosphated samples these changes were
not observed.
In the suspensions kept at pH 2, a considerable part of the solid (~ 40 %) dissolved over time.
The small residues showed features of schwertmannite in their XRD pattern but some peaks
partly disappeared.
Fig. II.2-10 Variation of arsenate- and chromate- concentrations as a function of time during thesuspension of schwertmannite samples (Sh-S-As-1, Sh-S-Cr-1, Sh-Cr-10) at constant pH of 2 or 4
(the appendix “-2” or “-4” mark the pH-value).
0
40
80
120
160
0 100 200 300 400time (days)
0
0,02
0,04
0,06
0,08
0,1
0,12
Sh-S-As-1-2 Sh-S-As-1-4
0
100
200
300
400
0 100 200 300 400
time (days)
Sh-Cr-S-1-4 Sh-Cr-10-2
Sh-Cr-10-4 Sh-Cr-S-1-2
c A
sO4 (µ
M),
pH
2
4 (µ
M),
pH
2 a
nd
4
4(µ
M),
pH
4

II.2. Effects of Arsenate and Chromate Incorporation on the Schwertmannite Structure
26
These results were confirmed by FTIR spectroscopic investigations of the solid samples
performed every several weeks during the experiment: At pH 4 all solids except that of pure
schwertmannite showed approximately the same pattern as in the beginning of the experiment
(the same as described for schwertmannite by Bigham et al., 1990). At pH 2 the complete
schwertmannite IR spectrum was unchanged in all samples after one year.
2.3.4. Adsorption Capacity for Arsenate and Chromate
The surface of pure schwertmannite, prepared after the synthesis method, had an area of
195 m2·g-1. In this study, quantitative adsorption of arsenate and chromate to schwertmannite
in dependence on pH (between 2.5 and 4.5), concentration of adsorbate (1·10-4 M, 1·10-3 M
and partly 5·10-3 M ) and adsorbent (1 g·L-1 and 4 g·L-1) was examined. The adsorption in the
investigated range of pH, was of little pH dependence. Table II.2-6 shows the maximum
amount of adsorbed oxyanions, the amount of simultaneously released sulfate and the
corresponding pH.
Table II.2-6 Schwertmannite adsorption capacity (maximum value) for arsenate and chromate,corresponding pH and release of sulfate in dependence on the concentrations of adsorbate and
adsorbent (concentrations in mM).
1 g·L-1 4 g·L-1
adsorbateaddition
pH adso
rbed
AsO
4/ C
rO4
SO4
rele
ase
pH adso
rbed
AsO
4/ C
rO4
SO4
rele
ase
0.1 AsO43- 3.9 0.099 0.39 3.6 0.099 0.66
1 AsO43- 3.9 0.969 0.63 4.1 0.999 1.35
5 AsO43- 4.0 4.775 0.59 - - -
0.1 CrO42- 4.4 0.098 0.18 3.9 0.099 0.93
1 CrO42- 3.5 0.883 0.30 4.3 0.975 0.69
1 g·L-1 schwertmannite adsorbed from a solution of c=10-4 M chromate or arsenate nearly 100
%. From a 10-3 M adsorbate solution, 1 g·L-1 schwertmannite adsorbed nearly 100 % arsenate
and 88 % chromate. A further increase of the arsenate concentration to c = 5·10-3 M showed
that even 4.7 mmol·g-1 arsenate were enriched in schwertmannite.
To quadruplicate the amount of schwertmannite (4 g·L-1), nearly 100 % of both oxyanions
from a c=10-3 M were adsorbed. Outside the observed pH range (2.5 to 4.5) of
schwertmannite stability, the pH dependency of adsorption for both oxyanions was much

II.2. Effects of Arsenate and Chromate Incorporation on the Schwertmannite Structure
27
stronger, but due to potential dissolution and transformation reactions of schwertmannite
under these conditions (Bigham et al., 1990), quantification was not possible and therefore not
further considered in this study.
The suspension of schwertmannite in different adsorbate solutions involves the release of
sulfate. The sulfate concentrations which correspond to adsorption maxims are presented in
Table II.2-6. The release of sulfate is strongly dependent on pH and increases with increasing
pH. Compared to chromate solutions, in arsenate solutions the sulfate release is higher and an
increased amount of schwertmannite resulted in slightly higher sulfate concentrations (0.6 to
1.3 mM·g-1).
2.3.5. Enrichment of As and Cr in Natural Schwertmannite
Schwertmannite was identified at several locations in both of the two investigated former
mines (Fig. II.2-3). The range of arsenic and chromium concentrations, measured in NH4-
oxalate extracts of schwertmannite precipitates and in the drainage water of the corresponding
sampling sites are presented in Table II.2-7 (8 to 10 sampling sites of water and
schwertmannite precipitate in each mine, see appendix B). Results suggest a strong
enrichments of Cr (up to 800 ppm) and As (up to 6700 ppm) in schwertmannite. In contrast to
these precipitates, concentrations in water reached only in few cases values > 100 ppb.
Concentrations were usually low and partly undetectable.
Table II.2-7 Range of As- and Cr-concentrations determined in AMD waters and in associatedschwertmannite containing precipitates (each 8 to 10 measurements) sampled in the former mines
“Saalfelder Feengrotten” (D) and “Prybyslav (Cz).
Mine drainage water Precipitate of Schwertmannite
Astot (ppb) Crtot (ppb) Astot (ppm) Crtot (ppm)
Saalfelder Feengrotten (D) 0 - 35 0-19 54 - 1594 10 - 296
Prybyslav (Cz) 0 - 235 0 - 174 560 - 6740 812 -100

II.2. Effects of Arsenate and Chromate Incorporation on the Schwertmannite Structure
28
2.4. Discussion
2.4.1. Tunnel Sulfate, Arsenate or Chromate in Schwertmannite
According to Bigham et al. (1990, 1994), sulfate is incorporated into caves of the
schwertmannite tunnel structure. Due to a direct binding of sulfate oxygen atoms to oxygen
atoms of the iron-hydroxide octahedra, sulfate is specifically (“structurally”) bound to
schwertmannite by the formation of bidentate binuclear complexes (Fe–O–S(O2)–O–Fe, Fig.
II.2-2). Recently some authors doubted this theory and stated that sulfate is exclusively bound
by inner- and outer-sphere adsorption to akaganéite (β-FeOOH) whose structure is marked by
tunnel caves which are either occupied by (outer-sphere bound) chloride or fluoride or are
unassigned (Waychunas et al., 2000). The characteristic XRD pattern of schwertmannite (Fig.
II.2-1) with different (compared to akaganéite) crystallographic cell parameters (Table II.2-1)
obtained in this study, is in accordance with the structure determinations of Bigham et al.
(1990) and serves as evidence for structural changes as a result of structurally bound sulfate.
Moreover, it seems not probable that high amounts of sulfate (1.25 mmol·g-1) in
schwertmannite are exclusively adsorbed to the surface (200 m2·g-1). And only a part of the
total sulfate (< 0.6 mmol·g-1) was desorbable in highly concentrated arsenate (c= 5 mM)
solutions. Therefore, the theory of sulfate bound in tunnel caves of schwertmannite (Bigham
et al., 1990) serves as a basis for further argumentation in this study.
Arsenate and chromate enriched in Schwertmannite
The analysis of both, synthetic and naturally formed schwertmannite (Table II.2-4 and Table
II.2-7, respectively) have shown that this mineral can incorporate high amounts of arsenic or
chromium. Therefore, schwertmannite could act as a sink for these toxic elements in
contaminated waters. Similar “cleaning effects” of schwertmannite were already described by
Rüde et al. (1999) for a natural stream (Rötlbach, Zillertaler Alps) in which the spring water
was highly enriched with arsenic. After the formation of schwertmannite, the arsenic
concentration decreased below detection limit in the stream water and As accumulated up to
1000 ppm in precipitates of schwertmannite.
Due to its low stability resulting in dissolution or transformation of this mineral (Bigham et
al., 1996) a release of these molecules should be expected by ageing or by change of
hydrochemical parameters. Depending on the bonding strength or the bonding type of the
oxyanions, the potential resulting contamination could differ. Structural incorporation by
sulfate substitution, specific- or non specific adsorption and coprecipitation of a secondary

II.2. Effects of Arsenate and Chromate Incorporation on the Schwertmannite Structure
29
phase are the possible and presently discussed mechanisms of the incorporation of arsenate
and chromate to schwertmannite.
Although incorporation of arsenate and chromate takes place in schwertmannite, produced by
both synthesis methods (oxidative synthesis and synthesis in Fe(III)-solutions , Table II.2-4),
this discussion only refers to results obtained for samples produced by synthesis in Fe(III)-
solutions. Reason for this was the low surface area of the particles (5-20 m2·g-1) produced by
oxidation of FeSO4. Therefore, they are difficult to compare with samples synthesised by
dialysis and which show a very high surface area of 100-300 m2·g-1.
2.4.2. Solid Solution or Coprecipitation of a Secondary Phase
Substitution of Sulfur in Minerals
Solid solutions in minerals generally depend on the particular ionic radii and charge of the
substituted compounds (Goldschmidt, 1937). Little differences of these features exist between
the anions sulfate, arsenate, chromate, phosphate or molybdate (Table II.2-3). Therefore,
exchanges of these anions can be expected in crystal structures. However, a substitution of the
tetrahedrally coordinated sulfur by other cations was rarely observed in most sulfate mineral
structures described in literature (Hawthorne, et al., 2000). Few exceptions were found in
minerals, such as a substitution of sulfur by molybdenum in vergasovaite
(Cu3O[(SO4)(Mo,S)O4)]) (Berlepsch et al., 1999) or by chromium in hashemite
(Ba[(Cr,S)O4]) (Duesler & Ford, 1986). Heterovalent isomorphism as an exchange of S6+ by
P5+ was also observed as described for woodhouseite (Kato, 1977) and svanbergite (Kato &
Miura 1977), respectively. The charge balance was then given as [P5+O3(OH)]2- for [SO4]2-.
The same scheme is valid for the sulfur substitution by arsenic in beudantite where the
tertahedrally coordinated sites consist of 53.5 % As and of 46.5 % S (Szymanski, 1988).
According to these references an exchange of sulfate in schwertmannite by other oxyanions
(chromate, phosphate, arsenate or molybdate) seems, at least partly, possible.
Structure and Structural Changes of Schwertmannite and its Solid Solutions
In this study, the mineralogy of both, synthesised and natural solid samples was investigated
by XRD analysis. Compared to the XRD patterns of well crystalline minerals with definite
peak positions as observed in this and described in other studies (Cornell & Schwertmann,
1996) for the Fe(III) hydroxides goethite (α-FeOOH) or akaganéite (β-FeOOH), the pattern of
schwertmannite is, due to its low crystallinity, hardly to identify (Fig. II.2-1). According to
Bigham et al. (1990), the XRD pattern of schwertmannite is marked by eight broad peaks.

II.2. Effects of Arsenate and Chromate Incorporation on the Schwertmannite Structure
30
Their position and corresponding hkl indices are presented in Table II.2-2 and compared to
akaganéite.
The results obtained by XRD showed that a complete substitution of sulfate by chromate in
schwertmannite is possible (Fig. II.2-5). However, minor differences between the patterns of
pure and chromated schwertmannite were observed (Table II.2-1) which can be explained by
different ionic radii of the two molecules (Table II.2-3). It was assumed that chromate
incorporates similar to sulfate in the tunnel cavities of schwertmannite. However, due to the
slightly larger ionic size of chromate, a more enhanced distortion of the crystal unit cell
results and therefore crystal growth is more reduced. As a consequence of this minor
structural change, the peaks on the diffraction pattern slightly shifts (Table II.2-2) and a
change of the unit cell parameters was obtained (the c-dimension halves, (Table II.2-1). It is
known that the symmetry of the unit cell influences the crystal growth and correspondingly
the macroscopic morphology (Cornell & Schwertmann, 1996). The incorporation of chromate
results in a more limited crystal growth and therefore in smaller particles, because the
schwertmannite crystal-needles are getting thinner. This was indirectly observed by scanning
electron microscopy: The obtained pictures of chromatised schwertmannite became, due to
smaller particle size, indistinct (therefore they were just presented in appendix D). However,
this is only a presumption, because other factors such as solution chemistry, have a stronger
influence in mineral morphology. Compared to the cell parameters of akaganéite and goethite
which are mineralogically related to schwertmannite, the differences between sulfated and
chromated schwertmannite are very small (Table II.2-1).
A similar solid solution effect, as shown for sulfate by chromate in schwertmannite, was
already demonstrated for the anion selenate (SeO42-) by Bigham et al. (1990). Therefore, it
could be assumed that divalent oxyanions of tetrahedrally coordinated cations, can be
incorporated into the schwertmannite tunnel structure. However, in this study it was shown
that other factors also influence the substitution, because a complete exchange of sulfate by
molybdate (MoO42-) in schwertmannite was not possible, as the XRD pattern in Fig.II.2-6
demonstrates. Presumably the larger size of this molecule (Table II.2-3) inhibits ist integration
into the structural tunnel positions of schwertmannite.
Incorporation of trivalent oxyanions, such as arsenate and phosphate, is limited as results
obtained by XRD show (Fig. II.2-4). Carlson et al. (2001) confirmed a substitution
dependency on the oxyanion charge by XRD analysis of similarly produced arsenate
schwertmannite samples. Schwertmann et al. (1996) also showed that a nitrate incorporation
in schwertmannite is possible.

II.2. Effects of Arsenate and Chromate Incorporation on the Schwertmannite Structure
31
According to these results, it was assumed that one or two excessive electrons in the molecule
permit a complete surrogate of the tunnel sulfate (substitution) in schwertmannite, if their
ionic radius is not larger than ~ 0.24 nm. Oxyanions with three excessive electrons in high
concentrations prevent this substitution, if the molar ratio sulfate: arsenate lies below 10 : 1.
The strong affinity of these anions to iron(III) probably provokes other structures
(coprecipitation of a secondary phase).
A comparison to the sulfate-mineral group of jarosite-alunites confirms these results: This
group consists of about 40 minerals with the general formula of DG3(TO4)2(OH,H2O)6
wherein D represents cations with a coordination number ≥ 9 and G and T represent sites with
octahedral and tetrahedral coordination, respectively (Smith et al., 1998). Tetrahedra are
composed of sulfate (the most frequently occurring jarosite group), phosphate, arsenate,
chromate, molybdate or silicate. Each of them forms a different mineral subgroup and
substitution of the tetrahedra within a subgroup is limited. The synthetic chromate analogue of
jarosite (KFe3(SO4)2(OH)6) is known (Baron & Palmer, 1996a) and substantial amounts of
chromate can substitute arsenate in philipsbornite (PbAl3[(AsO4)2(OH, H2O)6]), as reported
by Walenta et al. (1982). These data verify the obtained results for schwertmannite that a
complete solid solution between sulfate and chromate is potential, whereas between sulfate or
chromate by phosphate or arsenate can be partly possible, but is always limited (due to the
high width of the XRD peaks no clear evidence can be given). Correspondingly, the charge of
oxyanions seems to have the greatest influence in inhibiting the substitution.
Formation of Schwertmannite and Substitution Affinities
The formation process of schwertmannite in the dialysis suspensions was marked by two
phases. During the first ten days, the pH in all solutions arose to a value of 4 (Fig. II.2-7) and
nearly all oxyanions (< 90 %) were removed from the solution (Fig. II.2-7). This process was
most rapid for arsenate (complete after ~ 6 days). Due to the fact that the total amount of
arsenate was finally fixed in the precipitate, a preferred complex formation of arsenate with
Fe(III) was assumed.
In the second phase of schwertmannite formation which began after ten days of the synthesis
start, the pH remained constant and the solution composition hardly varied. Instead of that, the
X-ray diffraction pattern of the solid was altered during the following days. As shown in Fig.
II.2-9, the characteristic peaks for schwertmannite in the XRD pattern developed between 10
and 18 days after the synthesis had started.

II.2. Effects of Arsenate and Chromate Incorporation on the Schwertmannite Structure
32
Due to this observation, and since the crystallisation of other iron (III) minerals in acid media
is well described (Schneider & Schwyn, 1987; Music et al., 1982; Aktinson, 1977), it was
concluded that schwertmannite forms by this process in the dialysis bags: Firstly, Fe(III)
reacted with oxygen, hydroxide, chloride and the oxyanions to form different structural
complexes (polynuclears) of varying stability. These precipitated as X-ray amorphous solids
during the first 10 days of the experiment. Complexes of lower stability (as iron chlorides)
subsequently dissolved and chloride, sodium and high amounts of sulfate and hydronium
diffused through the dialysis-bag membranes. Finally, the remaining complexes gradually re-
ordered to form polynuclears with the structure of schwertmannite. Therefore, the velocity of
schwertmannite formation was controlled by the strength of the complexed species of iron
(Fe(III) chloride, Fe(III) sulfate, Fe(III) hydroxide, Fe(III) arsenate…). The process might
have been accelerated by more enhanced frequent water changes (deionised water outside the
dialysis bags) to eliminate the chloride. Due to the presence of too much arsenate or
phosphate in the synthesis solution (more than ~ 0.04 mol per mol Fe), most iron was
complexed with these oxyanions and no (or not enough) Fe hydroxide octahedra-chains could
form which are requirement for schwertmannite formation.
The trivalent oxyanions arsenate and phosphate were strongly preferred to schwertmannite for
structural incorporation, compared to sulfate. Similar amounts of chromate and sulfate in the
solutions resulted in a marginal preference of chromate incorporation (2.9 mol chromate per
mol schwertmannite) compared to sulfate (2.6 mol sulfate per mol schwertmannite, as shown
in Tab.II.2-4A). Substitution preferences in minerals can generally be explained by their
crystal structure (or atomic distances within the structure) and by molecule bonding affinities.
Konnert et al. (1994) investigated the influence of the crystal structure on substitution in
carlosruizite (K6(Na,K)Na6Mg10[(Se,S,Cr)O4]12(IO3)12(H2O)12). This mineral contains the
cations Se6+, S6+ and Cr6+ which all occur at the same tetrahedrally coordinated site. The
formula of the unit cell consists of twelve tetrahedrally coordinated cations. The proportion of
Se:S:Cr is given as 6.4:4.4:1.2. The interpretation of this substitution distribution was given
by the distances of the cation to the oxygen. For the crystallisation of carlosruizite a mean
<(Se,S,Cr)-O> distance of 1.588 Å is required which is given by the shown proportion. In this
study, no atomic distances were determined for schwertmannite crystals. Therefore, the
optimal composition can not be calculated.
The other factor influencing the substitution preferences is the tendency of these ions to form
complexes in homogenous solutions. The affinity of the oxyanions to form complexes with
iron(III) was investigated by Dzombak & Morel (1990) for surface complexes with hydrous

II.2. Effects of Arsenate and Chromate Incorporation on the Schwertmannite Structure
33
ferric oxides (HFO). They calculated the corresponding complexation constants which
describe the intensity of the resulting complex. In Table II.2-8, the dominating equilibria at
pH 4 are presented. These values demonstrate that the complexes between Fe(III) and
arsenate are strongest, followed by Fe(III) and chromate and at last by Fe(III) and sulfate.
According to Cornell & Schwertmann (1996), binding constants for surface complexes show
the same stability trend as those for equivalent complexation reactions in solutions.
Consequently, high surface complexation constants (log K in Tab. II.2-8) correspond to high
adsorption and high complexation affinities. Therefore, the oxyanion incorporation affinity in
schwertmannite can be explained with the order of these constants: the higher the surface
complexation constants, the higher the affinity of iron to react with the corresponding
oxyanion and the more stable is the formed complex.
Table II.2-8 Surface complexation constants of anions complexed with hydrous ferric oxide(Dzombak & Morel, 1990). Constants correspond to surface complexes, dominating at pH 3-4.
complex reaction at equilibrium Log K
≡FeSO4-
4
4
HSOFeOH
FeSOK
⋅≡≡
=−
7.78
≡FeCrO4-
4
4
CrOHFeOH
FeCrOK
⋅≡≡=
−10.85
≡FeH2AsO4
42
42
AsOHFeOH
AsOFeHK
⋅≡≡
=−
29.31
≡FeH2PO4
42
42
POHFeOH
POFeHK
⋅≡≡
=−
31.29
2.4.3. Influence of Arsenate and Chromate on Schwertmannite Stability
Synthesis experiments showed that high amounts of arsenate and chromate can be enriched in
schwertmannite. In consequence, schwertmannite acts as sink for these toxic elements and
therefore an industrial application to clean contaminated waters seems reasonable. However,
the metastable character of schwertmannite results in its dissolution at pH below 2.5 or in
transformation to goethite by increasing pH or by time (Bigham et al., 1996). During these
processes schwertmannite possibly releases previously bound toxic substances and therefore
this mineral could also act as a source of contamination. To investigate the influence of
incorporated oxyanions on schwertmannite stability and to quantify the oxyanion release in
dependence on time at constant pH (2 or 4), a long term (1 year) stability experiment with
schwertmannite and with schwertmannite containing arsenate, phosphate and chromate was
performed.

II.2. Effects of Arsenate and Chromate Incorporation on the Schwertmannite Structure
34
The results suggest that chromate, phosphate and arsenate have a stabilising effect and thus
prevent structural variation of schwertmannite caused by time. In suspensions, kept at pH 2, a
considerable part of pure schwertmannite at pH 2 was dissolved at the end of the experiment
(37 % of total iron and 78 % of total sulfate was released). In contrast, the dissolution process
was slowed down in samples containing other oxyanions than sulfate (Table II.2-5). At pH 4 a
part of pure schwertmannite transformed to goethite, as observed by XRD (Fig. II.2-11). This
was indicated by the formation of a new peak at 0.418 nm reflecting the 110 plane of goethite
and by the increased intensity of the peak at 0.156 nm which is typical for both minerals, but
of stronger intensity in the goethite XRD-pattern (Cornell & Schwertmann, 1996). No
features of goethite were identified in chromated, arsenated and phosphated schwertmannite.
Moreover, the total release of arsenate and chromate (0.02 to 0.1 µM AsO43- and 100-150 µM
CrO42-) was lower than the release of sulfate (each ~ 200 µM) during the reaction time.
Additionally, differences in the releasing rate of oxyanions indicated the stabilising influence
of arsenate (Fig. II.2-10). At pH 2, the release of arsenate (max. 150 µM) steadily increased
over the whole time scale, whereas the release of sulfate and chromate (max. 350 µM) was
already constant after about 150 days. Due to these results, it was assumed that arsenate and
chromate incorporation in schwertmannite retarded dissolution, transformation and the
consequent release of toxic elements. Arsenate (and potentially phosphate which was not
measured) seemed to have the most stabilising influence, followed by chromate. This
stabilising influence is a consequence of the stronger bonding between Fe(III) and arsenate,
Fig. II.2-11 X-ray powderdiffraction pattern of pure-,arsenated- and chromatedschwertmannite (samples Sh,Sh-S-As-1 and Sh-Cr-10)after reaction time of 362days kept at constant pH of4. All samples show XRDfeatures of schwertmannite.Arrows in sample “Sh” markpeaks of goethite.
40
50
60
70
80
90
100
40
50
60
70
80
90
100
0,510,360,280,230,200,170,150,130,12
d-value (nm)
50
60
70
80
90
100
GtGt
Sh
Sh-S-As-1
Sh-Cr-10

II.2. Effects of Arsenate and Chromate Incorporation on the Schwertmannite Structure
35
compared to chromate or sulfate as explained in the previous chapter on substitution affinities
(Dzombak & Morel, 1990; Table II.2-8).
According to Bigham et al. (1996), it is impractical to determine a solubility product constant
for schwertmannite because of its inherent compositional variability, the occurrence of sulfate
as both, structural and adsorbed species and the apparent instability of the mineral relative to
goethite. Therefore they determined an ionic activity product (IAP) for schwertmannite
(log IAPSh = 18 ± 2.5) which describes a solubility window for schwertmannite and is valid
for low pH (otherwise transformation to goethite should be expected) and pure
schwertmannite (without arsenate, chromate, etc).
The calculated ionic activity products (IAP) of differently composed schwertmannite
determined at pH 2 differed strongly at the end of the experiment (Tab. II.2-9).
Table II.2-9 Calculation of the ionic activity product (IAP) of schwertmannite in dependence on itscomposition (reaction based on Bigham et al., 1996).
solid composition Equation for IAP Log IAP
Fe8O8(OH)5.45(SO4)1.26 LogK = 8 log a(Fe3+) +1.26 log a(SO42-) + 21.48 ·pH =18.5 ±0.2
Fe8O8(OH)3.92(SO4)0.86(AsO4)0.77 LogK = 8 log a(Fe3+) +0.86 log a(SO42-) + 0.77 a(AsO4
3-) + 20.74 ·pH =13.5 ±1.2
Fe8O8(OH)5.11(CrO4)1.44 LogK = 8 log a(Fe3+) +1.44 log a(CrO42-) + 21.12 ·pH =16.2 ±0.4
Fe8O8(OH)5.5(SO4) (CrO4)0.22 LogK = 8 log a(Fe3+) +log a (SO42-) + 0.22 log a(CrO4
2-) + 21.56 ·pH =17.9 ±0.5
The log IAP obtained for pure schwertmannite (18) confirmed results of Bigham et al. (1996)
who determined a log IAPSh of 18.5± 2.5. Chromate incorporation debases this log IAP for
two units (16.2) and arsenate for five units (13.5), compared to schwertmannite. This indicates
the strong stabilising force of these anions to the schwertmannite structure.
A similar effect was described by Baron & Palmer (1995, 1996) for jarosite, an
iron(III)sulfate mineral which can substitute sulfate by chromate. Consequently, the
chromated jarosite had a clearly lower solubility (log KSP =-18.4±0.6) compared to sulfate
jarosite (log KSP= -11.0±0.3) at 25 °C.
Figure II.2-12 shows the time dependent changes of the calculated IAP which corresponds to
the temporal equilibrium setting for the different schwertmannite samples at pH 2. After about
100 days equilibrium was adjusted for pure, chromated and phosphated schwertmannite,
whereas the constant log IAP for arsenated schwertmannite (sample Sh-S-As-1) was still not
completely reached after 280 days. Therefore, the calculated log IAP of arsenated
schwertmannite was possibly slightly underestimated.

II.2. Effects of Arsenate and Chromate Incorporation on the Schwertmannite Structure
36
2.4.4. Adsorption Process
Due to the high surface area (~ 200 m²·g-1), a high adsorption-capacity of schwertmannite for
the investigated anions was assumed. It is known that about 30 % of the total sulfate content
of schwertmannite (0.4 to 0.5 mmol·g-1) is bound to the surface of that mineral (Bigham et al.,
1990). Therefore, the adsorption of oxyanions should be considered for the incorporation of
oxyanions in schwertmannite additionally to its substitution. Surface reactions of
schwertmannite were investigated in the pH range of its stability, because dissolution at lower
values or transformation to goethite at higher values would hint the adjustment of a chemical
equilibrium (Bigham et al., 1996).
Simultaneously to the mostly pH independent adsorption of arsenate and chromate, sulfate
was desorbed from schwertmannite (Table II.2-6) with a much stronger pH dependency. With
increased pH, an excess of sulfate was measured, indicating an addition of base results in an
exchange of SO42- by OH- in schwertmannite. Potentially, this replacement at the
schwertmannite surface is the first step of transformation to goethite and involves, with
increased exchange, the demolition of the mineral structure. It was supposed that the limit
between the release of surface sulfate and structurally bound sulfate can be given if the
released sulfate exceeds the mentioned 30 % of schwertmannite surface sulfate (which is ~
0.4 mmol·g-1). However, Webster et al. (1998) stated that even 60 wt.-% (~0.8 mmol·g-1) of
all schwertmannite sulfate is adsorbed and, correspondingly higher amounts of sulfate could
get desorbed by an exchange of surface sulfate by OH groups or adsorbates. In this study,
sulfate concentration never exceeded this amount indicating that only surface sulfate was
released (in the observed pH range). An increased content of suspended adsorbent (4 g·L-1
instead of 1 g·L-1) resulted in slightly higher sulfate concentrations but not in the expected
0
5
10
15
20
25
0 50 100 150 200 250 300time (days)
Lo
gS
h IA
P
Sh-2 Sh-S-As-1-2 Sh-S-Cr-1-2 Sh-Cr-10-2
Fig. II.2-12 Variation of the ionic activity product (IAP) as a function of time calculated forschwertmannite with different anionic contents (Sh-S-As-1, Sh-S-Cr-1, Sh-Cr-10) at pH 2.

II.2. Effects of Arsenate and Chromate Incorporation on the Schwertmannite Structure
37
quadruplicate amount (Table II.2-6). This indicates that agglomeration of schwertmannite
particles in highly concentrated suspensions reduce the surface area.
Compared to the release of sulfate from schwertmannite in chromate solutions (0.3 mmol·g-1),
more sulfate was released in arsenate ones (0.6 mmol·g-1). It was assumed that arsenate
displaces the surface sulfate, whereas chromate (mostly) adsorbs additionally to sulfate.
Assuming that on the surface of iron hydroxides 4 OH groups per nm2 are located (Sigg &
Stumm, 1981), the total OH-exchange capacity of schwertmannite (with a surface area of 200
m2· g-1) should amount 1.33 mmol·g-1, if the surface would be exclusively covered with OH
groups. These OH- ions could be replaced by 0.66 mmol·g-1 bidentate-bound oxyanions. This
amount ranges between the concentrations of adsorbed sulfate determined by Webster et al.
(1998) and Bigham et al. (1990). The calculations confirmed that during adsorption
experiments only surface sulfate was released. However, measurements of arsenate adsorption
have shown that schwertmannite enriched more than 4.5 mmol·g-1 arsenate from a 5 mM
arsenate solution which could not be exclusively surface bound. Therefore, three other
processes additional to adsorption were considered: (1) The exchange of structurally bound
sulfate by arsenate in the tunnel caves of the schwertmannite crystal would implicate a release
of tunnel sulfate. However, the released sulfate concentration (< 0.63 mmol·g-1) hardly
exceeded the amount of adsorbed sulfate (0.4 to 0.6 mmol·g-1). Therefore no exchange of
tunnel sulfate by arsenate was expected. As an other possibility (2), the precipitation of a
secondary iron arsenate phase would also imply additional released sulfate, because this
process includes the dissolution of a part of schwertmannite to make Fe3+ available. More
probable (3), though, seemed the diffusion of arsenate into particle pores due to electrostatic
effects as it was described by Fuller et al. (1992) for arsenate incorporation into ferrihydrite.
This weakly crystalline Fe(III) hydroxide with a high surface area (~ 300 m2·g-1) enriched 0.1
mol As per mol Fe. They explained the incorporation as a two phase process: After a rapid
(some minutes) phase of specific adsorption, a period of gradual arsenate incorporation
followed (~ eight days). During this long time, the oxyanions attached to surface places of the
colloidal particles within the aggregates bound by electrostatic interactions (diffusive
process). No secondary arsenic-containing solid phase was formed as investigations by X-ray
spectroscopy (EXAFS) confirmed. A similar process for schwertmannite was assumed,
because its colloidal crystals also form loose and porous aggregates, in between which anions
could possibly diffuse during the reaction time of 24 h. This was shown by scanning electron
microscopy (Bigham et al., 1990, this study: chapter III and appendix D).

II.2. Effects of Arsenate and Chromate Incorporation on the Schwertmannite Structure
38
2.5. Conclusions
In this study, evidence was given that schwertmannite acts as kind of scavenger for the
investigated toxic substances arsenate and chromate. Schwertmannite samples taken in two
different, former sulfidic ore mines were highly enriched with arsenic and chromium. In
contrast, the concentrations of these elements in associated drainage waters were mostly under
detection limit. This indicates a natural cleaning system in AMD affected waters which
contain schwertmannite. Even higher amounts of arsenate and chromate were found
incorporated in synthetic schwertmannite produced in laboratory.
These high uptake capacities of the mineral schwertmannite can be explained with its crystal
structure which is marked by cavities in which oxyanions can be stored. During the formation
of schwertmannite, sulfate normally incorporates into these structural cavities. However, this
process limits the crystal growth and results in a high particle surface and a low mineral
stability. These characteristics were investigated in this study, in order to determine influences
of chromate and arsenate incorporation in schwertmannite. It was shown by X-ray diffraction
analysis that an exchange of sulfate by chromate in schwertmannite is possible whereas
arsenate, though enriched in high concentrations can be found only combined with sulfate or
chromate in schwertmannite. Even after synthesis, schwertmannite defiltrates high amounts of
chromate and arsenate from a solution. Due to the metastability of schwertmannite, its
dissolution or mineral transformation to goethite caused either by time or by changes in the
pH, can be expected. This is accompanied with a release of oxyanions which is highest for
sulfate, followed by chromate and finally arsenate. Chromate and to a greater extend arsenate
have a stabilising influence on the schwertmannite structure and thus they debase the ionic
activity product of this mineral which is lowest for arsenated schwertmannite.
In this study the method of XRD was predominantly used for descriptions of changes in the
crystal structure of schwertmannite. However, no exact quantitative differentiation was
possible between the amounts incorporated in the tunnel caves, adsorbed to the surface or
coprecipitated as secondary phase. Other methods as Mössbauer- or EXAFS (extended X-ray
absorption fine structure) spectroscopy seem to be reasonable for future examinations of
bonding types in schwertmannite.
This mineral can function as sink for arsenate and chromate and therefore should be applied to
clean contaminated waters. Furthermore, schwertmannite can potentially enrich other toxic
compounds and investigations with industrially produced schwertmannite and its use,
optimally dosed, in drinking water conditioning systems could be suggestive.

II.3. A FTIR Spectroscopical Study
39
3. A FTIR SPECTROSCOPICAL STUDY TO EXPLAIN BONDING
STRUCTURES OF OXYANIONS INTO SCHWERTMANNITE
3.1. Introduction
Schwertmannite is an oxyhydroxysulfate of iron with the general formula
Fe8O8(OH)ySOz·n H2O, where 8-y =z and 1.0 ≤ z ≤ 1.75. Due to its weak crystallinity, it is
hard to identify (Bigham et al., 1994). Just by a combination of X-ray diffractometry (XRD),
Mössbauer- and Infrared-spectroscopy a characterisation of its structure was possible
(Bigham et al., 1990). This structure was described to be akin to that of akaganéite (β-
FeOOH) which was described in literature to consist of double chains of ironoxide- and
hydroxide-octahedra, sharing corners to yield square tunnels in which (in the case of
schwertmannite) sulfate is incorporated (Bigham et al., 1990). Additionally to this structurally
bound sulfate, high amounts of this anion (~ 30 % of the total sulfate content) can also be
adsorbed to its large surface, which is ~ 200 m2·g-1 (Bigham et al., 1990).
It was supposed that schwertmannite can enrich arsenate and chromate instead of, and in
addition to, sulfate. Compared to sulfate, these toxic oxyanions are also tetrahedrally
coordinated and have nearly the same ionic radius, which is approx. 0.25 nm. Due to this
similarity they could, either completely or partly, substitute the sulfate in schwertmannite. In
this study this should be confirmed by XRD. Moreover, it was hypothesised that any
incorporation of oxyanions results in changes of the Fourier-Transformed infra red (FTIR)
spectrum of schwertmannite, which should be used to distinguish between the types of
oxyanion bondings (adsorptive and structural). Therefore, the object of this study was to
investigate bonding structures of arsenate and chromate associated with schwertmannite by
the method of FTIR spectroscopy similarly as described for sulfate (Bigham et al., 1990).
Vibration spectroscopy of schwertmannite and sulfate
Bigham et al. (1990) characterised the structure of schwertmannite by IR spectroscopy. The
spectrum of schwertmannite consists of seven to eleven IR-active bands (Tab.II.3-1), five of
which correspond to sulfate vibrations and were differentiated in structural and adsorptive
bonding.

II.3. A FTIR Spectroscopical Study
40
Tab.II.3-1 Position of absorption bands in the FTIR spectrum of schwertmannite: Measured datacompared to literature data (position and interpretation according to Bigham et al., 1990).
Position ( cm-1) thisstudy
Position (cm-1)(Bigham et al., 1990)
Interpretation(Bigham et al., 1990)
485 483 ν-FeO608 608 ν4 SO4 1
704 704 ν-FeO790-885 800-880 δ-OH976 976 ν1SO4 2
1055, 1130, 1195 1038, 1124, 1186 ν3SO4 1
1634 1634 H2O3300 3300 ν-OH
1structural -/ inner-sphere bonding; 2outer-sphere bonding
Molecules of tetrahedral symmetry as SO42- vibrate in four modes after being activated by
electromagnetic radiation. Two vibrations (ν1 and ν2) are symmetric (=IR inactive) and
therefore normally (besides some exceptions) not observable in the IR spectrum. Depending
on the coordinative environment of the molecule, the IR-active asymmetric vibrations (ν3 and
ν4) can split and with increasing complexation the number of “absorption bands” in the IR
spectra also increases (Gottwald & Wachter, 1997, Peak et al., 1999).
Four of the five sulfate absorption bands detected in schwertmannite also appear in samples of
Fe(III) minerals with sulfate exclusively adsorbed to the surface (Parfitt & Smart, 1978,
Bigham et al., 1990, Tab.II.3-3). The schwertmannite specific absorption band of sulfate is
located at 608 cm-1 in the IR spectrum, and corresponds to a ν4-vibration (Nakamoto, 1986).
Bigham et al. (1990) showed in a series of schwertmannite-akaganéite-mixing samples that,
with the appearance of this band in schwertmannite, an OH-vibration at 640 cm-1 in
akaganéite disappears simultaneously. This indicates that sulfate incorporation affects an
exchange of hydroxide groups by sulfate and therefore this band is associated to an
exclusively structural bonding of sulfate into the tunnels of schwertmannite crystals.
The three sulfate vibrations between 1000 and 1200 cm-1 in the IR spectrum of
schwertmannite correspond to a split ν3-vibration, which is associated with an innerspheric
sulfate bonding to iron minerals (Peak et al., 1999). Parfitt & Smart (1978) described this
bonding of sulfate to goethite (= α-FeOOH) as a binuclear bridging complex (Fe–O–S(O2)–
O–Fe), which can be attributed to specific adsorption and (in schwertmannite) also to
structural bonding in the tunnel structure (Bigham et al., 1990). Both complexes are the same,
because incorporation in the tunnels caves requires that the oxygen atoms of sulfate share
places with the oxygen atoms of the iron-oxide/hydroxide octahedra to form a binuclear
bridging (Bigham et al., 1990). The occurrence of these absorption bands can not be used to

II.3. A FTIR Spectroscopical Study
41
distinguish between structural and adsorptive bonding. However, the highly intense bands of
this ν3-vibration suggests that high concentrations of sulfate are bound by this way to
schwertmannite. Casually, in IR spectra of sulfate complexes, additionally to the ν3 and ν4
vibrations a weakly active ν1-band appears, which is located at approx. 975 cm-1 and which
corresponds to outer-sphere bound sulfate (Peak et al., 1999). With respect to schwertmannite
this indicates that sulfate is adsorbed to its surface by both mechanisms. Together with
splitting of the ν3-vibration this is the consequence of lower symmetry of tetrahedral
oxyanions due to inner-sphere complexes (Peak et al., 1999).
3.2. Material and Methods
Sample Preparation
Schwertmannite was synthesised after the recipe of Bigham et al. (1990) by the reaction of 40
mmol⋅L-1 Fe(III) (as FeCl3⋅6 H2O )⋅with 10 mmol⋅L-1 SO42- (as Na2SO4), heated at 60 °C.
Subsequently the resulting suspension, cooled to room temperature was dialysed against
deionised water for several weeks with a daily exchange of water using cellulose membranes
with an average pore radius permeability of 2.4 nm.
This method was partly modified by the addition of different amounts of arsenate (as
Na2HAsO4⋅7 H2O) or chromate (as Na2CrO4) into the synthesis solution as shown in Table
II.3-2. Synthetic goethite (α-FeOOH) was produced according to Cornell & Schwertmann
(1996) by titration of ferric nitrate with KOH. After synthesis all precipitates were freeze-
dried. Mineral identification occurred by XRD using a Siemens D 5000 X-ray diffractometer
with Co-Kα1,2-anode (2 sec per 0.02 θ). The specific surface area of the samples was
determined by N2 adsorption according to the BET method (Brunauer et al., 1938).
Tab.II.3-2 Composition of the sample synthesis-solution. The prefix “Sh” of the sample nameindicates the formation of schwertmannite as proven by XRD.
sample name composition of the synthesis solution(mmol·L-1)
Sh 40 Fe(III) + 10 SO4
Sh-S-As-1 40 Fe(III) + 10 SO4 + 0.72 AsO4
As-S-5 40 Fe(III) + 10 SO4 + 4.6 AsO4
As-10 40 Fe(III) + 7.2 AsO4
Sh-S-Cr-1 40 Fe(III) + 10 SO4 + 0.86 CrO4
Sh-S-Cr-2.5 40 Fe(III) + 10 SO4 +4.15 CrO4
Sh-Cr-10 40 Fe(III) + 8.62 CrO4

II.3. A FTIR Spectroscopical Study
42
Adsorption of arsenate and chromate to the minerals was obtained by suspending 1 g⋅L-1
schwertmannite or goethite in a AsO43-- or CrO4
2- containing solution (c= 5 mmol⋅L-1). The
suspensions of schwertmannite had a pH of 4, which was in goethite suspensions adjusted by
addition of acid (HNO3). After shaking over 48 hours at 20°C, the suspensions were filtrated
(0.45 µm) and freeze-dried.
IR-Spectroscopic Measurement
Fourier transformed infrared spectra of the materials were recorded using a Vektor 22 Bruker
FTIR Spectrometer equipped with a KBr-beamsplitter, LADTGS detector, KBr-window and
silicium carbide as radiation source. The uptaken scans ranged in the middle infrared (MIR)
between wavenumbers of 7500 and 370 cm-1 with 1 cm-1 resolution. 32 scans were collected
for each measurement and the background spectrum was subtracted automatically from the
sample. Samples were measured in transmission as KBr pellets, which were prepared as a
homogenous mixture of 3 mg freeze-dried samples and 300 mg KBr and finally pressed to
pellets with a hydraulic press at a load of approx. eight tons. This measurement technique
could provoke structural changes, induced by pressing or by reactions with the KBr. This was
described by Peak et al. (1999) for changes in the protonation degree of adsorbed ions.
Therefore, some samples were measured directly either in suspended form or as solid without
KBr using the ATR technique (attenuated total reflection). The ATR unit (MIRacleTM Single
Reflection) consists of a ZnSe crystal on which the sample was spread on. The range of
wavelength for this measurement reaches wavenumbers as low as 650 cm-1 with a maximum
resolution of 4 cm-1 and is therefore not as accurate as the measurements in transmission
mode. The obtained spectra were compared to spectra of the same samples measured as KBr
pellets and no significant differences were observed between these two techniques indicating
that no structural changes should be expected.
The method of spectra subtraction between two measured samples was used to visualise
absorption bands which are normally covered by the mineral spectrum. Thereby the FTIR
spectrum of pure schwertmannite (or goethite) was subtracted from the schwertmannite (or
goethite) samples containing arsenate or chromate and consequently, the appearing residual
bands (the difference spectrum) stand for the vibrations of arsenate and chromate molecules.
The recorded absorption band were identified with the measurement program OPUS-NT and
the obtained spectra were compared to the library of Farmer (1974) and in case of
schwertmannite to the description of Bigham et al. (1990).
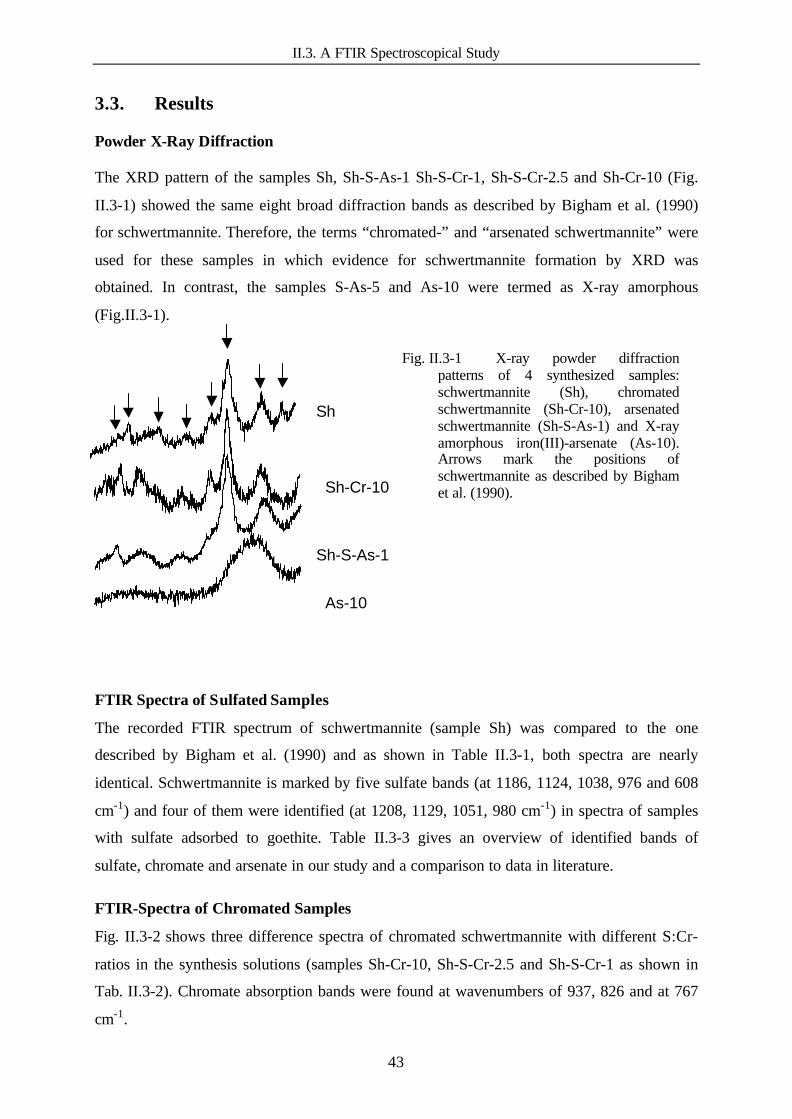
II.3. A FTIR Spectroscopical Study
43
3.3. Results
Powder X-Ray Diffraction
The XRD pattern of the samples Sh, Sh-S-As-1 Sh-S-Cr-1, Sh-S-Cr-2.5 and Sh-Cr-10 (Fig.
II.3-1) showed the same eight broad diffraction bands as described by Bigham et al. (1990)
for schwertmannite. Therefore, the terms “chromated-” and “arsenated schwertmannite” were
used for these samples in which evidence for schwertmannite formation by XRD was
obtained. In contrast, the samples S-As-5 and As-10 were termed as X-ray amorphous
(Fig.II.3-1).
FTIR Spectra of Sulfated Samples
The recorded FTIR spectrum of schwertmannite (sample Sh) was compared to the one
described by Bigham et al. (1990) and as shown in Table II.3-1, both spectra are nearly
identical. Schwertmannite is marked by five sulfate bands (at 1186, 1124, 1038, 976 and 608
cm-1) and four of them were identified (at 1208, 1129, 1051, 980 cm-1) in spectra of samples
with sulfate adsorbed to goethite. Table II.3-3 gives an overview of identified bands of
sulfate, chromate and arsenate in our study and a comparison to data in literature.
FTIR-Spectra of Chromated Samples
Fig. II.3-2 shows three difference spectra of chromated schwertmannite with different S:Cr-
ratios in the synthesis solutions (samples Sh-Cr-10, Sh-S-Cr-2.5 and Sh-S-Cr-1 as shown in
Tab. II.3-2). Chromate absorption bands were found at wavenumbers of 937, 826 and at 767
cm-1.
Fig. II.3-1 X-ray powder diffractionpatterns of 4 synthesized samples:schwertmannite (Sh), chromatedschwertmannite (Sh-Cr-10), arsenatedschwertmannite (Sh-S-As-1) and X-rayamorphous iron(III)-arsenate (As-10).Arrows mark the positions ofschwertmannite as described by Bighamet al. (1990).
As-10
Sh
Sh-Cr-10
Sh-S-As-1

II.3. A FTIR Spectroscopical Study
44
Increasing chromate concentrations simultaneously result in decreased sulfate absorption
intensities. The other IR-absorption bands characteristic to schwertmannite (Tab.II.3-1) were
still preserved in the spectra.
Chromate bands in samples with chromate adsorbed after synthesis to schwertmannite
(sample Sh-ads-Cr) were similarly located (777, 828, 933 cm-1; Fig. II.3-3), but the sulfate
band at 975 cm-1 disappeared. In the difference spectrum of samples with chromate adsorbed
to goethite two bands (at 743 and 819 cm-1) were identified.
SO4
500 600 700800 900 1000 1100 1200 1300
Wavenumber cm-1
-0.4
-0.2
0.0
0.2
0.4
0.6
Sh-S-Cr-1 Sh-S-Cr-2.5 Sh-Cr-10
CrO4
SO4 SO4
CrO4
Sh-S-Cr-1 Sh-S-Cr-2.5 Sh-S-10
SO4
Fig. II.3-2 FTIR-difference spectra of chromated schwertmannite (chromate addition duringmineral synthesis) with different amounts of chromate and sulfate (Tab. II.3-2). Marked bandsindicate IR-absorption of chromate and sulfate. Sulfate bands are of negative intensity due to
subtraction with the schwertmannite spectrum.

II.3. A FTIR Spectroscopical Study
45
FTIR Spectra of Arsenated Samples
IR spectra, obtained from samples with increasing arsenic content in the synthesis solution of
schwertmannite are marked by an increasing disappearance of characteristic schwertmannite
absorption bands (e.g. the band at 704 cm-1). Fig.II.3-4 shows the spectra of the samples Sh,
Sh-S-As-1, S-As-5 and As-10 with the marked bands of sulfate, FeO and one new vibration
occurring in arsenate containing samples at 834 cm-1. An increasing arsenate content caused a
decreasing intensity of sulfate- and FeO-vibrations, while the intensity of the arsenate band
increases.
The difference spectra of arsenated schwertmannite showed three IR-active bands
corresponding to arsenate with maxims at 938, 834 and 760 cm-1 (Fig. II.3-5).
The spectrum of schwertmannite with arsenate adsorbed after synthesis was marked by the
one broad band at 834 cm-1. The sulfate bands at 608 and 976 cm-1 completely disappeared
and the split high-intensity sulfate bands between 1000 and 1200 cm-1 shrank to one broad
band of low intensity. In Fig. II.3-5, a part of this difference spectrum is presented, which
shows two shoulders on both sides of the 834 cm-1 band, which are located in a similar way to
the identified arsenate bands of arsenated schwertmannite (Sh-S-As-1).
The difference spectrum of the sample with arsenate adsorbed to goethite showed three bands,
located at 713, 819, 839 cm-1.
ν4-
ν 3-
ν1-SO4
600 800 1000 1200
Wavenumber cm-1
0.0
0.2
0.4
0.6
0.8 A
bsor
banc
e U
nits
SO4 CrO 4 FeO
SO4
schwertmannite
adsorbed chromate on
schwertmannite
Sh-ads-Cr
Fig II.3-3 FTIR-spectrum of pure schwertmannite and of schwertmannite with chromate adsorbedafter mineral synthesis (Sh-ads-Cr, difference spectrum).
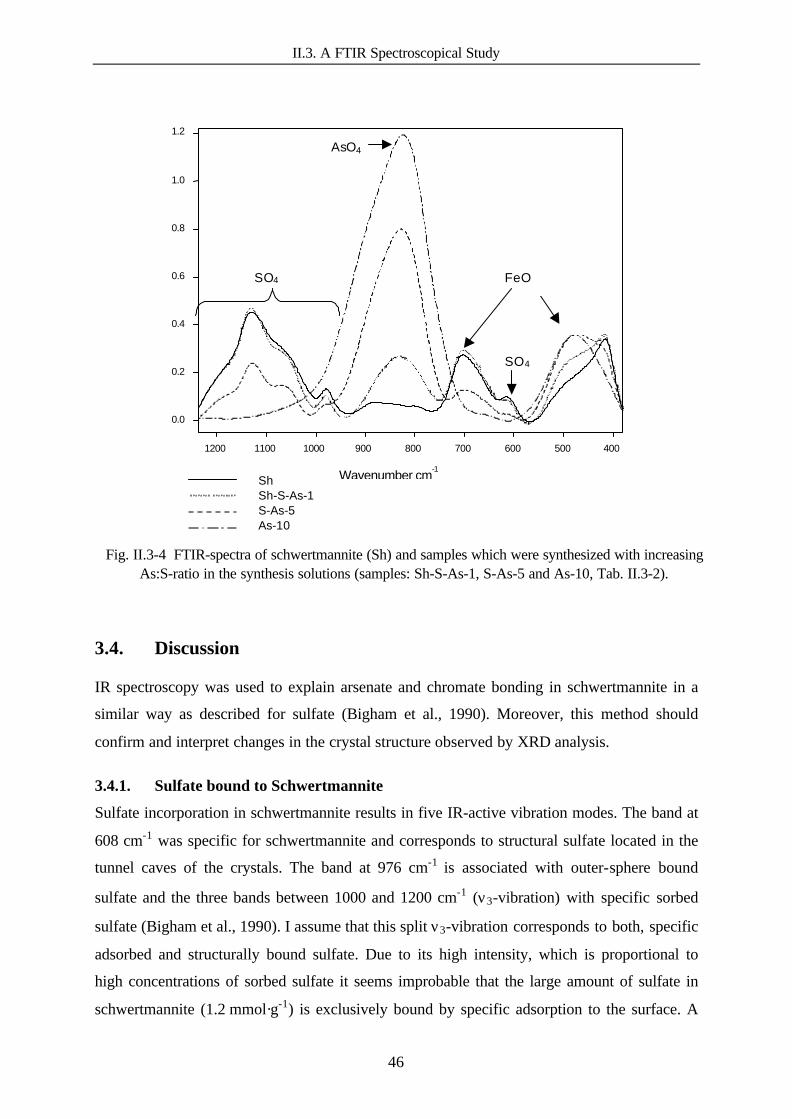
II.3. A FTIR Spectroscopical Study
46
3.4. Discussion
IR spectroscopy was used to explain arsenate and chromate bonding in schwertmannite in a
similar way as described for sulfate (Bigham et al., 1990). Moreover, this method should
confirm and interpret changes in the crystal structure observed by XRD analysis.
3.4.1. Sulfate bound to Schwertmannite
Sulfate incorporation in schwertmannite results in five IR-active vibration modes. The band at
608 cm-1 was specific for schwertmannite and corresponds to structural sulfate located in the
tunnel caves of the crystals. The band at 976 cm-1 is associated with outer-sphere bound
sulfate and the three bands between 1000 and 1200 cm-1 (ν3-vibration) with specific sorbed
sulfate (Bigham et al., 1990). I assume that this split ν3-vibration corresponds to both, specific
adsorbed and structurally bound sulfate. Due to its high intensity, which is proportional to
high concentrations of sorbed sulfate it seems improbable that the large amount of sulfate in
schwertmannite (1.2 mmol·g-1) is exclusively bound by specific adsorption to the surface. A
400 500 600 700 800 900 1000 1100 1200
Wavenumber cm-1
0.0
0.2
0.4
0.6
0.8
1.0
1.2
Sh Sh-S-As-1 As-S-5 As-10
SO4
FeO FeO
SO4
AsO4
Sh Sh-S-As-1 S-As-5 As-10
SO4
AsO4
SO4
FeO
Sh Sh-S-As-1 S-As-5 As-10
Fig. II.3-4 FTIR-spectra of schwertmannite (Sh) and samples which were synthesized with increasingAs:S-ratio in the synthesis solutions (samples: Sh-S-As-1, S-As-5 and As-10, Tab. II.3-2).

II.3. A FTIR Spectroscopical Study
47
rough estimate shows that a surface area of 380 m2·g-1 is required at minimum to bind all
sulfate on its surface if one assumes a large surface density of 4 OH groups per nm2 of an
Fe(III) hydroxide surface (Sigg & Stumm, 1981) of which each two OH ions are replaced by
one sulfate ion. However, measurements of the surface area using the BET method resulted in
an area of ~200 m2 ·g-1. As a consequence, these highly intense bands indicate occurrence of
the ν4-vibration (608 cm-1) structural incorporation of sulfate into schwertmannite.
3.4.2. Chromate bound to Schwertmannite
Three absorption bands, located at 946, 833 and 761 cm-1 were identified in this study, which
correspond to chromate vibrations (Fig. II.3-1). Two of them were already described by Baron
& Palmer (1996) and Barham (1997) in samples of chromatised jarosite and chromatised
schwertmannite (substitution of sulfate by chromate in both minerals), as shown in Table II.3-
3. Compared to Barham (1997), who found absorption bands at 781 cm-1 and at 926 cm-1, in
this study chromate bands were slightly shifted to lower wave numbers. This effect can be
explained by different protonation, an effect which could cause band-shifts of up to 50 cm-1,
as described for arsenate by Myneni et al. (1998).
A complete exchange of sulfate by chromate in schwertmannite was confirmed by XRD
(Fig.II.3-1) and therefore similar results should be expected with FTIR spectroscopy of
chromated schwertmannite. The spectra of chromatised schwertmannite should be marked by
bands of inner-sphere sorption (ν3-vibration), inner-sphere structural incorporation (ν4-
vibration), and outer-sphere adsorption (ν1-vibration). However, the absorption band
corresponding to a ν4-vibration of chromate, indicating an exclusively structural incorporation
was not found. According to vibration bands of dissolved chromate (Tab. II.3-3), this should
be located at a wavenumber of ~ 350 cm-1. Detection limit of the used instrument is > 370 cm-
1 and therefore this band was not observed and no exact differentiation between adsorptive
and structural chromate as described for sulfate was possible. I suppose that all identified
chromate bands correspond to a split ν3-vibration appropriate to the sulfate bands between
1000 and 1200 cm-1 identified in schwertmannite. Therefore, this split ν3-vibration of
chromate is equal to sulfate associated with binuclear bridging complexes (Fe-O-Cr(O2)–O–
Fe). Due to high intensities of these bands, they could correspond to specific adsorption and
structural incorporation as described for sulfate.
Adsorption of chromate to iron hydroxides was normally described as inner-sphere, binuclear
surface-complexation (Hsia et al., 1993).

II.3. A FTIR Spectroscopical Study
48
However, results, obtained by EXAFS measurements showed that different modes of
complexes can form by chromate adsorption to goethite, which are both, monodentate-,
bidentate-binuclear and bidentate-mononucleare (Fendorf et al., 1997). A similar distinction
by IR-spectroscopy was not possible. The bands of chromate identified in the sample Sh-ads-
Cr (777, 828, 933 cm-1, Fig. II.3-3) appeared at similar wavelengths as the bands in
schwertmannite synthesised in the presence of chromate, indicating that no difference in the
bonding mechanism exists between them. Possibly, the lower intensity can be used to
distinguish between them. Normally, the intensity of an absorption band depends on both, the
amount and the strength of a complex (van-der-Marel & Beutelspacher, 1976). The amount of
chromate in sample Sh-S-Cr-1 was quite low (Tab.II.2-2) and the absorption bands clearly
stronger than in sample Sh-ads-Cr. Therefore, it was assumed that compared to the
structurally bound complexes in Sh-S-Cr-1, Sh-S-Cr-2.5 and Sh-Cr-10, the pure adsorptive
chromate complexes in Sh-ads-Cr are less strong and therefore less intense.
The disappearance of the ν1-sulfate at 975 cm-1 in samples with chromate adsorbed after
schwertmannite synthesis, indicated that chromate displaces the outer-sphere bound sulfate.
Results suggest that a complete differentiation between sorbed- and structural- bound
chromate in schwertmannite based on FTIR spectra was not possible.
3.4.3. Arsenate bound to Schwertmannite
IR-spectroscopic investigations of the arsenated samples showed that with increasing arsenate
content in the synthesis solution of schwertmannite, nearly all characteristic schwertmannite
IR-absorption bands disappeared. As shown in the spectra of Fig. II.3-4, an increased arsenate
content resulted in an increased intensity of the band at 834 cm-1, and simultaneously all other
bands of schwertmannite shrank independent to the mode of sulfate-molecule bonding (ν1-,
ν3- or ν4-vibration) and finally disappeared. Therefore, no preferential exchange of a sulfate-
coordination by arsenate was assumed.
The absorption band at 834 cm-1 is a characteristic feature for Fe(III)-arsenate vibration and
was interpreted for the mineral scorodite (FeAsO4·2H2O) as an As-OFe-bonding (Myneni et
al., 1998). This corresponds either to specific adsorption of arsenate to schwertmannite
surface or to structural incorporation in the tunnel caves or to coprecipitation of an additional
iron-arsenate phase. Arsenate is probably bound by all three mentioned mechanisms to iron in
schwertmannite.
In the FTIR difference-spectra (Fig. II.3-5) two additional bands corresponding to arsenate
were identified (at 730 and 940 cm-1), which are of low magnitude.

II.3. A FTIR Spectroscopical Study
49
Lumsdon et al. (1984) interpreted the high-intensity band at 834 cm-1 as a specific,
asymmetric vibration of As-OFe/H, whereas the other two (730 and 940 cm-1) represent
symmetric As-OH- and As-OFe vibrations (Tab.II.3-3). According to interpretations of
sulfate and chromate bands, it can be supposed that the three bands of arsenate represent a
split ν3-vibration.
Due to the similar location of these arsenate bands compared to arsenate adsorbed to goethite
or to other iron hydroxides (Lumsdon et al., 1984, Tab.II.3-3), arsenate potentially is bound in
the same way to both minerals (specific, bidentate). Normally, arsenate forms strong
complexes with iron hydroxides (Dzombak & Morel, 1991), which are caused by an exchange
of two surface OH- molecules by one AsO43- ion (Harrison & Berkheiser, 1982).
The ν4-vibration of arsenate could not be detected, although it should be located at ~ 400 cm-1
according to the values from dissolved arsenate (Tab.II.3-3). This region is close to the
detection limit of the instrument and may therefore not be properly resolved. It was therefore
not possible in this study to discriminate between specific arsenate bonding types in
schwertmannite.
There is some evidence from the spectra that arsenate is bound in its protonated form to
schwertmannite. According to Myneni et al. (1998), the positions of arsenate bands shift with
increasing protonation to higher wave numbers from 720 cm-1 for AsO43- to 790 cm-1 for
H3AsO4. In this study, this arsenate band was detected at 760 cm-1 and corresponds to a
H2AsO4- species.
500600 700800900 1000 1100
Wavenumber (cm-1)
0.0
0.1
0.2
0.3
0.4
0.5
0.6
0.7
Abs
orba
nce
Uni
ts
940
834
740-760
Sh-S-As-1 Sh-ads-As
Fig. II.3-5 FTIR-difference spectra of arsenated schwertmannite (Sh-S-As-1) and arsenate adsorbed
to schwertmannite after synthesis (Sh-As-ads).

II.3. A FTIR Spectroscopical Study
50
Tab.II.3-3 IR-absorption band position of sulfate, arsenate and chromate in different phases.Measured data compared to literature data and interpretation from literature.
The Protonation degree of oxyanions in experiments of this study correspond to a pH of 4.
Oxyanion absorptionband position (cm-1)
Vibration mode reference
SO42- in solution 1105, 611 ν3, ν4 Farmer, 1974
SO42- adsorbed to goethite; pH 3.5
SO42- adsorbed to goethite
1254, 1141, 1040, 9651170, 1133, 1051, 977
ν1, ν2, ν3, ν4
ν3, ν4
Parfitt & Smart, 1978Peak et al., 1999
SO42- adsorbed to goethite 1200, 1120, 1060, 970 ν1, ν2, ν3, ν4 Parfitt & Smart, 1978
SO42- adsorbed to goethite 1208, 1129, 1051, 980 ν3, ν4 this study
SO42- in schwertmannite 1186, 1124, 1038, 976, 608 Bigham et al., 1990
AsO43- in solution 878 (810), 463 (398) ν3, ν4 Farmer, 1974
AsO43- adsorbed Fe(III) hydroxide 700 (As-OH), 805 (As-OFe) 875 (As-O/ As-OFe) Harrison &
Berkheiser, 1982
AsO43- adsorbed to goethite; pH 6 719 (As-OH) 810 (As-OFe), 834, 938 (As-OFe/H) Lumsdon et al., 1984
AsO43- adsorbed to goethite 713, 819, 839 this study
AsO43- adsorbed to schwertmannite 834 this study
AsO43- in schwertmannite 760, 834, 940 this study
CrO42- in solution 884, 368 ν3, ν4 Farmer, 1974
CrO42- adsorbed to goethite 843, 819, this study
CrO42- in jarosite
CrO42- in schwertmannite
851, 921
781, 926
Baron & Palmer, 1996
Barham, 1997
CrO42- in schwertmannite 761, 833, 946 this study
CrO42- adsorbed to schwertmannite 777, 828, 933 this study
3.5. Conclusions
FTIR spectra of chromated and arsenated samples recorded in this study confirmed data
obtained from X-ray diffraction: While a complete substitution of sulfate by chromate in the
schwertmannite structure is possible, sulfate only partly can be exchanged by arsenate.
Increasing amounts of arsenate added into the schwertmannite-synthesis solution, effect in the
resulting precipitate decreasing schwertmannite features according to both, XRD and FTIR
spectroscopy.
The method of FTIR spectroscopy was used to explain bonding structures of the oxyanions in
schwertmannite. The comparison of measured FTIR data with data from literature
demonstrates that both, arsenate and chromate, are mostly specifically sorbed to
schwertmannite. This could comprise adsorption to the surface, substitution in the mineral
and/or coprecipitation as new phases. A differentiation between these processes was not
attained.

II.4. Incorporation of Arsenite in Schwertmannite
51
4. INCORPORATION OF AS(III) IN SCHWERTMANNITE
4.1. Introduction: Significance of Arsenite
In the hydrochemical environment of waters affected by AMD (acid mine drainage), arsenate
(AsO43-) and arsenite (AsO3
3-) are, beside sulfate (SO42-), the most frequent and, due to their
high toxicity, the most important oxyanions (Bigham & Nordstrom, 2000). The mobility of
arsenic in the environment is generally controlled by sorption to Fe(III) hydroxides (Pichler et
al., 1999). For example, Savage et al. (1999), detected goethite (α-FeOOH) with arsenic
contents of about 1260 ppm in AMD precipitates. The release of mineral-bound or surface-
adsorbed arsenic usually follows a change of redox conditions. Due to its low oxidation rate,
the trigonally coordinated form of arsenic (arsenite) is frequently associated with the
tetrahedrally coordinated form (arsenate) in natural waters (Seith & Jekel, 1998). Fig. II.4 1
shows a redox stability diagram for possible arsenic species. At pH values < 2 and very high
arsenic concentrations, arsenic precipitates as scorodite (FeAsO4·2H2O) (Cullen & Reimer,
1989). At lower As concentrations and higher pH values adsorption and coprecipitation with
Fe(III) hydroxides are the dominant fixation processes.
Fig. II.4-1 Redox-stability diagram and arsenic speciation (Cullen & Reimer, 1989).
At the chemical conditions of potential schwertmannite formation (acidic and oxic)
protonated arsenate should be expected. However, due to the slow oxidation kinetics of
14
H2(g)
O2(g)H3AsO4
H2AsO4-
H3AsO3
AsO43-
HAsO42-
As
H2AsO3-
HAsO32
pE
0 6 8 10 122 4
pH14

II.4. Incorporation of Arsenite in Schwertmannite
52
As(III) to As(V), arsenite can also (temporarily) exist in the presence of schwertmannite.
As(III) is about 10 times more toxic than As (V) (Pontius et al., 1994) and is therefore of
major ecological interest.
This part of my study deals with the question if arsenite can be enriched in a similar way to
arsenate in schwertmannite. However, results should be considered as preliminary
investigations, because only few experiments were performed to differentiate the oxidation
state of As.
4.2. Materials and Methods
Sampling
Five water samples were taken from the AMD system of the former ore mine "Saalfelder
Feengrotten" in Thuringia (chapter II.2.2.5) and examined with respect to their As(V) and
As(III) content. The samples were chosen for analysis if schwertmannite was identified in
corresponding precipitates containing more than 100 ppm As (appendix B). During field trips,
samples were filtrated (0.2 µm) and frozen in the lab until analysis could take place.
As measurement
Quantitative analysis of As(tot) and As(III) was performed in the central analytic labs at the
Bayreuth institute for terrestrial ecological system research (BITOEK) with a coupled HPLC
ICP-MS system (Dionex). Nitric acid and benzene-disulfon acid served as eluents at a flow of
1 mL·min-1. The detection limit for As(III) was 2 µg·L-1 and for As(tot) 3 µg·L-1.
Synthesis of solids
The sample "Sh-AsO3" was produced following the dialysis method for schwertmannite
(chapter II.2.2.1., Bigham et al., 1990) with added arsenite (as Na2HAsO3·7 H2O). Thus the
synthesis suspension contained 40 mmol·L-1 Fe3+, 10 mmol·L-1 SO42- and 0.819 mmol·L-1
AsO33-. After 30 days of dialysis, the sample was filtered (blue ribbon) and the filter residue
freeze-dried. Evidence for schwertmannite formation was obtained by powder X-ray
diffraction. A part of the solid had completely dissolved in 1 M HCl (1 g·L-1) and in the
extract the total concentration of iron (flame AAS), sulfur (ICP-MS) and arsenic (graphite-
tube AAS) was determined (methods are described in II.2.2.2).
The sample "Sh-ads-AsO3" was produced by suspension of pure schwertmannite (1 g·L-1),
after its synthesis (method: synthesis in Fe(III)-solutions) into an arsenite solution (c = 1
mmol·L-1) which was gazed with N2 in three parallels. After a reaction time of 24 h, shaken at

II.4. Incorporation of Arsenite in Schwertmannite
53
constant temperature (20 °C), the suspension was filtered (blue ribbon filter) and As(tot) and
As(III) were determined in the filtrate. The amount of arsenic adsorbed to schwertmannite
was calculated on the basis of the difference between the total- and the measured As
concentration.
FTIR spectroscopy
The solid samples were measured as KBr pellets (3mg sample/300 mg KBr) in transmission
between wavenumber of 370 to 4500 cm-1 (analytics are described in chapter II.3.2.).
Subtraction spectra were obtained as a result of differentiation of the spectra of As-containing
samples with an As-free spectrum of schwertmannite.
4.3 . Results and Discussion
4.3.1. Arsenite in the AMD water of the Saalfelder-Feengrotten
The total arsenic concentrations of the examined acid mine drainage waters of the "Saalfelder-
Feengrotten" where As-enriched schwertmannite was formed, were usually below the
detection limit (Tab. II.4-1). Solely in two samples As(III) was observed.
Tab.II.4-1. Arsenite and arsenate concentrations in the AMD water of the Saalfelder-Feengrotten.
sample AsO33- (ppb) AsO4
3- (ppb)
1 < d.l.. 9
2 < d.l. < d.l.
3 8 83
4 6 52
5 < d.l. < d.l.
d.l. detection limit: for As(III) < 2, for As(V) < 3 ppb
Since the As(tot) content in the schwertmannite precipitates was relatively high (> to 100
ppm, appendix B), this result indicates that either schwertmannite filters As(III) similarly to
As(V) from water or that, due to the oxic conditions in the examined waters, As(III) does not
exist in this environment. The oxidation state of arsenic bound to these schwertmannite
precipitates was not examined.
4.3.2. Arsenite associated with schwertmannite: coprecipitation and adsorption

II.4. Incorporation of Arsenite in Schwertmannite
54
The sample "Sh-AsO3" (arsenite coprecipitated with schwertmannite) was composed of 45.1
wt.- % iron, 3.97 wt.-% sulfur and 5.72 wt.- % arsenic. If arsenic in this schwertmannite
sample would be present as arsenite, the chemical formula can be given as
Fe8O8(OH)3.3(SO4)1.22(AsO3)0.75. Compared to arsenate incorporation in schwertmannite a
similarly high incorporation-capacity and a similar formula can be obtained
(Fe8O8(OH)3.9(SO4)0.9(AsO4)0.75; chapter II.2.3).
Arsenite uptake by schwertmannite after mineral synthesis (sample "Sh-ads-AsO3") from an
arsenite solution (c = 1 mmol·L-1) resulted in 0.88 mmol·g-1. Analyses of the oxidation state of
arsenic remaining in solution indicated no oxidation to arsenate.
4.3.3. Distinction of the oxidation state of arsenic by FTIR spectroscopy
In this FTIR study it was to be examined whether the oxidation states of arsenic bound to
schwertmannite can be distinguished, or whether the binding of arsenic to schwertmannite
involves oxidation to arsenate. The FTIR spectra of the samples Sh-ads-AsO3 (arsenic uptake
after schwertmannite synthesis) and of Sh-AsO3 (arsenic uptake during schwertmannite
synthesis) are presented in Fig. II.4-2. Both spectra show 4 to 5 absorption bands, of which
the maxima are not located in the range of schwertmannite bands as described by Bigham et
al. (1990). Therefore, it was assumed that they correspond to the arsenic. In both spectra these
bands are located at the same wavenumbers (734, 808, 840, 870, 904 cm-1). They differ from
the bands identified in arsenate containing schwertmannite (760, 834 and 938, chapter II.3.3).
Sh-ads-AsO3
750 800 850 900
Wavenumber cm-1
0.00
0.05
0.10
0.15
Abs
orba
nce
Uni
ts
904 840 870 808
734
Sh-ads-AsO3
Sh-AsO3
wavenumber (cm-1)
734
Sh-AsO3
Fig. II.4-2 FTIR subtraction-spectra of arsenite bound to schwertmannite. (Sh-AsO3:Arsenite uptake during schwertmannite synthesis Sh-ads-AsO3: Arsenite uptake after
schwertmannite synthesis)

II.4. Incorporation of Arsenite in Schwertmannite
55
The biggest difference, compared to the arsenate spectra, is the high intensity of the
absorption band located at 734 cm-1. It was identified in arsenate spectra with weaker
intensity and located at a higher wavenumber (760 cm-1) and probably correlates to an As-OH
vibration (Lumsdon et al., 1984).
The description and differentiation of possible binding-modes of arsenite and arsenate to
goethite by FTIR spectroscopy were examined by Sun & Doner (1996). Their study is based
on investigations of changes in the band location of the surface OH groups of the iron
hydroxides depending on bound arsenate and arsenite concentrations. They demonstrated that
As(III) and As(V) exchange partly differently coordinated OH groups during their sorption to
the iron hydroxide. Thus evidence was found for different sorption modes and an oxidation of
arsenite during the adsorption could be excluded. In my investigations only the IR-active
bands which can be directly assigned to the arsenic, were interpreted. Since these bands differ
in both spectra of arsenite containing samples from the spectra of arsenate containing
samples, it was assumed that arsenite directly binds to schwertmannite without oxidation to
arsenate. Investigations of Manning et al. (1998) which described the binding of arsenite at
goethite by XAS (X-ray absorption spectroscopy) and EXAFS (extended X-ray absorption
fine structure) measurements, confirm this thesis. They stated that arsenite forms very strong,
bidentate-binuclear complexes (Fig. II.6-3) at the surface of goethite. These surface
complexes resist an oxidation to arsenate.
Results of this study suggest that schwertmannite can take up high concentrations of arsenite
during and after its formation. Further investigations concerning the bonding strength of
arsenite to schwertmannite and the possible mobilisation of this toxic compound seem
promising.
II.5. Mobilization of Arsenate and Chromate during Microbial Reduction of Schwertmannite
56
5. MOBILISATION OF ARSENATE AND CHROMATE DURING
MICROBIAL REDUCTION OF SCHWERTMANNITE
5.1. Introduction
The Fe(III)-mineral schwertmannite [Fe8O8(OH)x(SO4)y with 1≤ y ≤ 1.75 and 2y = 8-x] can
be frequently found as a product of pyrite oxidation in areas exposed to acid mine drainage
(Bigham et al., 1990, 1994). Its formation requires oxic, acidic (pH 2.5 - 4), and sulfate-rich
(> 10 mmol L-1) conditions. Schwertmannite is a mineral of poor crystallinity and high
instability. Changing of the chemical or physical conditions in the system lead to its
dissolution or transformation to more stable minerals such as goethite (Bigham et al., 1996).
Schwertmannite contains between 12 and 15 wt.-% of sulfate, part of which is structurally
bound to the mineral. Because of the large surface area of schwertmannite (∼200 m2 g-1),
about 30 % of the total sulfate can be also adsorbed to the surface (Bigham et al., 1990). The
mineral can take up large amounts of the oxyanions arsenate (Carlson et al., 2001) and
chromate (Barham, 1997). Up to 11 weight % of arsenate and 15 % of chromate can be bound
either structurally or adsorbed to schwertmannite (Regenspurg and Peiffer, 2000). Thus,
schwertmannite might act as a sink for these toxic elements in contaminated waters.
In general, the solubility of chromium and arsenic in the environment is controlled by the
presence of iron oxides and parameters like pH or redox potential. Dissimilatory Fe(III)-
reducing bacteria can promote the mobilisation of arsenate by the reductive dissolution of
iron-arsenate minerals (Cummings et al., 1999). Direct reduction of arsenate by arsenic-
reducing bacteria may also play a significant role in mobilising arsenic from those minerals
(Ahmann et al., 1997). The microbial reduction of chromate (VI) to a less toxic insoluble
chromium (III) precipitate is a detoxification mechanism of some bacteria (Lovley, 1993;
McLean and Beveridge, 2001). In acidic mining-impacted habitats, the reductive dissolution
of Fe(III) is a dominant electron-accepting process for the oxidation of organic carbon and
reduced sulfur mediated by the activity of acidophilic bacteria (Fortin et al., 1996; Peine et al.,
2000; Küsel and Dorsch, 2000; Küsel et al., 2001). Acidiphilium cryptum JF-5, a facultative
anaerobic, non-fermentative Fe(III) reducer, has been isolated from an acidic coal mining lake
sediment containing schwertmannite (Küsel et al., 1999). Thus, the objectives of this study
were to evaluate the effect of reductive dissolution of arsenated and chromated
schwertmannite on the mobilisation and potential reduction of arsenate and chromate by A.
cryptum JF-5, and to study the effect of schwertmannite transformations on these processes.

II.5. Mobilization of Arsenate and Chromate during Microbial Reduction of Schwertmannite
57
5.2. Materials and Methods
5.2.1 Preparation of Schwertmannite Specimens
Three different specimens were synthesised using a modified method described by Cornell
and Schwertmann (1996). Suspensions of 1 g⋅L-1-Fe(III) (provided as FeCl3⋅6 H2O) and
1 g⋅L-1 sulfate (provided as Na2SO4) were dialysed for 30 days against demonised water using
dialysis bags of cellulose membranes. Sulfate was partially substituted by addition of arsenate
or chromate (Tab.II.5-1). After synthesis of the different schwertmannite samples, total
Fe(III), sulfate, arsenate, and chromate were determined in freeze dried minerals by flame
AAS (Fe), ICP-AES (S), and graphite-tube AAS (As, Cr). (Tab.II.5-I). The identification of
schwertmannite was performed by X-ray diffraction (Siemens D5000 goniometer with a Co-
Kα1,2-anode), and samples were examined by FTIR (Fourier-Transformed Infrared)
spectroscopy (Vektor 22 FTIR–MIR, Bruker, spectral resolution of 1 cm-1) in transmission
mode as KBr pellets between 370 and 4500 cm-1.
Tab.II.5-1 Composition of the synthesis solution and of the solid schwertmannite specimens.
Synthesis solution Schwertmannite specimensSh Sh-As Sh-Cr Sh Sh-As Sh-Cr
Components (mM) (wt.-%) (mM) (wt.- %) (mM) (wt.- %) (mM)
Fe3+ 40 40 40 44.5 40 43.3 40 32.9 40
SO42-a 10.6 10.6 10.6 12.3 6.4 8,3 4.4 7.3 5.1
AsO43- a 0 0.72 0 0 0 10.3 3.8 0 0
CrO42- a 0 0 0.86 0 0 0 0 1.8 0.6
a addition as Na-salt
5.2.2 Microbial Reduction of Schwertmannite Samples
Cells of A. cryptum JF-5 were grown both aerobically and anaerobically in a tryptic soy broth
medium (TSB, 0.025%). Anoxic medium was boiled and cooled, and 15 ml were dispensed
under flowing N2. Oxic medium contained air in the headspace. The pH approximated 2.7
after autoclaving. Approximately, 5.2 to 5.4 g schwertmannite samples were added to 1 l
medium either before or after autoclaving (121°C for 20 min) to reach a final concentration of
40 mM Fe(III). Glucose was added from a sterile, anoxic stock solution to reach a final
concentration of 3 mM. For inoculation, approximately 4 x 10⁹ cells of aerobically grown
cells of A. cryptum JF-5 were transferred to anoxic medium containing schwertmannite
samples in 3 replicates.

II.5. Mobilization of Arsenate and Chromate during Microbial Reduction of Schwertmannite
58
Uninoculated tubes containing schwertmannite samples served as controls. In order to
determine whether A. cryptum JF-5 can enzymatically reduce arsenate or chromate,
aerobically grown cells of A. cryptum JF-5 were transferred to anoxic TSB medium
containing arsenate (5 mM) or chromate (2 mM) as the sole electron acceptor and glucose as
electron donor. Controls received no glucose. The incubation temperature was 30 °C.
The microbiological investigations were performed by Kirsten Kuesel at the department of
microbial ecosystem research, BITOEK.
5.2.3 Analytical Techniques
Reduction of Fe(III) was estimated by measuring the amount of Fe(II) formed. Aliquots (0.2
mL) of the media were taken by sterile syringes, transferred to 9.8 mL of 0.5 M HCl, and
incubated for 1 h at RT (Lovley and Philipps, 1986). Fe(II) was measured after the addition of
acetate by the phenanthroline method (Tamura et al., 1974). Glucose was determined with
Hewlett-Packard 1090 series II high-performance liquid chromatographs (Palo Alto, Calif.) as
previously described (Küsel et al., 1995). Sulfate was measured by ion chromatography with a
Metrohm IC, Separation Center 733 (Suppressor module 753; Metrosep Anion Dual 1
column) with an eluent mixture of NaHCO3 and Na2CO3 in a concentration of 2.4 mM and
2.5 mM, respectively, and a flow of 0.5 mL min-1. As(III) and As(tot) were measured by
HPLC-ICPMS (detection limit: 0.03 µM), an eluent of NH4H2PO4 (flow rate: 1 mL min-1).
Cr(tot) was measured with a graphite-tube AAS (Varian/Spectr-AA-30, GTA-96
5.3. Results
5.3.1. Characterisation of Uninoculated Schwertmannite Samples
The synthesised specimens Sh, Sh-As and Sh-Cr were identified as schwertmannite by XRD
analysis of freeze-dried samples (Fig.II.5-1).
d-value (nm)
Fig. II.5-1 XRD patterns of the three synthesisedfreeze-dried samples: schwertmannite (Sh),chromated schwertmannite (Sh-Cr) andarsenated schwertmannite (Sh-Cr). Arrowsmark the positions of the characteristic broadpeaks of schwertmannite (Bigham et al.,1994).
Sh
Sh-Cr
Sh-As

II.5. Mobilization of Arsenate and Chromate during Microbial Reduction of Schwertmannite
59
All samples seem to have the same crystal structure as schwertmannite described in literature
(Bigham et al., 1994) and were, therefore, defined as schwertmannite. In TSB medium, pure
schwertmannite (Sh) released about 30 % of bound sulfate probably due to a desorption
process of surface sorbed oxyanions (Fig.II.5-2). Chromated schwertmannite (Sh-Cr) released
approximately 20 % of the chromate into solution, and arsenated schwertmannite (Sh-As)
released only negligible amounts of As(V) (0.3 to 0.4 µM). Autoclaving of schwertmannite
samples caused a complete release of sulfate bound to pure schwertmannite (Fig. II.5-2).
Fig. II.5-2 Release of sulfate, chromate and arsenate (% of total) from autoclaved and non-autoclavedsamples of pure (Sh), chromated (Sh-Cr) and arsenated (Sh-As) schwertmannite, respectively, inuninoculated media. Abbreviations: n-aut, non-autoclaved samples; aut, autoclaved samples. Theresults are given in % of the total anion content of the sample. The release of arsenate fromarsenated schwertmannite (Sh-As) was smaller than 0.01 % of the total arsenate content inautoclaved and non-autoclaved samples. Presented data are the averages of triplicates (± standarddeviation).
The IR spectrum of autoclaved pure schwertmannite differed from that of non-autoclaved
pure schwertmannite (Fig.II.5-3) due to the disappearance of the schwertmannite-typical FeO
absorption-band at 704 cm-1 and of the peak at 610 cm-1 that is characteristic for structural
sulfate in schwertmannite.
In contrast, the presence of absorption bands of OH and O vibrations at 892, 795, 630, 495,
449 and 397 cm-1 are typical for synthetic goethite (Cornell & Schwertmann, 1996). This
indicates a structural change (transformation) of schwertmannite to goethite, which occurs
during heating a solution of schwertmannite.
0
20
40
60
80
100
n-aut Sh aut Sh n-aut Sh-As aut Sh-As n-aut Sh-Cr aut Sh-Cr
Rel
ease
(%
)
sulfate chromate arsenate

II.5. Mobilization of Arsenate and Chromate during Microbial Reduction of Schwertmannite
60
The four absorption bands between 990 cm-1 and 1300 cm-1 can be attributed both to sulfate
bound to schwertmannite (Bigham et al., 1990) and sulfate adsorbed to the surface of goethite
(Peak et al., 1999). IR spectra of Sh-As and Sh-Cr revealed no differences between the
autoclaved and non autoclaved samples (data not shown) and were similar to the spectrum of
pure schwertmannite.
400 600 800 1000 1200
0.1
0.0
0.2
0.3
0.44
Wavenumber cm -1
O H
O
SO4
B
Wavenumber cm -1
Ab
sorb
ance
Un
its
0.00
0.05
0.10
0.15
400 600 800 1000 1200
OH
FeO
SO4
S O 4
F eO
A
Fig. II.5-3 Effect of heat on the FTIR-spectra obtained from non-autoclaved (A) and autoclaved (B)pure schwertmannite (Sh) in uninoculated media.

II.5. Mobilization of Arsenate and Chromate during Microbial Reduction of Schwertmannite
61
5.3.2. Microbial Reduction of Schwertmannite Samples
Pure non-autoclaved schwertmannite was reduced by A. cryptum JF-5, and approximately 3.5
mM Fe(II) were formed during an incubation of 14 days (Fig.II.5-4A). Similar amounts of
Fe(II) were formed by A.cryptum JF-5 from autoclaved pure schwertmannite (Fig.II.5-4B)
indicating that alterations of schwertmannite apparently to goethite did not affect the
microbial reducibility. No Fe(II) was formed in controls containing no cells.
Differences in the lag phases prior to the formation of Fe(II) in autoclaved and non-
autoclaved samples might be due to different activities of aerobically grown A. cryptum cells,
because cells were harvested either from the exponential or from the stationary growth phase
to inoculate tubes of non-autoclaved and autoclaved samples, respectively.
Fig. II.5-4 Formation of Fe(II) from non-autoclaved (A) and autoclaved (B) pure schwertmannite(Sh), arsenated schwertmannite (Sh-As), and chromated schwertmannite (Sh-Cr) by A. cryptumJF-5 incubated in anoxic, acidic TSB-medium supplemented with glucose at 30 °C. No Fe(II) wasformed in uninoculated controls (Sh-K) containing Sh, Sh-As, or Sh-Cr. Presented are theaverages of triplicates (± standard deviation).
Compared to the formation of Fe(II) from pure schwertmannite, lower amounts of Fe(II) were
formed from arsenated schwertmannite (Fig.II.5-4). Whereas 10 % of the Fe(III) present in
pure schwertmannite were reduced by A. cryptum JF-5, only 5% of the Fe(III) present in
arsenated schwertmannite could be reduced.
A
0
1
2
3
4
5
6
0 2 4 6 8 10 12 14
Tim e (days)
Fe(
II) (
mM
)
Sh Sh-As Sh-Cr Sh-K
B
0
1
2
3
4
5
6
0 2 4 6 8 10 12
Tim e (days)
Sh Sh-As Sh-Cr Sh-K

II.5. Mobilization of Arsenate and Chromate during Microbial Reduction of Schwertmannite
62
In addition, no As(III) could be detected in solution at the end of incubation. In medium
containing chromated schwertmannite, neither Fe(II) was formed, nor glucose was consumed
indicating that chromate abiotically released at the beginning of incubation in a concentration
of 0.2 mM was toxic to cells of A. cryptum JF-5. FTIR analysis of the specimens at the end of
incubation did not show any structural change compared to the spectra of uninoculated
schwertmannite samples (data not shown)
When aerobically grown cells of A. cryptum JF-5 were transferred to an anoxic medium
containing arsenate or chromate as the sole electron acceptor, no growth occurred, no
reduction of As(V) or Cr(VI) could be detected and no glucose was consumed.
5.3.3 Effect of Microbial Fe(III) Reduction on the Release of Sulfate, Arsenate, and
Chromate
During the microbial reduction of Fe(III) of non-autoclaved pure schwertmannite (Sh), higher
amounts of sulfate were released (2.75 mM) compared to the amount of sulfate released in
uninoculated controls (1.4 mM). In medium, pure schwertmannite contained 6.4 mM sulfate
(12.3 wt.-% sulfate; Tab.II.5-1). Thus, 40 % of the total amount of sulfate bound to Sh were
released during the reductive dissolution of pure schwertmannite compared to 20 % in the
uninoculated controls. During the reduction of arsenated schwertmannite, lower additional
amounts of sulfate (0.54 mM) were released compared to the release from pure
schwertmannite. Compared to the uninoculated controls, no additional amounts of arsenate
were released during the microbial reduction of Fe(III) of arsenated schwertmannite. The
presence of cells did not affect the amount of sulfate or chromate released from chromated
schwertmannite.
5.4. Discussion
Although the general capacity to reduce Fe(III) is widespread among heterotrophic
acidophiles inhabiting Fe(III)-rich habitats, rates and the extent of Fe(III) reduction vary
greatly between the isolates examined (Johnson and McGinness, 1991). Sorption of Fe(II) by
cell and oxide surfaces can limit the extent of Fe(III) reduction (Urrutia et al., 1998). In batch
cultures, Fe(III) oxide reduction typically ceased after 15 to 30 days of incubation due to a
decline in cell viability (Urrutia et al., 1998). Thus, under in situ conditions more than 10% of
Fe(III) present in schwertmannite might be available for reductive dissolution.

II.5. Mobilization of Arsenate and Chromate during Microbial Reduction of Schwertmannite
63
At low pH, Fe(III)-reducing bacteria like Acidiphilium species likely do not have to attach to
the surface of iron minerals to transfer electrons to Fe(III); probably they can utilise the small
pool of dissolved Fe(III) for reduction (Bridge and Johnson, 2000). Consequently, the
reducibility of Fe(III) depends on the solubility of the iron oxide and the chemical speciation
of Fe(III) in solution. Substitutions in iron oxides change their solubility (Schwertmann et al.,
1991). Arsenated schwertmannite seemed to be less available for microbial Fe(III) reduction
than pure schwertmannite. Since all dissolution processes are surface reactions, surface
complexation also influences the dissolution.
The dissolution of Fe(III)oxides can particularly be inhibited by binuclear surface complexes
formed by oxyanions such as sulfate and arsenate (Biber et al., 1994). In acidic environments,
these oxyanions are protonated, and the reaction, for example for surface complexation of
arsenate on hydrous ferric oxide, equals: ≡FeOH + H2AsO4- + = ≡FeHAsO4
- + H2O
(Dzombak & Morel, 1990). Complexation constants in the pH-range of 2 to 4 increase in the
sequence sulfate (log K = 7.8), chromate (log K = 10.8), and arsenate (log K = 23.5)
(Dzombak and Morel, 1990). Differences in the equilibrium constants of soluble Fe(III) to
solid Fe(III) in arsenated schwertmannite compared to pure schwertmannite might have
caused the reduced bioavailability of Fe(III) by lowering the pool of soluble Fe(III). Since no
arsenate was released during the reductive dissolution of arsenated schwertmannite, only
Fe(III) not bound to arsenate seemed to be available for microbial reduction. Due to the
release of sulfate during the microbial reduction of arsenated schwertmannite, the remaining
arsenated schwertmannite should be enriched with arsenate. Differences in the surface
complexation constants might also explain the negligible and low release of arsenate and
chromate from arsenated and chromated schwertmannite, respectively, compared to the high
release of sulfate from pure schwertmannite in uninoculated controls.
No Fe(III) was reduced from chromated schwertmannite. The low amount of released
chromate present at the beginning of incubation might have been toxic to cells of A. cryptum
JF-5. In some neutrophilic bacteria, chromate is intracellularly reduced to Cr3+ after active
transport via the sulfate active transport system (Snow, 1991). The trivalent form of
chromium tends to form relatively insoluble compounds and is less harmful than the
hexavalent chromate (Nieboer and Jusys, 1988). Since Fe(III)-reducing Acidiphilium species
do not seem to have detoxification mechanisms, chromated schwertmannite might be not
dissolvable in acidic habitats.
In natural systems, goethite is often associated with schwertmannite, because it is
thermodynamically more stable than schwertmannite (Schwertmann, 1995; Yu et al., 1999).

II.5. Mobilization of Arsenate and Chromate during Microbial Reduction of Schwertmannite
64
In situ transformation of schwertmannite into goethite in deeper sediment layers of an acidic
lignite mining lake has been demonstrated by Peine et al. (2000). In contrast to pure
schwertmannite, autoclaving seemed to have no effect on the structure of arsenated and
chromated schwertmannite. Thus, these oxyanions seemed to stabilise the structure of
schwertmannite or to block the nucleation of goethite during autoclaving and prevent or
decelerate its transformation to goethite.
Differential thermal analysis experiments demonstrated that an increase in temperature up to
100 to 200°C causes a weight loss of schwertmannite indicating a structural transformation
process (Bigham et al., 1990). In this study, the complete release of sulfate from hydrous
schwertmannite during autoclaving demonstrated that the structure of schwertmannite,
characterised by structural bound sulfate, seemed to be changed or even destroyed. Therefore,
the results of the microbial reduction of autoclaved and non-autoclaved schwertmannite have
to be interpreted in terms of two different Fe(III) minerals. Nevertheless, similar amounts of
Fe(II) were formed during 14 days of incubation by A. cryptum JF-5 from non-autoclaved and
autoclaved schwertmannite. In general, the reactivity of Fe(III) minerals decreases as
crystallinity increases (Munch and Ottow, 1980). Since rates and extent of microbial Fe(III)
reduction are controlled by surface areas, which can vary between 9 m² g-1 and 153 m2 g-1 for
goethite (Schwertmann et al., 1985), goethite formed by autoclaving schwertmannite seemed
to be of low crystallinity.
5.5. Conclusions
In sediments of acidic lignite mining lakes, freshly precipitated schwertmannite is dissolved
by the activity of Fe(III)-reducing acidophilic bacteria or transformed into goethite. Thus,
incorporated toxic oxyanions like arsenate or chromate bound to schwertmannite might be
remobilize during reductive dissolution. However, the microbial dissolution of arsenated
schwertmannite mediated by the Fe(III)-reducer A. cryptum JF-5 isolated from those
sediments will be not associated with a release of arsenate into the pore water. The abiotic
release of chromate from chromated schwertmannite to the pore water seems to be toxic for
those bacteria. Transformation of schwertmannite to goethite might not enhance the mobility
of arsenate or chromate. Thus, arsenate and chromate, once bound to schwertmannite, will be
retained in the solid phase, and schwertmannite will act as an effective scavenger for these
elements in acidic habitats.

II.6. Surface Characteristics of Schwertmannite
65
6. SURFACE CHARACTERISTICS OF SCHWERTMANNITE
6.1. Surface- Size, -Morphology and -Charge
6.1.1. Introduction: Surfaces of Fe(III)-hydroxides
The relevance of ferric oxides and hydroxides in natural systems lies particularly in their
capability to bind anions and heavy metals on their surface and thus inhibiting the mobility of
these ions in the environment (Scheffer & Schachtschabel, 1998). Their high uptake-
capacities can be explained by their large surface areas at which the Fe atoms react as Lewis
acid (electron acceptor) resulting in a high chemical reactivity (Cornell & Schwertmann,
1996). The large ratio of surface to volume in weakly crystalline iron minerals results in their
high solubility and good microbial availability (micro-organism can use Fe(III) as energy
source). Fe(III) hydroxides prefer to the binding of anions at their surface (OH- ions in
aqueous systems), due to their usually positive surface charge. Non-specific (or outer-sphere)
adsorption exists, if the binding is a result of electrostatic attraction with a hydrate layer
between the adsorbed ion and the surface. In contrast, the exchange of the surface-OH groups
with other anions to form a covalent binding is known as specific (or inner-sphere) adsorption
(Cornell & Schwertmann, 1996). The surface charge of an iron hydroxide follows from the
dissociation of the surface hydroxyl group if no other ions are specifically adsorbed (Cornell
& Schwertmann, 1996; equation 6-1 and 6-2).
≡ FeOH2+ ↔ FeOH + H+ Ka1 = {≡FeOH}·a(H+) (mol·L-1) [6-1]
{≡FeOH2+}
≡ FeOH ↔ FeO- + H+ Ka2 = {≡FeO-}·a(H+) (mol·L-1) [6-2] {≡FeOH} {≡X}: surface concentration
Figure II.6-1 illustrates the popular model of charge distribution on a mineral surface.According to this "Stern-Graham" model, the
counter ion layer is divided into two planes, each
with its own energy of adsorption. In the relatively
fixed “Stern-layer” the ions are specifically
adsorbed. In the “Diffuse-layer” the non-
specifically adsorbing ions are located. With
increasing distance from the surface the electric
potential decreases within the Diffuse-layer
(Cornell & Schwertmann, 1996). The surface
charge density is balanced by the charges in the
Stern- and Diffuse-layer ("electric double layer").
Fig. II.6-1 Distribution of ions within theelectric double layer (model of Stern-
Graham, Cornell & Schwertmann, 1996).

II.6. Surface Characteristics of Schwertmannite
66
Due to the indefinite charge in the diffuse layer it cannot be directly determined. The
measurable potential is designated as ζ-potential and is located in an indefinite distance to the
mineral surface within the diffuse layer. Exclusively at the “point of zero charge”, at which
the sum of all positive and negative charges is equal, the ζ-potential corresponds to the
surface potential (Cornell & Schwertmann, 1996). The pH complying with this uncharged
surface is named "pH point of zero charge" (pHpzc) and is a material characteristic value. It
can be determined either by acid-base titration or by electrophoresis (= isoleletric point,
pHiep).
The object of this section of the study is the surface characterisation of schwertmannite by
investigations of its particle morphology, surface area and charge.
6.1.2. Materials and Methods
Schwertmannite containing different amounts of sulfate, arsenate and chromate was
synthesised by the dialysis method (Bigham et al., 1990). The preparation and composition of
the used samples of goethite and schwertmannite is described in chapter II.2.2. and in Tab.
II.2-4.
Additionally, a few samples of natural schwertmannite from the sediment of a mining lake
(Sh-ML 77, chapter III-2) and from the ore mine “Saalfelder Feengrotten” (Sh-FG, chapter
II.2-2.5.) were investigated .
Particle morphology: Scanning electron microscopy
Scanning electron micrographs (SEM) were obtained with a Leo 1530 field emission and
scanning electron microscope, equipped with a zircon oxide cathode on wolfram wire as
radiation source. This instrument optically resolves structures down to a few nm. The freeze-
dried samples were covered for 30 minutes with a platinum layer (∼1 nm) in a vacuum to
reach diversion of electron radiation from the sample surface during the subsequent
measurement. The normally used coating with carbon was not suitable for the investigated
fine-crystalline samples. Thereby, the tiny thin schwertmannite crystals stuck together so that
the morphology of the particles could not be identified.
Surface area: method of BET
The surface area was determined by the BET (Brunauer, Emmett, Teller) method (Brunauer et
al., 1938). Thereto the adsorption capacity of the material for N2 was investigated as a
function of the relative pressure. The surface is proportional to the adsorbable quantity of N2.

II.6. Surface Characteristics of Schwertmannite
67
Therefore, a linear relationship exists between the surface area and the relative vapour
pressure p/p0 (Cornell & Schwertmann, 1996). The used instrument, a Gemini 2370 V1.02
provided by the institute of material sciences (IMA) of Bayreuth, supplies a multipoint BET
report (compiling an adsorption isotherm in dependence on the pressure). Just before the
measurement, the samples were heated for 30 min. at 110 °C in glass tubes in order to
completely eliminate any moisture. After determination of the dry weight, samples were
gazed with N2 under increasing pressure with an evacuation speed of 300 mm Hg·min-1.
Usually, two or three BET reports were created per sample.
Surface potential: electrophoretic measurement
Determination of the isoelectrical point (pHiep) was obtained by electrophoretic measurements
of the ζ-potential (potential within the diffuse layer) using a Zetasizer (Malvern, Zetasizer
3000). Firstly, the samples (about 1 g·L-1 of synthetic schwertmannite or goethite) were
suspended in an inert electrolyte (NaNO3 solution; c=1·10-3 M) and different quantities of
HNO3 or NaOH (1 to 10 ‰ from a master solution with each c=1·10-3 M) were added. After
1 h of equilibration, the pH-values in the suspensions were determined and afterwards the ζ-
potentials were immediately measured in three replicates. The mean values were plotted into a
diagram (ζ-potential vs. pH) from which the pHiep could be perceived as the intersection of the
constructed curve with the pH axis (at a surface charge of zero).
In suspensions containing schwertmannite, the ionic strength varied (between 3.5·10-3 M and
5·10-3 M) depending on the sulfate release. Though ionic strength affects the slope of the
curve, it has no influence on the point of zero charge (Cornell & Schwertmann, 1996).
Consequently, a complete constancy of ionic strength is not necessary. The equilibration time
of 1 h was not sufficient for the adjustment of the equilibrium. However, due to the
metastable characteristic of schwertmannite which causes its transformation or dissolution,
the adjustment of an equilibrium is never possible. The maximum error of the measurements
was ± 0.5 pH units. The instrument accuracy was determined by measuring a synthetic
standard (DTS5050) with the known ζ-potential of 50 mV (the error was < 3 %).
In order to change the charge of the mineral surface, samples of schwertmannite (1 g·L-1)
were suspended either for 2 min in 0.1 M HCl (sample Sh-HCl) or for 24 h in 0.1 M BaCl2-
solution (sample Sh-Ba). To change the surface charge of goethite, 1g·L-1 of this mineral was
suspended at pH 4 (sample Gt-SO4) for 24 h in a sulfate-solution (c= 10 mmol·L-1).
Afterwards the three suspensions were filtrated, the filter residues washed with deionised
water and finally re-suspended in an inert electrolyte to determine the pHiep as described
above.

II.6. Surface Characteristics of Schwertmannite
68
6.1.3. Results and Interpretation
Particle Morphology and Surface Size
The external shape of a crystal (habit or morphology) reflects its preferential growth direction
and is therefore a typical characteristic for many minerals. It depends on many factors, such as
the symmetry of the unit cell, the chemical potential-difference in the crystallisation process
(= the supersaturation of the system) and the growth environment (Cornell & Schwertmann,
1996). Goethite crystallises in a relatively wide range of environmental conditions and thus it
occurs in several shapes (star shaped, hexagonal, bipyramidal or cubic). In contrast,
schwertmannite only forms in a small window of chemical conditions and solely one habit of
its particles is known. In the literature it is called as "hedgehog-like" (Bigham et al., 1990)
due to its long, star-likely arranged crystal needles. This was also observed in the synthetic
samples of the present study.
Due to the small particle size of weakly crystalline materials, a direct view on their habits is
only possible by the use of transmission- or scanning electron microscopes. The thin crystals
of schwertmannite (few nm) were frequently at the resolution limit of the used instrument and
consequently the micrographs became diffuse. In samples with an incorporated arsenate and
chromate content no visible influences on the habit were monitored (appendix D).
The acanthoid shape of schwertmannite particles results in its high specific surface area. For
synthetic schwertmannite an area between 150 and 330 m2·g-1 was determined (see Tab. II.6-
1). This is about 10-fold larger, than that of goethite.
Tab. II.6-1 Specific surface area of schwertmannite (Sh) in dependence on the oxyanion content andof goethite (Gt) (mean value and standard deviation s).
sample oxyanioncontent(wt.-%)
spec.surface area(m²·g-1)
±± s sample oxyanioncontent(wt.-%)
spec.surface area(m²·g-1)
±± s
Sh sulfate: 14.87 193 16 Sh-S-As-1 sulfate: 8.3arsenate: 10.3
217 29
Sh-S-Cr-1 sulfate: 7.3chromate: 1.97
224 8 Sh-S-P-1sulfate: 4.5phosphate: 11.3
263 15
Sh-S-Cr-2.5 sulfate: 5.58chromate: 2.4
328 - Sh-FG1 sulfate: 8.2 162 -
Sh-S-Cr-5 sulfate: 6.27chromate: 5.6
181 17 Sh-ML 772 sulfate: 16.2 72 -
Sh-Cr-10 chromate: 15.94 299 9 Gt - 19.6 4
1 natural precipitated schwertmannite of an ore mine or 2 from the sediment of an acidic mining lake

II.6. Surface Characteristics of Schwertmannite
69
Natural schwertmannite ("Sh-ML 77 "and" Sh-FG") showed lower surface areas (72 - 162
m2·g-1) which are still similar to data in literature of schwertmannite (100 to 200 m2·g-1,
Bigham et al., 1994). The incorporation of different oxyanions in schwertmannite affected the
surface areas of the precipitates in dependence on their quantity. A varying content of
chromate and sulfate in the samples mostly changed the specific surface area. However, this
dependency was not linear (Tab. II.6-1).
Surface Charge and Point of Zero Charge
Electrophoresis involves measurements of particle movements affected by an electric field.
This ζ-potential is measured in different suspensions in dependence on the pH. The pH-value
at which the measured potential is zero (no particle movement because the strength of positive
and neagtive charges are equal) is denoted as the isoelectric point (pHiep; Cornell &
Schwertmann, 1996). The pHiep corresponds to the pHpzc received by acid-base titration.
In this study the material characteristic pHiep was determined for schwertmannite containing
different oxyanions.
Fig. II.6-2 shows the results of ζ-potential measurements of schwertmannite. The presented
data obtained from three experimental series were measured under similar conditions at
different days. The different slopes of the curves probably arose from fluctuations in the ionic
strength (3.5·10-3 to 5·10-3 M). However, the pHiep is independent of the ionic strength and of
the slope of the potential curve, respectively (Cornell & Schwertmann, 1996). The
intersection with the pH-axis was between 6.3 and 7. Iron minerals typically show neutral pH-
points of zero charge (e.g. haematite: 7.0 - 9.5, akaganéite: 6.4 - 7.3 or goethite: 7.4 - 9.5).
This explains their amphotere characteristic to adsorb both, cations and anions (Cornell
Schwertmann, 1996).
-40
-30
-20
-10
0
10
20
30
40
0 2 4 6 8 10 12
pH-Wert
Zet
a-P
ote
nti
al (
mV
)
Fig. II.6-2 ζ-potential-curves of schwertmannite to determine the pHiep.
pH
-po
ten
tial
(m
V)

II.6. Surface Characteristics of Schwertmannite
70
Influence of the oxyanion composition in schwertmannite on the point of zero charge
Deviations of the point of zero charge of a mineral up to three pH units can be achieved by
changes in the number of surface hydroxyl groups. Impurities due to specific adsorption,
coatings (cover of one mineral with another) or changes of the suspension temperature or of
the water content of the solid (Cornell & Schwertmann, 1996, Lyklema, 1987; Bum &
Koopal, 1986) might be a reason for these variations.
Thus, in the present study the question should be answered to what extent the incorporation of
oxyanions affects the pHiep of schwertmannite. Therefore, electrophoretic measurements of
schwertmannite with different chemical compositions and of goethite were accomplished. The
results are summarised in Table II.6-2. The pHiep values of schwertmannite range between 5.4
and 7.4. For the pHiep of goethite a value of 7.4 was received which is similar to data from
literature (e.g. 7.4; Tipping & Cooke, 1982). Adsorption of sulfate to goethite caused a small
degradation of this value to 7.2 (Tab. II.6-2). According to Stumm (1992), a decrease of the
positive surface charge caused by specific anion adsorption results in the degradation of the
point of zero charge. Parfitt & Smart (1978) described a similar decrease of the pHiep due to
the sorption of phosphate on goethite and the associated formation of negatively charged
surface complexes.
As a result of the present investigations, the assumption was made that sulfate which is
normally adsorbed to the schwertmannite surface, probably debases the "true" pHiep. In this
context the "true" pHiep denotes a sulfate-free schwertmannite surface. The removal of this
adsorbed sulfate should therefore result in an increasing pHiep compared to the determined
pHiep of the “normal” (sulfate-rich) surface of schwertmannite (6.6 ± 0.3). In order to
eliminate or form complexes with surface-sulfate, schwertmannite was shaken in HCl- and
Ba-solutions, respectively. Afterwards the filter residues were re-suspended and therein the
pHiep determined. Within both procedures the pHiep rose to values of 6.9 or 7.1, respectively
(Tab. II.6-2). This neutralisation of the schwertmannite surface confirmed the assumption of
sulfate elimination and complexation, respectively.
According to the results of this study, no direct dependency of the pHiep on the oxyanion
content of schwertmannite was observed. Phosphate and arsenate incorporation in
schwertmannite hardly caused changes in the pHiep. In contrast, considerable fluctuations (5.4
to 7.1) were observed as a consequence of incorporated chromate, but no correlation could be
found. The inaccuracy of the present findings (± 0.5 pH units) is a result of the metastability
of schwertmannite which prevents the adjustment of pH-values outside its stability range (pH
2.5 to 4.5). According to Bigham et al. (1996) high pH values (> 4) accelerate the

II.6. Surface Characteristics of Schwertmannite
71
transformation of schwertmannite and low ones result in its dissolution. However, after the
equilibration time of 1 h, the pH measured further in the suspensions changed very slowly.
Tab. II.6-2 pHiep of schwertmannite (Sh) and goethite (Gt) in dependence on the oxyanion content.(The maximum deviation of the values amounts ± 0.5 pH-units.)
sample pHiep sample pHiep sample pHiep sample pHiep
Sh 6.6 Sh-S-Cr-1 7.1 Sh-S-As-1 6.4 Gt 7.4
Sh-Ba1 7.1 Sh-S-Cr-2.5 7.1 S-As-2.5 5.8 Gt-SO43 7.2
Sh-HCl2 6.9 Sh-S-Cr-5 5.4 Sh-S-P-1 6.4
Sh-S-Cr-10 6.4
Sh-Cr-10 6.3
1 schwertmannite, with Ba2+ adsorbed to its surface (as BaSO4-complexes).2 schwertmannite, shaken for 2 min. in 0.1 M HCl (to eliminate the adsorbed sulfate)3 goethite, with adsorbed sulfate (1g·L-1 was suspended for 24 h in a 10 mmol·L-1 sulfate-solution)
6.2. Acid-Base Titration
6.2.1. Introduction
The surface of schwertmannite is, as shown in the previous chapter, very large (100 to 300
m2·g-1) and positively charged within its pH-range of stability. The amount of sulfate
adsorbed on its surface is approximately 0.4 mmol·g-1 or 5.5 wt.-% (Bigham et al., 1990). Due
to this high sulfate adsorption capacity, it was assumed that high concentrations of arsenate
and chromate would also be adsorbed.
Using acid-base titration, Sigg & Stumm (1981) analysed processes occurring on the surface
of goethite during adsorption. They showed that sulfate and phosphate adsorb to goethite
specifically through the formation of a direct (covalent) binding. According to their study, the
OH-groups of the iron hydroxide surface were exchanged by the oxyanions. Similarly to the
schwertmannite experiments, an exchange of both hydroxides and surface-sulfate as well as
by the adsorbates should be expected.
Surface charge determination by acid-base titration
In the previous chapter (II.6.1) the electrophoretic determination of the point of zero charge
was described.
Due to different chemical conditions in this experiment, the point of zero charge (pHpzc) was
determined by titration curves (surface-charge vs. pH) obtained by acid-base titration.

II.6. Surface Characteristics of Schwertmannite
72
Thereby the surface charge σ0 was calculated from the chemical parameters in the solution
according to equation 6-3 (Sigg & Stumm, 1981).
Sm
F)CCCC( OHHBA0
⋅⋅+−−=σ −+ [6-3]
σ0 surface charge (C·m-²) m mass of the mineral (g·L-1)CA concentration of acid (M) F Faraday constant: 96485.3 (C·mol-1)CB concentration of base (M) S surface area of the mineral (m²·g-1)
The value of the point of zero charge determined by titration (pHpzc) should correspond to the
value of the isoelectric point (pHiep) determined by electrophoresis (described in II.6-1). For
iron oxides and -hydroxides the pHpzc is defined as the pH, at which the total surface charge
of the oxide is zero and no specific adsorption of the investigated ion takes place (Cornell &
Schwertmann, 1996). Anion adsorption can affect the surface charge and thus shift the
titration curve. Specific adsorption can result, on the one hand, in increased values of the
pHpzc due to the release of OH- ions (Stumm, 1992) and on the other hand, as explained in the
previous chapter (II.6.1.), negatively charged surface complexes can lower the positive charge
and thus decrease the pHpzc. This was observed for phosphate adsorption to goethite (Parfitt &
Smart, 1978).
Adsorption of arsenate and chromate to iron hydroxides
Trivalent oxyanions, such as PO43- or AsO4
3- form stronger complexes with iron hydroxides
compared to divalent anions, such as SO42- and CrO4
2- (Bigham & Nordstrom, 2000). Due to
this intensive and normally irreversible binding of arsenate, the mobility of arsenic in the
(oxic) environment is clearly lower than that of chromium (Fendorf et al., 1997).
In previous studies, the sorption of sulfate, phosphate, arsenate and chromate to goethite was
described as specific, bidentate and binuclear (one ligand is bound to the surface of the
adsorbent via 2 oxygen atoms to 2 iron atoms) (e.g. Parfitt et al., 1977; Torrent et al., 1990;
Waychunas et al., 1993; Hayes et al., 1988). However, recent studies indicate that the possible
bindings of oxyanions are more complex. Based on EXAFS measurements, Fendorf et al.
(1997) described three surface complexes for arsenate and chromate bound to goethite.
Depending on their sorption density on the surface, they can form monodentate-, bidentate-
binuclear and bidentate-mononuclear complexes (Fig. II.6-3). Minor covering of the surface
results in monodentate complexes and with increasing sorption bidentate-mononuclear and
finally bidentat-binucleare complexes are formed. The different complexes imply different
bonding strengths and consequently the adsorption of an adsorbate to an adsorbent is
described with up to 3 constants. Similar complexes can be assumed for the binding of these

II.6. Surface Characteristics of Schwertmannite
73
ions to schwertmannite. However, based on acid-base titration, no distinction between these
complexes is possible.
The object in this section of the study was to characterise the adsorption of arsenate and
chromate on schwertmannite by acid-base titration. For this purpose, titration curves (plot of
pH against vs. charge) and adsorption isotherms (plot of pH vs. adsorbate concentration)
serve as tools and goethite as reference for comparisons.
6.2.2. Method: Batch Experiment
Electrolyte solutions of KNO3 (c =0.1 M) were gazed with N2 while 1 g·L-1 or 4 g·L-1 freeze-
dried schwertmannite (synthesised by the dialysis method) or goethite (the mineral synthesis
of both minerals is explained in chapter II.2.2.) were simultaneously added. Either chromate
or arsenate (as Na-salts) were added to the suspensions to obtain oxyanion concentrations of
c=10-3 M, 10-4 M or 0 M. Subsequently the suspensions were titrated with HCl or NaOH (in
each case with a maximum of c=0.1 M). The resulting 400 aliquots (appendix E), each with a
volume of 25 mL were shaken at 20 °C over 24 or 48 h. After filtration (0.45 µm), the pH and
the concentrations of oxyanions were measured in the filtrate (sulfate by ionic
chromatography, As and Cr by graphite-tube AAS and iron by flame AAS (description of the
analytic in II.2.2.).
Construction of the titration curves: The calculation of the surface charge of
schwertmannite is based on eq. 6-3. Additionally, depending on the pH, schwertmannite
releases sulfuric acid and (at pH < 2.5) iron. Therefore, the equation (6-3) was extended to
include the appropriate concentrations (eq. 6-4 and 6-5). The concentrations of SO42- and
HSO4- were calculated using the protolysis coefficient of sulfuric acid in dependence of the
arsenate-complexes chromate-complexes
monodentatee
bidentate monodentate bidentate
mononuclear binuclear mononuclear binuclear
Fig. II.6-3 Surface complexes of arsenate und chromate to goethite (Fendorf et al., 1997) Fig. II.6-3 Schematic illustration of the surface structure of As(V) and Cr(VI) on goethite (Fendorfet al., 1997).

II.6. Surface Characteristics of Schwertmannite
74
pH. In the case of arsenate or chromate additions eq. 6-4 and 6-5 were further extended to
include their (protonated) concentrations.
Sm
F)CC2CCCC( 4420 HSOSOOHHBA
⋅⋅+⋅++−−=σ −−+ − pH > 2.5 [6-4]
Sm
F)C3CC2CCCC( 3FeHSOSOOHHBA 4420
⋅⋅⋅++⋅++−−=σ +−−+ −
pH < 2.5 [6-5]
(legend according to eq. 6-3)
6.2.3. Results and Discussion
Titration curves
Fig. II.6-4 and Fig. II.6-5 show the titration curves for goethite and schwertmannite,
respectively based on the concentration of solid (1 g·L-1 and 4 g·L-1). The composition of the
suspensions (concentrations of the added acid, base and oxyanion) as well as the measured pH
value are presented in appendix E.
The pHpzc of goethite was 9.2 ± 0.3 (Fig. II.6-4). This is higher than the value of 7.2 obtained
by Sigg & Stumm (1981) in a similar experiment. However, it falls within the range cited in
literature (7.2 - 9.5) (Cornell & Schwertmann, 1996). Different synthesis conditions of
goethite and the subsequent washing of the synthesis product with deionised water, are
responsible for the large range of its pHpzc-values. Additionally, the equilibration time during
which the dry goethite-samples were suspended in solutions (hydroxilation of the surface)
affects the quantity of OH groups released from the surface. In this study, the high measured
pHpzc can probably be attributed to inadequate washing of the filter residue subsequent to the
goethite synthesis which took place in caustic potash.
-0,4
-0,2
0,0
0,2
0,4
3 4 5 6 7 8 9 10 11 12
pH
Ob
erfl
äch
enla
du
ng
(C
·m - ²)
Gt-1-24 Gt-4-24
1 g·L-1 goethite
4 g·L-1 goethite
Fig. II.6-4 Titration curve of goethite todetermine the pHpzc (measurement after 24 h).
pH
surf
ace
char
ge
(C/m
²)
Hence it can be assumed that the surface of
goethite was enriched with hydroxides which
were partly released during the re-suspension
of the mineral. This results in a shift of the
titration curve to the right, compared to that
obtained by Sigg & Stumm (1981). Similarly,
the pHpzc is clearly higher compared with
results obtained by electrophoretis (pHiep =
7.4; chapter II.6.1.), despite the use of the
same goethite material.

II.6. Surface Characteristics of Schwertmannite
75
It was therefore assumed that the equilibration time which amounted in the acid-base titration
to 24 h and in the ζ-potential measurements to only 1 h was responsible for the observed
differences. A longer time interval would result in an increased release of OH ions.
Nevertheless, the pHpzc value of goethite determined in this titration experiment was proven to
be relatively stable (± 0.3 pH units) and independent to the reaction time (24 or 48 h) as well
as to the quantity of the adsorbent (1 g·L-1 or 4 g·L-1). It was hence concluded that the
experimental procedure could be used for schwertmannite in the same way.
Although the same concentrations of acid and base were added to the aliquots of goethite, the
titration curve of schwertmannite exhibits a clearly different gradient. In contrast to the
relatively constant ionic strength adjusted to the suspensions of goethite titration (0.1 M), in
schwertmannite suspensions, the ionic strength amounted up to 0.6 M due to its pH-dependent
sulfate release. However, the value of the pHpzc is generally independent to the ionic strength
(Cornell & Schwertmann, 1996).
As demonstrated in Fig. II.6-5, the surface of schwertmannite was always positively charged
up to a pH-value of approximately 4.5 (at a NaOH addition of c = 8.2·10-4 M). Negative
surface charges were determined at pH > 9 (at a NaOH addition of c=2.5·10-3 M).
Dashed lines mark theestimated run of thetitration curve.
The pHpzc rangesbetween 6 and 8.
- 1 , 0
- 0 , 6
- 0 , 2
0 , 2
0 , 6
1 , 0
2 3 4 5 6 7 8 9 10 11 12
p H
Su
rfac
e ch
arg
e (C
/m²)
S h 1 S h 4
1 g·L-1 schwertmannite
4 g·L-1 schwertmannite
Fig. II.6-5 Titration curve of schwertmannite to determine the pHpzc (measurement after 24 h).
surf
ace
char
ge
(C/m
²)
pH

II.6. Surface Characteristics of Schwertmannite
76
Intermediate pH-values which should mark the pHpzc were not measurable, since small
variations of the titrated base causes high pH fluctuations within this pH-range. Therefore,
equilibrium cannot be reached. It was therefore assumed that the point of zero charge fell into
the range between 6 and 8.
The results obtained in this acid-base titration experiment, although more uncertain, were
similar to those obtained by electrophoretic measurements which resulted in a pHiep of 6.6
± 0.3. An increased concentration of the adsorbent (4 g·L-1) caused an increased release of
sulfuric acid and thus a small shift in the titration curve to lower pH values.
The titration curves of both, schwertmannite and goethite, were not influenced by the duration
of the experiment (24 or 48 h) (data are shown in appendix E). Consequently, experiments
with added arsenate- and chromate-solutions (represented in the following) were only run for
24 hours.
Influence of arsenate and chromate on the titration curve
In order to investigate the interactions between the schwertmannite surface and the added
anions it was assumed that no oxyanions can be incorporated into the structure (the tunnel
cavities) of crystalline schwertmannite. This means that only adsorption processes take place.
Eick et al. (1999) observed that the negative surface charge increased due to the adsorption of
arsenate and chromate to goethite. The addition of these anions to suspensions of goethite and
schwertmannite should therefore cause a similar shift of the titration curves.
Table II.6-3 shows the results of pHpzc-determinations obtained from titration curves of
goethite suspended in arsenate- and chromate-solutions (titration curves of the experimental
series are presented in appendix E). The values indicate that the added oxyanions only slightly
affected the titration curves. The pHpzc reached maximum values of 9.6 during the titration of
goethite with arsenate (c=10-3 M). The lowest pH value of 8.8 was observed in the reaction of
1 g·L-1 goethite with chromate (c=10-3 M). A general decrease in the pHpzc was observed in
small quantities of suspended goethite (1g·L-1) and low adsorbate concentrations (c = 10-4 M)
as a result of anion addition.
High concentrations of adsorbent (4 g·L-1) and adsorbate (c = 10-3 M) prevented a monitoring
of surface effects, due to the strong increase of OH- concentration in the solution.

II.6. Surface Characteristics of Schwertmannite
77
Tab. II.6-3 pHpzc of goethite determined from curves of acid-base titration (appendix E) independence on adsorbate- and adsorbent-concentration.
1g·L-1 goethite 4 g·L-1 goethite
adsorbate0 10-4 M
AsO4
10-3 MAsO4
10-4 MCrO4
10-3 MCrO4
0 10-4 MCrO4
10-3 MAsO4
10-4 MCrO4
10-3 MCrO4
pHpzc 9.2 9.0 9.6 8.9 8.8 9.45 9.55 9.6 9.55 9.55
By the method of acid-base titration, no pHpzc was received for schwertmannite. However,
the anion sorption influenced its surface charge and caused shifts of the titration curves.
Fig. II.6-6 shows the obtained curves in comparison with Cr- and As-free (dots) titration-
solutions of schwertmannite. In suspensions containing 4 g·L-1 adsorbent, lower surface-
charges and pH-values were generally determined. I.e. these curves debase compared to the
curves of suspensions containing 1 g·L-1 schwertmannite. Therefore, a decrease of the pHpzc
could be supposed. The high concentration of sulfuric acid released of schwertmannite during
its suspension, explains this acidification which increases with the increased suspended mass.
In suspensions containing 1 g·L-1, the characteristics of the anion solution strongly affected
the run of the titration curves. Highly concentrated adsorbates (c=10-3 M) caused an increase
of the pH, because in these electrolytes the pH are in neutral range.
Fig. II.6-6 Titration curve of schwertmannite in arsenate- (triangles) and chromate- (rhombs)solutions. 10-3 M solutions are presented by empty symbols; 10-4 M solutions by filled
symbols. Circles stand for schwertmannite suspensions containing no adsorbate.(measurement after 24 h).
pH pHSu
rfac
e ch
arg
e (C
*m²)
3 4 5 6 73 4 5 6 7
1.0
0.6
0.4
0.0
0.2
-0.2
0.8
1.0
0.6
0.4
0.0
0.2
-0.2
0.8
4 g·L-1 schwertmannite1 g·L-1 schwertmannite
pH pH

II.6. Surface Characteristics of Schwertmannite
78
The titration curve resulting after the addition of low adsorbate concentrations (c=10-4 M) was
nearly identical to the curve of schwertmannite without adsorbate addition. However, the
(slight) shift to the left of the titration curves in the 10-4 M solutions can be considered as a
consequence to the formation of negatively charged surface complexes. This was already
described for goethite (see above) and confirmed by Parfitt & Smart (1978) who observed a
debasement of the pHpzc due to phosphate adsorption on goethite.
The results suggest only little influence of chromate and arsenate adsorption on the surface
charge of schwertmannite. Therefore, it was supposed that the oxyanions predominantly
exchange the surface-sulfate of schwertmannite. Thus no substantial change of the surface
charge was observed.
Adsorption Isotherms
The adsorption of anions to iron hydroxides in a solution generally increases with decreasing
pH (Cornell & Schwertmann, 1996). Adsorption isotherms describe this dependency. In this
study, the adsorption of arsenate and chromate to schwertmannite and goethite was examined
as a function of the added amount of adsorbate (1·10-3 M or 1·10-4 M), the quantity of the
adsorbent (1 or 4 g·L-1) and that of the pH. In schwertmannite containing suspensions the
release of sulfate (desorption) was simultaneously measured. Fig. II.6-7 shows the resulting
adsorption- and desorption-isotherms within the pH stability-range of schwertmannite.
Adsorption of arsenate and chromate: The adsorption of chromate and arsenate to goethite
is generally high within the examined pH range (> 60 % in all experimental series, Fig. II.6-7)
and decreases only slightly with increasing pH. Eick et al. (1999) showed in their
investigations of arsenate and chromate adsorption to goethite between pH of 2 and 12 a
strong difference in the adsorption isotherms slope in dependence of these anions. This was
explained by different complexes of arsenate and chromate formed on goethite surfaces: The
triple negatively charged arsenate predominantly forms strong, bidentate-binuclear
complexes, whereas the twice negatively charged chromate forms to a major part weaker,
monodentate complexes (Eick et al., 1999).
The adsorption on schwertmannite was proven to be completely independent to the pH
within the pH range examined in this study (Fig. II.6-7). In nearly all experimental series
more than 80 % of both adsorbates were adsorbed to schwertmannite (results to the adsorption
capacity of schwertmannite are shown in chapter II.2.3).

II.6. Surface Characteristics of Schwertmannite
79
Sulfate desorption: Suspending schwertmannite normally results in a release of sulfate ions
from the solid phase into the solution. Provided that the released amount is exclusively
surface bound, it was quantified as described in the following: According to Bigham et al.
(1990) the ratio of Fe:S in schwertmannite is 8, if the tunnel cavities of the crystal lattice are
exclusively occupied by sulfate. Additionally adsorbed sulfate reduces this value and its
release by suspending the mineral causes its re-increase. Eq. 6-6 illustrates the assumption
that schwertmannite with a Fe:S stoichiometry of 6.27 (averaged measured data of synthetic
schwertmannite samples) converts into schwertmannite with the "ideal" Fe:S ratio of 8. Thus
only adsorbed sulfate would be released into solution.
Fe16O16(OH)10.9(SO4)2.55 + 1.1 H2O à Fe16O16(OH)12(SO4)2 + 1.1 H+ + 0.55 SO42- [6-6]
A complete release of the surface sulfate due to suspending of 1 g·L-1 schwertmannite (1 g =
7.2·10-4 M) corresponds therefore to a sulfate concentration of c=0.39·10-3 M. The measured
sulfate concentration after suspending of 1 g·L-1 schwertmannite in deionised water amounted
0.38·10-3 M to 0.43·10-3 M and confirmed the concentration calculated by equation 6-6.
Adsorption reactions on the surface of schwertmannite imply interactions with the surface
sulfate, since this competes with the added adsorbates for surface places. The crucial factor to
determine the surface adsorption is the binding intensity of the competitive ions to the iron-
hydroxide surface (Fendorf et al., 1997). Surface complex constants describe binding affinity
and stability of the surface complexes at a mineral surface. Arsenate and chromate form
stronger complexes than sulfate at the surfaces of Fe(III) hydroxides (Dzombak & Morel,
1990). Therefore, in schwertmannite suspensions containing arsenate and chromate, a
displacement of surface sulfate by an exchange with arsenate and chromate was expected.
The sulfate desorption of the respective experimental series represented in Fig. II.6-7
indicates that with increasing adsorbate concentration the release of sulfate increases, too.
That refers to a "sulfate displacment" due to stronger binding intensities of chromate and
arsenate. This effect seems more obvious for arsenate compared to chromate. With increasing
pH (2.5 to 4.5) the sulfate desorption generally increased. However, the release of sulfate
never extended a third of the total schwertmannite-sulfate (4·10-4 M to 5·10-4 M g-1) which
corresponds to the adsorbed quantity of sulfate (Bigham et al., 1990). Rose & Ghazi (1997)
confirmed this pH-dependency in an analysis of the sulfate release from AMD iron-
hydroxides. In their experiments, the sulfate desorption proportionally increased with
increasing pH (the examined range of pH was between 2 and 12). The highest sulfate release
(4·10-4 M·g-1 to 6·10-4 M·g-1) was measured in suspensions which did not contain any

II.6. Surface Characteristics of Schwertmannite
80
adsorbate. This can be explained by the formation of strong surface complexes of arsenate and
chromate preventing a further sulfate release.
0,0
0,2
0,4
0,6
0,8
1,0
1,2
2,5 3,0 3,5 4,0 4,5
0,00
0,05
0,10
0,15
0,20
2,5 3,0 3,5 4,0 4,5
0,0
0,2
0,4
0,6
0,8
1,0
1,2
1,4
2,5 3,0 3,5 4,0 4,5
0,0
0,2
0,4
0,6
0,8
2,5 3,0 3,5 4,0 4,5
0,0
0,2
0,4
0,6
0,8
1,0
1,2
2,5 3,0 3,5 4,0 4,5
0,0
0,1
0,2
0,3
0,4
0,5
0,6
2,5 3,0 3,5 4,0 4,5
0,0
0,2
0,4
0,6
0,8
1,0
1,2
1,4
1,6
2,5 3,0 3,5 4,0 4,5
0,0
0,2
0,4
0,6
0,8
1,0
1,2
2,5 3,0 3,5 4,0 4,5
0,0
0,2
0,4
0,6
0,8
1,0
2 4 6 8 10
0,00
0,03
0,05
0,08
0,10
2 4 6 8 10
0,4
0,6
0,8
1,0
2 4 6 8 10
0,06
0,08
0,10
0,12
2 4 6 8 10
0,00
0,03
0,05
0,08
0,10
2 4 6 8 10
0,0
0,2
0,4
0,6
0,8
1,0
2 4 6 8 10
0,06
0,08
0,10
0,12
2 4 6 8 10
0,0
0,2
0,4
0,6
0,8
1,0
2 4 6 8 10
goethite+ chromate
schwertmannite+ arsenate
goethite+ arsenate
schwertmannite+ chromate
1 g Sh in 1 mM CrO42-
1 g Sh in 0.1 mM CrO42-
4 g Sh in 1 mM CrO42-
4 g Sh in 0.1 mM CrO42-
4 g Gt in0.1 mMCrO4
2-
4 g Gt in1 mM CrO4
2-
1 g Gt in0.1 mM CrO4
2-
1 g Gt in1 mM CrO4
2-
1 g Sh in 1 mM AsO43-
1 g Sh in 0.1 mM AsO43-
4 g Sh in 1 mM AsO43-
4 g Sh in 0.1 mMAsO4
3-4 g Gt in0.1 mMAsO4
3-
4 g Gt in1 mM
AsO43-
1 g Gt in0.1 mM AsO4
3-
1 g Gt in1 mM AsO4
3-
pH
adso
rbed
/ rel
ease
d o
xyan
ion
s (m
M)
Fig. II.6-7 Adsorption of chromate (rhombs) and arsenate (triangles) to schwertmannite (Sh, white symbols) andgoethite (Gt., black symbols) and desorption of sulfate (crosses) from schwertmannite, in dependence on the pH
(the demonstrated pH range shows the stability range of the respective mineral.

II.6. Surface Characteristics of Schwertmannite
81
6.4. Summary and Conclusions
In this study investigations to characterise size, morphology and charge of the schwertmannite
surface were accomplished. It was demonstrated that the surface of schwertmannite is with up
to 300 m2·g-1 particularly large, and within the considered pH stability range (~ 2.5 to 4.5),
positively charged. Therefore, the criteria for schwertmannite to adsorb high concentrations of
oxyanions (e.g. arsenate and chromate) either additionally to or in exchange with its generally
adsorbed sulfate are fulfilled.
Bigham et al. (1990) determined the adsorbed amount of sulfate on schwertmannite by
complexation of its surface sulfate with Ba2+ cations. This value normally ranges between
4·10-4 and 5·10-4 mol·g-1 and is similar to the sulfate concentration which was released in to
suspending schwertmannite in deionised water (c=3.9·10-4 mol·g-1·L-1). The good
desorbability of sulfate indicates a weak binding of these anions. In literature, the adsorption
of sulfate to Fe(III) hydroxides is predominantly described as an outer-sphere or intermediate
(combined outer- and inner-sphere) adsorption form (Cornell & Schwertmann, 1996).
A comparison between the isotherms of schwertmannite and goethite for arsenate and
chromate adsorption shows hardly any differences between the minerals in the considered pH-
range (Fig. II.6-7). Thus, the presented results give no clear evidence for an elevated
adsorption capacity of schwertmannite compared to goethite. In chapter II.2. of this thesis the
adsorption capacity of schwertmannite is discussed in more detail.
Fendorf et al. (1997) determined the adsorption of arsenate and chromate to goethite as a
consequence of the formation of monodentate as well as bidentate complexes with different
binding intensities (Fig. II.6-3).
Adsorption isotherms constructed in this and other studies (Eick et al., 1999; Fendorf et al.,
1997) indicate that adsorption of arsenate on Fe(III) hydroxides is stronger compared to
chromate (Fig. II.6-7). Although Fendorf et al. (1997) stated that the type of the formed
surface complex of arsenate and chromate strongly depends on the surface coverage of an
adsorbent, in numerous studies the binding of arsenate to Fe(III) hydroxides was described as
specifically bidentate-binuclear (e.g. Waychunas et al., 1992; Sun & Doner, 1996). In
contrast, chromate adsorption is defined by some authors as specifically binuclear (Hsia et al.,
1993) and by others as outer-sphere (Hayes et al., 1988).
However, it is generally accepted that the strength of surface complexes at low pH increase
from ≡FeSO4- to ≡FeCrO4
- to ≡FeH2AsO4 (surface complexation-constants of the complexes

II.6. Surface Characteristics of Schwertmannite
82
were calculated by Dzombak & Morel, 1990; Tab. II.2-8). Observations obtained in this study
confirm this order of complexation strength.
Surface complexation model of schwertmannite
In literature the oxyanion binding to iron hydroxides is normally described by detailed surface
complex models (e.g. Sigg & Stumm, 1981; Fendorf et al., 1997, 2001; Fuller et al., 1989;
Dzombak & Morel, 1991). These models give information about strength and types of surface
complexes.
I suppose that a similar modelling for schwertmannite can not be performed due to the
metastability of this mineral which results in its dissolution or transformation during
suspension (Bigham et al., 1996). The associated released amount of sulfate differs in
dependence to both, pH and adsorbate and it prevents the adjustment of a stable equilibrium
in schwertmannite suspensions. Moreover, the total surface-sulfate (released and adsorbed
amount) is in competition with possible adsorbates for surface places and influences the
obtained adsorption isotherms.
Investigations of Gao & Mucci (2001), who characterised the simultaneous adsorption of
phosphate and arsenate on the surface of goethite, confirm this assumption. They stated that in
the presence of several oxyanions in a solution the description of their adsorption by a
universal model is not possible. Though the 2-layered model of Stern (Fig. II. 6-1) is
conditionally suitable to characterise such systems, in conclusion, the different processes of
competition- and exchange reactions of inner- and outer-sphere adsorption are too complex
and not yet completely comprehended.
Similarly, the results of this adsorption study suggest that during anion adsorption on
schwertmannite competition reactions with the surface sulfate are always implied. The
obtained results partly permit a determination of the surface processes, but the complex
interactions of several oxyanions on the schwertmannite surface prevent an exact modelling
with the available data.
Future investigations of adsorption processes on schwertmannite should involve the use of
higher concentrated adsorbates to detect the limit of schwertmannite adsorption-capacity.
Furthermore the use of spectroscopic measurement techniques as EXAFS can be
recommended to determine the types of formed complexes.

III. Formation and Transformation of Schwertmannite in Sediments of Acidic Lignite Mining Lakes
83
III. FORMATION AND TRANSFORMATION OF
SCHWERTMANNITE IN SEDIMENTS OF
ACID LIGNITE OPENCAST LAKES
1. INTRODUCTION
In Germany, lignite mining in opencast was of major importance to the industry since the
middle of the 20th century (Asche et al., 1999). For several years it has not been profitable
anymore and as a consequence many mines were closed. A resulting rise in the groundwater
level leads to the formation of lakes in the former pits. Characteristics of these lakes are their
hostile conditions to the environment due to high concentrations of sulfate, iron (both are
frequently present of about 10 mM) and acid (pH 3 to 4) in most of the surface waters
(Herzsprung et al., 1998; Peine et al., 1998). In Germany many acidic lignite mining lakes
exist, most of them located in “Mitteldeutschland” and in “Lausitz”. Consequently it is the
objective of governments and water management offices to neutralise them to reach an
integration in recreation and conservation areas (Landesumweltamt Brandenburg, 1995).
Therefore, it is of great importance to understand the processes occurring in these acid lakes
to prevent further acidification and to make way for renaturation projects.
Groundwater flowing through dumps surrounding the opencast lake oxidises the pyrites
included in the lignite. Pyrite oxidation is a complex process consisting of numerous chemical
reactions which were extensively investigated during the last years (Nordstrom et al., 1982;
Evangelou & Zang, 1995; Nordstrom & Alpers, 1998):
The initial process (occurring in the lignite dumps) is the oxidation of the pyrite sulfide to
sulfate by groundwater oxygen (Nordstrom & Alpers, 1998):
FeS2+ 7/2O2+H2O à Fe2+ + 2 SO42- + 2H+ [1]
This anoxic, weakly acid (pH 5-6), Fe2+ and sulfate-rich water oxidises when it enters into
the lake (Nordstrom & Alpers, 1998):
Fe2++1/4O2 + H+ à Fe3+ + 1/2 H2O [2]
Finally, the Fe3+ precipitates as hydroxide by the release of acid. A summary of all reactions
involved is given in the following equation (Nordstrom & Alpers, 1998):
FeS2 + 3.75 O2 + 3.5 H2O à Fe(OH)3 + 2 SO42- + 4 H+ [3]

III. Formation and Transformation of Schwertmannite in Sediments of Acidic Lignite Mining Lakes
84
In this reaction the product “Fe(OH)3” represents a group of different secondary minerals
including jarosite, goethite and ferrihydrite as the most common minerals. But the Fe(III)
oxyhydroxysulfate schwertmannite has also been identified in the sediment of an acidic
mining lake (Peine & Peiffer, 1998).
Schwertmannite is, due to its weak crystallinity, metastability, variable composition and
similarity to other minerals (Bigham et al., 1990, 1996) difficult to identify and therefore few
investigations about its importance for the environment were carried out.
For a better understanding of its characteristics mentioned above, it is necessary to consider
the crystal structure of schwertmannite which is isostructural to the well described akaganéite
(FeO(OH)1-xClx) (Bigham et al., 1990). The crystals of this mineral are composed of double
chains of FeO3(OH)3 octahedra that share corners to yield square tunnels extending parallel to
the c-axis. Each tunnel is composed of adjoining cavities formed by eight OH groups, with
one cavity per unit cell (Murad, 1979). In akaganéite, chloride is normally enclosed in the
cavities and bonded by electrostatic interactions, whereas in schwertmannite sulfate is directly
incorporated by sharing its oxygen atoms with the iron-hydroxide octahedra. The resulting
complexes are linked by Fe-O-SO2-O-Fe complexes which distort the akaganéite structure.
This can be explained by the size of the sulfate ion which is, compared to chloride, too large
for an undisturbed storage in the tunnel cavities of the structure. This distortion results in a
reduced crystal growth which is consistent for the poor crystallinity of the mineral. Therefore,
schwertmannite consists only of small particles (< 200 nm in diameter) with a large surface
area (around 200 m2 per gram) on which a large amount of sulfate is normally adsorbed. Due
to this adsorbance, the composition of schwertmannite varies, resulting in a variable formula
of the unit cell which is expressed as Fe16O16(OH)y(SO4)z, where 16-y=2z (Bigham et al.,
1994). Other consequences of the poor crystallinity are a high solubility and low stability
which suggest that schwertmannite is only stable in the pH-range between 2.5 and 4.5
(Bigham et al., 1996).
Most waters of lignite mining lakes are characterised by this pH-range (Landesumweltamt
Brandenburg, 1995) and therefore schwertmannite can be expected in this environment. The
purposes of this study are (1) to examine the frequency of schwertmannite in the sediments of
acid lignite opencast lakes (AML) and to predict which mineral is the predominantly formed
iron(III) hydroxide in these environments; (2) to investigate if schwertmannite buffers the pH
of the surface waters due to formation and dissolution of schwertmannite and prevents further
acidification; (3) to elucidate the cycle of formation, dissolution and transformation of
schwertmannite in the lakes.

III. Formation and Transformation of Schwertmannite in Sediments of Acidic Lignite Mining Lakes
85
2. MATERIALS AND METHODS
2.1. Study sites
The 18 investigated acidic mining lakes (AML) are located in three different lignite mining
areas in Germany (Fig. III-1). In the region of the Lausitz, twelve lakes were examined.
Geology is marked by Quaternary glacier-sediments mostly sands and till-marls which cover
Tertiary sediments (Nowel et al., 1995). Pyrite content in the excavation amounts 0.014 %
(Landesumweltamt Brandenburg, 1995) and the sulphur content in the lignite is 0.3 to 1.5 %
(Nowel et al., 1995).
All investigated lakes are located near the excavation dumps of the lignite. Due to the
groundwater inflow which infiltrated the dumps before, the surface water of the lakes is
affected by acid mine drainage and thus characterised by low pH-values. An overview about
names, location and volume of the lakes is given in Table III-1.
In the mining area Oberpfalz,
where four lakes were
investigated, Tertiary and
Cretaceous sediments of sand and
clay form secondary-rocks.
Lignites, inter-bedded in these
high permeable, miocene sands
(Meyer & Mielke, 1993), contain
1.8 to 2.6 % pyrite (Meyer &
Poschlod, 1993). Just as lignites
from Lausitz and Oberpfalz, the
lignites in the area of
Mitteldeutschland, where two
lakes were investigated, pertain to
the Tertiary Eozene to Oligozene
(Henningsen & Katzung, 1998).
The dumps contain up to 4 %
pyrite, further minerals are mostly
quartz 50-90 %), feldspar (5-20
%) and kaolinite (0-10 %) (Krüger
& Reinhäckel, 2001).
Fig. III-1 Study sites in the eastern Germany: 18 acidicmining lakes (AML).
40 km
Regensburg
Berlin
Lausitz

III. Formation and Transformation of Schwertmannite in Sediments of Acidic Lignite Mining Lakes
86
Table III-1 Site description of 18 acidic mining lakes investigated(Peine, 1998; LMBV, 1997, Brand, 2001).
No Lake name region Flooding period/lake age (years)
Surface(ha)
Lake volume ormax. depth
1 ML 772 ML 1173 ML 107
~ 40~ 40~ 40
24~ 60
-
depth: 7 mdepth: 13 m
-4 ML 111 ~ 40 ~ 100 -5 ML 136 ML F
end: 20131999 - 2005
38234
volume: 5 Mio m³ volume: 25 Mio m³
7 Spreetal NO 1998-2003 314 volume: 97 Mio m³8 Kortitzmühle ~ 30 - -9 Koschen10 Bluno11 Skado12 Sedlitz
Lau
sitz
1999 - 20011999 - 20061999- 20071999 - 2011
6201211980
1311
volume: 39 Mio m³volume: 152 Mio m³volume: 130 Mio m³volume: 141 Mio m³
14 Borna Ost not finished - -
13 Niemegk Mitt
el-
Deu
tsch
-la
nd
flooding start: 1999 - -
15 Murnersee16 Brückelsee17 Ausee18 Lindensee O
berp
falz
flooding start: 1979(No 15), followed
by No 16, 17 and 18(not yet finished).
1452490121
depth: 45 mdepth: 40 mdepth: 30 mdepth: 12 m
2.2. Sampling
Sampling of lake sediment and water was carried out between August and October 2000,
during the stagnation period of the lakes. In ML 77 samples were already taken in summer
1997.
Depth profiles of pH, oxygen, temperature and electrical conductivity were measured with a
multi-parameter probe. Water samples were taken 1 m below the surface and 1 m above the
ground with a water trowel. A sub-sample was acidified with 1 0/00 concentrated HNO3
already in the field and the Fe2+ concentration was determined at the same day
photometrically in laboratory. The remaining sample was filtrated (0.2 µm) in the field,
cooled during transport and stored deep frozen in laboratory before further investigations.
Sediment sample cores were taken with a gravity corer (∅ 6 cm) in plexi-glass tubes from the
deepest (if known) part of each lake. Visually, an upper reddish to yellow layer between 1 to 5
cm could be distinguished from the deeper layers. We attributed this layer to freshly deposited
iron(III)minerals, their occurrence being directly linked to the geochemical processes within
the lakes, and separated only this layer for sediment analysis. The sediment samples were
flushed with N2 immediately after arrival and deep-frozen. Before further analysis the samples
were defrosted, filtrated (blue-ribbon) and the residue was dry frozen.

III. Formation and Transformation of Schwertmannite in Sediments of Acidic Lignite Mining Lakes
87
In ML 77, freshly precipitated material was collected in sediment traps, installed 1 m above
the lake ground. The traps consisted of cylindrical tubes constructed after Bloesch and Burns
(1980). The sediment core taken in this lake reached a sediment depth of 37 cm, the upper 12
cm were separated into intervals of 1 cm thickness. These sub-samples were dry frozen.
In order to obtain colloidal particles, water samples of three mining lakes (ML 77, ML117 and
Borna Ost) were first (pre-)filtered through a 0.2 µm cellulose acetate filter. The filter
residues of this filtration were separated from the cellulose filter by dissolution in aqua bidest
(10 mL) and simultaneous treatment by ultra sound (15 min.). Finally enrichment occurred by
centrifugation (20 minutes and 20800 G; the supernatant was removed with a pipet) and the
dried (60 °C) solids were analysed for mineralogical composition by FTIR spectroscopy
(described below).
The remaining material in the filtrate was enriched by an ultra-filtration system (Amicon).
Fractionation of particles was obtained by the use of different cellulose membranes (1 kDa, 10
kDa, 100 kDa). In the filtrate of each 50 mL fractionated sample the iron and sulfate content
was determined in four replicates. High amounts of colloidal material of the four different
fractions were produced by filtration of each 800 ml water sample. The filter residues of the
three fractions were enriched by centrifugation (3 times for 20 min. and 20800 G) and finally
dried (60 °C) and prepared for FTIR spectroscopic analysis (described below).
2.3. Analytical Methods
The redox voltage in the lake waters was determined using a platinum cell and converted in
pe-values after calibration against chinhydron saturated pH- buffer solutions.
SO42-, Cl-, Ca2+, Mg2+, K+, Na+ and NH4
+ were measured by ion chromatography, Fe(II)
photometrically by the phenantroline method (Tamura et al., 1974) and Fe(tot) and Al(tot) by
flame atomic absorption spectrometry. Fe(III) was determined as the difference between total
and ferrous iron.
Water-free sediment-samples were partly extracted with acid ammonium-oxalate (pH 3) for
15 minutes in the absence of light to separate the weakly-crystalline and well soluble solid-
phase from the better crystalline material. Weakly crystalline iron minerals as schwertmannite
dissolve completely within this time and without the influence of the UV radiation (Carlson &
Schwertmann, 1981, Bigham et al., 1990) contrary to well crystalline minerals as goethite and
jarosite. In the oxalate extracts (1 g·L-1 solid phase reacted with the oxalate solution), total
iron was determined by flame AAS and total sulphur by ICP-AES.
The mineral composition of the sediment material (without extraction) was determined after
grinding the samples by powder X-ray diffraction (XRD) analysis using a Siemens D 5000 X-

III. Formation and Transformation of Schwertmannite in Sediments of Acidic Lignite Mining Lakes
88
ray diffractometer with Co-Kα1,2 anode. The specimen were step-scanned from 10 to 80° 2θ
in increments of 0.02 2θ with 2 s counting time (in few cases 0.01 2θ per 8 s).
Mineral identification occurred either by the library evaluation-program DiffracAT Vers. 3.3
or in the case of schwertmannite by comparison with a schwertmannite standard, synthesised
in the laboratory (the diffraction pattern was identical to that of schwertmannite described by
Bigham et al., 1990).
Fourier Transform Infrared (FTIR) spectra of the samples were generated using a Vektor 22
Bruker FTIR spectrometer with a KBr beamsplitter. The sample scans ranged between
wavenumbers of 7500 and 370 cm-1 (the middle infrared) with 1 cm-1 resolution. 32 scans
were collected for each measurement. The samples were measured in transmission as KBr-
pellets which were produced as homogenous mixture of 3 mg sample and 300 mg KBr
pressed with a hydraulic press at a load of ∼eight tons. The peaks were identified with the
evaluation programme OPUS-NT and compared to mineral-librarys of Farmer (1974), Van
der Morel & Beutelspacher (1976) and the IR spectrum of schwertmannite described by
Bigham et al. (1990). In order to eliminate interferences from kaolinite or other silicates
frequently present in the natural samples, the spectra of the filter residue from the oxalate
insoluble fraction were subtracted from those of the original sediment sample.
Additionally to qualitative identification of the minerals, the quantitative composition was
determined with IR spectroscopy in the sample cores of ML 77. Generally, by IR
spectroscopy only semi-quantitative analysis of natural samples can be obtained, because the
IR-absorption intensity is influenced of the crystallinity and grain size of one mineral.
Normally these characteristics differ between calibration minerals and natural samples
resulting in a non-uniformly scattering of the infrared radiation at the crystals surfaces
(Günzler & Heise, 1996). Moreover, large errors in weight are probable, due to the very low
net weight (3 mg) which should be weighted as exact as possible (Russel & Fraser, 1994).
Therefore, the standard deviation in quantitative IR measurements is about ± 10 % (Günzler
& Heise, 1996). Yet, to quantify the mineral composition of the sample core, the spectrometer
was calibrated with the synthetic produced minerals schwertmannite and goethite, the two
minerals contained in the sample which were identified by XRD. In different ratios the two
minerals were mixed (in intervals of 10 wt.-% ), pressed to pellets and for each mixed ratio
the spectrum was measured. The absorption intensities of four mineral-characteristic peaks
(for goethite, the OH bands located at 891 cm-1 and 795 cm-1 and for schwertmannite, the ν3-
sulfate band at 1132 cm-1 and the FeO band at 702 cm-1) were measured and the mixed

III. Formation and Transformation of Schwertmannite in Sediments of Acidic Lignite Mining Lakes
89
intensity for each ratio and peak was calculated. A mixture of a % goethite and b %
schwertmannite features the mixed intensity (Imix) in the IR spectrum at peak-location x :
Imix, x = 0.a ⋅IGt,x + 0.b ⋅ISh,x [4]
IGt,x, ISh,x: mean values of the intensities of three parallel measured goethite andschwertmannite standards, respectively at location x (wavenumber).
The error for the calculated mixtures at each wavenumber was evaluated after the law of error
propagation for additions (Sachs, 1992):
2Sh
2Gtmix )s(8,0)s(2,0s += [5]
The calibration line was created by plotting Imix against the corresponding mineral
composition. The intensities of the measured peaks of sediment-segment samples of the core
taken in ML 77 were compared to this calibration line to predict the contents of
schwertmannite and goethite in the sediment in dependence on sediment depth.
Particle morphology and surface area
Scanning electron microscopy (SEM) was used to determine the particle morphology of the
solid samples (Leo 1530). Samples were covered with platinum layer before measurement.
The specific surface area was determined by N2 adsorption using the BET method (Brunauer
et al., 1938).
2.4. Geochemical Modeling
The geochemical modelling program PhreeqC (vers. 2.02) was used to calculate chemical
equilibria between the solid and dissolved phase in the lakes and to predict the dominating
species and ionic complexes in the water as well as the formation of minerals. Most stability
constants were taken from the PhreeqC data file which based on Nordstrom et al (1990).
Table III-2 lists the solubility functions of the four Fe-minerals considered in this study, i.e.
goethite, jarosite, schwertmannite and ferrihydrite according to Bigham et al (1996) and
Parkhurst (1995).
Eq. 6 gives the relative error (r) of ionic activities (determined after the Davis equation) as
result of charge imbalances L which were determined with PhreeqC.
)i(alog
)i(alog)i(alog))i(a(logr
0
0L −= [6]
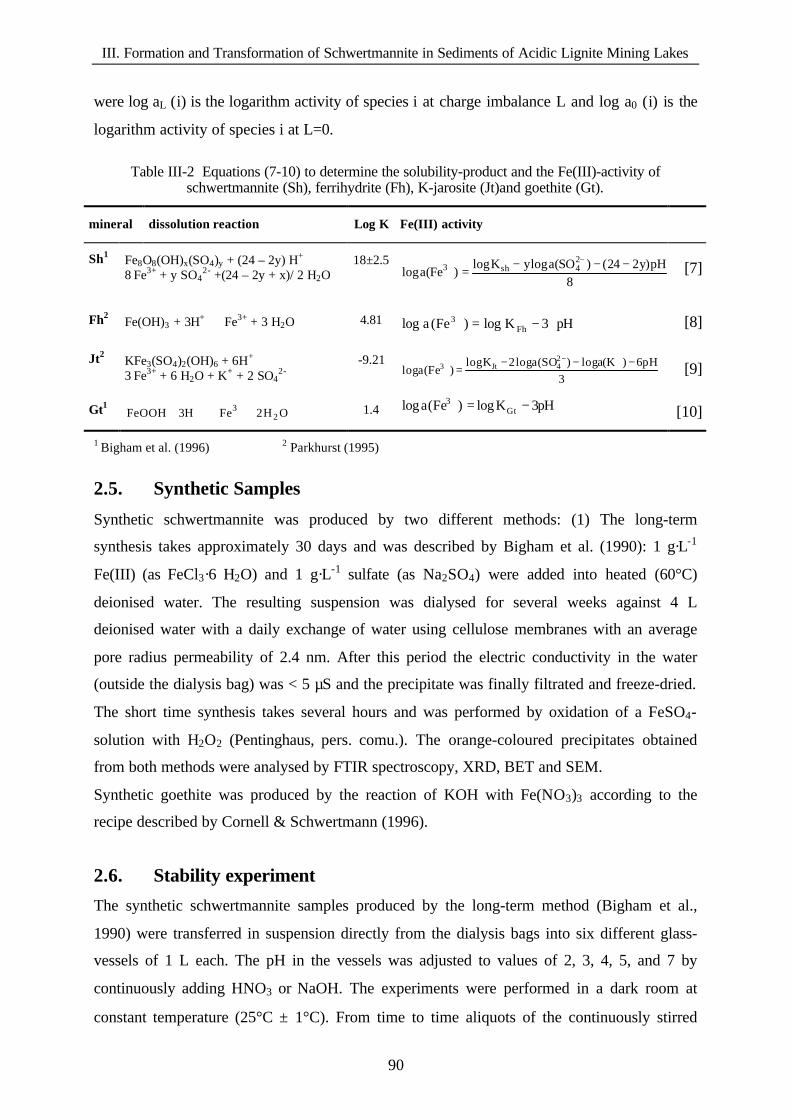
III. Formation and Transformation of Schwertmannite in Sediments of Acidic Lignite Mining Lakes
90
were log aL (i) is the logarithm activity of species i at charge imbalance L and log a0 (i) is the
logarithm activity of species i at L=0.
Table III-2 Equations (7-10) to determine the solubility-product and the Fe(III)-activity ofschwertmannite (Sh), ferrihydrite (Fh), K-jarosite (Jt)and goethite (Gt).
mineral dissolution reaction Log K Fe(III) activity
Sh1 Fe8O8(OH)x(SO4)y + (24 – 2y) H+ ⇒8 Fe3+ + y SO4
2- +(24 – 2y + x)/ 2 H2O18±2.5
8pH)y224()SO(alogyKlog
)Fe(alog24sh3 −−−=−
+ [7]
Fh2Fe(OH)3 + 3H+ ⇒ Fe3+ + 3 H2O 4.81 pH3Klog)Fe(alog Fh
3 ⋅−=+ [8]
Jt2KFe3(SO4)2(OH)6 + 6H+ ⇒3 Fe3+ + 6 H2O + K+ + 2 SO4
2--9.21
3
pH6)K(alog)SO(alog2Klog)Fe(alog
24Jt3 −−−
=+−
+ [9]
Gt1OH2FeH3FeOOH 2
3 +⇒+ ++ 1.4 pH3Klog)Fe(alog Gt3 −=+
[10]
1 Bigham et al. (1996) 2 Parkhurst (1995)
2.5. Synthetic Samples
Synthetic schwertmannite was produced by two different methods: (1) The long-term
synthesis takes approximately 30 days and was described by Bigham et al. (1990): 1 g·L-1
Fe(III) (as FeCl3·6 H2O) and 1 g·L-1 sulfate (as Na2SO4) were added into heated (60°C)
deionised water. The resulting suspension was dialysed for several weeks against 4 L
deionised water with a daily exchange of water using cellulose membranes with an average
pore radius permeability of 2.4 nm. After this period the electric conductivity in the water
(outside the dialysis bag) was < 5 µS and the precipitate was finally filtrated and freeze-dried.
The short time synthesis takes several hours and was performed by oxidation of a FeSO4-
solution with H2O2 (Pentinghaus, pers. comu.). The orange-coloured precipitates obtained
from both methods were analysed by FTIR spectroscopy, XRD, BET and SEM.
Synthetic goethite was produced by the reaction of KOH with Fe(NO3)3 according to the
recipe described by Cornell & Schwertmann (1996).
2.6. Stability experiment
The synthetic schwertmannite samples produced by the long-term method (Bigham et al.,
1990) were transferred in suspension directly from the dialysis bags into six different glass-
vessels of 1 L each. The pH in the vessels was adjusted to values of 2, 3, 4, 5, and 7 by
continuously adding HNO3 or NaOH. The experiments were performed in a dark room at
constant temperature (25°C ± 1°C). From time to time aliquots of the continuously stirred

III. Formation and Transformation of Schwertmannite in Sediments of Acidic Lignite Mining Lakes
91
suspension were sampled from each vessel and filtrated through a blue ribbon filter. Sulfate
and Fe(tot) were measured in the filtrate and the filter residue was investigated by FTIR
spectroscopy. Finally (after 362 days) the remaining solid was analysed by XRD.
3. RESULTS
3.1. Hydrochemistry of Acidic Mining Lakes (AML)
Measured data: All investigated mining lake surface waters had a similar hydrochemical
composition with low pH-values (2.3 to 4.7) and high sulfate concentrations (3-19 mmol⋅L-1).
The predominant cations were calcium (> 1.4 mmol⋅L-1), magnesium (> 0.2 mmol⋅L-1) and
iron (up to 11 mmol⋅L-1), both in the ferric and ferrous form. Fe(III) concentrations generally
exceeded that of Fe(II) and O2-saturation was between 35 and 97 %. The results of the most
important hydrochemical parameters, used in calculations of solubility in the modelling are
shown in Table III-3. The completely measured data are presented in appendix F.
Table III-3 Hydrochemical parameter of ML surface water samples, taken 1 m below surface.Sampling time was in summer 2000 (Brand, 2001) and in summer 1997 (ML 77, Peine, 1998).
ML pH pe SO42-
(mM)O2
(mM)Fe(III)(mM)
Fe(II)(mM)
ML pH pe SO42-
(mM)O2
(mM)Fe(III)(mM)
Fe(II)(mM)
ML 77 2.9 n.m. 8.5 0.34 1.5 0.03 Bluno 2.9 13.2 13.7 0.27 0.9 0.015
ML 107 2.3 13.8 65 n.m. 11.1 0.04 Skado 2.8 13.4 18 0.28 1.5 0.017
ML 117 3.0 13.4 9.3 0.30 0.3 0.004 Sedlitz 3.0 13.2 18.6 0.28 0.4 0.010
ML 111 2.7 13.3 14.9 0.26 2.6 0.055 Borna Ost 2.9 13.7 19.4 0.27 1.2 0.021
ML 13 2.9 12.8 7.5 0.29 0.23 0.028 Niemegck 4.7 4.5 3.4 0.28 n.d. n.d.
ML F 2.8 12.9 17 n.m. 0.5 n.d. Murner See 3.3 13.3 3.2 0.25 0.025 0.028
Spreetal NO 3.6 10.8 10.4 0.24 0.01 0.001 Ausee 3.0 n.m. 4.6 0.25 0.183 0.033
Kortitzmühle 4.7 7.8 12.4 0.27 0.004 n.d. Lindensee 2.8 n.m. 6.6 0.24 0.27 0.078
Koschen 3.1 12.4 7.6 0.26 0.22 0.001 Brückelsee 3.1 n.m. 3.4 0.27 0.54 0.024
n.d. not detected (< 0.1 µmol·L -1), n.m. not measuered
Calculated data (PhreeqC): Calculation of the chemical speciation indicated that in all lakes
with pH-values < 3.5, iron(III) was predominantly (~75 % of total ferric iron) complexed as
sulfate (Fe(SO4)+ and Fe(SO4)2-). Other complexation forms as Fe(OH)2+, Fe(OH)2
+, Fe(OH)3
or free Fe3+ play a minor role. Ferrous iron was for ~50 % uncomplexed as Fe2+, ~30 % as
FeSO4 and ~20 % as FeHSO4+ (quantitative distribution of the speciation of ferric and ferrous
iron is presented in appendix G).
Saturation indices (SI) were > 0 (oversaturated) for goethite and jarosite in 17 of all lakes
studied and equalled 0 in case to schwertmannite in 15 of the lakes.

III. Formation and Transformation of Schwertmannite in Sediments of Acidic Lignite Mining Lakes
92
Charge imbalances (eq. 5) which can affect the relative error r for SO42-- and Fe3+-activities
(eq. 6) were negative (between -10 and -30 %,) for most AML. In one lake even – 50 % (ML
107) were detrmined. The maximum error (r) due to this highest charge imbalance would
result in an overestimate of the sulfate activity of 14 % and in an underestimate of 11 % for
Fe3+ activity relative to the activity determined by calculations of PhreeqC.
Fig. III-2 shows a plot of calculated activities of Fe3+ as a function of pH. Included in this
diagram are the solubility lines of goethite, jarosite, ferrihydrite and schwertmannite (eq. 7-
10). The solubility windows of schwertmannite and jarosite (marked by dashed lines in Fig.
III-2) result from variable SO42-- and K+-concentrations of these minerals. Nearly all samples
are located in the solubility-window of schwertmannite indicating that schwertmannite
controls the solubility of Fe(III) in most of the lakes.
Measuered pe-values in the lakes were compared to the ratio of the redox couple Fe2+/ Fe3+
(Fe2+ à Fe3+ + e-) according to equation 11.
pε = -log kFe(II)/Fe(III) + log a(Fe3+)/ log a(Fe2+) [11]
log KFe(II)/Fe(III) = -13
-10
-8
-6
-4
-2
2 2,5 3 3,5 4 4,5 5
pH
log
a (
Fe3+
)
jarosite
schwertmannite
ferrihydrite
goethite
dissolved iron
Fig III-2 Plot of the logarithm of Fe3+ activity against pH for surface-waters of 18 acidic mining lakeswith solubility lines for goethite (log a(Fe3+) = 1.4 - 3pH), ferrihydrite (log a(Fe3+) = 4.83 - 3pH), K-jarosite (mid-line: log a(Fe3+) =-0.19-2 pH) and schwertmannite (mid-line: log a(Fe3+) = 2.7 - 2.63 pH).Maxima- and minima (dashed lines) for solubility windows of schwertmannite were given using log a(SO4
2-) = -1 to -1.5 and of jarosite using log a (SO42-) = -1.85 to –2.5 and Log a (K+) = -3.5 to - 4.07.

III. Formation and Transformation of Schwertmannite in Sediments of Acidic Lignite Mining Lakes
93
It was shown for most of the surface waters (except ML Niemegk and ML Kortitzmühle) that
pε ≈ pe and therefore the ratio Fe2+/ Fe3+ controls the pe and the use of a pε-pH-diagram (Fig.
III-3) can give information about redox-equilibria and stabilities of iron minerals in the lakes.
3.2. Composition of the Upper Sediment Layers
Due to the uncertainty in determination of weakly crystalline iron minerals, three independent
methods were applied to identify the mineral composition of the sediments of mining lakes.
Powder X-ray diffraction (XRD) proved the occurrence of schwertmannite in four lakes and
suggested it to be probable in two lakes. The XRD pattern of schwertmannite consists of eight
broad and “noisy” peaks with maxims at d values (in nm) of 0.486, 0.339, 0.255, 0.288,
0.195, 0.166, 0.151, 0.146 (Bigham et al., 1990).
Fig. III-4 shows the XRD pattern of two sediment samples (ML Skado and Murnersee)
compared to synthetic schwertmannite. While the broad peaks of schwertmannite were
identified in the XRD pattern of sample “ML Skado”, they were not detected in the sample
“Murnersee”. Instead of, the clearly visible peaks in this sample correspond to the minerals
quartz and kaolinite which are also present in this sample.
5
7
9
11
13
15
17
19
1,5 2,5 3,5 4,5 5,5
pH
pe
Stability range
of Sh
O2Jt
dissolved iron
Gt
Sh: schwertmanniteJt: jarositeGt: goethite
measured sediment sample
equilibrium range of Sh stability lines of Jt and Gt
pH at Gt- and Jt-stability
Gt
p εε
Fig. III-3 pε-pH-diagram for the system K-Fe-SO42. Equilibration lines were calculated using
formula in Table 3. The stability line between Jt and Gt was calculated using KFe3(SO4)2(OH)6 ↔3 FeOOH + 3 H+ +K+ +2 SO4
2- (log K = -13.4) and between H2O and O2 using 2 H2O ↔ O2 + 4 H+ + 4e- (log K= 86.08). Datapoints represent measured values of pe and pH. Goethite and jarosite are thethermodynamic stable minerals.

III. Formation and Transformation of Schwertmannite in Sediments of Acidic Lignite Mining Lakes
94
The occurrence of jarosite was proven in two lakes and that of goethite in four lakes (Tab. III-
4). Identification of schwertmannite in sediments of other lakes was not be possible by XRD.
Its presence, however could not be ruled out due to the high background of minerals of higher
crystallinity (for example quartz and kaolinite).
In contrast to the minerals goethite and jarosite or to silicates, weakly crystalline minerals as
schwertmannite and ferrihydrite are well soluble in acid ammonium oxalate. Therein the Fe:S
ratio was used as indicator for the occurrence of schwertmannite. It typically ranges between
5 to 8, if schwertmannite is the predominant iron (III)mineral phase and exceeds eight in the
presence of ferrihydrite to which sulfate can only be adsorbed. A low ratio should indicate the
presence of jarosite (normally 1.5) but this mineral is similar to goethite not extractable in the
oxalate solution. The soluble part in most of sediment samples of the mining lakes was larger
than 50 %. Therein the determined Fe:S ratio indicated in eight lakes the occurrence of
schwertmannite (Table III-4). Ratios lower than 5 were determined in six lakes. Therein
schwertmannite potentially occurs in combination with other, not identified (X-ray
amorphous) sulfates.
Fig. III-5 shows the IR spectrum of the sample “ML Skado”, with bands of kaolinite and
goethite (OH vibrations) and the spectrum of the same sample after subtraction of the oxalate-
insoluble fraction from the sediment spectrum. This difference spectrum contains the same
bands as synthetic schwertmannite. Therefore, it can be assumed that the oxalate-extractable
fraction of the sediment consists of schwertmannite. Evidence for the occurrence of
Fig. III-4 X-ray diffraction pattern of synthetic schwertmannite and of sediment samplestaken from ML “Skado” and “Murnersee”. While “Skado” shows the features ofschwertmannite, the clear peaks in Murnersee” mostly correlate with kaolinite.

III. Formation and Transformation of Schwertmannite in Sediments of Acidic Lignite Mining Lakes
95
schwertmannite by this method was obtained in eleven lakes, in five lakes goethite and in
three lakes jarosite were identified (Table III-4).
Table III-4 Identification of iron minerals in the upper sediment layer of AML by XRD, FTIRspectroscopy and Fe:S ratio in the oxalate-extractable fraction.
The “total result” gives a mean value of the three analytical methods for predication.
ML sample XRD Ratioof Fe/S
FTIR totalresult
ML sample XRD Ratio ofFe/S
FTIR totalresult
ML 77 Sh 5.9 Sh Sh Sh Bluno i.n.p. 3.7 (Sh) Sh, Jt (Sh, Jt)
ML 107 (Sh),Gt 2.9 (Sh) Sh, Gt Sh, Gt Skado Sh, Gt 4.9 Sh Sh, Gt Sh,Gt
ML 117 (Sh), Jt 1.4 Sh, Jt Sh, Jt Sedlitz Sh, Gt 5.1 Sh Sh, Gt Sh,Gt
ML 111 Jt 2.6 (Sh) Jt Jt Borna Ost i.n.p. 3.1 (Sh) i.n.p (Sh)
ML 13 i.n.p. 4.3 Sh i.n.p. (Sh) Niemegck Gt 7.9 Sh Sh, Gt (Sh, Gt)
ML F i.n.p. 5.1 Sh Sh (Sh) Murner See i.n.p. 1.3 i.n.p. i.n.p.
Spreetal NO i.n.p. 5.5. Sh Sh (Sh) Ausee i.n.p. 3.3 (Sh) i.n.p. (Sh)
Kortitzmühle i.n.p. 16 Sh, Gt, Jt (Sh) Lindensee i.n.p. 1.5 i.n.p. i.n.p.
Koschen Sh 4.7 Sh Sh Sh Brückelsee i.n.p. 3.5 (Sh) i.n.p. (Sh)
Sh: schwertmannite, Gt: goethite, Jt: jarosite; minerals in brackets stand for „probably formed minerals“i.n.p. identification not possible
Wavenumber (cm-1)
Skado
syntheticschwertmannite
difference spectra
SO4
Gt
2.0
1.5
1.0
0.5
0
Ab
sorb
ance
1500 1000 750 5001250
Kt
Fig. III-5 FTIR-spectrum of the sediment sample “Skado” with marked bands of kaolinite (Kt)and goethite (Gt) and the difference spectrum of “Skado” (result of the untreated sample minus
the filter residue from the NH4-oxalate extraction) compared to the spectrum of syntheticschwertmannite (middle) with marked sulfate bands (at 610, 976, and 1000 to 1200 cm-1).

III. Formation and Transformation of Schwertmannite in Sediments of Acidic Lignite Mining Lakes
96
To summarise, schwertmannite was unambiguously identified by all three methods in six
samples, whereas its presence can be clearly excluded in one samples (Murnersee). In the
other lakes identification using XRD failed, however, the other methods indicate the
occurrence of schwertmannite.
3.3. Colloid Analysis of Surface Waters
Colloid analysis of surface waters in three different lakes (Borna Ost, ML 117, ML 77) by
mass-balance approach showed that most of the colloids containing iron and sulfate (~ 93 -97
%) were found in the smallest filter-size in the range of 10-1 kDa (appendix H). This colloidal
fraction was identified in the three lakes as schwertmannite using FTIR spectroscopy.
3.4. Depth-dependent Alteration of the Sediment Composition (ML 77)
The variation of Fe(III) mineralogy in the sediment and in sediment traps as well as the pH-
value in the pore water depending on depth (0 to 11 cm) was examined. By X-ray diffraction,
the Fe(III) mineralogy in the top layer and in the sediment trap (installed 1 m about ground
level) was determined as pure schwertmannite and in the deepest layer (11 cm depth) of the
investigated sediment as pure goethite.
FTIR spectroscopic measurements
were used to describe the change in
mineralogy by depth. The spectrum
of each sample was analysed for the
intensity of each two characteristic
peaks of schwertmannite (at 1124
and at 704 cm-1) and goethite (at 892
and at 795 cm-1). These intensities
were compared to the calibration
lines which were obtained by
intensity measurements of the same
peaks of known mixtures of
synthetic schwertmannite and
goethite. Therefrom the
schwertmannite-goethite ratio in the
natural samples were estimated. The
result for each sample is presented in
FTIR spectroscopic measurements
were used to describe the change in
mineralogy by depth. The spectrum
of each sample was analysed for the
intensity of each two characteristic
peaks of schwertmannite (at 1124 and
at 704 cm-1) and goethite (at 892 and
at 795 cm-1). These intensities were
compared to the calibration lines
which were obtained by intensity
measurements of the same peaks of
known mixtures of synthetic
schwertmannite and goethite.
Therefrom the schwertmannite-
goethite ratio in the natural samples
were estimated. The result for each
sample is presented in Fig. III-6.
Fig. III-6 Ratio of schwertmannite to goethite inthe sediment of ML 77 (Tritschler, 1997). Withincreasing depth the schwertmannite-contentdecreases and the amount of goethitesimultainously increases.

III. Formation and Transformation of Schwertmannite in Sediments of Acidic Lignite Mining Lakes
97
3.5. Synthetic Schwertmannite
Both synthesised specimen were, independent on their synthesis method identified as
schwertmannite by analysis of X-ray diffraction and FTIR spectroscopy. The differences
between both precipitates were found mostly with respect to their surface by measurements of
SEM and BET.
3.6. Stability of Schwertmannite in Dependence on Time (362 days)
The long-term stability experiment with synthetic schwertmannite-samples which were each
kept at different constant pH-values, showed that the release of sulfate over time was strongly
depending on the pH. In the suspension of pH 2 equilibrium between the pH and solid
solutions was reached after about 75 days. Compared to the other suspensions, the release of
sulfate was highest (70 % of total or 740 µM sulfate, Fig. III-8 ). The simultaneous high
release of iron (40 % of total iron) indicates a mineral dissolution.
ML 77 1 µm
Sh-H2O2 0.1 µm
Sh 0.1 µm
Fig. III-7 Scanning electron micrographs ofschwertmannite-samples produced by slowformation in dialysis bags (Sh) and by quickformation by oxidation of FeSO4 (Sh-H2O2)compared to a natural sample (ML 77).
The surface area of quickly crystallised
schwertmannite (Sh-H2O2) was much smaller (~
10 m2·g-1) compared to the surface of the long-
time synthesized schwertmannite (Sh, ~ 200 m2·g-
1). Correspondingly the particles which were
formed by quick synthesis are large spheroidal
aggergates with a diameter of ~ 600 nm (Fig. III-
7). The slow synthesis method resulted in
crystalls, grown as long needles which form the
characteristic “hedge-hog“ habit of
schwertmannite. Figure III-7 shows scanning
electron micrographs of these synthesized
particles and of a natural schwertmannite taken
from ML 77. The natural sample had a surface
area of 72 m2·g-1 and its morphology was better
comparable to the long time synthesized
schwertmannite.

III. Formation and Transformation of Schwertmannite in Sediments of Acidic Lignite Mining Lakes
98
In samples with the adjusted pH-values of 3, 4, 5 and 7, respectively the equilibrium was
already reached after about 20 days. Compared to the suspension, kept at pH 2, no iron and
clearly less sulfate was detected in the suspensions. The sulfate concentration was lowest at
pH 4, followed by pH 3, 5 and 7 (Fig. III-8).
In the end of the experiment the crystal- and molecule structures of the filtrated solids were
analysed by XRD and FTIR. Fig. III-9 shows the powder X-ray diffraction pattern of the final
precipitates kept at a pH four and seven. Traces of goethite (marked peaks) were monitored in
all diffractograms. Moreover, it was observed that with increasing pH-value the intensity of
the goethite peaks also increased. Additionally, the broad peaks of schwertmannite are still
present in all samples. FTIR spectra of samples taken during and after the stability experiment
from the suspensions confirm this observation. The intensity of the goethite-characteristic
absorption bands increased with increasing time and pH, in the schwertmannite suspensions
(appendix C).
0
200
400
600
800
2 3 4 5 6 7 8
pH-value
a S
O4
(µM
)
Fig. III-8 Sulfate activity in 5 schwertmannite suspensions after 362 days at constant pH.
2,03970,92710,59990,44340,35170,29140,24870,2170,19240,17290,15690,14360,13240,1229
2,040,930,600,440,350,290,250,220,190,170,160,140,130,12
d-value (nm)
pH 7
pH 4
Fig. III-9 X-ray diffraction patterns of the solids taken from schwertmannite-containing solutions after362 days at constant pH of 4 and 7. Both samples show the peaks of schwertmannite and goethite.
However, the goethite features (arrows) are clearer in the sample from pH 7.

III. Formation and Transformation of Schwertmannite in Sediments of Acidic Lignite Mining Lakes
99
4. DISCUSSION
4.1. Occurrence of schwertmannite in acidic mining lakes (AML)
All examined lakes show a similar hydro-geochemical pattern favourable to the occurrence of
schwertmannite which implies that this mineral is the predominant solid Fe(III)-phase
occurring in these environments. This hypothesis is based on three observations:
(1) A plot of the activity of ferric iron versus pH (Fig. III-2) shows that almost all lake water
samples fall on a straight line which reflects the solubility of schwertmannite and which
indicates equilibrium between these two species. Most of the solutions are oversaturated with
respect to the minerals jarosite and goethite.
(2) The colloidal matter in the investigated lakes which was supposed to be exclusively
autochthone formed, is composed mainly of schwertmannite which suggests schwertmannite
to be the primary oxidation product of iron(II) in the lake water. Neither goethite nor jarosite
could be detected in this fraction.
(3) Schwertmannite appears to occur in almost all sediments studied. It was unequivocally
identified using X-ray diffraction in 6 and more or less clear evidence for its occurrence exists
in 16 of the 18 sediment samples studied (Table III-4). The occurrence of goethite which was
definitively found in four of the upper sediment layers, is probably related to the
transformation of metastable schwertmannite (Bigham, et al., 1996, cf. below). Similarly, also
jarosite which was identified in three of the samples, may be a transformation product. Its
origin can be also allochtonous in that this mineral is eroded into the lakes from the
surrounding dumps, a process assumed to occur in lake 111 (Göttlicher & Gasharova; 2000)
which is one of the lakes considered also in this study.
The observed formation of schwertmannite in acidic mining lakes is in accordance to the
conclusion by Bigham & Nordstrom (2000) that reddish precipitates found in acidic (pH 2.7 –
4) waters influenced by acid mine drainage (AMD) mainly consist of schwertmannite.
There is one principal question arising from these observations: Which processes do control
the composition of the lake waters and are responsible for both, the formation of the
characteristic product schwertmannite, and the remarkably constant pH of 3.2 ± 0.7 in the lake
water?
4.2. Processes regulating the mineralogy of iron in AML
It can be assumed that the formation of iron minerals in the acidic mining lakes is strongly
related to the input of ferrous iron from the adjacent ground and dump pore water and to the
composition of the solution at which oxidation and subsequent precipitation takes place.

III. Formation and Transformation of Schwertmannite in Sediments of Acidic Lignite Mining Lakes
100
Oxidation kinetics of Fe(II): Beside the solubility equilibrium between ferric iron, protons,
and schwertmannite (Fig. III-2) the lake water appears also to be at a redox equilibrium.
Fig. III-3 shows a pε-pH diagram for the redox equilibrium between ferrous iron and the
stable ferric iron minerals jarosite and goethite. The construction of this diagram is based on
the equilibria given in Table III-2. The K+ and SO42- concentrations were set to the mean
value found in the lakes. Into this diagram were plotted the measured pe-and pH-values of the
lake samples. Additionally, Fig. III-3 contains lines which correspond to the redox
equilibrium between Fe2+ and the minerals goethite, jarosite and schwertmannite. For the
metastable schwertmannite this can be expressed by:
8 Fe2+ + y SO42- + (24-2y + x)/ 2 H2O à Fe8O8(OH)x(SO4)y + (24 – 2y)·H+
which writes as:
pH
yFeaSOayK
p
8
2248
)(log8)(log(log 224
*
−−
−−=+−
ε [12]
where K* = (Kredox(Fe2+/Fe3+))8 ⋅ IAPschwertmannite [13]
Kredox(Fe2+/Fe3+) = 10-13
IAPschwertmannite = 1018±2,5 [mol2·L-2] for y = 1.5
Table III-5 shows the equilibrium formula between ferric iron and the other in this study
considered Fe(III) minerals.
Table III-5 Calculation of pε-values of the minerals ferrihydrite (Fh), K-jarosite (Jt) andgoethite (Gt). The formula were created by equating the mineral-dissolution formula (Table III-2)
and the oxidation of Fe2+ (Fe2+ à Fe3+ + e- log K = -13).
mineral equation
Jt pH23))SO(alog2)Fe(alog3)K(alogk(logp 24
2redJt −−−−=ε −++
[14]
Gt pH3)Fe(alogklogp 2redGt −−=ε +
[15]
Fh pH3)Fe(alogklogp 2redFh −−=ε +
[16]
It appears from Fig. III-3 that nearly all lake water samples are located in the equilibrium
window of the redox-couple Fe2+-schwertmannite. This implies that a steady state exists
between these two species and moreover that the rate at which schwertmannite is formed, is
controlled by the oxidation kinetics of Fe2+ being slow at the low pH values of the lakes.

III. Formation and Transformation of Schwertmannite in Sediments of Acidic Lignite Mining Lakes
101
Based on an annual budget of the Fe(II) flux into the sediments of ML 77, an oxidation rate
for Fe(II) of 12.5 mol m-2·a-1 was determined (Peine et al, 2000) which corresponds to an
approximate half-life of Fe(II) of 0.9 years at the lake-water pH of 3. This was confirmed by
Deng (1997) who demonstrated that the oxidation of Fe(II) in a solution which is similar to a
natural aquatic system, is very slowly (a complete oxidation of 0.1 mM Fe2+ takes 8 days) and
that the precipitated products (Fe(III)hydroxides) strongly depend on the solutes in the water.
Additionally, the hypothesis of schwertmannite being a kinetic product of Fe2+ oxidation is
confirmed by the morphology of the schwertmannite particles found in the sediment of ML 77
(Fig. III-7). They show the same “hedgehog” like structure as those obtained from slow (30
days) schwertmannite synthesis (reaction of FeCl3 with Na2SO4) using dialysis bags. In
contrast, rapid (< 24 h) production of schwertmannite by oxidation of FeSO4 using H2O2 as
oxidant results in particles with only little structure (Fig. III-7).
It remains to be examined whether complexation of Fe(II) by sulfate is a further requirement
for the preferential formation of schwertmannite. Due to the higher oxidation rate of FeSO4
compared to that of Fe2+, SO42- would be already bound to the inner shell of Fe3+ during the
oxidation process. Thus, OH- needs to compete with sulfate for coordination sites which
would eventually inhibit further polymerisation of a pure (hydr)oxide phase.
Complexation and coordination chemistry of iron: As suggested by the calculation of the
chemical speciation of dissolved iron in the lake water, sulfate complexes of both, Fe(II) and
Fe(III) make up a significant portion of the total concentration of the two components which
we expect to be the main reason for the occurrence of schwertmannite.
In Fe(III)-containing solutions polynuclears of iron(III) oxides and hydroxides form and their
structure and that of the crystallising mineral essentially depends on the pH-value and the
composition of the solution (Cornell & Schwertmann, 1996; Schneider & Schwyn, 1987). The
presence of chloride in acidic (pH 1-2) solutions leads to the formation of akaganéite (β-
FeOOH, Aktinson, 1977, Music et al., 1981, Schneider, 1984), a mineral that is isostructural
to schwertmannite with chloride incorporated into the structure instead of sulfate (Bigham et
al., 1990). Initially formed polymers of Fe(III) oxide and hydroxide chains already contain
some chloride ions instead of hydroxyl ions as demonstrated by Mössbauer spectroscopy
(Music et al., 1981).
After the formation of oxybridges between these polymers and an incomplete elimination of
chlorides in the course of precipitation, the β-FeOOH structure finally develops. In contrast to
nitrate or chloride solutions, this initial exchange of OH- in the polymers was also

III. Formation and Transformation of Schwertmannite in Sediments of Acidic Lignite Mining Lakes
102
demonstrated for SO42- in sulfate containing solutions (Music et al., 1981). Formation of
schwertmannite was not observed in the mentioned study, probably because some parameters
in the laboratory experiments are completely different to the conditions in the acidic mining
lakes or the solutions used for the synthesis of schwertmannite, such as the solution
temperature of 90 °C and the pH-value which ranged between 1 and 2 in the experiments
performed by Music et al. (1981). The difference in the polymerisation pattern was explained
by an occupation of the first coordination shell of iron(III) by sulfate or chloride which does
not occur with nitrate or perchlorate ions. Accordingly, the formation of FeSO4+ complexes
would suppress further polymerisation of pure Fe-OH species and subsequent crystallisation
as iron(hydr)oxides in favour to sulfate containing precipitates.
Scheider & Schwyn (1987) described a similar model according to which positively charged
polynuclears in Fe(III)-salt solutions undergo specific interaction with the anions chloride or
sulfate. By further steps of alteration which were described as aggregation and coagulation,
chloride was eliminated for charge compensation and finally exclusively bound by
electrostatic effects (outerspheric) at minimum energy position between the chains of Fe(III)-
O-OH octahedra which enclose the chloride ion to form the structural “embryo” of akaganéite
crystals. The favoured polymerisation of sulfate with iron can be explained chemically by the
valence-sum-rule (Brown, 1981) which states that the bonding of tetrahedrally coordinated
anions (sulfate) bound via an oxygen atom to an octahedrally coordinated cation (Fe3+), have
the ideal bond valence (Hawthorne et al. 2000).
To summarise, the iron(III)-sulfate complexes in solutions appear to prevent the formation of
the goethite or hematite structures in a similar way as chloride (Aktinson, 1977). Due to the
similar coordination of ferric iron with chloride and sulfate (Music et al., 1981) one can
assume that the akaganéite (= schwertmannite ) structure will be energetically preferred also
in sulfate solutions.
Metastability of Schwertmannite: The redox equilibrium between Fe(II) and
schwertmannite observed for most lakes (Fig. III-3) implies that this mineral is the kinetic
product of Fe(II) oxidation, being metastable with respect to goethite (Bigham et al., 1996)
and at very low pH to jarosite. It therefore transforms into this mineral in the lake sediments
as observed in ML 77 (Fig. III-6). The depth profile along which the transformation occurs
(upper 10 cm) is characterised by an increase of the pH from ≈ 3 to values between 3.5 and 6
due to the onset of alkalinity generation by sulfate. Fig. 10 plots the transformation rate of
schwertmannite derived from Fig 7 and from sediment dating provided in Peine et al. (2000)
together with the pore-water pH at various sampling periods.

III. Formation and Transformation of Schwertmannite in Sediments of Acidic Lignite Mining Lakes
103
Acceleration of the transformation reaction by an increasing pH was also displayed by the
initial releasing rates of sulfate during the stability experiments (Fig. III-8). The overall
release of sulfate during this transformation is low (11-37 % of total sulfate) and reaches an
equilibrium already after about 15 days for the solutions at pH 3, 4 and 5 and after about 50
days for the solution at pH 7 (diagrams of the temporal release of Fe and sulfate are presented
in appendix I). This indicates that either not all schwertmannite was transformed into goethite
or that sulfate is adsorbed to goethite in high concentrations. X-ray diffractograms (Fig. III-9)
and FTIR spectra (appendix C) demonstrated that the precipitates in all vessels in the pH-
range of 3 to 7, consisted of both minerals in the end of the experiments (after 362 days).
Hence, there is still some schwertmannite left at pH 7 which may be due to some unresolved
passivation effect. However, the initial linear sulfate release clearly indicates a pH
dependency of the transformation rate with a minimum between pH 3 and 5 and increasing
values at higher pH (Fig. III-8). At pH 2 proton promoted dissolution of schwertmannite
seems to be responsible for the release of sulfate as indicated by the high releasing rates of
iron which may open pathway for the formation of jarosite (e.g. ML 111 and ML 117).
Calculations of the saturation index for the waters of these lakes indicated indeed
oversaturation with respect to this mineral.
The transformation rate has a maximum after
3 years with a value of 55 % per year. The
mineral is more or less stable for the first two
years as long as the pH remains constant.
The onset of transformation is accompanied
by an increase of the pH although the
transformation reaction produces acidity
(Bigham et al., 1996).
It appears that the transformation which can
be explained by the combined dissolution of
schwertmannite and subsequent re-
precipitation of Fe3+ as goethite, is
accelarated upon generation of alkalinity by
sulfate reduction.
schwertmannitepH
sed
imen
t ag
e (y
ears
)
Change of the relative schwertmannitecontent (% a-1)
Fig. III-10 Correlation of the change of therelative schwertmannite content with the pH-value in the pore-water and the age of thesediment. Data from Peine et al. (2000).

III. Formation and Transformation of Schwertmannite in Sediments of Acidic Lignite Mining Lakes
104
4.3. The Regulation of the pH in AML
The observed pH range for the acidic mining lakes is in accordance to the survey of Cravotta
et al. (1999) who could distinguish two groups out of 793 study sites influenced by AMD in
the Eastern Coal province of the US, one of which with pH values between 2.5 and 4, the
other with values > 6. A similar classification was derived by Kleeberg (1998) from the study
of 25 mining lakes in the East-German lignite mining area.
So far, the discussion has demonstrated that the geochemical environment of acidic mining
lakes provides suited conditions for the formation of the metastable mineral schwertmannite.
It appears that the pH of the lake waters perfectly matches conditions where neither proton
promoted dissolution of schwertmannite nor re-crystallisation to goethite occurs. This implies
that the pH is directly linked to the mineral formation process. We therefore suggest that the
pH of AML reflects a steady-state between several processes involved into the formation and
consumption of schwertmannite, the mineral being the intermediate product: Preceding to the
mineral formation is a steady supply of iron(II) into the lake with seepage waters from the
adjacent dumps. These pore waters are anaerobic, weakly acidic and highly concentrated in
Fe(II) and sulfate due to pyrite oxidation and subsequent weathering reactions in the dump.
The Landesumweltamt Brandenburg (1995) surveyed such pore waters in tailings of two mine
sites and found pH values between 4.3 and 7.2, rich in sulfate (15 to 25 mM) and iron (0.7 to
17.1 mM, mainly dissolved and in the ferrous form). Oxygen concentration was either not
detectable or at the detection limit. Similar observations were made in sulphide bearing
tailings from the exploitation of a sulphide ore body (Germain et al, 1994). Ferrous iron will
enter a lake probably as a sulfate complex thereby being oxidised to a ferric sulfate complex.
Subsequently precipitation of schwertmannite occurs via the intermediate product discussed
above which is the principle acidifying process:
8 Fe2+ + 2 O2 + 1.7 SO42- + 8.6 H2O → Fe8O8(OH)4.6(SO4)1.7 + 12.6 H+ [17]
Peine et al. (2000) found an acidity production of 20 mol m-2·a-1 based on this reaction for
ML 77. In order to test this hypothesis we performed a scenario according to which a fictive
pore water of the composition (sample “Meuro”, Table III-6) described by the
Landesumweltamt Brandenburg (1995) is oxidised to find the pH at which equilibrium exists
between the oxidised water and one of the three minerals schwertmannite, jarosite and
goethite (Fig. III-11A). Even so schwertmannite had the highest supersaturation of all three
minerals in the beginning of the oxidation, it readily achieved equilibrium with the solution
(Fig. III-11A).

III. Formation and Transformation of Schwertmannite in Sediments of Acidic Lignite Mining Lakes
105
The pH value at which equilibrium establishes mainly depends on the initial Fe(II)
concentration as it was calculated by oxidation of three fictive dump-solutions with different
Fe(II)-concentrations (1-10 mM), as shown in Table III-6. The resulting pH (2.3 to 3.0)
perfectly matches the pH-range observed in the lakes (Fig. III-11B).
Table III-6 Calculation of pH as result of an oxidation of a Fe(II) solution with the modellingprogram PhreeqC. As input (pH and water composition in mM) served the data of the dump water
“Meuro” (Landesumweltamt Brandenburg, 1995) and of three fictive solutions (1, 2, 3).
Further acidification upon transformation to goethite seems to be balanced by alkalinity
generating processes. Peine et al. (2000) observed that the rate of alkalinity formation from
sulfate reduction (2.0 eq m-2·a-1) was in the range of the acidity generation due to
schwertmannite transformation (3.5 eq m-2·a-1) in ML 77 and concluded that these two
pH iron(II) sulfate chloride calcium magnesium sodium/potassium
pH afteroxidation
pH atSI=0
Meuro 6.14 4.6 21.5 2.4 14.8 4.1 1.3 3.51 2.671
6 1 10 - 2 2 1 3.71 3.012
6 5 10 - 2 2 1 3.38 2.533
6 10 10 - 2 2 1 3.24 2.32
0
4
8
12
16
20
24
2,5 2,7 2,9 3,1 3,3 3,5 3,7 pH
Schwertmannit
Jarosit
Goethit
0
4
8
12
16
20
2 2,5 3 3,5 4 4,5 pH
Sh
1 mM
Meuro 4.6 mM
5 mM
10 mM
Fe2+
B
A
A)
Saturation index (SI) ofschwertmannite, goethite andjarosite after oxidation of thedump-water “Meuro” (Landes-umweltamt Brandenburg, 1995;Tab. III-6.).
B)
Saturation index (SI) ofschwertmannite in dependenceon Fe(II)-concentration: thefictive solutions contain 1, 5 and10 mM Fe2+, respectivelycompared to data from thedump-water “Meuro” (Landes-umweltamt Brandenburg, 1995;
Tab. III-6.).
Fig. III-11 Oxidation of Fe(II): Calculations of the SI and pH (PhreeqC).
schwertmannitejarosite
goethite

III. Formation and Transformation of Schwertmannite in Sediments of Acidic Lignite Mining Lakes
106
processes balanced each other. We interpret this observation as a coupling of the both
reactions, with sulfate reduction being rate limiting for the pH increase and thus driving the
transformation reaction.
5. CONCLUSIONS
The oxidation of iron(II) in the presence of sulfate results in the crystallisation of the mineral
schwertmannite. This can be expected due to geochemical calculations and observations in
laboratory experiments (oxidation of FeSO4 with H2O2). Evidence for this formation in the
environment was found by sediment- and colloid-analysis of many acidic mining lakes. The
groundwater entering into these lakes, has previously oxidised pyrite contained in the lake-
surrounding lignite-dumps. This inflow is enriched in Fe(II) and sulfate and after contacting
the oxygen-rich lake-water, the Fe(II) is oxidised to Fe(III) by a simultaneously release of
acid. We hypothesised that schwertmannite forms due to structural and kinetic reasons as
primary phase directly after Fe(II) oxidation. The resulting pH after that reaction corresponds
to the stability window of schwertmannite (pH 2.5 to 4) and varies in this range in dependence
on the Fe2+ concentration. Decreasing pH to a value < 2.5 would result in the dissolution of
schwertmannite which is accompanied by a release of hydroxide, and a subsequent re-increase
of the pH-value.
Compared to other Fe(III)-hydroxides and -hyrdoxysulfates as goethite and jarosite,
respectively which are, according to geochemical calculations, also saturated in most of the
AML waters the saturation index of schwertmannite is highest at the pH-value which adjusts
after the total oxidation of Fe(II). However, schwertmannite is metastable with respect to
these minerals, indicating that transformation occurs in the sediment by time. Formation and
dissolution of schwertmannite effect that this mineral acts as a buffer in the range of its pH-
stability window in postmining lakes. As long as the supply of iron(II) in the lakes and the
subsequent oxidation is ensured, a change of the pH is not to expect.
In a broader sense this study suggests a general scheme which helps to understand the
geochemistry of acid mine drainage systems in terms of a dynamic process.
Due to these observations it can be concluded that in-lake neutralisation of the acidic lakes by
reduction of iron(III) and sulfate and fixing the weakly soluble products as Fe(II) sulphides in
the sediment, as described by Peine et al. (1998) can only be obtained if the inflow of iron is
prevented and further schwertmannite formation is stopped. It therefore should be considered
that the groundwater inflow from the lignite dumps is the crucial factor for each kind of
remediation of acidic mining lakes.

IV. Summary and Conclusions
107
IV. SUMMARY AND CONCLUSIONS
This thesis shows the results of investigations concerning the formation and stability of
schwertmannite as well as the interactions of this mineral with arsenate and chromate. Both,
field investigations with naturally formed schwertmannite and laboratory experiments with
synthetic schwertmannite, proved that this mineral cannot be defined clearly referring to its
chemical and mineral composition. Its difficult classification can be explained by the
characteristic of "weak crystallinity" which is a consequence of reduced crystal growth. This
results in the formation of small sized particles with a high surface area which is responsible
for the high reactivity and solubility of many weak-crystalline iron hydroxides.
Schwertmannite features the crystal structure of akaganéite, is usually associated with
goethite in natural systems and thermodynamically unstable referring to goethite and jarosite.
Thus it represents a link between these minerals belonging to the group of iron(III)
hydroxides and iron(III) hydroxysulfates. The “metastable” characteristic of schwertmannite
which causes it to dissolve or to transform into more stable minerals by time (depending on
the chemical environment) is the reason for its complicated verifiability in older precipitates
(e.g. sediments with an age of some years).
However, results of this study have demonstrated that schwertmannite is the primary mineral
phase which forms by the oxidation of iron(II) in sulfate containing solutions. This was
proven by geochemical calculations and theoretical interpretations of the crystal structure and
confirmed by analyses of natural samples from sediments of acid lignite mining lakes. In
these acidic lakes the optimal conditions for schwertmannite formation exist. A steady supply
of Fe(II)- and sulfate-rich seepage water from pyrite containing excavation dumps of lignite
mining into the lake causes the crystallisation of schwertmannite. The associated hydrolysis of
iron results in the decrease of pH in the surface water to ~ 3. An increased acidification (pH<
2.5) will dissolve the schwertmannite and result in the release of OH ions. Thus the water is
buffered within the pH-stability range of schwertmannite (2.5 to 4.5). The permanent
formation and/or dissolution of schwertmannite prevents both, the increased acidification and
the (desired) neutralisation of surface waters in the lakes. Analyses of the top centimetres of a
multitude of different lake sediments showed that schwertmannite is the mineral which forms
in most of the lakes investigated in this study. Furthermore it was observed that with
increasing sediment depth schwertmannite transforms to goethite. This “ageing” process of
the sediment can be accelerated by rising pH values which are a consequence of bacterially
induced sulfate reduction in the lakes. A permanent fixation of iron and sulphur can only be

IV. Summary and Conclusions
108
reached by the reduction of iron(III) and sulfate in the deeper and oxygen-free sediment as
assumed by Peine et al. (2000). However, a long-term neutralisation of surface water only
seems possible if the supply of Fe(II)- and sulfate-rich groundwater from dumps will be
prevented.
Apart from trying to comprehend the significance of schwertmannite and corresponding
processes in acidic mining lakes, its characteristic to act as a sink for arsenate and chromate
was examined in this study. Results obtained with synthetic schwertmannite showed that it
cannot only store sulfate, but also chromate as a structural component into its crystal lattice.
Both oxyanions can completely substitute themselves and the chromate content can amount
up to 15 wt.- %. Similarly, arsenate can be enriched in high concentrations in schwertmannite
(up to 10 wt.-%). However, arsenate incorporation into schwertmannite was only possible in
combination with sulfate or chromate. Due to the mechanism of both, coprecipitation with-
and adsorption onto schwertmannite, arsenate and chromate could be ex-filtrated from
contaminated waters. Additionally to these ions, many other toxic compounds can probably
be enriched in schwertmannite. This was shown by Webster at al. (1998) for heavy metals as
well as in this study for arsenite (AsO33-). However, only few experiments with As(III) were
realised and further research in this section is required. Anyway, schwertmannite has great
importance as a sink for poisonous materials. Therefore, a purposeful use as "cleaning agent"
in contaminated water would be very useful. Future investigations should focus on the
production of schwertmannite and its optimal dosage in drinking water processing plants.
Schwertmannite represents not only a sink, but also a potential source for previously enriched
toxic compounds. As already explained, schwertmannite transforms or dissolves by time or
due to changes of the chemical environment. This could possibly result in an additional
release of toxic materials. The long-term investigation of arsenate- and chromate-containing
schwertmannite showed that during schwertmannite dissolution the release of chromate is
obviously higher than that of arsenate. The incorporation of arsenate even resulted in an
increased mineral stability referring to dissolution caused by decreasing pH-values or
microbiological iron(III) reduction. Further investigations on interactions between
schwertmannite and micro-organisms which reduce not only Fe(III) but also sulfate, arsenate
or chromate in schwertmannite, also seem to be of interest for a better understanding of the
mobilisation processes of toxins.
Research on the extent of environmental risks by different contaminants which could be
bound with different intensity to schwertmannite and potentially be released, seems
recommendable.

References
109
V. REFERENCES
Aktinson R. J. (1977) Crystal nucleation and growth in hydrolysing iron(III)chloridesolutions. Clays and Clay Minerals 25, 49-56.
Asche H., Bork, H.-R., Heller, W. (1999) Entwicklung und Gestaltung von Erholungsgebietenin Bergbaufolgelandschaften der Niederlausitz. In Potsdamer GeographischeForschungen, Institut für Geographie und Geoökologie der Universität Potsdam. Vol.17, 137 p.
Barham J. R. (1997) Schwertmannite: A unique mineral contains a replaceable ligand,transforms to jarosites, hematites and/ or basic iron sulfate. J. Mater. Res. 12, 2751-2758.
Baron D., Palmer C. D. (1995) Solubility of jarosite KFe(SO4)2(OH)6 at 4 - 35 °C. Geochim.Cosmochim. Acta 60, 185-195.
Baron D., Palmer C. D. (1996) Solubility of KFe(CrO4)2(OH)6 at 4 to 35 °C Geochim.Cosmochim. Acta 60, 3815-3824.
Berlepsch P., Armbruster Th, Brugger J., Bykover, E.Y., Kartashov P.M. (1999) The crystalstructure of vergasovaite Cu3O[(Mo,S)O4SO4] and its relation to syntheticCu3O[MoO4]2. Eur. J. Mineral 11, 101-110.
Biber M. V., dos Santos Afonso M., Stumm W. (1994) The Coordination Chemistry ofWeathering IV. Inhibition of the Dissolution of Oxide Minerals. Geochim.Cosmochim. Acta 58, 1999-2010.
Bigham J. M., Schwertmann U., Carlson L., Murad E. (1990) A poorly crystallizedoxyhydoxysulfate of iron formed by bacterial oxidation of Fe(II) in acid mine waters.Geochim. Cosmochim. Acta 54, 2743-2758.
Bigham J. M., Schwertmann U., Carlson L. (1992) Mineralogy of precipitates formed by thebiogeochemical oxidation of Fe(II) in mine drainage. Catena Supplement 21, 219-232.
Bigham J. M., Carlson L., Murad E. (1994) Schwertmannite a new iron oxyhydroxysulfatefrom Pyhäsalmi, Finland, and other localities. Mineral. Mag., 58 (393), 641-648.
Bigham J. M., Schwertmann U., Traina S. J., Winland R. L., Wolf M. (1996) Schwertmanniteand the chemical modelling of iron in acid sulfate waters. Geochim. Cosmochim. Acta60, 2111-2121.
Bigham J. M., Nordstrom D.K. (2000) Iron and aluminium hydroxysulfates from acid sulfatewaters. In: Alpers C. N., Jambor J.L., Nordstrom D.K. Reviews in Mineralogy andGeochemistry, Mineralogical Society of America, 351-403.
Bishop J. L. (1996) Schwertmannite on Mars? Spectroscopic analysis of schwertmannite, itsrelationship to other ferric minerals and its possible presence in the surface material onmars. In: Dyar M.D., McCammon C., Schaefer M.W. (eds.) Mineral Spectroscopy: ATribute to Roger G Burns Geochemical Society Spec. Publ. No 5, 337-358.
Bloesch J., Burns N.M. (1980) A critical review of sedimentation trap technique. Schweiz. Z.Hydrol. 42, 15-55.
Brand A. (2001) Vorkommen, Bildung und Bedeutung von Schwertmannit in Sedimenten vonRestseen des Braunkohletagebaus. Unveröff. Diplomarbeit, Universität Bayreuth,Bayreuth.
Bridge T.M., Johnson D.B. (2000) Reductive dissolution of ferric iron minerals byAcidiphilium SJH, Geomicrob. J. 17, 193-206.
Brown I. D. (1981) The bond-valence method: an empirical approach to chemical structureand bonding. In Structure and bonding in crystals 29 (eds. M. O'Keeffe, NavrotskyA.), Acta Crystallogr.A., 266-282.
Brunauer S., Emmett P.H., Teller E. (1938) Adsorption of gases in multimolecular layers. J.Am. Chem. Soc. 60, 309-319.

References
110
Carlson L., Schwertmann U. (1981) Natural ferrihydrites in surface deposits from Finland andtheir association with silica. Geochim. Cosmochim. Acta 45, 421-429.
Carlson L., Bigham J.M. (2001) Retention of arsenic by precipitates from acid mine drainage.Environ. Sci. Technol. (submitted to est).
Chatterjee A., Das D. et al., (1995) Arsenic in groundwater in six districts of West Bengal,India: The biggest arsenic calamity in the world, Part 1. Arsenic species in drinkingwater and urine of the affected people. Analyst 120, 643-656.
Chowdhury, U. K., Biswas, B.K., et al. (2000) Groundwater arsenic contamination inBangladesh and West Bengal, India. Environmental Health Perspectives 108 (5), 393-397.
Cornell R. M. and Schwertmann U. (1996) The Iron Oxides. VCH Verlagsgesellschaft mbH,Weilheim, VCH Publishers, New York, 570 p.
Cravotta C. A. I., Brady K.B.C., Rose A.W., Douds J.B. (1999) Frequency distribution of thepH of coal-mine drainage in Pennsylvania DW. In: Morganwalp D.W. (ed.) U.S.Geological Survey Toxic substances Hydrology Program-Proc. Technical Meeting.US Geol. Surv. Water-Res. Invest Rep, 99- 4018A, 313-324.
Cullen W. R., Reimer K.J. (1989) Arsenic Speciation in the Environment. Chem. Rev. 89 No.4, 713-764.
Deng Y. (1997) Formation of iron(III)-hydroxides from homogenous solutions. Wat. Res. 31(6), 1347-1354.
Duesler E.N., Foord E.E. (1986) Crystal structure of hashemite, BaCrO4, a barite structuretype. Am. Mineral. 71, 2117-1220.
Dzombak D.A. and Morel F.M.M. (1990) Surface complexation modeling - hydrous ferricoxide. Wiley-Interscience, New York, 393 p.
Eick M.J., Peak J.D., Brady W.D. (1999) The effect of Oxyanions on the oxalate-promoteddissolution of goethite. Soil Sci. Soc. Am. J. 63, 1133-1141.
Evangelou V.P., Zhang Y.L. (1995) A review: pyrite oxidation mechanisms and acid minedrainage prevention. Crit. Rev. Environ. Sci. Technol., 25 (2), 141-199.
Farmer V. C. (1974) The infrared spectra of minerals. Min. Soc., London, 539 p.Fendorf S., Eick M.J., Grossl P., Sparks D.L. (1997) Arsenate and Chromate retention
mechanisms on goethite. 1. Surface structure. Environ. Sci. Technol. 31(2), 315-320.Fitzpatrick R.W., Self P.G. (1997) Iron oxyhydroxides, sulfides and oxyhydroxysulfates as
indicators of acid sulfate weathering environments. Advances in GeoEcology 30, 227-240.
Fortin D., Davis B., Beveridge T.J. (1996) Role of Thiobacillus and sulfate-reducing bacteriaon Fe biocycling in oxic and acidic mine tailings. FEMS Microbiol. Ecol., 21, 11-24.
Fuller C., Davis J.A., Waychunas G. A. (1992) Surface chemistry of ferrihydrite: Part 2.Kinetics of arsenate adsorption and coprecipitation. Geochim. Cosmochim. Acta 57,2271-2282.
Gao Y., Mucci A. (2001) Acid base reactions, phosphate and arsenate complexation, and theircompetitive adsorption at the surface of goethite in 0.7 M NaCl solution. Geochim.Cosmochim. Acta 65 (14), 2361-2378.
Glockner E. F. (1853) Über einen neuen Eisensinter von Obergrund bei Zuckmantel.Poggendorfs. Ann. Phys. Chem. 89, 482-488.
Gmelin H. d. A. C. (1954) Molybdat. In: Handbuch der Aanorganischen Chemie, 8. Auflage,Springer, Berlin.
Goldberg S., Glaubig R.A. (1988) Anion Sorption on a calcareous, montmorillonitic soil-arsenic. Soil Sci. Soc. Am. J. 52, 1297-1300.
Goldschmidt V.M. (1937) The principles of distribution of chemical elements in minerals androcks. J. Chem. Soc. 665-673.

References
111
Göttlicher J., Gasharova B. (2000) Interactions of iron and sulfur bearing solid phases withwater in surface coal mining pits and acidic mining lakes. In: Rammlmayr et al. (ed.)Applied Mineralogy, Balkema, Rotterdam, 1048 p.
Gottwald W., Wachter, G. (1997) IR-Spektroskopie für Anwender. Wiley-VCH, Weinheim,294 p.
Günzler H., Heise, H.M. (1996) IR-Spektroskopie, Wiley-VCH-Weinheim, 397 p.Harrison J.B., Berkheiser. V.E. (1982) Anion interactions with freshly prepared hydrous iron
oxides. Clays and Clay Minerals 30 (2), 97-102.Hawthorne F.C., Krivovichev S.V., Burns P.C. (2000) The crystal chemistry of sulfate
minerals. In Sulfate Minerals, Vol. 40 (ed. C. N. Alpers, Jambor J.L., NordstromD.K.), The Mineralogical Society of America, 608. p.
Hayes K.F., Papelis C., Leckie J.O. (1988) Modeling ionic strength: Effects on anionadsorption at hydrous oxide/solution interfaces. J. Colloid Interface Sci. 78, 717-726.
Henningsen D., Katzung G. (1998) Einführung in die Geologie Deutschlands. Enke, Stuttgart,224 p.
Herzsprung P., Friese K., Packroff G., Schimmele M., Wendt-Potthoff K., Winkler M. (1998)Vertical and annual distribution of ferric and ferrous iron in acidic mining lakes. ActaHydrochim. Hydrobiol. 26, 253-262.
Hollandliste (1988) Beurteilung von Konzentrationen verschiedener Stoffe im Boden undGrundwasser. Aus: Hollandliste Interventiewaarden bodemsanering Staatscourant Nr.9524.05.1994.
Holleman A.F., Wiberg E. (1985) Lehrbuch der Anorganischen Chemie, Walter de Gruyter,Berlin, New York, 1451 p.
Hsia T.H., Lo S.L., Lin C.F., Lee D.Y. (1993) Chemical and spectroscopic evidence forspecific adsorption of chromate on hydrous iron oxide. Chemosphere 26, 1897-1904.
Johnson D.B., McGinness S. (1991) Fe(III) reduction by acidophilic heterotrophic bacteria,Appl. Environ. Microbiol. 57, 207-211.
Kato T. (1977) Further refinement of woodhouseite structure. N. Jahrb. Mineral. Monatsh.,54-58.
Kato T. Miura Y. (1977) The crystal structure of jarosite and svanbergite. Mineral. J. (Japan)8 419-430.
Kleeberg A. (1998) The quantification of sulfate reduction in sulfate-rich freshwater lakes-ameans for predicting the eutrophication process of acidic mining lakes? Water Air andSoil Pollution 108, 365-374.
Konnerts J.A., Evans H.T.Jr., McGee J.J., Erickson G.E. (1994) Mineralogical studies ofnitrate deposits of Chile: VII. Two new saline minerals with the compositionK6(Na,K)4Na6Mg10(XO4)12(IO3)12*12H2O: fuenzaldaite (X=S) and carlosruizite(X=Se). Am. Mineral 79, 1003-1008.
Küsel, K., Drake H.L. (1995) Effects of environmental parameters on the formation andturnover of acetate by forest soils. Appl. Environ. Microbiol. 61, 3667-3675.
Küsel K., Dorsch T., Acker G., Stackebrandt E. (1999) Microbial reduction of Fe(III) inacidic sediments: Isolation of Acidiphilium cryptum JF-5 capable of coupling thereduction of Fe(III) to the oxidation of glucose, Appl. Environ. Microbiol. 65, 3633-3640.
Küsel K., Dorsch T. (2000) Effect of supplemental electron donors on the microbial reductionof Fe(III) and sulfate in coal mining-impacted freshwater lake sediments, Microb.Ecol. 40, 238-249.
Küsel K., Roth U., Dorsch T., Peiffer S. (2001) Effect of pH on the anaerobic microbialcycling of sulfur in freshwater mining-impacted lake sediments, in Ernst, W.H.O.,Pezeshki, S.R. and Chabbi, A. (eds.), Plants and organisms in wetland environments,Environ. Exper. Bot. 46, 213-224.

References
112
Landesumweltamt Brandenburg (1995) Wasserbeschaffenheit in Tagebaurestseen. In Studienund Tagungsberichte, Vol. 6, Potsdam, 86. p.
Lovley D.R. (1993) Dissimilatory metal reduction, Annu. Rev. Microbiol. 47, 263-290.Lovley D.R. and Phillips E.J.P. (1986) Availability of Fe(III) for microbial reduction in
bottom sediments of the freshwater tidal Potomac River. Appl. Environ. Microbiol. 52,751-757.
Lu F. J. (1990) Review of fluorescent humic substances and blackfoot disease in Taiwan.Applied Organometallic Chemistry 4, 191-195.
Lumsdon D.G., Fraser A.R., Russell J.D., Livesey N.T. (1984) New infrared bandassignments for the arsenate ion adsorbed on synthetic goethite. J.Soil Sci. 35, 381-386.
Lumsdon D.G., Evans L.J. (1994) Surface complexation model parameters for goethite(alpha-FeOOH). Journal of Colloid and Interface Science 164, 119-125.
Lyklema J. (1987) Electrical double layers on oxides; disparate observations and unifyingprinciples. Chemistry and Industry, 741-747.
Maly K. (1999) Jihlava ore region - geology and mineralogy. In Ekon (ed.) Silver-mining andcoinage of Jihlava (Iglau), Muzeum Vysociny, 110 p.
Mason B., Moore C. (1985) Grundzüge der Geochemie. Enke, Stuttgart, 340 p.Matthes S. (1996) Mineralogie. VCH Springer, Berlin, 499 p.McLean J., Beveridge T.J. (2001) Chromate reduction by a pseudomonad isolated from a site
contaminated with chromated copper arsenate. Appl. Environ. Microbiol. 67, 1076-84.Mesuere K., Fish W. (1992) Chromate and oxalate adsorption on goethite. 1. Calibration of
surface complexation models. Environ. Sci.Technol. 26(12), 2357-2370.Munch J.C., Ottow J.C.G. (1980) Preferential reduction of amorphous to crystalline iron
oxides by bacterial activity, Soil Science 129, 15-21.Murad E. (1979) Mössbauer and X-ray data on FeOOH (akaganéite). Clay Min. 14, 273-283.Music S., Vertes A., Simmons G.W., Dzako-Nagy I., Leidheiser, H.Jr. (1981) Mössbauer
spectroscopic study of the formation of Fe(III) oxyhydroxides and oxides byhydrolysis of aqueous Fe(III) salt solutions. Journal of Colloid and Interface Science85 (1), 256-265.
Myneni S.C.B., Traina S.J., Waychunas G.A., Logan T.J. (1998) Vibrational spectroscopy offunctional group chemistry and arsenate coordination in ettringite. Geochim.Cosmochim. Acta 62 (21/22), 3499-3514.
Nakamoto K. (1986) Infrared and raman spectra of inorganic and coordination compounds(3ed.).Wiley, New York.
Nieboer E., Jusys A.A. (1988) Chromium in the natural and human environments. J.O.Nriagu, Nieboer E. (eds.), John Wiley, New York, pp.21-80.
Nordstrom D.K. (1982) Aqueous pyrite oxidation and the consequent formation of secondaryiron minerals. In Kittrick J.A. et al. (eds.) Acid sulfate weathering. Soil Sci. Soc. Am.,37-56.
Nordstrom D.K., Alpers C.N. (1998) Geochemistry of acid mine waters. In Plumlee G.S.,Logsdon M.J. (ed.) The environmental geochemistry of mineral deposits. Reviews inEconomic geology. Society of ecologic geologists.
Nordstrom D.K., Munoz J.L. (1994) Geochemical Thermodynamics, 2nd edition. BlackwellScience, Boston.
Nordstrom D.K., Plummer L.N., Langmuir D., Busenberg E., May H.M., Jones B.E.,Parkhurst D.L. (1990) Revised chemical equilibrium data for major water-mineralreactions and their limitations. ACS Symp. Ser. 416, 398-413.
Nowel W., Bönisch R., Schneider W., Schulze H. (1995) Geologie des LausitzerBraunkohlereviers. 2 ed. Lausitzer Braunkohle Aktiengesellschaft, Senftenberg, 104 p.
References
113
Parfitt R.L., Russell J.D. (1977) Adsorption on hydrous oxides IV. Mechanism of adsorptionof various ions on goethite. J. Soil Sci. 28, 297-305.
Parfitt R.L., Smart R.St.C. (1978) The mechanism of sulfate adsorption on iron oxides. SoilSci. Soc. Am. J. 42, 48-50.
Parkhurst D.L. (1997) Geochemical mole-balance modelling with uncertain data. WaterResources Research 33(8), 1957-1970.
Peak D., Ford R.G., Sparks D.L. (1999) An in situ ATR-FTIR investigation of sulfatebonding mechansms on goethite. J.Colloid Sci., 218(1), 289-299.
Peine A. (1998a) Saure Restseen des Braunkohletagebaus - Charakterisierung undQuantifizierung biogeochemischer Prozesse und Abschätzung ihrer Bedeutung für dieseeinterne Neutralisierung. Dissertation, Bayreuther Institut für TerrestrischeÖkosystemforschung (Hrsg.) 62, 131p.
Peine A., Peiffer S. (1998b) In-Lake Neutralization of acid mine lakes. In W. K. Geller, H. W.Salmons (ed.) Acidic Mining Lakes, Springer, Berlin.
Peine A., Trischler A., Küsel K., Peiffer S. (2000) Electron flow in an iron-rich acidicsediment - evidence for an acidity-driven iron cycle. Limnology and Oceanography45(5), 1077-1087.
Penners N.H.G., Koopal L.K. (1986) Preparation and optical properties of homodispersehaematite hydrosols. Colloids and Surfaces 19, 337-349.
Pichler T., Veizer J., Gwendy E., Hall M. (1999) Natural input of arsenic into a coral-reefecosystem by hydrothermal fluids and its removal by Fe(III) Oxyhydroxides. Environ.Sci.Technol. 33, 1373-1378.
Regenspurg S., Peiffer S. (2000) The mineral schwertmannite in sediments of acid ligniteopencast lakes. In: Rammlmayr et al. (ed.) Applied Mineralogy, Balkema, Rotterdam,1048 p.
Rose S., Ghazi A.M. (1997) Release of sorbed sulfate from iron oxyhydroxides precipitatedfrom acid mine drainage associated with coal mining. Environ. Sci.Technol. 31, 2136-2140.
Rüde T.R., Barth A., Pietsch R., Regenspurg S., Surwald F. (1999) Chemistry of the acidicwaters of the Rötlbach, Zillertaler Alps, and the precipitation of iron oxides. In:Rammlmayr et al. (ed.) Applied Mineralogy, Balkema, Rotterdam, 1048 p.
Rüger F.R., Witzke T., Grunewald W., Langhammer D., Senf L. (1994) Die SaalfelderFeengrotten- eine mineralogische Kostbarkeit Deutschlands. Feuerpfeilverlag, 56 p.
Russel J.D., Fraser A.R. (1994) Infrared methods. In: Chapman M., Wilson H.J. (eds.) ClayMineralogy: Spectroscopic and chemical determinative methods.
Sachs L. (1992) Angewandte Statistik. Springer, Berlin.Savage K.S., Tingle T.N., O'Day P.A., Waychunas G.A., Bird D.K. (1999) Arsenic speciation
in pyrite and secondary weathering phases, Mother Lode Gold District, TuolumneCounty, California. Applied Geochemistry 15, 1219-1244.
Scheffer P., Schachtschabel P., Blume H.-P., Brümmer G., Hartge K.H., Schwertmann U.,Auerswald K., Beyer L., Fischer W.R., Kögel-Knaber I., Renger M. and Strebel O.(1998) Lehrbuch der Bodenkunde (14. edition). F. Enke Verlag, Stuttgart, 494 p.
Schneider W. (1984) Hydrolysis of iron(III)-chaotic olation versus nucleation. CommentsInorg.Chem. 3, 205-223.
Schneider W., Schwyn B. (1987) The hydrolysis of iron in synthetic, biological and aquaticmedia. In: Stumm W. (ed.) Aquatic surface chemistry. Wiley Interscience, New York,167-194.
Schwertmann U., Bigham J. M., Murad E. (1995) The first occurrence of schwertmannite in anatural stream environment. Eur. J. Mineral. 7, 547-552.
Schwertmann U., Cambier P., Murad E. (1985) Properties of goethite of varying crystallinity.Clays and Clay Minerals 33(5), 369-378.

References
114
Schwertmann U. (1991) Solubility and dissolution of iron oxides, Plant and Soil 130, 1-25.
Schwertmann U., Fitzpatrick R.W. (1992) Iron minerals in surface environment. CatenaSupplement 21, 7-30.
Sigg L., Stumm W. (1981) The interaction of anions and weak acids with the hydrous goethite(a-FeOOH) surface. Colloids and Surfaces 2, 101-117.
Smith D.K., Roberts A.C., Bayliss P., Liebau F. (1998) A systematic approach to general andstructure type formulas for minerals and other inorganic phases. Am. Mineral 83, 126-132.
Stumm W. (1992) Chemistry of the solid-water interface. Wiley, New York, 428 p.Stumm W., Morgan, J. (1996) Aquatic Chemistry. Wiley, New York, 1022 p.Stumm W., Furrer G., Wieland E., Zinder B. (1985) The effects of complex-forming ligands
on the dissolution of oxides and aluminiumsilicates. In: Drever, J.I. (ed.) Thechemistry of weathering, Dodrecht, R.,D., The Netherlands, 55-74
Sun X., Doner H.E. (1996) An investigation of arsenate and arsenite bonding structures ongoethite by FTIR. Soil Science 161(12), 865-872.
Szymanski J.T. (1988) The crystal structure of beudantite, Pb(Fe, Al)3((As,S)O4)2(OH)6. Can.Mineral 26, 923-932.
Tamura H., Goto K., Yotsuyanagi T., Nagayam, M. (1974) Spectrophotometric determinationof iron(II) with 1,10-Phenantroline in the presence of large amounts of iron (III).Talanta 21, 314-318.
Tipping E., Cooke D. (1982) The effects of adsorbed humic substances on the surface chargeof goethite in freshwaters. Geochim. Cosmochim. Acta 46, 75-80.
Torrent J., Barron V., and Schwertmann U. (1990) Phosphate adsorption and desorption bygoethites differing in crystal morphology. Soil Society of America 54, 1007-1012.
Trinkwasserverordnung. (1990) Trinkwasserverordnung vom 5.12.1990. BMFJG, 1036 S.Tritschler A. (1997) Quantifizierung und Charakterisierung von Eisenfestphasen im Sediment
von sauren Restseen des Lausitzer Braunkohletagebaus. unveröff. Diplomarbeit,Universität Bayreuth, Bayreuth.
Urrutia M.M., Roden E.E., Fredrickson J.F. and Zachara J.M. (1998) Microbial and surfacechemistry controls on reduction of synthetic Fe(III) oxide minerals by thedissimilatory iron-reducing bacterium Shewanella alga. Geomicrobiol. 15, 269-291.
Van der Marel H.W., Beutelspacher H. (1976) Atlas of infrared Spectroscopy of ClayMinerals and their Admixtures. Elsevier Scientific Publishing Company, Amsterdam.
Walenta K., Zweiner M., Dunn P.J. (1982) Philipsbornite, a new mineral of the cranallitegroup from Dundas, Tasmania. N. Jahrb. Mineral. Monatsheft 1-5.
Waychunas G.A., Rea B.A., Fuller C.C., Davis J.A. (1992) Surface chemistry of ferrihydrite:Part 1. EXAFS studies on geometry of coprecipitated and adsorbed arsenate. Geochim.Cosmochim. Acta 57, 2251-2269.
Waychunas G.A., Myneni S.C.B., Traina S.J., Bigham J.M., Fuller C.F., Davis, J.A. (2000)Reanalysis of the schwertmannite structure and the incorporation of SO4-Groups: AnIR, XAS, WAXS and simulation study. Conference-abstract: eleventh annual V.M.Goldschmidt Conference (2001).
Webster J.G., Swedlund P.J., Webster K.S. (1998) Trace metal adsorption onto acid minedrainage iron oxide. In Hulston A. (ed.) Water-Rock interactions, Balkema,Rotterdam, 951-954.
Wilkinson G., Gillard R.D., McCleverty J.A. (eds.) (1987) Comprehensive coordinationChemistry. Pergamon Print, Oxford.
WHO (2000) Environmental Health Criteria, Chromium. World Health Organisation, Genf.Yu J.-Y., Heo B., Choi I.-K., Cho J.-P, Chang H.-W. (1999) Apparent solubilities of
schwertmannite and ferrihydrite in natural stream water polluted by mine drainage.Geochim. Cosmochim. Acta 63, 3407-3416.

Acknowledgements
115
ACKNOWLEDGEMENTS
First, I want to say my sincere thanks to Prof. Dr. S. Peiffer, who transferred me this researchproject and enriched it by numerous ideas.
I acknowledge Prof. Dr. R. Herrmann for the chance to perform this research at his institute.
A special thanks is due to Andreas Brand, for the good cooperation, fruitful discussions andfor the valuable data, which I obtained of his diploma thesis. Many thanks are also to AndreaTritschler, whose diploma thesis was the basis for a big part of this work.
A very big thank you to Dr. K. Kuesel, for the idea of a combined geochemical-microbiological project and the good cooperation.
I gratefully acknowledge Dr. K. Maly (museum Vysconcyny, Jihlava, Cz) and B. Lochner(Saalfelder Feengrotten, Thuringia), who guided me through the ore mines "Prybyslav" andthe "Saalfelder Feengrotten", respectively and submitted the sampling at these unique places.
To Daniela Arneth and the laboratory personnel of the Limnological Research Station I amgreatly indebted for much help at numerous analytic work. Many thanks for analytic worksalso to Christopher Morys, Ulli Drescher and Jochen Schmitt.
With best thanks also to Prof. Dr. H. Stanjek, for the measurement and determination of theunit cell parameters of one of my samples by X-ray diffraction.
I acknowledge Clarissa Drummer, Dr. H. Keppler (BGI) and Dr. F. Heidenau (IMA) forthe support in measurements of the REM, FTIR and BET. Many thanks also to Dr. G. Ilgen(BITOEK), for the method development of the arsenite analysis (I regret that I could use itonly to small extent) and to the laboratory pesonnel of the BITOEK (Anita Gössner, YvonneHoffmann and Bettina Popp).
My sincere gratitude also to Prof. Dr. U. Schwertmann, Dr. J. Goettlicher and Prof. Dr.Pentinghaus, for scientific support to my work.
Many thanks for further assistance, fruitful discussions and good spirits to my colleaguesChristian Blodau, Thomas Eckert, Luisa Hopp, André Krug, Silke Marczinek,Charlotte Roehm and Winfrid Schulz Gade.
My sincere thanks is also to Silke van Schwarzenberg, who gave me much linguisticsupport.
I acknowledge the Deutsche Forschungsgemeinschaft (DFG) for financial support over twoyears in the priority program 546 "Geochemical processes with long-term effects inanthropogenically-affected seepage- and groundwater".
”To understand how anything very complex works, or even to know that there is somethingcomplex at work, man needs to see little tiny bits of it at a time.”
ADAMS, D., CARWARDINE, M. (1990): Last Chances to See.
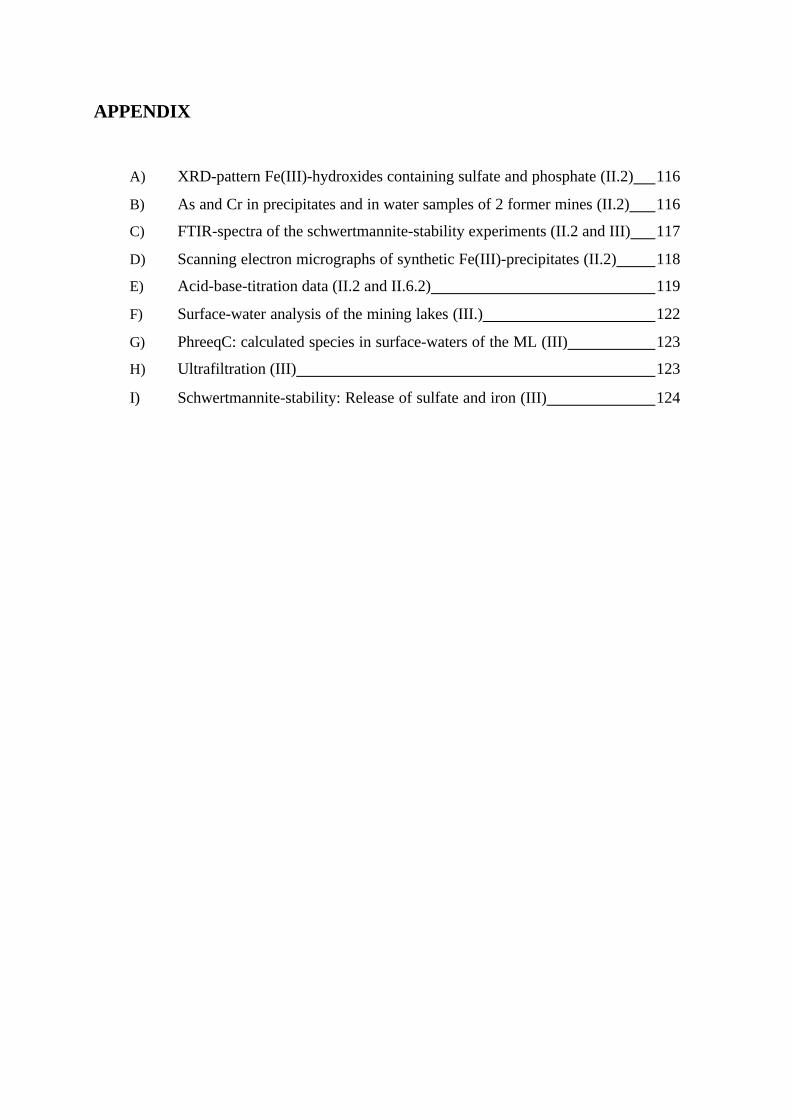
APPENDIX
A) XRD-pattern Fe(III)-hydroxides containing sulfate and phosphate (II.2) 116
B) As and Cr in precipitates and in water samples of 2 former mines (II.2) 116
C) FTIR-spectra of the schwertmannite-stability experiments (II.2 and III) 117
D) Scanning electron micrographs of synthetic Fe(III)-precipitates (II.2) 118
E) Acid-base-titration data (II.2 and II.6.2) 119
F) Surface-water analysis of the mining lakes (III.) 122
G) PhreeqC: calculated species in surface-waters of the ML (III) 123
H) Ultrafiltration (III) 123
I) Schwertmannite-stability: Release of sulfate and iron (III) 124
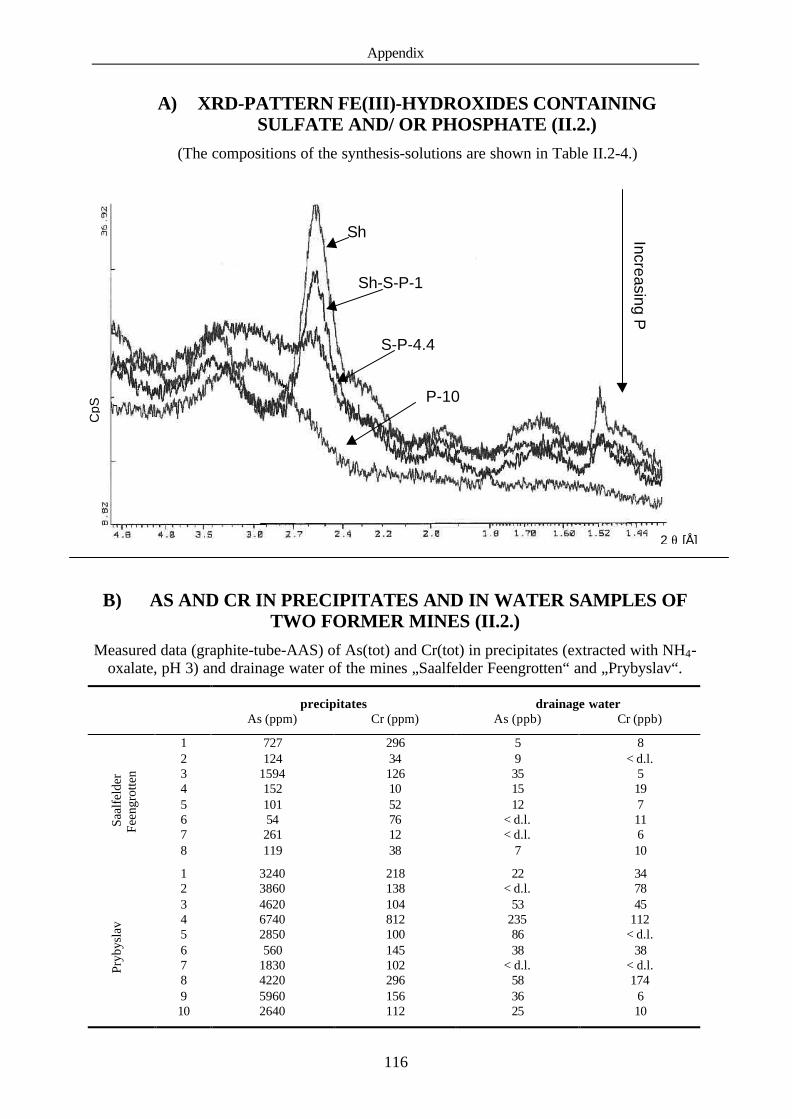
Appendix
116
A) XRD-PATTERN FE(III)-HYDROXIDES CONTAININGSULFATE AND/ OR PHOSPHATE (II.2.)
(The compositions of the synthesis-solutions are shown in Table II.2-4.)
B) AS AND CR IN PRECIPITATES AND IN WATER SAMPLES OFTWO FORMER MINES (II.2.)
Measured data (graphite-tube-AAS) of As(tot) and Cr(tot) in precipitates (extracted with NH4-oxalate, pH 3) and drainage water of the mines „Saalfelder Feengrotten“ and „Prybyslav“.
precipitates drainage waterAs (ppm) Cr (ppm) As (ppb) Cr (ppb)
1 727 296 5 82 124 34 9 < d.l.3 1594 126 35 54 152 10 15 195 101 52 12 76 54 76 < d.l. 117 261 12 < d.l. 6
Saal
feld
erFe
engr
otte
n
8 119 38 7 10
1 3240 218 22 342 3860 138 < d.l. 783 4620 104 53 454 6740 812 235 1125 2850 100 86 < d.l.6 560 145 38 387 1830 102 < d.l. < d.l.8 4220 296 58 1749 5960 156 36 6
Pryb
ysla
v
10 2640 112 25 10
Sh-S-P-1
Sh
P-10
S-P-4.4
CpS
2 θ [Å]
Increasing P

Appendix
117
C) FTIR-SPECTRA OF THE SCHWERTMANNITE-STABILITYEXPERIMENTS (II.2 AND III.)
The IR spectra of schwertmannite (samples Sh-S-P-1, Sh-S-As-1, Sh-S-Cr-1 and Sh-Cr-10)were recorded after suspending the samples over one year constantly at pH 4. They all showcharacteristic schwertmannite-bands (e.g. the FeO bands at 704 and 483 cm-1). No bandsindicating the formation of goethite were detected (see chapter II.2.3. and III.).
IR spectra of schwertmannite samples, which were suspended about one year at constant pHof 2, 3, 4, 5 and 7, respectively. The bands marked with arrows indicate the formation ofgoethite, which was observed in nearly all samples. The intensity of this band decreases withdecreasing pH.
(explanation to the experiments is given in chapter III.3.5. and II.2.3.)
Wavenumber cm - 1
400 600
800 1000
1200
0.0
0.1
0.2
0.3
0.4
Sh-Cr-10-pH 4
Sh-S-P-1-pH 4
Sh-S-As-1-pH 4
Sh-S-Cr-1-pH 4
Abs
orpt
ion
units
wavenumber (cm-1)
wavenumber (cm-1)
Abs
orpt
ion
units
pH 5
pH 4
pH 3pH 2
pH 7

Appendix
118
D) Scanning electron micrographs of synthetic Fe(III)-precipitates (II.2)Influence of the schwertmannite composition on the particle-morphology:
(The chemical compositions of the synthetic samples are presented inTab. II.2-4.)
100 nm Sh-As-Cr
300 nm Sh-H2O2-As
100 nm Sh-Cr-10
100 nm Sh-S-Cr-5
100 nm Sh
200 nm Sh-S-As-1
300 nm S-As-5
100 nm Sh-S-Cr-1

Appendix
119
E) ACID-BASE-TITRATION DATA (II.2 AND II.6.2)Batch-experiment: Measured pH in suspensions of schwertmannite and goethite after 24 and48 h, titrated with HCL or NaOH in 10-3 M and 10-4 M arsenate or chromate solutions and - asreference - without arsenate or chromate addition.
Gt(1), Gt(4), Sh(1), Sh(4): suspensions containing 1 or 4 g/L goethite or schwertmannite, respectively
GoethitepH after 24 h
Concentration of addedacid (HCl) or base(NaOH) in mM
Gt (1)10-3 MCrO4
Gt (1)10-4 MCrO4
Gt (4)10-3 MCrO4
Gt (4)10-4 MCrO4
Gt (1)10-3 MAsO4
Gt (1)10-4 MAsO4
Gt (4)10-3 MAsO4
Gt (4)10-4 MAsO4
Gt(1) Gt(4)
HCl: 0.7 2.60 2.57 5.45 3.96 2.48 2.50 5.59 4.00 2.44 4.49HCl: 0.5 2.92 2.76 6.37 6.04 2.85 2.73 6.57 6.19 2.67 6.45HCl: 0.3 6.07 4.64 7.71 7.80 6.73 5.69 8.63 8.08 4.98 8.20HCl: 0.2 6.76 6.52 8.47 8.51 7.20 6.73 9.02 8.52 6.45 8.66HCl: 0.7 7.45 7.07 8.95 8.51 7.31 6.89 9.00 8.77 6.25 8.700 8.96 8.90 9.40 9.39 9.26 9.10 9.47 9.33 9.19 9.42NaOH: 0.1 9.13 9.23 9.43 9.43 9.36 9.46 9.53 9.38 9.35 9.45NaOH: 0.3 9.63 9.49 9.49 9.53 9.70 9.71 9.63 9.48 9.58 9.57NaOH: 0.3 9.81 9.75 9.59 9.60 9.71 9.92 9.68 9.62 9.82 9.64NaOH: 0.7 10.01 9.93 9.70 9.70 10.10 10.06 9.73 9.65 10.03 9.73
pH after 48 h
Concentration of addedacid (HCl) or base(NaOH) in mM
Gt (1)10-3 MCrO4
Gt (1)10-4 MCrO4
Gt (4)10-3 MCrO4
Gt (4)10-4 MCrO4
Gt (1)10-3 MAsO4
Gt (1)10-4 MAsO4
Gt (4)10-3 MAsO4
Gt (4)10-4 MAsO4
Gt(1) Gt(4)
HCl: 0.7 2.50 2.43 5.73 4.17 2.55 2.47 6.04 4.10 2.50 4.79HCl: 0.5 2.82 2.64 6.70 6.60 2.88 2.70 8.30 6.59 2.68 7.03HCl: 0.3 6.26 4.82 7.90 8.11 7.28 6.08 8.88 8.31 5.23 8.42HCl: 0.2 6.99 6.94 8.58 8.68 7.50 7.09 9.21 8.74 6.88 8.85HCl: 0.7 7.59 7.32 9.01 8.69 7.56 7.28 9.19 8.96 6.67 8.870 8.81 8.71 9.49 9.51 9.33 9.06 9.64 9.52 9.17 9.57NaOH: 0.1 9.00 9.16 9.53 9.55 9.47 9.55 9.73 9.57 9.37 9.60NaOH: 0.3 9.56 9.45 9.61 9.67 9.80 9.82 9.82 9.62 9.59 9.69NaOH: 0.3 9.69 9.68 9.69 9.73 9.97 10.04 9.86 9.82 9.82 9.75NaOH: 0.7 9.80 9.83 9.77 9.83 10.13 10.17 9.90 9.87 10.02 9.84
SchwertmannitepH after 24 h
Concentration of addedacid (HCl) or base(NaOH) in mM
Sh (1)10-3 MCrO4
Sh (1)10-4 MCrO4
Sh (4)10-3 MCrO4
Sh (4)10-4 MCrO4
Sh (1)10-3 MAsO4
Sh (1)10-4 MAsO4
Sh (4)10-3 MAsO4
Sh (4)10-4 MAsO4
Sh(1) Sh(4)
HCl: 0.7 2.36 2.32 2.45 2.41 2.32 2.30 2.42 2.37 2.30 2.42HCl: 0.5 2.51 2.44 2.58 2.51 2.47 2.46 2.54 2.53 2.44 2.52HCl: 0.3 2.76 2.65 2.80 2.80 2.75 2.64 2.79 2.79 2.64 2.68HCl: 0.2 2.99 2.81 2.99 3.05 2.98 2.81 2.99 2.98 2.79 2.82HCl: 0.7 3.47 3.08 3.31 3.31 3.49 3.08 3.32 2.78 3.05 3.030 5.54 3.84 3.93 3.92 5.59 3.84 3.90 3.02 3.73 3.46NaOH: 0.1 5.90 4.01 4.01 4.07 5.86 4.02 3.99 3.03 3.88 3.52NaOH: 0.3 6.20 4.44 4.17 4.35 6.43 4.44 4.15 3.11 4.26 3.65NaOH: 0.3 6.53 4.93 4.14 3.69 7.01 4.91 4.18 3.69 4.71 3.79NaOH: 0.7 6.87 5.41 4.36 3.92 7.51 5.42 4.55 3.94 5.25 3.87
pH after 48 h
Concentration of addedacid (HCl) or base(NaOH) in mM
Sh (1)10-3 MCrO4
Sh (1)10-4 MCrO4
Sh (4)10-3 MCrO4
Sh (4)10-4 MCrO4
Sh (1)10-3 MAsO4
Sh (1)10-4 MAsO4
Sh (4)10-3 MAsO4
Sh (4)10-4 MAsO4
Sh(1) Sh(4)
HCl: 0.7 2.37 2.32 2.44 2.38 2.27 2.29 2.42 2.35 2.31 2.35HCl: 0.5 2.52 2.44 2.55 2.49 2.43 2.42 2.55 2.52 2.44 2.46HCl: 0.3 2.76 2.64 2.78 2.78 2.81 2.63 2.79 2.78 2.63 2.64HCl: 0.2 2.99 2.80 2.97 3.04 2.96 2.80 2.99 2.97 2.78 2.79HCl: 0.7 3.47 3.06 3.30 3.29 3.48 3.06 3.31 2.74 3.03 3.010 5.46 3.83 3.88 3.87 5.48 3.81 3.88 2.98 3.71 3.43NaOH: 0.1 5.79 4.00 3.97 4.00 5.78 3.99 3.97 2.99 3.84 3.49NaOH: 0.3 6.12 4.41 4.13 4.28 6.32 4.40 4.11 3.07 4.23 3.62NaOH: 0.3 6.42 4.89 4.11 3.63 6.86 4.85 4.14 3.65 4.69 3.75NaOH: 0.7 6.74 5.34 4.32 3.87 7.23 5.32 4.49 3.89 5.17 3.89

Appendix
120
Measured oxyanion concentration in suspensions of schwertmannite and goethite (each 1 or 4g·L-1) after 24 h in solutions of 10-3 M or 10-4 M or 5·10-3 M arsenate or chromate.
Schwertmannite
pH Sulfate [[µM]] Chromate [[µM]] pH Sulfate [[µM]] Arsenate [[µM]]
2.37 276.2 177.2 2.32 304.7 56.42.52 269.6 171
Sh (1) 10-3 MAsO4 2.47 336.4 61.1
Sh (1) 10-3 MCrO4
2.76 271.6 175.5 2.75 343.6 48.12.99 301.6 177.9 2.98 349 45.33.47 306.8 164.2 3.49 409.2 50.35.46 737.5 131 5.59 630.2 38.85.79 738.8 136.4 5.86 654.6 34.16.12 803.9 135.2 6.43 719.6 37.46.42 847.6 136.1 7.01 727 43.86.74 853.8 148.9 7.51 775 65.72.32 105.4 12.8 2.30 76.4 0.432.44 93.3 11
Sh (1) 10-4 MAsO4 2.46 94.07 0.55
Sh (1) 10-4 MCrO4
2.64 79.4 8.1 2.64 132.4 0.292.80 69.7 13.1 2.81 180.6 0.453.06 87.8 2.1 3.08 259.5 0.163.83 131.8 1.96 3.84 393.2 0.24.00 146.7 1.47 4.02 371.7 0.144.41 181 1.42 4.44 448.6 0.424.89 227 1.16 4.91 576.4 0.635.34 311 1 5.42 594.4 0.95Sh (4) 10-3 M
CrO4 2.44 386.3 37.8Sh (4) 10-3 MAsO4 2.42 564.0 1.86
2.55 394.1 37.7 2.54 627.4 0.732.78 432.7 37.75 2.79 686.7 0.662.97 492.4 37.5 2.99 878.5 0.623.3 596 36.8 3.32 1015 0.66
3.88 929.1 32.4 3.90 1276 0.443.97 952.6 32.9 3.99 1323 0.554.13 1025 29.9 4.15 1394 0.574.11 1022 31.1 4.18 1398 0.344.32 1082 28.9 4.55 1454 0.982.38 148.8 3.1 2.37 232.8 0.61Sh (4) 10-4 M
CrO4 2.49 116.8 2.5Sh (4) 10-4 MAsO4 2.53 281.7 0.96
2.78 128.9 4.6 2.79 402.5 1.003.04 164.7 4.9 2.98 498.0 0.773.29 344.3 4.1 2.78 670.5 0.0903.63 330.1 2.7 3.02 662.3 1.063.87 386.6 2.6 3.03 709.3 0.3093.87 507.9 2.9 3.11 836.4 0.1224.00 534.5 7.7 3.69 972.5 0.1084.28 697.9 5.6 3.94 1035 0.17
pH Sulfate [[µM]] pH Sulfate [[µM]] pH Sulfate [[µM]] Arsenate[[µM]]
2.33 597.0 Sh (4) 2.42 1065 Sh(1) 5·10-3 6.79 902.5 12312.47 665.3 2.52 1234 AsO4 6.51 737 2102
Sh (1)
2.66 631.3 2.68 1121 5.3 685 19982.85 579.3 2.82 1212 4.01 599 216
3 615.2 3.03 1042 4.01 836 626.43.13 391.4 3.46 1100 4.23 841.9 691.23.2 506.4 3.52 987 4.04 801 172.83.3 538.8 3.65 1220 3.47 753 568.8
3.34 506.7 3.79 1120 3.17 759.9 482.43.41 498.5 3.87 1243 2.77 709.5 640.83.46 471.53.48 588.43.62 455.43.68 534.84.32 484.34.32 367.45.7 713.1
9.79 108310.95 114111.19 1156

Appendix
121
Goethite
pH Chromate [[µM]] pH Arsenate [[µM]]
2.50 210.9 Gt (1) 10-3 M AsO4 2.55 388.72.82 216.1 2.88 384.2
Gt (1) 10-3 M CrO4
6.26 271.2 7.28 709.06.99 284.5 7.50 723.07.59 296.8 7.56 727.08.81 300.2 9.33 799.29.00 298.1 9.47 806.49.56 303.7 9.80 824.49.69 303.7 9.97 799.29.80 322.7 10.1 824.42.43 0.91 Gt (1) 10-4 M AsO4 2.32 0.62.64 0.78 2.47 0.4
Gt (1) 10-4 M CrO4
4.82 1.83 2.70 0.86.94 27.59 6.08 1.37.32 29.82 7.09 5.48.71 31.42 7.28 33.59.16 38.80 9.06 45.49.45 39.57 9.55 54.49.68 36.20 9.82 49.09.83 35.88 10.04 89.7Gt (4) 10-3 M CrO45.73 69.23 Gt (4) 10-3 M AsO4 6.04 43.26.70 71.63 8.30 154.87.90 72.23 8.88 583.28.58 74.53 9.21 640.89.01 71.78 9.19 658.89.49 73.30 9.64 738.09.53 74.22 9.73 774.09.61 73.45 9.82 752.49.69 74.38 9.86 770.49.77 74.22 9.90 835.24.17 0.20 Gt (4) 10-4 M AsO4 4.10 0.1Sh (4) 10-4 M CrO4
6.60 7.07 6.59 0.18.11 7.42 8.31 1.18.68 7.62 8.74 2.58.69 7.50 8.96 3.39.51 14.81 9.52 1.39.55 15.22 9.57 1.89.67 18.17 9.62 1.79.73 18.10 9.82 3.79.83 18.40 9.87 9.5
Titration curves of goethite in presence of arsenate or chromate (chapter II.6.2)
-0 ,8
-0 ,6
-0 ,4
-0 ,2
0 ,0
0 ,2
0 ,4
4 5 6 7 8 9 1 0 1 1 1 2
pH
-0 ,8
-0 ,6
-0 ,4
-0 ,2
0 ,0
0 ,2
0 ,4
4 5 6 7 8 9 1 0 1 1 1 2
pH
Ob
erfl
äch
enla
du
ng
(C
/m²)
-0 ,8
-0 ,6
-0 ,4
-0 ,2
0 ,0
0 ,2
0 ,4
4 5 6 7 8 9 1 0 1 1 1 2
pH
-0 ,8
-0 ,6
-0 ,4
-0 ,2
0 ,0
0 ,2
0 ,4
4 5 6 7 8 9 1 0 1 1 1 2
pH
10-3 Mchromate
10-4 Mchromate
10-3 Marsenate
10-3 Marsenate
m 1 g·L-1 goethite, 24 h of reaction • 1 g·L-1 goethite, 48 h of reaction� 4 g·L-1 goethite, 24 h of reaction n 4 g·L-1 goethite, 48 h of reaction
Su
rfac
e ch
arg
e (C
·m2)

Appendix
122
F) SURFACE-WATER ANALYSIS OF THE MINING LAKES (III.)(BRAND, 2001)
Mining lake depth T O2 pH pe Fe2+ Fe3+ Al3+ Na+ NH4+ K+ Ca2+ Mg2+ F- Cl- NO3
- SO42-
[m] [°C] [mg/l] [µmol/l] [µmol/l] [µmol/l] [µmol/l] [µmol/l] [µmol/l] [µmol/l] [µmol/l] [µmol/l] [µmol/l] [µmol/l] [µmol/l]
Spreetal NO 1 22 7.97 3.6 10.86 12.9 0.1 176.9 1003.0 n.d. 379.4 7674 2561 n.d. 798.1 n.d. 10463
20 16 8.22 4.8 7.18 3.3 n.d. 45.7 769.3 178.4 369.9 12673 2487 n.d. 770.1 n.d. 12133
31 8 7.56 4.1 9.12 3.1 1.4 87.5 891.9 168.6 365.7 12518 2592 n.d. 778.0 n.d. 11356
Laubusch 0 17 8.64 6.5 5.43 n.d. n.d. n.d. 3460.0 n.d. 222.7 2657 530.8 42.2 720.4 59.4 3457
1.5 17 8.75 6.7 5.48 n.d. n.d. n.d. 2749.9 n.d. 219.8 2658 526.6 29.1 719.1 59.2 3001
Koschen 1 19 8.53 3.1 12.46 10.9 219.1 59.5 1524.6 129.3 296.6 4661 1158 n.d. 1170 n.d. 7584
10.5 17 7.74 3.1 12.51 9.8 254.3 63.6 1525.6 125.2 285.5 4497 1161 n.d. 1152 n.d. 8957
19 7 7.52 3.0 12.62 9.0 304.9 57.7 1502.8 139.9 292.7 4696 1171 n.d. 1201 n.d. 9069
Kortitzmühle 0 20 8.63 4.7 7.77 n.d. n.d. n.d. 960.9 206.2 293.6 13364 2177 n.d. 856.2 44.8 12443
2.9 19 7.94 4.5 8.19 n.d. 3.8 n.d. 962.6 207.8 293.2 13648 2213 n.d. 869.3 45.8 14657
Bluno 0 19 8.57 2.9 13.24 16.2 835.2 236.5 791.2 108.8 322.4 5015 1784 n.d. 781.9 n.d. 13733
2 19 8.64 2.8 13.28 13.4 851.9 272.3 794.5 109.4 327.3 5679 1786 n.d. 779.1 n.d. 18033
RL 111 0 19 8.5 2.7 13.28 55.2 2574 1561 266.2 198.1 154.1 5296 1250 33.7 251.4 n.d. 14944
5 13 9.39 2.6 13.51 23.7 2686 1538 242.8 182.9 143.8 5163 1061 32.4 255.5 n.d. 14176
Skado 0 18 9.02 2.8 13.38 16.9 1541.1 302.1 866.5 224.6 284.9 7006 2079 n.d.. 788.7 n.d. 18749
8 17 6.28 2.8 13.58 12.1 1609 302.1 853.0 241.4 275.4 6241 2103 n.d. 809.4 n.d. 18533
Sedlitz 0 18 8.89 3.0 13.24 9.6 421.4 343.9 2293.0 218.2 336.1 7806 1841 n.d. 899.4 n.d. 18593
7.5 18 8.62 3.0 13.19 10.5 415.8 355.8 1216.4 219.1 332.5 8071 1833 n.d. 911.5 n.d. 14362
Borna Ost 0 18 8.68 2.9 13.65 21.0 1189.4 791.1 423.4 n.d. 112.5 8906 1436 31.6 474.9 n.d. 19406
10 12 3.69 2.8 13.76 18.2 1221.2 749.3 400.8 n.d. 116.2 8947 1395 31.9 468.5 n.d. 19926
RL 13 0 15 9.42 2.9 12.76 28.9 237.5 272.3 259.6 47.5 171.5 2532 234.1 n.d. 273.4 99.6 7535
6.5 14 9.27 2.9 12.69 27.5 379.2 403.5 353.2 67.8 114.6 3093 351.3 n.d. 415.2 n.d. 8189
RL F 0 15 n.m. 2.8 12.92 24.4 440.3 451.2 345.3 116.5 198.3 13027 1885 n.d. 872.5 n.d. 16778
Niemegck 0 16 9.08 6.7 4.47 n.d. n.d. n.d. 1303.5 n.d. 151.3 2462 551.5 n.d. 1150 243.2 3438
13 12 8.43 4.7 4.07 n.d. n.d. n.d. 1426.7 n.d. 175.1 2734 633.0 n.d.. 1135 274.2 2080
RL 107 0 15 n.m. 2.3 13.79 38.7 11162 2936.1 217.8 448.3 326.7 9451 634.0 n.d. 163.3 n.d. 65653
RL 117 0 12 9.56 3.0 13.38 4.2 309.7 69.6 390.4 120.5 139.6 2468 574.8 n.d. 398.2 n.d. 9372
12 12 9.32 3.0 13.35 3.4 304.8 63.6 386.7 122.7 172.4 2383 563.4 n.d. 398.2 n.d. 7907
Murnersee 0 21 8.02 3.3 13.35 28.1 25.5 222.2 241.3 n.d. 108.9 1922 389.2 n.d.. 307.7 n.d. 3223
35 5 9.65 3.1 n.m. n.d. 84.0 222.2 248.6 n.d. 109.5 1865 380.7 n.d. 295.6 n.d. 3246
Ausee 0 24 7.97 3.0 n.m. 33.2 183.4 370.4 397.1 39.7 137.9 1424 350.1 n.d. 337.7 n.d. 4625
28 5 7.47 2.9 n.m. 36.0 258.4 407.4 494.7 42.5 133.3 1415 349.0 n.d. 358.0 n.d. 4585
Brückelsee 0 20 8.79 3.1 n.m. 24.0 53.9 296.3 196.5 n.d. 114.5 3998 358.4 n.d. 256.0 n.d. 3393
Lindensee 0 23 7.78 2.8 n.m. 78.0 270.8 870.4 158.4 42.5 117.1 5862 338.2 31.2 228.2 n.d. 6673
12 9 8.8 2.7 n.m. 31.0 365.8 870.4 197.6 60.9 146.6 6511 374.6 n.d. 211.1 n.d. 6078
n.m. not measuredn.d. not determinable (signal overlap in the ionic-chromatographic measurement due to higher concentrated ions)

Appendix
123
G)PHREEQC: CALCULATED SPECIES IN SURFACE WATERS OFTHE ML (III.), BRAND (2001)
Mining lake Depth[m]
loga(Fe2+)
loga(Fe3+)
loga(K+)
loga(SO4
2-)log
a(Fe(OH)2+)log
a(Fe(OH)2)+log
a(Fe(OH)3
loga(Fe(SO4)+)
loga(Fe(SO4)2
-
Spreetal NO 31 -5.89 -8.01 -3.52 -2.42 -6.61 -6.34 -9.52 -6.56 -7.67
Koschen 1 -5.31 -5.37 -3.60 -2.50 -4.66 -5.19 -9.15 -3.89 -5.06
10.5 -5.37 -5.34 -3.62 -2.42 -4.69 -5.26 -9.25 -3.80 -4.90
19 -5.39 -5.14 -3.61 -2.42 -4.85 -5.68 -9.96 -3.69 -4.80
Kortitzmühle 2.9 -10 -8.71 -3.63 -2.32 -6.53 -5.59 -8.07 -7.05 -8.05
Bluno 0 -5.21 -4.95 -3.58 -2.29 -4.45 -5.18 -9.34 -3.26 -4.23
2 -5.34 -5.05 -3.58 -2.19 -4.56 -5.31 -9.49 -3.26 -4.11
RL 111 0 -4.66 -4.38 -3.90 -2.37 -4.03 -4.91 -9.22 -2.76 -3.80
5 -5.01 -4.26 -3.92 -2.39 -4.18 -5.27 -9.80 -2.74 -3.81
Skado 0 -5.24 -4.76 -3.64 -2.21 -4.36 -5.20 -9.46 -3.00 -3.88
8 -5.38 -4.73 -3.66 -2.20 -4.32 -5.12 -9.35 -2.98 -3.86
Sedlitz 0 -5.50 -5.37 -3.57 -2.18 -4.73 -5.31 -9.32 -3.58 -4.44
7.5 -5.41 -5.25 -3.57 -2.30 -4.65 -5.27 -9.32 -3.58 -4.56
Borna Ost 0 -5.15 -4.88 -4.05 -2.20 -4.39 -5.12 -9.28 -3.12 -3.99
10 -5.20 -4.82 -4.03 -2.19 -4.55 -5.46 -9.80 -3.10 -3.97
RL 13 0 -4.87 -5.29 -3.83 -2.45 -4.81 -5.53 -9.69 -3.80 -4.93
6.5 -4.90 -5.09 -4.01 -2.44 -4.65 -5.40 -9.59 -3.60 -4.72
RL F 0 -5.05 -5.19 -3.80 -2.29 -4.84 -5.70 -9.98 -3.54 -4.52
RL 107 0 -5.07 -4.28 -3.63 -1.85 -4.42 -5.75 -10.5 -2.19 -2.72
RL 117 0 -5.73 -5.24 -3.93 -2.35 -4.79 -5.50 -9.66 -3.68 -4.72
12 -5.80 -5.19 -3.83 -2.42 -4.71 -5.41 -9.54 -3.69 -4.79
Murnersee 0 -4.80 -6.22 -4.01 -2.77 -5.23 -5.50 -9.18 -4.99 -6.43
35 -10 -5.37 -4.01 -2.76 -4.99 -5.70 -9.88 -4.30 -5.76
Ausee 0 -4.76 -5.37 -3.92 -2.64 -4.59 -5.09 -9.01 -3.98 -5.28
28 -4.70 -4.94 -3.93 -2.64 -4.84 -5.82 -10.3 -3.75 -5.09
Brückelsee 0 -4.87 -5.78 -4.00 -2.83 -4.98 -5.43 -9.30 -4.61 -6.10
Lindensee 0 -4.43 -5.17 -4.00 -2.63 -4.61 -5.32 -9.45 -3.78 -5.07
12 -4.80 -4.83 -3.90 -2.68 -4.71 -5.72 -10.2 -3.63 -4.99
H) ULTRAFILTRATION
Total iron and sulfate concentration (mmol·L-1) in the filtrates obtained by the mass balanceapproach , Brand (2001).
< 0.22 µm < 100 kDa < 10 kDa < 1 kDaFe(tot) SO4
2- Fe(tot) SO42- Fe(tot) SO4
2- Fe(tot) SO42-
Borna Ost 1.188 18.76 1.211 n.m. 1.179 n.m. 1.004 18.309
ML 117 0.301 6.48 0.298 n.m. 0.299 n.m. 0.233 8.23
ML 77 1.915 14.31 1.918 n.m. 1.875 n.m. 1.298 9.973
n.m. not measured

Appendix
124
I) SCHWERTMANNITE-STABILITY: RELEASE OFSULFATE AND IRON (III.)
Activity of released sulfate and iron of schwertmannite, suspended at constant pH (2, 3, 4, 5
and 7; III) over 362 days .
0
500
1000
1500
2000
2500
3000
3500
0 50 100 150 200 250 300days
a F
e(to
t) (
µM
); p
H 2
0
2
4
6
8
10
12
14
a F
e(to
t) (
µM
);
pH
3, 4
, 5, 7
0
200
400
600
800
1000
0 50 100 150 200 250 300days
a S
O4
(µM
)
pH 2 pH 3 pH 4 pH 5 pH 7

Hiermit erkläre ich, dass ich die Arbeit selbstständig verfasst und keine anderen als die von
mir angegebenen Quellen und Hilfsmittel verwendet habe.
Ferner erkläre ich, dass ich anderweitig mit oder ohne Erfolg nicht versucht habe, diese
Dissertation einzureichen. Ich habe keine gleichartige Doktorprüfung an einer anderen
Hochschule endgültig nicht bestanden.
Bayreuth,