Embed Size (px)
Citation preview
lable at ScienceDirect
Atmospheric Environment 44 (2010) 4325e4329
Contents lists avai
Atmospheric Environment
journal homepage: www.elsevier .com/locate/atmosenv
Short communication
Characterisation of particulate exposure during fireworks displays
Alexandre Joly a, Audrey Smargiassi b,c,*, Tom Kosatsky d, Michel Fournier e, Ewa Dabek-Zlotorzynska f,Valbona Celo f, David Mathieu f, René Servranckx g, Réal D'amours g, Alain Malo g, Jeffrey Brook f
a École de Santé Publique, Université de Montréal, CanadabDépartement de Santé Environnementale et de Santé au travail, Université de Montréal, Canadac Institut National de Santé Publique du Québec, CanadadBritish Columbia Center for Disease Control, CanadaeDirection de Santé Publique de l'Agence de la Santé et des Services Sociaux de Montréal, CanadafAnalysis and Air Quality Section, Air Quality Research Division, Atmospheric Science and Technology Directorate, Science and TechnologyBranch/Environment Canada, CanadagMeteorological Service of Canada/Environment Canada, Canada
a r t i c l e i n f o
Article history:Received 8 September 2009Received in revised form25 November 2009Accepted 4 December 2009
Keywords:Fine particulate matterFireworksHuman exposure
* Correspondence to: Audrey Smargiassi, Directiontréal, 1301 rue Sherbrooke Est, Montréal, Qc. H2L 1M2400x3226; fax: þ1 514 528 2459.
E-mail address: [email protected] (A.
1352-2310/$ e see front matter � 2009 Elsevier Ltd.doi:10.1016/j.atmosenv.2009.12.010
a b s t r a c t
Little is known about the level and content of exposure to fine particles (PM2.5) among persons whoattend fireworks displays and those who live nearby. An evaluation of the levels of PM2.5 and theirelemental content was carried out during the nine launches of the 2007 Montréal International Fire-works Competition. For each event, a prediction of the location of the firework plume was obtained fromthe Canadian Meteorological Centre (CMC) of the Meteorological Service of Canada. PM2.5 was measuredcontinuously with a photometer (Sidepak�, TSI) within the predicted plume location (“predicted sites”),and integrated samples were collected using portable personal samplers. An additional sampler waslocated on a nearby roof (“fixed site”). The elemental composition of the collected PM2.5 samples fromthe “predicted sites” was determined using both a non-destructive energy dispersive ED-XRF methodand an ICP-MS method with a near-total microwave-assisted acid digestion. The elemental compositionof the “fixed site” samples was determined by the ICP-MS with the near-total digestion method. Thehighest PM2.5 levels reached nearly 10 000 mg m�3, roughly 1000 times background levels. Elements suchas K, Cl, Al, Mg and Ti were markedly higher in plume-exposed filters. This study shows that 1) persons inthe plume and in close proximity to the launch site may be exposed to extremely high levels of PM2.5 forthe duration of the display and, 2) that the plume contains specific elements for which little is known oftheir acute cardio-respiratory toxicity.
� 2009 Elsevier Ltd. All rights reserved.
1. Introduction
Outdoor ambient fine particulate levels are known to increasewith fireworks displays. During the Indian Diwali festival, whichlast for a few days, daily levels of PM10 (particles with diametersless than 10 mm) were shown to increase 2e6 times the usual dailylevels (e.g. Barman et al., 2008; Ravindra et al., 2003). Followingshort-term displays, such as during National celebrations, increasesin fine particles have also been reported. For example, Vecchi et al.(2008) reported an increase in PM10 of 33.6 mg m�3, due to
de Santé Publique de Mon-3, Canada. Tel.: þ1 514 528
Smargiassi).
All rights reserved.
fireworks displays, with a 4 h time resolution; Perry (1995) foundan 18.5 mg m�1 increase in PM2.5 averaged over 24 h.
Unusually high levels of a number of trace elements, such as Ti,S, Cl, Mg, K, Sr, Ba, C, Ca, Al, Cu, Pb, have been measured in outdoorambient fine particles following both day-long celebrations (e.g.Indian Diwali festival, Spanish Las Fallas celebration) and aftershort-term displays (Kim and Hopke, 2008; Vecchi et al., 2008;Moreno et al., 2007; Kulshrestha et al., 2004; Röösli et al., 2001;Perry, 1995). Some of these elements, namely C, K and S, originatefrom black powder combustion (Perry, 1995), whereas others suchas Sr have been suggested as being particularly characteristic offireworks aerosols (Walsh et al., 2009; Vecchi et al., 2008).
Notwithstanding this literature, little is known about theexposure of spectators attending short-term outdoor displaysdespite the fact that they are more common. Most studies thatmeasured outdoor ambient fine particles during short-termdisplays, sampled either air at fixed monitoring sites located on
A. Joly et al. / Atmospheric Environment 44 (2010) 4325e43294326
roofs of buildings or at remote monitoring sties (e.g. Vecchi et al.,2008; Drewnick et al., 2006; Perry, 1995), and not at the breathingheight where people attend displays. Furthermore, levels haveusually been measured over periods of time much longer than theduration of the displays and thus over periods of time much longerthan the individual's exposure period (e.g. Walsh et al., 2009; Röösliet al., 2001; Perry, 1995).
The present study was thus performed to quantify the levels andelemental composition of the exposure of individuals attendingshort-term displays during the 2007 International FireworksCompetition in Montréal.
2. Methods
2.1. Design and particulate measurement sites
The 2007 Montréal International Fireworks Competition con-sisted of 9 fireworks displays in June and July. Each display startedat 22:00 and lasted from 30 to 45 min, with test shots occurring fora fewminutes preceding each event. On the morning of each event,the day's weather forecast was used to predict the most likelyplume location, based on the Canadian Meteorological Centre(CMC)’s short range LaGrangian particle dispersion model. Thisapproach was used to maximize the particulate exposure of thecollection team going to the “predicted site” on each fireworksdisplay of the competition. All the “predicted sites” were situatedwithin 500e2000 m from the “launch site” (Ste-Hélène Island inthe St. Lawrence River just off Montréal, Qc.) and were occupied bynumerous spectators. A “fixed site” situated on the roof ofa building in Longueuil, Qc. (immediately South of Montréal) ata height of 10 m from ground level and a distance of 1100 m fromthe “launch site” was used for all launches.
2.2. PM2.5 sampling
PM2.5 samples were collected with a large URG cyclone sampleron 90 mm Zefluor� filters at w55 lpm at the “fixed site”. Samplingat the “predicted sites” was conducted with a smaller URG cyclonesampler on 47 mm Teflo� filters at 10 lpm. Collection with the URGsamplers at both the “predicted” and “fixed” sites was performedfor 60 min. Field blank filters were recovered on every day ofsampling for both URG samplers. The Teflo� filters were weighedbefore and after sample collection using a Mettler Microbalance(MT-5, Mettler-Toledo Inc., Hightstown, NJ) under controlled rela-tive humidity (45 � 5%) and temperature (23 � 3 �C) conditions;Zefluor� filters were not weighed due to the unavailability ofa balance that could accommodate their large size. In addition,PM2.5 levels were also measured continuously with a Sidepack�(photometer) at the “predicted sites”.
2.3. Chemical analysis
The elemental composition of the PM2.5 samples from the“predicted site” was determined by both ED-XRF and ICP-MS witha near-total microwave-assisted acid digestion. The samplescollected at “fixed sites” were determined only by ICP-MS after thenear-total microwave-assisted acid digestion.
A Jordan Valley EX-6600 AF dispersive X-ray spectrometerequipped with a 400 watt Rhodium target tube was used for theanalysis of 22 elements (Al, Si, S, K, Ca, Ti, V, Cr, Mn, Fe, Cl, Zn, Se, Br,Rb, Sr, Cd, Sn, Ni, Cs, Ba, Pb). Following the measurement process,data treatment was performed to correct results for backgroundsignal, spectral interferences, and X-ray signal loss due to absorp-tion by the sample mass. Micromatter� standard reference sampleswere used for the quantitative calibration of the system. Calibration
was checked by analyzing NIST standards (SRM 1832 and SRM1833). Blank filters were used for background subtraction. Thedetection limits were in the range of 1e15 ng m�3. Experimentaloverall uncertainties were in the range of 5e35%.
All ICP-MS measurements were performed using an AgilentTechnologies 7500c ICP-MS system (Agilent Technologies, Wil-mington, DE, USA), equipped with an octopole collision/reactionsystem (ORS), a Babington nebulizer, a Peltier cooled (2 �C) quartzScott-type double pass spray chamber and an Agilent I-AS inte-grated autosampler. The ICP-MS ChemStation software (AgilentTechnologies, Inc.) was used to control all instrument operationsincluding tuning, data acquisition, and data analysis. ICP-MSmeasurements were performed in semiquant (SemiQ) mode (Chenet al., 2008) with a 100 mg l�1 multi-element calibration standardused for calibration. Before the daily analysis, the instrument wastuned in both normal and reaction cell mode in terms of sensitivity,interference levels and resolution, using a tuning solution thatcontains 10 mg l�1 of Li, Y, Tl, Ce and Co in 2% (v/v) HNO3. Internalstandardization with 1 mg l�1 solution of 45Sc, 89Y, 115In, and 165Howas used to correct for the instrumental drifts and nonspectralinterferences. The internal standard was added on line and wasautomatically mixed with the sample solution before being intro-duced into the nebulizer.
A closed vessel microwave-assisted reaction system (MARS 5,CEM Corporation, Matthews, NC) was used for near-total digestionof samples prior to ICP-MS measurements for 20 metals (Ag, Al, As,Ba, Be, Cd, Co, Cu, Fe, Mn, Mo, Ni, Pb, Se, Sb, Sn, Sr, Tl, V, Zn) (Celoet al., 2005). The PM2.5 laden filters were digested using 40% (v/v)HNO3, following a two-step digestion program (Celo et al., 2005).The precision and accuracy of the analysis were checked byanalyzing standard reference materials prepared in the same wayas the digested samples, spikes and duplicates. The detectionslimits were in the range 0.02e4 ng m�3. The overall uncertaintiesfor determined trace metals were in the range 10e25%.
2.4. Statistical analysis
Elements with values below the limits of detection (LOD) wereset at half the LOD for each element. Elements showing less than 4out of 9 readings above the LOD were discarded. The discardedelements were all from the ED-XRF analysis.
A hierarchical cluster analysis, using Ward's method and theEuclidian squared distance of the elemental proportions of eachfilter, was used to classify them into “Exposed” and “Non-exposed”filters. The elemental proportions of each filter, with respect to theirtotal mass, were calculated with the ICP-MS values. This filterclassification approach was used to remove any ambiguity as towhether the filters had been exposed or not.
3. Results
Sampling was successful at all sampling sites, on all fireworksdates, and a total of 18 filters (9 Zefluor�, 9 Teflo�) were collected.
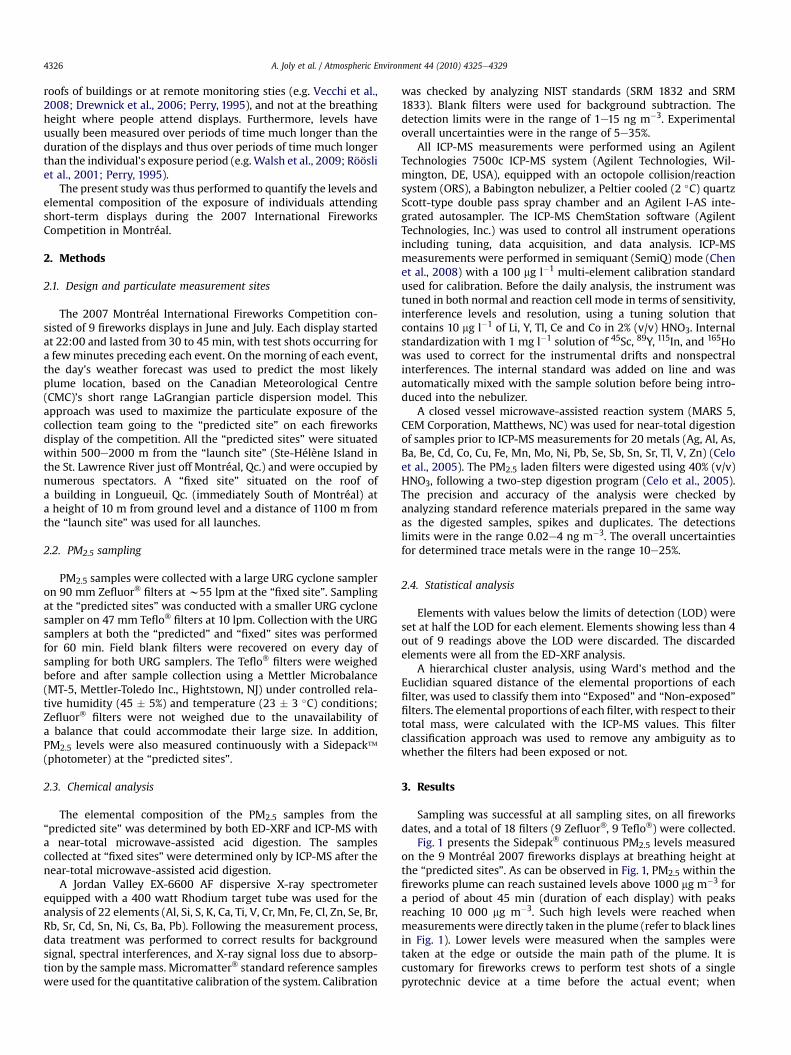
Fig. 1 presents the Sidepak� continuous PM2.5 levels measuredon the 9 Montréal 2007 fireworks displays at breathing height atthe “predicted sites”. As can be observed in Fig. 1, PM2.5 within thefireworks plume can reach sustained levels above 1000 mg m�3 fora period of about 45 min (duration of each display) with peaksreaching 10 000 mg m�3. Such high levels were reached whenmeasurements were directly taken in the plume (refer to black linesin Fig. 1). Lower levels were measured when the samples weretaken at the edge or outside the main path of the plume. It iscustomary for fireworks crews to perform test shots of a singlepyrotechnic device at a time before the actual event; when
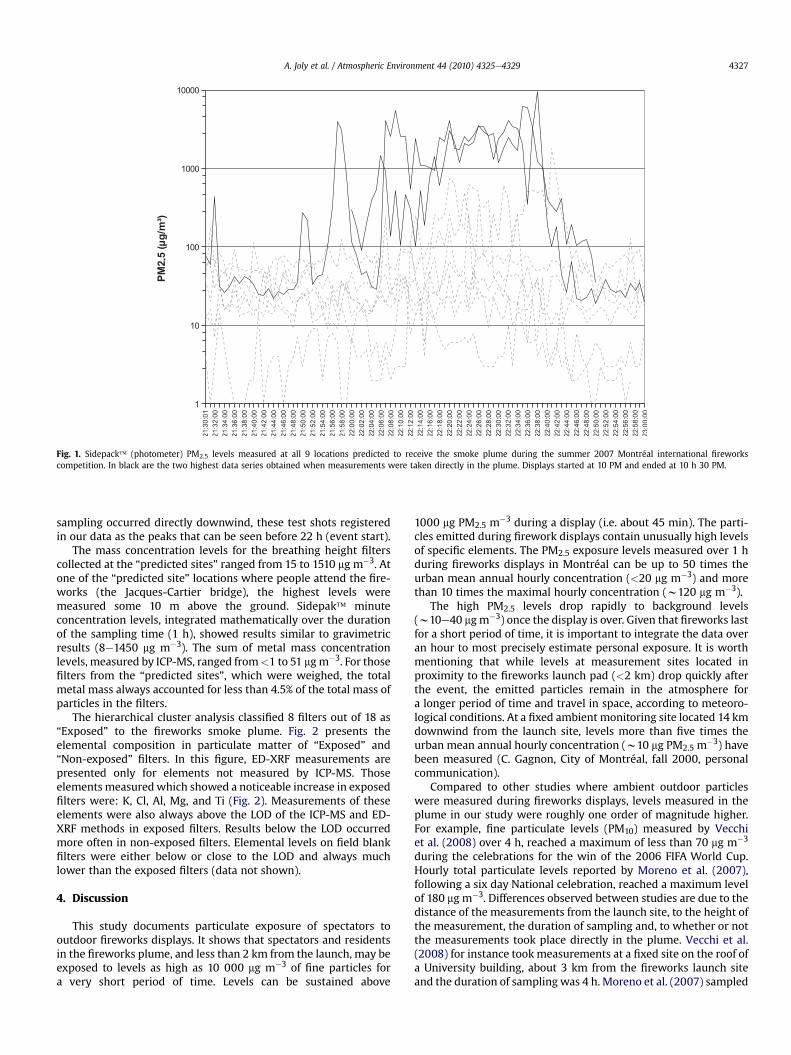
Fig. 1. Sidepack� (photometer) PM2.5 levels measured at all 9 locations predicted to receive the smoke plume during the summer 2007 Montréal international fireworkscompetition. In black are the two highest data series obtained when measurements were taken directly in the plume. Displays started at 10 PM and ended at 10 h 30 PM.
A. Joly et al. / Atmospheric Environment 44 (2010) 4325e4329 4327
sampling occurred directly downwind, these test shots registeredin our data as the peaks that can be seen before 22 h (event start).
The mass concentration levels for the breathing height filterscollected at the “predicted sites” ranged from 15 to 1510 mg m�3. Atone of the “predicted site” locations where people attend the fire-works (the Jacques-Cartier bridge), the highest levels weremeasured some 10 m above the ground. Sidepak� minuteconcentration levels, integrated mathematically over the durationof the sampling time (1 h), showed results similar to gravimetricresults (8e1450 mg m�3). The sum of metal mass concentrationlevels, measured by ICP-MS, ranged from<1 to 51 mgm�3. For thosefilters from the “predicted sites”, which were weighed, the totalmetal mass always accounted for less than 4.5% of the total mass ofparticles in the filters.
The hierarchical cluster analysis classified 8 filters out of 18 as“Exposed” to the fireworks smoke plume. Fig. 2 presents theelemental composition in particulate matter of “Exposed” and“Non-exposed” filters. In this figure, ED-XRF measurements arepresented only for elements not measured by ICP-MS. Thoseelementsmeasuredwhich showed a noticeable increase in exposedfilters were: K, Cl, Al, Mg, and Ti (Fig. 2). Measurements of theseelements were also always above the LOD of the ICP-MS and ED-XRF methods in exposed filters. Results below the LOD occurredmore often in non-exposed filters. Elemental levels on field blankfilters were either below or close to the LOD and always muchlower than the exposed filters (data not shown).
4. Discussion
This study documents particulate exposure of spectators tooutdoor fireworks displays. It shows that spectators and residentsin the fireworks plume, and less than 2 km from the launch, may beexposed to levels as high as 10 000 mg m�3 of fine particles fora very short period of time. Levels can be sustained above
1000 mg PM2.5 m�3 during a display (i.e. about 45 min). The parti-cles emitted during firework displays contain unusually high levelsof specific elements. The PM2.5 exposure levels measured over 1 hduring fireworks displays in Montréal can be up to 50 times theurban mean annual hourly concentration (<20 mg m�3) and morethan 10 times the maximal hourly concentration (w120 mg m�3).
The high PM2.5 levels drop rapidly to background levels(w10e40 mgm�3) once the display is over. Given that fireworks lastfor a short period of time, it is important to integrate the data overan hour to most precisely estimate personal exposure. It is worthmentioning that while levels at measurement sites located inproximity to the fireworks launch pad (<2 km) drop quickly afterthe event, the emitted particles remain in the atmosphere fora longer period of time and travel in space, according to meteoro-logical conditions. At a fixed ambient monitoring site located 14 kmdownwind from the launch site, levels more than five times theurban mean annual hourly concentration (w10 mg PM2.5 m�3) havebeen measured (C. Gagnon, City of Montréal, fall 2000, personalcommunication).
Compared to other studies where ambient outdoor particleswere measured during fireworks displays, levels measured in theplume in our study were roughly one order of magnitude higher.For example, fine particulate levels (PM10) measured by Vecchiet al. (2008) over 4 h, reached a maximum of less than 70 mg m�3
during the celebrations for the win of the 2006 FIFA World Cup.Hourly total particulate levels reported by Moreno et al. (2007),following a six day National celebration, reached a maximum levelof 180 mg m�3. Differences observed between studies are due to thedistance of the measurements from the launch site, to the height ofthe measurement, the duration of sampling and, to whether or notthe measurements took place directly in the plume. Vecchi et al.(2008) for instance took measurements at a fixed site on the roof ofa University building, about 3 km from the fireworks launch siteand the duration of sampling was 4 h. Moreno et al. (2007) sampled
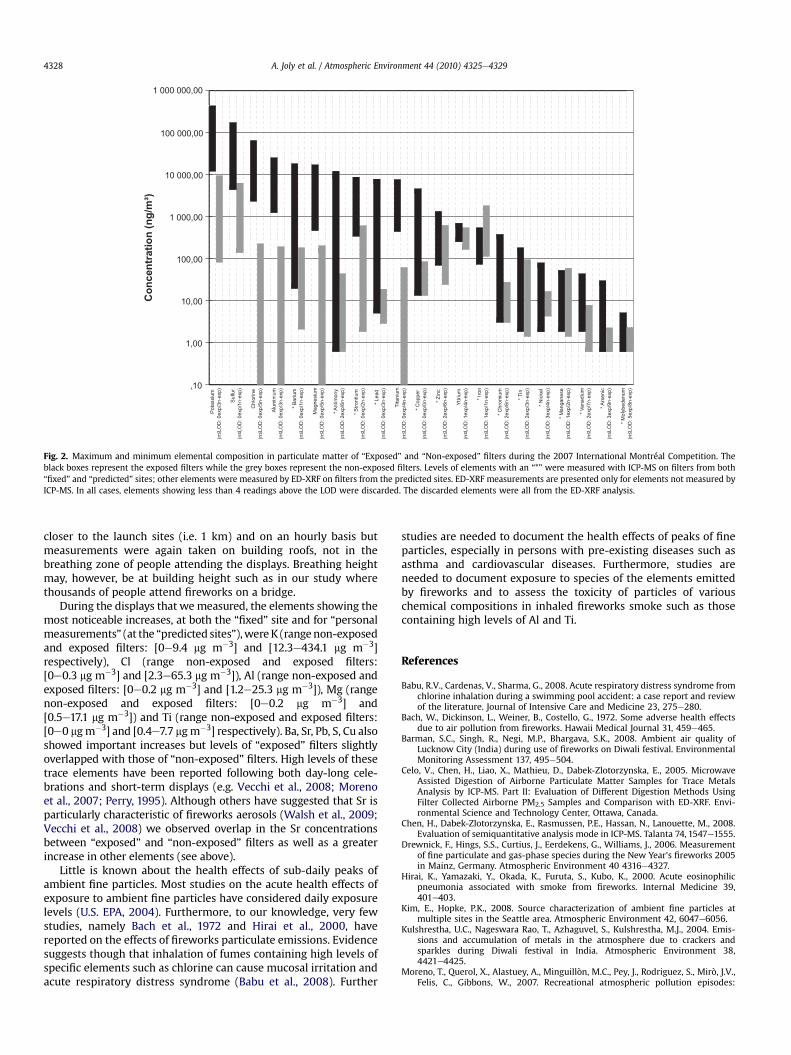
Fig. 2. Maximum and minimum elemental composition in particulate matter of “Exposed” and “Non-exposed” filters during the 2007 International Montréal Competition. Theblack boxes represent the exposed filters while the grey boxes represent the non-exposed filters. Levels of elements with an “*” were measured with ICP-MS on filters from both“fixed” and “predicted” sites; other elements were measured by ED-XRF on filters from the predicted sites. ED-XRF measurements are presented only for elements not measured byICP-MS. In all cases, elements showing less than 4 readings above the LOD were discarded. The discarded elements were all from the ED-XRF analysis.
A. Joly et al. / Atmospheric Environment 44 (2010) 4325e43294328
closer to the launch sites (i.e. 1 km) and on an hourly basis butmeasurements were again taken on building roofs, not in thebreathing zone of people attending the displays. Breathing heightmay, however, be at building height such as in our study wherethousands of people attend fireworks on a bridge.
During the displays that we measured, the elements showing themost noticeable increases, at both the “fixed” site and for “personalmeasurements” (at the “predicted sites”),wereK (rangenon-exposedand exposed filters: [0e9.4 mg m�3] and [12.3e434.1 mg m�3]respectively), Cl (range non-exposed and exposed filters:[0e0.3 mg m�3] and [2.3e65.3 mg m�3]), Al (range non-exposed andexposed filters: [0e0.2 mg m�3] and [1.2e25.3 mg m�3]), Mg (rangenon-exposed and exposed filters: [0e0.2 mg m�3] and[0.5e17.1 mg m�3]) and Ti (range non-exposed and exposed filters:[0e0 mgm�3] and [0.4e7.7 mgm�3] respectively). Ba, Sr, Pb, S, Cu alsoshowed important increases but levels of “exposed” filters slightlyoverlapped with those of “non-exposed” filters. High levels of thesetrace elements have been reported following both day-long cele-brations and short-term displays (e.g. Vecchi et al., 2008; Morenoet al., 2007; Perry, 1995). Although others have suggested that Sr isparticularly characteristic of fireworks aerosols (Walsh et al., 2009;Vecchi et al., 2008) we observed overlap in the Sr concentrationsbetween “exposed” and “non-exposed” filters as well as a greaterincrease in other elements (see above).
Little is known about the health effects of sub-daily peaks ofambient fine particles. Most studies on the acute health effects ofexposure to ambient fine particles have considered daily exposurelevels (U.S. EPA, 2004). Furthermore, to our knowledge, very fewstudies, namely Bach et al., 1972 and Hirai et al., 2000, havereported on the effects of fireworks particulate emissions. Evidencesuggests though that inhalation of fumes containing high levels ofspecific elements such as chlorine can cause mucosal irritation andacute respiratory distress syndrome (Babu et al., 2008). Further
studies are needed to document the health effects of peaks of fineparticles, especially in persons with pre-existing diseases such asasthma and cardiovascular diseases. Furthermore, studies areneeded to document exposure to species of the elements emittedby fireworks and to assess the toxicity of particles of variouschemical compositions in inhaled fireworks smoke such as thosecontaining high levels of Al and Ti.
References
Babu, R.V., Cardenas, V., Sharma, G., 2008. Acute respiratory distress syndrome fromchlorine inhalation during a swimming pool accident: a case report and reviewof the literature. Journal of Intensive Care and Medicine 23, 275e280.
Bach, W., Dickinson, L., Weiner, B., Costello, G., 1972. Some adverse health effectsdue to air pollution from fireworks. Hawaii Medical Journal 31, 459e465.
Barman, S.C., Singh, R., Negi, M.P., Bhargava, S.K., 2008. Ambient air quality ofLucknow City (India) during use of fireworks on Diwali festival. EnvironmentalMonitoring Assessment 137, 495e504.
Celo, V., Chen, H., Liao, X., Mathieu, D., Dabek-Zlotorzynska, E., 2005. MicrowaveAssisted Digestion of Airborne Particulate Matter Samples for Trace MetalsAnalysis by ICP-MS. Part II: Evaluation of Different Digestion Methods UsingFilter Collected Airborne PM2.5 Samples and Comparison with ED-XRF. Envi-ronmental Science and Technology Center, Ottawa, Canada.
Chen, H., Dabek-Zlotorzynska, E., Rasmussen, P.E., Hassan, N., Lanouette, M., 2008.Evaluation of semiquantitative analysis mode in ICP-MS. Talanta 74, 1547e1555.
Drewnick, F., Hings, S.S., Curtius, J., Eerdekens, G., Williams, J., 2006. Measurementof fine particulate and gas-phase species during the New Year's fireworks 2005in Mainz, Germany. Atmospheric Environment 40 4316e4327.
Hirai, K., Yamazaki, Y., Okada, K., Furuta, S., Kubo, K., 2000. Acute eosinophilicpneumonia associated with smoke from fireworks. Internal Medicine 39,401e403.
Kim, E., Hopke, P.K., 2008. Source characterization of ambient fine particles atmultiple sites in the Seattle area. Atmospheric Environment 42, 6047e6056.
Kulshrestha, U.C., Nageswara Rao, T., Azhaguvel, S., Kulshrestha, M.J., 2004. Emis-sions and accumulation of metals in the atmosphere due to crackers andsparkles during Diwali festival in India. Atmospheric Environment 38,4421e4425.
Moreno, T., Querol, X., Alastuey, A., Minguillòn, M.C., Pey, J., Rodriguez, S., Mirò, J.V.,Felis, C., Gibbons, W., 2007. Recreational atmospheric pollution episodes:

A. Joly et al. / Atmospheric Environment 44 (2010) 4325e4329 4329
inhalable metalliferous particles from firework displays. Atmospheric Envi-ronment 41, 913e922.
Perry, K.D., 1995. Effects of outdoor pyrotechnic displays on the regional air qualityof Western Washington State. Journal of the Air and Waste ManagementAssociation 49, 146e155.
Ravindra, K., Mor, S., Kaushik, C.P., 2003. Short-term variation in air quality asso-ciated with fireworks events: a case study. Journal of Environmental Monitoring5, 260e264.
Röösli, M., Theis, G., Künzli, N., Staehelin, J., Mathys, P., Oglesby, L., Camenzind, M.,Braun-Fahrländer, C., 2001. Temporal and spatial variation of the chemical
composition of PM10 at urban and rural sites in the Basel area, Switzerland.Atmospheric Environment 35, 3701e3713.
U.S. Environmental Protection Agency, 2004. Air Quality Criteria for ParticulateMatter. EPA600/p-99/002aF. U.S. Environmental Protection Agency, Wash-ington, DC.
Vecchi, R., Bernardoni, V., Cricchio, D., D'Alessandro, A., Fermo, P., Lucarelli, F.,Nava, S., Piazzalunga, A., Valli, G., 2008. The impact of fireworks on airborneparticles. Atmospheric Environment 42, 1121e1132.
Walsh, K.J., Milligan, M., Sherwell, J., 2009. Synoptic evaluation of regional PM2.5concentrations. Atmospheric Environment 43, 594e603.