Embed Size (px)
Citation preview

Mayr and Ashlock 2001. Principles of Systematic Zoology.
New Characters Molecular * microsatellite DNA * SNPs (single nucleotide polymorphisms) * next-generation sequence fragments * whole genomes Ultrastructure * sperm ultrastructure very conservative CT Scans (=computer-processed X-rays to produce tomographic images or slices of an object
Character: trait or attribute Character States: various forms or expression of a character Ex.: beetle elytra (forewing) Character: punctation of tiger beetle elytra States: punctures shallow or punctures deep
Start: 30 September, 2013

Apomorphic: derived or evolved character state Plesiomorphic: the ancestral or pre-existing state of
a character Apotypic and plesiotypic: can use for (non-
morphological) behavioral, ecological, and physiological characters
Autapomorphic: unique (unshared) derived state Synapomorphic: uniquely shared derived state Symplesiomorphic: shared primitive state


Autapomorphic, Synapomorphic & Symplesiomorphic * relative terms: i.e., relative to other taxa under study * usage depends on level of analysis or inquiry Ex.: feathers are - autapomorphic for the class Aves(birds) (relative to other vertebrates) - synapomorphic for all bird orders (relative to other vertebrates) - symplesiomorphic for ratites and other flightless birds (when trying to infer relationships of bird orders to one another)


Trees
Nodes: branching points Branches (internodes, edges) - terminal nodes: terminal taxa - the entities in the analysis Internal nodes: hypothetical
ancestors Root: basal ancestor

Tree Notation

* Partially or fully resolved trees - fully resolved: all branches bifurcating - partially resolved trees a have polytomies * Polytomy = 3 or more branches (descendants) from single node - soft polytomy: waiting for more data (unsure of sequence) - hard polytomy: polytomy thought to be reflective of true evolutionary history
Tree resolution

A dendrogram is a broad term for any diagrammatic representation of a phylogenetic tree. A cladogram is a tree formed using cladistic methods. This type of tree only represents a branching pattern, i.e., its branch lengths do not represent time. * A synapomorphy mapping scheme of sorts as its topology is determined by mapping of shared derived characters. A phylogram (additive tree) is a phylogenetic tree that represents the amount of character change by its branch lengths. An ultrametric tree or chronogram is a phylogenetic tree that explicitly represents evolutionary time through its branch lengths.
Types of branching diagrams

a. cladograms - simply branching sequence, relationships - branch lengths unknown or not estimated b. additive trees - branching sequence plus branch lengths - distance from root to tips differs among lineages - root to tip specifies degree of divergence c. ultrametric trees - tips equidistant from root (assuming all taxa extant) - branching sequence plus time - lengths of branches specify time since splits

* Trees may be rooted or unrooted * unrooted trees = networks or graphs - no base or origin implied * if no constraints on character evolution (directionality), all trees are of same length no matter where the root is placed
Rooting Trees

Rooting Trees
Rooting determines everything…

Cladograms ≠ Evolutionary Trees * a cladogram is often equated with an evolutionary tree but - many phylogenetic/evolutionary trees possible from even a simple cladogram (see Pages and Holmes 1998: 24)

Branches Can Rotate on Node
…taxon on right is not most derived

Kre
ll an
d C
rans
ton
2004
. Whi
ch si
de o
f the
tree
is m
ore
basa
l?

Announcements 2 October, 2013
* Field trip receipts: approx. $85 available * black jacket * Readings * Paper topic * ?Wagner away at Smithsonian after noon on
Thursday

Rooting Trees
Rooting determines everything…

Number of possible unrooted trees
Number of possible rooted trees

Qualitative versus Quantitative Characters
1. Qualitative characters 2. Quantitative (measurement) characters a. continuous: height b. meristic: count measurements e.g., number of antennal segments All three character types may appear in same matrix.

Discrete versus non-discrete (continuous) characters
* Discrete characters most commonly employed character type in phylogenetic analyses because the various states may be unambiguously coded with respect to one another.
* If measured variation (states) is not discrete, i.e., the taxa exhibit overlapping states, there is disagreement on how such data can/should be incorporated into a phylogenetic analysis.
* Keep in mind that much apparently discrete data may, in fact, be pseudo-discrete data
- states might be defined as if they were discrete: e.g., leaf shapes; - absence of intermediates may simply reflect incomplete sampling; - even presence/absence can be tricky (a feature may appear absent
until you view it under greater magnification).

Coding Discrete Characters
* Binary Characters - two states, coded by 0 and 1 - ordered by default * Multistate Character - more than two states - two broad types with several possible attributes: a) linear transformation series (Compleat Cladist Fig. 3.13)
i) linear coding (Compleat Cladist Table 3.6) ii) additive binary (Compleat Cladist Table 3.6)
b) branching transformation series (Compleat Cladist Fig. 3.14) i) nonadditive binary coding (Compleat Cladist Table 3.7) ii) mixed coding (Compleat Cladist Table 3.7)

Optional

Optional

No rules on how to code complex (morphological) characters: How many characters do you derive from a single character or character system?

Coding Continuous Characters
gap coding – some statistical measure of the variance is used as a yard-stick for identifying sufficiently large gaps in the raw data.
segment coding – the total range in variation in a character is divided into an arbitrarily chosen number of equal-sized, non-overlapping ranges.
divergence coding – makes prior knowledge of taxa; mean character values for each taxon are ranked; taxon by taxon matrix is filled with either 1s, -1s or 0s depending on whether the means for each pair of taxa are greater or less than that of other taxa; the total score of 1s, -1s, and 0s is calculated for each taxon and that value is used as the character state.
generalized gap coding – taxa are again arranged in order according to their mean values and pooled data for all possible sets of contiguous taxa are compared statistically with data for adjacent taxa or contiguous sets of adjacent taxa; if a statistically significant difference is obtained then the boundary between the two groups is taken as a “gap.”
See Quicke, D. L. J. (1993): Principles and Techniques of Contemporary Taxonomy, Tertiary Level Biology Series, Blackie Publishing Group, Glasgow.

* Character analysis sits at the heart of phylogenetic construction and systematic analysis * "Knowing where useful characters are to be found and establishing their specific value is perhaps the most important skill of a systematist..." Mayr and Ashlock (1991) * They go on to write: "The entire zoological classification is based on the proper evaluation of taxonomic characters. This operation, then, is the most important as well as one of the most difficult tasks of the taxonomist.” * cladograms and phylogenetic trees are only as good as the character analysis that goes to generating them (garbage in...garbage out)
Character Analysis

* find characters that are variable but not too variable - characters should be appropriate for the questions being asked * objectivity is important when selecting non-molecular characters - easy to bias an analysis by choosing the characters that fit your preconceived notions (glass slipper phenomenon) * choose independent characters - avoid suites of correlated characters - avoid characters known to be under strong selection (e.g., 1° and 2° sex. characters)
Character selection
Golden crowned fruit bat
Big brown bat

* External morphology argues for common, and unique ancestry (monophyly), - but many of these are characters associated with flight and the flight musculature. * Neurological wiring of brain suggests two lineages, and that bats are polyphyletic - but again same problem because Megachiroptera do not echolocate
Character selection and Bat Phylogeny
Golden crowned fruit bat
Big brown bat


46 Characters in analysis: • 29 based on male genitalia • 15 based on male valve

“The male scent system consists of a (1) fascicle of long scent scales, a (2) lever system that deploys the androconial brush during courtship, an (3) apodeme associated with the lever, a (4) pheromone-releasing gland, a (5) pocket on the side of the third and fourth abdominal segments that receives the brush at rest, plus (6) all the associated musculature and innervation.”
Wagner (2007)
Cerma cerintha
Cerma cerintha
Moved into Acronictinae because of DNA data and pupation behavior, but initially regarded as problematic because Cerma possessed very complex (derived) male pheromone system believed to have evolved later in Noctuidae

Abdominal Brush Organ in Cerma cerintha
Fibiger and Lafontaine 2005
Char. 6 = abdominal coremata in Fibiger and Lafontaine 2005
If Cerma is an acronictine, then: (1) abdominal coremata must evolve more basally (2) abdominal coremata must be surprisingly labile (evolutionarily) (3) elevation of Sinocharinae and Lophonyctinae based on presence of coremata seems ill-considered, and Sinocharis and Lophonycta could be returned to Acronictinae
Bottom line: male sexual characters can evolve rapidly and workers need to regard cautiously

* Similarity in position ex. forelimbs in vertebrates * Similarity of quality or function ex. all vertebrate eyes * Continuance through intermediate forms taxonomic, fossil, or ontogenetic intermediates ex. our inner ear bones are homologous to the jaw bones of reptiles, i.e., hydromandibular, quadrate, & articular bones - fossils can be key here (as in horses and their toe fusion…)
Scoring Synapomorphies: Homology Criteria
Regressive and Loss Characters * difficult to determine homology - because there are so many ways to lose a character - for example, phylogenetic reconstruction of parasitic lineages based on morphology has been problematic historically

Taxon 1 2 3 4 5 6 7 8 9 A A G G T C B A G G G G C C A G G G G C D A C C T C C E A C C T C F A C C T C C
Analogous problems when aligning nucleotide sequences: gaps, insertions, and deletions become homology problems
Is the loss at position 7 homologous in taxon A and E?

Unordered versus Ordered Characters
* unordered characters – any state can transform into any other state with equal cost
* ordered – the relationships of character states are specified (for example, below character state 0 may transform into character state 1, and character state 1 may transform into character state 2).

Modern Analyses Use Indirect (Outgroup) Method to Determine Character Polarities
* characters are not apriori polarized * run characters as ordered/unordered * specification of outgroup taxon (taxa) choice of outgroup(s) (and rooting) determines
character polarities.

Polarity
* Polarity (direction of character change) is critical to our understanding of evolution
* Darwin’s misunderstanding of fish swim bladder/tetrapod lung - common sense would suggest lungs are derivative of the swim bladder - but wrong - swim bladders and lungs are homologous but lungs did not evolve from
swim bladder - at least one placoderm had a breathing structure off of the pharynx (phryngeal pouch) transformation series: gut diverticula lung gut divertiucla swim bladder

gut diverticula
lung
swim bladder

Outgroup Rule: given two character states within a monophyletic group, the state also found in the outgroup is plesiomorphic, whereas that found only in the ingroup is apomorphic.
Transformation series: a ----> a'
outgroup ingroup
ingroup
a a’ a

ingroup = study group outgroup = any taxon of equal or higher rank outside ingroup sister group: outgroup taxon that shares the most recent common ancestor with the ingroup.
- sister group provides best estimate of ancestral character states combinations in ingroup (best outgroup taxon) - true sister lineage often extinct (or unavailable) - when you can, use closest available taxon in analyses

* Outgroup selection profoundly affects polarity decisions which ultimately determines: (1) tree topology (2) all monophyly decisions

TAXON 1 2 3 4 5 Tribe X-ini
Genus Hirsutus
Species A 1’ 2 3’ 4’ 5’ Species B 1 2 3 4’ 5 Species C 1’ 2’ 3’ 4 5’ Species D 1 2’ 3 4’ 5 Genus Prohirsutus
Species E 1 2’ 3 4 5

TAXON 1 2 3 4 5 Tribe X-ini
Genus Hirsutus
Species A 1’ 2 3’ 4’ 5’ Species B 1 2 3 4’ 5
Species C 1’ 2’ 3’ 4 5’
Species D 1 2’ 3 4’ 5
Genus Prohirsutus
Species E 1 2’ 3 4 5 Tribe Y-ine
Species F 1 2 3’ 4’ 5’

* Outgroup selection profoundly affects polarity decisions which determines: (1) tree topology (2) monophyly decisions * consider outgroup selection in when you're evaluating papers and grant proposals (or your own work) - might results hinge on a single outgroup taxon? * avoid distant outgroups when possible - sometimes unavoidable (when there has been much extinction) - this is why fossils are needed for reconstruction of tetrapods (?and angiosperms)

0.1
Raphia frater Panthea acronyctoides
Acronicta afflicta Acronicta retardata1 Acronicta retardata2 1.00 Acronicta dactylina1 Acronicta dactylina2 1.00 Acronicta americana2 1.00 1.00
Acronicta funeralis1 Acronicta funeralis2 1.00
Acronicta oblinita1 Acronicta oblinita2 1.00
Simyra henrici1 Simyra henrici2 1.00 0.99
Acronicta fragilis1 Acronicta fragilis2 1.00 Acronicta interrupta
Acronicta hasta1 Acronicta hasta2 0.99 1.00 Acronicta lobeliae
Acronicta superans1 Acronicta superans2 1.00 0.57
1.00
Acronicta vinnula1 Acronicta vinnula2 1.00
Acronicta grisea1 Acronicta grisea2 1.00 0.85
0.84
0.98
Harrisimemna trisignata1 Harrisimemna trisignata2 1.00
Comachara cadburyi Polygrammate hebraeicum1 Polygrammate hebraeicum2 1.00 1.00
Cerma cerintha1 Cerma cerintha2 1.00
Cerma cora2 Cerma cora1 1.00 1.00
0.88 0.69
0.58
0.96
COI, 657 bp MrBayes, GTR+G+I, 3 million generations Partitioned by codon
Cerma
Harrisimemna
Acronicta dactylina1
1.00

0.1
Plusia putnami Eudryas grata
Harrisimemna trisignata1 Harrisimemna trisignata2 1.00
Acronicta funeralis1 Acronicta funeralis2 1.00
Acronicta retardata1 Acronicta retardata2 1.00
Acronicta americana1 Acronicta americana2 1.00 Acronicta dactylina1 Acronicta dactylina2 1.00 1.00
Acronicta oblinita1 Acronicta oblinita2 1.00
Simyra henrici1 Simyra henrici2 1.00
0.96 Comachara cadburyi
Polygrammate hebraeicum1 Polygrammate hebraeicum2 1.00 1.00
Cerma cerintha1 Cerma cerintha2 1.00
Cerma cora2 Cerma cora1 1.00 0.99
0.95
Acronicta afflicta Raphia frater
Panthea acronyctoides 0.93 0.70 Acronicta interrupta
Acronicta hasta1 Acronicta hasta2 0.99 1.00 Acronicta lobeliae
Acronicta superans1 Acronicta superans2 1.00 0.65 1.00
Acronicta fragilis1 Acronicta fragilis2 1.00
Miracavira brillians Acronicta vinnula1 Acronicta vinnula2 1.00
Acronicta grisea1 Acronicta grisea2 1.00 0.50
0.51
0.63
0.77
COI, 657 bp MrBayes, GTR+G+I, 6 million generations Partitioned by codon
Harrisimemna
Cerma
unfortunately position of Harrisimena proved unstable!

(common for species-level analyses in large, unstudied families) * use multiple outgroups * perform sensitivity analysis - if results stable to outgroup addition, phylogeny is more believable * sometimes have to eliminate rogue taxon * if sister group too distant explore assigning FIG's and FOG's
(assigning functional in group and functional outgroup from your ingroup taxa)
- for example, if you have an idea about which ingroup is likely to be sister to rest of the members in your analysis, based on
biogeography, fossil data, unusual characters, etc.
When Relationships Around Ingroup are Poorly Understood

Character Weighting * some characters are more valuable than others and
could be accorded greater weight in our analyses coding versus non-coding regions; synonymous versus
non-synonymous substitutions * but how you go about determining weights can get
subjective esp. for morphological characters a priori – done before the analysis a posteriori – after the analysis, re-weigh characters
relative to the amount of homoplasy they show; rerun analysis

Homoplasy: Character Conflict * In a perfect world each character evolves only once (i.e., map onto
the tree at a single position) and all our phylogenetic algorithms will allow us to reconstruct the tree of life correctly. But in essentially all molecular and larger morphological data sets, many characters map on in more than one spot.
* Sources of character conflict: (1) incorrect homology decisions (2) homoplasy a. reversal b. parallelism c. convergence

Homoplasy
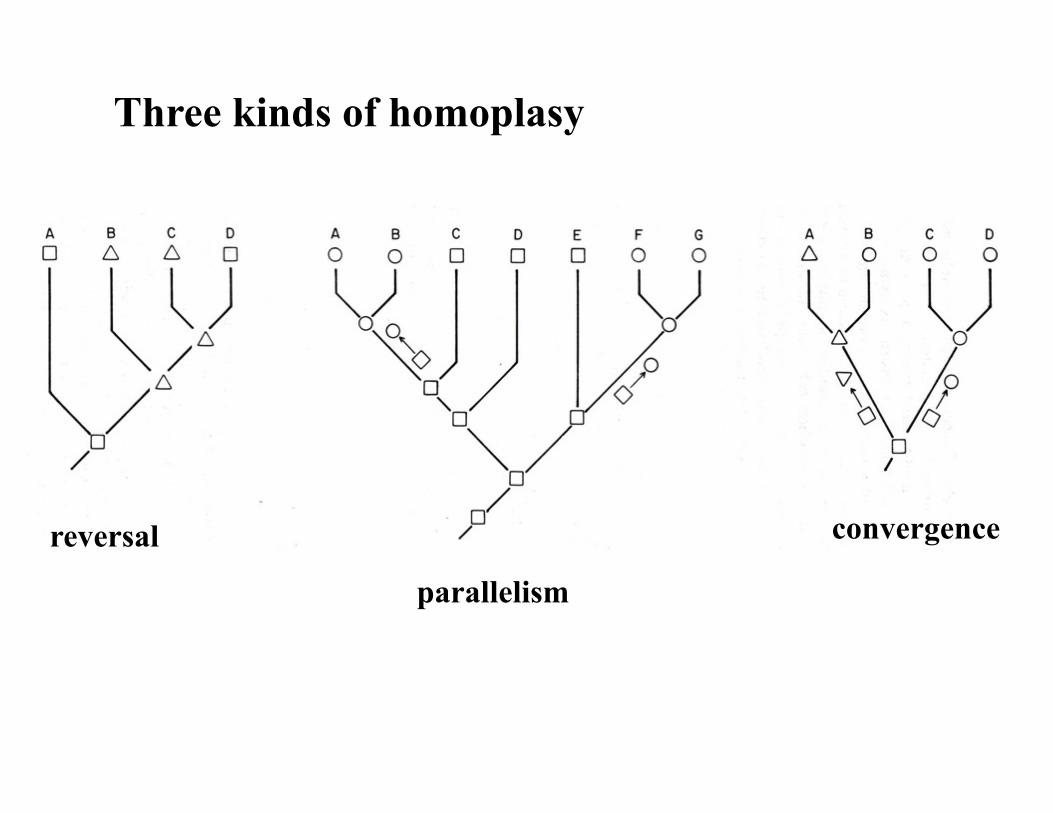
Three kinds of homoplasy
reversal
parallelism
convergence