Embed Size (px)
Citation preview
7/27/2019 CHAPTER_7-consolidation_new.ppt
http://slidepdf.com/reader/full/chapter7-consolidationnewppt 1/22
CONSOLIDATION
7/27/2019 CHAPTER_7-consolidation_new.ppt
http://slidepdf.com/reader/full/chapter7-consolidationnewppt 2/22
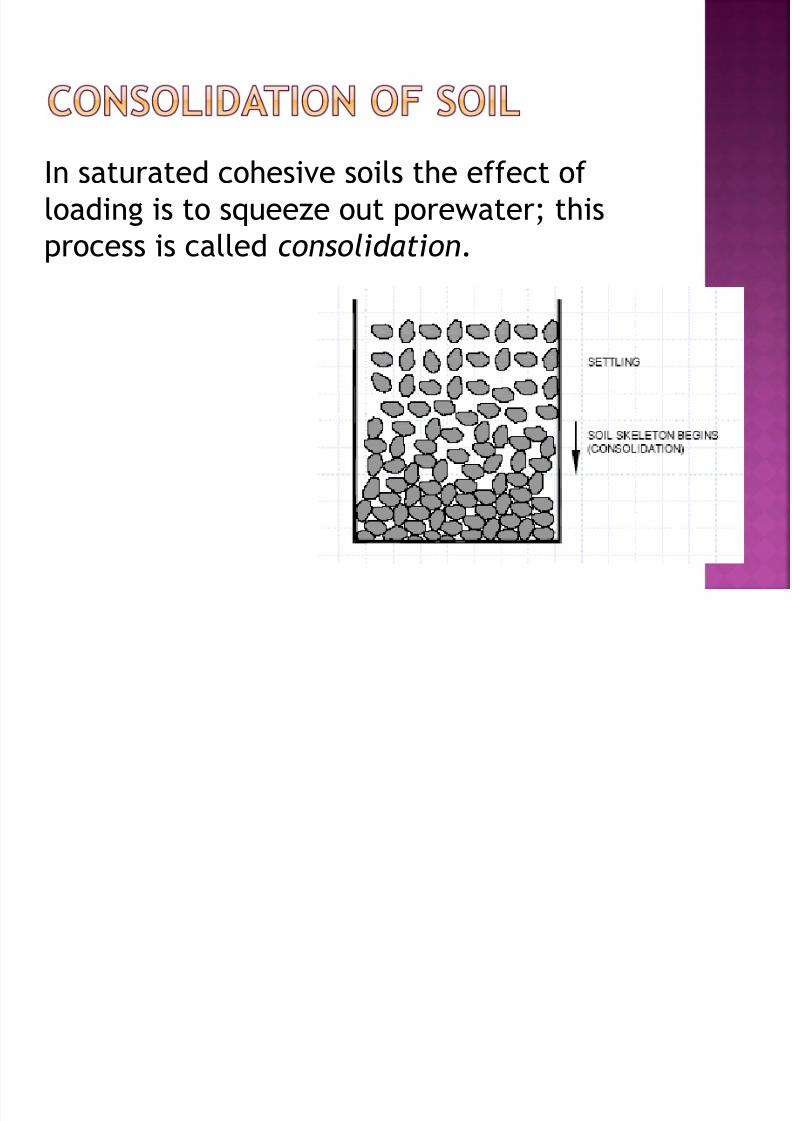
In saturated cohesive soils the effect of
loading is to squeeze out porewater; this
process is called consolidation.
7/27/2019 CHAPTER_7-consolidation_new.ppt
http://slidepdf.com/reader/full/chapter7-consolidationnewppt 3/22
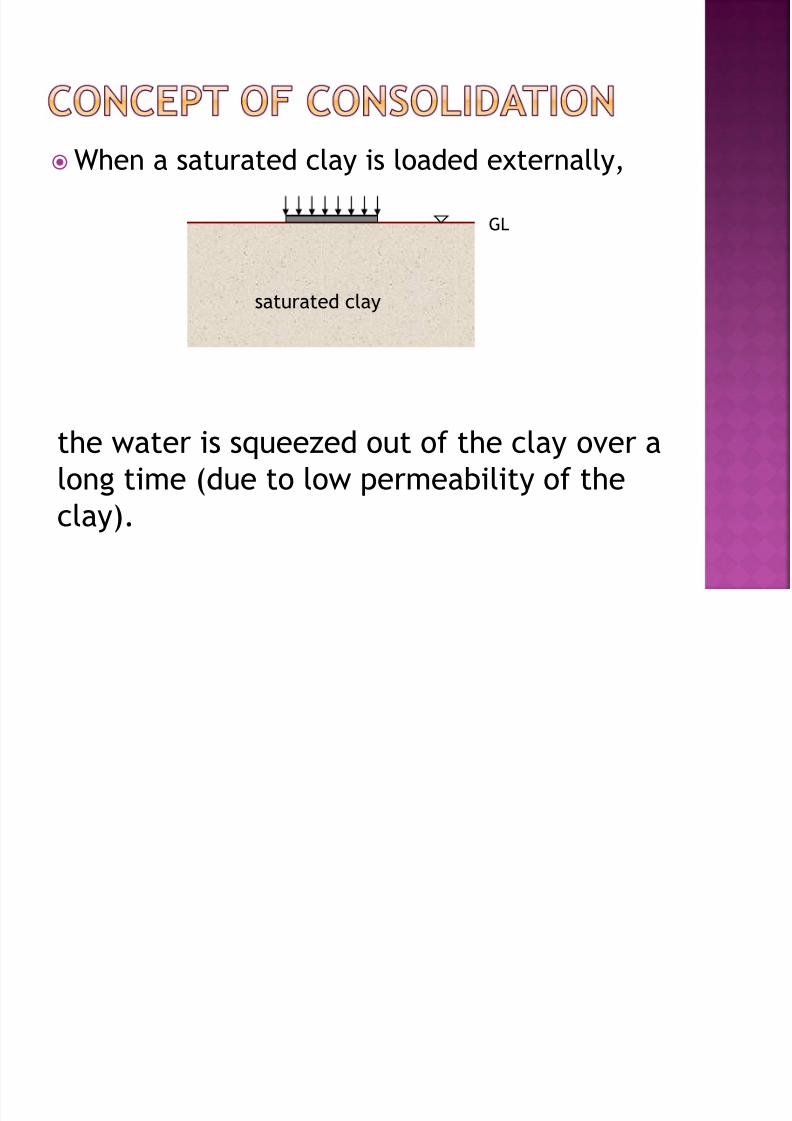
When a saturated clay is loaded externally,
saturated clay
GL
the water is squeezed out of the clay over a
long time (due to low permeability of the
clay).

7/27/2019 CHAPTER_7-consolidation_new.ppt
http://slidepdf.com/reader/full/chapter7-consolidationnewppt 4/22
4
This leads to settlements occurring over a
long time,
which could be several years.
time
s e t t l e m e n t
7/27/2019 CHAPTER_7-consolidation_new.ppt
http://slidepdf.com/reader/full/chapter7-consolidationnewppt 5/22
5
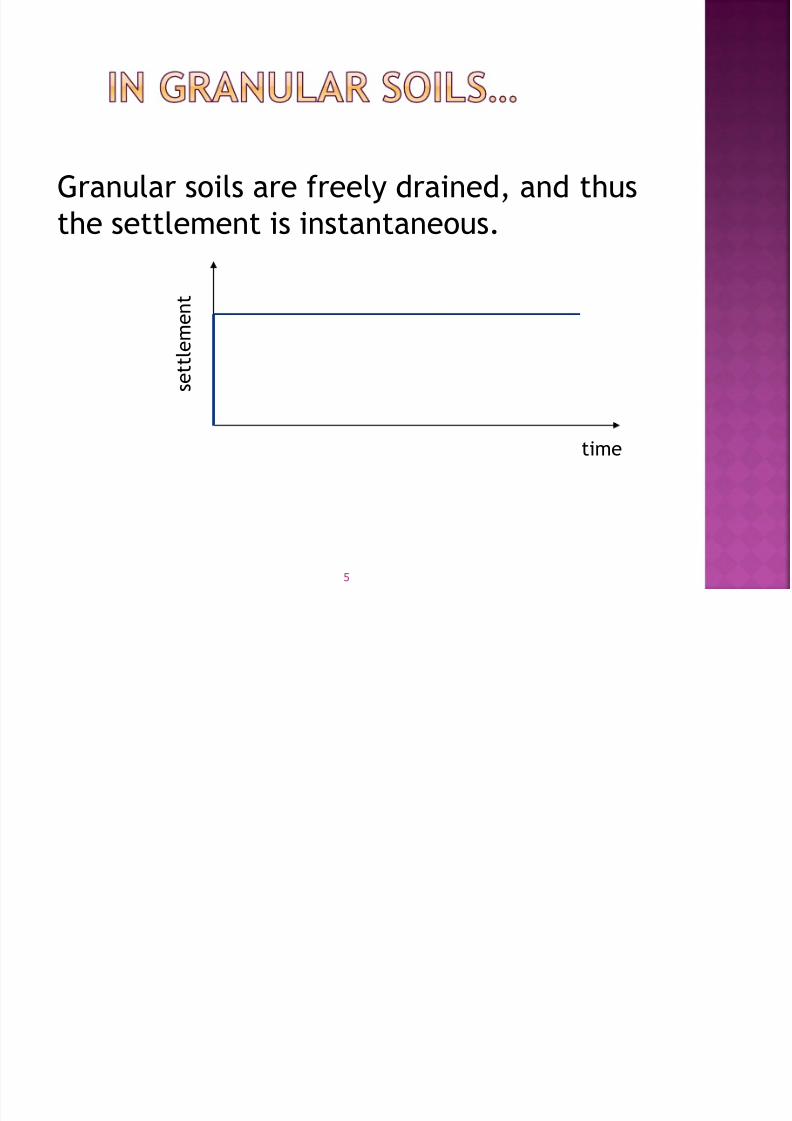
Granular soils are freely drained, and thus
the settlement is instantaneous.
time
s e t t l e m e n t
7/27/2019 CHAPTER_7-consolidation_new.ppt
http://slidepdf.com/reader/full/chapter7-consolidationnewppt 6/22
7/27/2019 CHAPTER_7-consolidation_new.ppt
http://slidepdf.com/reader/full/chapter7-consolidationnewppt 7/22
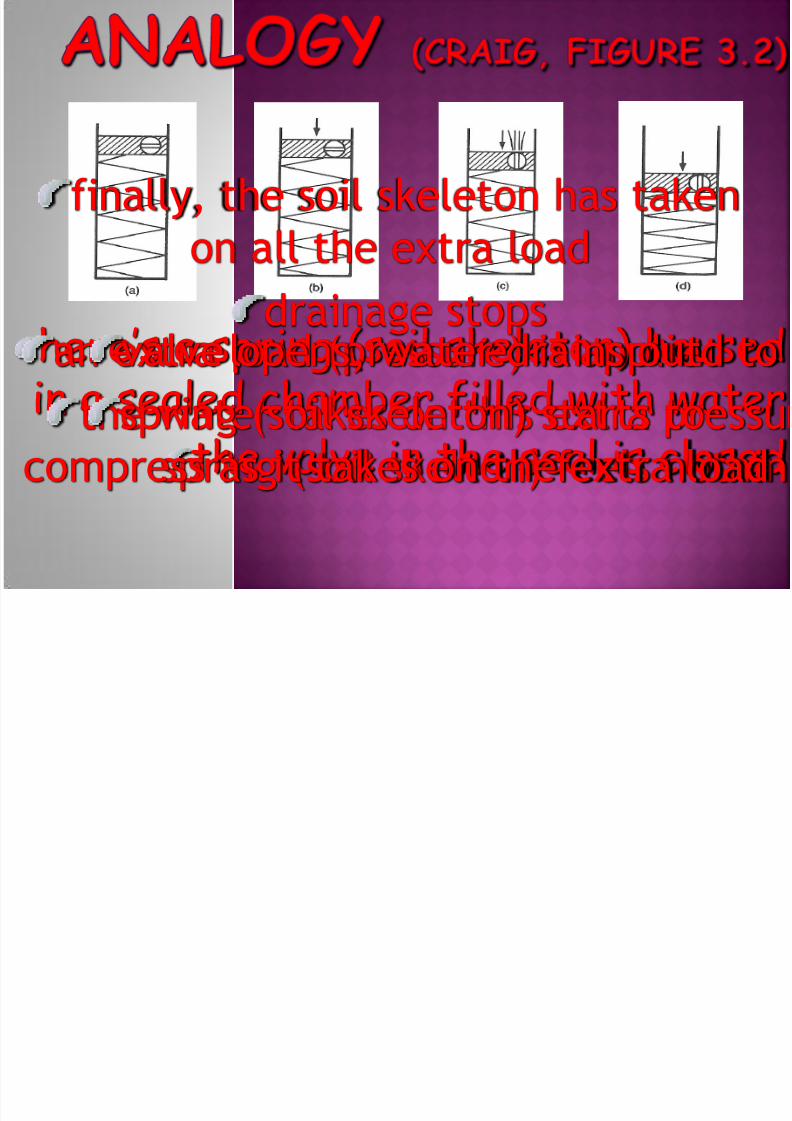
here’s a spring (soil skeleton) housed
in a sealed chamber filled with waterthe valve in the seal is closed
an extra load (pressure) is applied to
the water takes on this extra pressuspring (soil skelton) feels nothin
valve opens, water drains out
spring (soil skeleton) starts tocompress as it takes on the extra load
finally, the soil skeleton has taken
on all the extra load
drainage stops
7/27/2019 CHAPTER_7-consolidation_new.ppt
http://slidepdf.com/reader/full/chapter7-consolidationnewppt 8/22
From this analogy, the process of
consolidation involves three main features :
A) Flow of water
B) Compression
C) Displacement pressure
7/27/2019 CHAPTER_7-consolidation_new.ppt
http://slidepdf.com/reader/full/chapter7-consolidationnewppt 9/22
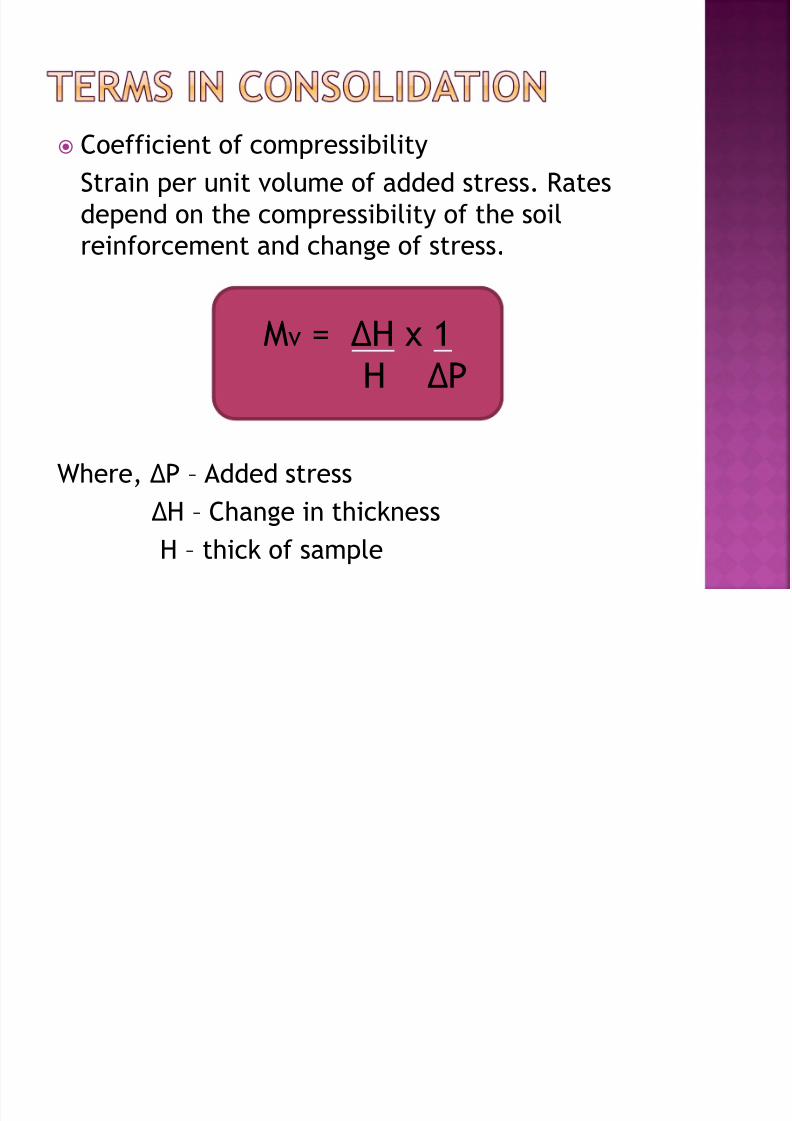
Coefficient of compressibility
Strain per unit volume of added stress. Rates
depend on the compressibility of the soil
reinforcement and change of stress.
Where, ∆P – Added stress
∆H – Change in thickness
H – thick of sample
Mv = ∆H x 1
H ∆P
7/27/2019 CHAPTER_7-consolidation_new.ppt
http://slidepdf.com/reader/full/chapter7-consolidationnewppt 10/22
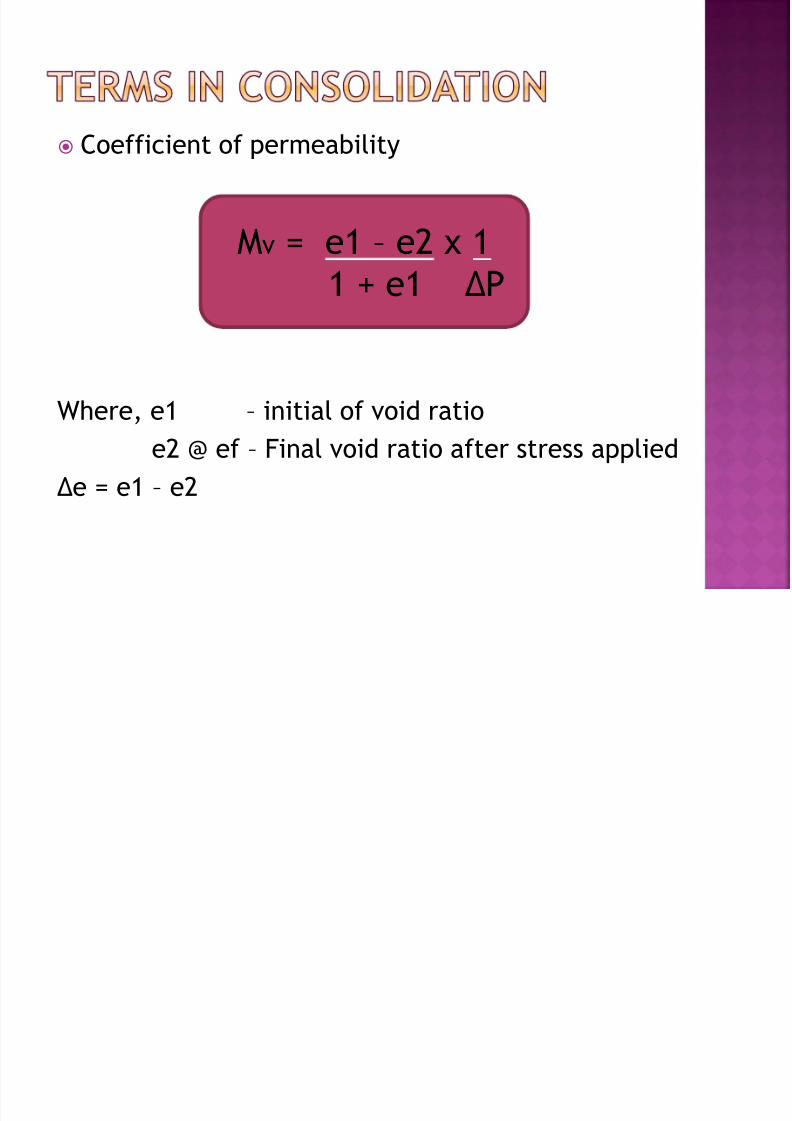
Coefficient of permeability
Where, e1 – initial of void ratioe2 @ ef – Final void ratio after stress applied
Δe = e1 – e2
Mv = e1 – e2 x 1
1 + e1 ∆P
7/27/2019 CHAPTER_7-consolidation_new.ppt
http://slidepdf.com/reader/full/chapter7-consolidationnewppt 11/22
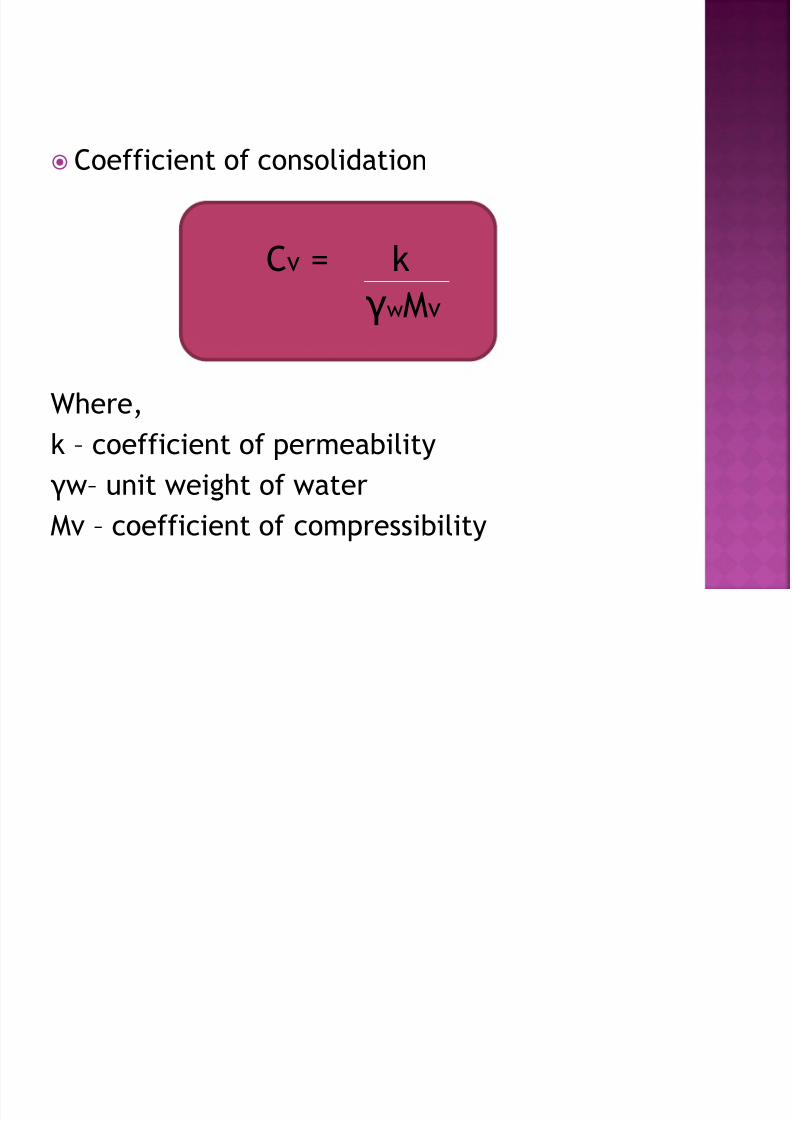
Coefficient of consolidation
Where,k – coefficient of permeability
γw– unit weight of water
Mv – coefficient of compressibility
Cv
= kγwMv
7/27/2019 CHAPTER_7-consolidation_new.ppt
http://slidepdf.com/reader/full/chapter7-consolidationnewppt 12/22
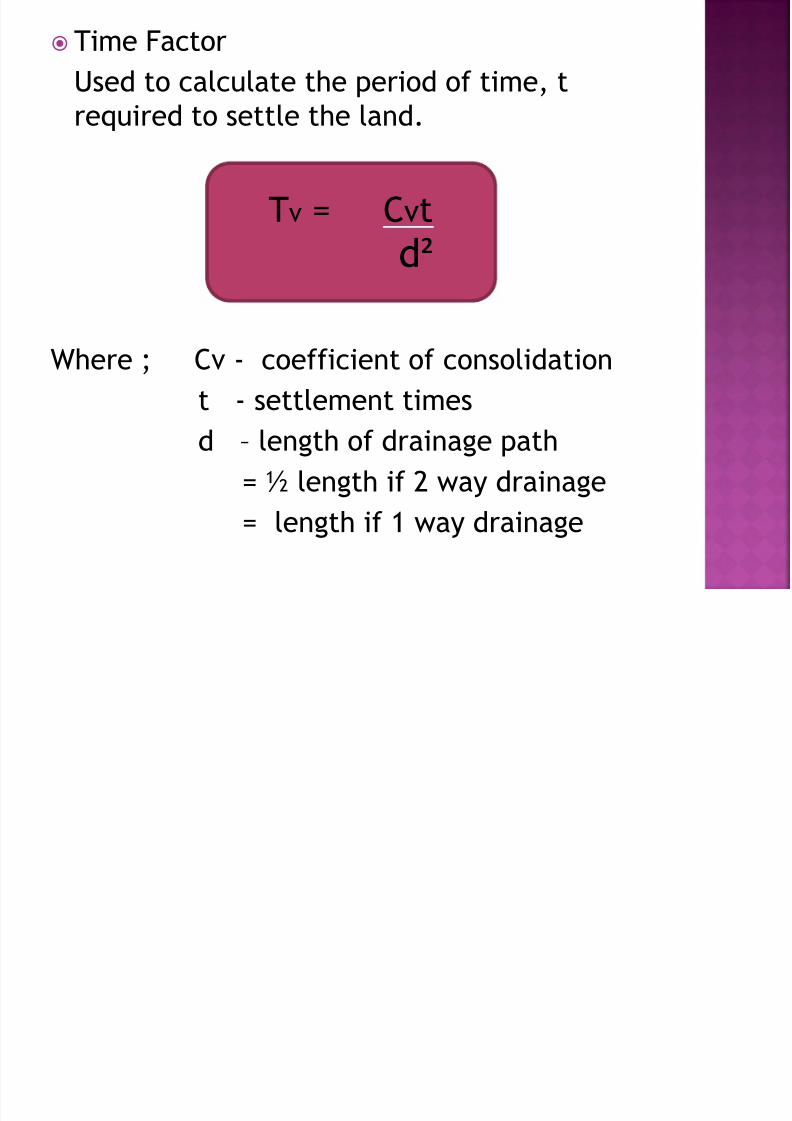
Time Factor
Used to calculate the period of time, t
required to settle the land.
Where ; Cv - coefficient of consolidation
t - settlement timesd – length of drainage path
= ½ length if 2 way drainage
= length if 1 way drainage
Tv = Cvt
d²
7/27/2019 CHAPTER_7-consolidation_new.ppt
http://slidepdf.com/reader/full/chapter7-consolidationnewppt 13/22
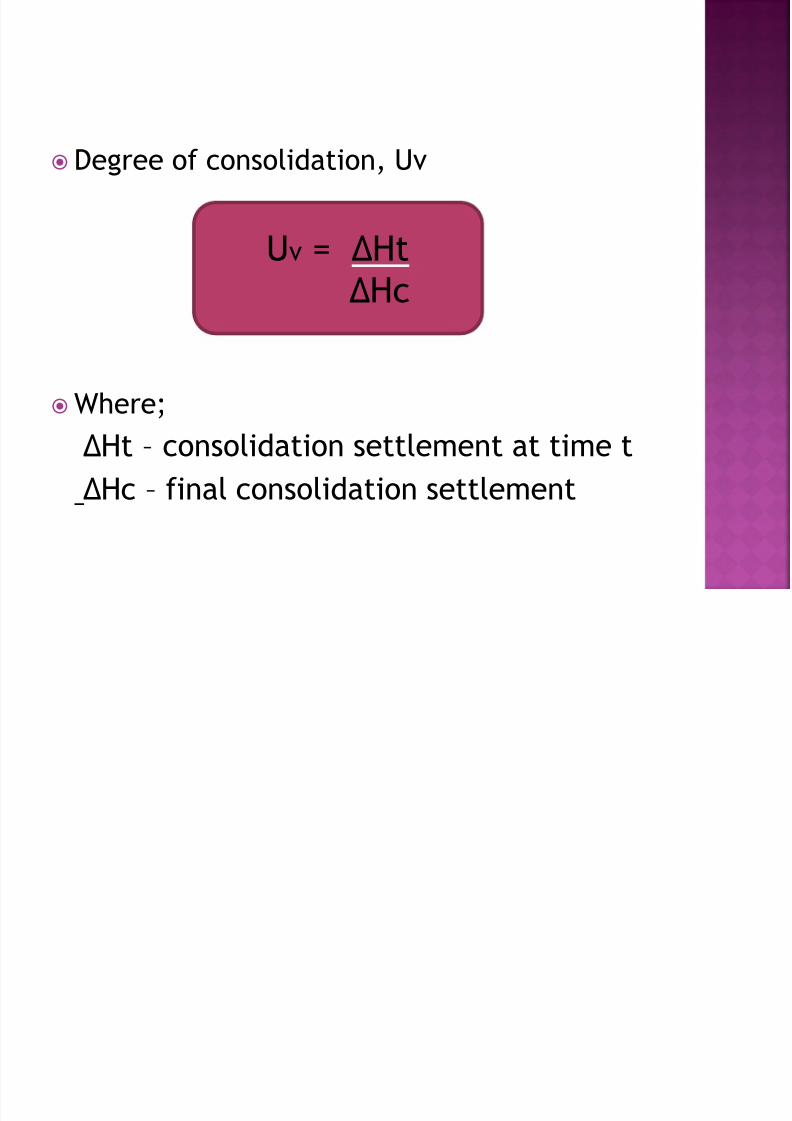
Degree of consolidation, Uv
Where;∆Ht – consolidation settlement at time t
∆Hc – final consolidation settlement
Uv = ∆Ht
∆Hc
7/27/2019 CHAPTER_7-consolidation_new.ppt
http://slidepdf.com/reader/full/chapter7-consolidationnewppt 14/22
Refers to the vertical downwarddisplacement at the base of a
foundation or other structure due to
ground movement.
7/27/2019 CHAPTER_7-consolidation_new.ppt
http://slidepdf.com/reader/full/chapter7-consolidationnewppt 15/2215
7/27/2019 CHAPTER_7-consolidation_new.ppt
http://slidepdf.com/reader/full/chapter7-consolidationnewppt 16/2216
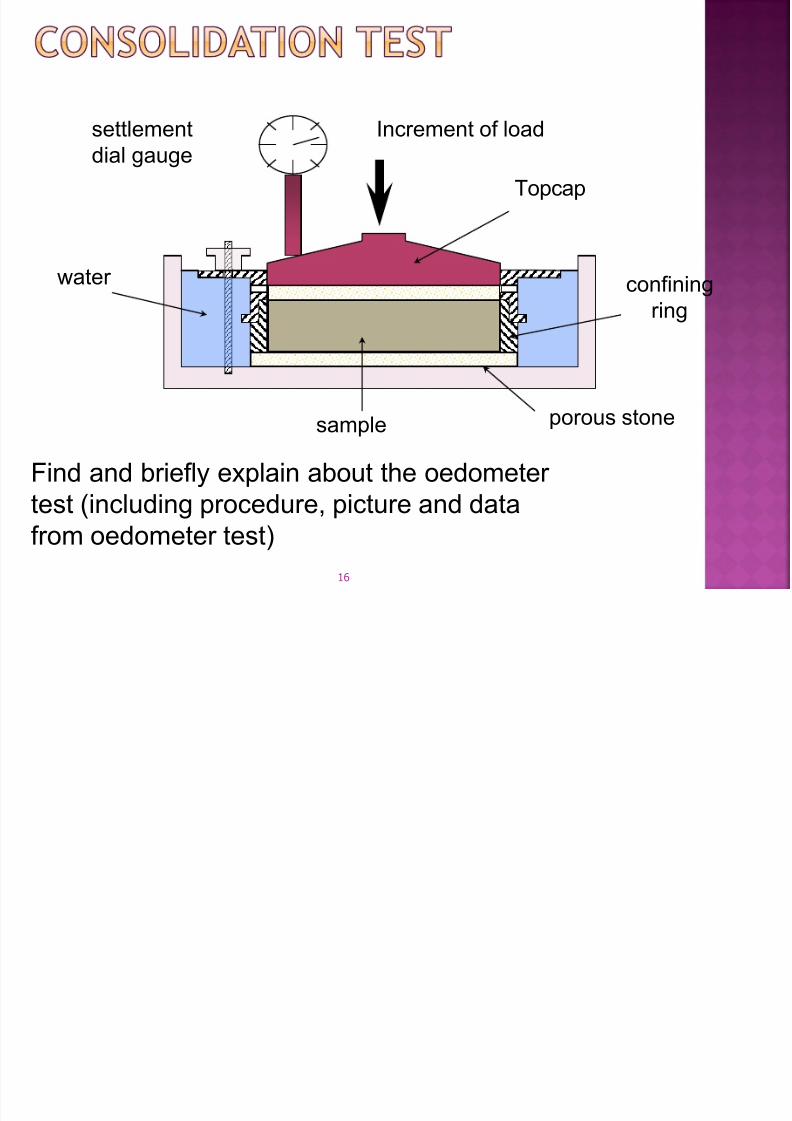
Increment of load
Topcap
porous stonesample
water confiningring
settlementdial gauge
Find and briefly explain about the oedometer
test (including procedure, picture and data
from oedometer test)

7/27/2019 CHAPTER_7-consolidation_new.ppt
http://slidepdf.com/reader/full/chapter7-consolidationnewppt 17/22
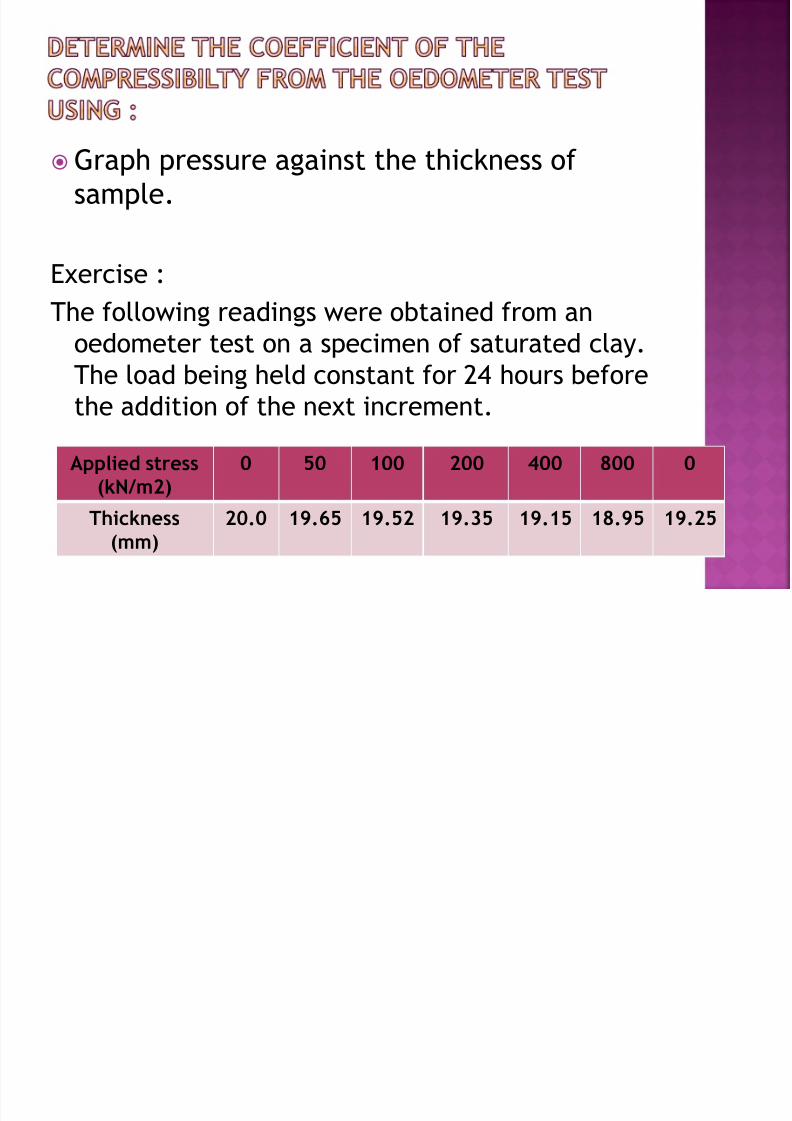
Graph pressure against the thickness of
sample.
Example :The following readings were obtained from an
oedometer test on a specimen of saturated clay.
The load being held constant for 24 hours before
the addition of the next increment.
Applied stress(kN/m2)
0 50 100 200 400 800 0
Thickness(mm)
25.0 24.6 24.4 24.2 23.9 23.7 24.2
7/27/2019 CHAPTER_7-consolidation_new.ppt
http://slidepdf.com/reader/full/chapter7-consolidationnewppt 18/22
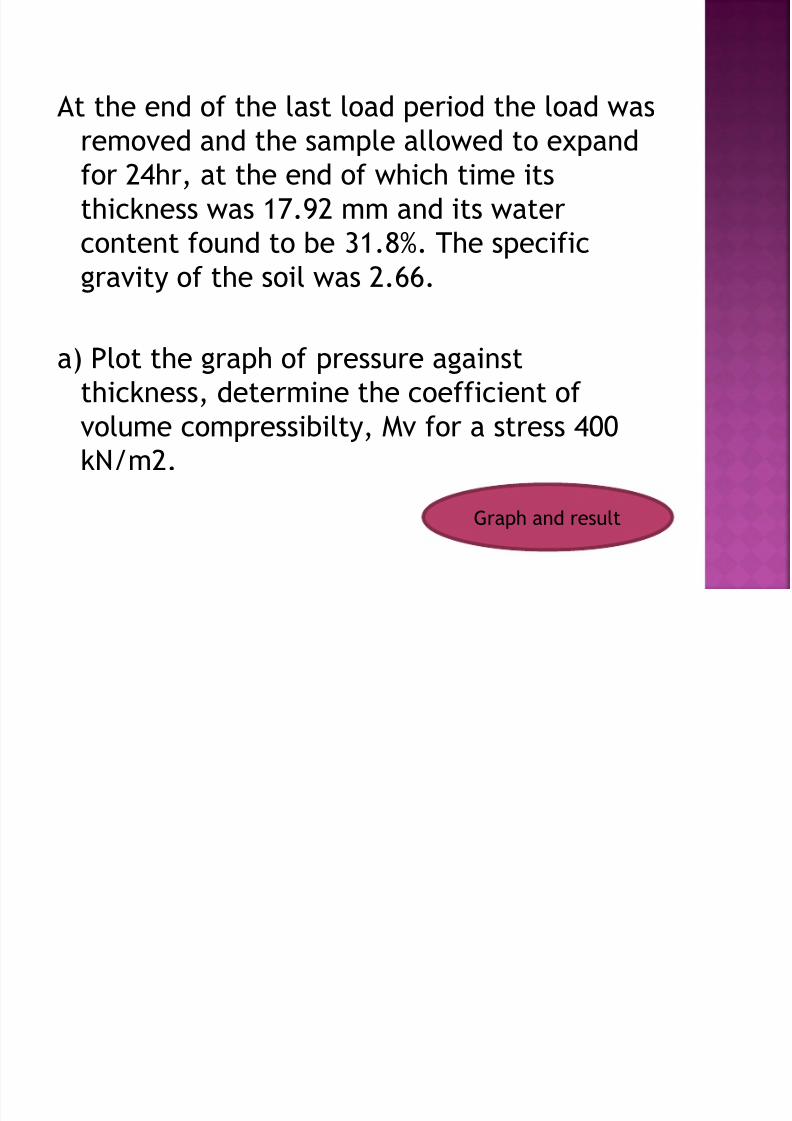
At the end of the last load period the load was
removed and the sample allowed to expandfor 24hr, at the end of which time its
thickness was 17.92 mm and its water
content found to be 31.8%. The specific
gravity of the soil was 2.66.
a) Plot the graph of pressure against
thickness, determine the coefficient of
volume compressibilty, Mv for a stress 400kN/m2.
Graph and result
7/27/2019 CHAPTER_7-consolidation_new.ppt
http://slidepdf.com/reader/full/chapter7-consolidationnewppt 19/22
Graph pressure against the thickness of
sample.
Exercise :The following readings were obtained from an
oedometer test on a specimen of saturated clay.
The load being held constant for 24 hours before
the addition of the next increment.
Applied stress(kN/m2)
0 50 100 200 400 800 0
Thickness(mm)
20.0 19.65 19.52 19.35 19.15 18.95 19.25
7/27/2019 CHAPTER_7-consolidation_new.ppt
http://slidepdf.com/reader/full/chapter7-consolidationnewppt 20/22
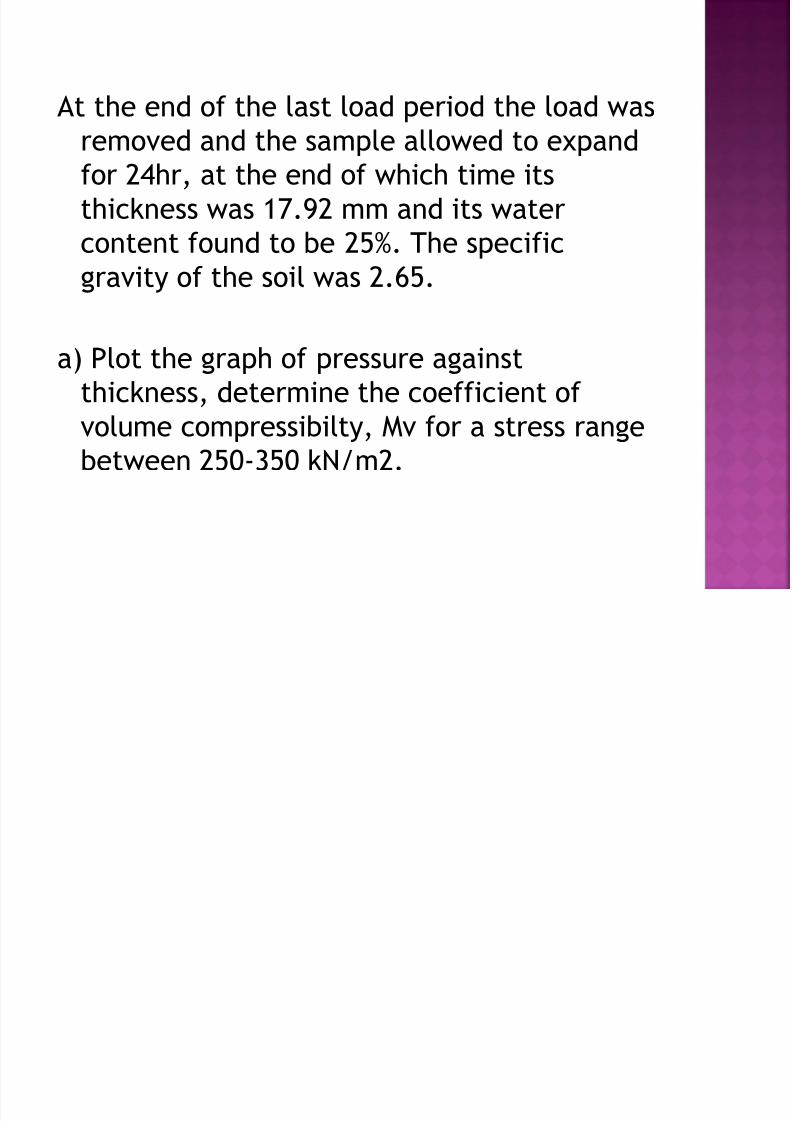
At the end of the last load period the load was
removed and the sample allowed to expandfor 24hr, at the end of which time its
thickness was 17.92 mm and its water
content found to be 25%. The specific
gravity of the soil was 2.65.
a) Plot the graph of pressure against
thickness, determine the coefficient of
volume compressibilty, Mv for a stress rangebetween 250-350 kN/m2.
7/27/2019 CHAPTER_7-consolidation_new.ppt
http://slidepdf.com/reader/full/chapter7-consolidationnewppt 21/22
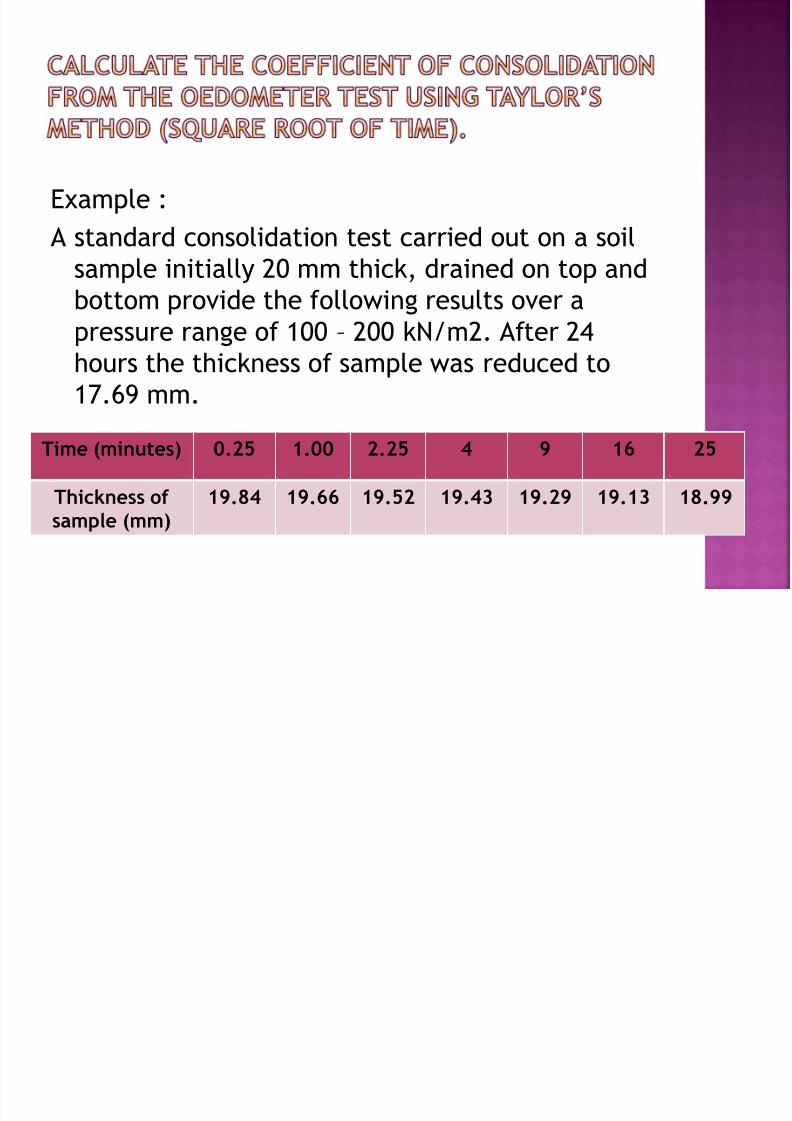
Example :
A standard consolidation test carried out on a soil
sample initially 20 mm thick, drained on top andbottom provide the following results over a
pressure range of 100 – 200 kN/m2. After 24
hours the thickness of sample was reduced to
17.69 mm.
Time (minutes) 0.25 1.00 2.25 4 9 16 25
Thickness ofsample (mm)
19.84 19.66 19.52 19.43 19.29 19.13 18.99
7/27/2019 CHAPTER_7-consolidation_new.ppt
http://slidepdf.com/reader/full/chapter7-consolidationnewppt 22/22
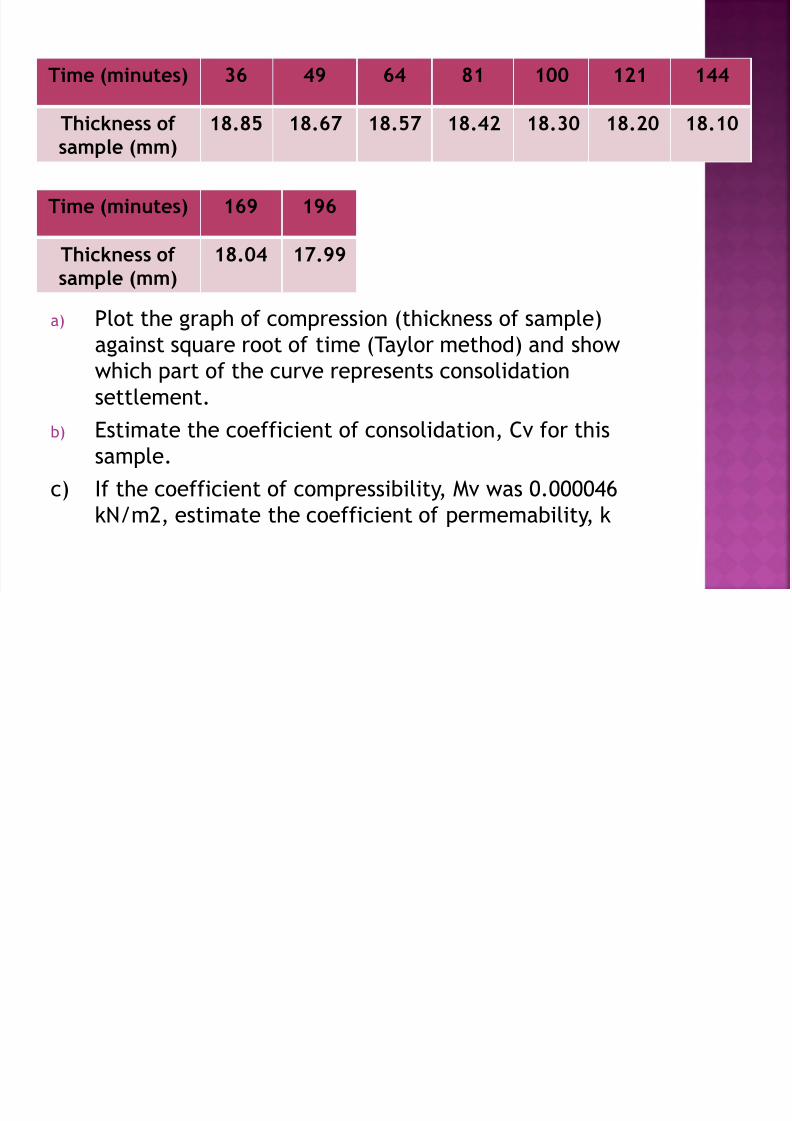
a) Plot the graph of compression (thickness of sample)
against square root of time (Taylor method) and show
which part of the curve represents consolidation
settlement.
b) Estimate the coefficient of consolidation, Cv for this
sample.
c) If the coefficient of compressibility, Mv was 0.000046
kN/m2, estimate the coefficient of permemability, k
Time (minutes) 36 49 64 81 100 121 144
Thickness of
sample (mm)
18.85 18.67 18.57 18.42 18.30 18.20 18.10
Time (minutes) 169 196
Thickness of
sample (mm)
18.04 17.99