Embed Size (px)
Citation preview
CHAPTER 6
STUDIES ON ONE WAY RESTRAINED SLABS
6.1 GENERAL
In this chapter the experimental investigation on one way SFRCC slabs with two short
edges restrained is discussed. Specimens with 0.5%, 0.75% fibres and without fibres
were cast and tested under uniformly distributed load. The influence of fibres in
enhancing load carrying capacity, reducing deflection and crack width, improving
engineering properties like ductility, energy absorption capacity were investigated.
For comparison, similar CVC slabs were also studied. The details of fabrication done
for providing fixity, reinforcement for slabs, casting and testing of slabs are discussed
in the following sections.
6.2 EXPERIMENTAL PROGRAMME
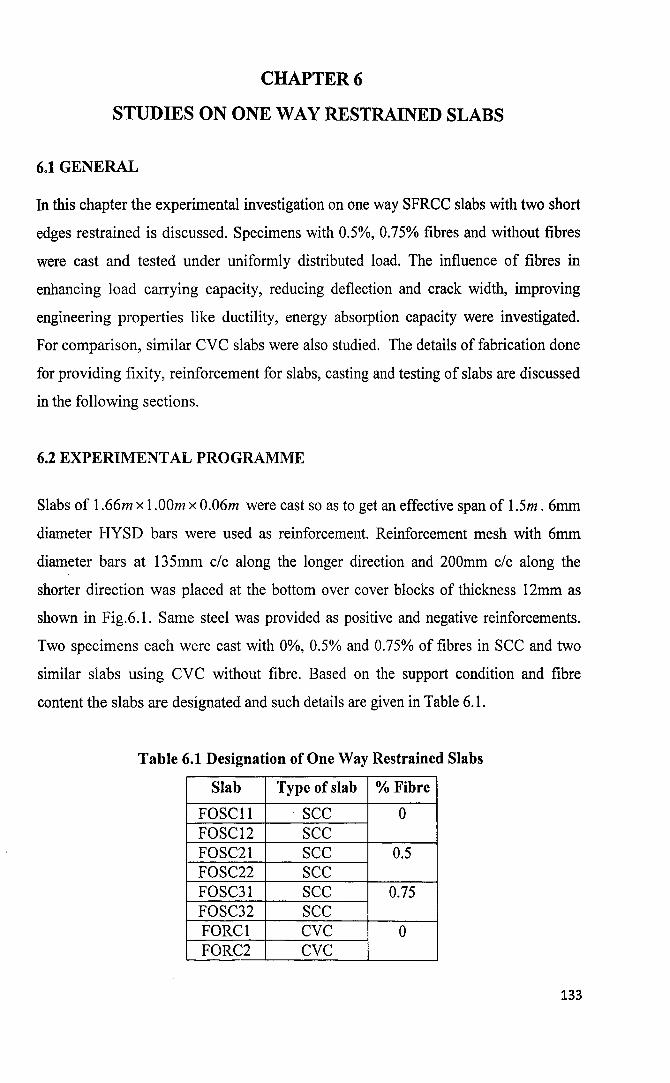
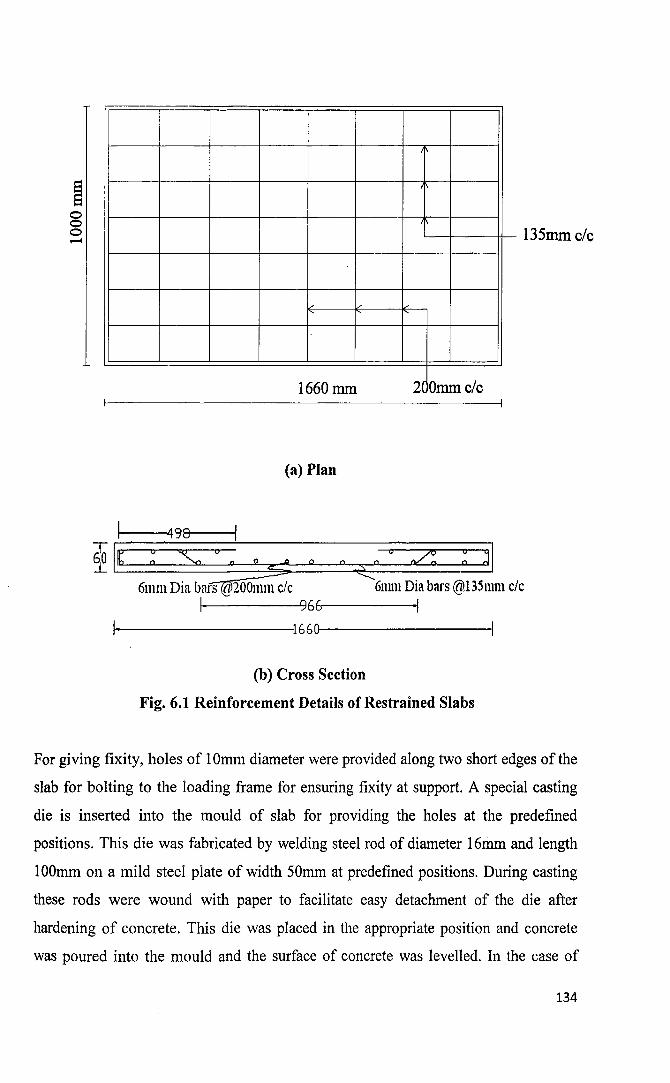
Slabs of 1.66m x 1.00m x 0.06m were cast so as to get an effective span of 1.5m . 6mm
diameter HYSD bars were used as reinforcement. Reinforcement mesh with 6mm
diameter bars at 135mm c/c along the longer direction and 200mm c/c along the
shorter direction was placed at the bottom over cover blocks of thickness 12mm as
shown in Fig.6.1. Same steel was provided as positive and negative reinforcements.
Two specimens each were cast with 0%, 0.5% and 0.75% of fibres in SCC and two
similar slabs using CVC without fibre. Based on the support condition and fibre
content the slabs are designated and such details are given in Table 6.1.
Table 6.1 Designation of One Way Restrained Slabs
Slab Type of slab % Fibre
FOSCII SCC 0FOSC12 SCCFOSC21 SCC 0.5FOSC22 SCCFOSC31 SCC 0.75FOSC32 SCCFORCI CVC 0FORC2 CVC
133
8o-
" "
1660mm 2( Ommc/c
(a) Plan
---449H-8--T60
r.;=::::;:::::;;;::::=:;=~----------=::::;::==;;::::::::::;;::::::;]
I. ~:::::===~==~o~~==~~==~====~
135mmc/c
6111111 Dia bars a200111m clc 6111111 Dia bars @135mlll clcI 96f-r-G----II
1-----------'16601----------1
(b) Cross Section
Fig. 6.1 Reinforcement Details of Restrained Slabs
For giving fixity, holes of 10mm diameter were provided along two short edges of the
slab for bolting to the loading frame for ensuring fixity at support. A special casting
die is inserted into the mould of slab for providing the holes at the predefined
positions. This die was fabricated by welding steel rod of diameter 16mm and length
100mm on a mild steel plate of width 50mm at predefined positions. During casting
these rods were wound with paper to facilitate easy detachment of the die after
hardening of concrete. This die was placed in the appropriate position and concrete
was poured into the mould and the surface of concrete was levelled. In the case of
134
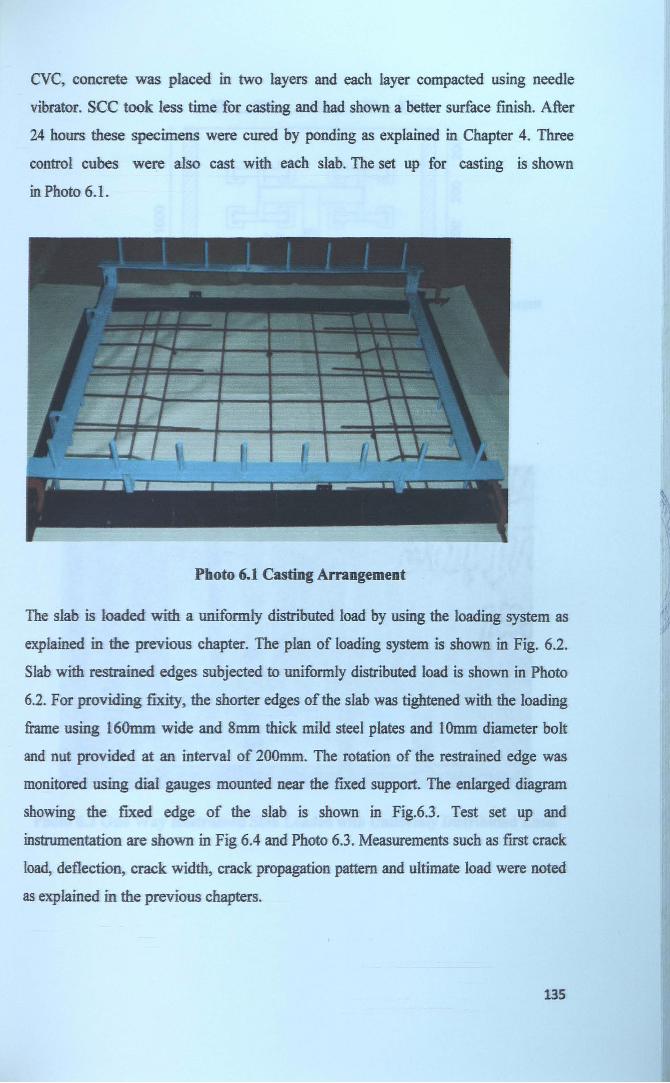
eve, concrete was placed in two layers and each layer compacted using needle
vibrator. see took less time for casting and had shown a better surface fInish. After
24 hours these specimens were cured by ponding as explained in Chapter 4. Three
control cubes were also cast with each slab. The set up for casting is shown
in Photo 6.1.
Photo 6.1 Casting Arrangement
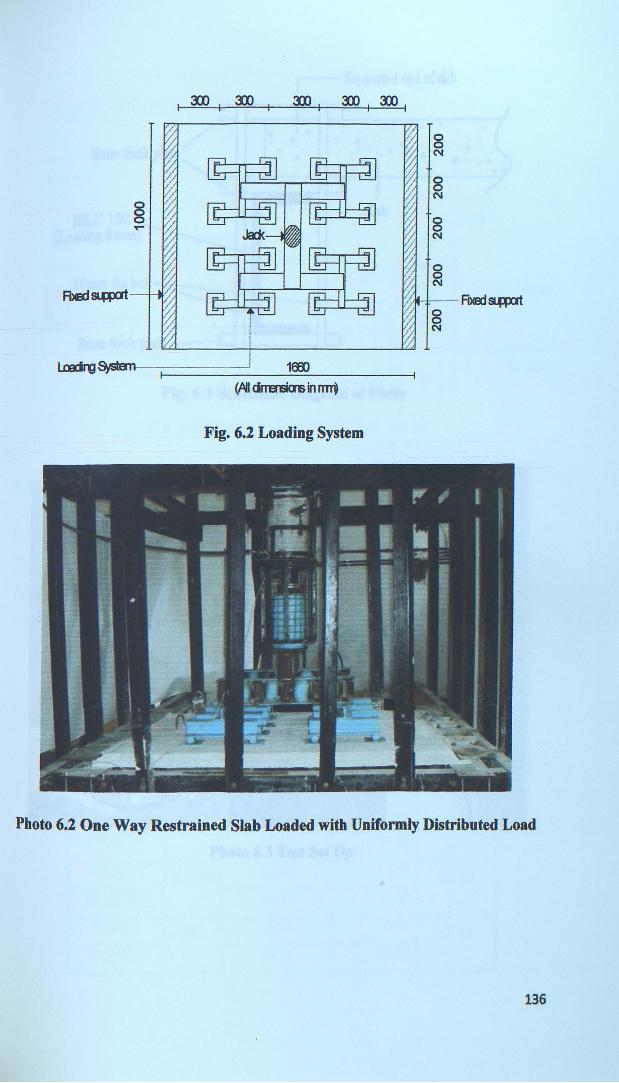
The slab is loaded with a uniformly distributed load by using the loading system as
explained in the previous chapter. The plan of loading system is shown in Fig. 6.2.
Slab with restrained edges subjected to uniformly distributed load is shown in Photo
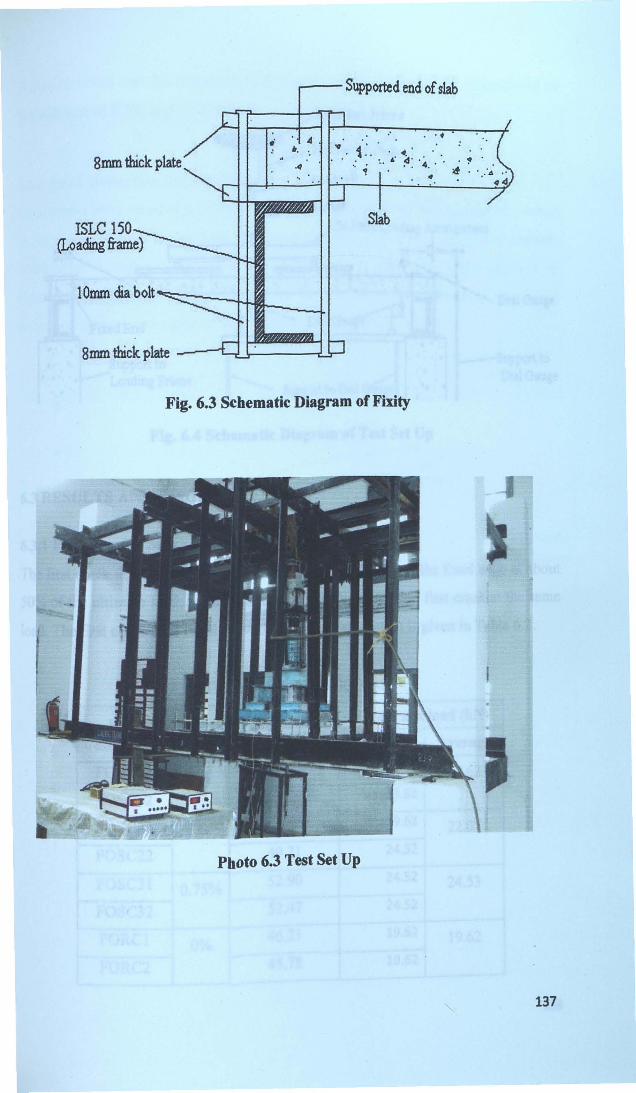
6.2. For providing fixity, the shorter edges ofthe slab was tightened with the loading
frame using 160mm wide and 8mm thick mild steel plates and lOmm diameter bolt
and nut provided at an interval of 200mm. The rotation of the restrained edge was
monitored using dial gauges mounted near the fIxed support. The enlarged diagram
showing the fixed edge of the slab is shown in Fig.6.3. Test set up and
instrumentation are shown in Fig 6.4 and Photo 6.3. Measurements such as fIrst crack
load, deflection, crack width, crack propagation pattern and ultimate load were noted
as explained in the previous chapters.
135
8N
8N
I 8N
8N
Ladrg~tfll-~======~__1~EB>~ ---l
(~dn"a1lias in rml
Fig. 6.2 Loading System
Photo 6.2 One Way Restrained Slab Loaded with Uniformly Distributed Load
136
8mm thick plate
ISLe 150(Loading frame)
10mm dia bolt ~:::-----.-J..l ~
--Supported end ofslab
fi . A.. '..4
Slab
8mm thick plate ---L...,LJ,..:.-----.!.J...-J
Fig. 6.3 Schematic Diagram of Fixity
Photo 6.3 Test Set Up
137
••• of ",
SuPPOtt toLoading Frame
------ Support to Dial e:aug; : •"A :.'...... 0··'
Dial Gauge
support toDial Gauge
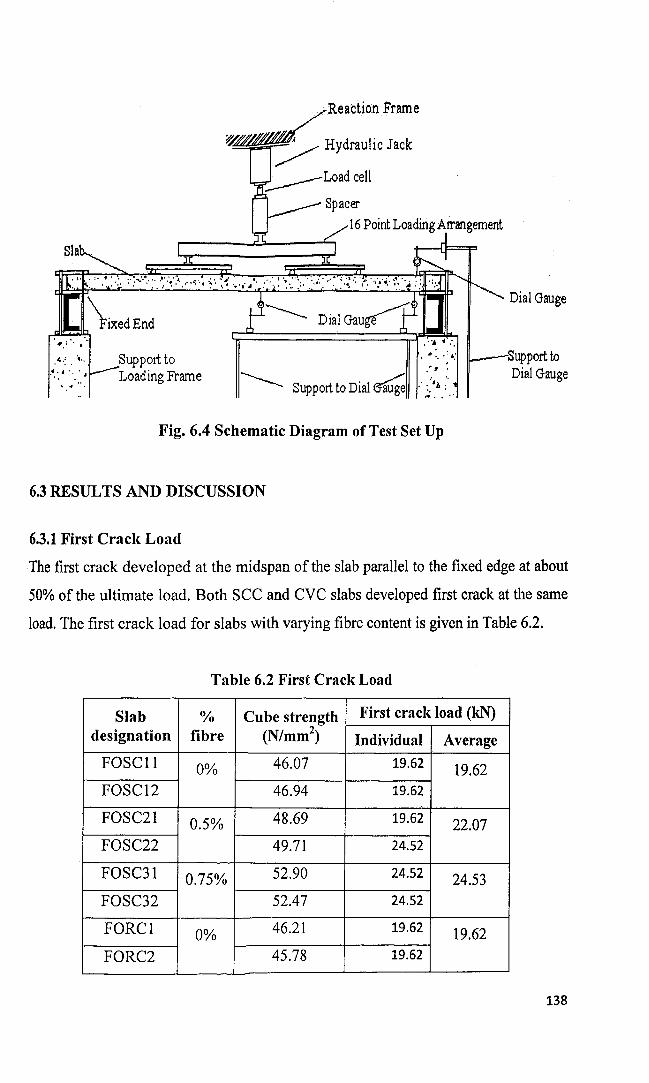
Fig. 6.4 Schematic Diagram of Test Set Up
6.3 RESULTS AND DISCUSSION
6.3.1 First Crack Load
The first crack developed at the midspan of the slab parallel to the fixed edge at about
50% of the ultimate load. Both SCC and CVC slabs developed first crack at the same
load. The first crack load for slabs with varying fibre content is given in Table 6.2.
Table 6.2 First Crack Load
Slab 0/0 Cube strength First crack load (kN)
designation fibre (N/mm2) Individual Average
FOSCII 0% 46.07 19.62 19.62FOSC12 46.94 19.62
FOSC21 0.5% 48.69 19.62 22.07FOSC22 49.71 24.52
FOSC31 0.75% 52.90 24.52 24.53FOSC32 52.47 24.52
FORCI 0% 46.21 19.62 19.62
FORC2 45.78 19.62
138
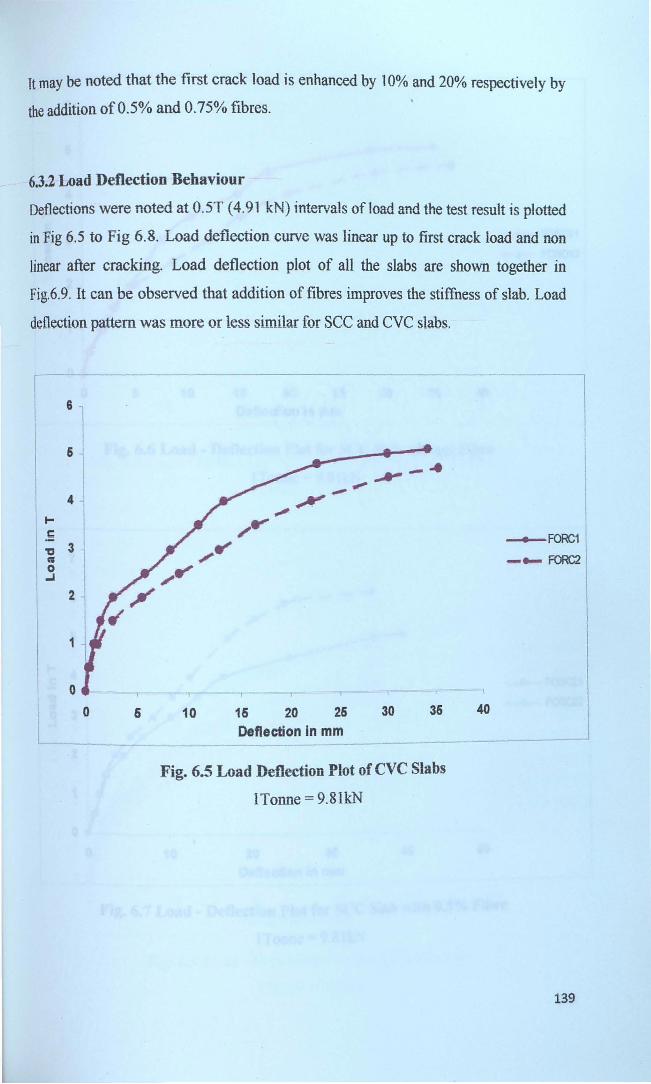
Tt may be noted that the first crack load IS enhanced by 10% and 20% respectIvely by
the addition of 0.5% and 0.75% fibres.
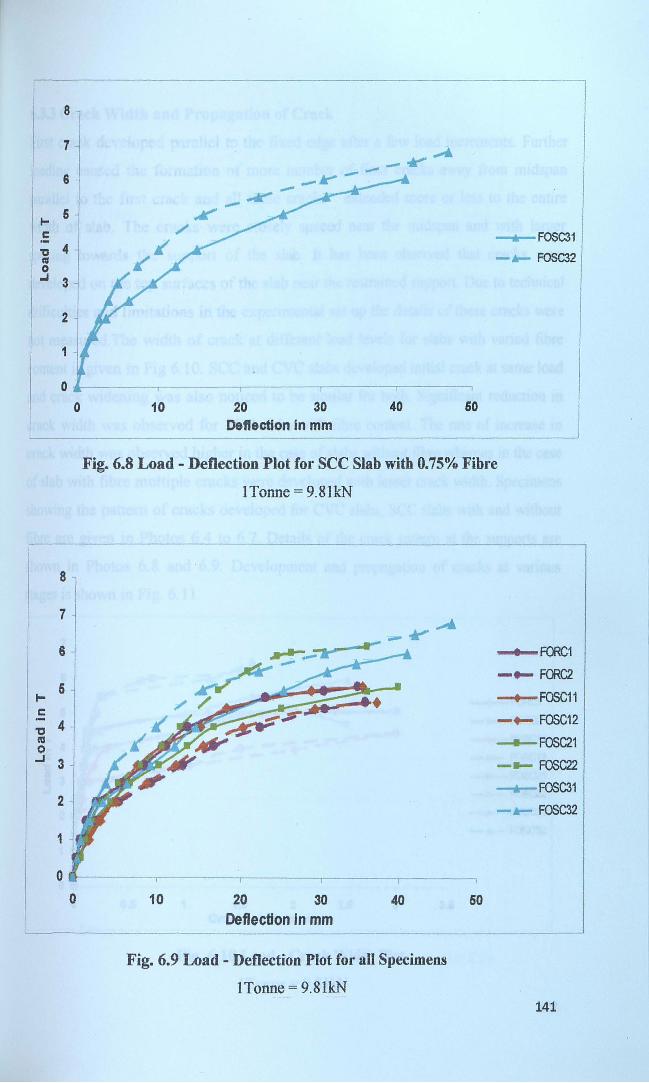
6.3.2 Load Deflection Behaviour
Deflections were noted at O.5T (4.91 kN) 1ntervals ofload and the test result 1s plotted
in Fig 6.5 to Fig 6.8. Load deflection curve was linear up to first crack load and non
linear after cracking. Load deflection plot of all the slabs are shown together in
Fig.6.9. It can be observed that addition of fibres improves the stiffuess of slab. Load
deflection pattern was more or less similar for see and eve slabs.
4
6 -
...e:'tJ 3
,g.J
II
• FORC1 I- ... FORC2
I
4036
- -- ------
15 20 26 30Deflection in mm
105
ool
Fig. 6.5 Load Deflection Plot of eve Slabs
ITonne = 9.81kN
139
--+-FOSC11
-.- F0SC12
40353015 20 25
Deflection in mm10
.... -- ....fIII""'-.--
,.",
/.,/
/"
5
:1I 4
It-&:
'U 3".3
2
1
0
0
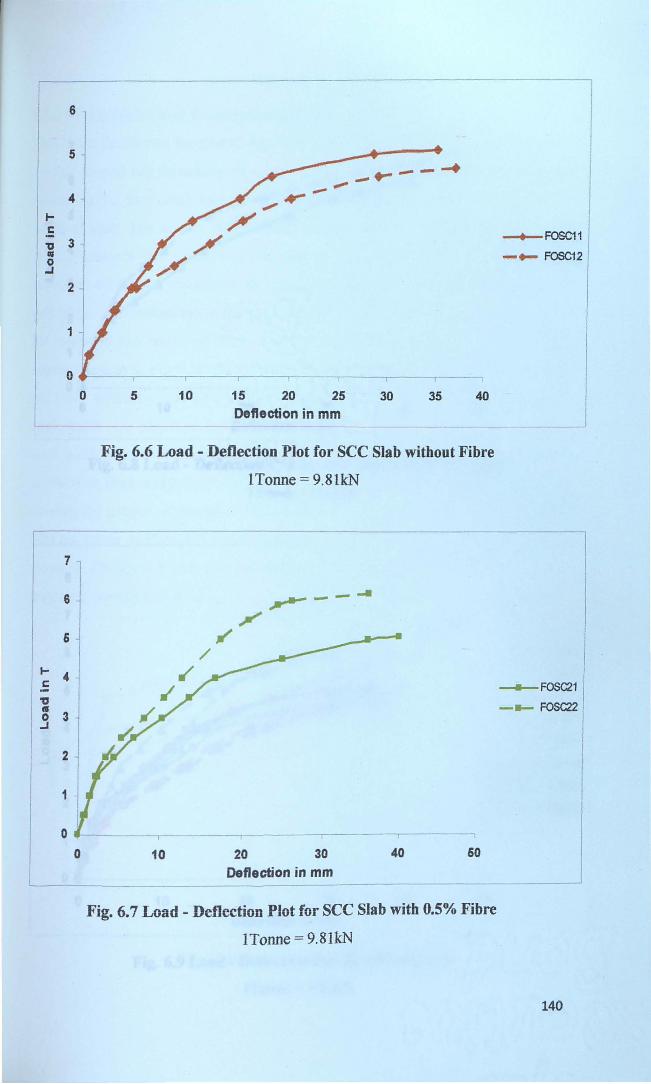
Fig. 6.6 Load - Deflection Plot for sec Slab without Fibre
ITonne = 9.81kN
------,-- ---,.-
,...-----7
6
6
...4
l:.-"CI0 3-'
2
1
0
0 10 20 30Deflection in mm
40 60
lI
__ FOS~1
- ..... F0SC22
- - --------------
Fig. 6.7 Load - Deflection Plot for sec Slab with 0.5% Fibre
1Tonne = 9.81kN
140
8
7_-IJt"' ......
6 -l-
S ¥c /' ---.-FOSC31'tJ 4 ~
-Itt- F0SC32" X0..I 3
2
1
0
0 10 20 30 40 60Deflection in mm
Fig. 6.8 Load - Deflection Plot for see Slab with 0.75% Fibre
1Tonne = 9.81kN
8
7
6
5t-c:'C 4IV0...I 3
2
1
0 ~
I
0 10 20 30
Deflection In mm40 50
.. FORC1
- .... FORC2
--.-FOSC11
-+- FOSC12
• FOSC21
--.- FOSC22
--.-FOSC31
-Itt- FOSC32
---- --- -------
Fig. 6.9 Load - Deflection Plot for all Specimens
1TOIUle = 9.81kN141
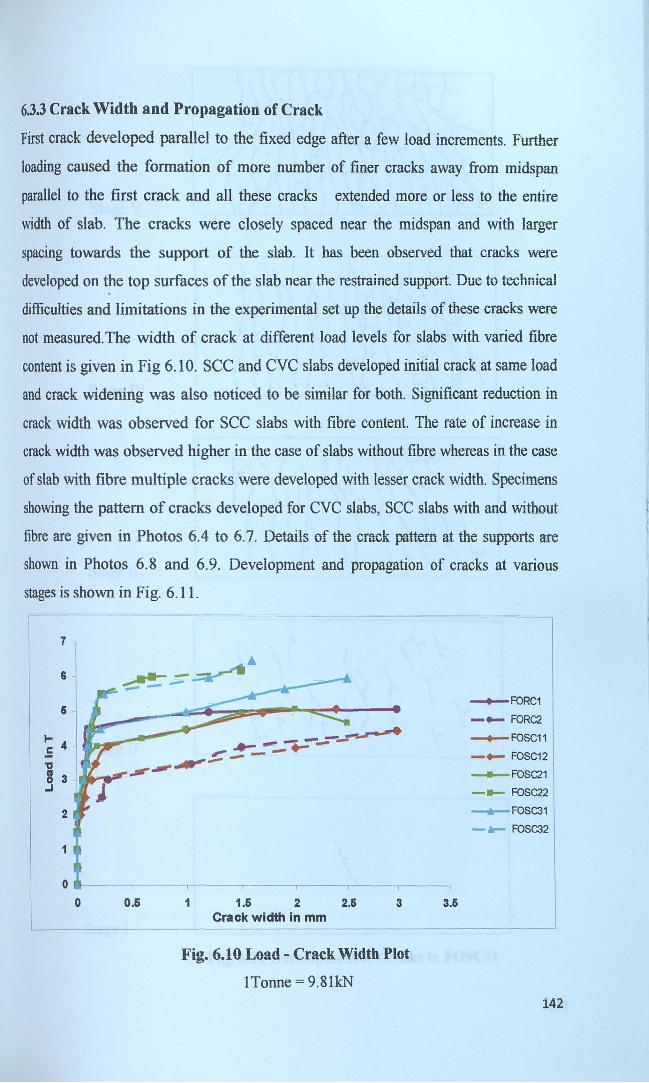
6.3.3 Crack Width and Propagation of Crack
First crack developed parallel to the fixed edge after a few load increments. Further
loading caused the formation of more number of finer cracks away from midspan
parallel to the first crack and all these cracks extended more or less to the entire
width of slab. The cracks were closely spaced near the midspan and with larger
spacing towards the support of the slab. It has been observed that cracks were
developed on the top surfaces of the slab near the restrained support. Due to technical
difficulties and limitations in the experimental set up the details of these cracks were
not measured.The width of crack at different load levels for slabs with varied fibre
content is given in Fig 6.10. see and eve slabs developed initial crack at same load
and crack widening was also noticed to be similar for both. Significant reduction in
crack width was observed for see slabs with fibre content. The rate of increase in
crack width was observed higher in the case of slabs without fibre whereas in the case
of slab with fibre multiple cracks were developed with lesser crack width. Specimens
showing the pattern of cracks developed for eve slabs, see slabs with and without
fibre are given in Photos 6.4 to 6.7. Details of the crack pattern at the supports are
shown in Photos 6.8 and 6.9. Development and propagation of cracks at various
stages is shown in Fig. 6.11.
7
6
6
... 4c'0
8 3~""'''''..I
2
--..-FORC1
- .... FORC2
--..-FOSC11
- .... FOSC12_____ FOSC21
-.- FOSC22
---.- FOSC31
-II!- FOSC32
1
3.631 1.6 2 2.6Crack width in mm
0.6
o ---,r- --,----,.---,------r---.------,
o
Fig. 6.10 Load - Crack Width Plot
ITonne = 9.81k:N142
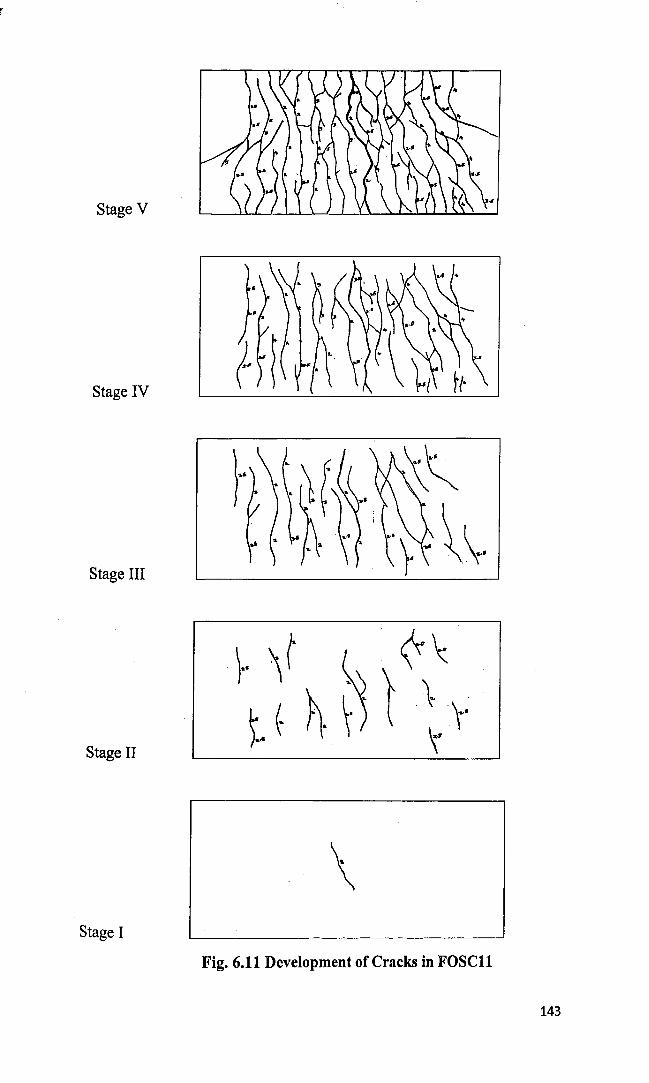
Stage V
Stage IV
Stage III
Stage II
Stage I
\Fig. 6.11 Development of Cracks in FOSCll
143
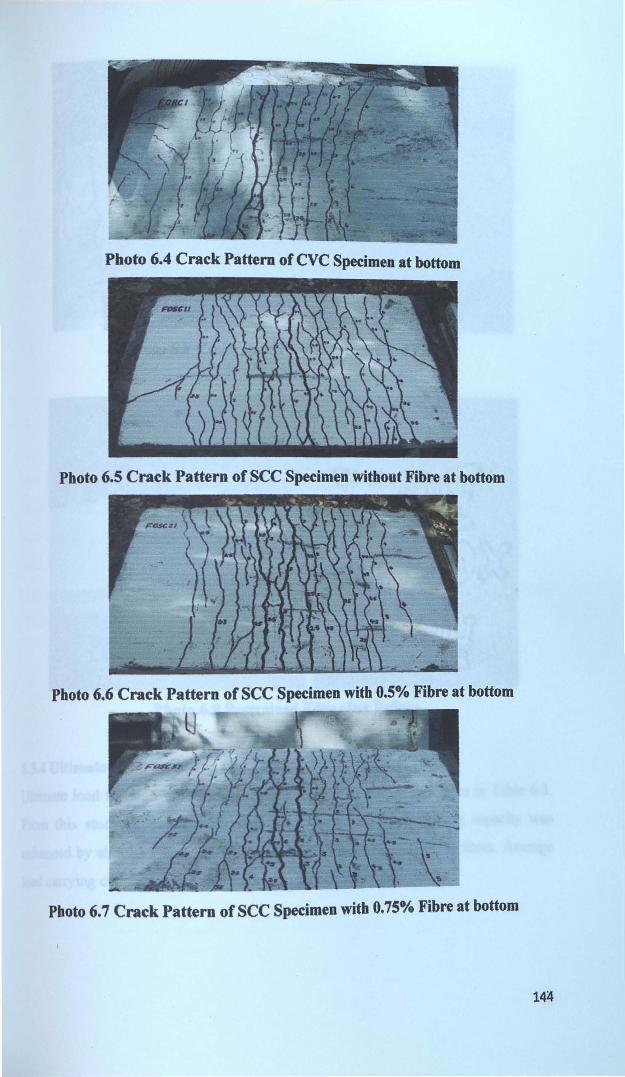
Photo 6.4 Crack Pattern ofcve Specimen at bottom
Photo 6.S Crack Pattern of see Specimen without Fibre at bottom
Photo 6.6 Crack Pattern of SCC Specimen with 0.5% Fibre at bottom
Photo 6.7 Crack Pattern of sec Specimen with 0.75% Fibre at bottom
14~
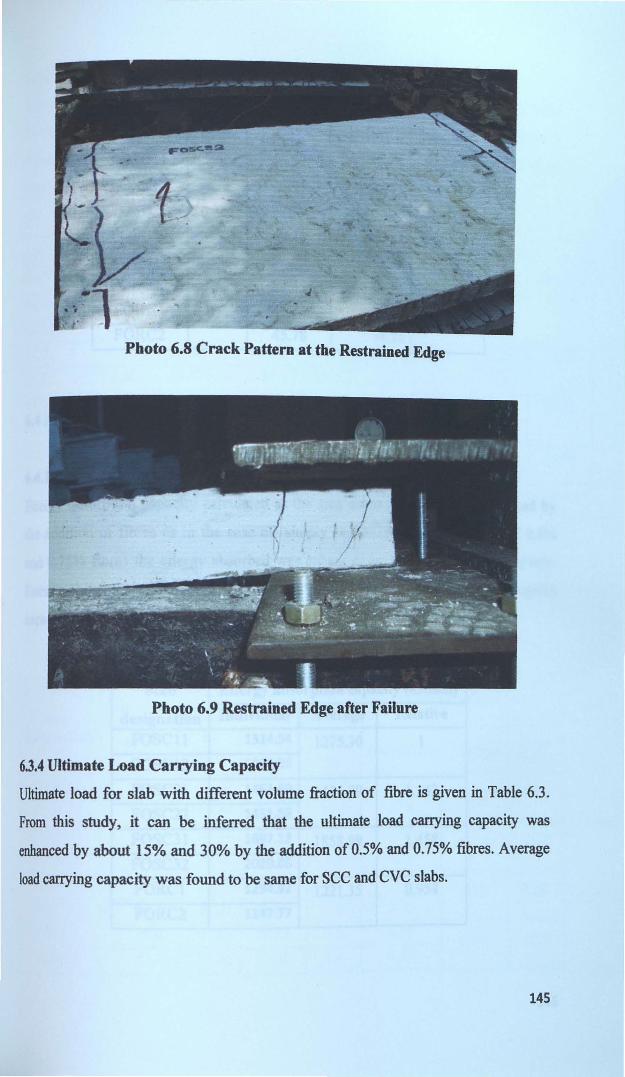
Photo 6.8 Crack Pattern at the Restrained Edge
Photo 6.9 Restrained Edge after Failure
6.3.4 Ultimate Load Carrying Capacity
Ultimate load for slab with different volume fraction of fibre is given in Table 6.3.
From this study, it can be inferred that the ultimate load carrying capacity was
enhanced by about 15% and 30% by the addition of 0.5% and 0.75% fibres. Average
load carrying capacity was found to be same for see and eve slabs.
145
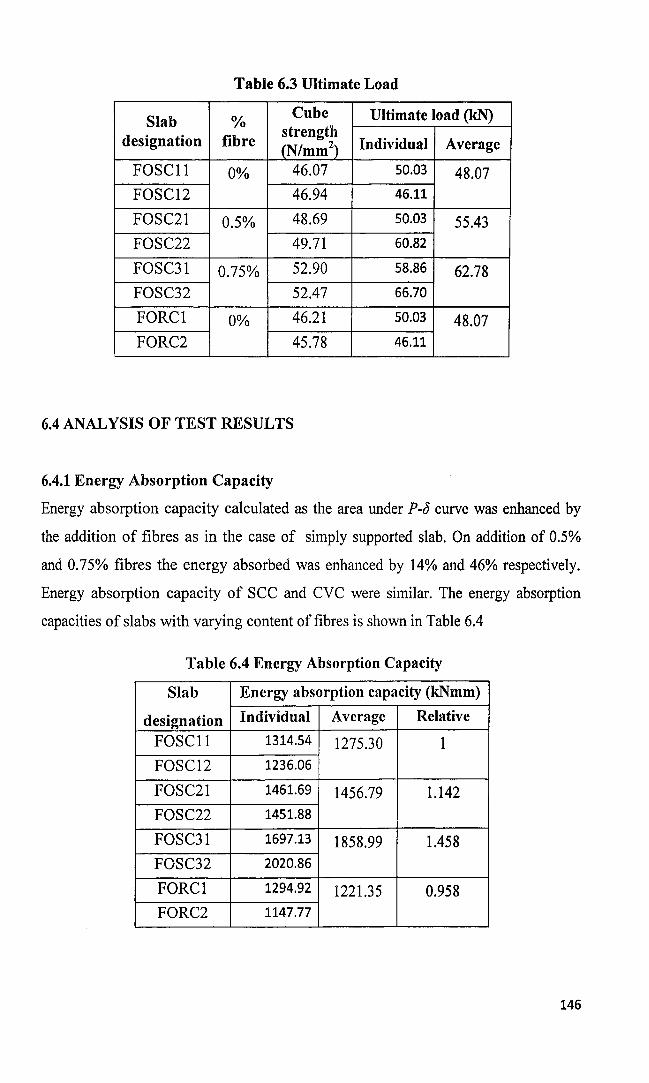
Table 6.3 Ultimate Load
Slab 0/0Cube Ultimate load (l<N)
designation fibrestrength
Individual Average(N/mm2)
FOSCll 0% 46.07 50.03 48.07FOSC12 46.94 46.11
FOSC21 0.5% 48.69 50.03 55.43FOSC22 49.71 60.82
FOSC31 0.75% 52.90 58.86 62.78FOSC32 52.47 66.70
FORCI 0% 46.21 50.03 48.07FORC2 45.78 46.11
6.4 ANALYSIS OF TEST RESULTS
6.4.1 Energy Absorption Capacity
Energy absorption capacity calculated as the area under p-a curve was enhanced by
the addition of fibres as in the case of simply supported slab. On addition of 0.5%
and 0.75% fibres the energy absorbed was enhanced by 14% and 46% respectively.
Energy absorption capacity of SCC and CVC were similar. The energy absorption
capacities of slabs with varying content of fibres is shown in Table 6.4
Table 6.4 Energy Absorption Capacity
Slab Energy absorption capacity (l<Nmm)
designation Individual Average Relative
FOSCll 1314.54 1275.30 1
FOSC12 1236.06
FOSC21 1461.69 1456.79 1.142
FOSC22 1451.88
FOSC31 1697.13 1858.99 1.458
FOSC32 2020.86
FORCI 1294.92 1221.35 0.958FORC2 1147.77
146

6.4.2 Toughness Index
Is and 110 were determined for all the specimens as explained in section 4.5.2 and the
result is shown in Table 6.5. It can be seen that toughness index of SFRSee slabs is
more or less similar to that of see slabs without fibre. Whereas, toughness index of
cve and see are found to be comparable.
Table 6.5 Toughness Index
SlabDeflection at Area up to Tou2hness indexfirst crack
designation<>t (mm) <>t 3<>t 5.5<>t Is Ave. Is 110 Ave. 110
FOSC11 5.20 294.30 1731.46 4434.12 5.88 5.69 15.07 14.52
FOSC12 5.20 309.01 1703.99 4312.47 5.51 13.96
FOSC21 4.55 269.77 1520.55 3831.78 5.63 5.65 14.20 14.55
FOSC22 5.40 405.15 2297.50 6033.15 5.67 14.89
FOSC31 6.40 530.72 2787.02 6839.53 5.25 5.59 12.89 13.76
FOSC32 3.92 279.58 1656.90 4086.84 5.93 14.62
FORC1 2.92 179.52 887.805 2198.42 4.95 5.03 12.24 12.46
FORC2 5.60 368.85 1886.46 4676.42 5.11 12.68
6.4.3 Ductility Factor
Ductility factor calculated for the slabs is given in Table 6.6. The ductility factor for
slabs with 0.5% and 0.75% are 35% and 65% higher than those without fibre. When
SCC and CVC are compared, ductility factor for CVC slabs are 37% higher.
Table 6.6 Ductility Factor
Yield Deflection Ductility factor (011 )Slab
Ultimateload (mm) Oy
load P udesignation P(kN) y AtPu AtPy Gain
(liN)Ou Oy
Individual Averagefactor
FOSe11 50.03 34.33 35.10 10.5 3.343.52 1
FOSC12 46.10 26.48 37.00 10.0 3.70
FOSC21 50.03 27.46 39.66 7.5 5.294.74 1.35
FOSC22 60.82 30.41 35.60 8.5 4.19
FOSC31 58.86 28.44 40.85 7.5 5.445.82 1.65
FOSC32 66.70 35.31 46.52 7.5 6.20
FORC1 50.03 27.46 34.50 7.5 4.604.58 1.37
FORC2 46.10 21.58 35.52 7.8 4.55
147
(6.1)
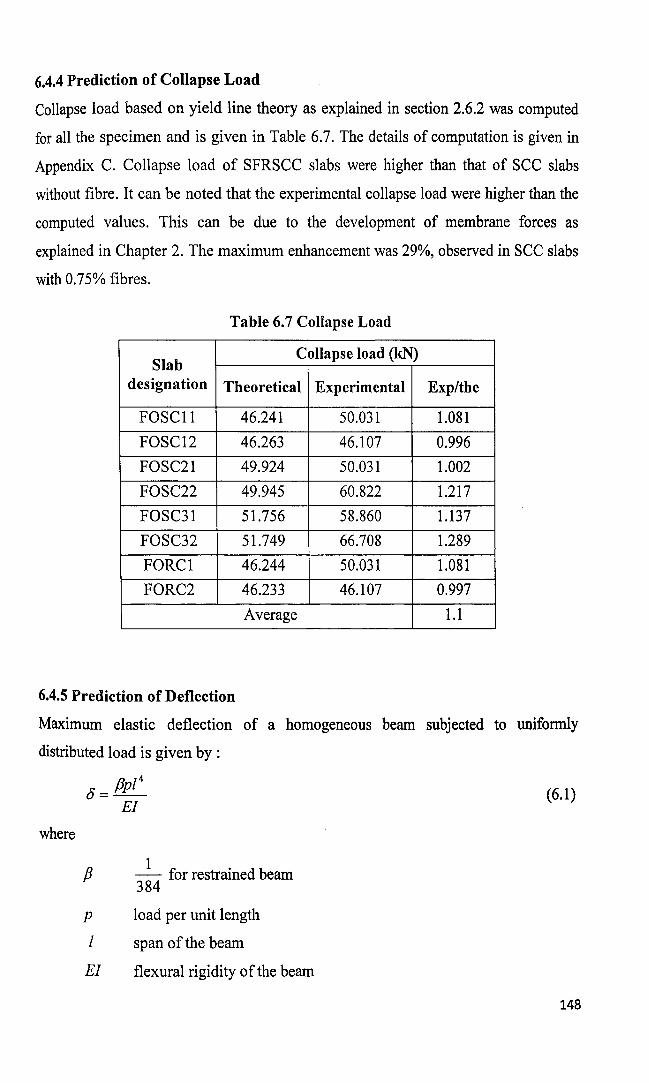
6.4.4 Prediction of Collapse Load
Collapse load based on yield line theory as explained in section 2.6.2 was computed
for all the specimen and is given in Table 6.7. The details of computation is given in
Appendix C. Collapse load of SFRSCC slabs were higher than that of SCC slabs
without fibre. It can be noted that the experimental collapse load were higher than the
computed values. This can be due to the development of membrane forces as
explained in Chapter 2. The maximum enhancement was 29%, observed in SCC slabs
with 0.75% fibres.
Table 6.7 Collapse Load
SlabCollapse load (kN)
designation Theoretical Experimental Exp/the
FOSCII 46.241 50.031 1.081
FOSC12 46.263 46.107 0.996
FOSC21 49.924 50.031 1.002
FOSC22 49.945 60.822 1.217
FOSC31 51.756 58.860 1.137
FOSC32 51.749 66.708 1.289
FORCI 46.244 50.031 1.081
FORC2 46.233 46.107 0.997
Average 1.1
6.4.5 Prediction of Deflection
Maximum elastic deflection of a homogeneous beam subjected to uniformly
distributed load is given by :
fJpi 4
0=-E1
where
fJ
P
i
£1
_1_ for restrained beam384
load per unit length
span of the beam
flexural rigidity of the beam
148
(6.2)
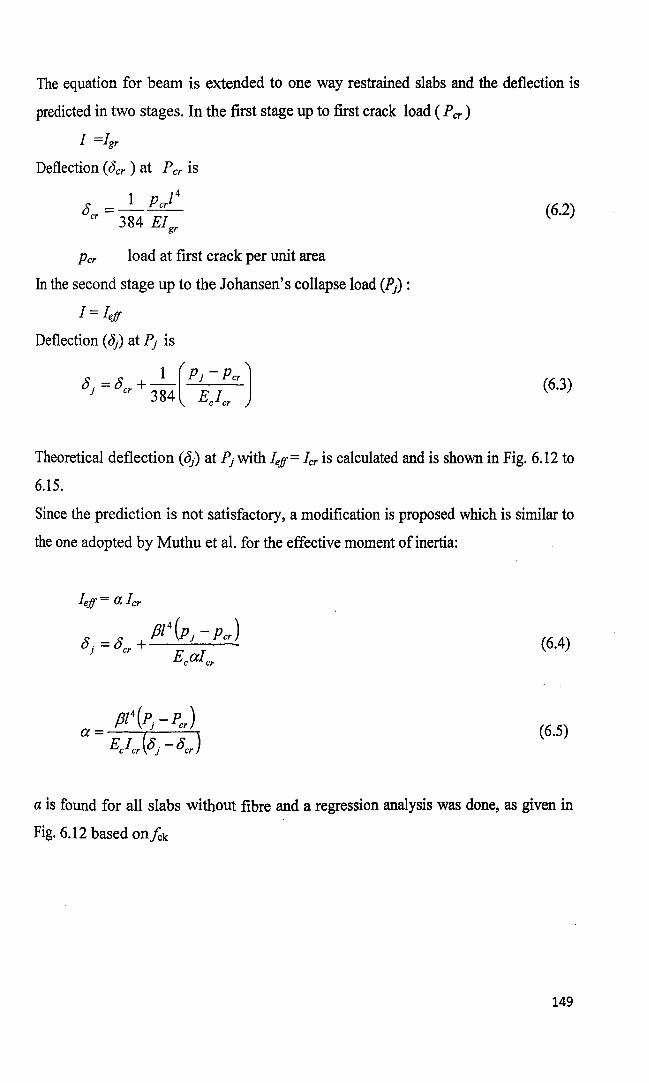
The equation for beam is extended to one way restrained slabs and the deflection is
predicted in two stages. In the first stage up to first crack load (Pcr )
I =Igr
Deflection (8cr ) at Pcr is
8 =_I_PerI4
er 384 EIgr
pcr load at first crack per unit area
In the second stage up to the Johansen's collapse load (Pj ) :
I = Ieff
Deflection (8j ) at Pj is
8 =8 +_I_(Pi - Per)J er 384 E I
e er(6.3)
Theoretical deflection (8j) at Pjwith Ie.ff= Icr is calculated and is shown in Fig. 6.12 to
6.15.
Since the prediction is not satisfactory, a modification is proposed which is similar to
the one adopted by Muthu et a1. for the effective moment of inertia:
(6.4)
(6.5)
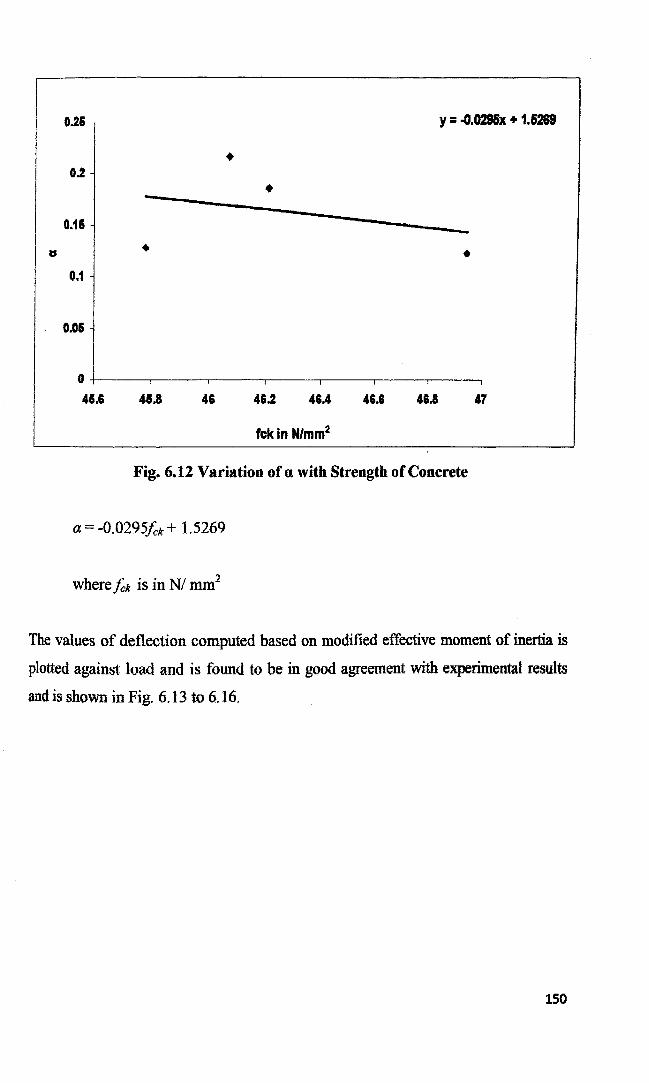
a is found for all slabs without fibre and a regression analysis was done, as given in
Fig. 6.12 based onfek
149
0.26 Y=-o.0296x + 1.6269
•0.2
•0.16 -
IS • •0.1
0.05
4746.846,646A46.24646.8
O+----.------.------r----r---~--~--~
46.6
fckin N/mm2
Fig. 6.12 Variation of a with Strength ofConcrete
a = -O.0295kk + 1.5269
where fck is in N/ mm2
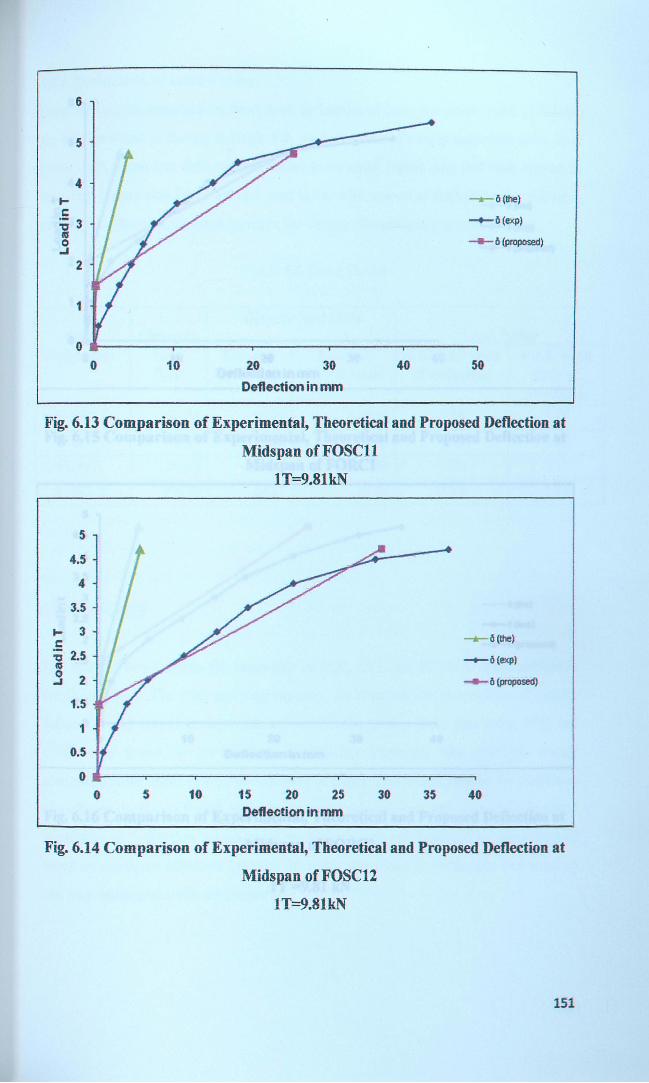
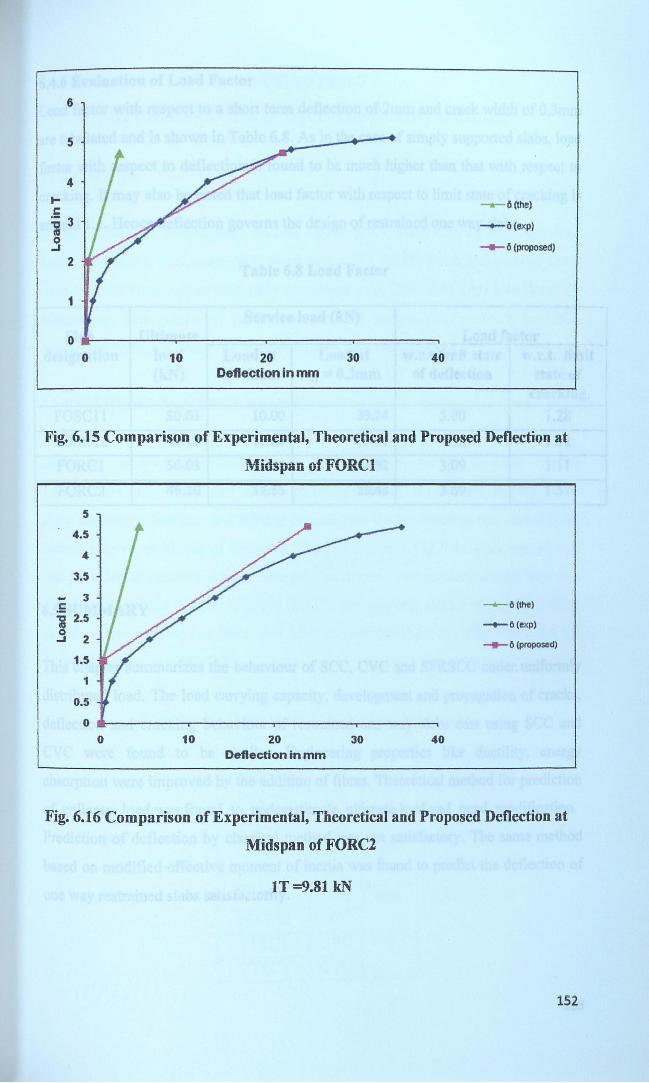
The values of deflection computed based on modified effective moment of inertia is
plotted against load and is found to be in good agreement with experimental results
and is shown in Fig. 6.13 to 6.16.
150
6
5
4f0e:; 3tISo.J
2
1
_6(lhe}
-.-6 (exp)
~ 6 (proposed)
5040302010
oa----.,.------,-------,,..------,------,o
Deflection in rnm
Fig. 6.13 Comparison of Experimental, Theoretical and Proposed Deflection at
Midspan of FOSCll
IT=9.81k.N
40353015 20 25Deflection in rnm
105
5
4.5
4
3.5
f- 3e:; 2.5ta.3 2
1.5
1
0.5
O __--,.----r---.,-----,----.------,--.,-----.,
o
Fig. 6.14 Comparison of Experimental, Theoretical and Proposed Deflection at
Midspan of FOSC12
IT=9.81kN
151
6
5
4lI:.- 3'i.s
2
1
-0(the)
_0 (8l(p)
-.-0 (proposed)
403020Deflection in mm
100 .....------.-------,------..,.------.,
o
Fig. 6.15 Comparison of Experimental, Theoretical and Proposed Deflection at
~fidspanof FORC1
5
4.5
4
3.5
- 3c:i 2.50
2...1.5
1
0.5
0
0 10 20 30Deflection in mm
40
-6(Ihe)
_0 (exp)
_ 0 (proposed)
Fig. 6.16 Comparison ofExperimental, Theoretical and Proposed Deflection at
Midspan ofFORC2
IT =9.81 kN
152
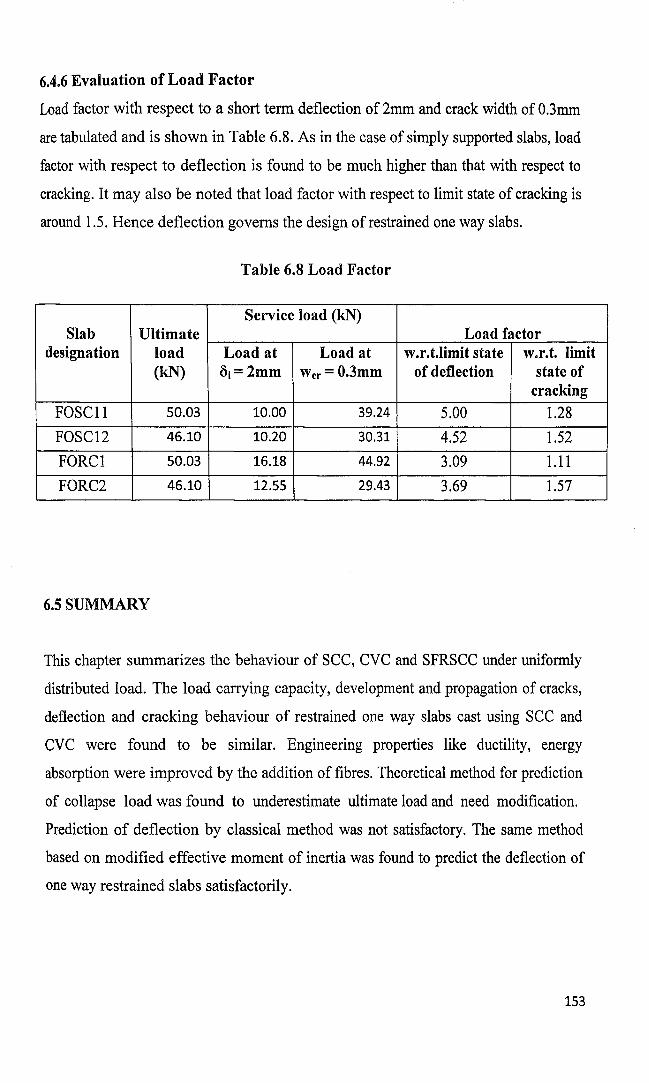
6.4.6 Evaluation of Load Factor
Load factor with respect to a short term deflection of 2mm and crack width of O.3mm
are tabulated and is shown in Table 6.8. As in the case of simply supported slabs, load
factor with respect to deflection is found to be much higher than that with respect to
cracking. It may also be noted that load factor with respect to limit state of cracking is
around 1.5. Hence deflection governs the design of restrained one way slabs.
Table 6.8 Load Factor
Service load (kN)Slab Ultimate Load factor
designation load Load at Load at w.r.t.limit state w.r.t. limit(kN) oj=2mm wcr =O.3mm of deflection state of
cracking
FOSCll 50.03 10.00 39.24 5.00 1.28
FOSC12 46.10 10.20 30.31 4.52 1.52
FORCl 50.03 16.18 44.92 3.09 1.11
FORC2 46.10 12.55 29.43 3.69 1.57
6.5 SUMMARY
This chapter summarizes the behaviour of SCC, CVC and SFRSCC under uniformly
distributed load. The load carrying capacity, development and propagation of cracks,
deflection and cracking behaviour of restrained one way slabs cast using sce and
eve were found to be similar. Engineering properties like ductility, energy
absorption were improved by the addition of fibres. Theoretical method for prediction
of collapse load was found to underestimate ultimate load and need modification.
Prediction of deflection by classical method was not satisfactory. The same method
based on modified effective moment of inertia was found to predict the deflection of
one way restrained slabs satisfactorily.
153