Embed Size (px)
Citation preview
§1
Chapter 5:
Using Financial Statement Information
§2
Control and PredictionFinancial accounting numbers are useful in two fundamental ways:
They help investors and creditors influence and monitor the business decisions of a company’s managers.
They help to predict a company’s future earnings and cash flows.
§3
Financial Accounting Numbers as Prediction Aids
Financial statements do not reflect the company’s prospects within its business environment Statements are backward looking, not focusing on the future prospects.
Financial statements are inherently limited Statements leave out some current and historical information such as human resources and the effects of inflation.
Management prepares the financial statements in a biased manner Managers often choose accounting methods and estimates that make them look good.
§4
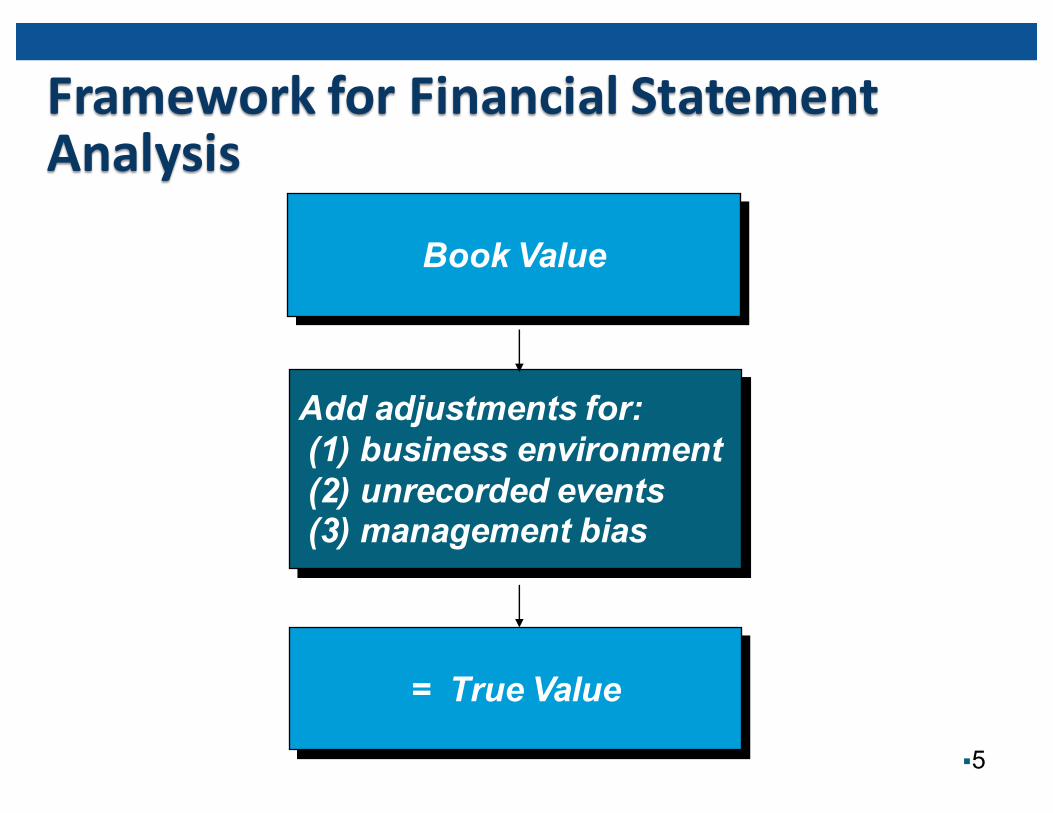
Framework for Financial Statement Analysis
§5
Book Value
Add adjustments for:(1) business environment(2) unrecorded events(3) management bias
= True Value
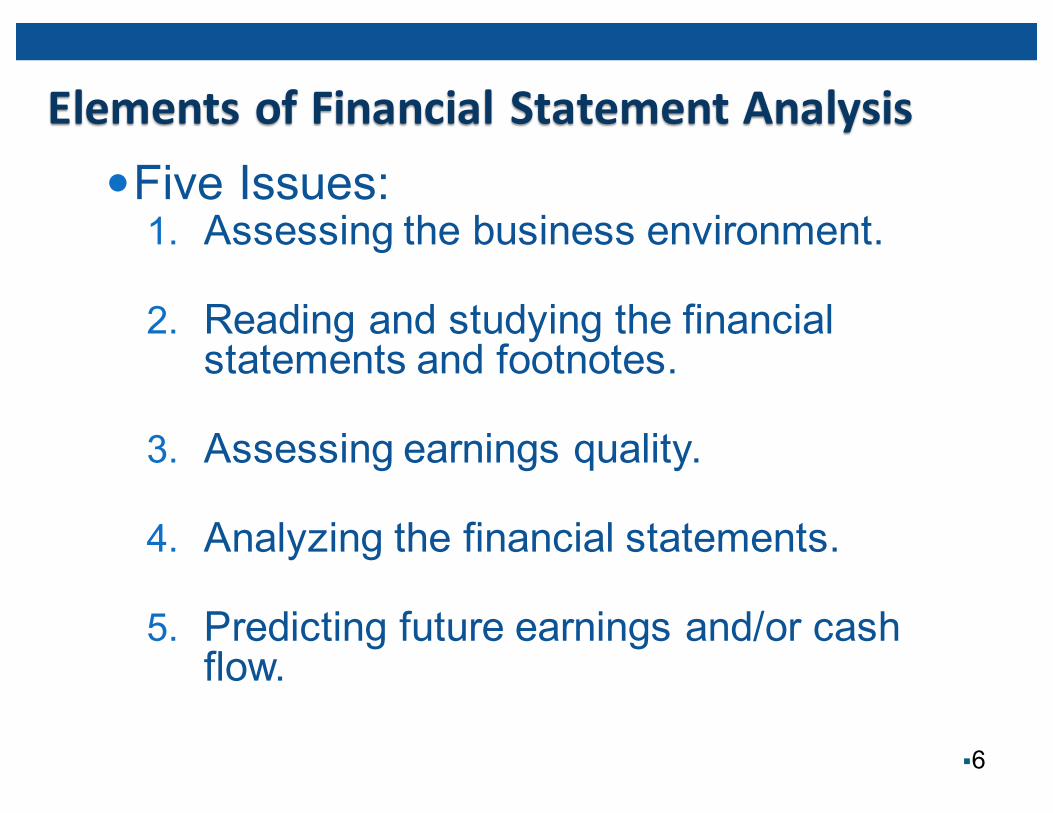
Elements of Financial Statement AnalysisFive Issues:1. Assessing the business environment.
2. Reading and studying the financial statements and footnotes.
3. Assessing earnings quality.
4. Analyzing the financial statements.
5. Predicting future earnings and/or cash flow.
§6
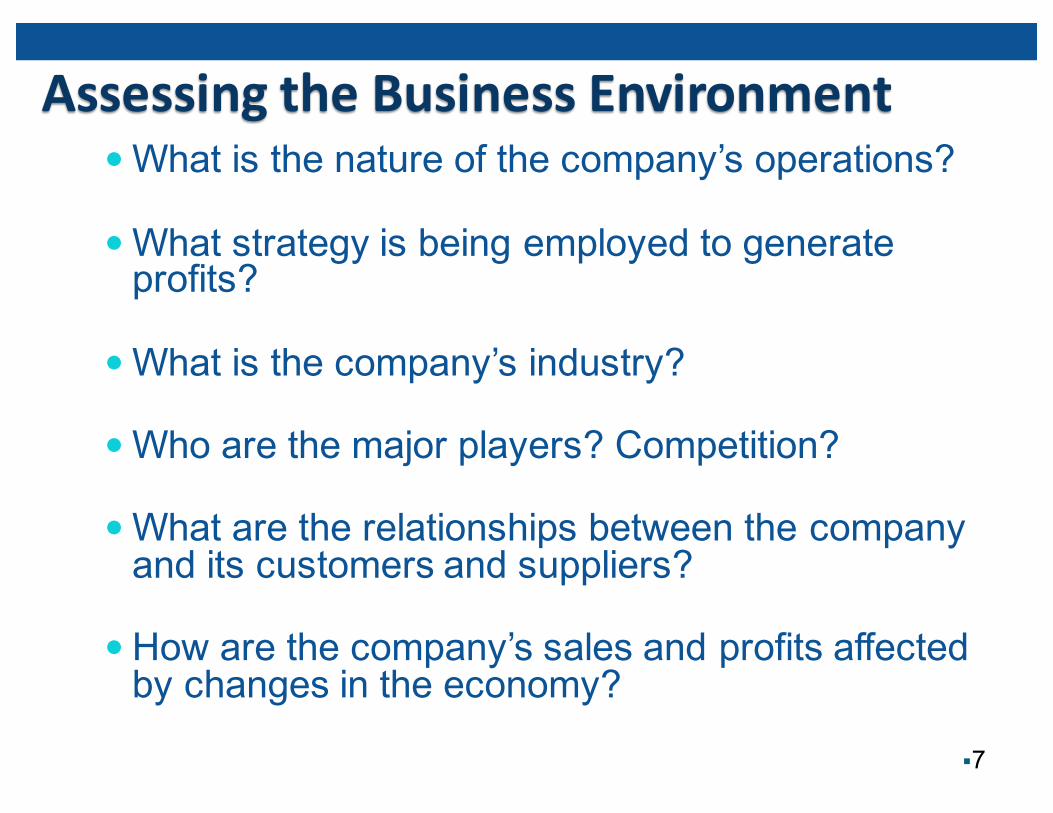
Assessing the Business EnvironmentWhat is the nature of the company’s operations?
What strategy is being employed to generate profits?
What is the company’s industry?
Who are the major players? Competition?
What are the relationships between the company and its customers and suppliers?
How are the company’s sales and profits affected by changes in the economy?
§7
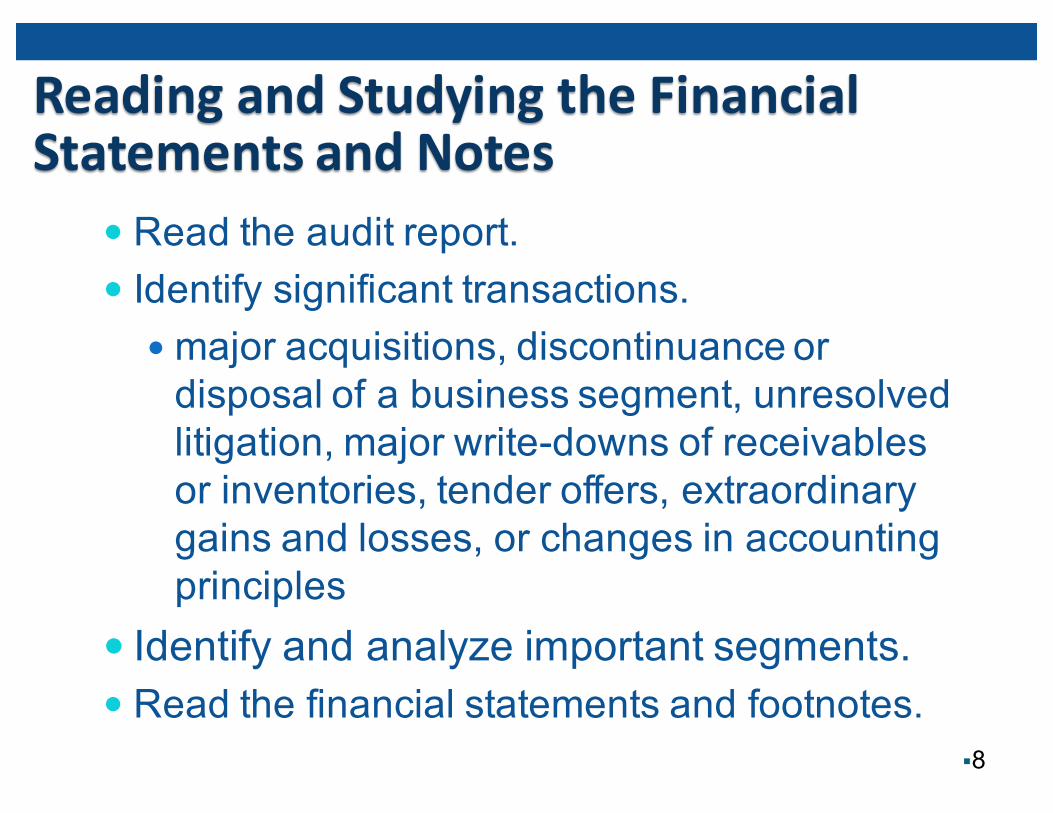
Reading and Studying the Financial Statements and Notes
Read the audit report. Identify significant transactions.
major acquisitions, discontinuance or disposal of a business segment, unresolved litigation, major write-downs of receivables or inventories, tender offers, extraordinary gains and losses, or changes in accounting principles
Identify and analyze important segments. Read the financial statements and footnotes.
§8
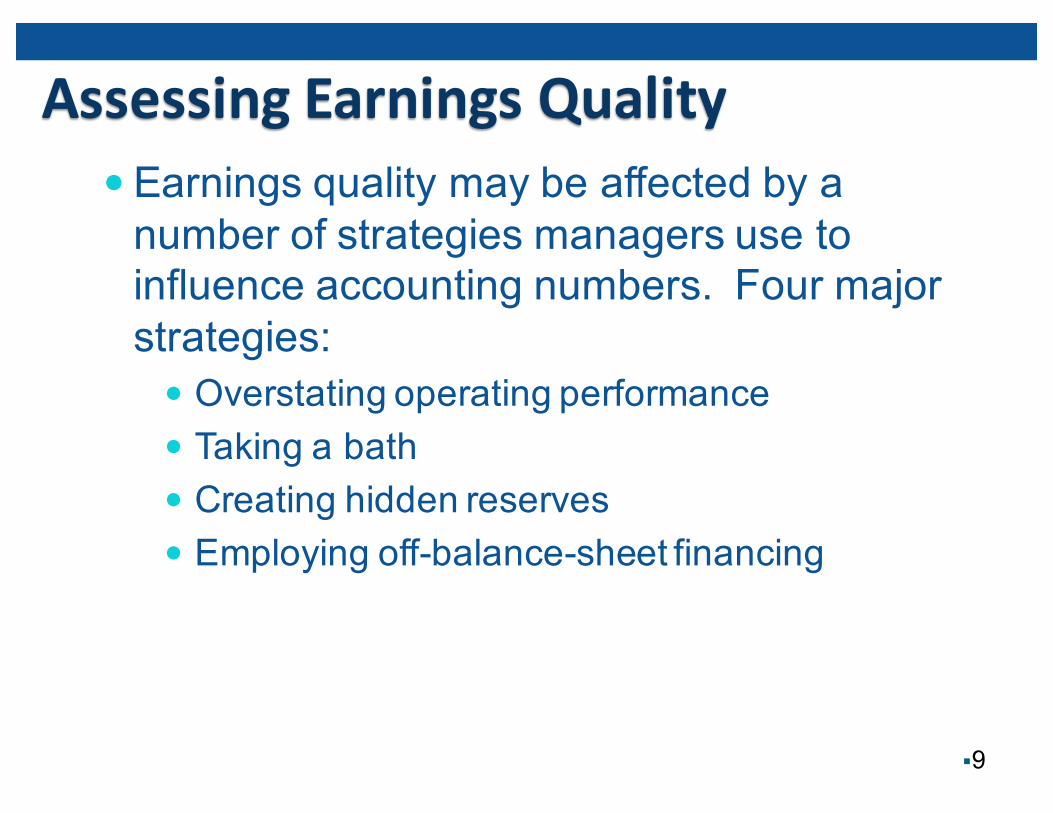
Assessing Earnings QualityEarnings quality may be affected by a number of strategies managers use to influence accounting numbers. Four major strategies: Overstating operating performance Taking a bath Creating hidden reserves Employing off-balance-sheet financing
§9
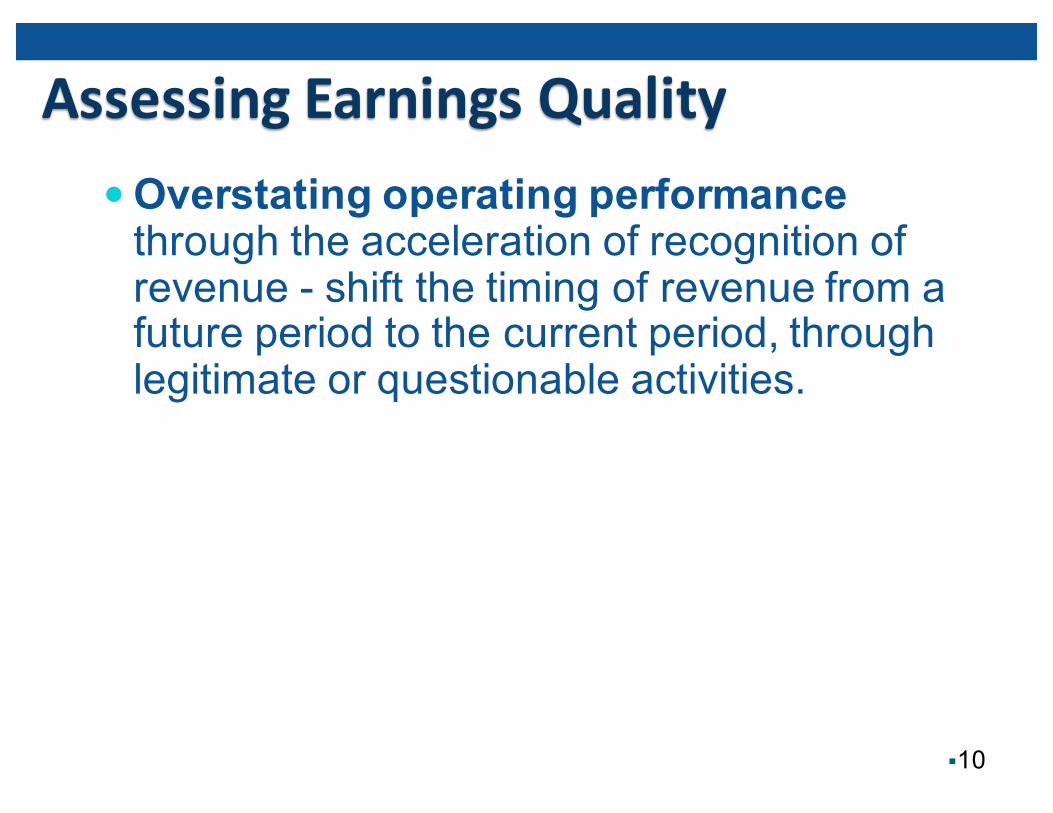
Assessing Earnings QualityOverstating operating performancethrough the acceleration of recognition of revenue - shift the timing of revenue from a future period to the current period, through legitimate or questionable activities.
§10
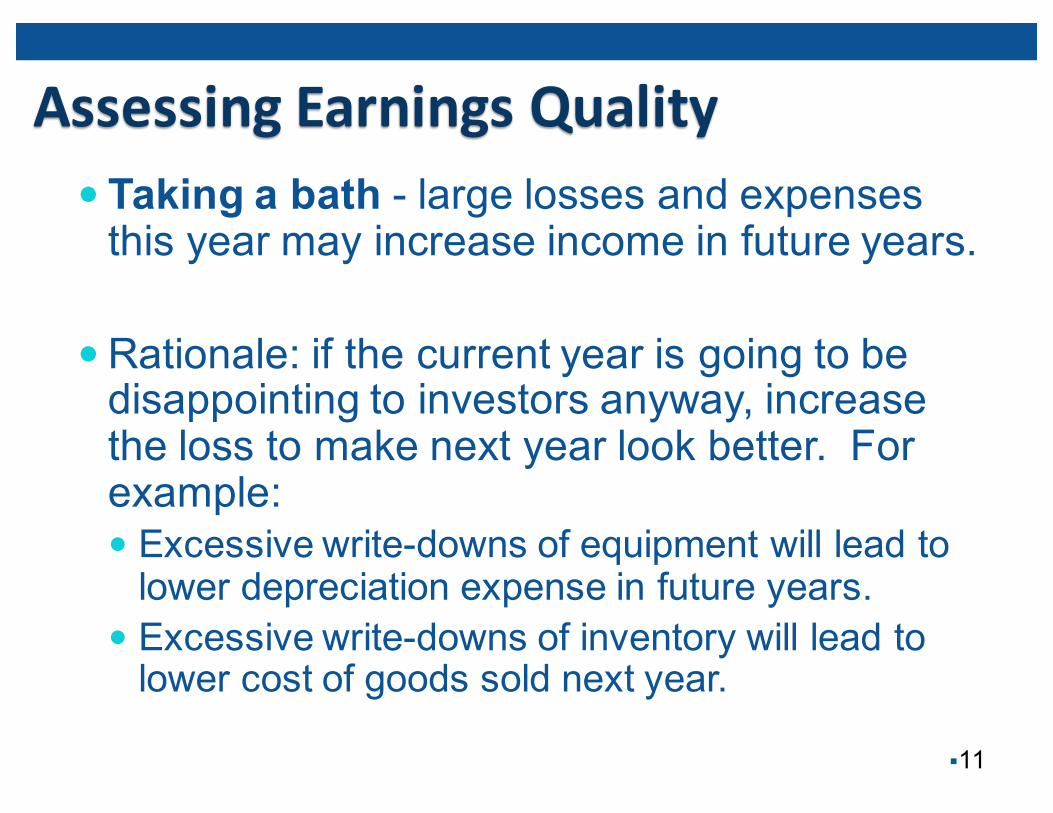
Assessing Earnings Quality Taking a bath - large losses and expenses this year may increase income in future years.
Rationale: if the current year is going to be disappointing to investors anyway, increase the loss to make next year look better. For example: Excessive write-downs of equipment will lead to lower depreciation expense in future years.
Excessive write-downs of inventory will lead to lower cost of goods sold next year.
§11
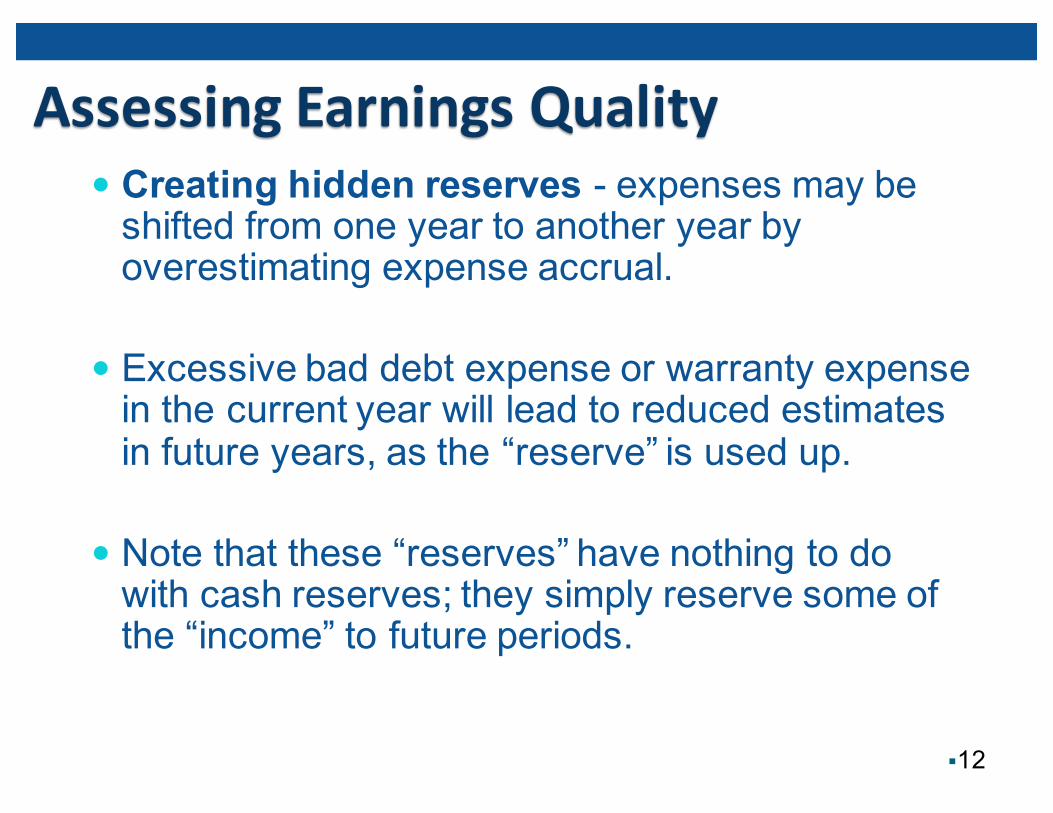
Assessing Earnings Quality Creating hidden reserves - expenses may be shifted from one year to another year by overestimating expense accrual.
Excessive bad debt expense or warranty expense in the current year will lead to reduced estimates in future years, as the “reserve” is used up.
Note that these “reserves” have nothing to do with cash reserves;; they simply reserve some of the “income” to future periods.
§12
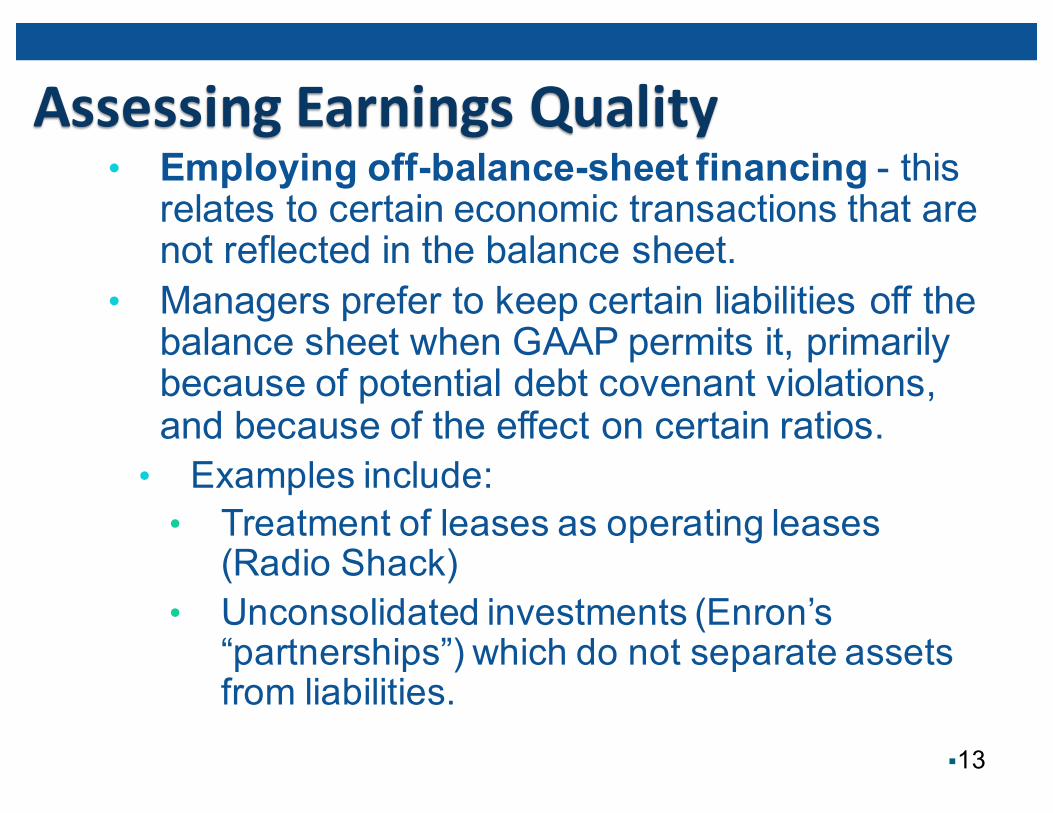
Assessing Earnings Quality• Employing off-balance-sheet financing - this relates to certain economic transactions that are not reflected in the balance sheet.
• Managers prefer to keep certain liabilities off the balance sheet when GAAP permits it, primarily because of potential debt covenant violations, and because of the effect on certain ratios.• Examples include:• Treatment of leases as operating leases (Radio Shack)
• Unconsolidated investments (Enron’s “partnerships”) which do not separate assets from liabilities.
§13
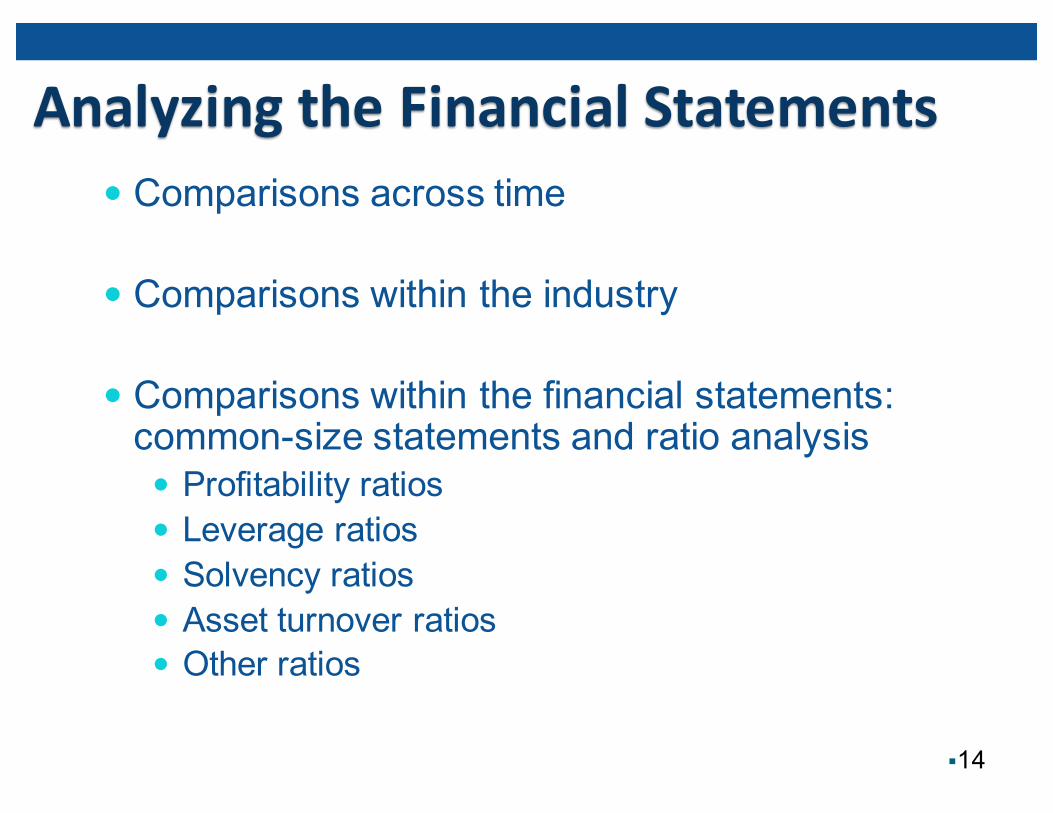
Analyzing the Financial Statements Comparisons across time
Comparisons within the industry
Comparisons within the financial statements: common-size statements and ratio analysis Profitability ratios Leverage ratios Solvency ratios Asset turnover ratios Other ratios
§14
Comparisons Across Time Financial accounting numbers can be made more meaningful if they are compared across time.
GAAP require side-by-side comparison of the current and the preceding years in published financial reports.
§15
Comparisons Within the Industry Financial accounting numbers can also be made more meaningful if they are compared to those of similar companies.
Comparison of financial accounting numbers with industry averages is also helpful.
Sources of industry information include: Dun & Bradstreet Robert Morris Associates Moody Standard & Poor
§16
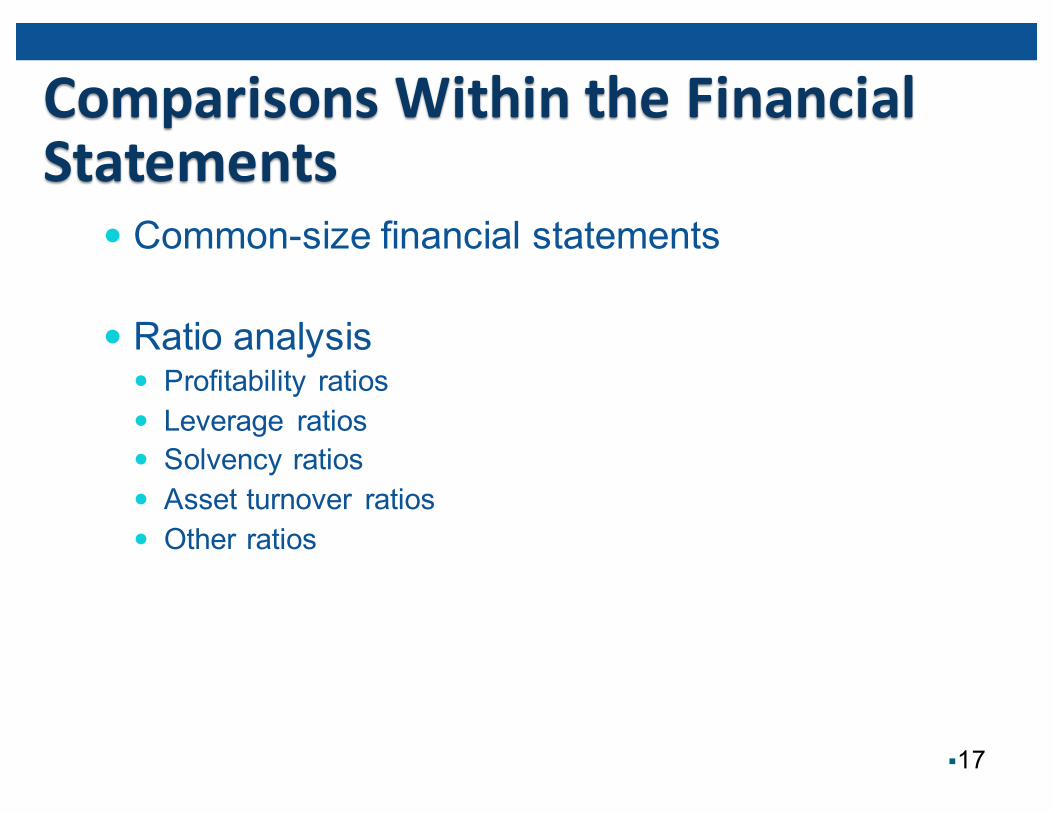
Comparisons Within the Financial Statements
Common-size financial statements
Ratio analysis Profitability ratios Leverage ratios Solvency ratios Asset turnover ratios Other ratios
§17
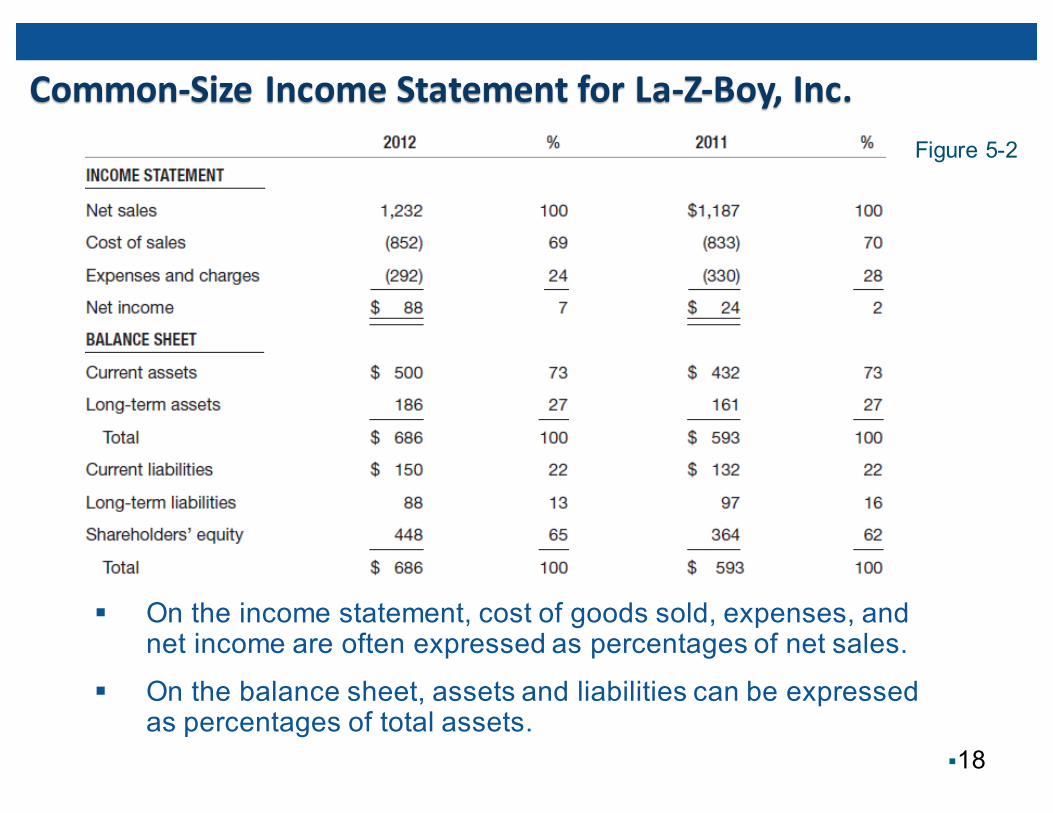
Common-‐Size Income Statement for La-‐Z-‐Boy, Inc.
§18
§ On the income statement, cost of goods sold, expenses, and net income are often expressed as percentages of net sales.
§ On the balance sheet, assets and liabilities can be expressed as percentages of total assets.
Figure 5-2
Profitability Ratios These ratios are designed to measure a firm’s earnings power.
Net income, the primary measure of the overall success of a company, is compared to other measures of financial activity or condition to assess performance as a percent of some level of activity or investment.
§19
Profitability Ratios
§20
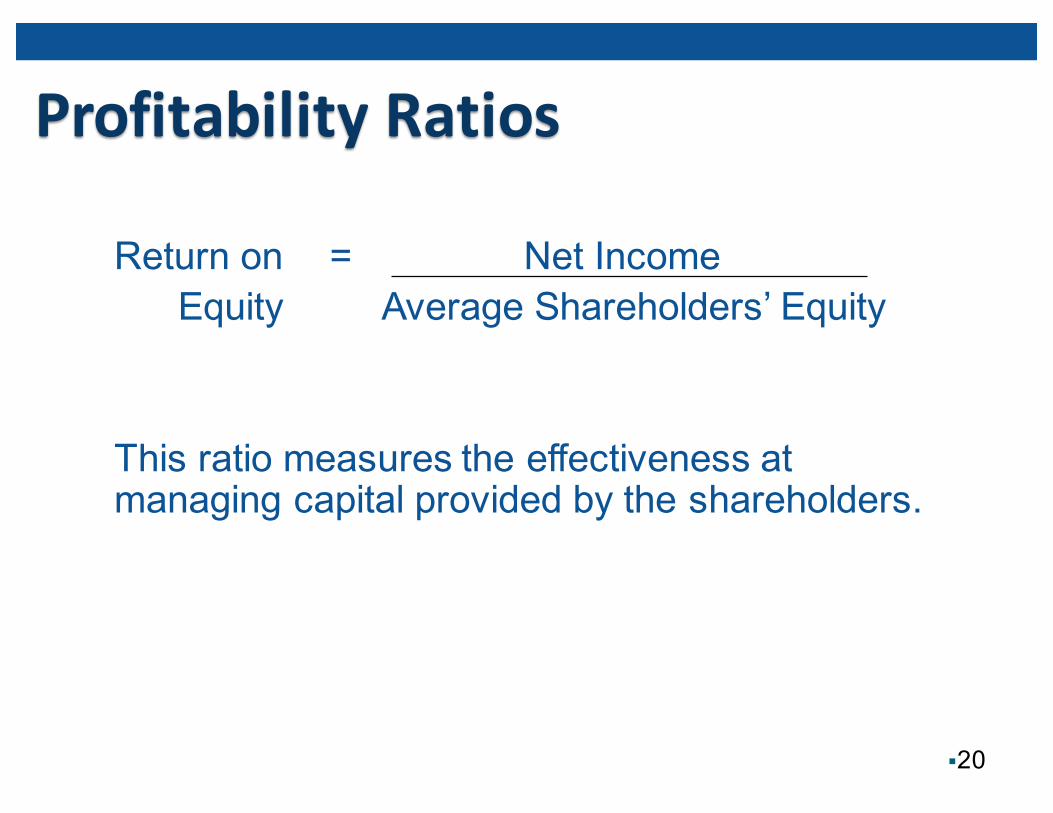
Return on = Net IncomeEquity Average Shareholders’ Equity
This ratio measures the effectiveness at managing capital provided by the shareholders.
Profitability Ratios
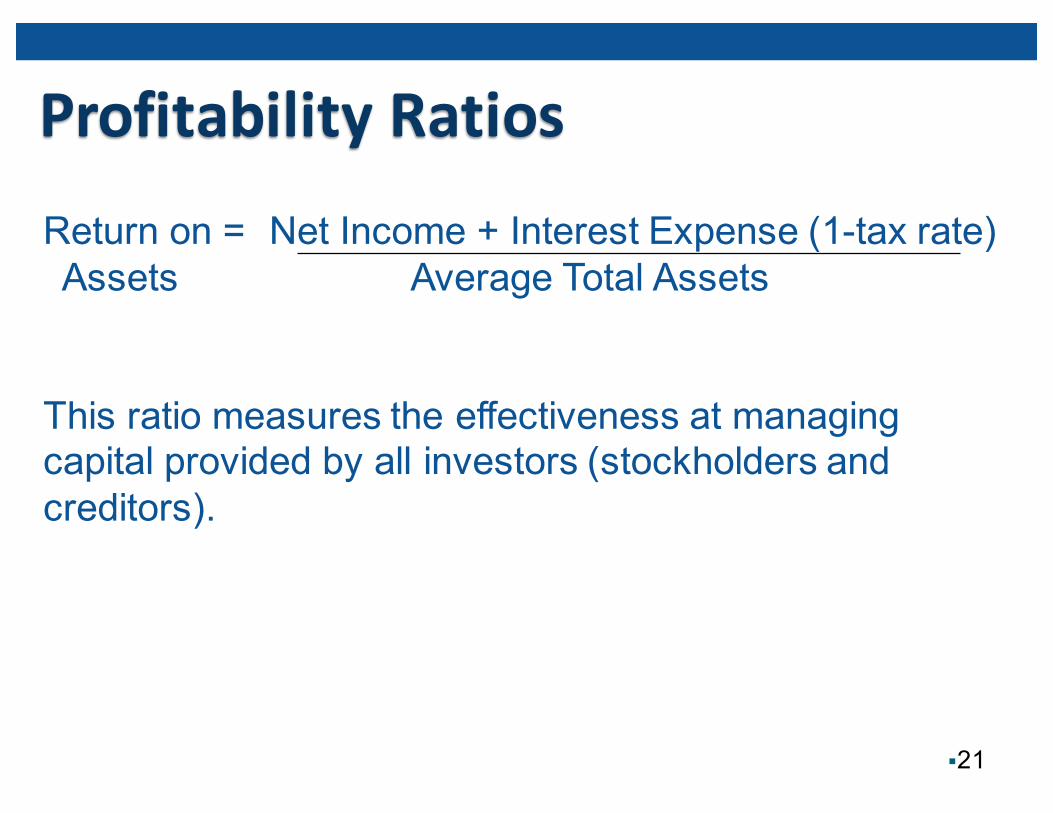
§21
Return on = Net Income + Interest Expense (1-tax rate) Assets Average Total Assets
This ratio measures the effectiveness at managing capital provided by all investors (stockholders and creditors).
Profitability Ratios
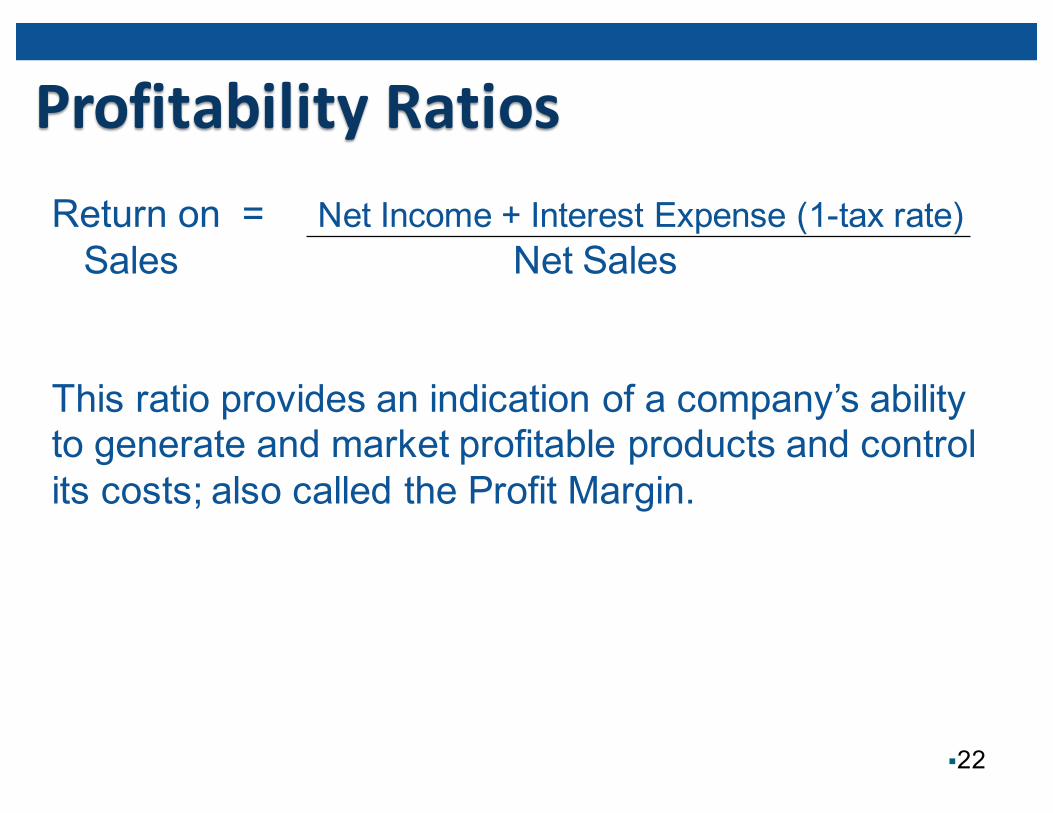
§22
Return on = Net Income + Interest Expense (1-tax rate) Sales Net Sales
This ratio provides an indication of a company’s ability to generate and market profitable products and control its costs;; also called the Profit Margin.
Leverage Ratios Leverage refers to using borrowed funds to generate returns for stockholders.
Leverage is desirable because it creates returns for shareholders without using any of their money.
Leverage increases risk by committing the company to future cash obligations.
§23
Leverage Ratios (cont’d)
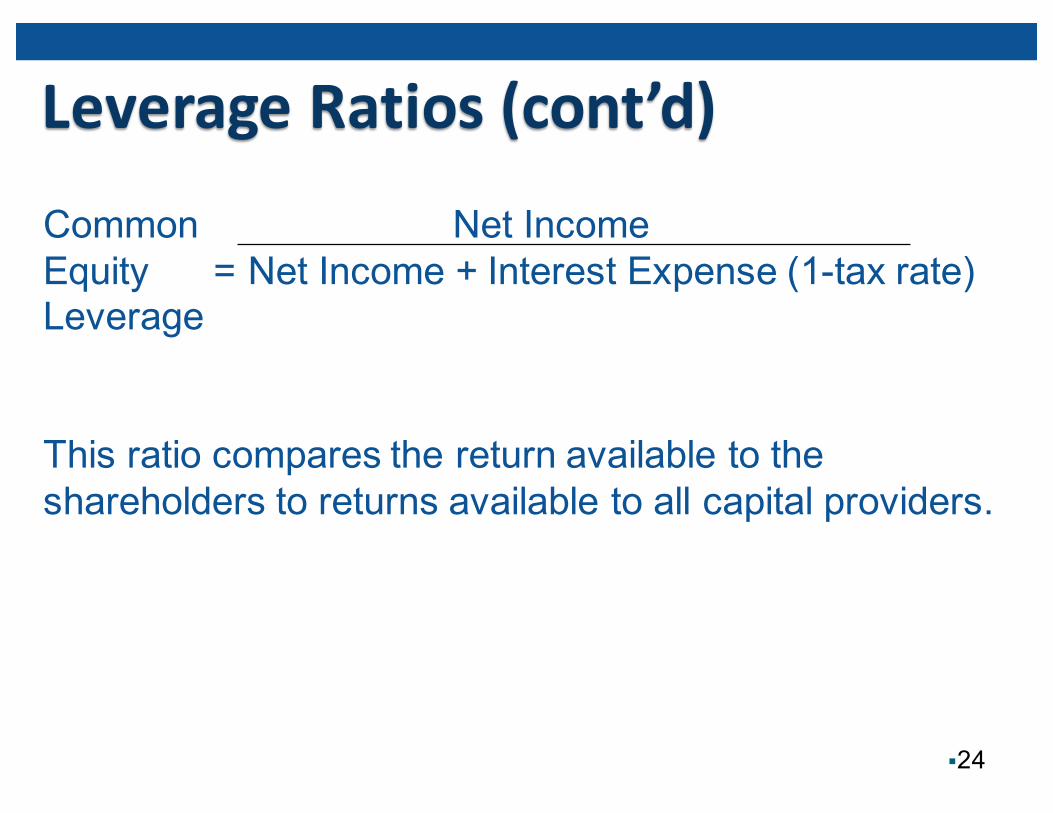
§24
Common Net IncomeEquity = Net Income + Interest Expense (1-tax rate)Leverage
This ratio compares the return available to the shareholders to returns available to all capital providers.
Leverage Ratios (cont’d)
§25
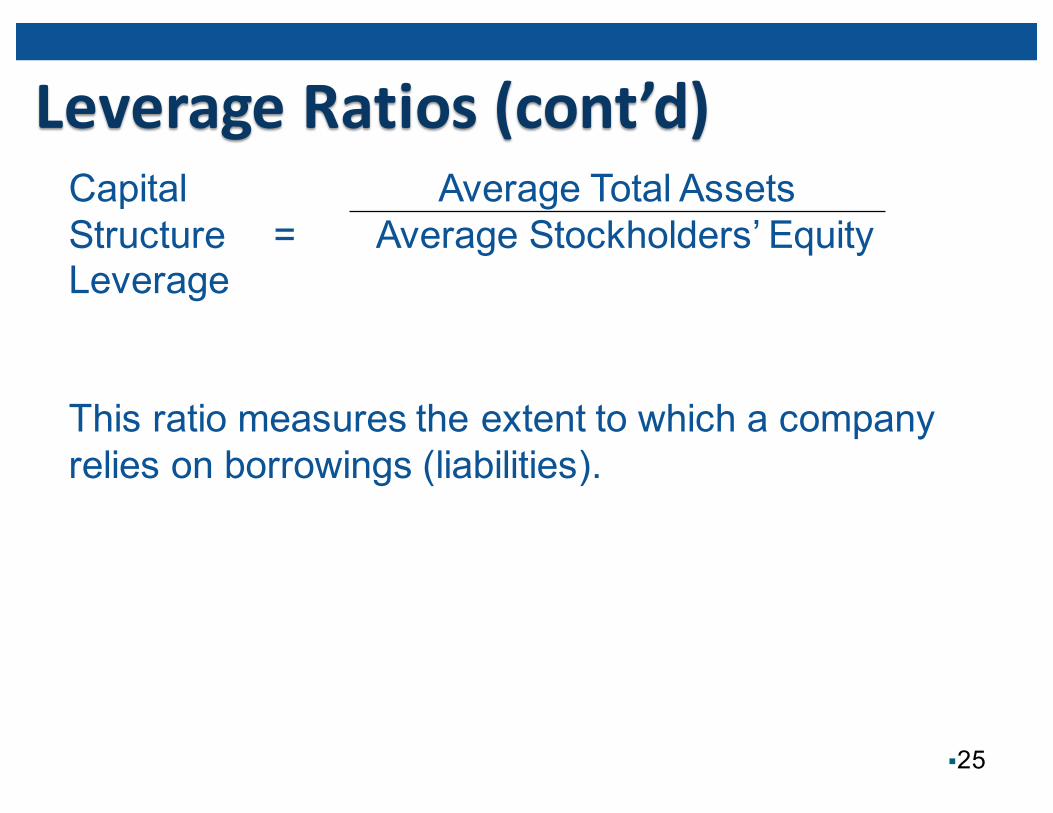
Capital Average Total AssetsStructure = Average Stockholders’ EquityLeverage
This ratio measures the extent to which a company relies on borrowings (liabilities).
Leverage Ratios (cont’d)
§26
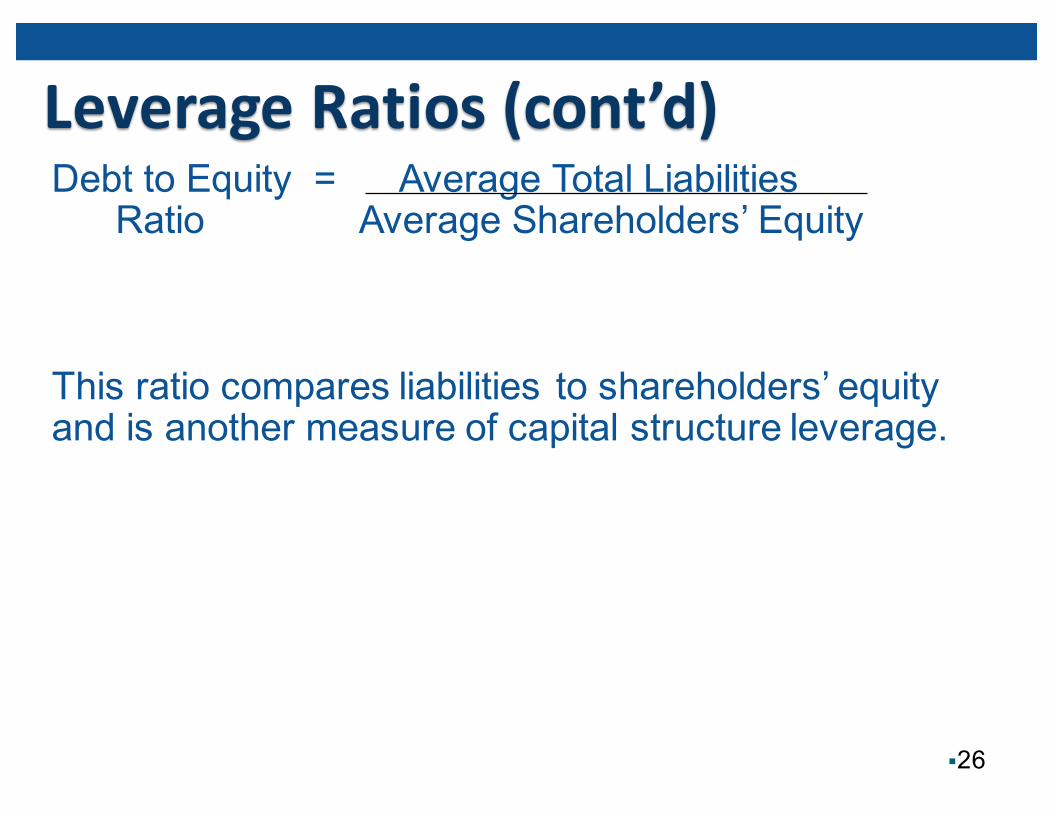
Debt to Equity = Average Total LiabilitiesRatio Average Shareholders’ Equity
This ratio compares liabilities to shareholders’ equity and is another measure of capital structure leverage.
Leverage Ratios (cont’d)
§27
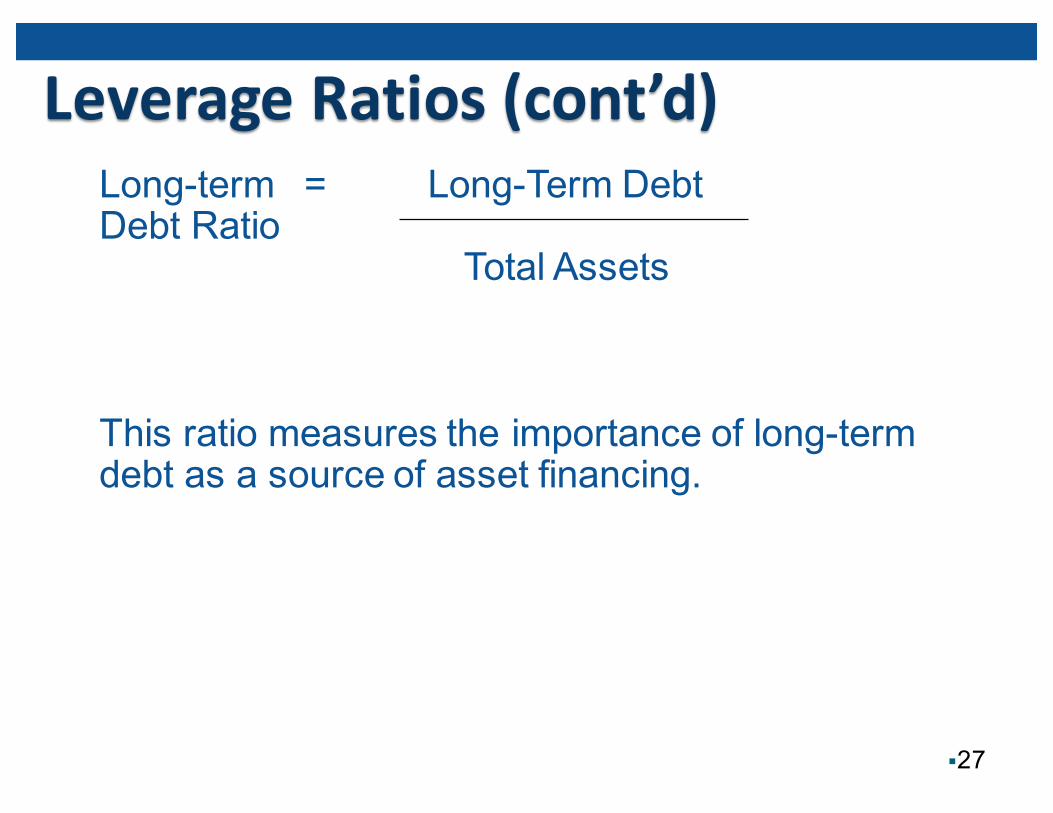
Long-term = Long-Term DebtDebt Ratio
Total Assets
This ratio measures the importance of long-term debt as a source of asset financing.
Solvency Ratios Solvency refers to a company’s ability to meet its current debts as they come due.
There is pressure on companies with high levels of leverage to manage their solvency.
§28
Solvency Ratios (cont’d)
§29
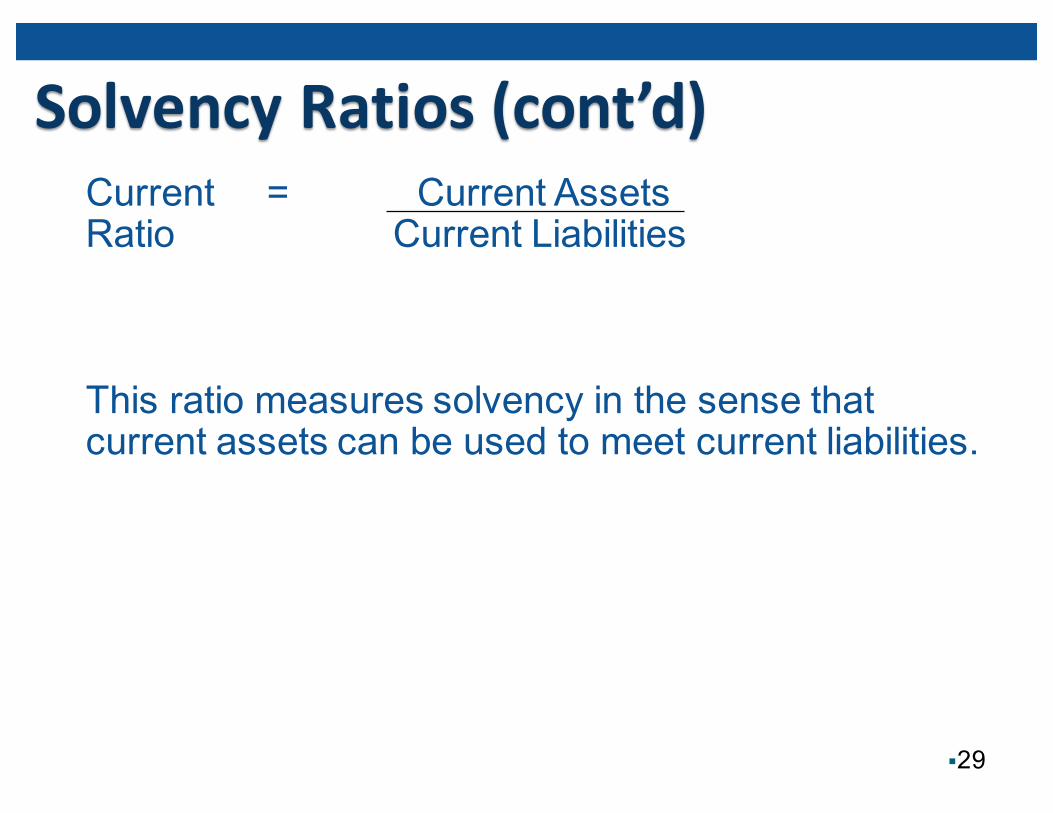
Current = Current Assets Ratio Current Liabilities
This ratio measures solvency in the sense that current assets can be used to meet current liabilities.
Solvency Ratios (cont’d)
§30
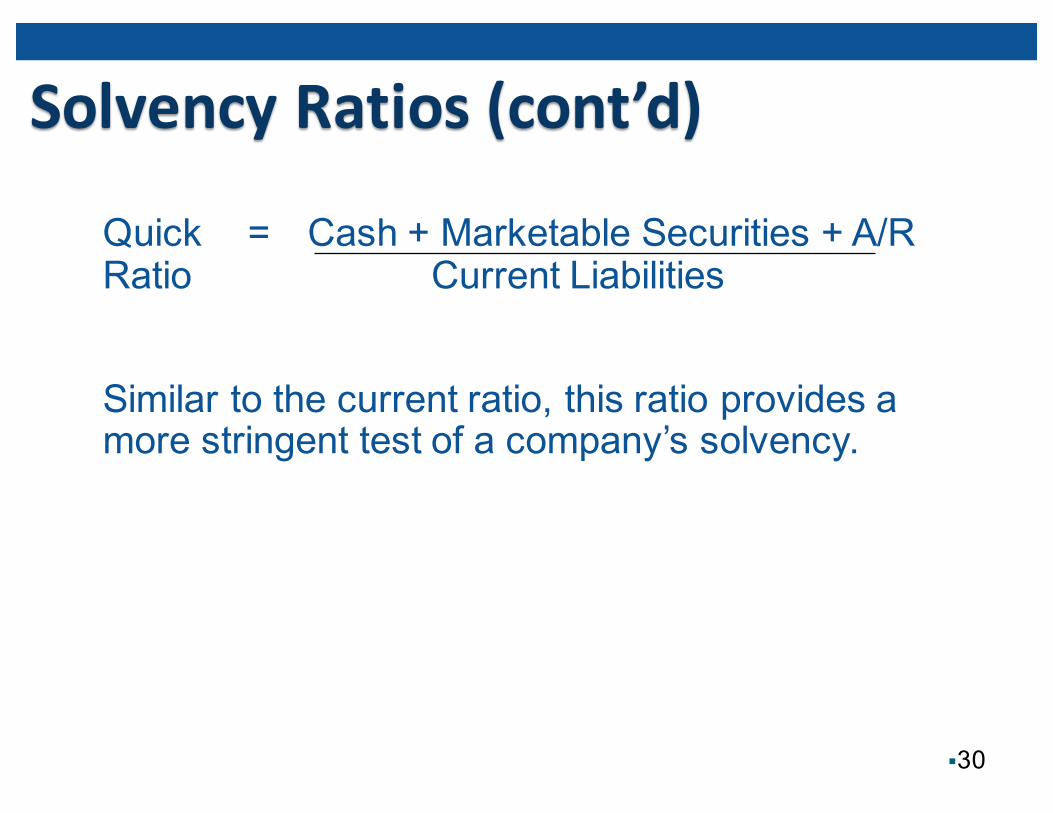
Quick = Cash + Marketable Securities + A/R Ratio Current Liabilities
Similar to the current ratio, this ratio provides a more stringent test of a company’s solvency.
Solvency Ratios (cont’d)
§31
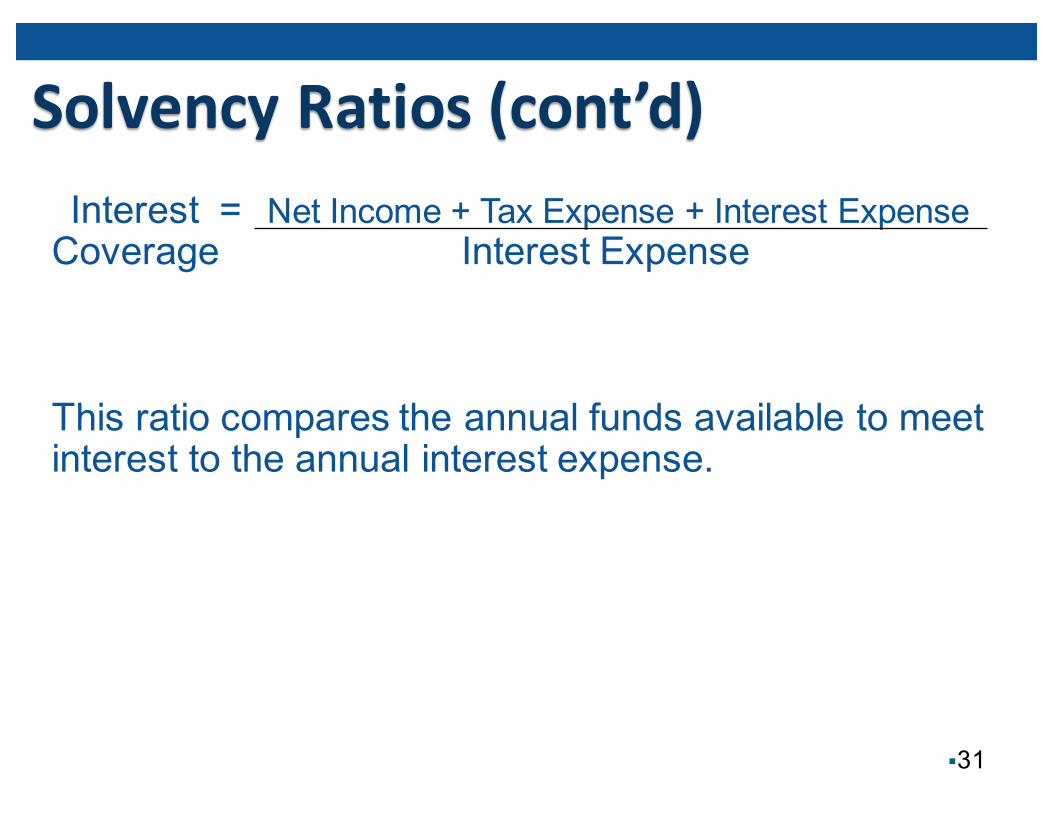
Interest = Net Income + Tax Expense + Interest ExpenseCoverage Interest Expense
This ratio compares the annual funds available to meet interest to the annual interest expense.
Solvency Ratios (cont’d)
§32
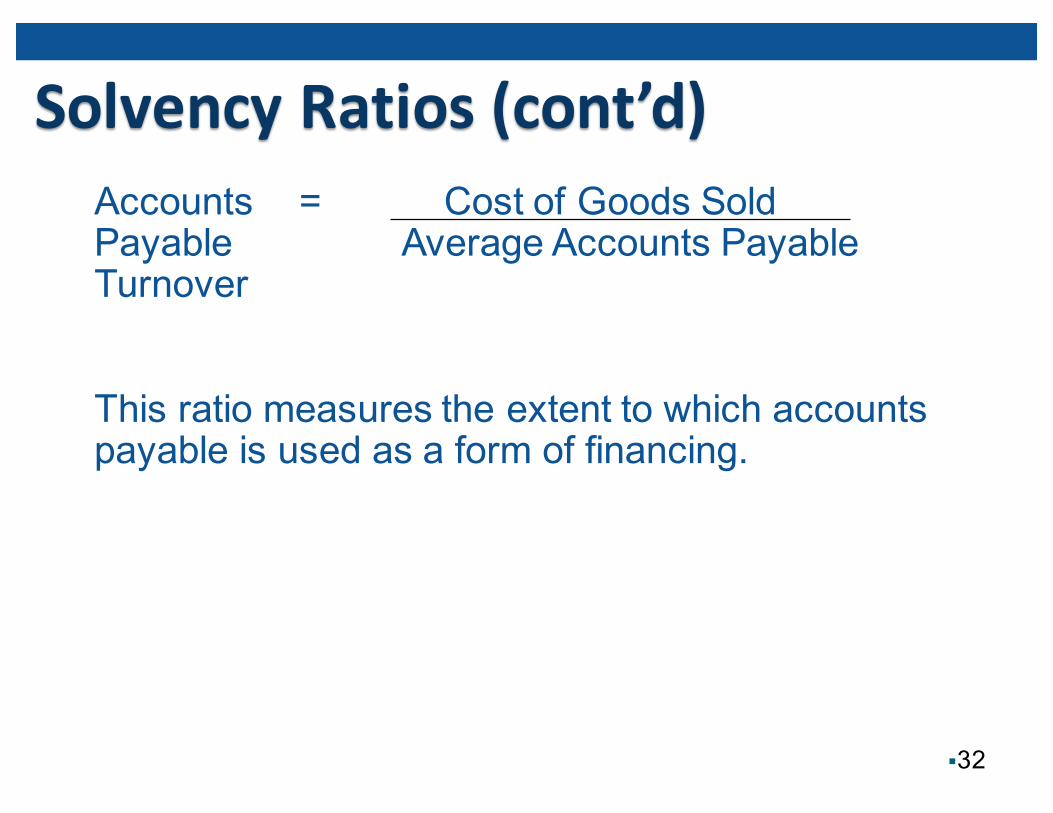
Accounts = Cost of Goods SoldPayable Average Accounts PayableTurnover
This ratio measures the extent to which accounts payable is used as a form of financing.
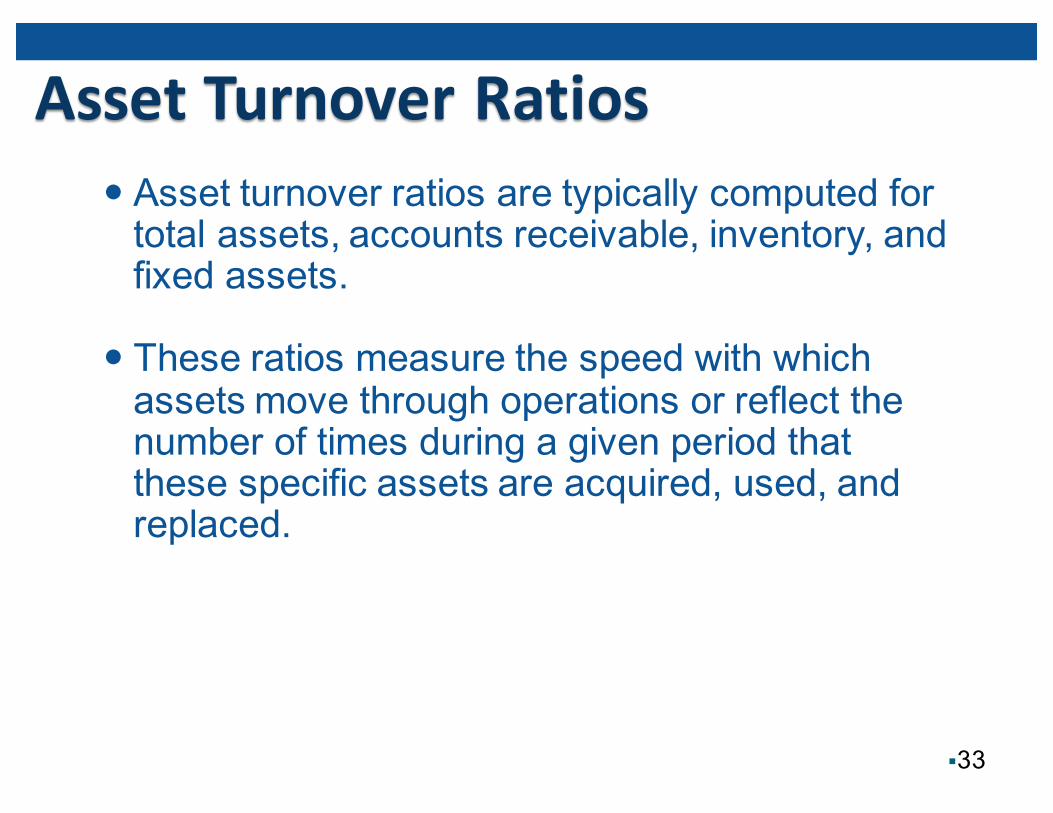
Asset Turnover Ratios Asset turnover ratios are typically computed for total assets, accounts receivable, inventory, and fixed assets.
These ratios measure the speed with which assets move through operations or reflect the number of times during a given period that these specific assets are acquired, used, and replaced.
§33
Asset Turnover Ratios (cont’d)
§34
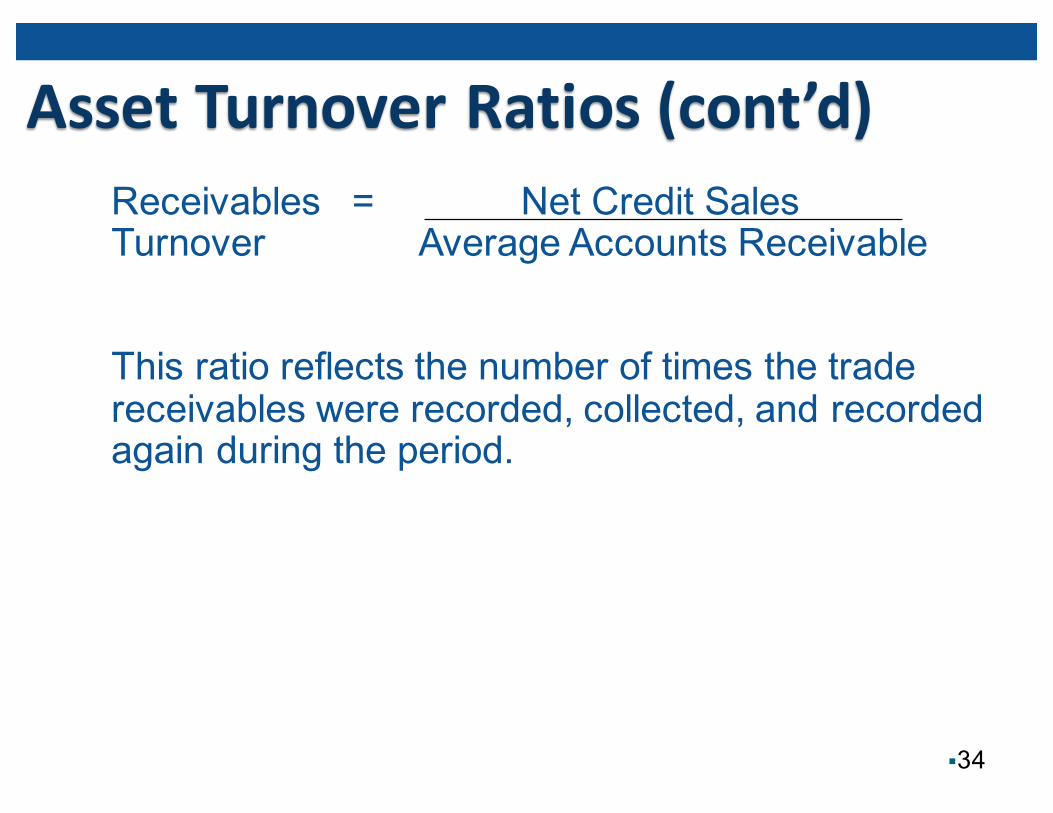
Receivables = Net Credit SalesTurnover Average Accounts Receivable
This ratio reflects the number of times the trade receivables were recorded, collected, and recorded again during the period.
Asset Turnover Ratios (cont’d)
§35
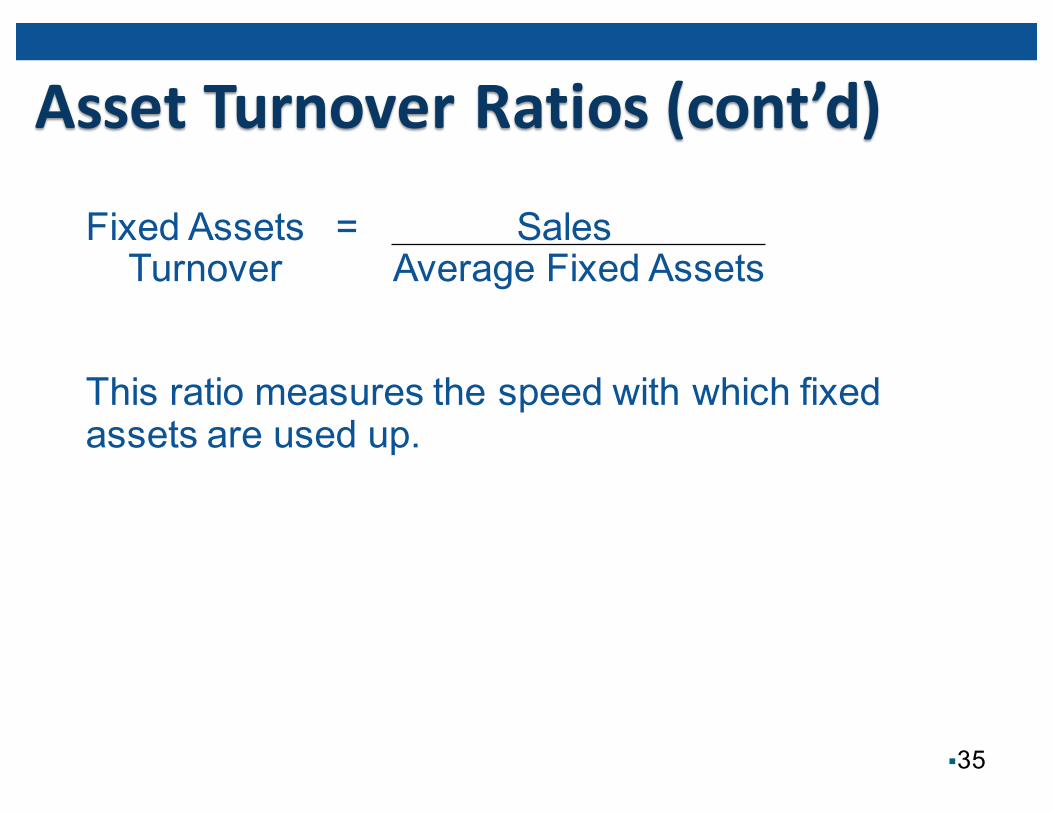
Fixed Assets = SalesTurnover Average Fixed Assets
This ratio measures the speed with which fixed assets are used up.
Asset Turnover Ratios (cont’d)
§36
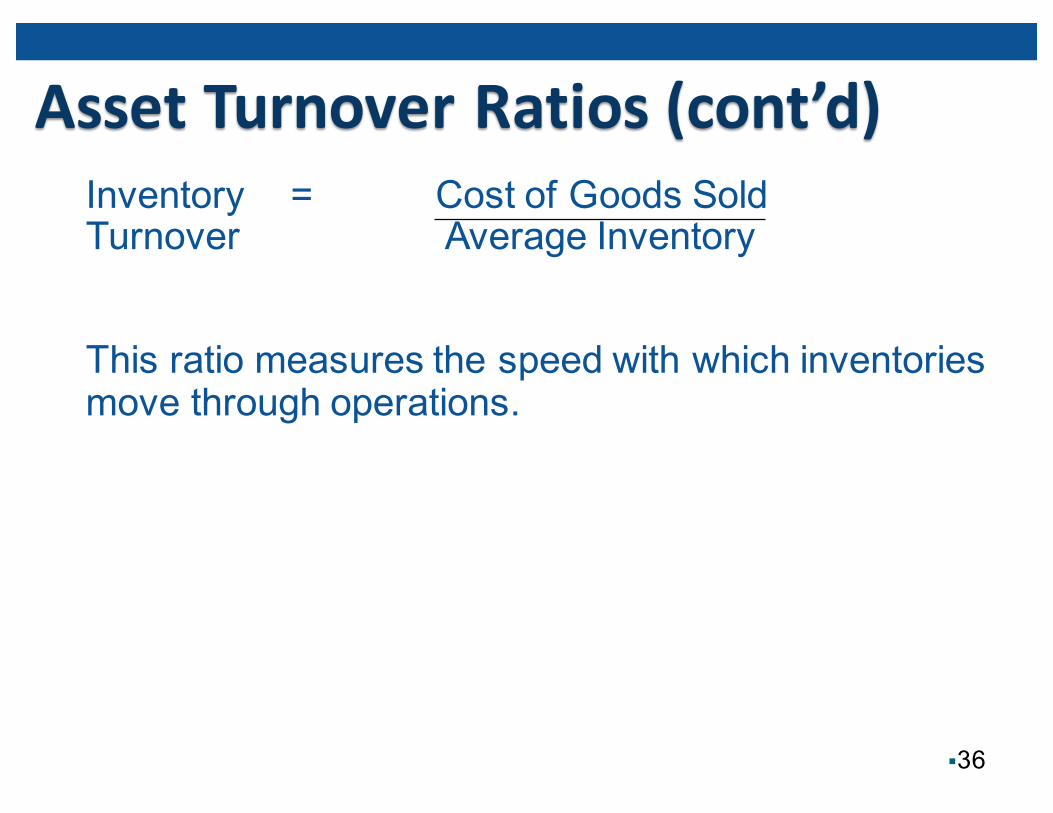
Inventory = Cost of Goods SoldTurnover Average Inventory
This ratio measures the speed with which inventories move through operations.
Asset Turnover Ratios (cont’d)
§37
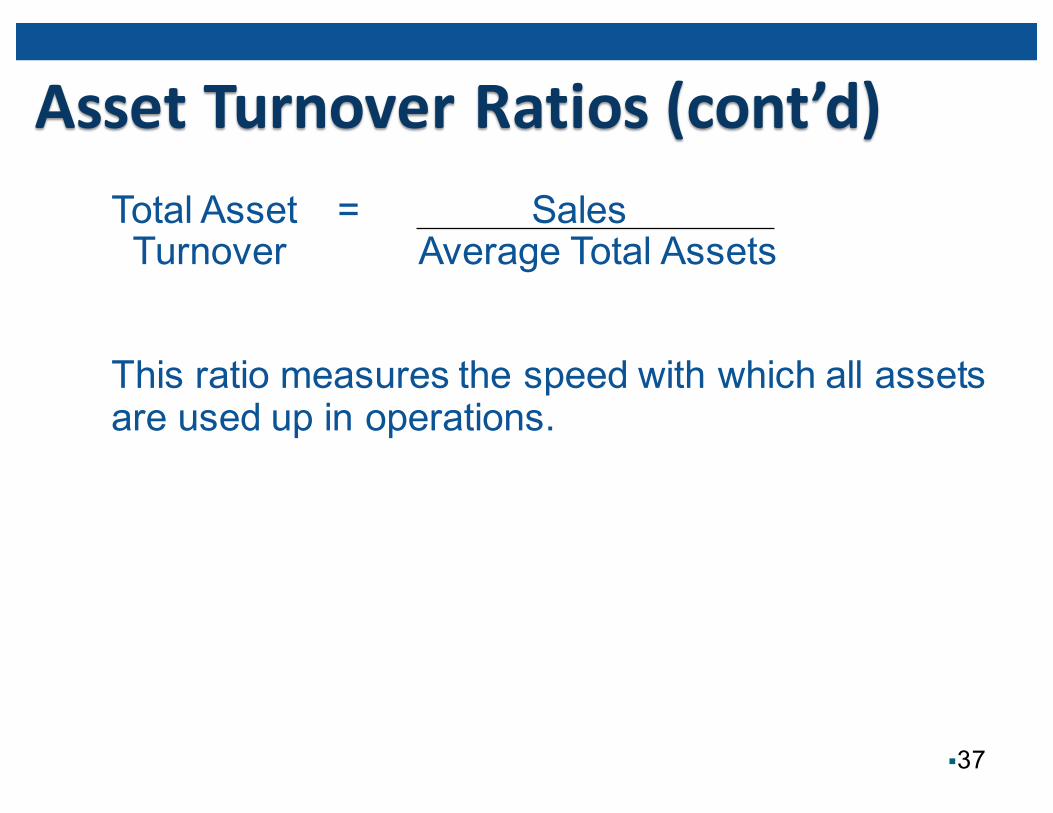
Total Asset = SalesTurnover Average Total Assets
This ratio measures the speed with which all assets are used up in operations.
Other Ratios These additional ratios are used by the financial community to assess company performance.
§38
Other Ratios (cont’d)
§39
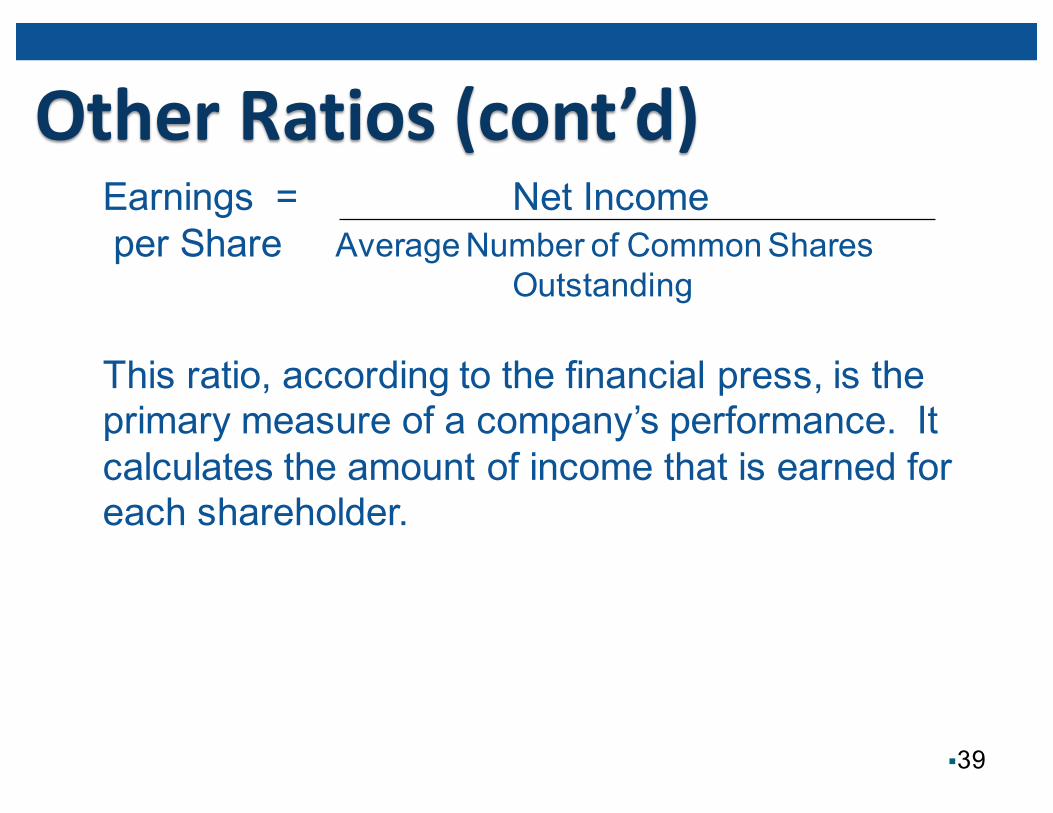
Earnings = Net Incomeper Share Average Number of Common Shares
Outstanding
This ratio, according to the financial press, is the primary measure of a company’s performance. It calculates the amount of income that is earned for each shareholder.
Other Ratios (cont’d)
§40
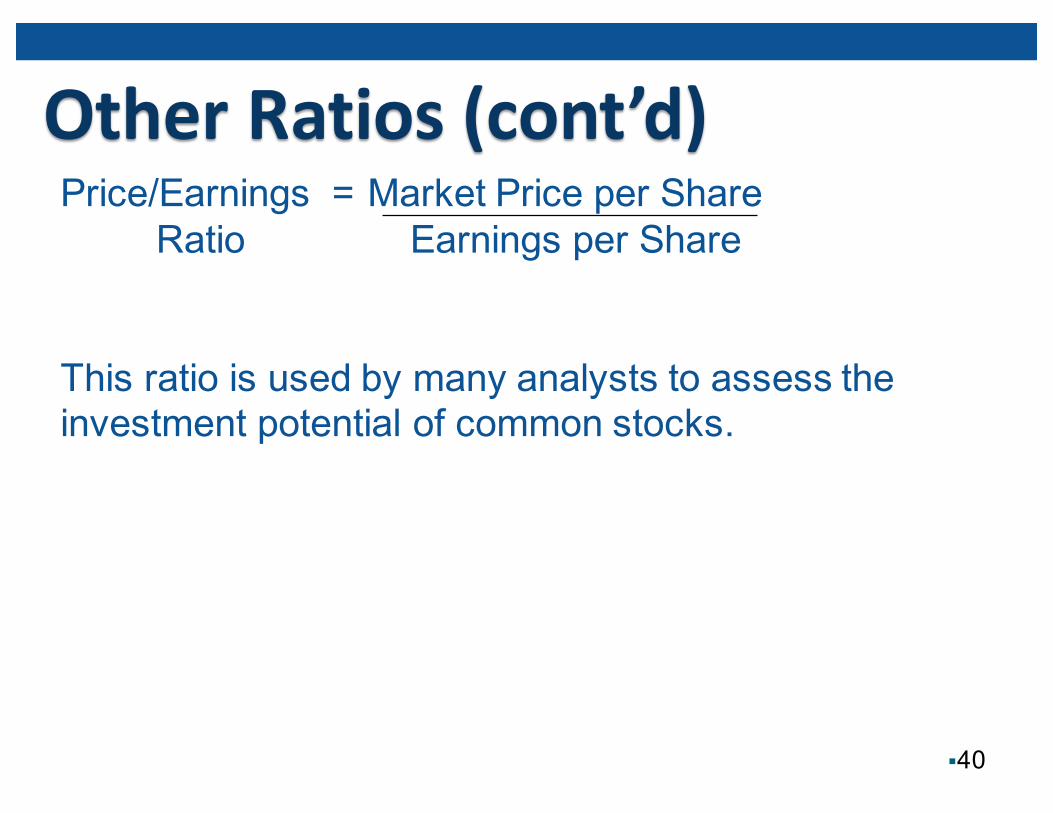
Price/Earnings = Market Price per ShareRatio Earnings per Share
This ratio is used by many analysts to assess the investment potential of common stocks.
Other Ratios (cont’d)
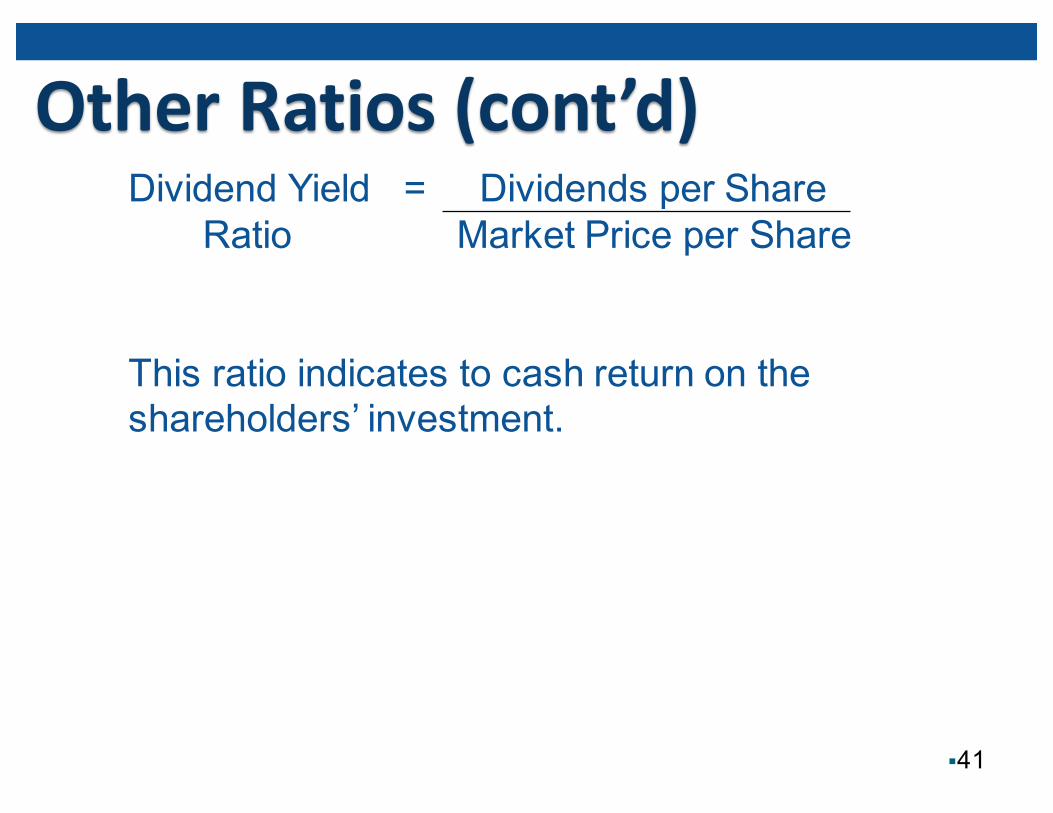
§41
Dividend Yield = Dividends per ShareRatio Market Price per Share
This ratio indicates to cash return on the shareholders’ investment.
Other Ratios (cont’d)
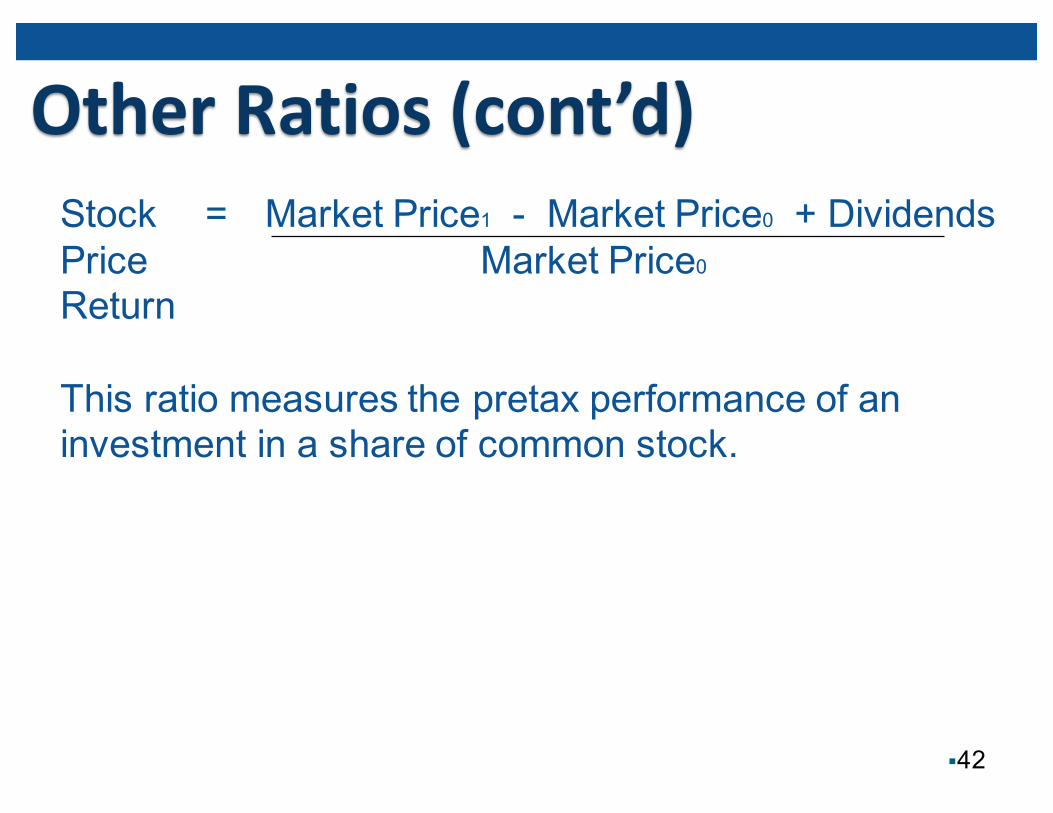
§42
Stock = Market Price1 - Market Price0 + DividendsPrice Market Price0Return
This ratio measures the pretax performance of an investment in a share of common stock.
Predict Future Earnings and Cash Flow
§43
• After previous analysis mathematical models can be used to predict future earnings and future earnings. This is used to:• Predict stock price• Determine credit worthiness
Comparisons Across Different Countries • Investors interested in comparing the financial performance and condition of companies from different countries often must contend with two difficult issues:
• If the companies use different accounting standards (e.g., U.S. GAAP vs. IFRS), the reported values must be adjusted to a common basis so that reasonable comparisons can be made.
• Adjusting financial statements to a common basis by itself may not be sufficient to achieve meaningful comparisons. In other words, not only must the financial statements of a foreign-based company be adjusted, but the resulting numbers can only be interpreted through an understanding of the foreign environment.
§44
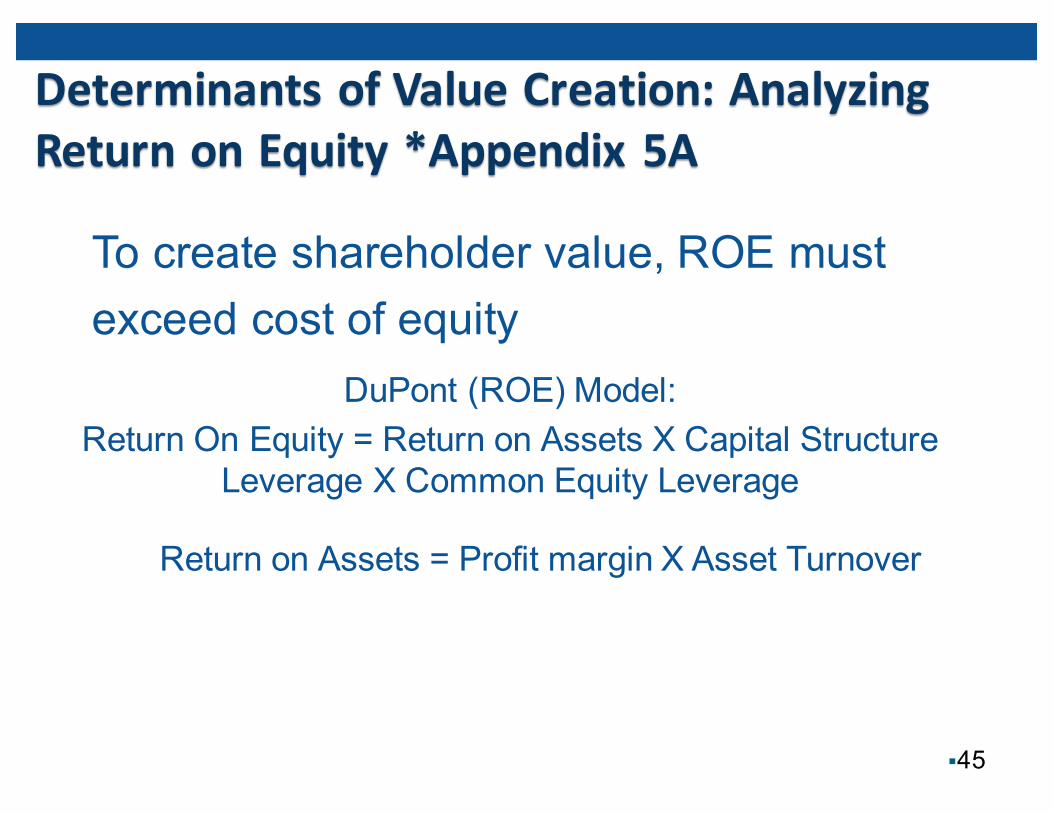
Determinants of Value Creation: Analyzing Return on Equity *Appendix 5A
§45
DuPont (ROE) Model:Return On Equity = Return on Assets X Capital Structure
Leverage X Common Equity Leverage
Return on Assets = Profit margin X Asset Turnover
To create shareholder value, ROE must exceed cost of equity
*Appendix 5A -‐ Cash Flow Analysis
§46
• Analyzing a company’s cash flow tells us a great deal about company performance and financial position.• Operating performance• Financial flexibility• Liquidity
• The statement of cash flows can be used to develop a cash flow profile
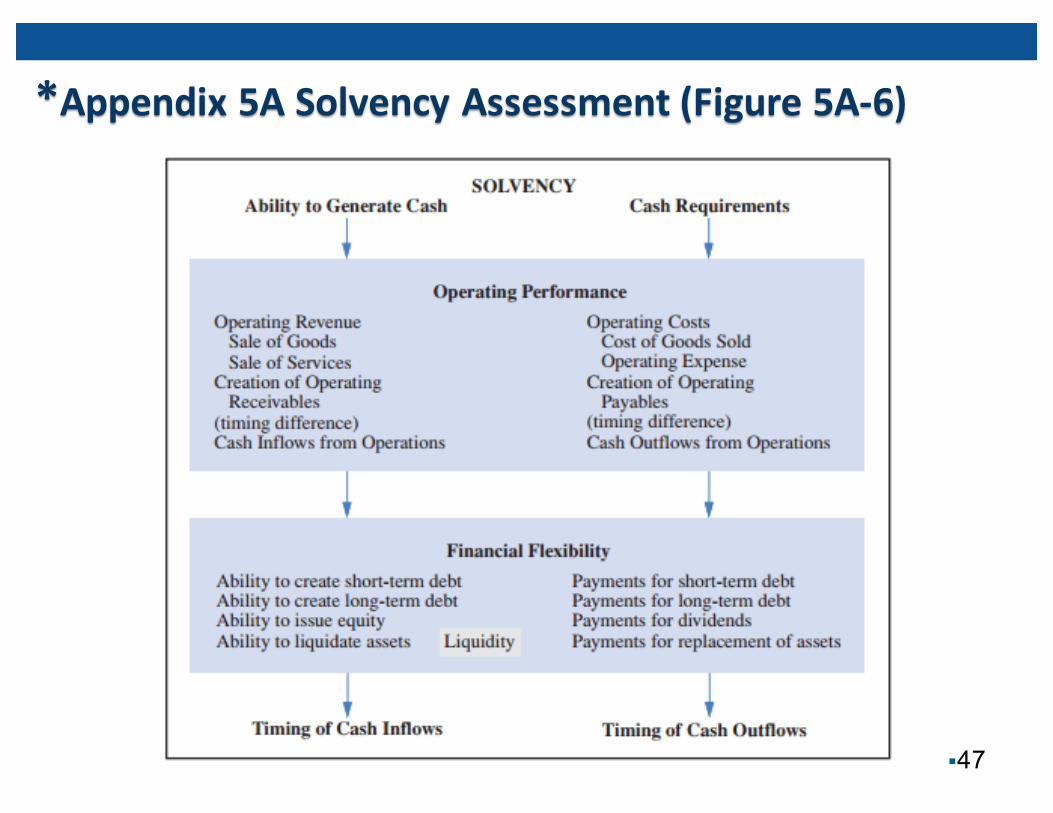
*Appendix 5A Solvency Assessment (Figure 5A-‐6)
§47
*Appendix 5A -‐ Projecting Future Financial Statements
Financial analysis includes attempting to project future financial statements. To do so: Predict future sales Predict future profit margins Based on sales predictions, estimate the level of assets necessary to support that level of sales
Choose a target financing mix.
§48
Copyright
§49
Copyright © 2014 John Wiley & Sons, Inc. All rights reserved. Reproduction or translation of this work beyond that permitted in Section 117 of the 1976 United States Copyright Act without the express written permission of the copyright owner is unlawful. Request for further information should be addressed to the
Permissions Department, John Wiley & Sons, Inc. The purchaser may make back-up copies for his/her own use only and not for
distribution or resale. The Publisher assumes no responsibility for errors, omissions, or damages, caused by the use of these
programs or from the use of the information contained herein.


![$ EDUCATIONAL FACILITIES REVENUE [AND REVENUE REFUNDING… · EDUCATIONAL FACILITIES REVENUE [AND REVENUE REFUNDING] ... Educational Facilities Revenue [and Revenue ... Aeronautical](https://img.pdfslide.us/doc/110x75/5b16e1207f8b9a686d8e7aa7/-educational-facilities-revenue-and-revenue-refunding-educational-facilities.jpg)