Embed Size (px)
Citation preview
Chapter 12
Evaluating VR Systems and Experiences
Steven M. LaValle
University of Illinois
Copyright Steven M. LaValle 2015, 2016
Available for downloading at http://vr.cs.uiuc.edu/
Chapter 12
Evaluating VR Systems andExperiences
Which headset is better? Which VR experience is more comfortable over a longperiod of time? How much field of view is enough? What is the most appropri-ate interaction mechanism? Engineers and developers want to know the answersto these kinds of questions; however, it should be clear at this point that theseare difficult to answer because of the way that human physiology and perceptionoperate and interact with engineered systems. By contrast, pure engineering ques-tions, such as “What is the estimated battery life?” or “What is the vehicle’s topspeed on level ground?”, are much more approachable.
Recall the definition of VR from Section 1.1, which involves an organism.When VR is applied by scientists to study the neural structures and perception ofa rat, there is a clear separation between the rat and the scientist. However, in thecase of VR for humans, the developer frequently tries out his own creations. In thiscase, the developer alternates between the role of scientist and rat. This introducesnumerous problems, especially if the developer is naive about perceptual issues.
Further complicating matters is adaptation, which occurs on all scales. Forexample, a person evaluating a VR experience many times over several weeks mayinitially find it uncomfortable, but later become accustomed to it. Of course thisdoes not imply that its likelihood of making a fresh user sick is lower. There is alsogreat variation across people. Any one person, including the developer, providesjust one data point. People who are immune to sickness from vection will haveno trouble developing such systems and inflicting them upon others.
Another factor is that most people who create systems are biased towardliking what they create. Furthermore, as discussed in Section 8.4, just having theknowledge of what the experience represents can effect vection. These issues fallunder the general heading of human factors, which has been studied for decades.One closely related area is human-computer interaction (HCI), which uses themethods discussed in this section. However, since VR works by disrupting thelow-level operation of sensory systems that we have trusted for our entire lives,
331
332 S. M. LaValle: Virtual Reality
the level of complications from the lowest-level side effects to the highest-levelcognitive effects seems unprecedented.
Opportunities for failure exist at all levels, from hardware, to low-level soft-ware, to content creation engines. As hardware and low-level software rapidlyimprove, the burden is shifting more to developers of software engines and VRexperiences. This chapter presents several topics that may aid engineers anddevelopers in their quest to build better VR systems and experiences. Section12.1 introduces methods for guiding them to improve their discriminatory power.Rather than adapting to become oblivious to a problem, a developer could trainherself to become more sensitive to problems. Section 12.2 applies the funda-mentals from this book to provide simple advice for VR developers. Section 12.3covers VR sickness, including the main symptoms and causes, so that VR systemsand experiences may be improved. Section 12.4 introduces general methods fordesigning experiments that involve human subjects, and includes some specificmethods from psychophysics. All of the concepts from this chapter should beused to gain critical feedback and avoid pitfalls in an iterative VR developmentprocess.
12.1 Perceptual Training
Most people who try VR for the first time are unaware of technical flaws that wouldbe obvious to some experienced engineers and developers. If the VR experienceis functioning as it should, then the user should be overwhelmed by dominantvisual stimuli and feel as if he is inhabiting the virtual world. Minor flaws may besubtle or unnoticeable as attention is focused mainly on the targeted experience(as considered in the definition of VR from Section 1.1). Some parts might notbe functioning as designed or some perceptual issues might have been neglected.This might result in an experience as that not as good as it could have been afterperforming some simple adjustments. Even worse, the flaws might cause the userto become fatigued or sick. At the end, such users are usually not consciouslyaware of what went wrong. They might blame anything, such as particular visualstimuli, a particular experience, the headset hardware, or even the whole conceptof VR.
This problem can be mitigated by training specific users and developers tonotice common types of flaws. By developing a program of perceptual training,a user could be requested to look for a particular artifact or shortcoming, or torepeatedly practice performing some task. Throughout this book, we have seenthe importance of adaptation in human perceptual processes. For example, ifa constant stimulus is presented over a long period of time, then its perceivedintensity diminishes.
Through repeated and guided exposure to a particular VR system and ex-perience, users can adapt their perceptual systems. This is a form of perceptuallearning, which is a branch of perceptual psychology that studies long-lasting
12.1. PERCEPTUAL TRAINING 333
changes to the perceptual systems of an organism in response to its environment.As VR becomes a new environment for the organism, the opportunities and limitsof perceptual learning remain largely unexplored. Through active training, theway in which users adapt can be controlled so that their perceptual abilities anddiscrimination power increases. This in turn can be used train evaluators whoprovide frequent feedback in the development process. An alternative is to de-velop an automated system that can detect flaws without human intervention.It is likely that a combination of both human and automatic evaluation will beimportant in the years to come.
Examples of perceptual learning In everyday life we encounter many exam-ples of perceptual learning, for each of the senses. Regarding vision, doctors andmedical technicians are trained to extract relevant information from images thatappear to be a confusing jumble to the untrained eye. A cancer specialist canspot tumors in CT and MRI scans. An obstetrician can effortlessly determine,from a hand-held ultrasound scanner, whether structures in a fetus are developingnormally. Regarding hearing, musicians learn to distinguish and classify variousmusical notes after extensive practice. Audiophiles learn to notice particular flawsin music reproduction due to recording, compression, speaker, and room-acousticissues. Regarding taste and smell, a sommelier learns to distinguish subtle dif-ferences between wines. Regarding touch, the blind learn to read Braille, whichis expressed as tiny patterns of raised dots that are felt with fingertips. All ofthese examples seem impossible to a newcomer, to the point that it would seemwe do not even have the neural hardware for accomplishing it. Nevertheless,through established perceptual training programs and/or repeated practice, peo-ple can acquire surprisingly powerful perceptual abilities. Why not do the samefor evaluating VR?
Perceptual learning factors and mechanisms What happens to human per-ceptual systems when these forms of learning occur? One important factor is neu-roplasticity, which enables human brains to develop specialized neural structuresas an adaptation to environmental stimuli. Although this is much stronger withsmall children, as exhibited in the case of native language learning, neuroplasticityremains through adults lives; the amount may highly vary across individuals.
Another factor is the way in which the learning occurs. Adaptations mightoccur from casual observation or targeted strategies that focus on the stimulus.The time and repetition involved for the learning to take place might vary greatly,depending on the task, performance requirements, stimuli, and person. Further-more, the person might be given supervised training, in which feedback is directlyprovided as she attempts to improve her performance. Alternatively, unsuper-vised training may occur, in which the trainer has placed sufficient stimuli in thelearner’s environment, but does not interfere with the learning process.
Four basic mechanisms have been developed to explain perceptual learning
334 S. M. LaValle: Virtual Reality
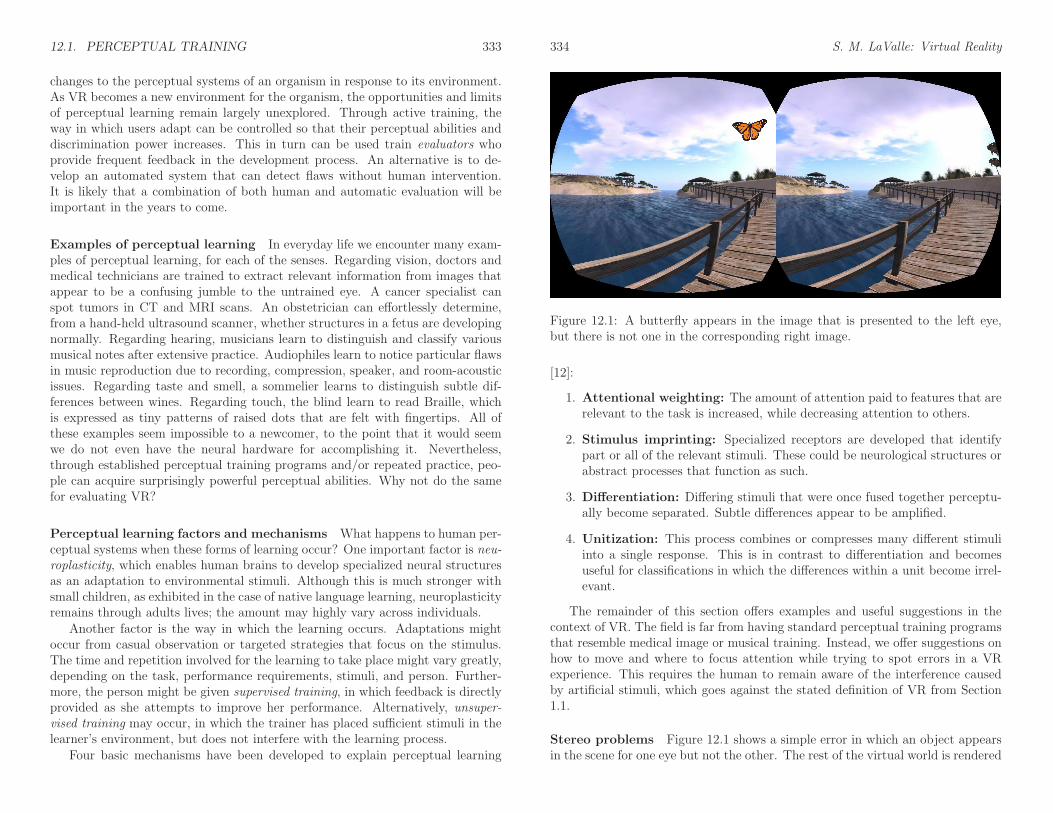
Figure 12.1: A butterfly appears in the image that is presented to the left eye,but there is not one in the corresponding right image.
[12]:
1. Attentional weighting: The amount of attention paid to features that arerelevant to the task is increased, while decreasing attention to others.
2. Stimulus imprinting: Specialized receptors are developed that identifypart or all of the relevant stimuli. These could be neurological structures orabstract processes that function as such.
3. Differentiation: Differing stimuli that were once fused together perceptu-ally become separated. Subtle differences appear to be amplified.
4. Unitization: This process combines or compresses many different stimuliinto a single response. This is in contrast to differentiation and becomesuseful for classifications in which the differences within a unit become irrel-evant.
The remainder of this section offers examples and useful suggestions in thecontext of VR. The field is far from having standard perceptual training programsthat resemble medical image or musical training. Instead, we offer suggestions onhow to move and where to focus attention while trying to spot errors in a VRexperience. This requires the human to remain aware of the interference causedby artificial stimuli, which goes against the stated definition of VR from Section1.1.
Stereo problems Figure 12.1 shows a simple error in which an object appearsin the scene for one eye but not the other. The rest of the virtual world is rendered
12.1. PERCEPTUAL TRAINING 335
correctly. This may go completely unnoticed to untrained eyes. Solution: Closethe left eye, while keeping the right one open; after that, switch to having the lefteye open and the right eye closed. By switching back and forth between havinga single eye open, the mismatch should become clear. This will be called theeye-closing trick.
Another common error is to have the right and left eye images reversed. It iseasy have this problem after making a sign error in (3.50), or misunderstandingwhich way the viewpoint needs to shift for each eye. The phenomenon is knownas pseudoscopic vision, in which the perceived concavity of objects may be seemreversed. In many cases, however, it is difficult to visually detect the error. So-lution: Approach the edge of an object so that one side of it is visible to one eyeonly. This can be verified by using the eye-closing trick. Based on the geometryof the object, make sure that the side is visible to the correct eye. For example,the left eye should not be the only one to see the right side of a box.
Finally, stereoscopic vision could have an incorrect distance between the virtualpupils (the t parameter in (3.50)). If t = 0, then the eye closing trick could beused to detect that the two images look identical. If t is too large or too small,then depth and scale perception (Section 6.1) are affected. A larger separation t
would cause the world to appear smaller; a smaller t would cause the opposite.
Canonical head motions Now consider errors that involve movement, whichcould be caused by head tracking errors, the rendering perspective, or some com-bination. It is helpful to make careful, repeatable motions, which will be calledcanonical head motions. If rotation alone is tracked, then there are three rota-tional DOFs. To spot various kinds of motion or viewpoint errors, the evaluatorshould be trained to carefully perform individual, basic rotations. A pure yaw canbe performed by nodding a “no” gesture. A pure pitch appears as a pure “yes”gesture. A pure roll is more difficult to accomplish, which involves turning thehead back and forth so that one eye is higher than the other at the extremes. Inany of these movements, it may be beneficial to translate the cyclopean viewpoint(point between the center of the eyes) as little as possible, or follow as closely tothe translation induced by the head model of Section 9.1.
For each of these basic rotations, the evaluator should practice performingthem at various, constant angular velocities and amplitudes. For example, sheshould try to yaw her head very slowly, at a constant rate, up to 45 each way.Alternatively, she should try to rotate at a fast rate, up to 10 degrees each way,perhaps with a frequency of 2 Hz. Using canonical head motions, common errorsthat were given in Figure 9.7 could be determined. Other problems, such as adiscontinuity in the tracking, tilt errors, latency, and the incorrect depth of theviewpoint can be more easily detected in this way.
If position is tracked as well, then three more kinds of canonical head motionsbecome important, one for each position DOF. Thus, horizontal, vertical, anddepth-changing motions can be performed to identify problems. For example, with
336 S. M. LaValle: Virtual Reality
horizontal, side-to-side motions, it can be determined whether motion parallax isfunctioning correctly.
VOR versus smooth pursuit Recall from Sections 5.3, 5.4, and 6.2 that eyemovements play an important role in visual perception. An evaluator should inmind the particular eye movement mode when evaluating whether an object inthe virtual world is actually stationary when it is supposed to be. If a canonicalyaw motion is made while eyes are fixated on the object, then the vestibulo-ocularreflex (VOR) is invoked. In this case, then the evaluator can determine whetherthe object appears to move or distort its shape while the image of the object isfixed on the retina. Similarly, if an object is slowly moving by and the head isfixed, the evaluator performs smooth pursuit to keep the object on the retina.As indicated in Section 5.4, the way in which an object appears to distort fora line-by-line scanout display depends on whether the motion is due to VOR orsmooth pursuit. If the object moves by very quickly and the eyes do not keep itfixed on the retina, then it may be possible to perceive the zipper effect.
Peripheral problems The current generation of VR headsets have significantoptical aberration issues; recall from Section 4.3 that these become worse as thedistance from the optical axis increases. It is important to distinguish betweentwo cases: 1) Looking through the center of the lens while detecting distortionat the periphery, and 2) rotating the eyes to look directly through the edge ofthe lens. Distortion might be less noticeable in the first case because of lowerphotoreceptor density at the periphery; however, mismatches could neverthelesshave an impact on comfort and sickness. Optical flow signals are strong at theperiphery, and mismatched values may be perceived as incorrect motions.
In the second case, looking directly through the lens might reveal lack offocus at the periphery, caused by spherical aberration. Also, chromatic aberrationmay become visible, especially for sharp white lines against a black background.Furthermore, errors in pincushion distortion correction may be come evident asa straight line appears to become curved. These problems cannot be fixed bya single distortion correction function (as covered in Section 7.3) because thepupil translates away from the optical axis when the eye rotates. A different,asymmetric correction function would be needed for each eye orientation, whichwould require eye tracking to determine which correction function to use at eachtime instant.
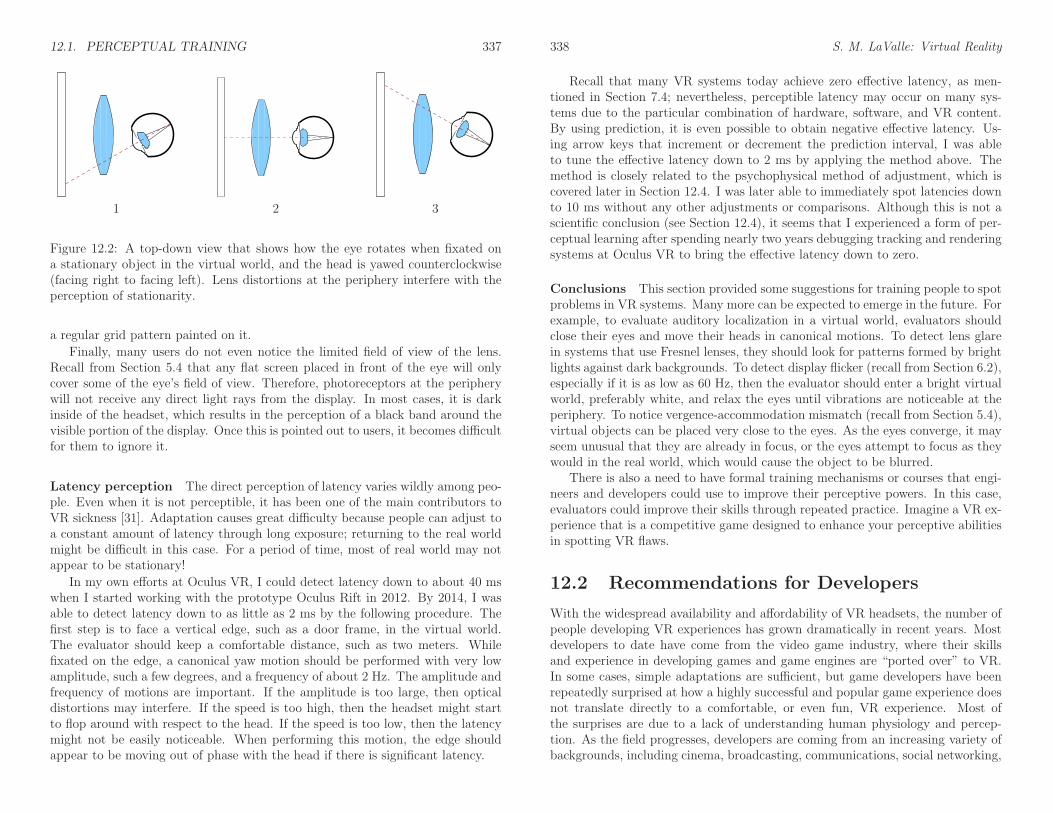
To observe pincushion or barrel distortion the evaluator should apply a canon-ical yaw motion over as large of an amplitude as possible, while fixating on anobject. In this case, the VOR will cause the eye to rotate over a large rangewhile sweeping its view across the lens from side to side, as shown in Figure 12.2.If the virtual world contains a large, flat wall with significant texture or spatialfrequency, then distortions could become clearly visible as the wall appears to be“breathing” during the motion. The effect may be more noticeable if the wall has
12.1. PERCEPTUAL TRAINING 337
1 2 3
Figure 12.2: A top-down view that shows how the eye rotates when fixated ona stationary object in the virtual world, and the head is yawed counterclockwise(facing right to facing left). Lens distortions at the periphery interfere with theperception of stationarity.
a regular grid pattern painted on it.
Finally, many users do not even notice the limited field of view of the lens.Recall from Section 5.4 that any flat screen placed in front of the eye will onlycover some of the eye’s field of view. Therefore, photoreceptors at the peripherywill not receive any direct light rays from the display. In most cases, it is darkinside of the headset, which results in the perception of a black band around thevisible portion of the display. Once this is pointed out to users, it becomes difficultfor them to ignore it.
Latency perception The direct perception of latency varies wildly among peo-ple. Even when it is not perceptible, it has been one of the main contributors toVR sickness [31]. Adaptation causes great difficulty because people can adjust toa constant amount of latency through long exposure; returning to the real worldmight be difficult in this case. For a period of time, most of real world may notappear to be stationary!
In my own efforts at Oculus VR, I could detect latency down to about 40 mswhen I started working with the prototype Oculus Rift in 2012. By 2014, I wasable to detect latency down to as little as 2 ms by the following procedure. Thefirst step is to face a vertical edge, such as a door frame, in the virtual world.The evaluator should keep a comfortable distance, such as two meters. Whilefixated on the edge, a canonical yaw motion should be performed with very lowamplitude, such a few degrees, and a frequency of about 2 Hz. The amplitude andfrequency of motions are important. If the amplitude is too large, then opticaldistortions may interfere. If the speed is too high, then the headset might startto flop around with respect to the head. If the speed is too low, then the latencymight not be easily noticeable. When performing this motion, the edge shouldappear to be moving out of phase with the head if there is significant latency.
338 S. M. LaValle: Virtual Reality
Recall that many VR systems today achieve zero effective latency, as men-tioned in Section 7.4; nevertheless, perceptible latency may occur on many sys-tems due to the particular combination of hardware, software, and VR content.By using prediction, it is even possible to obtain negative effective latency. Us-ing arrow keys that increment or decrement the prediction interval, I was ableto tune the effective latency down to 2 ms by applying the method above. Themethod is closely related to the psychophysical method of adjustment, which iscovered later in Section 12.4. I was later able to immediately spot latencies downto 10 ms without any other adjustments or comparisons. Although this is not ascientific conclusion (see Section 12.4), it seems that I experienced a form of per-ceptual learning after spending nearly two years debugging tracking and renderingsystems at Oculus VR to bring the effective latency down to zero.
Conclusions This section provided some suggestions for training people to spotproblems in VR systems. Many more can be expected to emerge in the future. Forexample, to evaluate auditory localization in a virtual world, evaluators shouldclose their eyes and move their heads in canonical motions. To detect lens glarein systems that use Fresnel lenses, they should look for patterns formed by brightlights against dark backgrounds. To detect display flicker (recall from Section 6.2),especially if it is as low as 60 Hz, then the evaluator should enter a bright virtualworld, preferably white, and relax the eyes until vibrations are noticeable at theperiphery. To notice vergence-accommodation mismatch (recall from Section 5.4),virtual objects can be placed very close to the eyes. As the eyes converge, it mayseem unusual that they are already in focus, or the eyes attempt to focus as theywould in the real world, which would cause the object to be blurred.
There is also a need to have formal training mechanisms or courses that engi-neers and developers could use to improve their perceptive powers. In this case,evaluators could improve their skills through repeated practice. Imagine a VR ex-perience that is a competitive game designed to enhance your perceptive abilitiesin spotting VR flaws.
12.2 Recommendations for Developers
With the widespread availability and affordability of VR headsets, the number ofpeople developing VR experiences has grown dramatically in recent years. Mostdevelopers to date have come from the video game industry, where their skillsand experience in developing games and game engines are “ported over” to VR.In some cases, simple adaptations are sufficient, but game developers have beenrepeatedly surprised at how a highly successful and popular game experience doesnot translate directly to a comfortable, or even fun, VR experience. Most ofthe surprises are due to a lack of understanding human physiology and percep-tion. As the field progresses, developers are coming from an increasing variety ofbackgrounds, including cinema, broadcasting, communications, social networking,
12.2. RECOMMENDATIONS FOR DEVELOPERS 339
visualization, and engineering. Artists and hobbyists have also joined in to makesome of the most innovative experiences.
This section provides some useful recommendations, which are based on acombination of the principles covered in this book, and recommendations fromother developer guides (especially [59]). This is undoubtedly an incomplete listthat should grow in coming years as new kinds of hardware and experiences aredeveloped. The vast majority of VR experiences to date are based on successful3D video games, which is evident in the kinds of recommendations being made bydevelopers today. Most of the recommendations below link to prior parts of thisbook, which provide scientific motivation or further explanation.
Virtual worlds
• Set units in the virtual world that match the real world so that scales canbe easily matched. For example, one unit equals one meter in the virtualworld. This helps with depth and scale perception (Section 6.1).
• Make sure that objects are completely modeled so that missing parts arenot noticeable as the user looks at them from viewpoints that would havebeen unexpected for graphics on a screen.
• Very thin objects, such as leaves on a tree, might look incorrect in VR dueto varying viewpoints.
• Design the environment so that less locomotion is required; for example, avirtual elevator would be more comfortable than virtual stairs (Sections 8.4and 10.2).
• Consider visual and auditory rendering performance issues and simplify thegeometric models as needed to maintain the proper frame rates on targetedhardware (Sections 7.4 and 11.4).
Visual rendering
• The only difference between the left and right views should be the viewpoint,not models, textures, colors, and so on (Sections 3.5 and 12.1).
• Never allow words, objects, or images to be fixed to part of the screen; allcontent should appear to be embedded in the virtual world. Recall fromSection 2.1 that being stationary on the screen is not the same as beingperceived as stationary in the virtual world.
• Be careful when adjusting the field of view for rendering or any parametersthat affect lens distortion that so the result does not cause further mismatch(Sections 7.3 and 12.1).
340 S. M. LaValle: Virtual Reality
• Re-evaluate common graphics tricks such as texture mapping and normalmapping, to ensure that they are effective in VR as the user has stereoscopicviewing and is able to quickly change viewpoints (Section 7.2).
• Anti-aliasing techniques are much more critical for VR because of the varyingviewpoint and stereoscopic viewing (Section 7.2).
• The rendering system should be optimized so that the desired virtual worldcan be updated at a frame rate that is at least as high as the hardware re-quirements (for example, 90 FPS for Oculus Rift and HTC Vive); otherwise,the frame rate may decrease and vary, which causes discomfort (Section 7.4.)
• Avoid movements of objects that cause most of the visual field to changein the same way; otherwise, the user might feel as if she is moving (Section8.4).
• Determine how to cull away geometry that is too close to the face of theuser; otherwise, substantial vergence-accommodation mismatch will occur(Section 5.4).
• Unlike in games and cinematography, the viewpoint should not change ina way that is not matched to head tracking, unless the intention is for theuser to feel as if she is moving in the virtual world, which itself can beuncomfortable (Section 10.2).
• For proper depth and scale perception, the interpupillary distance of theuser in the real world should match the corresponding viewpoint distancebetween eyes in the virtual world (Section 6.1).
• In comparison to graphics on a screen, reduce the brightness and contrastof the models to increase VR comfort.
Tracking and the matched zone
• Never allow head tracking to be frozen or delayed; otherwise, the user mightimmediately perceive self-motion (Section 8.4).
• Make sure that the eye viewpoints are correctly located, considering stereooffsets (Section 3.5), head models (Section 9.1), and locomotion (Section10.2).
• Beware of obstacles in the real world that do not exist in the virtual world; awarning system may be necessary as the user approaches an obstacle (Section8.3.1).
• Likewise, beware of obstacles in the virtual world that do not exist in the realworld. For example, it may have unwanted consequences if a user decidesto poke his head through a wall (Section 8.3.1).
12.2. RECOMMENDATIONS FOR DEVELOPERS 341
• As the edge of the tracking region is reached, it is more comfortable togradually reduce contrast and brightness than to simply hold the positionfixed (Section 8.4).
Interaction
• Consider interaction mechanisms that are better than reality by giving peo-ple superhuman powers, rather than applying the universal simulation prin-ciple (Chapter 10).
• For locomotion, follow the suggestions in Section 10.2 to reduce vection sideeffects.
• For manipulation in the virtual world, try to require the user to move aslittle as possible in the physical world; avoid giving the user a case of gorillaarms (Section 10.3).
• With regard to social interaction, higher degrees of realism are not neces-sarily better, due to the uncanny valley (Section 10.4).
User interfaces
• If a floating menu, web browser, or other kind of virtual display appears,then it should be rendered at least two meters away from the user’s viewpointto minimize vergence-accommodation mismatch (Section 5.4).
• Such a virtual display should be centered and have a relatively narrow fieldof view, approximately one-third of the total viewing area, to minimize eyeand head movement. (Section 5.3).
• Embedding menus, options, game status, and other information may bemost comfortable if it appears to be written into the virtual world in waysthat are familiar; this follows the universal simulation principle (Chapter10).
Audio
• Be aware of the difference between a user listening over fixed, external speak-ers versus attached headphones; sound source localization will not functioncorrectly over headphones without tracking (Section 2.1).
• Both position and orientation from tracking and avatar locomotion shouldbe taken into account for auralization (Section 11.4).
• The Doppler effect provides a strong motion cue (Section 11.1).
• Geometric models can be greatly simplified for audio in comparison to visualrendering; a spatial resolution of 0.5 meters is usually sufficient (Section11.4).
342 S. M. LaValle: Virtual Reality
Self appearance
• The feeling of being present in the virtual world and the ability to judgescale in it are enhanced if the user is able to see her corresponding body inVR.
• A simple virtual body is much better than having none at all.
• Unexpected differences between the virtual body and real body may bealarming. They could have a different gender, body type, or species. Thiscould lead to a powerful experience, or could be an accidental distraction.
• If only head tracking is performed, then the virtual body should satisfy somebasic kinematic constraints, rather than decapitating the user in the virtualworld (Section 9.4).
• Users’ self-appearance will affect their social behavior, as well as the waypeople around them react to them (Section 10.4).
12.3 Comfort and VR Sickness
Experiencing discomfort as a side effect of using VR systems has been the largestthreat to widespread adoption of the technology over the past decades. It is con-sidered the main reason for its failure to live up to overblown expectations inthe early 1990s. Few people want a technology that causes them to suffer whileusing it, and in many cases long after using it. It has also been frustrating forresearchers to characterize VR sickness because of many factors such as variationamong people, adaptation over repeated use, difficulty of measuring symptoms,rapidly changing technology, and content-dependent sensitivity. Advances in dis-play, sensing, and computing technologies have caused the adverse side effectsdue to hardware to reduce; however, they nevertheless remain today in consumerVR headsets. As hardware-based side effects reduce, the burden has been shiftingmore toward software engineers and content developers. This is occurring becausethe VR experience itself has the opportunity to make people sick, even thoughthe hardware may be deemed to be perfectly comfortable. In fact, the best VRheadset available may enable developers to make people more sick than ever be-fore! For these reasons, it is critical for engineers and developers of VR systemsto understand these unfortunate side effects so that they determine how to reduceor eliminate them for the vast majority of users.
Sickness or syndrome In this book, we refer to any unintended, uncomfortableside effects of using a VR system as a form of VR sickness. This might includemany symptoms that are not ordinarily associated with sickness, such as fatigue.A more accurate phrase might therefore be VR maladaptation syndrome, in which
12.3. COMFORT AND VR SICKNESS 343
maladaptation refers to being more harmful than helpful, and syndrome refersto a group of symptoms that consistently occur together in association with theactivity.
Motion sickness variants It is helpful to know terms that are closely relatedto VR sickness because they are associated with similar activities, sets of symp-toms, and potential causes. This helps in searching for related research. Thebroadest area of relevance is motion sickness, with refers to symptoms that areassociated with exposure to real and/or apparent motion. It generally involvesthe vestibular organs (Section 8.2), which implies that they involve sensory inputor conflict regarding accelerations; in fact, people without functioning vestibularorgans do not experience motion sickness [23]. Motion sickness due to real motionoccurs because of unusual forces that are experienced. This could happen fromspinning oneself around in circles, resulting in dizziness and nausea. Similarly,the symptoms occur from being transported by a vehicle that can produce forcesthat are extreme or uncommon. The self-spinning episode could be replaced by ahand-powered merry-go-round. More extreme experiences and side effects can begenerated by a variety of motorized amusement park rides.
Unfortunately, motion sickness extends well beyond entertainment, as manypeople suffer from motion sickness while riding in vehicles designed for transporta-tion. People experience car sickness, sea sickness, and air sickness, from cars,boats, and airplanes, respectively. It is estimated that only about 10% of peoplehave never experienced significant nausea during transportation [31]. Militarieshave performed the largest motion sickness studies because of soldiers spendinglong tours of duty on sea vessels and flying high-speed combat aircraft. About70% of naval personnel experience seasickness, and about 80% of those have de-creased work efficiency or motivation [39]. Finally, another example of unusualforces is space travel, in which astronauts who experience microgravity complainof nausea and other symptoms; this is called space sickness.
Visually induced motion sickness The motion sickness examples so far haveinvolved real motion. By contrast, motion sickness may occur by exposure tostimuli that convince the brain that accelerations are occurring, even though theyare not. This is called apparent motion. The most commonly studied case isvisually induced apparent motion, which is also called vection and was covered inSections 8.4 and 10.2. Symptoms associated with this are part of visually inducedmotion sickness.
Vection (more generally, optical flow) can be generated in many ways. Recallfrom Figure 2.20 of Section 2.3 that extreme vection was caused by a room thatswung while people remained fixed inside. Scientists use an optokinetic drum toconduct controlled experiments in vection and motion sickness by surrounding thesubject with movable visual stimuli. Across a variety of studies that involve par-ticular moving visual fields, only a few subjects are immune to side effects. About
344 S. M. LaValle: Virtual Reality
50% to 100% experience dizziness and about 20% to 60% experience stomachsymptoms; the exact level depends on the particular experiment [31].
Alternatively, displays may be used to generate vection. Recall from Section6.2 that the optical flow perceived in this case is stroboscopic apparent motiondue to a rapid succession of frames. The case of using displays is obviously ofmore interest to us; however, sickness studies that use optokinetic drums remainrelevant because they serve as an important point of reference. They reveal howbad visually induced motion sickness can become, even in the limit of having nodigital artifacts such as display resolution and frame rates.
Simulator sickness and cybersickness Once displays are used, the choicesdiscussed in Section 2.1 reappear: They may be fixed screens that surround theuser (as in a CAVE VR system) or a head-mounted display that requires tracking.Vehicle simulators are perhaps the first important application of VR, with themost common examples being driving a car and flying an airplane or helicopter.The user may sit on a fixed base, or a motorized based that responds to controls.The latter case provides vestibular stimulation, for which time synchronization ofmotion and visual information is crucial to minimize sickness. Usually, the entirecockpit is rebuilt in the real world, and the visual stimuli appear at or outsideof the windows. The head could be tracked to provide stereopsis and varyingviewpoints, but most often this is not done so that comfort is maximized andtechnological side effects are minimized. The branch of visually induced motionsickness that results from this activity is aptly called simulator sickness, whichhas been well-studied by the US military.
The term cybersickness [35] was proposed to cover any sickness associatedwith VR (or virtual environments), which properly includes simulator sickness.Unfortunately, the meaning of the term has expanded in recent times to includesickness associated with spending too much time interacting with smartphones orcomputers in general. Furthermore, the term cyber has accumulated many oddconnotations over the decades. Therefore, we refer to visually induced motionsickness, and any other forms of discomfort that arise from VR, as VR sickness.
Common symptoms of VR sickness A variety of terms are used to refer tosymptoms throughout various motion and VR sickness studies. The most commonare (based on [21, 23, 29, 31, 49]):
• Nausea: In mild form, users may start having unpleasant sensations as-sociated with the stomach, upper abdomen, esophagus, or throat. As theintensity increases, it gradually leads to the feeling of needing to vomit. Thisis the most negative and intimidating symptom of VR sickness.
• Dizziness: Users may feel a sensation of movement, such as spinning, tum-bling, or swaying, even after the stimulus is removed. This may also include
12.3. COMFORT AND VR SICKNESS 345
vertigo, which is similar and often associated with malfunctioning vestibularorgans.
• Drowsiness: Users may become less alert, yawn, and eventually start tofall asleep.
• Increased salivation: The amount of saliva in the mouth increases, caus-ing more swallowing that usual.
• Cold sweating: Users begin to sweat or increase their sweat, but not inresponse to increased ambient temperature.
• Pallor: Users experience a whitening or loss or normal skin color in theface, and possibly ears, neck, and chest.
• Warmth/flushing: This corresponds to a sudden increase in perceivedwarmth, similar to a wave of fever.
• Headache: Users develop headaches that may gradually increase in inten-sity and remain long after use.
• Fatigue: Users may become tired or exhausted after a long experience.
• Eyestrain: Users may feel that their eyes are tired, fatigued, sore, or aching.
• Accommodation issues: Users may have blurred vision or have difficultyfocusing.
After reading this daunting list, it is important to associate it with worst-caseanalysis. These are the symptoms reported by at least some people for some VRexperiences. The goal is to make VR systems and experiences that eliminate thesesymptoms for as many people as possible. Furthermore, most symptoms may begreatly reduced through repeated exposure and adaptation.
Other side effects In addition to the direct symptoms just listed, several otherphenomena are closely associated with motion and VR sickness, and potentiallypersist long after usage. One of them is Sopite syndrome [14], which is closelyrelated to drowsiness, but may include other symptoms, such as laziness, lackof social participation, mood changes, apathy, and sleep disturbances. Thesesymptoms may persist even after adaptation to the systems listed above havebeen greatly reduced or eliminated. Another phenomenon is postural disequi-librium, which adversely affects balance and coordination [31]. Finally, anotherphenomenon is loss of visual acuity during head or body motion [31], which seemsto be a natural consequence of the VOR (Section 5.3) becoming adapted to theflaws in a VR system. This arises from forcing the perception of stationarity inspite of issues in resolution, latency, frame rates, optical distortion, and so on.
346 S. M. LaValle: Virtual Reality
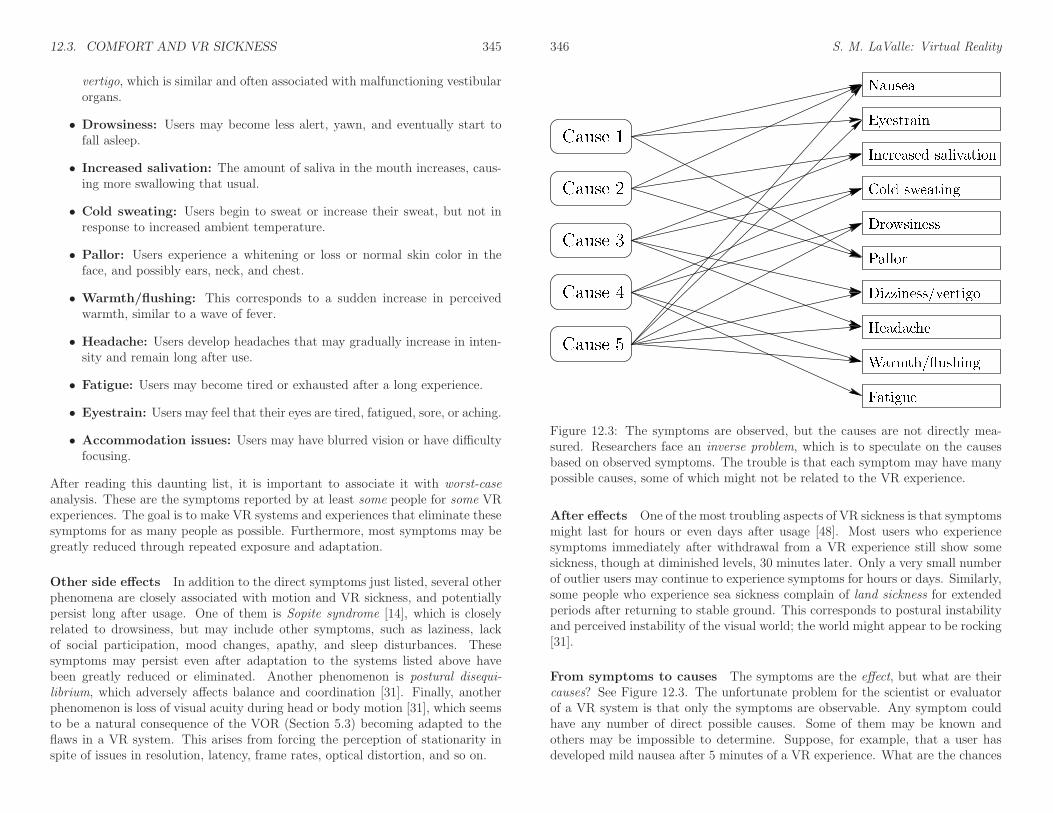
Figure 12.3: The symptoms are observed, but the causes are not directly mea-sured. Researchers face an inverse problem, which is to speculate on the causesbased on observed symptoms. The trouble is that each symptom may have manypossible causes, some of which might not be related to the VR experience.
After effects One of the most troubling aspects of VR sickness is that symptomsmight last for hours or even days after usage [48]. Most users who experiencesymptoms immediately after withdrawal from a VR experience still show somesickness, though at diminished levels, 30 minutes later. Only a very small numberof outlier users may continue to experience symptoms for hours or days. Similarly,some people who experience sea sickness complain of land sickness for extendedperiods after returning to stable ground. This corresponds to postural instabilityand perceived instability of the visual world; the world might appear to be rocking[31].
From symptoms to causes The symptoms are the effect, but what are theircauses? See Figure 12.3. The unfortunate problem for the scientist or evaluatorof a VR system is that only the symptoms are observable. Any symptom couldhave any number of direct possible causes. Some of them may be known andothers may be impossible to determine. Suppose, for example, that a user hasdeveloped mild nausea after 5 minutes of a VR experience. What are the chances
12.3. COMFORT AND VR SICKNESS 347
that he would have gotten nauseated anyway because he rode his bicycle to thetest session and forgot to eat breakfast? What if he has a hangover from alcoholicdrinks the night before? Perhaps a few users such as this could be discarded asoutliers, but what if there was a large festival the night before which increasedthe number of people who are fatigued before the experiment? Some of theseproblems can be handled by breaking them into groups that are expected to havelow variability; see Section 12.4. At the very least, one should probably ask thembeforehand if they feel nauseated; however, this could even cause them to paymore attention to nausea, which generates a bias.
Even if it is narrowed down that the cause was the VR experience, this deter-mination may not be narrow enough to be useful. Which part of the experiencecaused it? The user might have had no problems were it not for 10 seconds ofstimulus during a 15-minute session. How much of the blame was due to the hard-ware versus the particular content? The hardware might be as comfortable as anoptokinetic drum, which essentially shifts the blame to the particular images onthe drum.
Questions relating to cause are answered by finding statistical correlations inthe data obtained before, during, and after the exposure to VR. Thus, causationis not determined through directly witnessing the cause and its effect in the wayas witnessing the effect of a shattered glass which is clearly caused by droppingit on the floor. Eliminating irrelevant causes is an important part of the experi-mental design, which involves selecting users carefully and gathering appropriatedata from them in advance. Determining more specific causes requires more ex-perimental trials. This is complicated by the fact that different trials cannot beeasily applied to the same user. Once people are sick, they will not be able toparticipate, or would at least give biased results that are difficult to compensatefor. They could return on different days for different trials, but there could againbe issues because of adaptation to VR, including the particular experiment, andsimply being in a different health or emotional state on another occasion.
Variation among users A further complication is the wide variability amongpeople to VR sickness susceptibility. Accounting for individual differences amonggroups must be accounted for in the design of the experiment; see Section 12.4.Most researchers believe that women are more susceptible to motion sickness thanmen [21, 38]; however, this conclusion is disputed in [31]. Regarding age, it seemsthat susceptibility is highest in children under 12, which then rapidly decreases asthey mature to adulthood, and then gradually decreases further over their lifetime[42]. One study even concludes that Chinese people are more susceptible thansome other ethic groups [50]. The best predictor of an individual’s susceptibilityto motion sickness is to determine whether she or he has had it before. Finally,note that there may also be variability across groups as in the severity of thesymptoms, the speed of their onset, the time they last after the experiment, andthe rate at which the users adapt to VR.
348 S. M. LaValle: Virtual Reality
Sensory conflict theory In addition to determining the link between cause andeffect in terms of offending stimuli, we should also try to understand why the bodyis reacting adversely to VR. What physiological and psychological mechanisms areinvolved in the process? Why might one person be unable to quickly adapt tocertain stimuli, while other people are fine? What is particularly bad about thestimulus that might be easily fixed without significantly degrading the experience?The determination of these mechanisms and their reasons for existing falls underetiology. Although, there is no widely encompassing and accepted theory thatexplains motion sickness or VR sickness, some useful and accepted theories exist.
One of must relevant and powerful theories for understanding VR sickness issensory conflict theory [19, 23]. Recall the high-level depiction of VR systemsfrom Figure 2.1 of Section 2.1. For VR, two kinds of mismatch exist:
1. The engineered stimuli do not closely enough match that which is expectedcentral nervous system and brain in comparison to natural stimuli. Exam-ples include artifacts due to display resolution, aliasing, frame rates, opticaldistortion, limited colors, synthetic lighting models, and latency.
2. Some sensory systems receive no engineered stimuli. They continue to sensethe surrounding physical world in a natural way and send their neural signalsaccordingly. Examples include signals from the vestibular and propriocep-tive systems. Real-world accelerations continue to be sensed by the vestibu-lar organs and the poses of body parts can be roughly estimated from motorsignals.
Unsurprisingly, the most important conflict for VR involves accelerations. Inthe case of vection, the human vision system provides optical flow readings con-sistent with motion, but the signals from the vestibular organ do not match. Notethat this is the reverse of a common form of motion sickness, which is travelingin a moving vehicle without looking outside of it. For example, imagine readinga book while a passenger in a car. In this case, the vestibular system reports theaccelerations of the car, but there is no corresponding optical flow.
Forced fusion and fatigue Recall from Section 6.4 that our perceptual sys-tems integrate cues from different sources, across different sensing modalities, toobtain a coherent perceptual interpretation. In the case of minor discrepanciesbetween the cues, the resulting interpretation can be considered as forced fusion[17], in which the perceptual systems appear to work harder to form a match inspite of errors. The situation is similar in engineering systems that perform sen-sor fusion or visual scene interpretation; the optimization or search for possibleinterpretations may be much larger in the presence of more noise or incompleteinformation. Forced fusion appears to lead directly to fatigue and eyestrain. Byanalogy to computation, it may be not unlike a CPU or GPU heating up as com-putations intensify for a more difficult problem. Thus, human bodies are forced to
12.3. COMFORT AND VR SICKNESS 349
work harder as they learn to interpret virtual worlds in spite of engineering flaws.Fortunately, repeated exposure leads to learning or adaptation, which might ulti-mately reduce fatigue.
Poison hypotheses Sensory conflict might seem to be enough to explain whyextra burden arises, but it does not seem to imply that nausea would result.Scientists wonder what the evolutionary origins might be for responsible this andrelated symptoms. Note that humans have the ability to naturally nauseate them-selves from spinning motions that do not involve technology. The indirect poisonhypothesis asserts that nausea associated with motion sickness is a by-product ofa mechanism that evolved in humans so that they would vomit an accidentally in-gested toxin [53]. The symptoms of such toxins frequency involve conflict betweenvisual and vestibular cues. Scientists have considered alternative evolutionary ex-planations, such as tree sickness in primates so that they avoid swaying, unstablebranches. Another explanation is the direct poison hypothesis, which asserts thatnausea became associated with toxins because they were correlated throughoutevolution with activities that involved increased or prolonged accelerations. Adetailed assessment of these alternative hypotheses and their incompleteness isgiven in Section 23.9 of [31].
Levels of VR sickness To improve VR systems and experiences, we must firstbe able to properly compare them in terms of their adverse side effects. Thus, theresulting symptoms need to be quantified. Rather than a simple yes/no responsefor each symptom, it is more precise to obtain numbers that correspond to relativeseverity. Several important quantities, for a particular symptom, include
• The intensity of the symptom.
• The rate of symptom onset or intensity increase while the stimulus is pre-sented.
• The rate of symptom decay or intensity decrease after the stimulus is re-moved.
• The percentage of users who experience the symptom at a fixed level orabove.
The first three can be visualized as a plot of intensity over time. The last one is astatistical property; many other statistics could be calculated from the raw data.
Questionnaires The most popular way to gather quantitative data is to haveusers fill out a questionnaire. Researchers have designed many questionnairesover the years [30]; the most widely known and utilized is the simulator sicknessquestionnaire (SSQ) [22]. It was designed for simulator sickness studies for the USmilitary, but has been used much more broadly. The users are asked to score each
350 S. M. LaValle: Virtual Reality
of 16 standard symptoms on a four-point scale: 0 none, 1 slight, 2 moderate, and3 severe. The results are often aggregated by summing the scores for a selection ofthe questions. To determine onset or decay rates, the SSQ must be administeredmultiple times, such as before, after 10 minutes, after 30 minutes, immediatelyafter the experiment, and then 60 minutes afterwards.
Questionnaires suffer from four main drawbacks. The first is that the answersare subjective. For example, there is no clear way to calibrate what it means acrossthe users to feel nausea at level “1” versus level “2”. A single user might evengive different ratings based on emotion or even the onset of other symptoms. Thesecond drawback is that users are asked pay attention to their symptoms, whichcould bias their perceived onset (they may accidentally become like perceptuallytrained evaluators, as discussed in Section 12.1). The third drawback is that usersmust be interrupted so that they can provide scores during a session. The finaldrawback is that the intensity over time must be sampled coarsely because a newquestionnaire must be filled out at each time instant of interest.
Physiological measurements The alternative is to attach sensors to the userso that physiological measurements are automatically obtained before, during, andafter the VR session. The data can be obtained continuously without interruptingthe user or asking him to pay attention to symptoms. There may, however, besome discomfort or fear associated with the placement of sensors on the body.Researchers typically purchase a standard sensing system, such as the BiopacMP150, which contains a pack of sensors, records the data, and transmits themto a computer for analysis.
Some physiological measures that have been used for studying VR sicknessare:
• Electrocardiogram (ECG): This sensor records the electrical activity ofthe heart by placing electrodes on the skin. Heart rate typically increasesduring a VR session.
• Electrogastrogram (EGG): This is similar to the ECG, but the elec-trodes are placed near the stomach so that gastrointestinal discomfort canbe estimated.
• Electrooculogram (EOG): Electrodes are placed around the eyes so thateye movement can be estimated. Alternatively, a camera-based eye trackingsystem may be used (Section 9.4). Eye rotations and blinking rates can bedetermined.
• Photoplethysmogram (PPG): This provides additional data on heartmovement and is obtained by using a pulse oximeter. Typically this deviceis clamped onto a fingertip and monitors the oxygen saturation of the blood.
12.3. COMFORT AND VR SICKNESS 351
• Galvanic skin response (GSR): This sensor measures electrical resis-tance across the surface of the skin. As a person sweats, the moisture ofthe skin surface increases conductivity. This offers a way to measure coldsweating.
• Respiratory effort: The breathing rate and amplitude are measured froma patch on the chest that responds to differential pressure or expansion. Therate of breathing may increase during the VR session.
• Skin pallor: This can be measured using a camera and image processing. Inthe simplest case, an IR LED and photodiode serves as an emitter-detectorpair that measures skin reflectance.
• Head motion: A head tracking system is a rich source of movement data,which can help to estimate fatigue or postural instability with no additionalcost, or distraction to the user.
A recent comparison of physiological measures and questionnaires appears in [5],and it is even concluded that one can determine whether a person is experiencingVR from the physiological data alone.
Sickness reduction strategies Through experimental studies that determineVR sickness frequencies and intensities across users, engineers and developerscan iterate and produce more comfortable VR experiences. Improvements areneeded at all levels. Recall the challenge of the perception of stationarity. Mostof the real world is perceived as stationary, and it should be the same way forvirtual worlds. Improvements in visual displays, rendering, and tracking shouldhelp reduce sickness by ever improving the perception of stationarity. Opticaldistortions, aliasing, latencies, and other artifacts should be reduced or eliminated.When they cannot be eliminated, then comfortable tradeoffs should be found. Newdisplay technologies should also be pursued that reduce vergence-accommodationmismatch, which causes substantial discomfort when close objects appear on aheadset that uses a traditional screen and lens combination (recall from Section5.4).
Even for an ideally functioning headset, locomotion can cause sickness becauseof vection. Following the strategies suggested in Section 10.2 should reduce thesickness symptoms. A better idea is to design VR experiences that require littleor no locomotion.
As last resorts, two other strategies may help to alleviate VR sickness [23].The first is to regularly practice, which causes adaptation. The amount of fatiguefrom forced fusion should be expected to decrease as the body becomes adjustedto the unusual combination of stimuli. Of course, if the VR experience makes mostpeople sick, then asking them to “power through” it a dozen times or more maybe a bad idea. Finally, users could take drugs that reduce susceptibility, much inthe way that some people take air sickness pills before boarding a plane. These
352 S. M. LaValle: Virtual Reality
pills are usually antihistamines or anticholinergics, which have unfortunate sideeffects such as fatigue, drowsiness, impaired cognitive performance, and potentialfor addiction in some cases.
12.4 Experiments on Human Subjects
Imagine that you have developed a new locomotion method with hopes that itreduces VR sickness. You and a few friends may try it and believe it is betterthan the default method. How do you convince the skeptical world that it isbetter, which includes people who are less likely to be biased toward preferringyour presumably clever, new method? You could argue that it is better becauseit respects known issues from human physiology and perception, which would bea decent start. This would have provided good motivation for trying the methodin the first place; however, it is not sufficient by itself because there is so muchuncertainty in how the body interacts with technology. The solution is to designan experiment that scientifically establishes whether your method is better. Thisleads to many challenges, such as determining how many people should try it, whatexactly they should do, how long they should do it for, who should be assignedto which method, and how their sickness will be measured afterward. Some ofthese difficulties emerged in Section 12.3. If the experiment is designed well, thenscientists will be on your side to support the results. If some people are stillnot convinced, then at least you will have the support of those who believe in thescientific method! Fortunately, this includes the psychologists and neuroscientists,and even the closely researchers in the related field of human-computer interaction[2, 3].
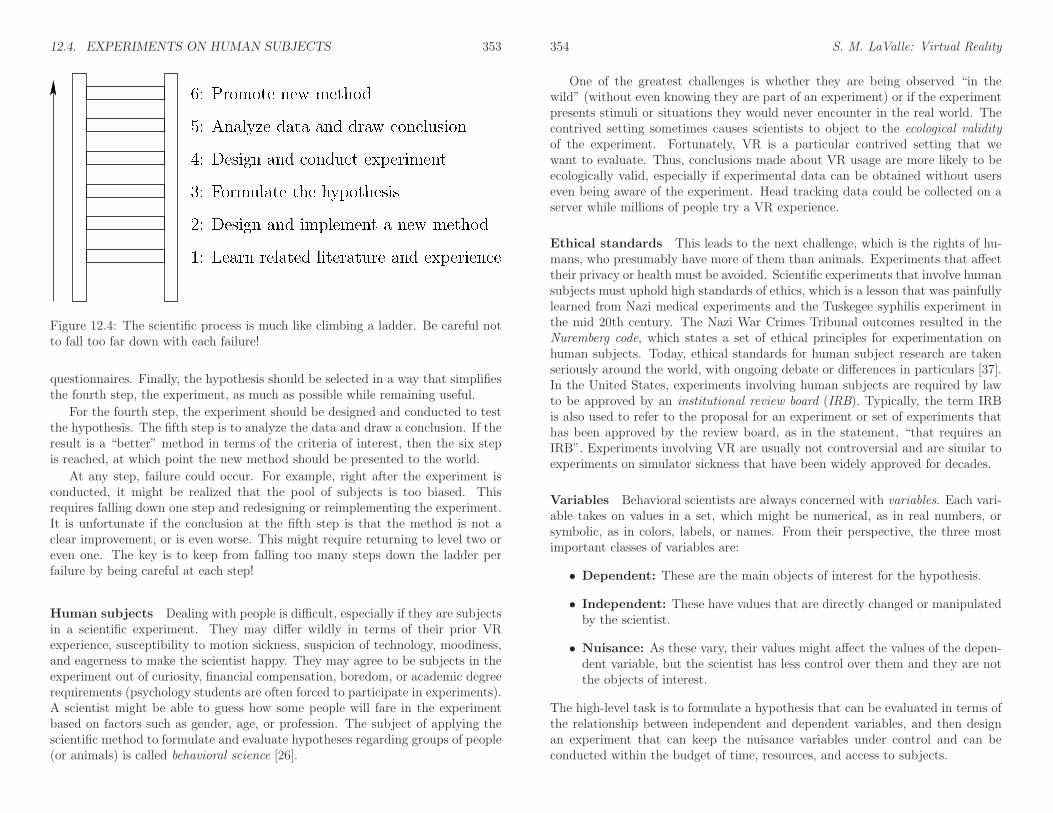
The scientific method The scientific method has been around since ancienttimes, and continues to be refined and improved in particular sciences. Figure12.4 depicts how it could appear for VR development. Imagine trying to climb aladder. The first step is accomplished by studying the appropriate literature orgaining the background necessary to design a new method that is likely to be animprovement. This will reduce the chances of falling from the ladder. The secondstep is to design and implement the new method. This step could include somesimple evaluation on a few users just to make sure it is worth proceeding further.
The third step is to precisely formulate the hypothesis, regarding how it is animprovement. Examples are: 1) a reduction in adverse symptoms, 2) improvedcomfort, 3) greater efficiency at solving tasks, 4) stronger belief that the virtualworld is real, and 5) a greater enjoyment of the activity. It often makes sense toevaluate multiple criteria, but the result may be that the new method is better insome ways and worse in others. This is a common outcome, but it is preferableto failing to improve in any way! The hypothesis could even involve improvingfuture experimental procedures; an example is [5], in which researchers determinedcases in which physiological measures are better indicators of VR sickness than
12.4. EXPERIMENTS ON HUMAN SUBJECTS 353
Figure 12.4: The scientific process is much like climbing a ladder. Be careful notto fall too far down with each failure!
questionnaires. Finally, the hypothesis should be selected in a way that simplifiesthe fourth step, the experiment, as much as possible while remaining useful.
For the fourth step, the experiment should be designed and conducted to testthe hypothesis. The fifth step is to analyze the data and draw a conclusion. If theresult is a “better” method in terms of the criteria of interest, then the six stepis reached, at which point the new method should be presented to the world.
At any step, failure could occur. For example, right after the experiment isconducted, it might be realized that the pool of subjects is too biased. Thisrequires falling down one step and redesigning or reimplementing the experiment.It is unfortunate if the conclusion at the fifth step is that the method is not aclear improvement, or is even worse. This might require returning to level two oreven one. The key is to keep from falling too many steps down the ladder perfailure by being careful at each step!
Human subjects Dealing with people is difficult, especially if they are subjectsin a scientific experiment. They may differ wildly in terms of their prior VRexperience, susceptibility to motion sickness, suspicion of technology, moodiness,and eagerness to make the scientist happy. They may agree to be subjects in theexperiment out of curiosity, financial compensation, boredom, or academic degreerequirements (psychology students are often forced to participate in experiments).A scientist might be able to guess how some people will fare in the experimentbased on factors such as gender, age, or profession. The subject of applying thescientific method to formulate and evaluate hypotheses regarding groups of people(or animals) is called behavioral science [26].
354 S. M. LaValle: Virtual Reality
One of the greatest challenges is whether they are being observed “in thewild” (without even knowing they are part of an experiment) or if the experimentpresents stimuli or situations they would never encounter in the real world. Thecontrived setting sometimes causes scientists to object to the ecological validityof the experiment. Fortunately, VR is a particular contrived setting that wewant to evaluate. Thus, conclusions made about VR usage are more likely to beecologically valid, especially if experimental data can be obtained without userseven being aware of the experiment. Head tracking data could be collected on aserver while millions of people try a VR experience.
Ethical standards This leads to the next challenge, which is the rights of hu-mans, who presumably have more of them than animals. Experiments that affecttheir privacy or health must be avoided. Scientific experiments that involve humansubjects must uphold high standards of ethics, which is a lesson that was painfullylearned from Nazi medical experiments and the Tuskegee syphilis experiment inthe mid 20th century. The Nazi War Crimes Tribunal outcomes resulted in theNuremberg code, which states a set of ethical principles for experimentation onhuman subjects. Today, ethical standards for human subject research are takenseriously around the world, with ongoing debate or differences in particulars [37].In the United States, experiments involving human subjects are required by lawto be approved by an institutional review board (IRB). Typically, the term IRBis also used to refer to the proposal for an experiment or set of experiments thathas been approved by the review board, as in the statement, “that requires anIRB”. Experiments involving VR are usually not controversial and are similar toexperiments on simulator sickness that have been widely approved for decades.
Variables Behavioral scientists are always concerned with variables. Each vari-able takes on values in a set, which might be numerical, as in real numbers, orsymbolic, as in colors, labels, or names. From their perspective, the three mostimportant classes of variables are:
• Dependent: These are the main objects of interest for the hypothesis.
• Independent: These have values that are directly changed or manipulatedby the scientist.
• Nuisance: As these vary, their values might affect the values of the depen-dent variable, but the scientist has less control over them and they are notthe objects of interest.
The high-level task is to formulate a hypothesis that can be evaluated in terms ofthe relationship between independent and dependent variables, and then designan experiment that can keep the nuisance variables under control and can beconducted within the budget of time, resources, and access to subjects.
12.4. EXPERIMENTS ON HUMAN SUBJECTS 355
The underlying mathematics for formulating models of how the variables be-have and predicting their behavior is probability theory, which was introduced inSection 6.4. Unfortunately, we are faced with an inverse problem, as was notedin Figure 12.3. Most of the behavior is not directly observable, which means thatwe must gather data and make inferences about the underlying models and try toobtain as much confidence as possible. Thus, resolving the hypothesis is a prob-lem in applied statistics, which is the natural complement or inverse of probabilitytheory.
Formulating a hypothesis In the simplest case, scientists want to determinea binary outcome for a hypothesis of interest: true or false. In more complicatedcases, there may be many mutually exclusive hypotheses, and scientists want todetermine which one is true. For example, which among 17 different locomotionmethods is the most comfortable? Proceeding with the simpler case, supposethat a potentially better locomotion method has been determined in terms of VRsickness. Let x1 denote the use of the original method and let x2 denote the useof the new method.
The set x = {x1, x2} is the independent variable. Each xi is sometimes calledthe treatment (or level if xi takes on real values). The subjects who receive theoriginal method are considered to be the control group. If a drug were beingevaluated against applying no drug, then they would receive the placebo.
Recall from Section 12.3 that levels of VR sickness could be assessed in avariety of ways. Suppose, for the sake of example, that EGG voltage measurementsaveraged over a time interval is chosen as the dependent variable y. This indicatesthe amount of gastrointestinal discomfort in response to the treatment, x1 or x2.
The hypothesis is a logical true/false statement that relates x to y. For exam-ple, it might be
H0 : µ1 − µ2 = 0, (12.1)
in which each µi denotes the “true” average value of y at the same point in theexperiment, by applying treatment xi to all people in the world.1 The hypothesisH0 implies that the new method has no effect on y, and is generally called a nullhypothesis. The negative of H0 is called an alternative hypothesis. In our case thisis
H1 : µ1 − µ2 6= 0, (12.2)
which implies that the new method has an impact on gastrointestinal discomfort;however, it could be better or worse.
Testing the hypothesis Unfortunately, the scientist is not able to performthe same experiment at the same time on all people. She must instead draw a
1To be more mathematically precise, µi is the limiting case of applying xi to an infinitenumber of people with the assumption that they all respond according to a normal distributionwith the same mean.
356 S. M. LaValle: Virtual Reality
(a) (b)
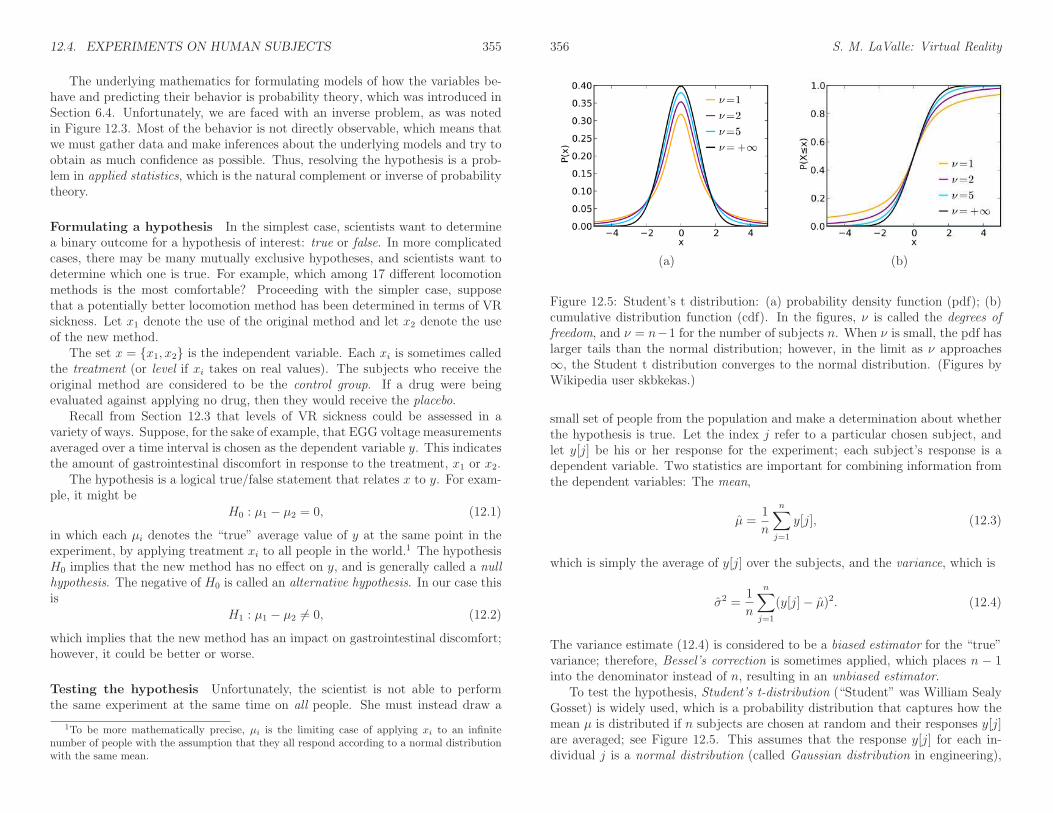
Figure 12.5: Student’s t distribution: (a) probability density function (pdf); (b)cumulative distribution function (cdf). In the figures, ν is called the degrees offreedom, and ν = n−1 for the number of subjects n. When ν is small, the pdf haslarger tails than the normal distribution; however, in the limit as ν approaches∞, the Student t distribution converges to the normal distribution. (Figures byWikipedia user skbkekas.)
small set of people from the population and make a determination about whetherthe hypothesis is true. Let the index j refer to a particular chosen subject, andlet y[j] be his or her response for the experiment; each subject’s response is adependent variable. Two statistics are important for combining information fromthe dependent variables: The mean,
µ =1
n
n∑
j=1
y[j], (12.3)
which is simply the average of y[j] over the subjects, and the variance, which is
σ2 =1
n
n∑
j=1
(y[j]− µ)2. (12.4)
The variance estimate (12.4) is considered to be a biased estimator for the “true”variance; therefore, Bessel’s correction is sometimes applied, which places n − 1into the denominator instead of n, resulting in an unbiased estimator.
To test the hypothesis, Student’s t-distribution (“Student” was William SealyGosset) is widely used, which is a probability distribution that captures how themean µ is distributed if n subjects are chosen at random and their responses y[j]are averaged; see Figure 12.5. This assumes that the response y[j] for each in-dividual j is a normal distribution (called Gaussian distribution in engineering),
12.4. EXPERIMENTS ON HUMAN SUBJECTS 357
which is the most basic and common probability distribution. It is fully charac-terized in terms of its mean µ and standard deviation σ. The exact expressionsfor these distributions are not given here, but are widely available; see [18] andother books on mathematical statistics for these and many more.
The Student’s t test [52] involves calculating the following:
t =µ1 − µ2
σp
√
1
n1
+ 1
n2
, (12.5)
in which
σp =
√
(n1 − 1)σ2
1+ (n2 − 1)σ2
2
n1 + n2 − 2(12.6)
and ni is the number of subjects who received treatment xi. The subtractions by1 and 2 in the expressions are due to Bessel’s correction. Based on the value of t,the confidence α in the null hypothesis H0 is determined by looking in a table ofthe Student’s t cdf (Figure 12.5(b)). Typically, α = 0.05 or lower is sufficient todeclare that H1 is true (corresponding to 95% confidence). Such tables are usuallyarranged so that for a given ν and α is, the minimum t value needed to confirmH1 with confidence 1 − α is presented. Note that if t is negative, then the effectthat x has on y runs in the opposite direction, and −t is applied to the table.
The binary outcome might not be satisfying enough. This is not a problembecause difference in means, µ1 − µ2, is an estimate of the amount of change thatapplying x2 had in comparison to x1. This is called the average treatment effect.Thus, in addition to determining whether the H1 is true via the t-test, we alsoobtain an estimate of how much it affects the outcome.
Student’s t-test assumed that the variance within each group is identical. Ifit is not, then Welch’s t-test is used [56]. Note that the variances were not givenin advance in either case. They are estimated “on the fly” from the experimentaldata. Welch’s t-test gives the same result as Student’s t-test if the varianceshappen to be the same; therefore, when in doubt, it may be best to apply Welch’st-test. Many other tests can be used and are debated in particular contexts byscientists; see [18].
Correlation coefficient In many cases, the independent variable x and thedependent variable y are both continuous (taking on real values). This enablesanother important measure called the Pearson correlation coefficient (or Pearson’sr). This estimates the amount of linear dependency between the two variables.For each subject i, the treatment (or level) x[i] is applied and the response is y[i].Note that in this case, there are no groups (or every subject is a unique group).Also, any treatment could potentially be applied to any subject; the index i onlydenotes the particular subject.
358 S. M. LaValle: Virtual Reality
The r-value is calculated as the estimated covariance between x and y whentreated as random variables:
r =
n∑
i=1
(x[i]− µx)(y[i]− µy)
√
n∑
i=1
(x[i]− µx)2
√
n∑
i=1
(y[i]− µy)2
, (12.7)
in which µx and µy are the averages of x[i] and y[i], respectively, for the setof all subjects. The denominator is just the product of the estimated standarddeviations: σxσy.
The possible r-values range between −1 and 1. Three qualitatively differentoutcomes can occur:
• r > 0: This means that x and y are positively correlated. As x increases, ytends to increase. A larger value of r implies a stronger effect.
• r = 0: This means that x and y are uncorrelated, which is theoreticallyequivalent to a null hypothesis.
• r < 0: This means that x and y are negatively correlated. As x increases, ytends to decrease. A smaller value of r implies a stronger effect.
In practice, it is highly unlikely to obtain r = 0 from experimental data; there-fore, the absolute value |r| gives an important indication of the likelihood that ydepends on x. The theoretical equivalence to the null hypothesis (r = 0) wouldhappen only as the number of subjects tends to infinity.
Dealing with nuisance variables We have considered dependent and inde-pendent variables, but have neglected the nuisance variables. This is the mostchallenging part of experimental design. Only the general idea is given here; see[26, 33] for exhaustive presentations. Suppose that when looking through thedata it is noted that the dependent variable y depends heavily on an identifiableproperty of the subjects, such as gender. This property would become a nuisancevariable, z. We could imagine designing an experiment just to determine whetherand how much z affects y, but the interest is in some independent variable x, notz.
The dependency on z drives the variance high across the subjects; however,if they are divided into groups that have the same z value inside of each group,then the variance could be considerably lower. For example, if gender is thenuisance variable, then we would divide the subjects into groups of men andwomen and discover that the variance is smaller in each group. This technique iscalled blocking, and each group is called a block. Inside of a block, the variance ofy should be low if the independent variable x is held fixed.
12.4. EXPERIMENTS ON HUMAN SUBJECTS 359
The next problem is to determine which treatment should be applied to whichsubjects. Continuing with the example, it would be a horrible idea to give treat-ment x1 to women and treatment x2 to men. This completely confounds thenuisance variable z and independent variable x dependencies on the dependentvariable y. The opposite of this would be to apply x1 to half of the women andmen, and x2 to the other half, which is significantly better. A simple alternativeis to use a randomized design, in which the subjects are assigned x1 or x2 at ran-dom. This safely eliminates accidental bias and is easy for an experimenter toimplement.
If there is more than one nuisance variable, then the assignment process be-comes more complicated, which tends to cause a greater preference for randomiza-tion. If the subjects participate in a multiple-stage experiment where the differenttreatments are applied at various times, then the treatments must be carefully as-signed. One way to handle it is by assigning the treatments according to a Latinsquare, which is an m-by-m matrix in which every row and column is a permuta-tion of m labels (in this case, treatments).
Analysis of variance The main remaining challenge is to identify nuisancevariables that would have a significant impact on the variance. This is calledanalysis of variance (or ANOVA, pronounced “ay nova”), and methods that takethis into account are called ANOVA design. Gender was an easy factor to imagine,but others may be more subtle, such as the amount of FPS games played amongthe subjects, or the time of day that the subjects participate. The topic is far toocomplex to cover here (see [26]), but the important intuition is that low-varianceclusters must be discovered among the subjects, which serves as a basis for dividingthem into blocks. This is closely related to the problem of unsupervised clustering(or unsupervised learning) because classes are being discovered without the useof a “teacher” who identifies them in advance. ANOVA is also considered as ageneralization of the t-test to three or more variables.
More variables Variables other than independent, dependent, and nuisancesometimes become important in the experiment. A control variable is essentiallya nuisance variable that is held fixed through the selection of subjects or exper-imental trials. For example, the variance may be held low by controlling thesubject selection so that only males between the ages of 18 and 21 are used in theexperiment. The approach helps to improve the confidence in the conclusions fromthe experiment, possibly with a smaller number of subjects or trials, but mightprevent its findings from being generalized to settings outside of the control.
A confounding variable is an extraneous variable that causes the independentand dependent variables to be correlated, but they become uncorrelated once thevalue of the confounding variable is given. For example, having a larger shoe sizemay correlate to better speaking ability. In this case the confounding variableis the person’s age. Once the age is known, we realize that older people have
360 S. M. LaValle: Virtual Reality
larger feet then small children, and are also better at speaking. This illustratesthe danger of inferring causal relationships from statistical correlations.
Psychophysical methods Recall from Section 2.3 that psychophysics relatesperceptual phenomena to the original stimuli, which makes it crucial for under-standing VR. Stevens’ power law (2.1) related the perceived stimulus magnitudeto the actual magnitude. The JND involved determining a differential threshold,which is the smallest amount of stimulus change that is detectable. A specialcase of this is an absolute threshold, which is the smallest magnitude stimulus (incomparison to zero) that is detectable.
Psychophysical laws or relationships are gained through specific experimentson human subjects. The term psychophysics and research area were introduced byGustav Fechner [8], who formulated three basic experimental approaches, whichwill described next. Suppose that x represents the stimulus magnitude. The taskis to determine how small ∆x can become so that subjects perceive a difference.The classical approaches are:
• Method of constant stimuli: In this case, stimuli at various magnitudesare presented in succession, along with the reference stimulus. The subjectis asked for each stimulus pair where he can perceive a difference betweenthem. The magnitudes are usually presented in random order to suppressadaptation. Based on the responses over many trials, a best-fitting psycho-metric function is calculated, as was shown in Figure 2.21.
• Method of limits: The experimenter varies the stimulus magnitude insmall increments, starting with an upper or lower limit. The subject is askedin each case whether the new stimulus has less, equal, or more magnitudethan the reference stimulus.
• Method of adjustment: The subject is allowed to adjust the stimulusmagnitude up and down within a short amount of time, while also being ableto compare to the reference stimulus. The subject stops when she reportsthat the adjusted and reference stimuli appear to have equal magnitude.
Although these methods are effective and widely used, several problems exist. Allof them may be prone to some kinds of bias. For the last two, adaptation mayinterfere with the outcome. For the last one, there is no way to control how thesubject makes decisions. Another problem is efficiency, in that many iterationsmay be wasted in the methods by considering stimuli that are far away from thereference stimulus.
Adaptive methods Due to these shortcomings, researchers have found numer-ous ways to improve the experimental methods over the past few decades. A largenumber of these are surveyed and compared in [54], and fall under the headingof adaptive psychophysical methods. Most improved methods perform staircase
12.4. EXPERIMENTS ON HUMAN SUBJECTS i
procedures, in which the stimulus magnitude starts off with an easy case for thesubject and is gradually decreased (or increased if the reference magnitude islarger) until the subject makes a mistake [9]. At this point, the direction is re-versed and the steps are increased until another mistake is made. The processof making a mistake and changing directions continues until the subject makesmany mistakes in a short number of iterations. The step size must be carefullychosen, and could even be reduced gradually during the experiment. The direction(increase or decrease) could alternatively be decided using Bayesian or maximum-likelihood procedures that provide an estimate for the threshold as the data arecollected in each iteration [16, 28, 55]. These methods generally fall under theheading of the stochastic approximation method [44].
Stimulus magnitude estimation Recall that Stevens’ power law is not aboutdetection thresholds, but is instead about the perceived magnitude of a stimulus.For example, one plate might feel twice as hot as another. In this case, subjectsare asked to estimate the relative difference in magnitude between stimuli. Overa sufficient number of trials, the exponent of Stevens’ power law (2.1) can beestimated by choosing a value for x (the exponent) that minimizes the least-squares error (recall from Section 9.1).
Further Reading
For surveys on perceptual learning, see [11, 12, 15, 40]. Hyperacuity through perceptuallearning is investigated in [13, 40]. In [45] it is established that perceptual learning canoccur without even focused attention.
Human sensitivity to latency in VR and computer interfaces is analyzed in [6, 7,34, 58]. Comfort issues in stereo displays is studied in [46]. For connections betweenpostural sway and sickness, see [47, 51].
For some important studies related to VR sickness, see [1, 24, 25, 27, 36, 43]. Generaloverviews of VR sickness are given in [21, 29, 49]. Motion sickness is surveyed in [42].See [17, 20, 4, 41] for additional coverage of forced fusion.
For coverage of the mathematical methods and statistics for human subjects experi-mentation, see [26]. The book [33] is highly popular for its coverage of hypothesis testingin the context of psychology. For treatment of psychophysical methods, see [32, 54, 57]and Chapter 3 of [10].
ii S. M. LaValle: Virtual Reality

Bibliography
[1] K. W. Arthur. Effects of Field of View on Performance with Head-MountedDisplays. PhD thesis, University of North Carolina at Chapel Hill, 2000.
[2] P. Cairns and A. L. Cox. Research Methods for Human-Computer Interaction.Cambridge University Press, Cambridge, U.K., 2008.
[3] J. M. Caroll. HCI Models, Theories, and Frameworks: Toward a Multidisci-plinary Science. Morgan Kaufmann, San Francisco, CA, 2003.
[4] K. N. de Winkel, M. KAtliar, and H. H. Bulthoff. Forced fusion in multisen-sory heading estimation. PloS ONE, 10(5), 2015.
[5] M. Dennison, Z. Wisti, and M. D’Zmura. Use of physiological signals topredict cybersickness. Displays, 44:52–52, 2016.
[6] M. H. Draper, E. S. Viire, and T. A. Furness amd V. J. Gawron. Effects ofimage scale and system time delay on simulator sickness with head-coupledvirtual environments. Human Factors, 43(1):129–146, 2001.
[7] S. R. Ellis, K. Mania, B. D. Adelstein, and M. I. Hill. Generalizeability oflatency detection in a variety of virtual environments. In Proceedings of theHuman Factors and Ergonomics Society Annual Meeting, pages 2632–2636,2004.
[8] G. T. Fechner. Elements of Psychophysics (in German). Breitkopf and Hartel,Leipzig, 1860.
[9] M. A. Garcia-Perez. Forced-choice staircases with fixed step sizes: asymptoticand small-sample properties. Vision Research, 38(12):1861–81, 1998.
[10] G. Gescheider. Psychophysics: The Fundamentals, 3rd Ed. Lawrence Erl-baum Associates, Mahwah, NJ, 2015.
[11] E. Gibson. Principles of Perceptual Learning and Development. Appleton-Century-Crofts, New York, 1969.
[12] R. L. Goldstone. Perceptual learning. Annual Review of Psychology, 49:585–612, 1998.
iii
iv BIBLIOGRAPHY
[13] A. C. Grant, M. C. Thiagarajah, and K. Sathian. Tactile perception inblind Braille readers: A psychophysical study of acuity and hyperacuity usinggratings and dot patterns. Perception and Psychophysics, 62(2):301–312,2000.
[14] A. Graybiel and J. Knepton. Sopite syndrome - sometimes sole manifestationof motion sickness. Aviation, Space, and Environmental Medicine, 47(8):873–882, 1976.
[15] G. Hall. Perceptual and Associative Learning. Oxford University Press, Ox-ford, UK, 1991.
[16] J. O. Harvey. Efficient estimation of sensory thresholds with ml-pest. SpatialVision, 11(1):121–128, 1997.
[17] J. M. Hillis, M. O. Ernst, M. S. Banks, and M. S. Landy. Combining sensoryinformation: mandatory fusion within, but not between, senses. Science,298(5098):1627–30, 2002.
[18] R. V. Hogg, J. McKean, and A. T. Craig. Introduction to MathematicalStatistics, 7th Ed. Pearson, New York, NY, 2012.
[19] J. A. Irwin. The pathology of sea-sickness. The Lancet, 118(3039):907–909,1878.
[20] M. Kaliuzhna, M. Prsa, S. Gale, S. J. Lee, and O. BLanke. Learning to inte-grate contradictory multisensory self-motion cue pairings. Journal of Vision,15(10), 2015.
[21] R. S. Kennedy and L. H. Frank. A review of motion sickness with specialreference to simulator sickness. Technical Report NAVTRAEQUIPCEN 81-C-0105-16, United States Navy, 1985.
[22] R. S. Kennedy, N. E. Lane, K. S. Berbaum, and M. G. Lilienthal. Simula-tor sickness questionnaire: An enhanced method for quantifying simulatorsickness. International Journal of Aviation Psychology, 3(3):203–220, 1993.
[23] B. Keshavarz, H. Hecht, and B. D. Lawson. Visually induced motion sickness:Causes, characteristics, and countermeasures. In K. S. Hale and K. M. Stan-ney, editors, Handbook of Virtual Environments, 2nd Edition, pages 647–698.CRC Press, Boca Raton, FL, 2015.
[24] B. Keshavarz, B. E. Riecke, L. J. Hettinger, and J. L. Campos. Vectionand visually induced motion sickness: how are they related? Frontiers inPsychology, 6(472), 2015.

BIBLIOGRAPHY v
[25] B. Keshavarz, D. Stelzmann, A. Paillard, and H. Hecht. Visually inducedmotion sickness can be alleviated by pleasant odors. Experimental BrainResearch, 233:1353–1364, 2015.
[26] R. E. Kirk. Experimental Design, 4th Ed. Sage, Thousand Oaks, CA, 2013.
[27] E. M. Kolasinski. Simulator sickness in virtual environments. TechnicalReport 2017, U.S. Army Research Institute, 1995.
[28] L. L. Kontsevich and C. W. Tyler. Bayesian adaptive estimation of psycho-metric slope and threshold. Vision Research, 39(16):2729–2737, 1999.
[29] J. J. LaViola. A discussion of cybersickness in virtual environments. ACMSIGCHI Bulletin, 32:47–56, 2000.
[30] B. D. Lawson. Motion sickness scaling. In K. S. Hale and K. M. Stanney,editors, Handbook of Virtual Environments, 2nd Edition, pages 601–626. CRCPress, Boca Raton, FL, 2015.
[31] B. D. Lawson. Motion sickness symptomatology and origins. In K. S. Haleand K. M. Stanney, editors, Handbook of Virtual Environments, 2nd Edition,pages 531–600. CRC Press, Boca Raton, FL, 2015.
[32] M. R. Leek. Adaptive procedures in psychophysical research. Perception andPsychophysics, 63(8):1279–1292, 2001.
[33] N. A. Macmillan and C. D. Creelman. Dection Theory: A User’s Guide, 2ndEd. Lawrence Erlbaum Associates, Mahwah, NJ, 2005.
[34] K. Mania, B. D. Adelstein, S. R. Ellis, and M. I. Hill. Perceptual sensitivityto head tracking latency in virtual environments with varying degrees of scenecomplexity. In Proceedings of Symposium on Applied Perception in Graphicsand Visualization, pages 39–47, 2004.
[35] M. E. McCauley and T. J. Sharkey. Cybersickness: Perception of self-motionin virtual environments. Presence, 1(3):311–318, 1992.
[36] J. D. Moss and E. R. Muth. Characteristics of head-mounted displays andtheir effects on simulator sickness. Human Factors, 53(3):308–319, 2011.
[37] Office for Human Research Protections. International compila-tion of human research standards. Technical report, U.S. De-partment of Health and Human Services, 2016. Available athttp://www.hhs.gov/ohrp/international/compilation-human-research-standards.
vi BIBLIOGRAPHY
[38] G. D. Park, R. W. Allen, D. Fiorentino, T. J. Rosenthal, and M. L. Cook.Simulator sickness scores according to symptom susceptibility, age, and gen-der for an older driver assessment study. In Proceedings of the Human Factorsand Ergonomics Society Annual Meeting, pages 2702–2706, 2006.
[39] R. J. Pethybridge. Sea sickness incidence in royal navy ships. TechnicalReport 37/82, Institute of Naval Medicine, Gosport, Hants, UK, 1982.
[40] T. Poggio, M. Fahle, and S. Edelman. Fast perceptual learning in visualhyperacuity. Science, 256(5059):1018–1021, 1992.
[41] M. Prsa, S. Gale, and O. Blanke. Self-motion leads to mandatory cue fusionacross sensory modalities. Journal of Neurophysiology, 108(8):2282–2291,2012.
[42] J. T. Reason and J. J. Brand. Motion Sickness. Academic, New York, 1975.
[43] M. F. Reschke, J. T. Somers, and G. Ford. Stroboscopic vision as a treatmentfor motion sickness: strobe lighting vs. shutter glasses. Aviation, Space, andEnvironmental Medicine, 77(1):2–7, 2006.
[44] H. Robbins and S. Monro. Stochastic iteration: A Stochastic approximationmethod. Annals of Mathematical Statistics, 22(3):400–407, 1951.
[45] A. R. Seitz and T. Watanabe. The phenomenon of task-irrelevant perceptuallearning. Vision Research, 49(21):2604–2610, 2009.
[46] T. Shibata, J. Kim, D. M. Hoffman, and M. S. Banks. The zone of comfort:predicting visual discomfort with stereo displays. Journal of Vision, 11(8):1–29, 2011.
[47] L. J. Smart, T. A. Stoffregen, and B. G. Bardy. Visually induced motionsickness predicted by postural instability. Human Factors, 44(3):451–465,2002.
[48] K. M. Stanney and R. S. Kennedy. Aftereffects from virtual environmentexpore: How long do they last? In Proceedings of the Human Factors andErgonomics Society Annual Meeting, pages 48(2): 1476–1480, 1998.
[49] K. M. Stanney and R. S. Kennedy. Simulation sickness. In D. A. Vincenzi,J. A. Wise, M. Mouloua, and P. A. Hancock, editors, Human Factors inSimulation and Training, pages 117–127. CRC Press, Boca Raton, FL, 2009.
[50] R. M. Stern, S. Hu, R. LeBlanc, and K. L. Koch. Chinese hyper-susceptibilityto vection-induced motion sickness. Aviation, Space, and EnvironmentalMedicine, 64(9 Pt 1):827–830, 1993.
BIBLIOGRAPHY vii
[51] T. A. Stoffregen, E. Faugloire, K. Yoshida, M. B. Flanagan, and O. Merhi.Motion sickness and postural sway in console video games. human factors.Human Factors, 50(2):322–331, 2008.
[52] Student. The probable error of a mean. Biometrika, 6(1):1–25, 1908.
[53] A. Treisman. Focused attention in the perception and retrieval of multi-dimensional stimuli. Attention, Perception, and Psychophysics, 22(1):1–11,1977.
[54] B. Treutwein. Minireview: Adaptive psycholphysical procedures. VisionResearch, 35(17):2503–2522, 1995.
[55] A. B. Watson and D. G. Pelli. QUEST: A Bayesian adaptive psychometricmethod. Perception and Psychophysics, 33(2):113–120, 1983.
[56] B. L. Welch. The generalization of ”Student’s” problem when several differentpopulation variances are involved. Biometrika, 34(1-2):28–35, 1947.
[57] F. A. Wichman and N. J. Hill. The psychometric function: I. fitting, sam-pling, and goodness of fit. Perception and Psychophysics, 63(8):1293–1313,2001.
[58] E. Yang and M. Dorneich. The effect of time delay on emotion, arousal, andsatisfaction in human-robot interaction. In Proceedings of the Human Factorsand Ergonomics Society Annual Meeting, pages 443–447, 2015.
[59] R. Yao, T. Heath, A. Davies, T. Forsyth, N. Mitchell, andP. Hoberman. Oculus VR Best Practices Guide. Retrievedfrom http://brianschrank.com/vrgames/resources/OculusBestPractices.pdf,March 2014. Last retrieved on July 10, 2016.


![REALESTATECOMMISSION[193E] · 2011. 8. 24. · IAC7/27/11 RealEstate[193E] Analysis,p.3 CHAPTER12 DISCLOSUREOFRELATIONSHIPS 12.1(543B) Writtencompanypolicyrequired 12.2(543B) Disclosureofagency](https://img.pdfslide.us/doc/110x75/60beb5c331876c7453062a49/realestatecommission193e-2011-8-24-iac72711-realestate193e-analysisp3.jpg)