Embed Size (px)
Citation preview

1
Chapter1
Introduction
1.1 General Background
The growth of the integrated circuits (IC) is primarily based on increasing circuit
performance and the functional complexity of the circuits. To achieve the goal,
scaling down of active device sizes and increasing interconnect packing density are
very effective means. But scaling the device, the line width and space between metal
interconnections also become small. This process will increase the RC time delay,
which is due to the higher wire resistance (R) of narrower metal lines and the higher
intra/inter- level capacitance (C) between the tightly spaced interconnections. As a
result, the characteristics of the interconnections will be an important factor of RC
time delay.[1-2].
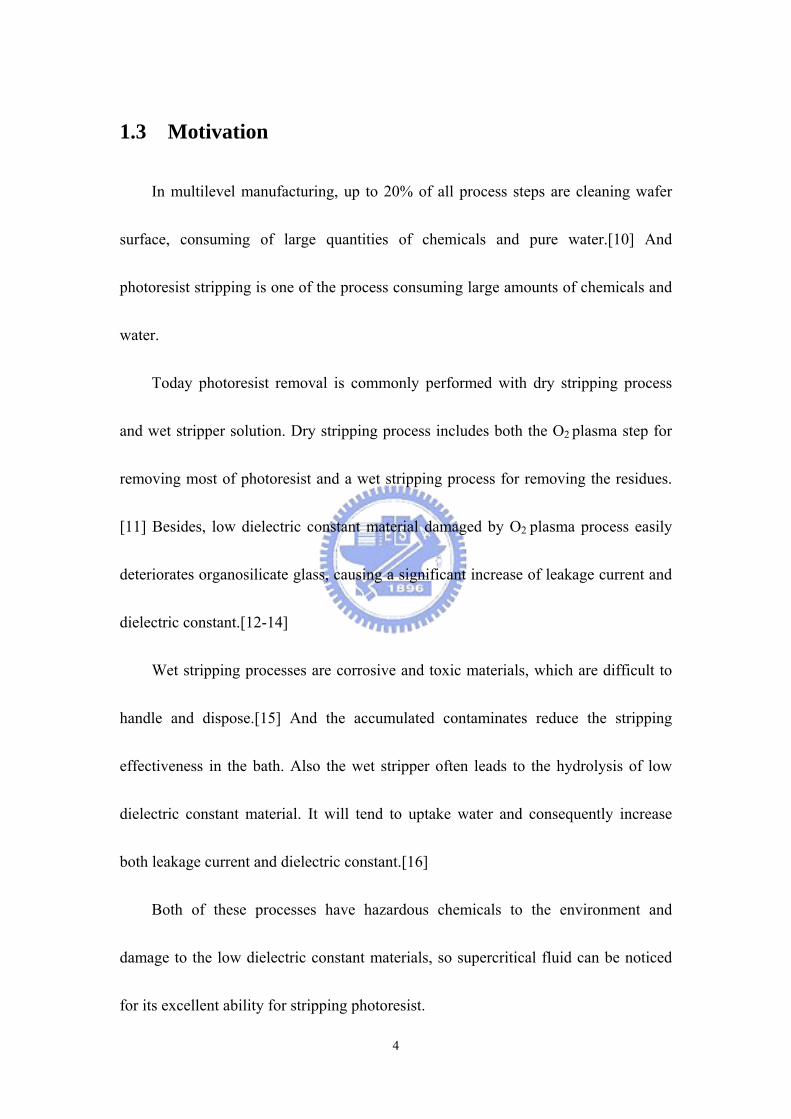
The delay effect is shown in Fig1-1, we assume that the minimum metal pitch
equals twice the metal width and the dielectric thickness. This assumption is the same
as that of the metal lines in between Fig 1-2. With the first-order approximation, time
delay τ and power consumption P can be obtained respectively as following:
2
CfVPfVP
tL
WL
RC
tWL
WtL
CCC
WtL
R
m
mm
m
mmmvL
m
m
2
2
2
2
2
2
2)tan(2
2
2)(2
π
δεπ
ρετ
ε
ρ
∝∴
∝
⎥⎥⎦
⎤
⎢⎢⎣
⎡+==
⎥⎦
⎤⎢⎣
⎡+=+=
=
Where ρ is the resistivity, Lm is the interconnect line length, W is the interconnect line
width, ε is the permittivity, tm is the thickness of the metal, and f, V and tan (δ) are
frequency, applied voltage and dielectric loss. Based on these equations, reducing RC
time delay can be divided to resistance or the capacitance. Copper has a resistivity
(1.7 µΩ-cm) much lower than the Al-Cu material (2.7µΩ-cm,). So using copper
wiring instead of Al interconnection for multi interconnects is the solution to reduce
the metal line resistance.[3-4] On the other hand, a low dielectric constant material
(k<3.0) is needed to reduce the coupling capacitance between the metal lines for
reduction of signal propagation delay, and it also reduces cross-talk noise in
interconnections and alleviates power dissipation issues. [5]
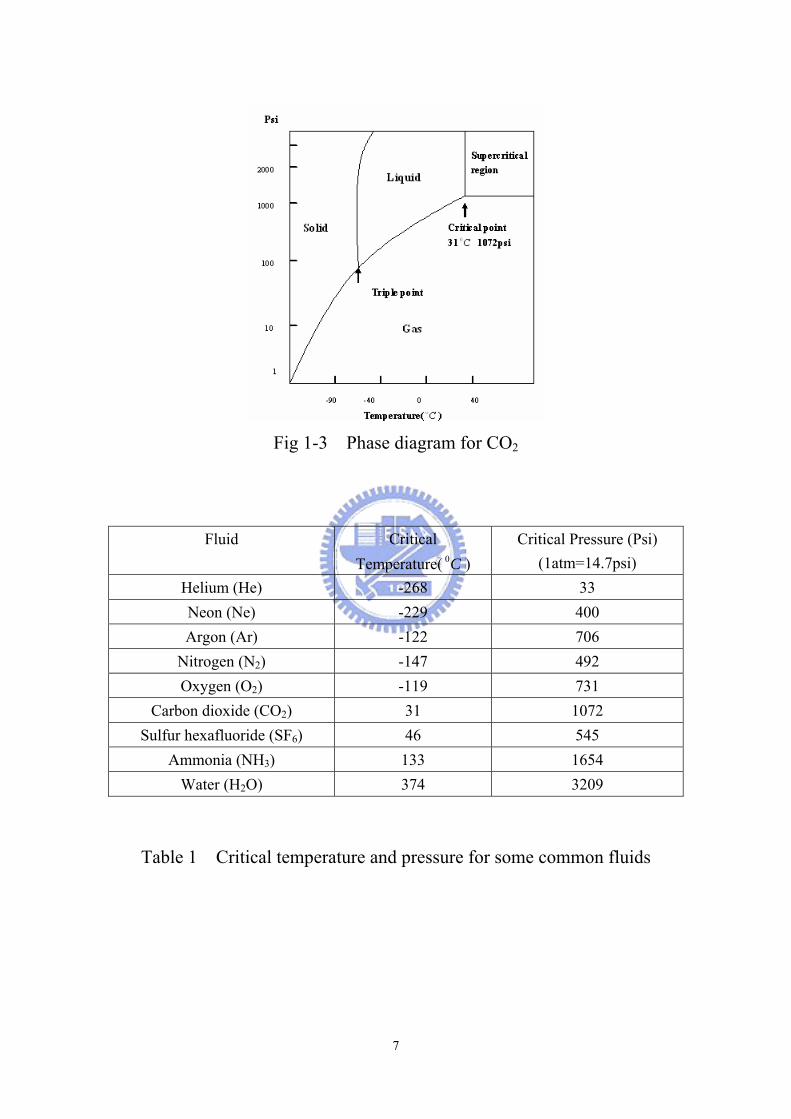
1.2 Introduction to Supercritical Fluid Processes
Supercritical fluids are compounds above their critical temperatures and pressure.
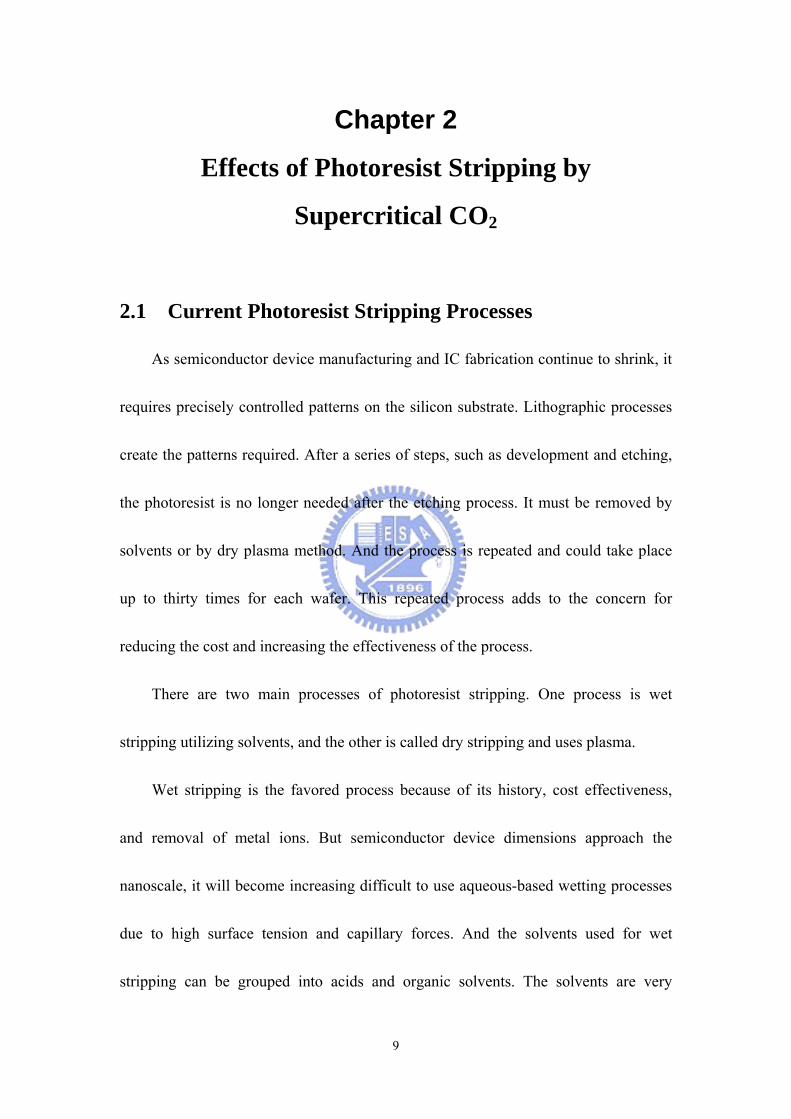
( Fig 1-3) [6-7] Table1 shows critical temperature and pressure for some common

3
fluids. And they are used in many commercial applications, including the extraction
of caffeine from coffee, fats from foods, and essential oils from plants for use in
perfumes. CO2-based supercritical fluids are particularly attractive because CO2 is
non-toxic, non-flammable, and inexpensive. Its critical conditions are easily
achievable with existing process equipment (31 C0 , 1072 psi =72.8atm).
The attractiveness of supercritical fluids for commercial applications are their
unique combination of liquid-like and gas-like properties. Table2 shows the
comparison of several physical properties of typical liquid, vapor, and supercritical
fluid state. It can be seen that high density of supercritical fluids, possessing a
liquid-like density. This gives the fluid the ability, much like that of a light
hydrocarbon (i.e. pentane), to dissolve most solutes [8]. Also supercritical fluids are
gas-like in respect to their very low viscosity and little to no surface tension allowing
them to enter the smallest pores or spaces on a wafer. These properties are what make
supercritical fluids so appealing for cleaning, extraction, and chromatography.[9]
Figure 1-4 shows the density- pressure-temperature surface for pure CO2. It can
be seen that relatively small changes in temperature or pressure near the critical point,
result in large changes in density. These properties are what make supercritical fluid
technology so attractive for the cleaning process.
4
1.3 Motivation
In multilevel manufacturing, up to 20% of all process steps are cleaning wafer
surface, consuming of large quantities of chemicals and pure water.[10] And
photoresist stripping is one of the process consuming large amounts of chemicals and
water.
Today photoresist removal is commonly performed with dry stripping process
and wet stripper solution. Dry stripping process includes both the O2 plasma step for
removing most of photoresist and a wet stripping process for removing the residues.
[11] Besides, low dielectric constant material damaged by O2 plasma process easily
deteriorates organosilicate glass, causing a significant increase of leakage current and
dielectric constant.[12-14]
Wet stripping processes are corrosive and toxic materials, which are difficult to
handle and dispose.[15] And the accumulated contaminates reduce the stripping
effectiveness in the bath. Also the wet stripper often leads to the hydrolysis of low
dielectric constant material. It will tend to uptake water and consequently increase
both leakage current and dielectric constant.[16]
Both of these processes have hazardous chemicals to the environment and
damage to the low dielectric constant materials, so supercritical fluid can be noticed
for its excellent ability for stripping photoresist.

5
The purpose of this study will discuss the photoresist stripping by supercritical
CO2 with co-solvents, and the influence of supercritical CO2 integrated to the backend
process.
6
Fig 1-1 Decrease in interconnect delay and improved performance are
achieved using copper and low-k dielectric. (Source: ITRS)
Fig 1-2 The cross-section of interconnect system with parasitic
capacitance.
7
Fig 1-3 Phase diagram for CO2
Fluid Critical Temperature( C0 )
Critical Pressure (Psi) (1atm=14.7psi)
Helium (He) -268 33 Neon (Ne) -229 400 Argon (Ar) -122 706
Nitrogen (N2) -147 492 Oxygen (O2) -119 731
Carbon dioxide (CO2) 31 1072 Sulfur hexafluoride (SF6) 46 545
Ammonia (NH3) 133 1654 Water (H2O) 374 3209
Table 1 Critical temperature and pressure for some common fluids

8
Liquid Supercritical fluid
Vapor
Density(g/c 2m ) 1.0 0.3-0.7 ~ 310− Diffusivity(c 2m /sec) < 510− 52 1010 −− − ~ 110− Viscosity(g/cm-sec) ~ 210− 63 1010 −− − ~ 610−
Table 2 Comparison of physical properties of CO2
Fig1-4 Density- pressure-temperature surface for pure CO2
9
Chapter 2
Effects of Photoresist Stripping by
Supercritical CO2
2.1 Current Photoresist Stripping Processes
As semiconductor device manufacturing and IC fabrication continue to shrink, it
requires precisely controlled patterns on the silicon substrate. Lithographic processes
create the patterns required. After a series of steps, such as development and etching,
the photoresist is no longer needed after the etching process. It must be removed by
solvents or by dry plasma method. And the process is repeated and could take place
up to thirty times for each wafer. This repeated process adds to the concern for
reducing the cost and increasing the effectiveness of the process.
There are two main processes of photoresist stripping. One process is wet
stripping utilizing solvents, and the other is called dry stripping and uses plasma.
Wet stripping is the favored process because of its history, cost effectiveness,
and removal of metal ions. But semiconductor device dimensions approach the
nanoscale, it will become increasing difficult to use aqueous-based wetting processes
due to high surface tension and capillary forces. And the solvents used for wet
stripping can be grouped into acids and organic solvents. The solvents are very
10
corrosive and are irritants to mucous membranes and skin as well as a possible
carcinogen. This acid emits highly toxic vapors when heated. Besides, the wet stripper
may cause the hydrolysis of low dielectric constant material, and increases the
leakage current and dielectric constant.
The other photoresist stripping process is dry stripping method. During plasma
process, photoresist is removed by oxygen energized in a plasma field, which oxidizes
the resist components to gases that are removed from the process chamber by a
vacuum pump. The main advantage of utilizing a dry stripping process is the
elimination of the chemical hoods and solvents needed for wet stripping. But the
plasma process has problems needed to solve. The problems can be summarized as
follows:
After plasma process, residues are left in vias and trenches that need additional
wet chemical treatment;
Plasma process is performed at high temperatures, adding to the thermal budget
of the wafer;
Plasma process is not efficient for removing mobile metallic ion contamination;
Plasma process can cause radiation damage of the electronic circuits;
With Plasma process, selectivity between photoresist and low k materials is bad
and low-k material may be mechanically affected;

11
Plasma process can modify the dielectric constant of low k material due to
charge damage;
Post-strip wet chemical treatment may modify the low k material in its electrical
properties;
Shrinking dimensions of features below 0.18 u.m present a problem for wet
chemistry as post-strip cleans method, because of surface tension issues.
Although current photoresist stripping processes are effective at removing most
photoresist, it was found that wetting processes are limitted in the reduction of
microchip size due to their physical properties. Also, the solvents have a short lifetime.
This requires disposing and replacing the solvents frequently.
The purpose of this study was to analysis the supercritical carbon dioxide for use in
the photoresist removal process to overcome current process barriers.
2.2 Mechanism of Striping Photoresist by Supercritical
Carbon Dioxide
Supercritical fluids are compounds above their critical temperature and pressure.
The critical point for pure CO2 occurs at temperature of 31oC, and pressure 1072 psi
(72.8 atm). The relatively small changes of temperature and pressure, above the
critical point, will result in large changes of CO2 density. The tenability of density is

12
one of the most attractive attributes of supercritical fluids. The gas-like properties of
low viscosity and high diffusivity are allowed for rapid transport into micro-porous
matrices. And the liquid-like property of density provides for transport and dissolving
properties.[17]
The use of supercritical carbon dioxide as a photoresist stripper has been
researched. [18-20] Rubin[18] observed that supercritical carbon dioxide behaves as a
non-polar organic solvent, similar to hexane, and is good for dissolving other
non-polar materials.[21] Small amounts of polar cosolvents can be added to enhance
the solubility of polar materials.[22-24] And supercritical carbon dioxide can clean
high aspect ratio structures by low surface tension character. In addition, Rubin
developed a closed-loop system for supercritical carbon dioxide and cosolvents. The
system was effective in stripping photoresist and no rinsing or drying is needed in
other instrument.
The mechanism for stripping photoresist by supercritical carbon dioxide has not
clearly determined. However, it is well known that the mechanism for photoresist
baked or implanted and RIE etched is different. The baked photoresist is easily
stripped by supercritical carbon dioxide with co-solvent. But the photoresist
implanted or exposed to reactive ion etching will be difficult tripped.
Rubin speculate that the photoresist is swelled by the diffusion of carbon dioxide
13
into the matrix. It will effectively soften the photoresist. The co-solvent degrades the
polymer and breaks the bonds at the surface. And repeated depressurization and
repressurization promotes the photoresist stripping. Finally fluid flows carry away the
debonded photoresist.
Recently, the other article [25] has shown a method for the photoresist removal
process by supercritical carbon dioxide. Soak and agitation steps are applied to the
wafer, including a rapid decompression of the process chamber after a soak period at
higher supercritical pressure, to mechanically weaken and break loose pieces of the
photoresist, sidewall polymer and such other materials as are sought to be removed,
with a significant pressure differential.
The soak step at an elevated supercritical pressure permits infusion of
supercritical carbon dioxide and solvents into the unwanted matter. The agitation step
follows the soak step. The agitation step includes a rapid decompression of the
process chamber in supercritical pressure, in order to mechanically weaken and break
loose pieces of the photoresist, sidewall polymer and such other materials are sought
to be removed, with a very significant different pressure. Combined with a
supercritical fluid flush to carry away the loose debris, and is then preferably
concluded by rapidly elevating the vessel pressure back to the higher supercritical
pressure, stressing the unwanted material times with rapid compression. The core
14
process steps are preceded and followed by more conventional loading and unloading
steps, except that the purging and pressurization steps avoid any liquid contact with
the substrate, constraining the inflowing process materials to process gas and
supercritical fluid.
2.3 Experimental procedures
The purpose of the experiment is to verify the photoresist stripping by
supercritical carbon dioxide with co-solvent.
The photoresist used in the experiment is positive photoresist, and is compatible
for I-Line process. The photoresist is coated on the bare silicon and low-K MSZ film.
Then the photoresist is baked at 90 C0 for 90 sec and 110 C0 for 60 sec for soft and
hard bake.
The MSZ film is formed as follows. The wafer was spun coated with a methyl-
silsesquiozane (MSZ) solution. The spin speed is about 2000 rpm for 30 sec. Then the
wafer is baked at 150 C0 and 280 C0 for 3minutes. Then the wafer was in clean room
for 48 hours in order to carry out hydration. The precursor-structure of MSZ film will
be transformed to methyl-silsesquiozane through hydrolysis and condensation process,
shown as follows:

15
OHSi-O-Si Si-HOOH-SiNHOH-Si OHNH-Si
Si-HONH-Si OH Si-NH-Si
2
322
22
+≡≡→≡+≡+≡→+≡
≡+≡→+≡≡
Afterward, the coated wafer was cured in quartz furnace at 400 C0 for 30 min
under 2N ambient. The final MSZ film was formed to about 230nm. The structure
properties of MSZ film was studied using Fourier-transform infrared spectroscopy
(FTIR) in Fig 2-1.
The co-solvents used in the experiment are PCO3 [25-26] and propyl alcohol.
Propylene carbonate, abbreviated PCO3 shown in Fig 2-2 is effective to remove
hard-baked photoresist. PCO3 is an environmentally-friendly solvent and is
non-flammable, non-toxic, biodegradable, and has a low vapor pressure. Besides,
PCO3 is completely miscible with high pressure carbon dioxide.
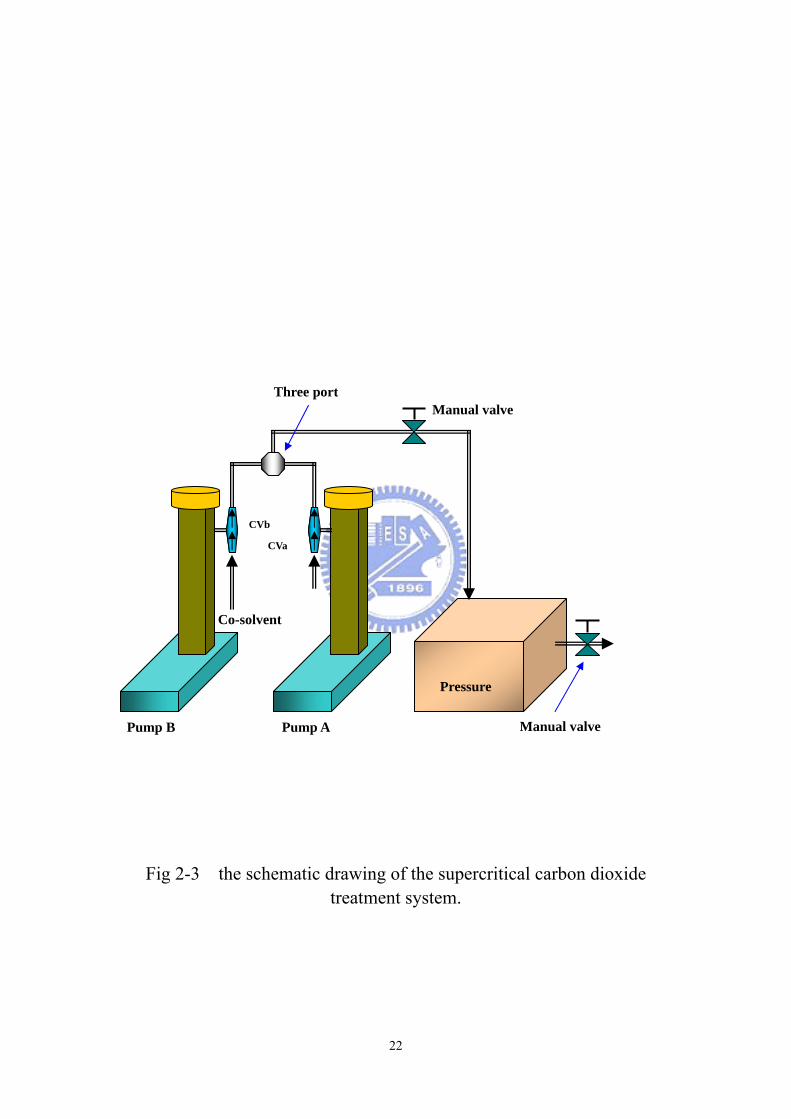
For the experiment, Fig 2-3 shows the schematic drawing of the supercritical
carbon dioxide treatment system. Pump A feeds a high-pressure syringe pump,
supplies high-pressure ambient-temperature 2CO . Pump B feeds a high-pressure
syringe pump, supplies solvents. The sample is setting in the pressure chamber. And
the flow rate is restricted by modulated tube.
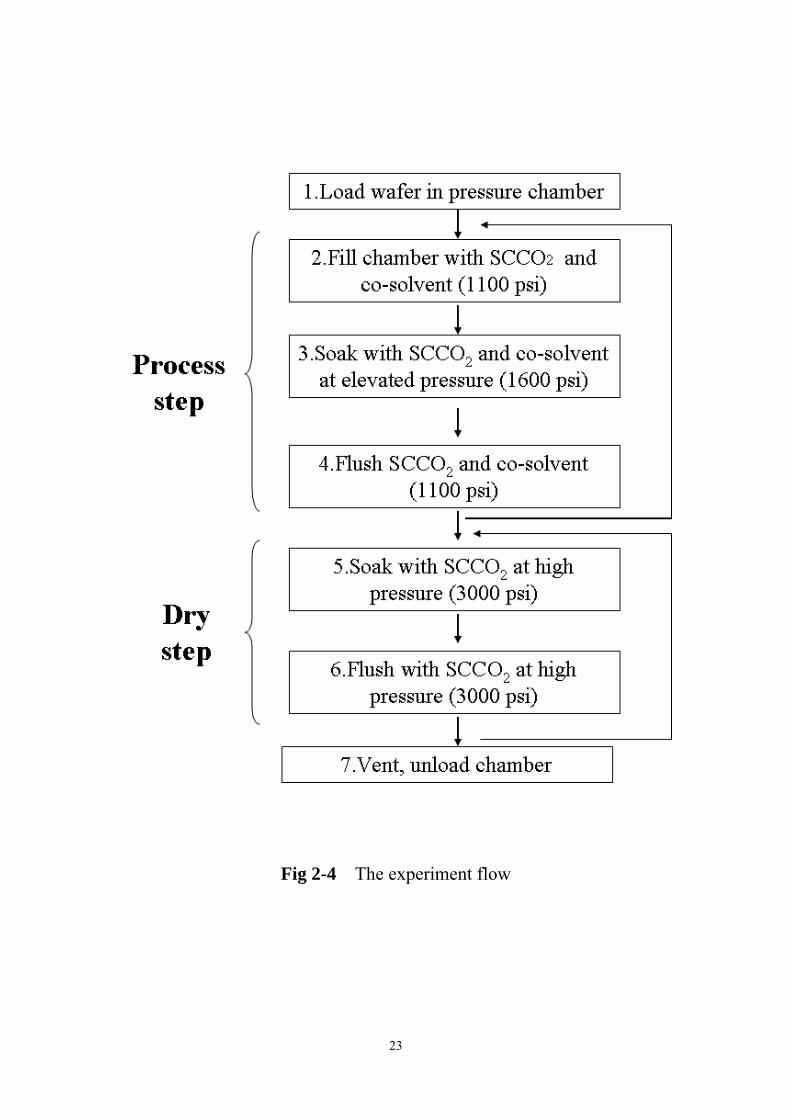
The photoresist is coated on the bare silicon and low-K MSZ film. Then the
wafer is cut into pieces suitable for the size of pressure chamber. The experiment flow
is illustrated as a block diagram in Fig 2-4. The temperature of chamber is set for

16
50 0 C, and PCO3 and propyl alcohol are used for co-solvent. Also, we change the
percent of co-solvent as 1%, 5%, 9%. The experiment begins by placing the sample
within the pressure chamber in a first process step.
In a second process step, the syringe pumps of Pump A and Pump B (Fig2-3) are
pressurized to 1100 psi, and then the supercritical CO2 carries the co-solvent into
pressure chamber. The step provides for that CO2 and co-solvent in supercritical fluid
state. In a third process step, the syringe pumps of Pump A and Pump B are
pressurized to 1600 psi, and more co-solvents are carried by supercritical CO2 into the
chamber. During this soak step, the supercritical CO2 and co-solvent are maintained in
contact with the wafer, and the co-solvent partially dissolve the photoresist.
In a fourth process step, the syringe pumps of Pump A and Pump B are
de-pressurized to 1100 psi, and provide supercritical CO2 and co-solvent to flush
through the chamber. During this flush step, co-solvent also partially dissolves the
photoresist, and supercritical CO2 carry away the dissolved photoresist.
From a second step to a fourth step, it is called” process step”, and the
photoresist is not removed completely. The process step is performed for 1, 2, 3
cycles.
After photoresist removed completely, it is followed by dry step. In a fifth
process step, the sample is soaked by supercritical CO2 at 3000psi. Then it is flushed

17
by supercritical CO2 at 3000psi in a sixth process step. The dry step is performed to
carry away the solvent on the wafer. And three cycles of dry step is needed to dry the
sample. Finally, in a seventh process step, the experiment ends by depressurizing the
pressure chamber and removing the wafer.
The experiment flow is illustrated as a diagram in Fig 2-5. The time of first step
is from 0 to t 0 . The time of second step from t 0 to t 1 is 1 min, and the time of fifth
step from t 6 to t 7 is 1 min. The flush time of the fourth step from t 4 to t 5 is 2 min, and
the flow rate is about 20 ml/min. And the flush time of the sixth step from t 7 to t 8 is 1
min, and the flow rate is about 60 ml/min. Finally, the time of seventh process step is
from t 8 to t 9 .
We perform the samples with 1%, 5%, 9% of PCO 3 and propyl alcohol, and change
the process step for 1, 2, 3, cycles. By the way, excluding the time from 0 to t 0 for
the first process step, and the pressurized time from t1 to t 2 , and from time t 5 to t 6 ,
and the seventh process step from t 8 to t 9 , the total experiment time for 1 cycle of
process step and 3cycles of dry step is 10 min. And the experiment time for 2 cycles
of process step and 3cycles of dry step is 14 min. And the experiment time for 3
cycles of process step and 3cycles of dry step is 18 min.
Fig 2-6 shows that photoresist coated on the bare silicon are stripped by
supercritical CO2 and PCO 3 with different percent of co-solvent and cycles of process
18
step. We took the photos by microscope. While the effects for the photoresist on the
bare silicon stripped by supercritical CO2 with PCO 3 , and the photoresist on the MSZ
film stripped by supercritical 2CO with PCO 3 or propyl alcohol are similar, so we
show Fig 2-6 for example. And Fig 2-7 represents the FTIR spectra for the photoresist
coated on the bare silicon and low-K MSZ film stripped by that 3 cycles of process
step and 3cycles of dry step with 5 % PCO 3 or 5% propyl alcohol.
2.4 Result and discussion
The photoresist on the bare silicon stripped by supercritical CO2 with PCO 3 is
exhibited, and the pictures are shown in Fig 2-6. In Fig 2-6, the effects of 1, 2, 3
cycles of process step and 1, 5, 9 % of PCO 3 are compared. We find that the
hard-baked photoresist is dissolved by PCO 3 , and the more cycles of process step or
more percent of PCO 3 will improve the photoresist stripping. It shows that 5% of
PCO 3 and 3 cycles of process step is needed to strip photoresist. The effect for propyl
alcohol is similar to PCO 3 . And the photoresist coated on the MSZ film stripped by
supercritical CO2 with PCO 3 or propyl alcohol is confirmed in the experiment. In
Fig.2-7, FTIR pictures show the effect for photoresist stripping. The photoresist is
treated by 3 cycles of process step and 5% or 9% of PCO 3 or propyl alcohol. The
intensities of H 2 O groups (~3400 cm -1 ) increase when photoresist is coated on the
bare silicon. And the C-H peaks (~2974, ~1470cm -1 ) also increase. After the

19
photoresist is stripped by supercritical CO2 with PCO 3 and propyl alcohol, the C-H
peaks which are the main bond of the photoresist decrease significantly, and are
similar to the peak of bare si. This means that photoresist is stripped completely. And
we find that H 2 O groups increase when photoresist is coated. After the photoresist is
stripped, the H 2 O groups decrease significantly. This means that the dry step of the
stripping process is effective for removing moisture and solvent.
Fig.2-7-3 and Fig.2-7-4 show the FTIR pictures of the photoresist on the MSZ film
stripped by supercritical CO2 with PCO 3 and propyl alcohol. The H 2 O groups and
C-H peaks increase when photoresist is coated on the MSZ film. After photoresist
stripping, the peaks decrease and are similar to the MSZ film. So, we can confirm that
the photoresist coated on the bare silicon or MSZ film can be stripped by supercritical
2CO with PCO 3 or propyl alcohol.
2.5 Summary
The current photoresist stripping by solvents or by plasma is useful. But
problems caused by stripping process can be summarized as follows: The hazards
and toxity of solvents are harmful to human and environment. It needed to continually
purchase and replace the solvents since they have a short time of effectiveness, and it
is costly. Besides, the surface tension of water will occur for small features. And
photoresist stripping by solvents or by plasma will damage the low-K film in previous

20
work.
The supercritical carbon dioxide with solvents is another method to strip
photoresist. It is not harmful to human and environment, and it needs less solvent in
the process. Besides, the damage to film is minimal by supercritical CO2.
In the experiment, we find that hard-baked photoresist can be dissolved by
solvents. More cycles of process step and solvent will strip more photoresist. And the
FTIR pictures help us to confirm the effect. In next chapter, the process will be
integrated to MSZ film. We will analyze the supercritical CO2 impacts of MSZ film.

21
Fig 2-1 FTIR spectra of MSZ formation
Fig 2-2 Structure of Propylene carbonate (PCO3)
0 500 1000 1500 2000 2500 3000 3500 4000 4500
-0.14-0.12-0.10-0.08-0.06-0.04-0.020.000.020.040.060.080.100.120.140.16
Si-N
Si-CH3
Si-CSi-O "network"
C-H
Si-OH +H2O
as-cured
48 hours latter
as-baked
Abso
rban
ce(A
.U.)
Wavenumber(cm -1)
22
Fig 2-3 the schematic drawing of the supercritical carbon dioxide
treatment system.
Co-solvent
Pressure
Pump A Pump B
Manual valve
Manual valve
Three port
CVa CVb
23
Fig 2-4 The experiment flow

24
Fig 2-5 The timeline of the experiment

25
Fig 2-6-1 photoresist stripping by supercritical 2CO with 1 % PCO 3 ,
1 cycle of process step and 3 cycles of dry step
Fig 2-6-2 photoresist stripping by supercritical 2CO with 1 % PCO 3 ,
2 cycles of process step and 3 cycles of dry step
Fig 2-6-3 photoresist stripping by supercritical 2CO with 1 % PCO 3 ,
3 cycles of process step and 3 cycles of dry step
26
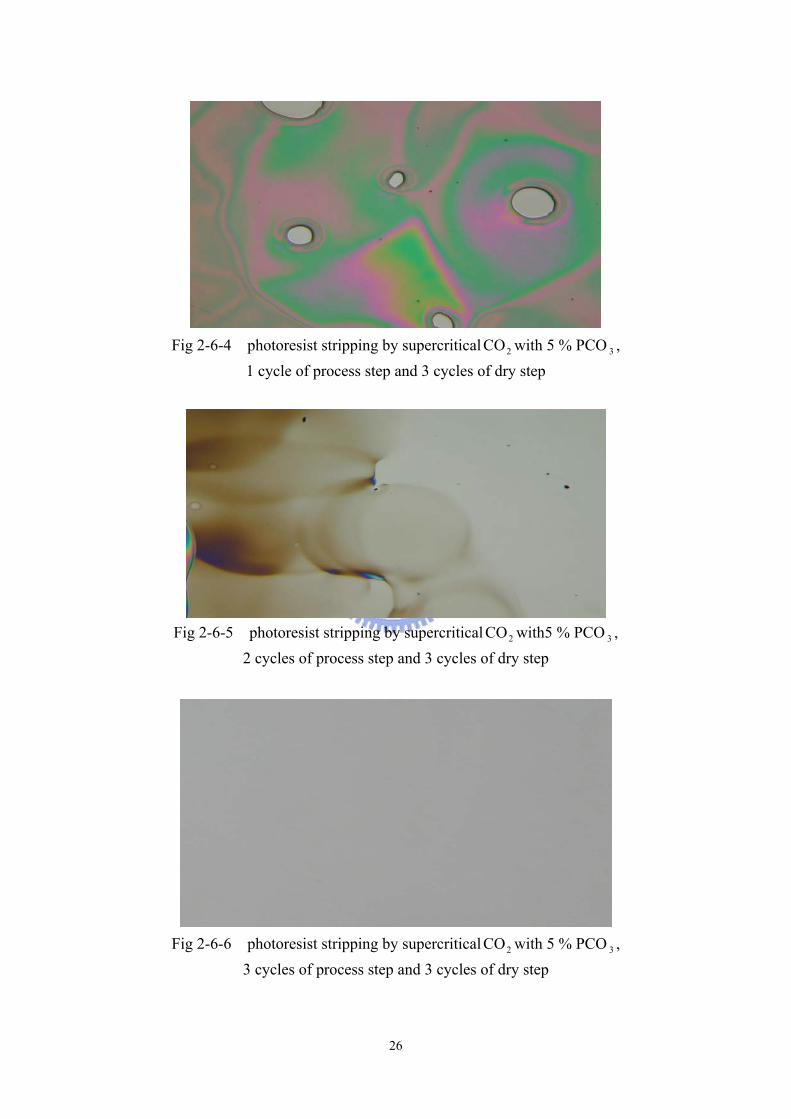
Fig 2-6-4 photoresist stripping by supercritical 2CO with 5 % PCO 3 ,
1 cycle of process step and 3 cycles of dry step
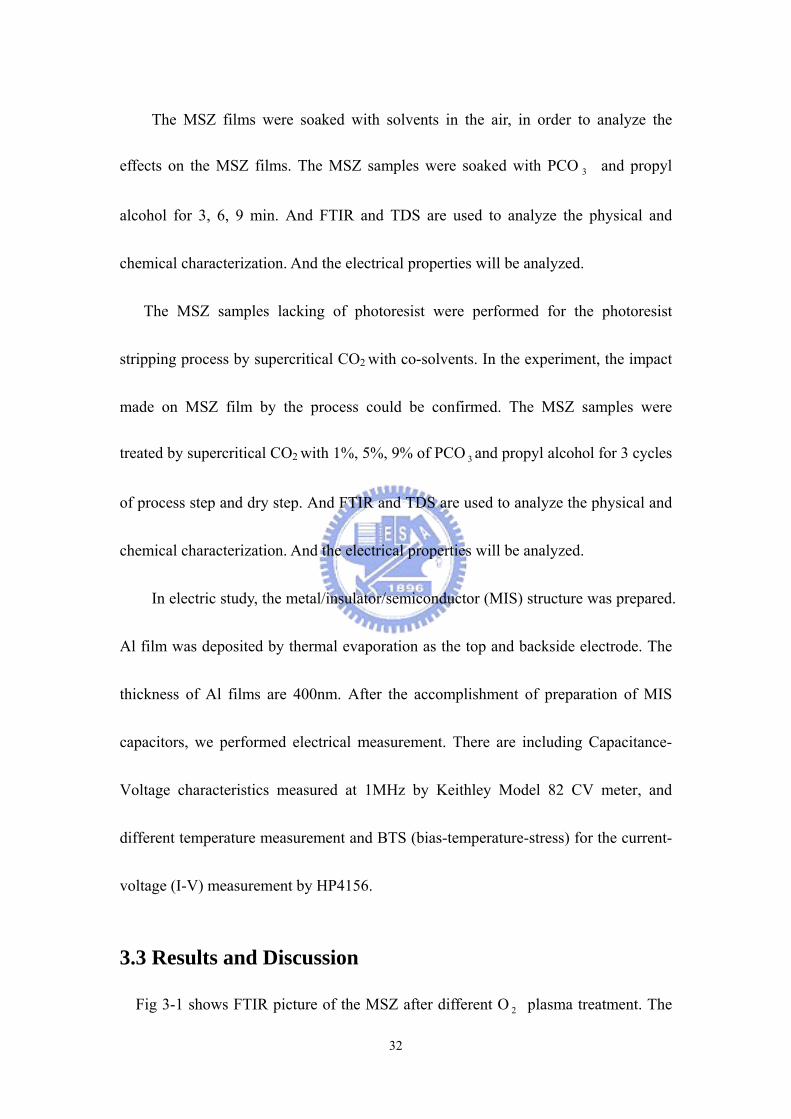
Fig 2-6-5 photoresist stripping by supercritical 2CO with5 % PCO 3 ,
2 cycles of process step and 3 cycles of dry step
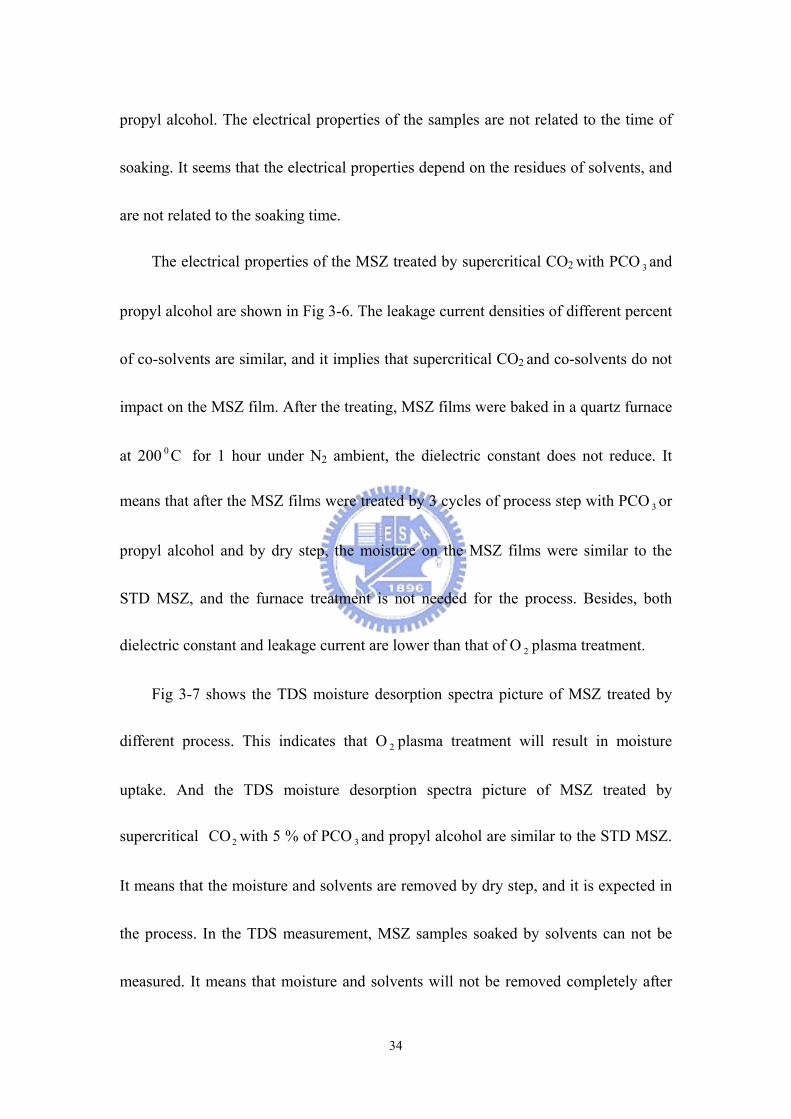
Fig 2-6-6 photoresist stripping by supercritical 2CO with 5 % PCO 3 ,
3 cycles of process step and 3 cycles of dry step

27
Fig 2-6-7 photoresist stripping by supercritical 2CO with 9 % PCO 3 ,
1 cycle of process step and 3 cycles of dry step
Fig 2-6-8 photoresist stripping by supercritical 2CO with 9 % PCO 3 ,
2 cycles of process step and 3 cycles of dry step
Fig 2-6-9 photoresist stripping by supercritical 2CO with 9 % PCO 3 ,
3cycles of process step and 3 cycles of dry step

28
Fig 2-7-1 FTIR spectrum of photoresist stripping on bare silicon by supercritical CO2 with PCO 3
Fig 2-7-2 FTIR spectrum of photoresist stripping on bare silicon by supercritical CO2 with propyl alcohol
500 1000 1500 2000 2500 3000 3500 4000 4500
-0.2
-0.1
0.0
0.1
0.2
0.3
0.4
0.5
C-H C-HO-H
9% 3cycle
5% 3cycle
PR
Base Si
Abs
orba
nce(
A.U
.)
Wavenumber(cm -1)
500 1000 1500 2000 2500 3000 3500 4000 45000.0
0.1
0.2
0.3
0.4
0.5
0.6
0.7
0.8
C-H C-H
O-H
5% 3cycle
9% 3cycle
PR
Base Si
Abso
rban
ce(A
.U.)
Wavenumber(cm -1)

29
Fig 2-7-3 FTIR spectrum of photoresist stripping on MSZ film by supercritical CO2 with PCO 3
Fig 2-7-4 FTIR spectrum of photoresist stripping on MSZ film by
supercritical CO2 with propyl alcohol
0 500 1000 1500 2000 2500 3000 3500 4000 4500
-0.2
-0.1
0.0
0.1
0.2
0.3
0.4
0.5
C -H
C-HO-H
9% 3cycle
5% 3cycle
PR /MSZ
MSZ
Abso
rban
ce(A
.U.)
W avenum ber(cm -1)
0 500 1000 1500 2000 2500 3000 3500 4000 4500-0.25-0.20-0.15-0.10-0.050.000.050.100.150.200.250.300.350.400.450.500.55
C-H
C-H O-H
9% 3cycle
5% 3cycle
PR/MSZ
MSZ
Abs
orba
nce(
A.U
.)
Wavenumber(cm -1)

30
Chapter 3.
Study on Process Integration of Low-k MSZ and
Supercritical CO2
3.1 Introduction
Many low dielectric constant materials are under investigation to lower the RC
delay of interconnect layers in microelectronic device. Low-k films are patterned
using photoresist and Plasma etching followed by ashing with O 2 or other chemistries.
The photoresist and residues are left on the surface of the low-k film after the process,
and they must be completely removed to obtain good adhesion.
The primary low-k materials for photoresist stripping issues are the selectivity
between photoresist and low-k materials, and low-k materials may be mechanically
affected. And the low-k films must retain its hydrophobic after the process and each
type of low-k film must be fit for the process. There are ongoing effects to improve
the Plasma etching process; however the conventional photoresist stripping has a lot
of impacts on backend process needed to overcome. So, supercritical CO2 cleaning
process is being investigated for backend applications.
The hard-baked photoresist stripping by supercritical 2CO is achieved. We can
confirm that photoresist stripping by supercritical 2CO with co-solvent is workable.

31
Following, the purpose of this work will focus on the supercritical CO2 impacts of
low-k MSZ film.
3.2Experiment Procedures
In chapter 2, we confirm the photoresist stripping process works. And
supercritical 2CO with 5 % of PCO 3 or propyl alcohol for 3 cycles of process step is
needed for the process. The purpose of experiment will focus on the
supercritical 2CO impacts of low-k MSZ film, and the process will act on MSZ film
only, lacking of the photoresist on the film. And the O2 plasma process is the reference
of the experiment.
The MSZ solution was coated on the silicon wafer, and bake, hydration, and
curing are carried out to form the MSZ film. The parameters are shown as chapter 2.
After the standard samples were prepared, some of the samples were treated with
oxygen plasma by PECVD. The oxygen gas flow is 300sccm, RF power is 300 W,
reacted temperature is 300 C0 , and chamber pressure is 300 mTorr, with various
treated time :0.5, 1, 3, minutes. The thickness of the MSZ film was measured by n&k
analyzer. Material analysis such as Fourier transform infrared spectrum (FTIR) and
thermal desorption spectrometer (TDS) are used to confirm the physical and chemical
characterization. And the electrical properties will be analyzed.
32
The MSZ films were soaked with solvents in the air, in order to analyze the
effects on the MSZ films. The MSZ samples were soaked with PCO 3 and propyl
alcohol for 3, 6, 9 min. And FTIR and TDS are used to analyze the physical and
chemical characterization. And the electrical properties will be analyzed.
The MSZ samples lacking of photoresist were performed for the photoresist
stripping process by supercritical CO2 with co-solvents. In the experiment, the impact
made on MSZ film by the process could be confirmed. The MSZ samples were
treated by supercritical CO2 with 1%, 5%, 9% of PCO 3 and propyl alcohol for 3 cycles
of process step and dry step. And FTIR and TDS are used to analyze the physical and
chemical characterization. And the electrical properties will be analyzed.
In electric study, the metal/insulator/semiconductor (MIS) structure was prepared.
Al film was deposited by thermal evaporation as the top and backside electrode. The
thickness of Al films are 400nm. After the accomplishment of preparation of MIS
capacitors, we performed electrical measurement. There are including Capacitance-
Voltage characteristics measured at 1MHz by Keithley Model 82 CV meter, and
different temperature measurement and BTS (bias-temperature-stress) for the current-
voltage (I-V) measurement by HP4156.
3.3 Results and Discussion
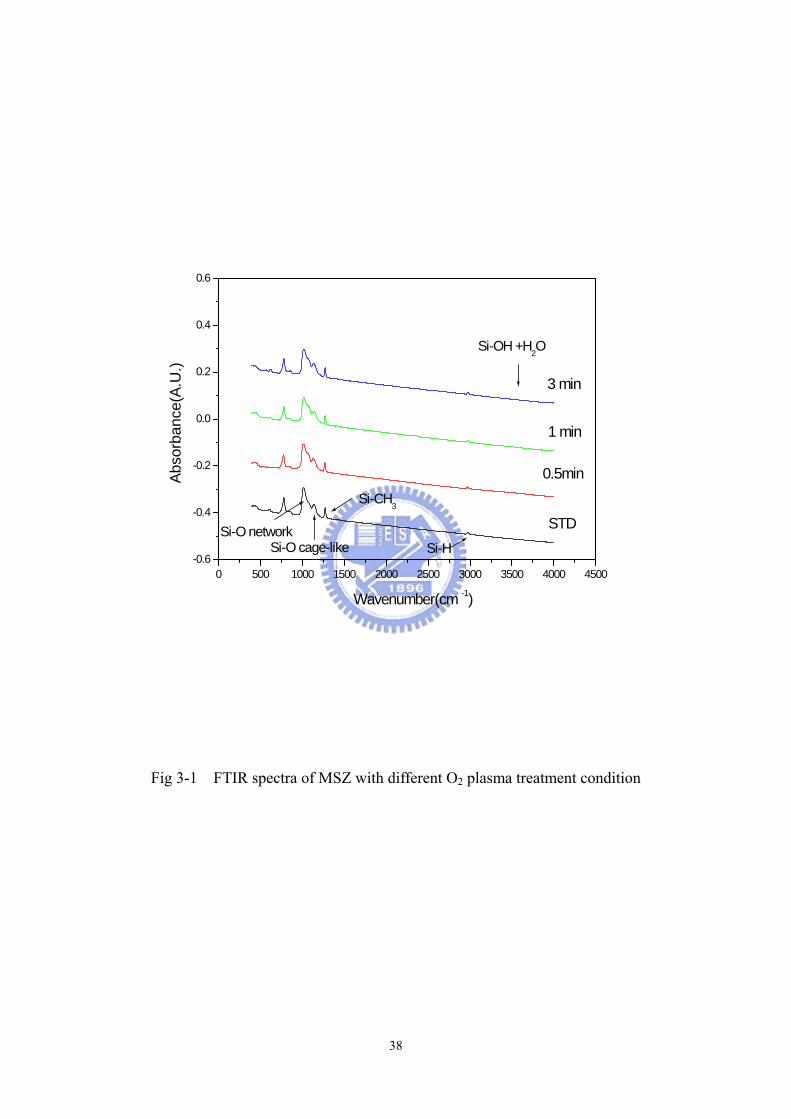
Fig 3-1 shows FTIR picture of the MSZ after different O 2 plasma treatment. The

33
intensities of Si-OH and H 2 O bonds (933,~3400 cm -1 ) increased gradually when the
time of the O 2 plasma treatment is raising. The intensities of C-H bond (2974 cm -1 ),
and Si- 3CH bonds (781, 1273 cm-1) decreased after the O 2 plasma treatment. The
variation of the spectrum is not obvious, because the bonds of the MSZ film are
strong to reduce the damage from O 2 plasma treatment. And the slightly increase in
Si-OH and H2O bonds is assumed that the dangling bonds generated by O 2 plasma
treatment easily absorb moisture when the sample is exposed to the environment. And
the oxygen radicals can react with a large number of Si- 3CH groups on MSZ films,
which cause the content of C-H and Si-C bonds decreasing. The reaction will convert
Si- 3CH bonds into Si-OH groups after the reaction. This indicates that after O 2
plasma treatment it will result in moisture uptake. And Fig 3-2 shows that damage of
MSZ surface and moisture absorption will increase the dielectric constant, and the
leakage current increases with the increase of O 2 plasma treatment time.
Fig 3-3 shows FTIR picture of the MSZ soaked with different solvents and
treatment time. And Fig 3-4 shows FTIR picture of the MSZ treated by supercritical
CO2 with 5 % of PCO 3 and propyl alcohol. We find that Si-OH and H 2 O bonds
change unobvious. It seems that solvents and supercritical CO2 process damage the
MSZ film slightly, and it needs another evidence to support the hypothesis.
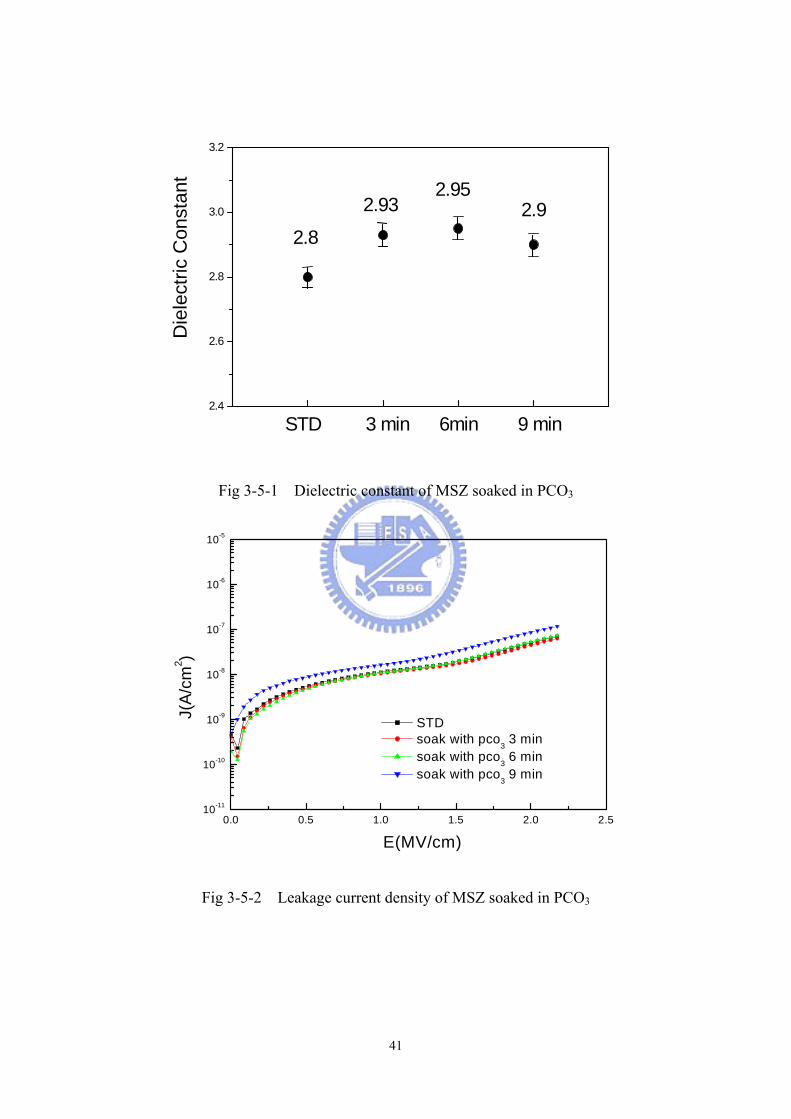
Fig 3-5 shows the electrical properties of the samples soaked with PCO 3 and
34
propyl alcohol. The electrical properties of the samples are not related to the time of
soaking. It seems that the electrical properties depend on the residues of solvents, and
are not related to the soaking time.
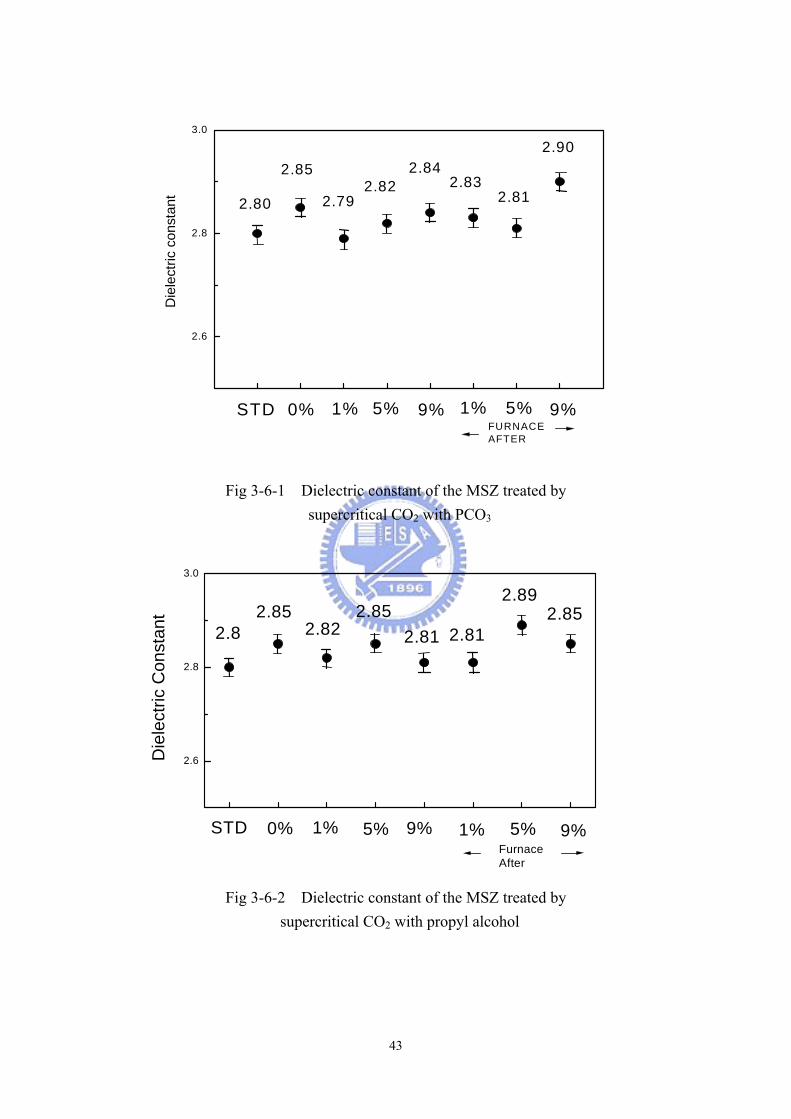
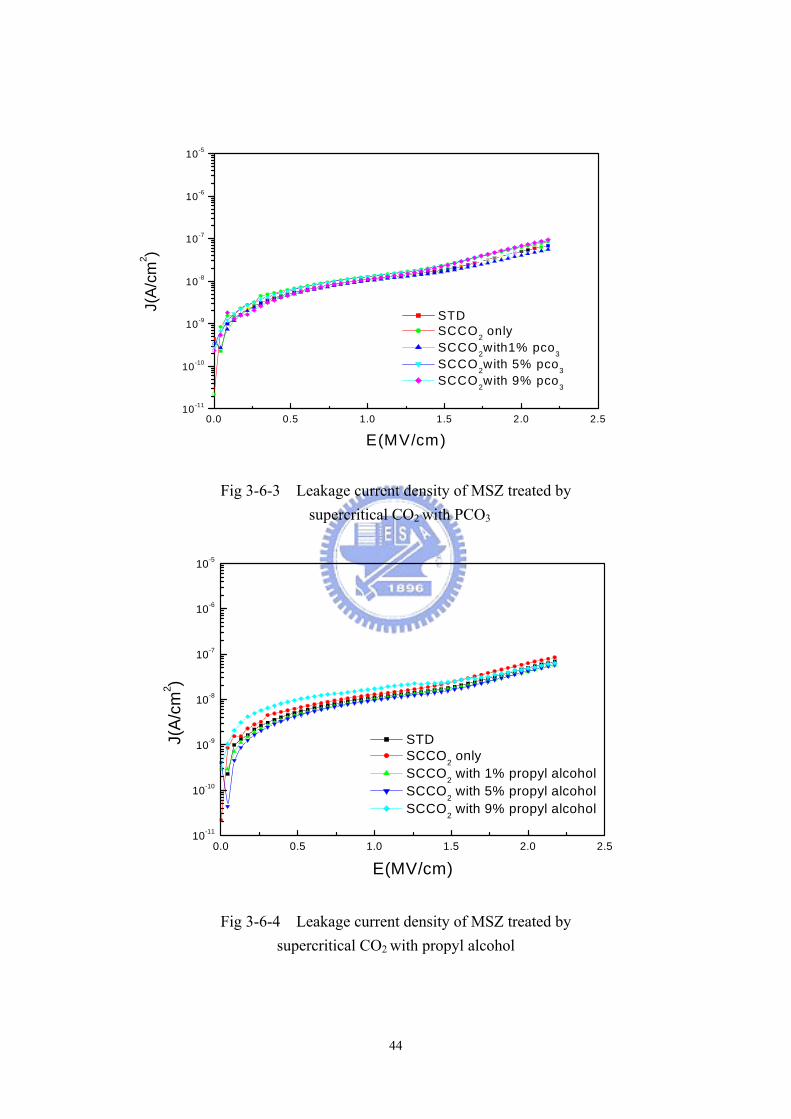
The electrical properties of the MSZ treated by supercritical CO2 with PCO 3 and
propyl alcohol are shown in Fig 3-6. The leakage current densities of different percent
of co-solvents are similar, and it implies that supercritical CO2 and co-solvents do not
impact on the MSZ film. After the treating, MSZ films were baked in a quartz furnace
at 200 C0 for 1 hour under N2 ambient, the dielectric constant does not reduce. It
means that after the MSZ films were treated by 3 cycles of process step with PCO 3 or
propyl alcohol and by dry step, the moisture on the MSZ films were similar to the
STD MSZ, and the furnace treatment is not needed for the process. Besides, both
dielectric constant and leakage current are lower than that of O 2 plasma treatment.
Fig 3-7 shows the TDS moisture desorption spectra picture of MSZ treated by
different process. This indicates that O 2 plasma treatment will result in moisture
uptake. And the TDS moisture desorption spectra picture of MSZ treated by
supercritical 2CO with 5 % of PCO 3 and propyl alcohol are similar to the STD MSZ.
It means that the moisture and solvents are removed by dry step, and it is expected in
the process. In the TDS measurement, MSZ samples soaked by solvents can not be
measured. It means that moisture and solvents will not be removed completely after

35
the samples are soaked by solvents.
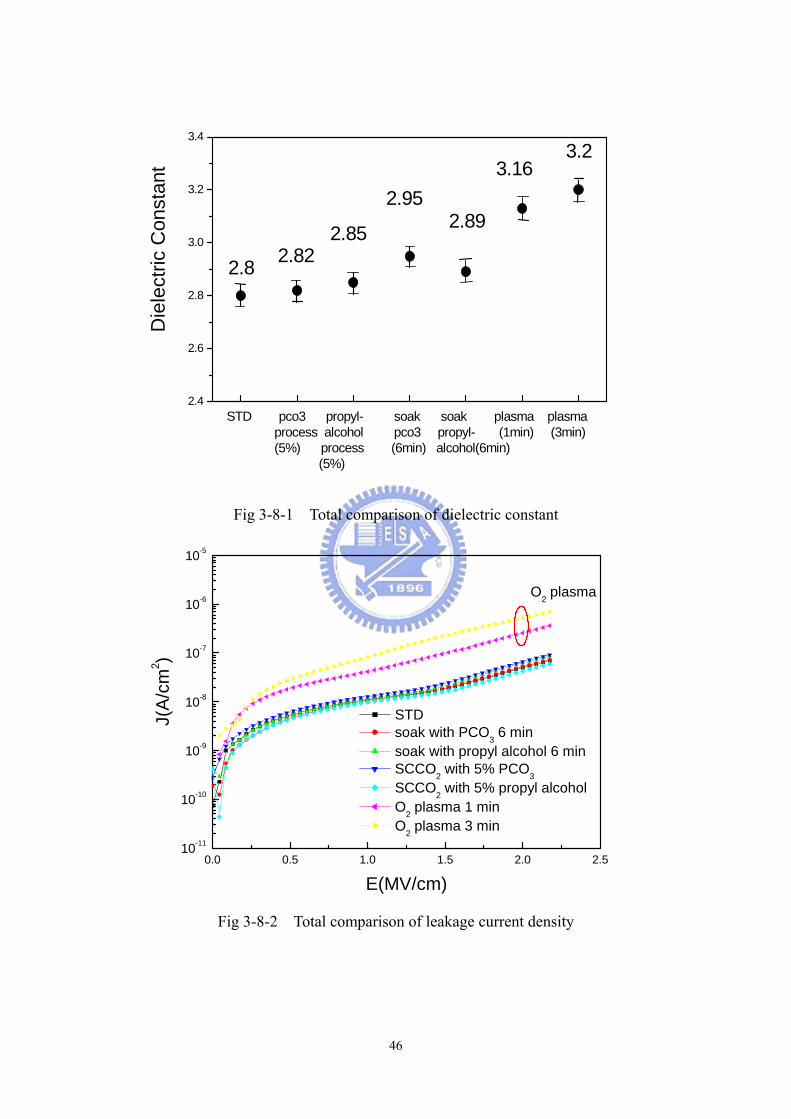
And the comparison of different process of the MSZ films is done in Fig 3-8.
Compared with the soaking process or the supercritical 2CO process, the leakage
current density and dielectric constant of O 2 plasma process are elevated seriously.
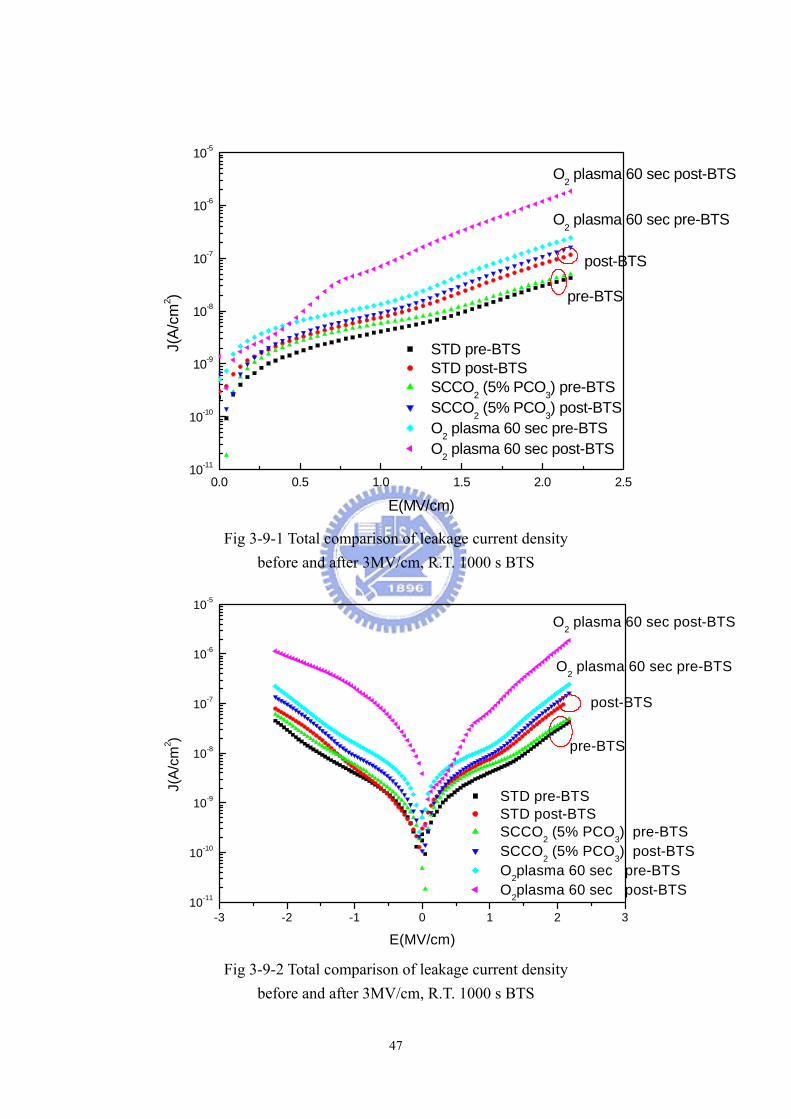
Fig 3-9 shows leakage current densities of MSZ with O 2 plasma process 60 sec and
MSZ with supercritical 2CO process treatment. After 3MV/cm, R.T. 1000 s BTS, the
leakage current densities all increase, however the leakage current density of MSZ
with O 2 plasma treatment increases obviously, because of the damaged and moisture
absorption property of MSZ film. According to the result, we know that with
increasing O 2 plasma time, the leakage current density increases. However, the
soaking and supercritical 2CO process will damage the MSZ film slightly, and the
leakage current density and dielectric constant increase unobviously than that of
O 2 plasma process.
Fig 3-10 shows leakage current densities of the samples at R.T. and at 150 oC.
The leakage current densities of the STD MSZ and MSZ after
supercritical 2CO process treatment increase obviously at 150oC, while the leakage
current densities of the MSZ after O 2 plasma process treatment slightly increase. All
leakage current densities would increase with increasing temperature, revealing a
temperature dependence on the leakage behavior. The leakage current density of the

36
MSZ after O 2 plasma process treatment is higher than the others at R.T. However, the
leakage current densities are similar to each other at 150 oC. This means that though
the leakage current density increases with increasing temperature, the moisture will be
removed at 150 oC and that will cause the leakage current density decreasing. It is the
reason why the leakage current density of the MSZ after O 2 plasma process treatment
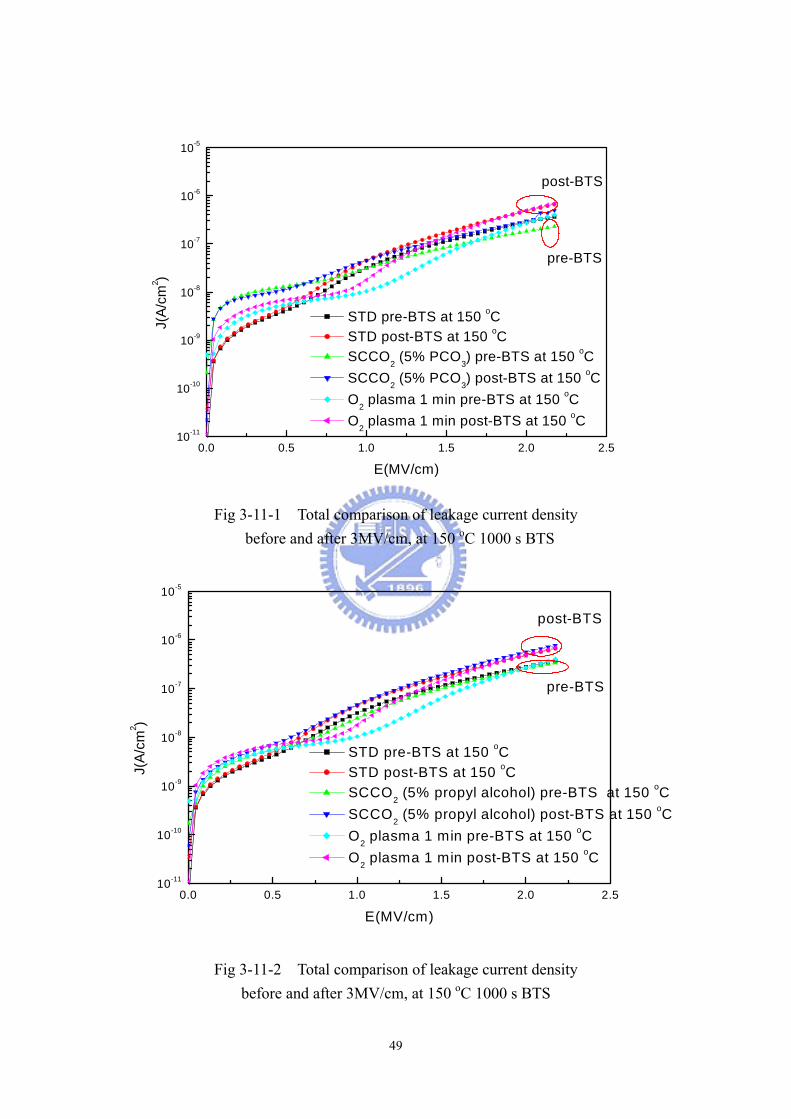
does not increase obviously at 150 oC. Fig 3-11 shows the leakage current densities of
each samples on 3MV/cm 150 oC 1000 s BTS, and the leakage current density of the
MSZ after O 2 plasma process treatment increases slightly and is similar to the others
after BTS at 150 oC.

37
3.4 Summary
In this study, we investigated the effect of various treatments on MSZ film. The
results show that MSZ films would absorb moisture after O 2 plasma treatment, and
the electrical properties will become worse than STD MSZ. At the same time, the
reliability will decrease. The electrical properties of the MSZ films treated by
supercritical 2CO with co-solvent change slightly comparing with STD MSZ, and
they are better than that of treated by O 2 plasma obviously. This indicated that
supercritical 2CO with co-solvent is fit for the low k MSZ. Consequently, supercritical
2CO with co-solvent process has advantage over O 2 plasma process for photoresist
stripping in our study.
38
0 500 1000 1500 2000 2500 3000 3500 4000 4500-0.6
-0.4
-0.2
0.0
0.2
0.4
0.6
Si-OH +H2O
Si-O networkSi-O cage-like
Si-CH3
Si-H
3 min
1 min
0.5min
STD
Abso
rban
ce(A
.U.)
Wavenumber(cm -1)
Fig 3-1 FTIR spectra of MSZ with different O2 plasma treatment condition

39
1.0
1.5
2.0
2.5
3.0
3.5
3 min1 min0.5 minSTD
3.203.163.11
2.80
Die
lect
ric c
onst
ant
Fig 3-2-1 Dielectric constant variation of different O2 plasma treatment
0.0 0.5 1 .0 1 .5 2 .0 2.510 -11
10 -10
10 -9
10 -8
10 -7
10 -6
10 -5
O 2 p lasm a 180 sec O 2 p lasm a 60 sec O 2 p lasm a 30 sec S T D
J(A
/cm
2 )
E (M V /cm )
Fig 3-2-2 Leakage current density of MSZ with different O2 plasma treatment at R.T.

40
Fig 3-3 FTIR spectra of MSZ soaked with different solvents and treatment time
Fig 3-4 FTIR spectra of MSZ treated by SCCO2 with different cosolvent
0 500 1000 1500 2000 2500 3000 3500 4000 4500-0.2
0.0
0.2
0.4
0.6
0.8
1.0
1.2
1.4
STD
PCO3 3 min
PCO3 6 min
PCO3 9 min
propyl alcohol 3 min
propyl alcohol 6 min
propyl alcohol 9 minAb
sorb
ance
(A.U
.)
Wavenumber(cm -1)
0 500 1000 1500 2000 2500 3000 3500 4000 4500
-0.3
-0.2
-0.1
0.0
0.1
0.2
0.3
0.4
0.5
MSZ with SCCO2(5% propyl alcohol)
MSZ with SCCO2(5% PCO3)
MSZ with SCCO2 process
STD
Abso
rban
ce(A
.U.)
Wavenumber(cm -1)
41
Fig 3-5-1 Dielectric constant of MSZ soaked in PCO3
Fig 3-5-2 Leakage current density of MSZ soaked in PCO3
2.4
2.6
2.8
3.0
3.2
STD 3 min 6min 9 min
2.92.95
2.93
2.8
Die
lect
ric C
onst
ant
0.0 0.5 1.0 1.5 2.0 2.510-11
10-10
10-9
10-8
10-7
10-6
10-5
J(A
/cm
2 )
E(MV/cm)
STD soak with pco3 3 min soak with pco3 6 min soak with pco3 9 min

42
Fig 3-5-3 Dielectric constant density of MSZ soaked in propyl alcohol
Fig 3-5-4 Leakage current density of MSZ soaked in propyl alcohol
2.0
2.5
3.0
3.5
STD 3 min 6 min 9 min
2.862.893.03
2.8
Die
lect
ric C
onst
ant
0 .0 0 .5 1 .0 1 .5 2 .0 2 .51 0 -1 1
1 0 -1 0
1 0 -9
1 0 -8
1 0 -7
1 0 -6
1 0 -5
J(A
/cm
2 )
E (M V /c m )
S T D s o a k w ith p ro p y l a lc o h o l 3 m in s o a k w ith p ro p y l a lc o h o l 6 m in s o a k w ith p ro p y l a lc o h o l 9 m in
43
Fig 3-6-1 Dielectric constant of the MSZ treated by supercritical CO2 with PCO3
Fig 3-6-2 Dielectric constant of the MSZ treated by supercritical CO2 with propyl alcohol
2.6
2.8
3.0
FURNACEAFTER
2.842.82
2.79
2.85
2.802.83
2.81
2.90
9%5%1%
9%5%1%0%STD
Die
lect
ric c
onst
ant
2.6
2.8
3.0
FurnaceAfter
9%5%1%9%5%1%0%STD
2.852.89
2.812.812.85
2.822.85
2.8
Die
lect
ric C
onst
ant
44
Fig 3-6-3 Leakage current density of MSZ treated by supercritical CO2 with PCO3
Fig 3-6-4 Leakage current density of MSZ treated by supercritical CO2 with propyl alcohol
0.0 0.5 1.0 1.5 2.0 2.510-11
10-10
10-9
10-8
10-7
10-6
10-5
J(
A/c
m2 )
E(MV/cm)
STD SCCO2 only SCCO2with1% pco3 SCCO2with 5% pco3 SCCO
2with 9% pco
3
0.0 0.5 1.0 1.5 2.0 2.510-11
10-10
10-9
10-8
10-7
10-6
10-5
J(A
/cm
2 )
E(MV/cm)
STD SCCO2 only SCCO2 with 1% propyl alcohol SCCO2 with 5% propyl alcohol SCCO2 with 9% propyl alcohol

45
Fig 3-7 TDS moisture desorption spectra of MSZ treated by different process
0 200 400 600 800
5.0x10⁻¹⁰
1.0x10⁻⁹
1.5x10⁻⁹
2.0x10⁻⁹
2.5x10⁻⁹
3.0x10⁻⁹
MSZ MSZ with SCCO2 (5% PCO3) MSZ with SCCO2 (5% propyl alcohol) MSZ with O2 Plasma 3min
while MSZ soaked with PCO3 or propyl alcohol is exceed the max sensitivity
Ioni
oc In
tens
ity
Temperature(OC)
46
Fig 3-8-1 Total comparison of dielectric constant
Fig 3-8-2 Total comparison of leakage current density
2.4
2.6
2.8
3.0
3.2
3.4
STD pco3 propyl- soak soak plasma plasma process alcohol pco3 propyl- (1min) (3min) (5%) process (6min) alcohol(6min) (5%)
3.23.16
2.892.95
2.852.822.8
Die
lect
ric C
onst
ant
0.0 0.5 1.0 1.5 2.0 2.510-11
10-10
10-9
10-8
10-7
10-6
10-5
O2 plasma
J(A
/cm
2 )
E(MV/cm)
STD soak with PCO3 6 min soak with propyl alcohol 6 min SCCO2 with 5% PCO3 SCCO2 with 5% propyl alcohol O2 plasma 1 min O2 plasma 3 min
47
Fig 3-9-1 Total comparison of leakage current density before and after 3MV/cm, R.T. 1000 s BTS
Fig 3-9-2 Total comparison of leakage current density before and after 3MV/cm, R.T. 1000 s BTS
0.0 0.5 1.0 1.5 2.0 2.510-11
10-10
10-9
10-8
10-7
10-6
10-5
O2 plasma 60 sec post-BTS
post-BTS
pre-BTS
O2 plasma 60 sec pre-BTS
J(A
/cm
2 )
E(MV/cm)
STD pre-BTS STD post-BTS SCCO2 (5% PCO3) pre-BTS SCCO2 (5% PCO3) post-BTS O2 plasma 60 sec pre-BTS O2 plasma 60 sec post-BTS
-3 -2 -1 0 1 2 310-11
10-10
10-9
10-8
10-7
10-6
10-5
pre-BTS
post-BTS
O2 plasma 60 sec pre-BTS
O2 plasma 60 sec post-BTS
J(A/
cm2 )
E(MV/cm)
STD pre-BTS STD post-BTS SCCO2 (5% PCO3) pre-BTS SCCO2 (5% PCO3) post-BTS O2plasma 60 sec pre-BTS O2plasma 60 sec post-BTS

48
Fig 3-10-1 Leakage current density of the samples at R.T. and at 150 oC.
Fig 3-10-2 Leakage current density of the samples at R.T. and at 150 oC.
0.0 0.5 1.0 1.5 2.0 2.510-11
10-10
10-9
10-8
10-7
10-6
10-5
Measured at R.T.
Measured at 150oC
J(A
/cm
2 )
E(MV/cm)
STD at R.T. STD at 150 oC SCCO2 (5% PCO3) at R.T. SCCO2 (5% PCO3) at 150 oC O2 plasma 1 min at R.T. O2 plasma 1 min at 150 oC
0.0 0.5 1.0 1.5 2.0 2.510-11
10-10
10-9
10-8
10-7
10-6
10-5
Measured at 150oC
Measured at R.T.
J(A
/cm
2 )
E(MV/cm)
STD at R.T. STD at 150 oC SCCO
2 (5% propyl alcohol) at R.T.
SCCO2 (5% propyl alcohol) at 150 oC O2 plasma 1 min at R.T. O2 plasma 1 min at 150 oC
49
Fig 3-11-1 Total comparison of leakage current density before and after 3MV/cm, at 150 oC 1000 s BTS
Fig 3-11-2 Total comparison of leakage current density before and after 3MV/cm, at 150 oC 1000 s BTS
0.0 0.5 1.0 1.5 2.0 2.510-11
10-10
10-9
10-8
10-7
10-6
10-5
post-BTS
pre-BTS
J(A/
cm2 )
E(MV/cm)
STD pre-BTS at 150 oC STD post-BTS at 150 oC SCCO2 (5% PCO3) pre-BTS at 150 oC SCCO2 (5% PCO3) post-BTS at 150 oC O2 plasma 1 min pre-BTS at 150 oC O2 plasma 1 min post-BTS at 150 oC
0.0 0.5 1.0 1.5 2.0 2.510-11
10-10
10-9
10-8
10-7
10-6
10-5
pre-BTS
post-BTS
J(A/
cm2 )
E(MV/cm)
STD pre-BTS at 150 oC STD post-BTS at 150 oC SCCO2 (5% propyl alcohol) pre-BTS at 150 oC SCCO2 (5% propyl alcohol) post-BTS at 150 oC O2 plasma 1 min pre-BTS at 150 oC O2 plasma 1 min post-BTS at 150 oC
50
Chaper4
Conclusions and Future Works
4.1Conclusions
In this work, a photoresist stripping process by supercritical 2CO with co-solvent
and its process method are proposed. Overall, the supercritical 2CO process is
effective in stripping photoresist, and it needs less solvents. O2 plasma ashing is
commonly used to remove the photoresist in integrated circuit fabrication. However,
O2 plasma will attack the functional groups of silica-based MSZ films, causing the
formation of Si-OH groups during photoresist removal. Comparing with O 2 plasma
treatment, supercritical 2CO with co-solvent has less damage on low k MSZ film. And
the electrical properties of MSZ treated by supercritical 2CO with co-solvent are
obviously better than that treated by O 2 plasma. The reliability of MSZ after
O 2 plasma treatment during 3MV/cm 1000s BTS at R.T. is worse than the MSZ after
supercritical 2CO process. However, the leakage current density of MSZ after
O 2 plasma treatment at 150 oC or during 3MV/cm 1000s BTS at 150 oC is close to
that after supercritical 2CO treatment, because of the desorption of the moisture.

51
4.2 Future Works
In this study, we focus on the photoresist stripping and the impacts on low-k film,
and there are numbers of topics relevant to the work which deserve for future studies:
.
(1) Investigate the effects of supercritical CO2 with co-solvent to more low-k
materials.
(2) Remove post-RIE plasma residues on patterned ultra low k films using
supercritical CO2 with co-solvent.
(3) Remove the Cu metal atoms and CuOx contaminations selectively from Cu
interconnect lines before deposition of barrier metal.
There are other applications for supercritical CO2 process. For example, it can be
used to deposit metallic and insulating thin films. It is also possible to use
supercritical fluids for etching metal and oxide films.
However, the operating conditions require high pressure process chambers not
typical found in the vacuum-intensive semiconductor fab. This imposes a
psychological safety for the supercritical 2CO technology.
52
References
[1] S. Yang, in Proceeding of Symposium. Mater. Res. Soc., Warrendale, 1998,
pp.53-64.
[2] T. Kikkawa, in Proceedings of the Conference. Mater. Res. Soc., 1999, pp.705-15.
[3] M. Fayolle, G. Passemard, M. Assous, D. Louis, A. Beverina, Y. Gobil et al.,
Microelectronic Engineering, vol.60, no.1-2, pp.119-24, 2002.
[4] M. Fayolle, J. Torres, G. Passemard, F. Fusalba, G. Fanget, D. Louis et al.,
Microelectronic Engineering, vol.64, no.1-4, pp.35-42, 2002.
[5] H. Ruelke, C. Streck, J. Hohage, T. S. Weiher, O. Chretrien, in IEEE proceeding of
Advancing the Science and Technology of Semiconductor Manufacturing., pp.356-61,
2002.
[6] K. Zosel, Angew. Chem. Int. Ed. Engl, vol.17, pp.702, 1978.
[7] P. M. F. Paul, W. S. Wise, Mills&Boon, Ltd,1971.
[8] S. Poliakoff, “Web at http://www.nottingham.ac.uk/supercritical”, 2001.
[9] Y. Adachi, Fluid phase Equilibria, vol.14, pp.147-156, 1983
[10] Van. Zant. Peter ,”Micro Microchip Fabrication 4th edition” McGraw Hill, New
York.
[11] D. L. Flamm, Solid State Technology, pp37-39, 1992.
53
[12] Liu, P.T, Chang, T.C, Sze, S.M, Pan, F.M, Mei, Y.J, Wu, W.F, Tsai, M.S, Dai, B.T,
Chang, C.Y, et. AOferl, Thin Solid Films, vol332, pp.345-350, 1998
[13] T. C. Chang, P. T. Liu, Y. S. Mor, S. M. Sze, Y. L. Yang, M. S. Feng, F. M. Pan,
B.T. Dai, and C. Y. Chang, J. Electrochem. Soc., 146, 3802 ,1999.
[14] M. J. Loboda, C. M. Grove, R. F. Schneider, J. Electrochem. Soc.vol.145,
pp.2861, 1998.
[15] B. Livshits, Ofer. Tehar Zahav, Solid State Technology, vol 197, 1997.
[16] T. C. Chang, Y. S. Mor, P. T. Liu, T.M. Tsai, C. W. Chen, Y. J. Mei, S. M. Sze,
Thin Solid Films, vol398 –399, pp523-526, 2001.
[17] J. F. Brennecke, C. A. Eckert, AIChEJ, vol35, pp1049-1427, 1989.
[18] J. B. Rubin, L. B. Davenhall, C. M. V. Taylor, L. D. Sivils, T. Pierce, K. Tiefert,
International LANL, 1998.
[19] L. B. Rothman, R. J. Robey, M. K. Ali, D. J. Mount, IEEE/SEMI Advanced
Semiconductor manufacturing Conference,2002.
[20] W. H. Mullee, M. A. Biberger, P. E. Schilling, Patent 6500605 B1, United States
Patent, 2002.
[21] E. Stahl, K. W. Quirin, Fluid Phase Equilibria, vol10, pp269-278, 1983.
[22] J. B. McClain, D. Londono, J. R. Combes, T. J. Romack, D. A. Canelas, D. E.
Betts, E. T. Samulski, G. Wignall, and J. M. DeSimone, Science, No.274,
54
pp.2049-2052,1996
[23] J. M. DeSimone and J. S. Keiper, Current Opinion in Solid State and
Materials Science, No.5, pp.333-341, 2001.
[24] L.Wells and J. M. DeSimone, Angew. Che, No.113, pp.518-527, 2001.
[25] M. Chandra, D. J. Mount, M. A. Costantini, H. D. Moritz, etc, Patent6602349,
United States Patent, 2003
[26] K. H. Beyer, W. F. Bergfeld, D. K. Hoffman, R. C. Shank, etc, J. Amer. Coll.
Toxicology 6, pp.23-51, 1987.
[27] S. H. Page, D. E. Raynie, S. R. Goates, M. E. Lee, D. J. Dixon, K. P. Johnston, J.
Microcol, Sep. 3, pp.355-369, 1991.