Embed Size (px)
Citation preview
CHAPTER X
TITRIMETRIC, CHROMATOGRAPHIC AND SPECTROPHOTOMETRIC ASSAY OF QUETIAPINE FUMARATE
386
Section 10.0
DRUG PROFILE AND LITERATURE SURVEY
10.0.1 DRUG PROFILE
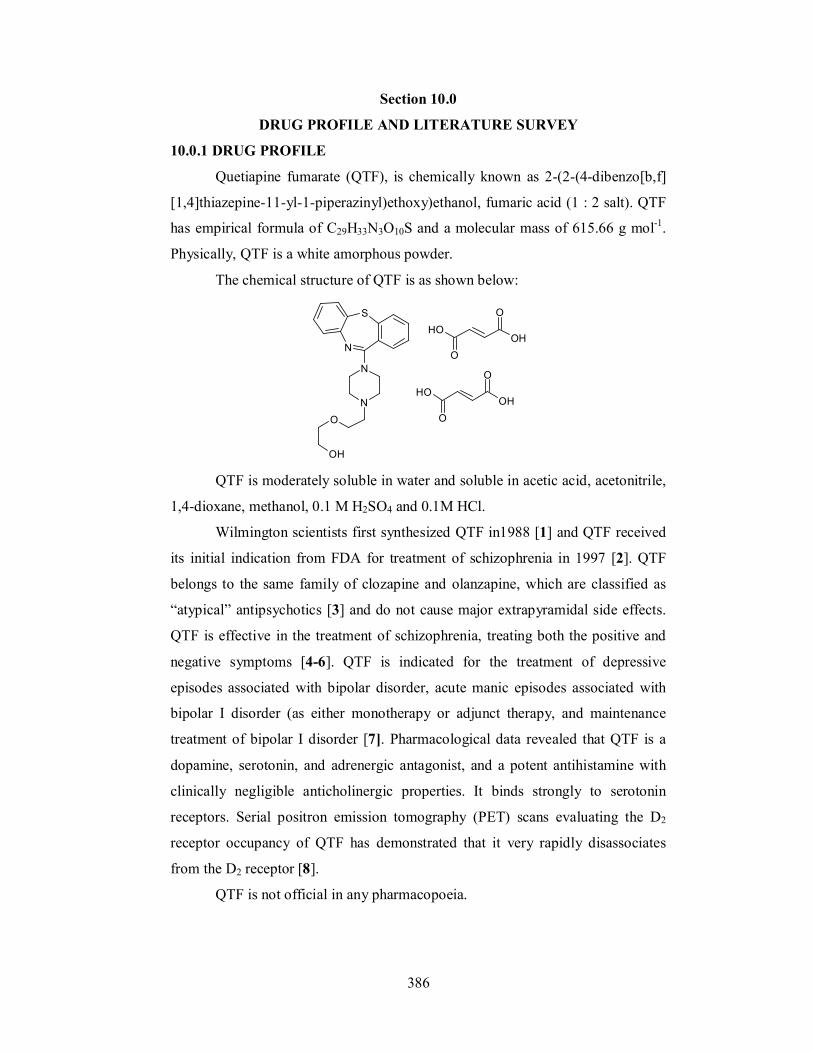
Quetiapine fumarate (QTF), is chemically known as 2-(2-(4-dibenzo[b,f]
[1,4]thiazepine-11-yl-1-piperazinyl)ethoxy)ethanol, fumaric acid (1 : 2 salt). QTF
has empirical formula of C29H33N3O10S and a molecular mass of 615.66 g mol-1.
Physically, QTF is a white amorphous powder.
The chemical structure of QTF is as shown below:
N
S
N
NO
OH
OH
O
OH
O
OH
O
OH
O
QTF is moderately soluble in water and soluble in acetic acid, acetonitrile,
1,4-dioxane, methanol, 0.1 M H2SO4 and 0.1M HCl.
Wilmington scientists first synthesized QTF in1988 [1] and QTF received
its initial indication from FDA for treatment of schizophrenia in 1997 [2]. QTF
belongs to the same family of clozapine and olanzapine, which are classified as
“atypical” antipsychotics [3] and do not cause major extrapyramidal side effects.
QTF is effective in the treatment of schizophrenia, treating both the positive and
negative symptoms [4-6]. QTF is indicated for the treatment of depressive
episodes associated with bipolar disorder, acute manic episodes associated with
bipolar I disorder (as either monotherapy or adjunct therapy, and maintenance
treatment of bipolar I disorder [7]. Pharmacological data revealed that QTF is a
dopamine, serotonin, and adrenergic antagonist, and a potent antihistamine with
clinically negligible anticholinergic properties. It binds strongly to serotonin
receptors. Serial positron emission tomography (PET) scans evaluating the D2
receptor occupancy of QTF has demonstrated that it very rapidly disassociates
from the D2 receptor [8].
QTF is not official in any pharmacopoeia.
387
10.0.2 LITERATURE SURVEY OF ANALYTICAL METHODS FOR
QUETIAPINE FUMARATE
10.0.2.1 Titrimetric methods
Two titrimetric methods [9] have been reported for the assay of QTF in
pharmaceuticals. The methods are based on the ion association-titration of QTF
with sodium tetraphenylboron (STPB) and sodium lauryl sulfate (SLS) by using
tetrabromophenolphthalein ethyl ester and methyl yellow as indicators,
respectively. In STPB method, the titration was performed in the presence of
sodium acetate and 1, 2-dichloroethane with tetrabromophenolphthalein ethyl
ester as indicator whereas in SLS method, the titration was carried out in the
presence of dilute sulphuric acid and in dichloromethane using methyl yellow as
indicator. The methods are applicable over the ranges of 4.0-18.0 and 5.0-25.0 mg
of QTF for STPB and SLS methods, respectively.
10.0.2.2 Spectrophotometric methods
There are four UV-spectrophotometric methods [10-12] available for the
quantification of QTF in pharmaceuticals. The method reported by Pucci et al [10]
is based on the determination of QTF after converting the drug into its free base
by using 50 mM phosphate buffer (pH 2.5) as diluent. The assay was carried out
by measuring the absorbance of quetiapine free base solution at 246 nm. The
linearity was observed in the range of 5-25 µg ml-1 QTF. Another method,
developed by Fursule et al [11] involves the measurement of QTF at 290 nm in
water and Beer’s law is obeyed over the linear range, 6-54 µg ml-1. The other two
methods [12] are based on measurement of absorbance of QTF solution either in
0.1 M HCl at 209 nm or in methanol at 208 nm. Both methods gave linear range
of 1.25 – 12.5 µg ml-1 with apparent molar absorptivity values of 6.21 × 10⁴ and
5.93 × 10⁴ l mol-1cm-1 for HCl and methanol, respectively. In the literature five
visible spectrophotometric methods [13-16] based on ion-pair formation reactions
between QTF and sulphonthalein/sulphonic acid dyes in organic solvent medium
with or without extraction have been found. In these methods, the dyes, namely,
bromocresol green (BCG) [13], calmagite (CGT) [14] and quinoline yellow (QY)
[15], and bromophenol blue (BPB) and thymol blue (TB) [16] were used as ion
pair reagents. The BCG method [13] is based on measurement of absorbance of
chloroform extractable ion-pair complex of QTF with bromocresol green at 415
nm and Beer’s law was obeyed over the concentration range of 5.0 - 25.0 µg ml-1.
388
The CGT method [14] is based on measurement of dichloromethane-extractable
ion-pair of QTF with CGT at 490 nm. At this wavelength, Beer’s law is obeyed
over the concentration range of 3.0 – 30.0 µg ml-1 of QTF. The apparent molar
absorptivity, limit of detection (LOD) and quantitation (LOQ) values for this
method are 1.32 × 10⁴ l mol-1 cm-1, 0.27 and 0.81 µg ml-1, respectively. QY has
also been successfully utilized for the determination of QTF [15]. The method is
based on the measurement of chloroform extractable yellow ion-pair complex of
QTF-QY in acetate-hydrochloride buffer (pH 2.56) medium. The formed ion-pair
complex exhibited an absorption maximum at 420 nm. Beer’s law is obeyed over
the concentration range 2.5 – 25 µg ml-1 with an apparent molar absorptivity value
of 2.02 × 10⁴ l mol-1 cm-1. Two direct extraction-free spectrophotometric methods
[16] based on formation of ion-pair complex between the drug and two
sulphonthalein acidic dyes namely, BPB and TB, and measurement of absorbance
at 410 and 380 nm, respectively, have also been reported. The linear ranges are 1 -
20 and 1.5 - 30 µg ml-1 in BPB and TB methods, with apparent molar
absorptivities of 2.97 x 10⁴ and 1.97 x 10⁴ l mol-1cm-1, respectively.
10.0.2.3 Chromatographic techniques
Several workers have reported chromatographic methods for the
determination of QTF in biological materials and these include HPLC with UV
[17-24], chemiluminescence [25], electrospray ionization MS [26-29], tandem
MS/MS [30-33] detection, UPLC with tandem MS detection [34, 35], GC-MS
[36, 37] and HPTLC [38-40]
Perhaps the most widely used technique for the assay of IRB in
pharmaceuticals has been the HPLC. One of the first reports for OTF in presence
of its degradation products uses Zorbax SB-Phenyl column with a mixture of
acetonitrile and 0.02 M phosphate buffer (50:50) as mobile phase at a flow rate of
1.0 ml min-1 with UV-detection at 254 nm. The method was applicable over a
concentration range of 0.08-20 µg ml-1 [17]. Using X-bridge C18 (150x4.6 mm,
3.5 µm) and a mobile phase consisting of 5 mM ammonium acetate and
acetonitrile and a flow rate of 1.0 ml min -1 with UV-detection at 220 nm[41], the
method allowed the determination of QTF and its degradants. Bharathi et al., [42]
have determined main components and impurities in QTF-sustained tablets by
RP-HPLC. This method also includes the characterisation of the impurities using
1H NMR, 13C NMR, MS and IR. Raju et al., have used HPLC for the separation
389
and simultaneous determination of process-related substance of QTF in bulk drugs
using C18 stationary phase with simple mobile phase compbination in isocratic
mode and quantification was by UV detection at 225 nm [43].
10.0.2.4 Other techniques
Voltammetric technique [44] was employed for assaying QTF in human
serum and urine. Capillary zone electrophoretic [10, 45] and polarographic [46]
methods have been used for assay of QTF in pharmaceuticals.
From the literature survey presented above, it is clear that two titrimetric,
four UV and five visible spectrophotmetric methods are available for the assay of
QTF in pharmaceuticals. The reported titrimetric methods based on ion-pair
complex reaction are complex where the location of end point is difficult. The
reported UV methods have some demerits such as conversion of the salt to free
base before measurement [10], poor sensitivity and narrow linear dynamic range
[11, 12]. The extractive spectrophotometric methods [13-15] are less sensitive. On
the other hand, the extraction-free spectrophotometric methods [16] seem to be
sensitive, but require different organic solvents to dissolve drug and dyes.
Of the various chromatographic techniques reported for the determination
of QTF in body fluids [17-37], only the GC-MS method [37] is devoted to urine
sample. The RP-HPLC method [41] uses a column temperature of 40 ◦C and
limited to the identification of the related substances in QTF, There is only one
article dealing with the HPLC assay of QTF in tablets [43], but is less sensitive
with a linear range of 10-100 µg ml-1 QTF. Another report [17] deals with the
determination of QTF in human plasma and tablets.
Keeping in view the drawbacks of the reported methods, the author has
attempted to develop titrimetric, spectrophotometric and HPLC methods giving
due consideration to various parameters involved in the validation and assay of
QTF both in pharmaceuticals as well as in spiked human urine. The inadequacies
of the previously reported UV and visible methods have been considered while
developing new methods for the assay of QTF. The details are presented in
Section 10.1 to 10.5 and a separate Section (Section 10.6) has been devoted to
assess the performance characteristics of the proposed methods in comparison
with the reported methods.
390
Section 10.1
POTENTIOMETRIC DETERMINATION OF QUETIAPINE FUMARATE
IN PHARMACEUTICAL FORMULATIONS
10.1.1 INTRODUCTION
Since QTF posses three amino groups, it acts as a weak base and this
property has not been exploited before for developing a titrimetric procedure in
non-aqueous medium. A validated potentiometric titration procedure is described
without any sample pre-treatment or prior extraction. The method is based on the
basic property of the drug molecule in which the solution of drug in glacial acetic
acid was titrated potentiometrically with acetous perchloric acid using modified
glass-saturated calomel electrode system. The details relating to the development
and validation of the method for the assay of QTF are presented in this Section
(10.1).
10.1.2 EXPERIMENTAL
10.1.2.1 Apparatus
An Elico 120 digital pH meter provided with a combined glass-SCE
electrode system was used in the titration. The KCl of the salt bridge was replaced
with saturated solution of KCl in glacial acetic acid.
10.1.2.2 Materials
All chemicals used were of analytical reagent grade. All solutions were
made in glacial acetic acid (S. D. Fine Chem, Mumbai, India) unless mentioned
otherwise. QTF pure drug was kindly provided by Cipla Ltd, Bangalore, India,
India, as a gift and used as received. Qutipin-200 and Qutipin-100 (both from Sun
Pharmaceuticals Ltd, India) tablets were purchased from local market.
10.1.2.3 Reagents
Perchloric Acid ( 0.01 M): The stock solution of (~0.1 M) perchloric acid (S. D.
Fine Chem, Mumbai, India) was diluted appropriately with glacial acetic acid
(Merck, Mumbai, India) to get a working concentration of 0.01 M and
standardized with pure potassium hydrogenphthalate (S. D. Fine Chem, Mumbai,
India) [47].
Crystal violet indicator (0.1 %): Prepared by dissolving 50 mg of dye (S. D.
Fine Chem, Mumbai, India) in 50 ml of glacial acetic acid.
391
Standard drug solution
Stock standard solution containing 2 mg ml-1 QTF was prepared in glacial
acetic acid.
10.1.2. 4 General procedures
An aliquot of the standard drug solution equivalent to 2.0-20.0 mg of QTF
was measured accurately and transferred into a clean and dry 100 ml beaker and
the solution was diluted to 25 ml by adding glacial acetic acid. The combined
glass-SCE (modified) system was dipped in the solution. The contents were
stirred magnetically and the titrant (0.01 M HClO4) was added from a
microburette. Near the equivalence point, titrant was added in 0.05 ml increments.
After each addition of titrant, the solution was stirred magnetically for 30 s and
the steady potential was noted. The addition of titrant was continued until there
was no significant change in potential on further addition of titrant. The
equivalence point was determined by applying the graphical method. The amount
of the drug in the measured aliquot was calculated from
Amount (mg) = VMwR/n
where V = volume of perchloric acid required, ml; Mw = relative molecular mass
of the drug (615.66); and R = molarity of the perchloric acid and n = number of
moles of perchloric acid reacting with each mole of QTF.
Procedure for tablets
Twenty tablets were weighed accurately and pulverised. A weighed
quantity of the tablet powdered equivalent to 200 mg QTF was transferred into a
clean and dried 100 ml volumetric flask. The flask was shaken for 20 min with 60
ml of acetic acid, the volume was brought to 100 ml with the same solvent. After
5 min, the solution was filtered through a Whatman No. 42 filter paper. First 10
ml of the aliquot was discarded. A suitable aliquot was next subjected to analysis
as described above.
10.1.3 RESULTS AND DISCUSSION
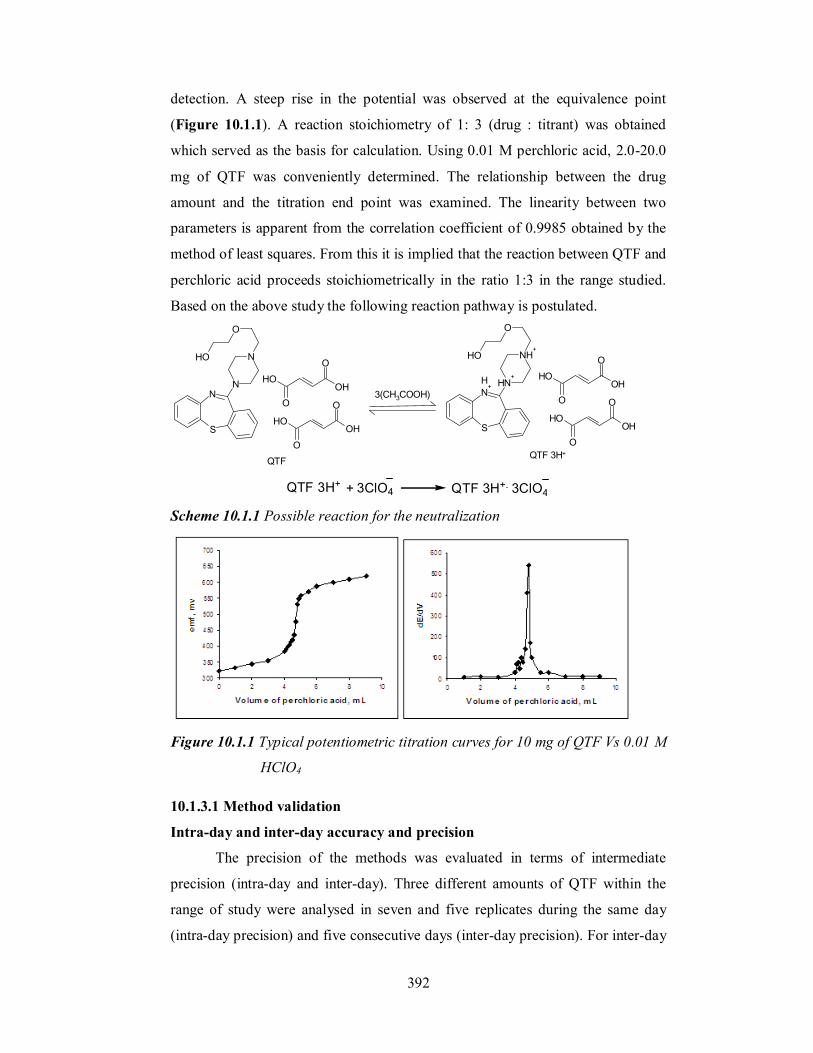
The basis and chemistry involved in non-aqueous titrations are clearly
presented in Section 2.4.
Since, QTF is having 3 basic nitrogen atoms in its molecular structure, the
enhanced basicity of QTF in acetic acid medium is due to non-levelling effect of
acetic acid and the determination of QTF becomes much easier. The procedure
involves the titration of QTF with perchloric acid with potentiometric end point
392
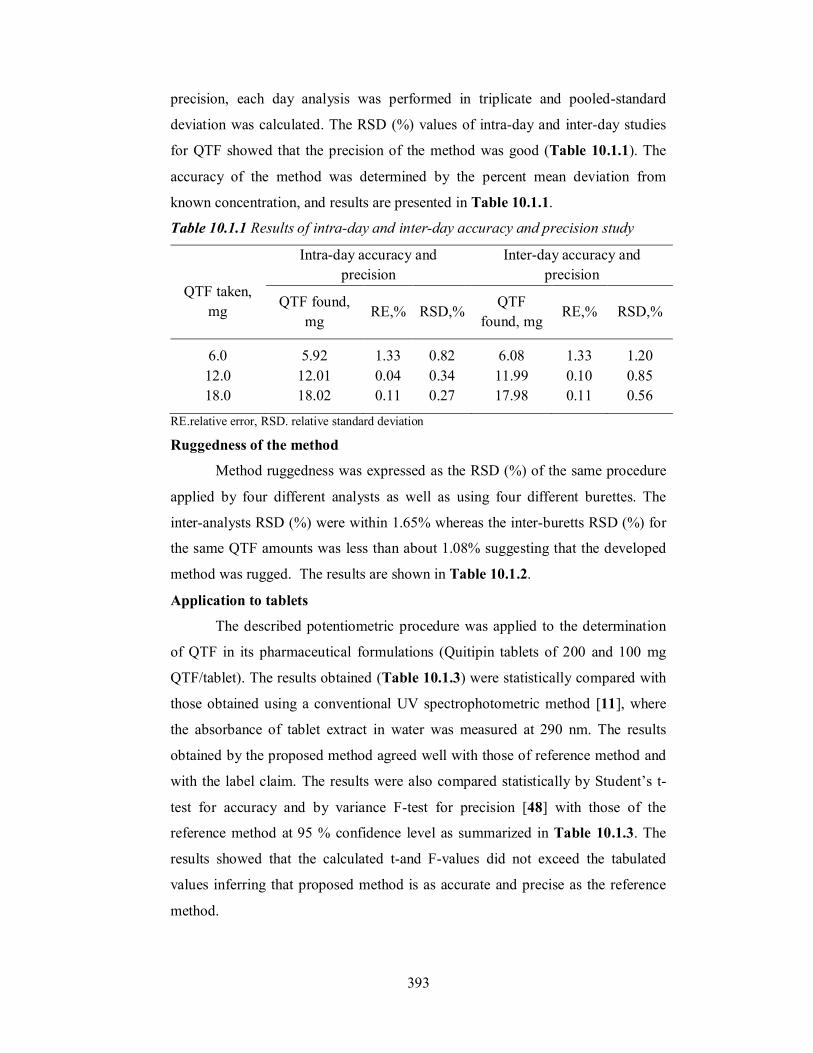
detection. A steep rise in the potential was observed at the equivalence point
(Figure 10.1.1). A reaction stoichiometry of 1: 3 (drug : titrant) was obtained
which served as the basis for calculation. Using 0.01 M perchloric acid, 2.0-20.0
mg of QTF was conveniently determined. The relationship between the drug
amount and the titration end point was examined. The linearity between two
parameters is apparent from the correlation coefficient of 0.9985 obtained by the
method of least squares. From this it is implied that the reaction between QTF and
perchloric acid proceeds stoichiometrically in the ratio 1:3 in the range studied.
Based on the above study the following reaction pathway is postulated.
QTF
N
S
N
N
O
OH
OH
OOH
O
OH
OOH
O
OH
OOH
O
OH
OOH
O
NH
+
S
NH+
NH+
O
OH
QTF 3H+
3(CH3COOH)
+ 3ClO4 QTF 3H+.
3ClO4QTF 3H+
Scheme 10.1.1 Possible reaction for the neutralization
Figure 10.1.1 Typical potentiometric titration curves for 10 mg of QTF Vs 0.01 M
HClO4
10.1.3.1 Method validation
Intra-day and inter-day accuracy and precision
The precision of the methods was evaluated in terms of intermediate
precision (intra-day and inter-day). Three different amounts of QTF within the
range of study were analysed in seven and five replicates during the same day
(intra-day precision) and five consecutive days (inter-day precision). For inter-day
393
precision, each day analysis was performed in triplicate and pooled-standard
deviation was calculated. The RSD (%) values of intra-day and inter-day studies
for QTF showed that the precision of the method was good (Table 10.1.1). The
accuracy of the method was determined by the percent mean deviation from
known concentration, and results are presented in Table 10.1.1.
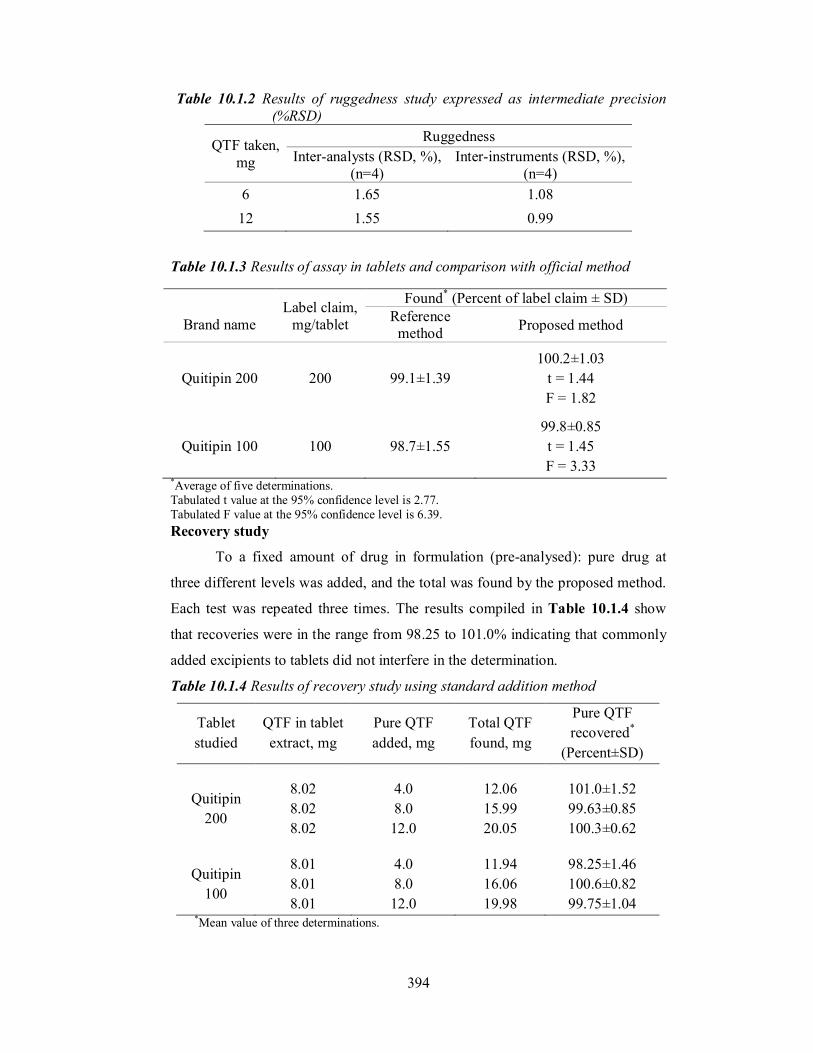
Table 10.1.1 Results of intra-day and inter-day accuracy and precision study
QTF taken,
mg
Intra-day accuracy and precision
Inter-day accuracy and precision
QTF found, mg
RE,% RSD,% QTF
found, mg RE,% RSD,%
6.0 12.0 18.0
5.92 12.01 18.02
1.33 0.04 0.11
0.82 0.34 0.27
6.08 11.99 17.98
1.33 0.10 0.11
1.20 0.85 0.56
RE.relative error, RSD. relative standard deviation
Ruggedness of the method
Method ruggedness was expressed as the RSD (%) of the same procedure
applied by four different analysts as well as using four different burettes. The
inter-analysts RSD (%) were within 1.65% whereas the inter-buretts RSD (%) for
the same QTF amounts was less than about 1.08% suggesting that the developed
method was rugged. The results are shown in Table 10.1.2.
Application to tablets
The described potentiometric procedure was applied to the determination
of QTF in its pharmaceutical formulations (Quitipin tablets of 200 and 100 mg
QTF/tablet). The results obtained (Table 10.1.3) were statistically compared with
those obtained using a conventional UV spectrophotometric method [11], where
the absorbance of tablet extract in water was measured at 290 nm. The results
obtained by the proposed method agreed well with those of reference method and
with the label claim. The results were also compared statistically by Student’s t-
test for accuracy and by variance F-test for precision [48] with those of the
reference method at 95 % confidence level as summarized in Table 10.1.3. The
results showed that the calculated t-and F-values did not exceed the tabulated
values inferring that proposed method is as accurate and precise as the reference
method.
394
Table 10.1.2 Results of ruggedness study expressed as intermediate precision (%RSD)
QTF taken, mg
Ruggedness Inter-analysts (RSD, %),
(n=4) Inter-instruments (RSD, %),
(n=4) 6 1.65 1.08
12 1.55 0.99
Table 10.1.3 Results of assay in tablets and comparison with official method
*Average of five determinations. Tabulated t value at the 95% confidence level is 2.77. Tabulated F value at the 95% confidence level is 6.39. Recovery study
To a fixed amount of drug in formulation (pre-analysed): pure drug at
three different levels was added, and the total was found by the proposed method.
Each test was repeated three times. The results compiled in Table 10.1.4 show
that recoveries were in the range from 98.25 to 101.0% indicating that commonly
added excipients to tablets did not interfere in the determination.
Table 10.1.4 Results of recovery study using standard addition method
Tablet studied
QTF in tablet extract, mg
Pure QTF added, mg
Total QTF found, mg
Pure QTF recovered*
(Percent±SD)
Quitipin 200
8.02 8.02 8.02
4.0 8.0
12.0
12.06 15.99 20.05
101.0±1.52 99.63±0.85 100.3±0.62
Quitipin 100
8.01 8.01 8.01
4.0 8.0
12.0
11.94 16.06 19.98
98.25±1.46 100.6±0.82 99.75±1.04
*Mean value of three determinations.
Brand name
Label claim, mg/tablet
Found* (Percent of label claim ± SD) Reference
method Proposed method
Quitipin 200 200 99.1±1.39 100.2±1.03
t = 1.44 F = 1.82
Quitipin 100 100 98.7±1.55 99.8±0.85 t = 1.45 F = 3.33
395
Section 10.2
REVERSED PHASE HIGH PERFORMANCE LIQUID
CHROMATOGRAPHIC DETERMINATION QUETIAPINE FUMARATE
IN PHARMACEUTICALS AND HUMAN URINE
10.2.1 INTRODUCTION
In the literature survey presented in Section 10.0.2 it is clear that the four
HPLC methods used for the assay of QTF in pharmaceuticals are not completely
satisfactory with respect to sensitivity, linear range, and column temperature
employed. The GC method [37] is the only method devoted to the assay of QTF in
human urine. In this Section (10.2) a precise and feasible reversed-phase high-
performance liquid chromatographic procedure is described for the determination
QTF in pharmaceuticals and spiked human urine. The method development and
validation procedures along with the results are presented in this Section 10.2.
10.2.2 EXPERIMENTAL
10.2.2.1 Apparatus
Chromatographic analyses were carried out using Alliance Waters HPLC
system equipped with Alliances 2657 series low pressure quaternary pump, a
programmable variable wavelength UV-visible detector, Waters 2996 photodiode
array detector and auto sampler. Data were collected and processed using Waters
Empower 2.0 software.
10.2.2.2 Materials and methods
All solvents used were HPLC grade. Pure QTF and its tablets used were
the same as described in Section 10.1. Orthophosphoric acid (Rankem, Bangalore,
India), acetonitrile (Labscan Asia Co. Ltd, Bangkok, Thailand) and de-ionized
water were used in the investigation. Urine sample was obtained from a 34 years
old healthy male. Phosphate buffer (pH 3.1): Prepared by adding 0.02 M NaOH to
aqueous orthophosphoric acid and adjusting the pH using a pH meter.
10.2.2.3 Chromatographic conditions
The analysis was carried out on a chromatopack column (250 mm × 4.6
mm i.d., 5 µm particle size). The column oven temperature was maintained at 25
°C and the autosampler temperature maintained at ambient.
A solution containing a mixture of acetonitrile and phosphate buffer of pH
3.1 (40:60) was used as a mobile phase. The flow rate was 1 ml min-1, the detector
396
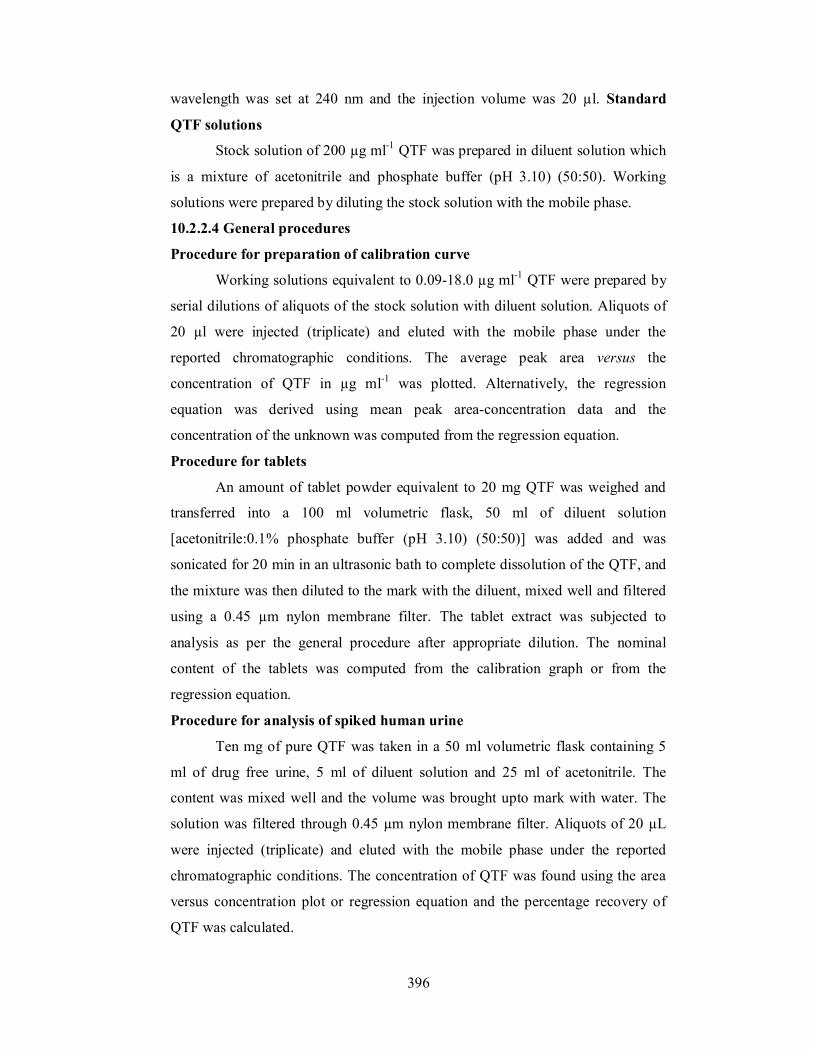
wavelength was set at 240 nm and the injection volume was 20 µl. Standard
QTF solutions
Stock solution of 200 µg ml-1 QTF was prepared in diluent solution which
is a mixture of acetonitrile and phosphate buffer (pH 3.10) (50:50). Working
solutions were prepared by diluting the stock solution with the mobile phase.
10.2.2.4 General procedures
Procedure for preparation of calibration curve
Working solutions equivalent to 0.09-18.0 µg ml-1 QTF were prepared by
serial dilutions of aliquots of the stock solution with diluent solution. Aliquots of
20 µl were injected (triplicate) and eluted with the mobile phase under the
reported chromatographic conditions. The average peak area versus the
concentration of QTF in µg ml-1 was plotted. Alternatively, the regression
equation was derived using mean peak area-concentration data and the
concentration of the unknown was computed from the regression equation.
Procedure for tablets
An amount of tablet powder equivalent to 20 mg QTF was weighed and
transferred into a 100 ml volumetric flask, 50 ml of diluent solution
[acetonitrile:0.1% phosphate buffer (pH 3.10) (50:50)] was added and was
sonicated for 20 min in an ultrasonic bath to complete dissolution of the QTF, and
the mixture was then diluted to the mark with the diluent, mixed well and filtered
using a 0.45 µm nylon membrane filter. The tablet extract was subjected to
analysis as per the general procedure after appropriate dilution. The nominal
content of the tablets was computed from the calibration graph or from the
regression equation.
Procedure for analysis of spiked human urine
Ten mg of pure QTF was taken in a 50 ml volumetric flask containing 5
ml of drug free urine, 5 ml of diluent solution and 25 ml of acetonitrile. The
content was mixed well and the volume was brought upto mark with water. The
solution was filtered through 0.45 µm nylon membrane filter. Aliquots of 20 µL
were injected (triplicate) and eluted with the mobile phase under the reported
chromatographic conditions. The concentration of QTF was found using the area
versus concentration plot or regression equation and the percentage recovery of
QTF was calculated.
397
10.2.3 RESULTS AND DISCUSSION
In order to obtain good linearity, sensitivity and selectivity, the method
was optimized and validated in accordance with the current ICH guidelines [49].
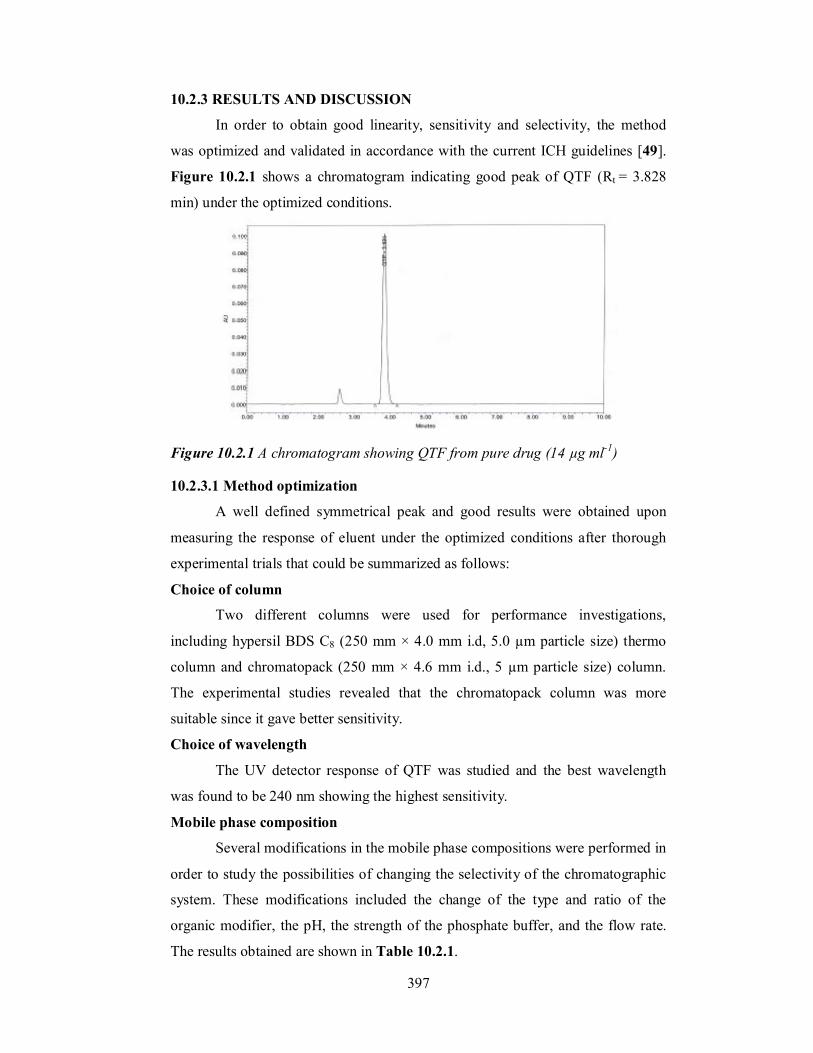
Figure 10.2.1 shows a chromatogram indicating good peak of QTF (Rt = 3.828
min) under the optimized conditions.
Figure 10.2.1 A chromatogram showing QTF from pure drug (14 µg ml-1)
10.2.3.1 Method optimization
A well defined symmetrical peak and good results were obtained upon
measuring the response of eluent under the optimized conditions after thorough
experimental trials that could be summarized as follows:
Choice of column
Two different columns were used for performance investigations,
including hypersil BDS C8 (250 mm × 4.0 mm i.d, 5.0 µm particle size) thermo
column and chromatopack (250 mm × 4.6 mm i.d., 5 µm particle size) column.
The experimental studies revealed that the chromatopack column was more
suitable since it gave better sensitivity.
Choice of wavelength
The UV detector response of QTF was studied and the best wavelength
was found to be 240 nm showing the highest sensitivity.
Mobile phase composition
Several modifications in the mobile phase compositions were performed in
order to study the possibilities of changing the selectivity of the chromatographic
system. These modifications included the change of the type and ratio of the
organic modifier, the pH, the strength of the phosphate buffer, and the flow rate.
The results obtained are shown in Table 10.2.1.
398
Type of organic modifier
Acetonitrile was replaced by methanol but it did not give good peak.
Acetonitrile was the organic modifier of choice giving nice, elegant and highly
sensitive peak.
Ratio of organic modifier
The effect of ratio of organic modifier on the selectivity and retention time
of the test solute was investigated using mobile phases containing 30-60%
acetonitrile. Table 10.2.1 shows that 40% acetonitrile was the best, giving well
defined peak and the highest number of theoretical plates.
Effect of pH and ionic strength of buffer
The effect of pH of the mobile phase on the selectivity and retention time
of the test solute was investigated using mobile phases of pH ranging from 2.0-
4.0. The results (Table 10.2.1) revealed that pH 3.10 was most appropriate and
giving well defined peak and the highest number of theoretical plates. At lower
and higher pH non-symmetrical peak and smaller number of theoretical plates
were observed. Therefore pH 3.1 was fixed as optimum. The same trend was
observed after making alteration in the ionic strength of the buffer and 0.1%
phosphate buffer was used as working buffer throughout the investigation. The
results of these observations are also presented in Table 10.2.1.
The effect of flow rate
The effect of flow rate on the symmetry, sensitivity and retention time of
the peak was studied and a flow rate of 1 ml min-1 was optimal for better
symmetry and reasonable retention time (Table 10.2.1).
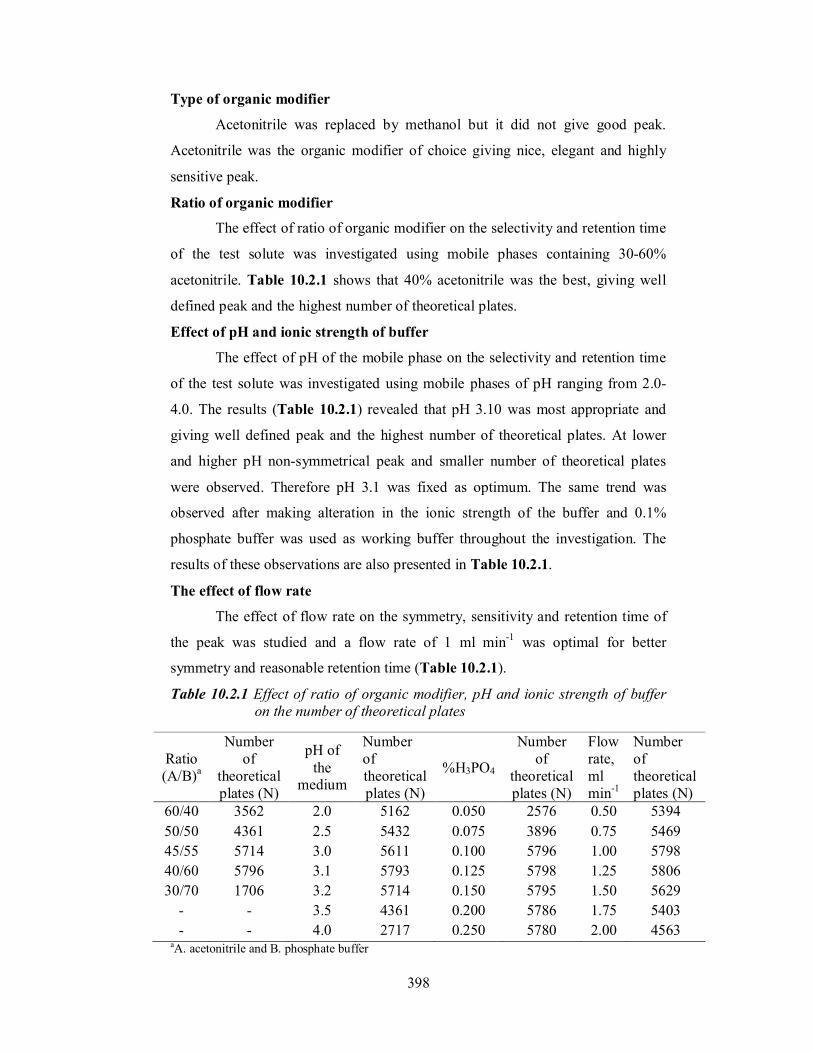
Table 10.2.1 Effect of ratio of organic modifier, pH and ionic strength of buffer on the number of theoretical plates
Ratio (A/B)a
Number of
theoretical plates (N)
pH of the
medium
Number of theoretical plates (N)
%H3PO4
Number of
theoretical plates (N)
Flow rate, ml min-1
Number of theoretical plates (N)
60/40 50/50 45/55 40/60 30/70
- -
3562 4361 5714 5796 1706
- -
2.0 2.5 3.0 3.1 3.2 3.5 4.0
5162 5432 5611 5793 5714 4361 2717
0.050 0.075 0.100 0.125 0.150 0.200 0.250
2576 3896 5796 5798 5795 5786 5780
0.50 0.75 1.00 1.25 1.50 1.75 2.00
5394 5469 5798 5806 5629 5403 4563
aA. acetonitrile and B. phosphate buffer
399
10.2.3.2 Method validation
Linearity
Working standard solution of QTF (200 µg ml-1) was appropriately diluted
with the diluent solution to obtain solutions in the concentration range 0.09-18 µg
ml-1 QTF. Twenty microlitre of each solution was injected in triplicate onto the
column under the operating chromatographic conditions described above. The
least squares method was used to calculate the slope, intercept and the correlation
coefficient (r) of the regression line. The relation between mean peak area Y (n=3)
and concentration, X expressed by the equation Y = 49249.47 X + 4530.54 (r2 =
0.9999), was linear. A plot of log peak area Vs log concentration was a straight
line with the slope of 1.1135 and this coupled with a high value of the correlation
coefficient (r- value >0.999) indicated excellent linearity between mean peak area
and concentration in the range 0.09-18.0 µg ml-1 QTF. These data are presented in
Table 10.2.2.
Limits of quantification (LOQ) and detection (LOD)
The limit of quantification (LOQ) was determined by establishing the
lowest concentration that can be measured according to ICH recommendations
[45], below which the calibration graph is non linear and was found to be 0.09 µg
ml-1. The limit of detection (LOD) was determined by establishing the minimum
level at which the analyte can be reliably detected and it was found to be 0.03 µg
ml-1.
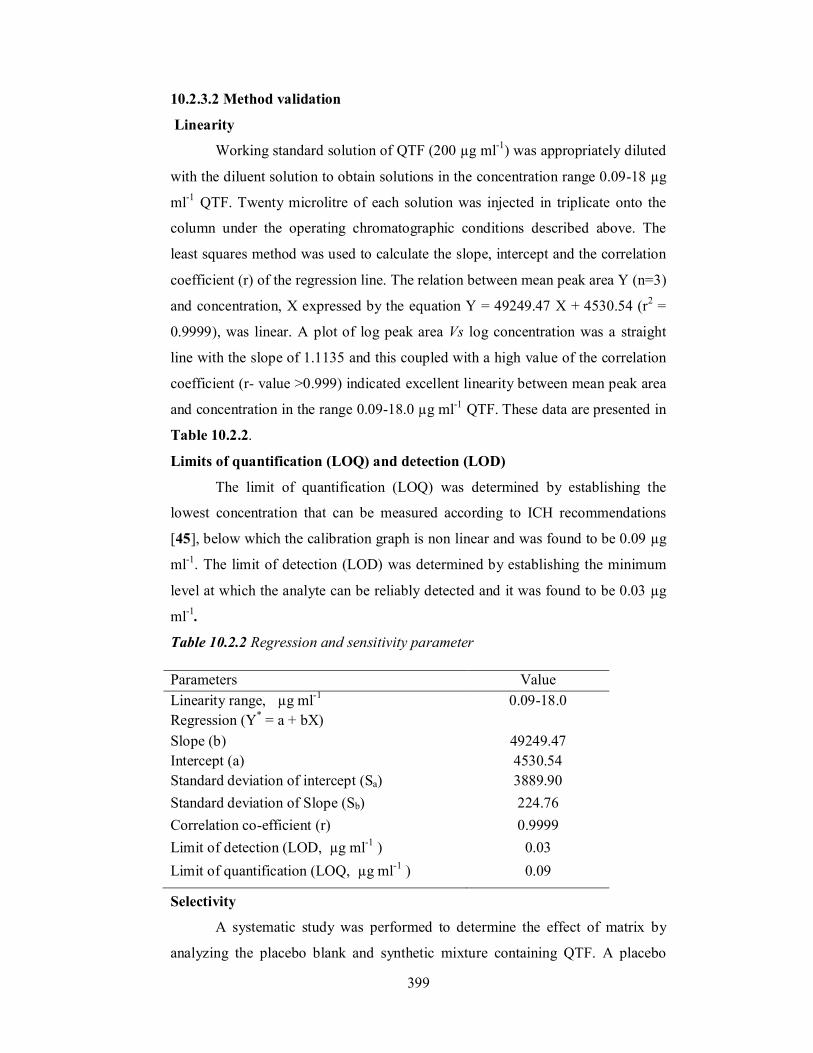
Table 10.2.2 Regression and sensitivity parameter
Selectivity
A systematic study was performed to determine the effect of matrix by
analyzing the placebo blank and synthetic mixture containing QTF. A placebo
Parameters Value Linearity range, µg ml-1 0.09-18.0 Regression (Y* = a + bX) Slope (b) 49249.47 Intercept (a) 4530.54 Standard deviation of intercept (Sa) 3889.90 Standard deviation of Slope (Sb) 224.76 Correlation co-efficient (r) 0.9999 Limit of detection (LOD, µg ml-1 ) 0.03 Limit of quantification (LOQ, µg ml-1 ) 0.09
400
blank of the composition: starch (10 mg), acacia (15 mg), hydroxyl cellulose ( 10
mg), sodium citrate (10 mg), talc (20 mg), magnesium stearate (15 mg) and
sodium alginate (10 mg) was made and its solution was prepared as described
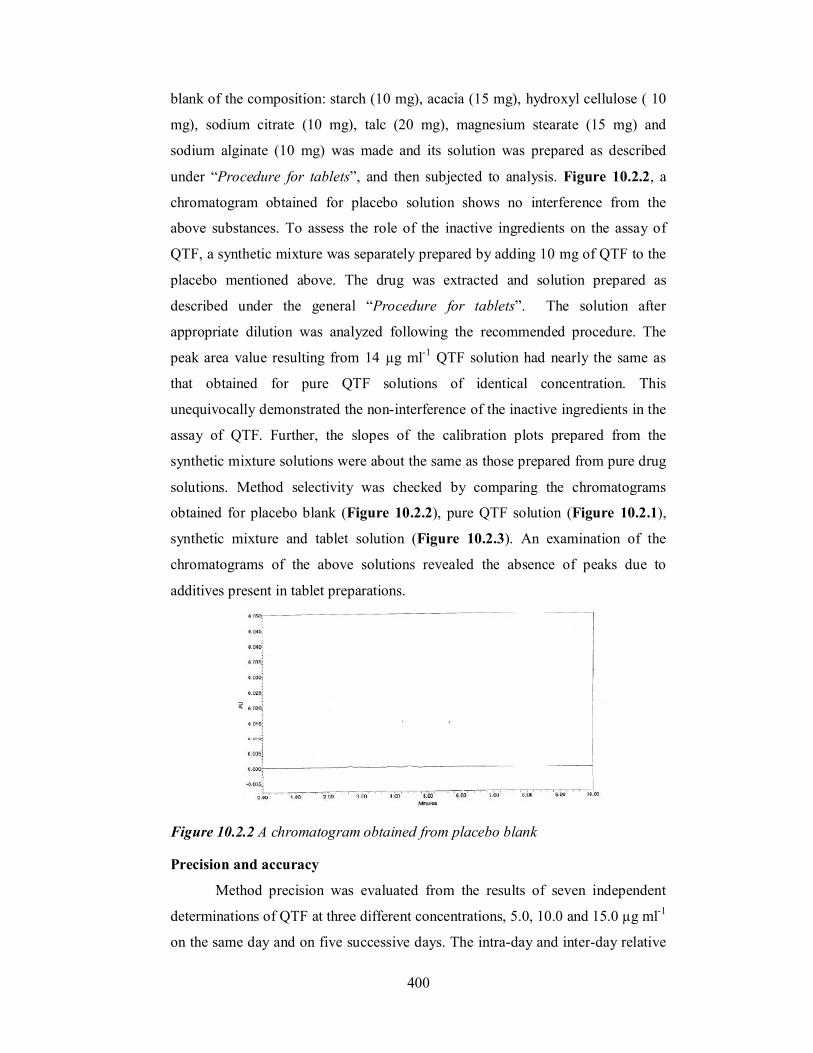
under “Procedure for tablets”, and then subjected to analysis. Figure 10.2.2, a
chromatogram obtained for placebo solution shows no interference from the
above substances. To assess the role of the inactive ingredients on the assay of
QTF, a synthetic mixture was separately prepared by adding 10 mg of QTF to the
placebo mentioned above. The drug was extracted and solution prepared as
described under the general “Procedure for tablets”. The solution after
appropriate dilution was analyzed following the recommended procedure. The
peak area value resulting from 14 µg ml-1 QTF solution had nearly the same as
that obtained for pure QTF solutions of identical concentration. This
unequivocally demonstrated the non-interference of the inactive ingredients in the
assay of QTF. Further, the slopes of the calibration plots prepared from the
synthetic mixture solutions were about the same as those prepared from pure drug
solutions. Method selectivity was checked by comparing the chromatograms
obtained for placebo blank (Figure 10.2.2), pure QTF solution (Figure 10.2.1),
synthetic mixture and tablet solution (Figure 10.2.3). An examination of the
chromatograms of the above solutions revealed the absence of peaks due to
additives present in tablet preparations.
Figure 10.2.2 A chromatogram obtained from placebo blank
Precision and accuracy
Method precision was evaluated from the results of seven independent
determinations of QTF at three different concentrations, 5.0, 10.0 and 15.0 µg ml-1
on the same day and on five successive days. The intra-day and inter-day relative
401
standard deviation (RSD, %) values for peak area and retention time for the
selected concentration of QTF were less than 2.52 and 2.4%, respectively. The
method accuracy, expressed as relative error (%) was determined by calculating
the percent deviation found between concentrations of QTF injected and
concentrations found from the peak area. This study was performed by taking the
same three concentrations of QTF used for precision estimation. The intra-day and
inter-day accuracy (expressed as RE) was less than 4% and the values are
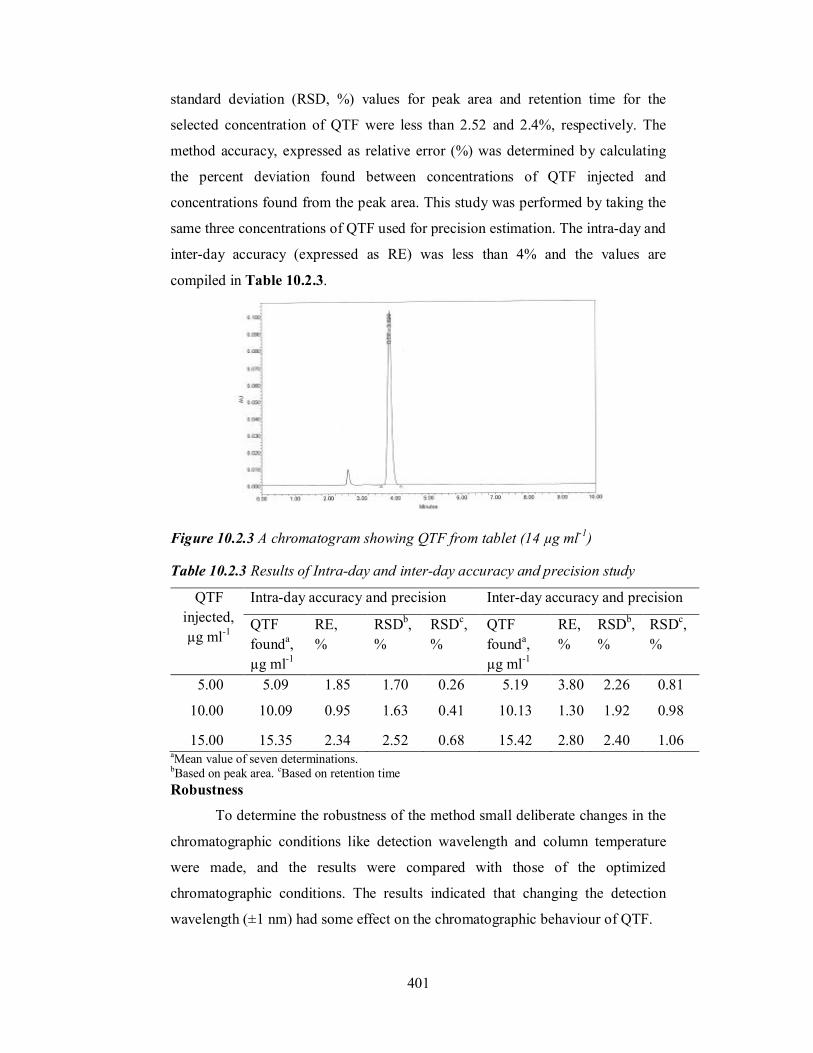
compiled in Table 10.2.3.
Figure 10.2.3 A chromatogram showing QTF from tablet (14 µg ml-1)
Table 10.2.3 Results of Intra-day and inter-day accuracy and precision study
QTF injected, µg ml-1
Intra-day accuracy and precision Inter-day accuracy and precision
QTF founda, µg ml-1
RE, %
RSDb, %
RSDc, %
QTF founda, µg ml-1
RE, %
RSDb, %
RSDc, %
5.00 5.09 1.85 1.70 0.26 5.19 3.80 2.26 0.81
10.00 10.09 0.95 1.63 0.41 10.13 1.30 1.92 0.98
15.00 15.35 2.34 2.52 0.68 15.42 2.80 2.40 1.06 aMean value of seven determinations. bBased on peak area. cBased on retention time Robustness
To determine the robustness of the method small deliberate changes in the
chromatographic conditions like detection wavelength and column temperature
were made, and the results were compared with those of the optimized
chromatographic conditions. The results indicated that changing the detection
wavelength (±1 nm) had some effect on the chromatographic behaviour of QTF.
402
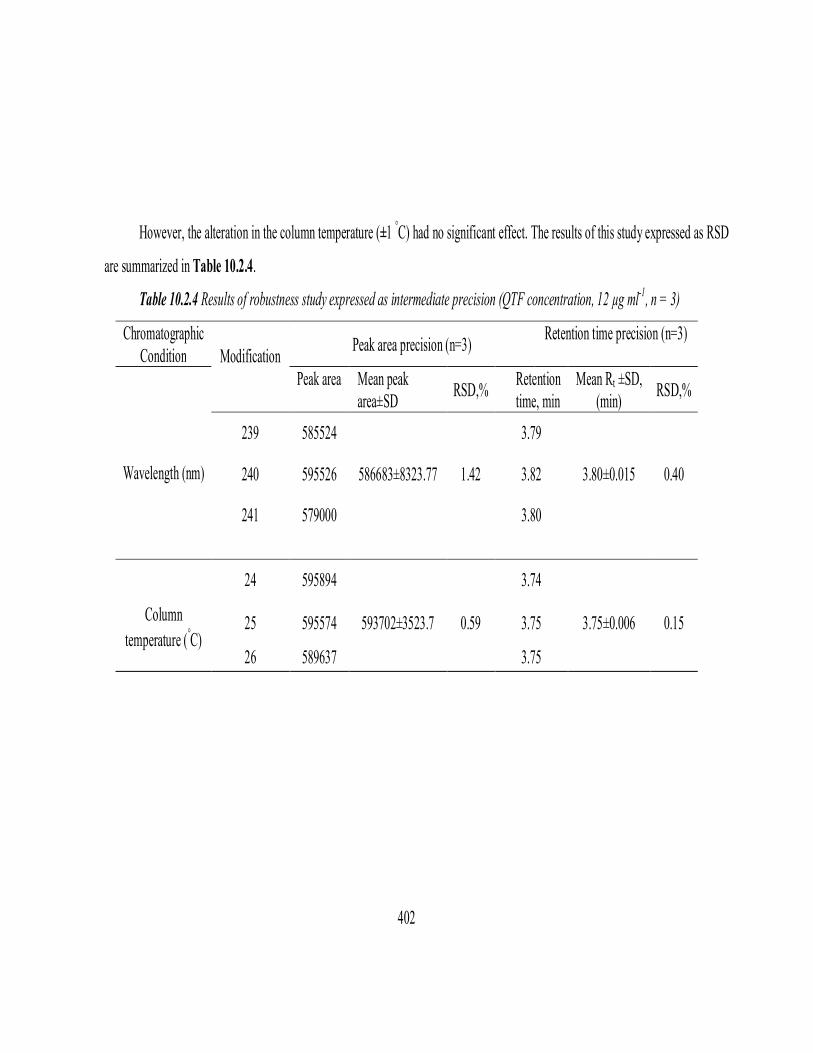
However, the alteration in the column temperature (±1 °C) had no significant effect. The results of this study expressed as RSD
are summarized in Table 10.2.4.
Table 10.2.4 Results of robustness study expressed as intermediate precision (QTF concentration, 12 µg ml-1, n = 3)
Chromatographic Condition Modification
Peak area precision (n=3) Retention time precision (n=3)
Wavelength (nm)
Peak area
Mean peak area±SD RSD,% Retention
time, min Mean Rt ±SD,
(min) RSD,%
239 585524 3.79
240 595526 586683±8323.77 1.42 3.82 3.80±0.015 0.40
241 579000 3.80
Column
temperature (°C)
24 595894 3.74
25 595574 593702±3523.7 0.59 3.75 3.75±0.006 0.15
26 589637 3.75
403
Application to tablets
The developed and validated method was applied to the assay of QTF
commercial tablets. The results shown in Table 10.2.5 are in good agreement
with those obtained with the reference method [11] and with the label claim.
Application to spiked human urine sample
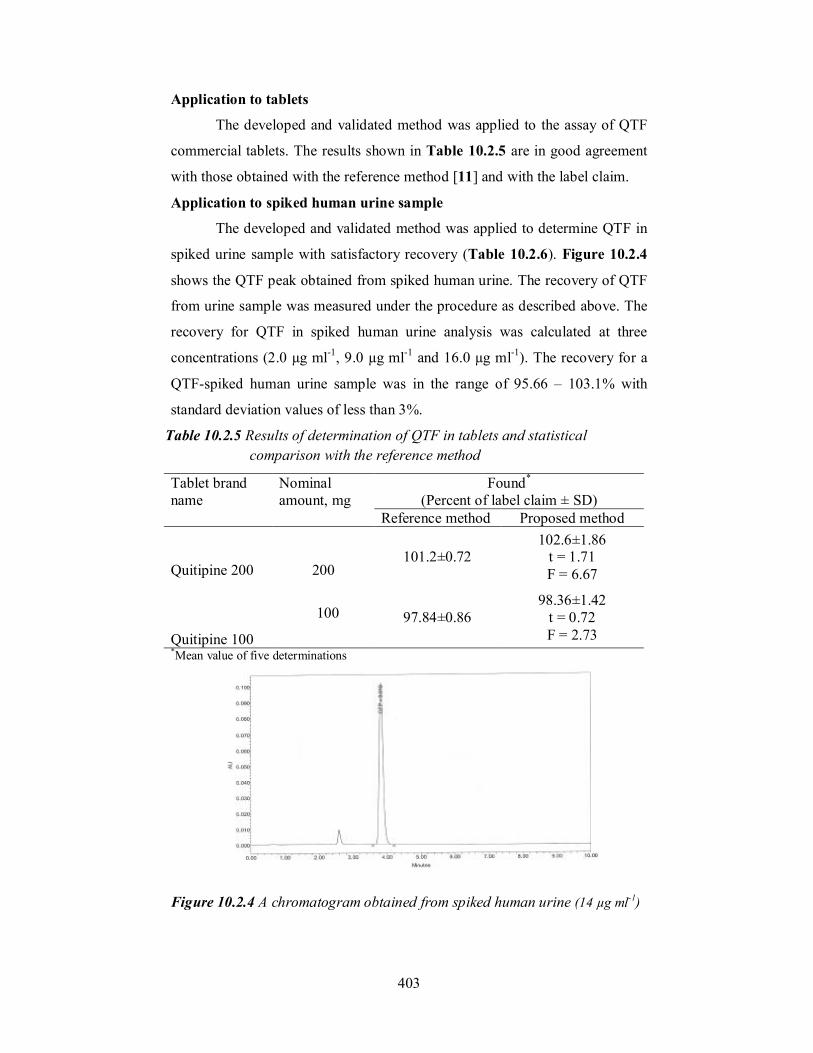
The developed and validated method was applied to determine QTF in
spiked urine sample with satisfactory recovery (Table 10.2.6). Figure 10.2.4
shows the QTF peak obtained from spiked human urine. The recovery of QTF
from urine sample was measured under the procedure as described above. The
recovery for QTF in spiked human urine analysis was calculated at three
concentrations (2.0 µg ml-1, 9.0 µg ml-1 and 16.0 µg ml-1). The recovery for a
QTF-spiked human urine sample was in the range of 95.66 – 103.1% with
standard deviation values of less than 3%.
Table 10.2.5 Results of determination of QTF in tablets and statistical comparison with the reference method
*Mean value of five determinations
Figure 10.2.4 A chromatogram obtained from spiked human urine (14 µg ml-1)
Tablet brand name
Nominal amount, mg
Found* (Percent of label claim ± SD)
Reference method Proposed method Quitipine 200
Quitipine 100
200 101.2±0.72
102.6±1.86 t = 1.71 F = 6.67
100 97.84±0.86
98.36±1.42 t = 0.72 F = 2.73
404
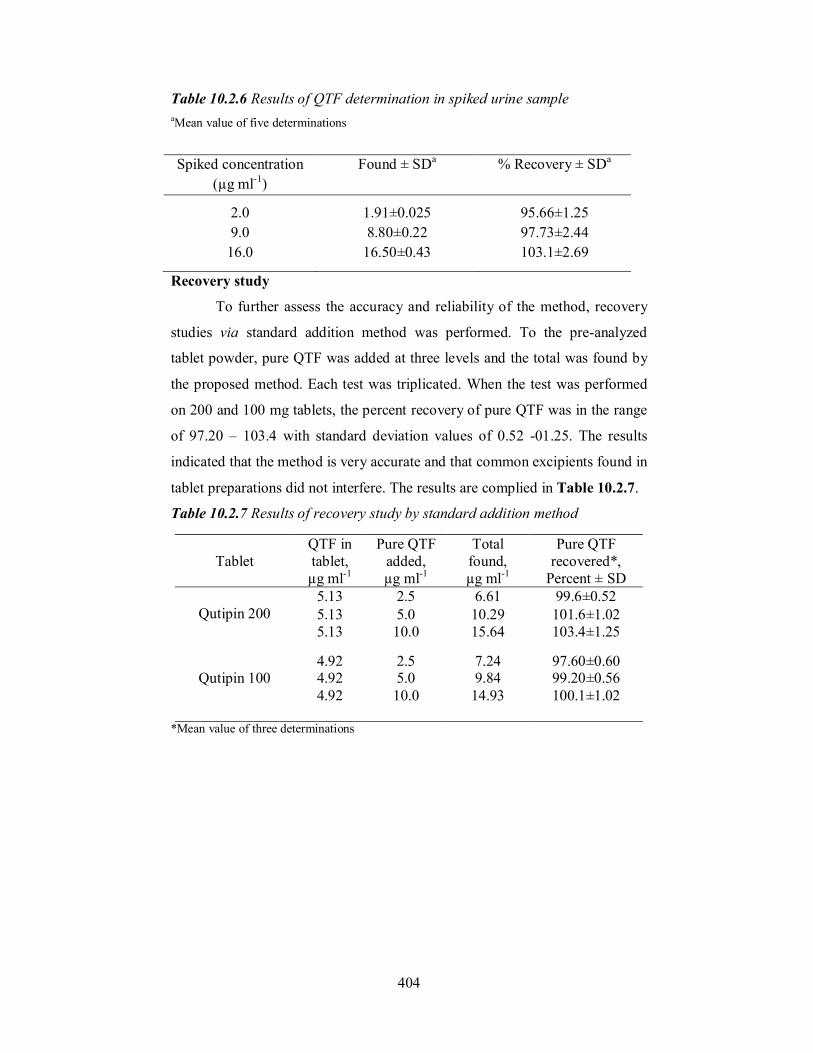
Table 10.2.6 Results of QTF determination in spiked urine sample aMean value of five determinations
Recovery study
To further assess the accuracy and reliability of the method, recovery
studies via standard addition method was performed. To the pre-analyzed
tablet powder, pure QTF was added at three levels and the total was found by
the proposed method. Each test was triplicated. When the test was performed
on 200 and 100 mg tablets, the percent recovery of pure QTF was in the range
of 97.20 – 103.4 with standard deviation values of 0.52 -01.25. The results
indicated that the method is very accurate and that common excipients found in
tablet preparations did not interfere. The results are complied in Table 10.2.7.
Table 10.2.7 Results of recovery study by standard addition method
*Mean value of three determinations
Spiked concentration (µg ml-1)
Found ± SDa % Recovery ± SDa
2.0 9.0
16.0
1.91±0.025 8.80±0.22
16.50±0.43
95.66±1.25 97.73±2.44 103.1±2.69
Tablet QTF in tablet,
µg ml-1
Pure QTF added, µg ml-1
Total found, µg ml-1
Pure QTF recovered*,
Percent ± SD
Qutipin 200
5.13 2.5 6.61 99.6±0.52 5.13 5.0 10.29 101.6±1.02 5.13 10.0 15.64 103.4±1.25
Qutipin 100
4.92 2.5 7.24 97.60±0.60 4.92 5.0 9.84 99.20±0.56 4.92 10.0 14.93 100.1±1.02
405
Section 10.3
SPECTROPHOTOMETRIC DETERMINATION OF QUETIAPINE
FUMARATE THROUGH ION-PAIR COMPLEXATION REACTION
WITH TROPAEOLIN OOO
10.3.1 INTRODUCTION
The basis and application of the extractive spectrophotometric methods
for the assay of therapeutically active organic compounds/pharmaceutical
drugs by employing many sulphonthalein dyes are presented in the Section
9.1. From the literature it is confirmed that tropaeolin ooo (TP) has not been
utilized for the spectrophotometric assay of QTF. Since TP has sulphonic acid
group, it posses the ability to form ion-pair complex with weakly basic amino
compounds. Therefore, the basic nature of QTF was utilized by the author to
develop a new extractive spectrophotometric method with TP. A 1:2
chloroform extractable orange-red coloured ion-pair complex is formed
between QTF and TP in acidic medium (pH 1.83±0.03). The resulting ion-pair
complex exhibited an absorption maximum at 480 nm. All experimental
variables governing complex formation and its extraction were optimized and
the method was validated according to ICH guidelines. The details about these
are presented in this Section (10.3).
10.3.2 EXPERIMENTAL
10.3.2.1 Apparatus
The instruments to measure absorbance and pH were the same as
described in Section 9.1.2.
10.3.2.2 Reagents and materials
All chemicals used were of analytical reagent grade and distilled water
was used throughout the investigation. Spectroscopic grade organic solvents
were used. Pure QTF and its tablets used were the same as described in
Section 10.1.2.
Sulphuric acid (1 M & 0.1 M): A 1 M acid was prepared by appropriate
dilution of concentrated acid (S.D. Fine Chem, Mumbai, India, Sp. gr. 1.84)
with water. This was further diluted with water to get 0.1 M.
406
Tropaeolin ooo (TP) solution (0.1% w/v): The aqueous solution was
prepared by dissolving 0.1 g of TP (S.D. Fine, Mumbai) in 100 ml of water in
a volumetric flask.
Urine sample: Drug-free human urine was obtained from a healthy male aged
about 28 years.
Stock QTF solution
A 100 µg ml-1 stock solution was prepared by dissolving 10 mg of pure
QTF in 0.1 M H2SO4 and it was diluted upto mark with the same acid in a 100
ml volumetric flask. This solution was diluted appropriately with 0.1 M H2SO4
to get 40 µg ml-1 QTF.
10.3.2.4 General procedures
Preparation of calibration curve
Aliquots of (0.5-5.0 ml) QTF standard solution (40 µg ml-1) were
accurately measured and transferred into a series of 125 ml separating funnels
and the total volume was brought to 5 ml by adding 0.1 M H2SO4. Then, to
each funnel were added 2 ml of 1 M H2SO4, 10 ml of water and 5 ml of 0.1%
TP dye solution were added. Content was mixed well and kept aside for 5 min.
The drug-dye ion-pair was next extracted with 10 ml of chloroform by shaking
for 30 sec and the layers were allowed to separate. The organic layer was then
passed over anhydrous sodium sulphate and absorbance was measured at 480
nm against the reagent blank.
A standard graph was prepared by plotting the absorbance vs drug
concentration, and the concentration of the unknown was read from the
calibration graph or computed from the regression equation derived using the
absorbance-concentration data.
Procedure for tablets
An amount of the tablet powder equivalent to 40 mg of QTF was
transferred into a 100 ml volumetric flask containing ~70 ml of 0.1 M H2SO4.
The flask was shaken for 20 min and the solution was diluted up to the mark
with 0.1 M H2SO4 and filtered through a Whatman No 42 filter paper. The first
10 ml portion of the filtrate was discarded and 10 ml of the filtrate was diluted
to 100 ml to get 40 µg ml-1 QTF. A suitable aliquot (say 3 ml) was subjected to
analysis by following the general procedure described for pure drug.
407
Procedure for assay in spiked urine
Into a 25 ml volumetric flask containing 3 ml of urine and 2 ml of
acetonitrile, 10 ml of 100 µg ml-1 QTF solution was added and the volume was
made up to mark with 0.1 M H2SO4 and mixed. The resulting solution was
filtered through Whatman No 42 filter paper and three different aliquots were
subjected to analysis by following the general procedure. The concentration of
QTF in urine was found using standard graph or from the regression equation.
Procedure for the analysis of placebo blank and synthetic mixture
A placebo blank containing starch (10 mg), acacia (15 mg), hydroxyl
cellulose (10 mg), sodium citrate (10 mg), talc (20 mg), magnesium stearate
(15 mg) and sodium alginate (10 mg) was made and its solution was prepared
as described for tablets and then subjected to analysis.
A synthetic mixture was prepared by adding pure QTF (40 mg) to 30
mg of the above mentioned placebo blank and the mixture was homogenised.
Synthetic mixture containing 4 mg of QTF was weighed and its solution in a
100 ml volumetric flask was prepared as described under the procedure for
tablets. Three different aliquots were subjected to analysis by the general
procedure. The concentration of QTF was found from the calibration graph or
from the regression equation.
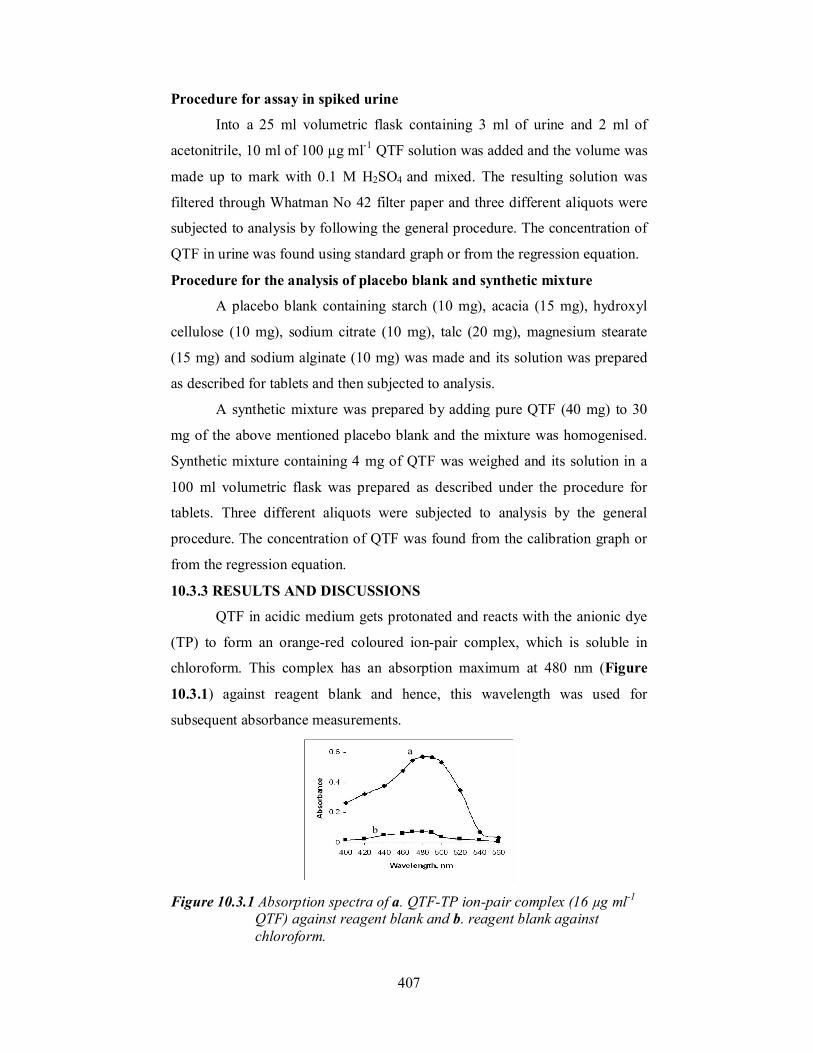
10.3.3 RESULTS AND DISCUSSIONS
QTF in acidic medium gets protonated and reacts with the anionic dye
(TP) to form an orange-red coloured ion-pair complex, which is soluble in
chloroform. This complex has an absorption maximum at 480 nm (Figure
10.3.1) against reagent blank and hence, this wavelength was used for
subsequent absorbance measurements.
a
b
Figure 10.3.1 Absorption spectra of a. QTF-TP ion-pair complex (16 µg ml-1
QTF) against reagent blank and b. reagent blank against chloroform.
408
10.3.3.1 Method development
Optimisation of variables
Optimum conditions necessary for rapid formation and quantitative
extraction of the coloured ion-pair complex with maximum stability and
sensitivity were established by a number of preliminary experiments by
varying such variables as volume of acid, volume of water in the aqueous
phase, type of organic solvent, volume of the dye shaking time, number of
extractions, etc.
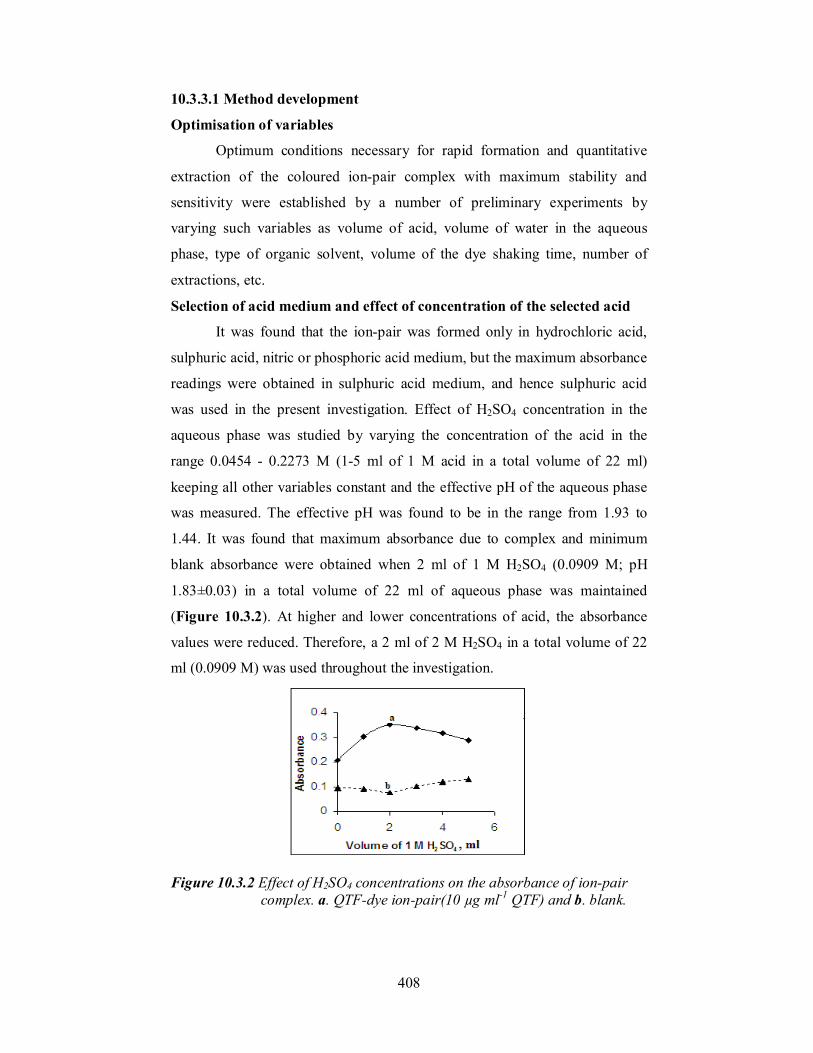
Selection of acid medium and effect of concentration of the selected acid
It was found that the ion-pair was formed only in hydrochloric acid,
sulphuric acid, nitric or phosphoric acid medium, but the maximum absorbance
readings were obtained in sulphuric acid medium, and hence sulphuric acid
was used in the present investigation. Effect of H2SO4 concentration in the
aqueous phase was studied by varying the concentration of the acid in the
range 0.0454 - 0.2273 M (1-5 ml of 1 M acid in a total volume of 22 ml)
keeping all other variables constant and the effective pH of the aqueous phase
was measured. The effective pH was found to be in the range from 1.93 to
1.44. It was found that maximum absorbance due to complex and minimum
blank absorbance were obtained when 2 ml of 1 M H2SO4 (0.0909 M; pH
1.83±0.03) in a total volume of 22 ml of aqueous phase was maintained
(Figure 10.3.2). At higher and lower concentrations of acid, the absorbance
values were reduced. Therefore, a 2 ml of 2 M H2SO4 in a total volume of 22
ml (0.0909 M) was used throughout the investigation.
Figure 10.3.2 Effect of H2SO4 concentrations on the absorbance of ion-pair
complex. a. QTF-dye ion-pair(10 µg ml-1 QTF) and b. blank.
409
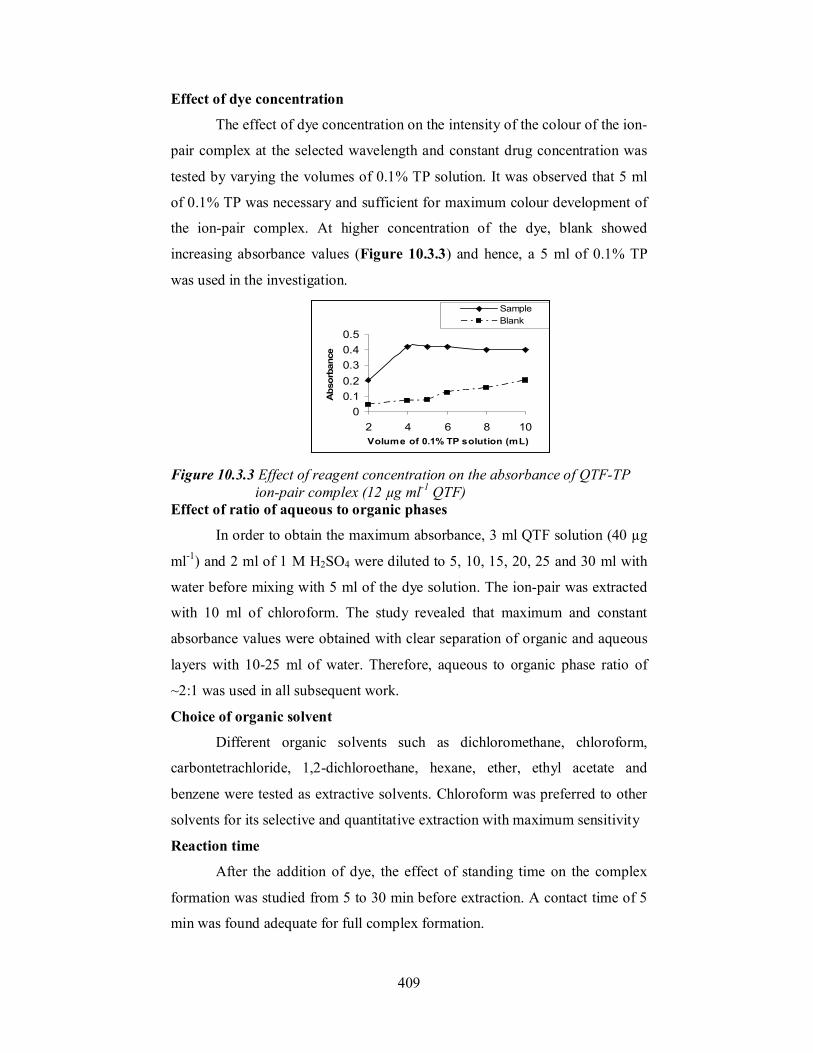
Effect of dye concentration
The effect of dye concentration on the intensity of the colour of the ion-
pair complex at the selected wavelength and constant drug concentration was
tested by varying the volumes of 0.1% TP solution. It was observed that 5 ml
of 0.1% TP was necessary and sufficient for maximum colour development of
the ion-pair complex. At higher concentration of the dye, blank showed
increasing absorbance values (Figure 10.3.3) and hence, a 5 ml of 0.1% TP
was used in the investigation.
Figure 10.3.3 Effect of reagent concentration on the absorbance of QTF-TP
ion-pair complex (12 µg ml-1 QTF) Effect of ratio of aqueous to organic phases
In order to obtain the maximum absorbance, 3 ml QTF solution (40 µg
ml-1) and 2 ml of 1 M H2SO4 were diluted to 5, 10, 15, 20, 25 and 30 ml with
water before mixing with 5 ml of the dye solution. The ion-pair was extracted
with 10 ml of chloroform. The study revealed that maximum and constant
absorbance values were obtained with clear separation of organic and aqueous
layers with 10-25 ml of water. Therefore, aqueous to organic phase ratio of
~2:1 was used in all subsequent work.
Choice of organic solvent
Different organic solvents such as dichloromethane, chloroform,
carbontetrachloride, 1,2-dichloroethane, hexane, ether, ethyl acetate and
benzene were tested as extractive solvents. Chloroform was preferred to other
solvents for its selective and quantitative extraction with maximum sensitivity
Reaction time
After the addition of dye, the effect of standing time on the complex
formation was studied from 5 to 30 min before extraction. A contact time of 5
min was found adequate for full complex formation.
00.10.20.30.40.5
2 4 6 8 10Volume of 0.1% TP solution (mL)
Abs
orba
nce
SampleBlank
410
Effect of shaking time
The effect of the shaking time on the extraction of the QTF-TP ion-pair
was studied by shaking the separating funnel for different times ranging from
30 to 180 s after adding chloroform. Constant absorbance readings were
obtained from 30 sec and onwards and, hence a 30 sec shaking time was fixed.
Number of extractions
To obtain the complete extraction of the QTF-TP ion-pair, under
optimum conditions, the drug-dye complex in the aqueous phase was extracted
with three 10 ml portions of chloroform separately and absorbance was
measured each time against the respective blank. After the second extraction,
the absorbance of the organic layer was negligibly small. Hence, a single
extraction with 10 ml of chloroform was fixed as optimum.
Equilibration time and stability of the coloured complex
The organic and aqueous phases were clearly separated in less than 1
min. The drug-dye ion-pair complex was stable for more than 15 h at
laboratory temperature (29±2oC).
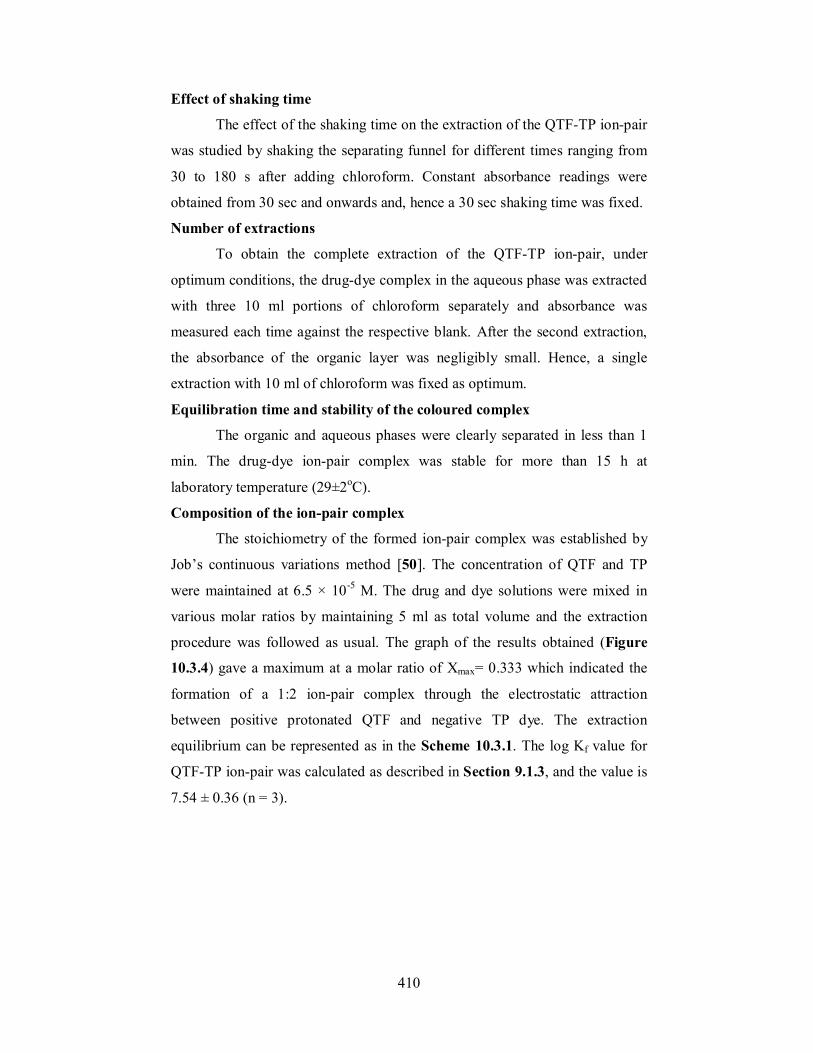
Composition of the ion-pair complex
The stoichiometry of the formed ion-pair complex was established by
Job’s continuous variations method [50]. The concentration of QTF and TP
were maintained at 6.5 × 10⁻⁵ M. The drug and dye solutions were mixed in
various molar ratios by maintaining 5 ml as total volume and the extraction
procedure was followed as usual. The graph of the results obtained (Figure
10.3.4) gave a maximum at a molar ratio of Xmax= 0.333 which indicated the
formation of a 1:2 ion-pair complex through the electrostatic attraction
between positive protonated QTF and negative TP dye. The extraction
equilibrium can be represented as in the Scheme 10.3.1. The log Kf value for
QTF-TP ion-pair was calculated as described in Section 9.1.3, and the value is
7.54 ± 0.36 (n = 3).
411
S
NN
N
O
OH
OH
O
O
OH
OH
O
O
OH
S
NNH
+
NH+
O
OH
OH
O
O
OH
OH
O
O
OH
2H+
QTF.2H++QTF
QTF.2H(aq)++
+ QTF.2H 2TP(aq)
Quetiapine fumarate Protonated quetiapine fumarate
2TP(aq)++ --
QTF.2H 2TP(org)++ --
ion-pair in aqueous phase before extraction
ion-pair in organic phase after extraction
--
where TP- =
Scheme 10.3.1 The probable reaction pathway for the formation of QTF-TP
ion-pair complex
Figure 10.3.4 Job’s method of continuous variations graph for the formation
of a 1:2 ion-pair complex between QTF and TP. 10.3.3.2 Method validation
Linearity, sensitivity, limits of detection and quantification
Calibration graph (Figure 10.3.5) was constructed from six points
covering the concentration range 2.0 - 20.0 µg ml-1. Regression analysis of the
Beer’s law data indicated a linear relationship between absorbance and
concentration, (Table 10.3.1) which is corroborated by high value (close to
unity) of the correlation coefficient. A plot of log absorbance and log
concentration yielded a straight line with slope equal to 1.006, further
establishing the linear relation between the two variables. The calculated molar
absorptivity and Sandell sensitivity [51] values are summarized in Table
412
10.3.1. The limits of detection (LOD) and quantification (LOQ) were
calculated and summarized in Table 10.3.1. The high values of ε and low
values of Sandell sensitivity and LOD indicate the high sensitivity of the
proposed method.
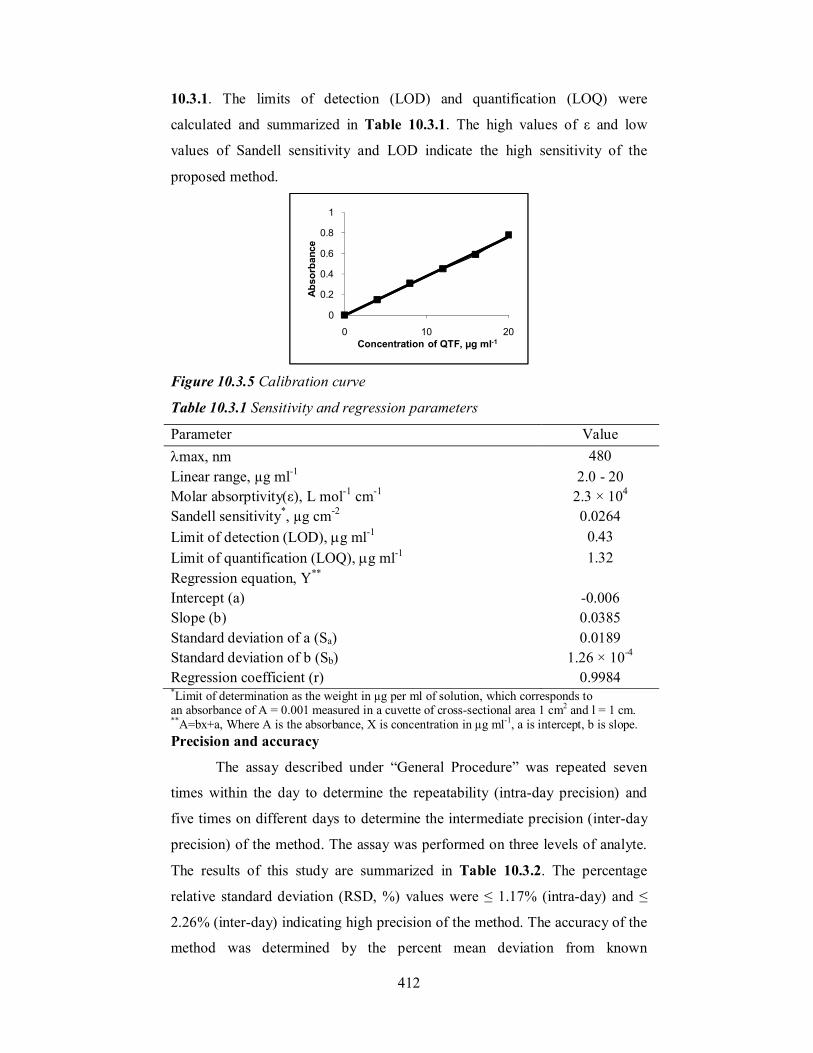
Figure 10.3.5 Calibration curve
Table 10.3.1 Sensitivity and regression parameters
Parameter Value max, nm 480 Linear range, µg ml-1 2.0 - 20 Molar absorptivity(ε), L mol-1 cm-1 2.3 × 10⁴ Sandell sensitivity*, µg cm-2 0.0264 Limit of detection (LOD), g ml-1 0.43 Limit of quantification (LOQ), g ml-1 1.32 Regression equation, Y**
Intercept (a) -0.006 Slope (b) 0.0385 Standard deviation of a (Sa) 0.0189 Standard deviation of b (Sb) 1.26 × 10⁻⁴ Regression coefficient (r) 0.9984 *Limit of determination as the weight in µg per ml of solution, which corresponds to an absorbance of A = 0.001 measured in a cuvette of cross-sectional area 1 cm2 and l = 1 cm. **A=bx+a, Where A is the absorbance, X is concentration in µg ml-1, a is intercept, b is slope. Precision and accuracy
The assay described under “General Procedure” was repeated seven
times within the day to determine the repeatability (intra-day precision) and
five times on different days to determine the intermediate precision (inter-day
precision) of the method. The assay was performed on three levels of analyte.
The results of this study are summarized in Table 10.3.2. The percentage
relative standard deviation (RSD, %) values were ≤ 1.17% (intra-day) and ≤
2.26% (inter-day) indicating high precision of the method. The accuracy of the
method was determined by the percent mean deviation from known
0
0.2
0.4
0.6
0.8
1
0 10 20
Abso
rban
ce
Concentration of QTF, µg ml-1
413
concentration. Percent relative error (RE, %) values < 3.0% demonstrate the
accuracy of the proposed method.
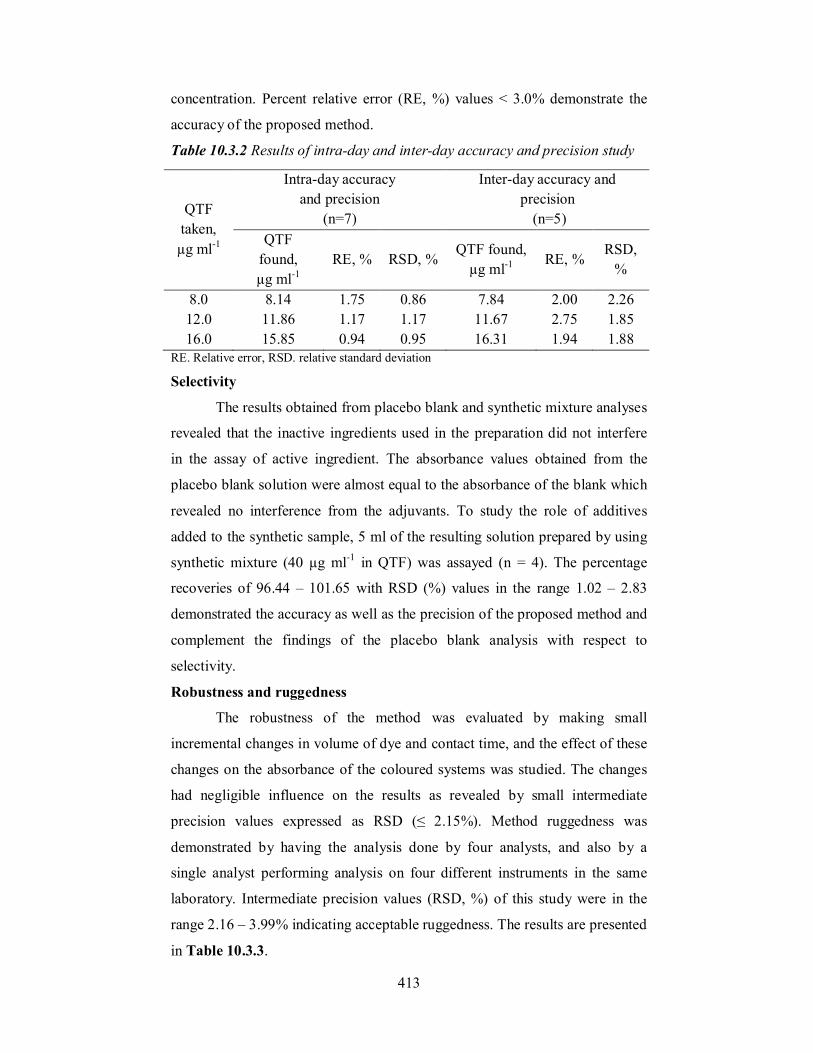
Table 10.3.2 Results of intra-day and inter-day accuracy and precision study
RE. Relative error, RSD. relative standard deviation
Selectivity
The results obtained from placebo blank and synthetic mixture analyses
revealed that the inactive ingredients used in the preparation did not interfere
in the assay of active ingredient. The absorbance values obtained from the
placebo blank solution were almost equal to the absorbance of the blank which
revealed no interference from the adjuvants. To study the role of additives
added to the synthetic sample, 5 ml of the resulting solution prepared by using
synthetic mixture (40 µg ml-1 in QTF) was assayed (n = 4). The percentage
recoveries of 96.44 – 101.65 with RSD (%) values in the range 1.02 – 2.83
demonstrated the accuracy as well as the precision of the proposed method and
complement the findings of the placebo blank analysis with respect to
selectivity.
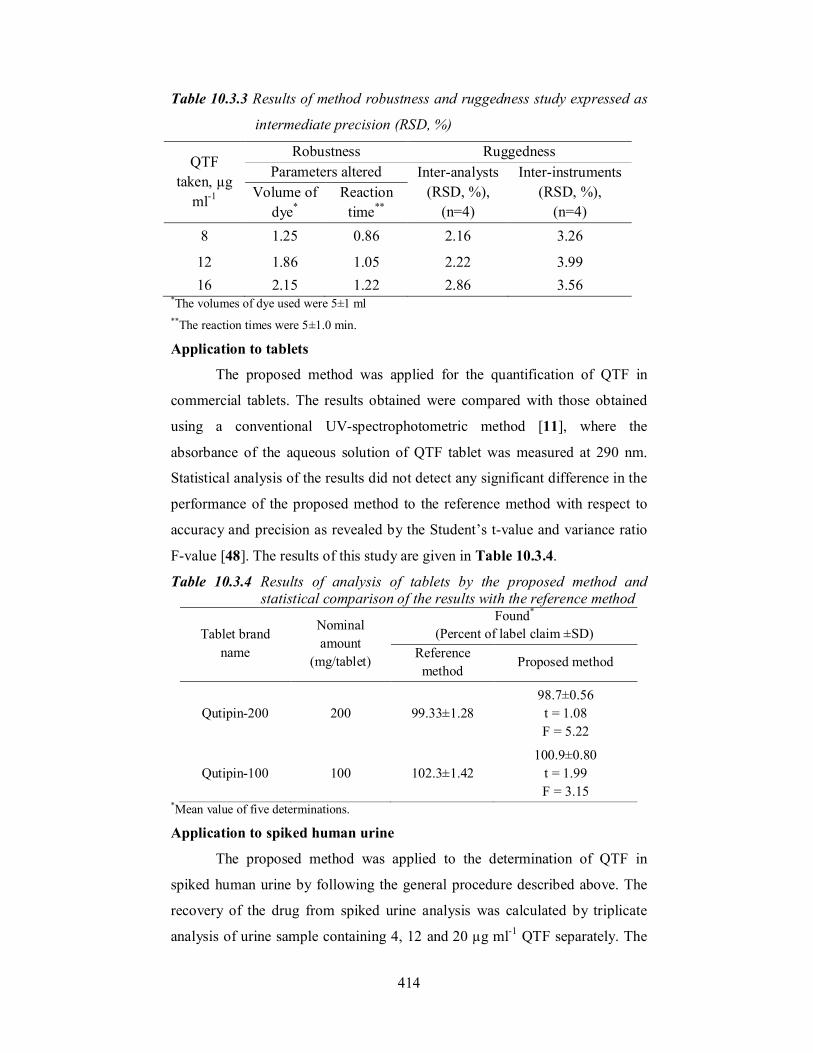
Robustness and ruggedness
The robustness of the method was evaluated by making small
incremental changes in volume of dye and contact time, and the effect of these
changes on the absorbance of the coloured systems was studied. The changes
had negligible influence on the results as revealed by small intermediate
precision values expressed as RSD (≤ 2.15%). Method ruggedness was
demonstrated by having the analysis done by four analysts, and also by a
single analyst performing analysis on four different instruments in the same
laboratory. Intermediate precision values (RSD, %) of this study were in the
range 2.16 – 3.99% indicating acceptable ruggedness. The results are presented
in Table 10.3.3.
QTF taken,
µg ml-1
Intra-day accuracy and precision
(n=7)
Inter-day accuracy and precision
(n=5) QTF
found, µg ml-1
RE, % RSD, % QTF found,
µg ml-1 RE, %
RSD, %
8.0 12.0 16.0
8.14 11.86 15.85
1.75 1.17 0.94
0.86 1.17 0.95
7.84 11.67 16.31
2.00 2.75 1.94
2.26 1.85 1.88
414
Table 10.3.3 Results of method robustness and ruggedness study expressed as
intermediate precision (RSD, %)
QTF taken, µg
ml-1
Robustness Ruggedness Parameters altered Inter-analysts
(RSD, %), (n=4)
Inter-instruments (RSD, %),
(n=4) Volume of
dye* Reaction
time**
8 1.25 0.86 2.16 3.26
12 1.86 1.05 2.22 3.99 16 2.15 1.22 2.86 3.56
*The volumes of dye used were 5±1 ml **The reaction times were 5±1.0 min.
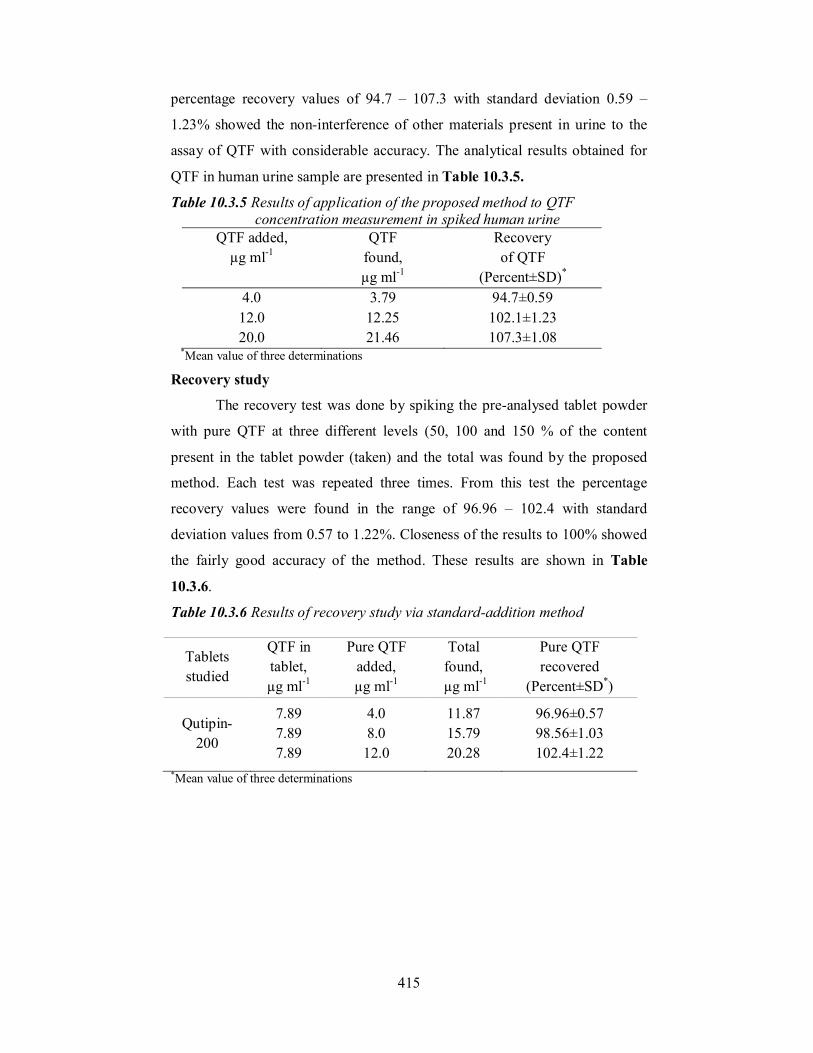
Application to tablets
The proposed method was applied for the quantification of QTF in
commercial tablets. The results obtained were compared with those obtained
using a conventional UV-spectrophotometric method [11], where the
absorbance of the aqueous solution of QTF tablet was measured at 290 nm.
Statistical analysis of the results did not detect any significant difference in the
performance of the proposed method to the reference method with respect to
accuracy and precision as revealed by the Student’s t-value and variance ratio
F-value [48]. The results of this study are given in Table 10.3.4.
Table 10.3.4 Results of analysis of tablets by the proposed method and statistical comparison of the results with the reference method
*Mean value of five determinations.
Application to spiked human urine
The proposed method was applied to the determination of QTF in
spiked human urine by following the general procedure described above. The
recovery of the drug from spiked urine analysis was calculated by triplicate
analysis of urine sample containing 4, 12 and 20 µg ml-1 QTF separately. The
Tablet brand name
Nominal amount
(mg/tablet)
Found* (Percent of label claim ±SD)
Reference method
Proposed method
Qutipin-200 200 99.33±1.28 98.7±0.56 t = 1.08 F = 5.22
Qutipin-100 100 102.3±1.42 100.9±0.80
t = 1.99 F = 3.15
415
percentage recovery values of 94.7 – 107.3 with standard deviation 0.59 –
1.23% showed the non-interference of other materials present in urine to the
assay of QTF with considerable accuracy. The analytical results obtained for
QTF in human urine sample are presented in Table 10.3.5.
Table 10.3.5 Results of application of the proposed method to QTF concentration measurement in spiked human urine
QTF added, µg ml-1
QTF found, µg ml-1
Recovery of QTF
(Percent±SD)* 4.0 12.0 20.0
3.79 12.25 21.46
94.7±0.59 102.1±1.23 107.3±1.08
*Mean value of three determinations
Recovery study
The recovery test was done by spiking the pre-analysed tablet powder
with pure QTF at three different levels (50, 100 and 150 % of the content
present in the tablet powder (taken) and the total was found by the proposed
method. Each test was repeated three times. From this test the percentage
recovery values were found in the range of 96.96 – 102.4 with standard
deviation values from 0.57 to 1.22%. Closeness of the results to 100% showed
the fairly good accuracy of the method. These results are shown in Table
10.3.6.
Table 10.3.6 Results of recovery study via standard-addition method
*Mean value of three determinations
Tablets studied
QTF in tablet, µg ml-1
Pure QTF added, µg ml-1
Total found,
µg ml-1
Pure QTF recovered
(Percent±SD*)
Qutipin-200
7.89 7.89 7.89
4.0 8.0
12.0
11.87 15.79 20.28
96.96±0.57 98.56±1.03 102.4±1.22
416
Section 10.4
SPECTROPHOTOMETRIC DETERMINATION OF QUETIAPINE
FUMARATE IN PHARMACEUTICALS AND HUMAN URINE BY
TWO CHARGE-TRANSFER COMPLEXATION REACTIONS
10.4.1 INTRODUCTION
The introduction about the principle and chemistry in forming charge
transfer complexes between electron donors and acceptors are presented in
Section 2.3. QTF features basic nature in its structure due to presence of amino
groups and is prone to form charge transfer complex with two π-acceptors,
namely, p-chloranilic acid (p-CAA) or 2,3-dichloro-5,6-dicyanoquinone
(DDQ). The coloured charge transfer complexes formed exhibited absorption
maxima at 520 and 540 nm, in p-CAA and DDQ methods, respectively. The
method development, validation results and applications are presented in this
section (Section 10.4).
10.4.2 EXPERIMENTAL
10.4.2.1 Apparatus
All absorption measurements were made using the instrument
described in Section 10.3.2.1.
10.4.2.2 Materials
Pure QTF and its tablets used were the same as described in Section
10.1.2.3. Dichloromethane and acetonitrile (spectroscopic grade) were
purchased from Merck, Mumbai, India. Distilled water was used wherever
required. All other chemicals used were of analytical reagent grade.
10.4.2.3 Reagents
p-Chloranilic acid (p-CAA, 0.2%) & 2,3-dichloro-5,6-dicyanoquinone
(DDQ, 0.1%): Prepared freshly by dissolving required quantity of the pure
compounds (both from S.D. Fine Chem Ltd, Mumbai, India) in acetonitrile.
Sulphuric acid (H2SO4, 0.1 M): Prepared as described in Section 10.3.2.
Sodium hydroxide (NaOH, 1 M): Accurately weighed 4 g of the pure
compound (Merck, Mumbai, India) was dissolved in water, the solution was
made up to 100 ml with water.
Urine: The sample was collected from healthy volunteer (male, around 28-
year-old) and kept frozen until use after gentle thawing.
417
Standard free base form of drug
Into a 125 ml separating funnel, an accurately weighed amount of 16.1
mg of pure QTF was transferred and its solution was made by adding 2 ml of
0.1 M H2SO4 and 10 ml of water. A 5 ml of 1 M NaOH was added and the
content was shaken for 5 min. Then the free base (QTP) was extracted with
three 15 ml portions of dichloromethane, the extract each time was passed over
anhydrous sodium sulphate and collected in a 50 ml volumetric flask, the
volume was made upto mark with dichloromethane and the resulting solution
(200 µg ml-1 QTP) was used for the assay in method A. This solution was
diluted with dichloromethane to get a working concentration of 100 µg ml-1
QTP for method B.
10.4.2.4 General procedures
Construction of calibration curves
Method A (using p-CAA)
Varying aliquots of standard QTP solution equivalent to 8.0 – 160 µg
ml-1 (0.2 – 4.0 ml of 200 µg ml-1) were accurately measured by means of a
microburette and transferred into a series of 5 ml calibrated flasks and the total
volume in each flask was brought to 4 ml by adding dichloromethane. After
the addition of 1ml of 0.2 % p-CAA solution, the content was mixed well and
the absorbance was measured at 520 nm against a reagent blank similarly
prepared without adding QTP solution.
Method B (using DDQ)
Into a series of 5 ml calibration flasks, aliquots (0.2 – 4.0 ml) of
standard QTP solution (100 µg ml-1) equivalent to 4.0 – 80.0 µg ml-1 QTP
were accurately transferred, and to each flask 1 ml of 0.1 % DDQ solution was
added and the mixture was diluted to 5 ml with dichloromethane. After 2
minutes, the absorbance of the red coloured C-T complex was measured at 540
nm against the reference blank similarly prepared.
Standard graph was prepared by plotting the absorbance vs QTP
concentration, and the concentration of the unknown was read from the
calibration graph or computed from the respective regression equation derived
using the absorbance-concentration data.
418
Procedure for tablets
An amount of tablet powder equivalent to 16.1 mg of QTP was
transferred into a 25 ml volumetric flask containing 2 ml of 0.1 M H2SO4 and
10 ml of water. The content was shaken well for 20 min. The resulting solution
was filtered through Whatmann No 42 filter paper and the filtrate was
collected in to a 125 ml separating funnel. QTP solutions of concentrations 200
and 100 µg ml-1, for method A and method B, respectively, were prepared as
described under the general procedure for pure drug and a suitable aliquot was
used for assay by applying procedures described earlier.
Procedure for spiked human urine
To prepare spiked urine sample, 16.1 mg of the pure QTF, 2 ml of 0.1
M H2SO4 and 5 ml of urine sample were taken in a separating funnel. Ten ml
of water was added followed by 5 ml of 1 M NaOH. The content was shaken
for 5 min and QTP base formed was extracted with three 15 ml portions of
dichloromethane. The organic layer was passed over anhydrous sodium
sulphate and collected in a 50 ml volumetric flask. The solution was made up
to the mark with dichloromethane, mixed well and 200 µg ml-1 QTP solution
so obtained was used for the assay in method A. The above solution was
diluted appropriately to get a working concentration of 100 µg ml-1 and a
suitable aliquot (say 2 or 3 ml) was then subjected to analysis by following the
procedure described in method B.
Procedure for the analysis of placebo blank and synthetic mixture
A placebo blank was prepared as described in Section 10.3.2 and then
subjected to analysis.
A synthetic mixture was prepared by adding pure QTF (100 mg) to the
above mentioned placebo blank and the mixture was homogenised. Synthetic
mixture containing 16.1 mg of QTP was weighed and its solution was prepared
as described for tablets. Three different aliquots were subjected to analysis by
the general procedure. The concentration of QTP was found from the
calibration graph or from the regression equation.
10.4.3 RESULTS AND DISCUSSION
QTP, a nitrogenous base acting as n-donor was made to react with p-
CAA and DDQ (π-acceptors) to produce a coloured charge transfer complexes
in dichloromethane-acetonitrile solvent system.
419
QTF is a fumarate salt. Salts of amines do not react faster with π-
acceptors [52]. Therefore it was necessary to first convert the salt form into
free base (QTP) and then extract the free base into a non-aqueous solvent.
QTP, being an n-electron donor, reacts with π -acceptors giving CT complexes
of n– π type which dissociate to give the coloured free radical anions of the
acceptors according to the following equation:
QTP + A QTP-A QTF + + A.-
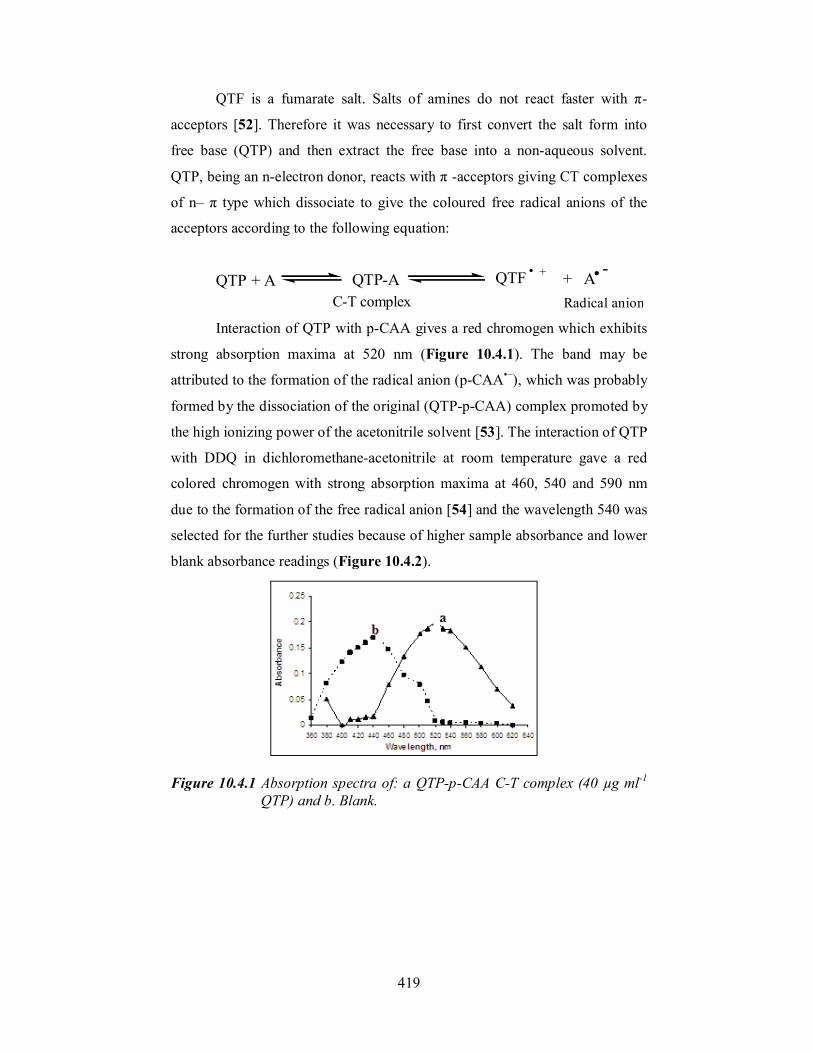
C-T complex Radical anion Interaction of QTP with p-CAA gives a red chromogen which exhibits
strong absorption maxima at 520 nm (Figure 10.4.1). The band may be
attributed to the formation of the radical anion (p-CAA•−), which was probably
formed by the dissociation of the original (QTP-p-CAA) complex promoted by
the high ionizing power of the acetonitrile solvent [53]. The interaction of QTP
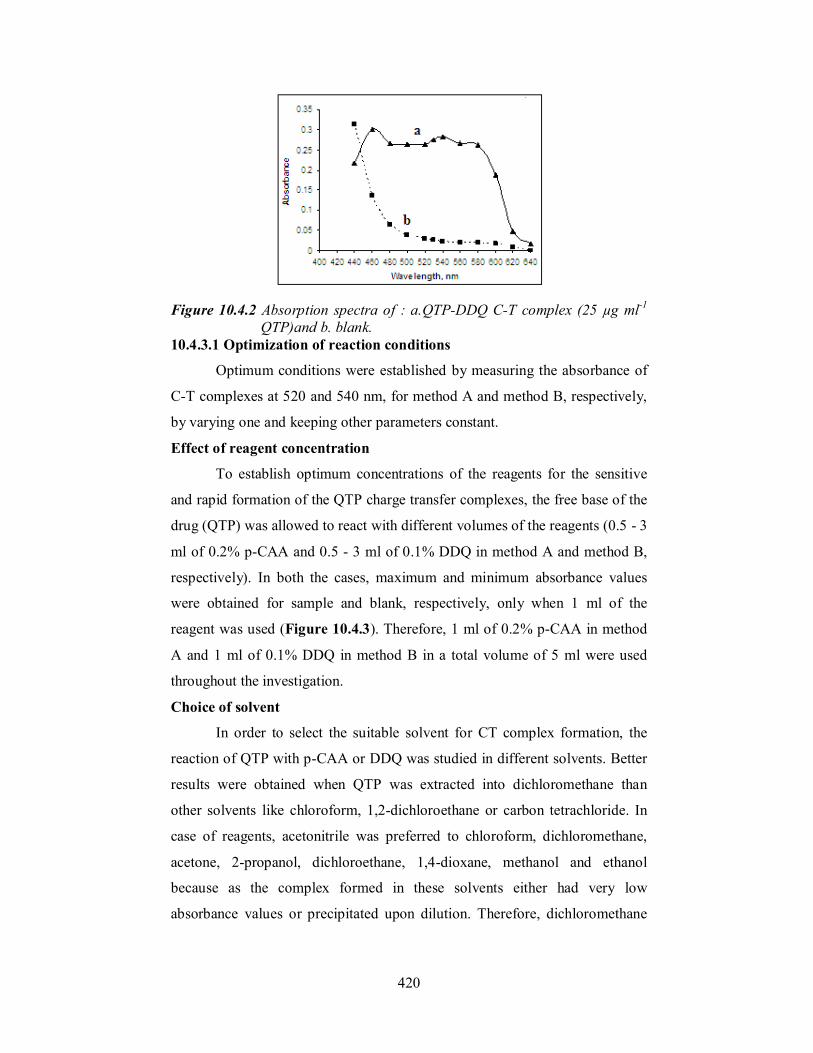
with DDQ in dichloromethane-acetonitrile at room temperature gave a red
colored chromogen with strong absorption maxima at 460, 540 and 590 nm
due to the formation of the free radical anion [54] and the wavelength 540 was
selected for the further studies because of higher sample absorbance and lower
blank absorbance readings (Figure 10.4.2).
Figure 10.4.1 Absorption spectra of: a QTP-p-CAA C-T complex (40 µg ml-1
QTP) and b. Blank.
420
Figure 10.4.2 Absorption spectra of : a.QTP-DDQ C-T complex (25 µg ml-1
QTP)and b. blank. 10.4.3.1 Optimization of reaction conditions
Optimum conditions were established by measuring the absorbance of
C-T complexes at 520 and 540 nm, for method A and method B, respectively,
by varying one and keeping other parameters constant.
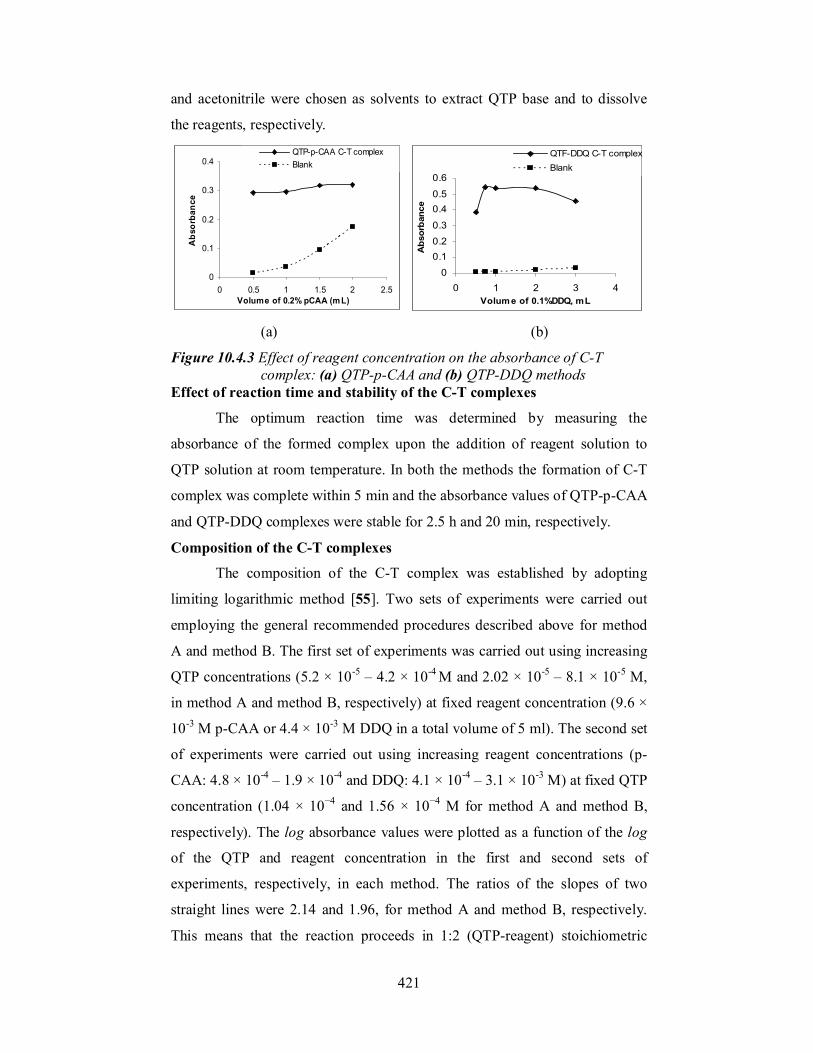
Effect of reagent concentration
To establish optimum concentrations of the reagents for the sensitive
and rapid formation of the QTP charge transfer complexes, the free base of the
drug (QTP) was allowed to react with different volumes of the reagents (0.5 - 3
ml of 0.2% p-CAA and 0.5 - 3 ml of 0.1% DDQ in method A and method B,
respectively). In both the cases, maximum and minimum absorbance values
were obtained for sample and blank, respectively, only when 1 ml of the
reagent was used (Figure 10.4.3). Therefore, 1 ml of 0.2% p-CAA in method
A and 1 ml of 0.1% DDQ in method B in a total volume of 5 ml were used
throughout the investigation.
Choice of solvent
In order to select the suitable solvent for CT complex formation, the
reaction of QTP with p-CAA or DDQ was studied in different solvents. Better
results were obtained when QTP was extracted into dichloromethane than
other solvents like chloroform, 1,2-dichloroethane or carbon tetrachloride. In
case of reagents, acetonitrile was preferred to chloroform, dichloromethane,
acetone, 2-propanol, dichloroethane, 1,4-dioxane, methanol and ethanol
because as the complex formed in these solvents either had very low
absorbance values or precipitated upon dilution. Therefore, dichloromethane
421
and acetonitrile were chosen as solvents to extract QTP base and to dissolve
the reagents, respectively.
(a) (b)
Figure 10.4.3 Effect of reagent concentration on the absorbance of C-T complex: (a) QTP-p-CAA and (b) QTP-DDQ methods
Effect of reaction time and stability of the C-T complexes
The optimum reaction time was determined by measuring the
absorbance of the formed complex upon the addition of reagent solution to
QTP solution at room temperature. In both the methods the formation of C-T
complex was complete within 5 min and the absorbance values of QTP-p-CAA
and QTP-DDQ complexes were stable for 2.5 h and 20 min, respectively.
Composition of the C-T complexes
The composition of the C-T complex was established by adopting
limiting logarithmic method [55]. Two sets of experiments were carried out
employing the general recommended procedures described above for method
A and method B. The first set of experiments was carried out using increasing
QTP concentrations (5.2 × 10⁻⁵ – 4.2 × 10⁻⁴ M and 2.02 × 10⁻⁵ – 8.1 × 10⁻⁵ M,
in method A and method B, respectively) at fixed reagent concentration (9.6 ×
10-3 M p-CAA or 4.4 × 10⁻³ M DDQ in a total volume of 5 ml). The second set
of experiments were carried out using increasing reagent concentrations (p-
CAA: 4.8 × 10⁻⁴ – 1.9 × 10⁻⁴ and DDQ: 4.1 × 10⁻⁴ – 3.1 × 10⁻³ M) at fixed QTP
concentration (1.04 × 10⁻⁴ and 1.56 × 10⁻⁴ M for method A and method B,
respectively). The log absorbance values were plotted as a function of the log
of the QTP and reagent concentration in the first and second sets of
experiments, respectively, in each method. The ratios of the slopes of two
straight lines were 2.14 and 1.96, for method A and method B, respectively.
This means that the reaction proceeds in 1:2 (QTP-reagent) stoichiometric
0
0.1
0.2
0.3
0.4
0 0.5 1 1.5 2 2.5Volume of 0.2% pCAA (mL)
Abs
orba
nce
QTP-p-CAA C-T complexBlank
00.10.20.3
0.40.5
0.6
0 1 2 3 4Volume of 0.1%DDQ, mL
Abs
orba
nce
QTF-DDQ C-T complexBlank
422
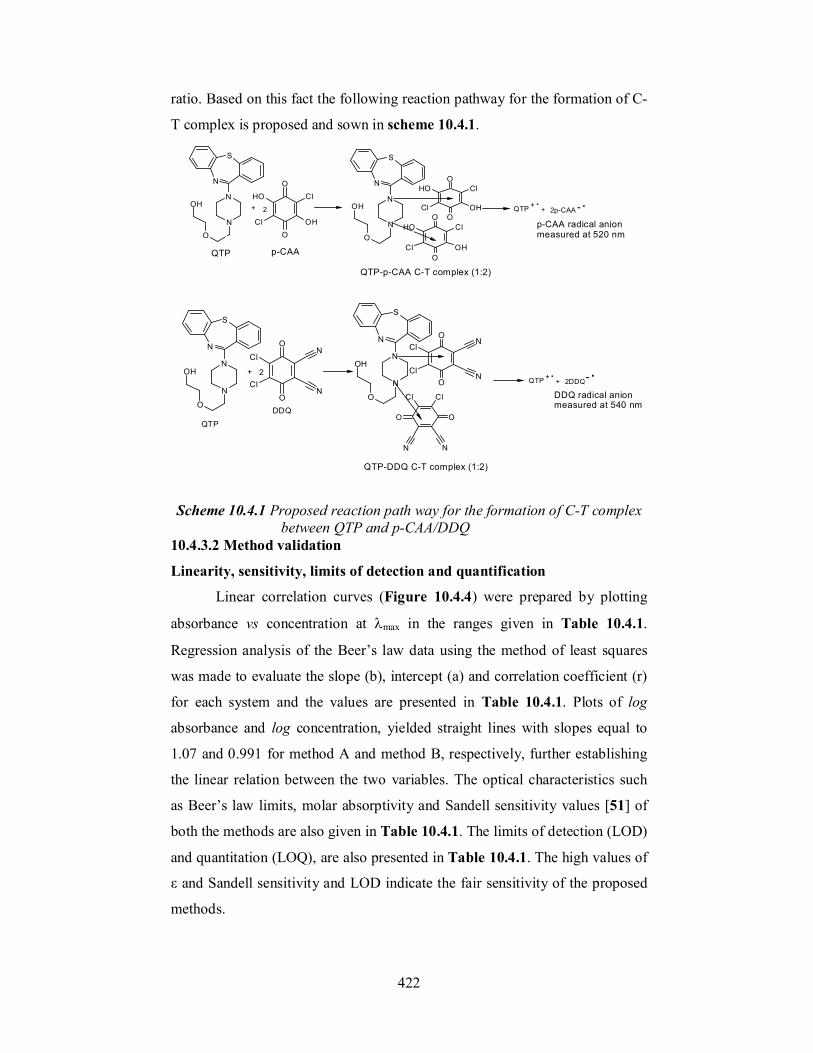
ratio. Based on this fact the following reaction pathway for the formation of C-
T complex is proposed and sown in scheme 10.4.1.
S
N
N
N
O
OH
O
O
Cl
OH
OH
Cl
S
N
N
N
O
OH
S
N
N
N
O
OH
O
O
N
N
Cl
Cl
OO
NN
ClCl
O
O
N
N
Cl
Cl
S
N
N
N
O
OH
O
O
Cl
OH
OH
ClO
O
Cl
OH
OH
ClQTP p-CAA
2
QTP-p-CAA C-T complex (1:2)
QTP +.+ + 2p-CAA
p-CAA radical anionmeasured at 520 nm
-.
+ 2
QTP
DDQ
QTP +.+ 2DDQ
DDQ radical anionmeasured at 540 nm
.-
QTP-DDQ C-T complex (1:2)
Scheme 10.4.1 Proposed reaction path way for the formation of C-T complex between QTP and p-CAA/DDQ
10.4.3.2 Method validation
Linearity, sensitivity, limits of detection and quantification
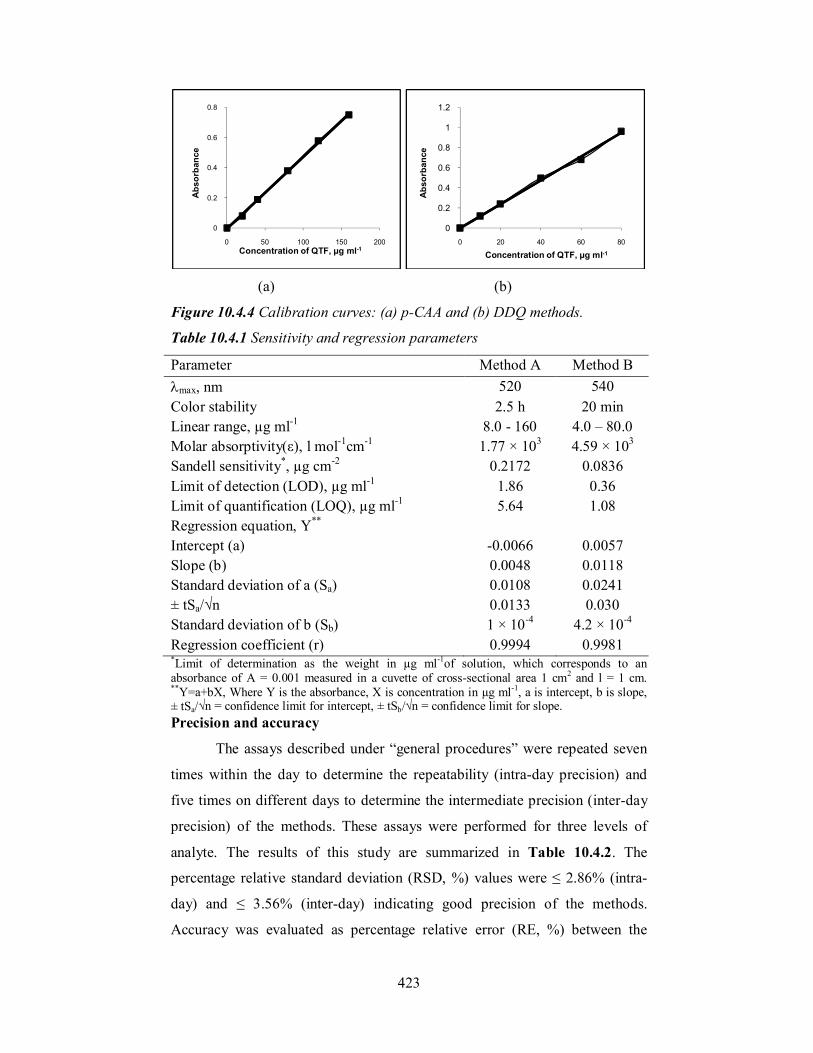
Linear correlation curves (Figure 10.4.4) were prepared by plotting
absorbance vs concentration at max in the ranges given in Table 10.4.1.
Regression analysis of the Beer’s law data using the method of least squares
was made to evaluate the slope (b), intercept (a) and correlation coefficient (r)
for each system and the values are presented in Table 10.4.1. Plots of log
absorbance and log concentration, yielded straight lines with slopes equal to
1.07 and 0.991 for method A and method B, respectively, further establishing
the linear relation between the two variables. The optical characteristics such
as Beer’s law limits, molar absorptivity and Sandell sensitivity values [51] of
both the methods are also given in Table 10.4.1. The limits of detection (LOD)
and quantitation (LOQ), are also presented in Table 10.4.1. The high values of
ε and Sandell sensitivity and LOD indicate the fair sensitivity of the proposed
methods.
423
(a) (b)
Figure 10.4.4 Calibration curves: (a) p-CAA and (b) DDQ methods.
Table 10.4.1 Sensitivity and regression parameters
Parameter Method A Method B max, nm 520 540 Color stability 2.5 h 20 min Linear range, µg ml-1 8.0 - 160 4.0 – 80.0
Molar absorptivity(ε), l mol-1cm-1 1.77 × 10³ 4.59 × 10³
Sandell sensitivity*, µg cm-2 0.2172 0.0836 Limit of detection (LOD), µg ml-1 1.86 0.36 Limit of quantification (LOQ), µg ml-1 5.64 1.08 Regression equation, Y**
Intercept (a) -0.0066 0.0057 Slope (b) 0.0048 0.0118 Standard deviation of a (Sa) 0.0108 0.0241 ± tSa/√n 0.0133 0.030 Standard deviation of b (Sb) 1 × 10⁻⁴ 4.2 × 10⁻⁴ Regression coefficient (r) 0.9994 0.9981 *Limit of determination as the weight in µg ml-1of solution, which corresponds to an absorbance of A = 0.001 measured in a cuvette of cross-sectional area 1 cm2 and l = 1 cm. **Y=a+bX, Where Y is the absorbance, X is concentration in µg ml-1, a is intercept, b is slope, ± tSa/√n = confidence limit for intercept, ± tSb/√n = confidence limit for slope. Precision and accuracy
The assays described under “general procedures” were repeated seven
times within the day to determine the repeatability (intra-day precision) and
five times on different days to determine the intermediate precision (inter-day
precision) of the methods. These assays were performed for three levels of
analyte. The results of this study are summarized in Table 10.4.2. The
percentage relative standard deviation (RSD, %) values were ≤ 2.86% (intra-
day) and ≤ 3.56% (inter-day) indicating good precision of the methods.
Accuracy was evaluated as percentage relative error (RE, %) between the
0
0.2
0.4
0.6
0.8
0 50 100 150 200
Abs
orba
nce
Concentration of QTF, µg ml-1
0
0.2
0.4
0.6
0.8
1
1.2
0 20 40 60 80
Abs
orba
nce
Concentration of QTF, µg ml-1
424
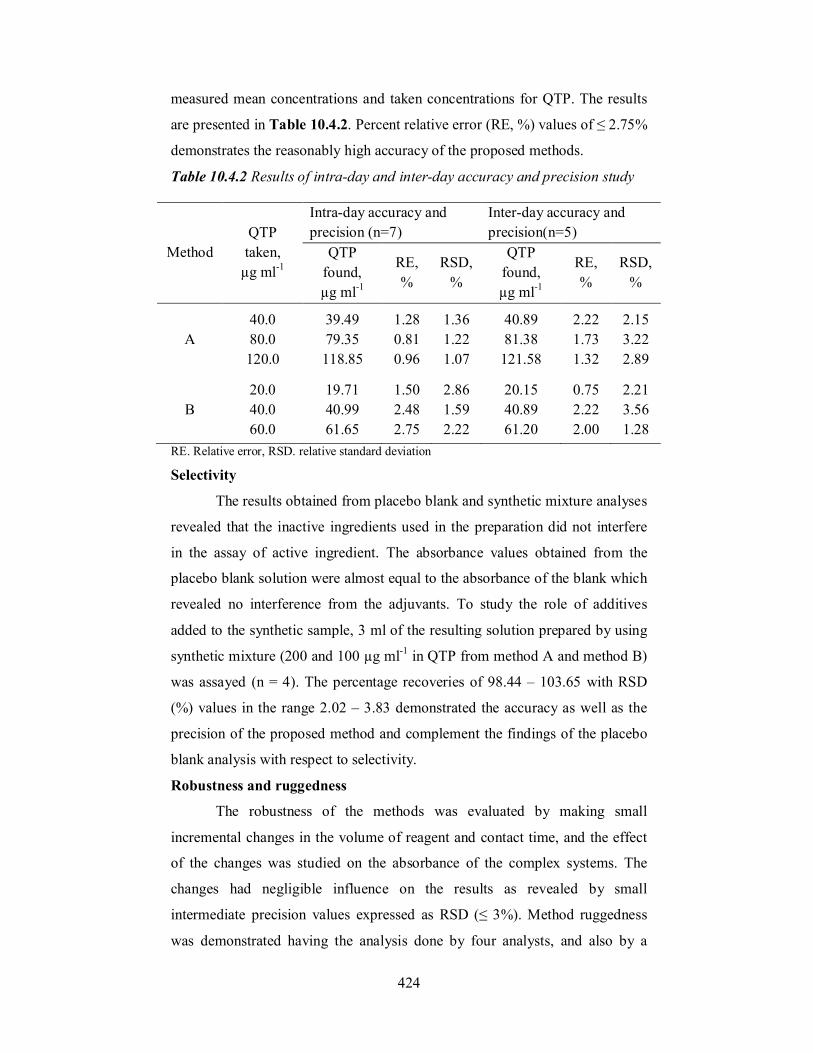
measured mean concentrations and taken concentrations for QTP. The results
are presented in Table 10.4.2. Percent relative error (RE, %) values of ≤ 2.75%
demonstrates the reasonably high accuracy of the proposed methods.
Table 10.4.2 Results of intra-day and inter-day accuracy and precision study
RE. Relative error, RSD. relative standard deviation
Selectivity
The results obtained from placebo blank and synthetic mixture analyses
revealed that the inactive ingredients used in the preparation did not interfere
in the assay of active ingredient. The absorbance values obtained from the
placebo blank solution were almost equal to the absorbance of the blank which
revealed no interference from the adjuvants. To study the role of additives
added to the synthetic sample, 3 ml of the resulting solution prepared by using
synthetic mixture (200 and 100 µg ml-1 in QTP from method A and method B)
was assayed (n = 4). The percentage recoveries of 98.44 – 103.65 with RSD
(%) values in the range 2.02 – 3.83 demonstrated the accuracy as well as the
precision of the proposed method and complement the findings of the placebo
blank analysis with respect to selectivity.
Robustness and ruggedness
The robustness of the methods was evaluated by making small
incremental changes in the volume of reagent and contact time, and the effect
of the changes was studied on the absorbance of the complex systems. The
changes had negligible influence on the results as revealed by small
intermediate precision values expressed as RSD (≤ 3%). Method ruggedness
was demonstrated having the analysis done by four analysts, and also by a
Method QTP taken,
µg ml-1
Intra-day accuracy and precision (n=7)
Inter-day accuracy and precision(n=5)
QTP found, µg ml-1
RE, %
RSD, %
QTP found, µg ml-1
RE, %
RSD, %
A 40.0 80.0 120.0
39.49 79.35 118.85
1.28 0.81 0.96
1.36 1.22 1.07
40.89 81.38
121.58
2.22 1.73 1.32
2.15 3.22 2.89
B 20.0 40.0 60.0
19.71 40.99 61.65
1.50 2.48 2.75
2.86 1.59 2.22
20.15 40.89 61.20
0.75 2.22 2.00
2.21 3.56 1.28

425
single analyst performing analysis on four different instruments in the same
laboratory. Intermediate precision values (RSD, %) in both instances were in
the range 1.99 – 3.26% indicating acceptable ruggedness. The results are
presented in Table 10.4.3.
Table 10.4.3 Results of method robustness and ruggedness study expressed as intermediate precision (RSD, %)
Method QTP taken,
µg ml-1
Robustness Ruggedness Parameters altered Inter-
analysts (RSD, %),
(n=4)
Inter-instruments (RSD, %),
(n=4)
Volume of p-CAA/DDQ*
(RSD, %)
Reaction timeΨ
(RSD,%)
A 40.0 80.0 120.0
1.85 1.44 0.98
1.56 1.88 2.31
2.89 3.21 2.56
3.26 3.10 2.56
B 20.0 40.0 60.0
1.12 1.59 1.78
2.22 2.11 1.89
2.88 2.45 2.22
1.99 2.51 2.31
*The volumes of p-CAA or DDQ added were 1±0.2 ΨThe reaction times were 5±1 min
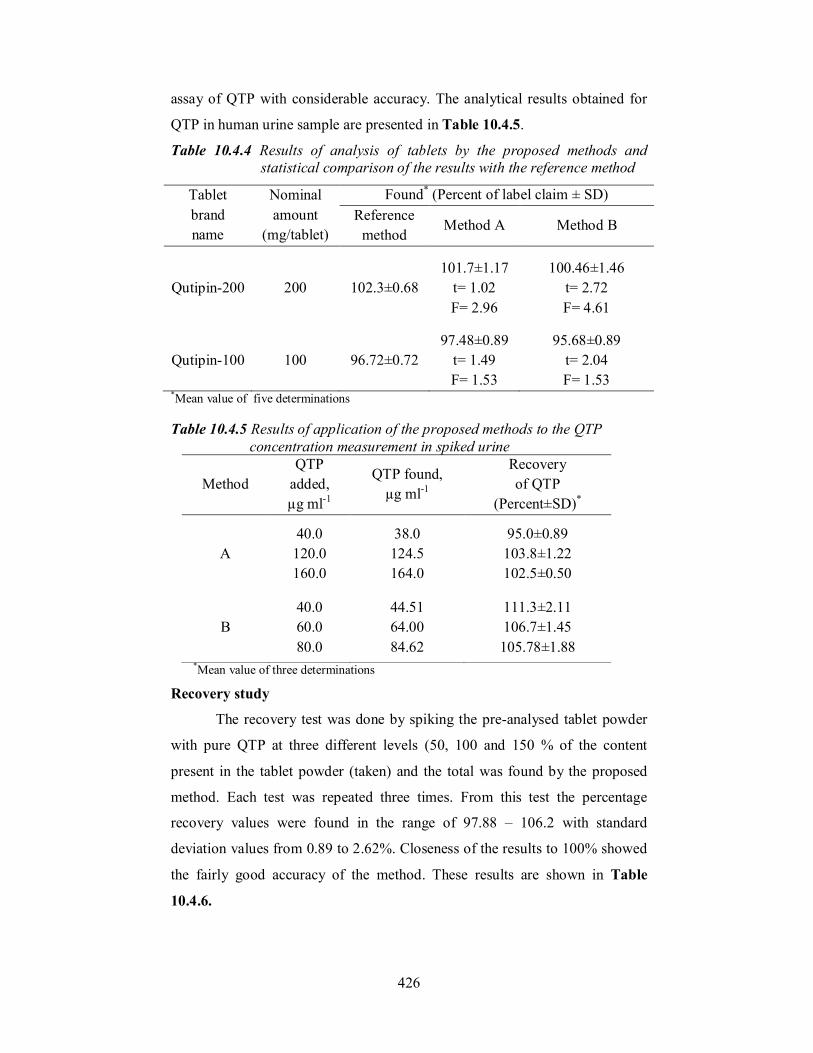
Application to tablets
The proposed methods were applied to the quantification of QTP in
commercial tablets. The results obtained were compared with those obtained
using a conventional UV-spectrophotometric method [11]. Statistical analysis
of the results did not detect any significant difference in the performance of the
proposed method to the reference method with respect to accuracy and
precision as revealed by the Student’s t-value and variance ratio F-value [48].
The results of this study are given in Table 10.4.4.
Application to spiked human urine
The proposed methods were applied to the determination of QTP in
spiked human urine by following the general procedures described above. The
recovery of the drug from spiked urine analysis was calculated by triplicate
analysis of urine sample (containing 40, 120 and 160 µg ml-1 QTP and 40, 60
and 80 µg ml-1 QTP in method A and method B, respectively) separately. The
percentage recovery values of 95.0 – 111.3 with standard deviation 0.5 –
2.11% showed the non-interference of other materials present in urine to the
426
assay of QTP with considerable accuracy. The analytical results obtained for
QTP in human urine sample are presented in Table 10.4.5.
Table 10.4.4 Results of analysis of tablets by the proposed methods and statistical comparison of the results with the reference method
*Mean value of five determinations Table 10.4.5 Results of application of the proposed methods to the QTP
concentration measurement in spiked urine
Method QTP
added, µg ml-1
QTP found, µg ml-1
Recovery of QTP
(Percent±SD)*
A 40.0
120.0 160.0
38.0 124.5 164.0
95.0±0.89 103.8±1.22 102.5±0.50
B 40.0 60.0 80.0
44.51 64.00 84.62
111.3±2.11 106.7±1.45 105.78±1.88
*Mean value of three determinations
Recovery study
The recovery test was done by spiking the pre-analysed tablet powder
with pure QTP at three different levels (50, 100 and 150 % of the content
present in the tablet powder (taken) and the total was found by the proposed
method. Each test was repeated three times. From this test the percentage
recovery values were found in the range of 97.88 – 106.2 with standard
deviation values from 0.89 to 2.62%. Closeness of the results to 100% showed
the fairly good accuracy of the method. These results are shown in Table
10.4.6.
Tablet brand name
Nominal amount
(mg/tablet)
Found* (Percent of label claim ± SD) Reference
method Method A Method B
Qutipin-200 200 102.3±0.68 101.7±1.17
t= 1.02 F= 2.96
100.46±1.46 t= 2.72 F= 4.61
Qutipin-100 100 96.72±0.72 97.48±0.89
t= 1.49 F= 1.53
95.68±0.89 t= 2.04 F= 1.53
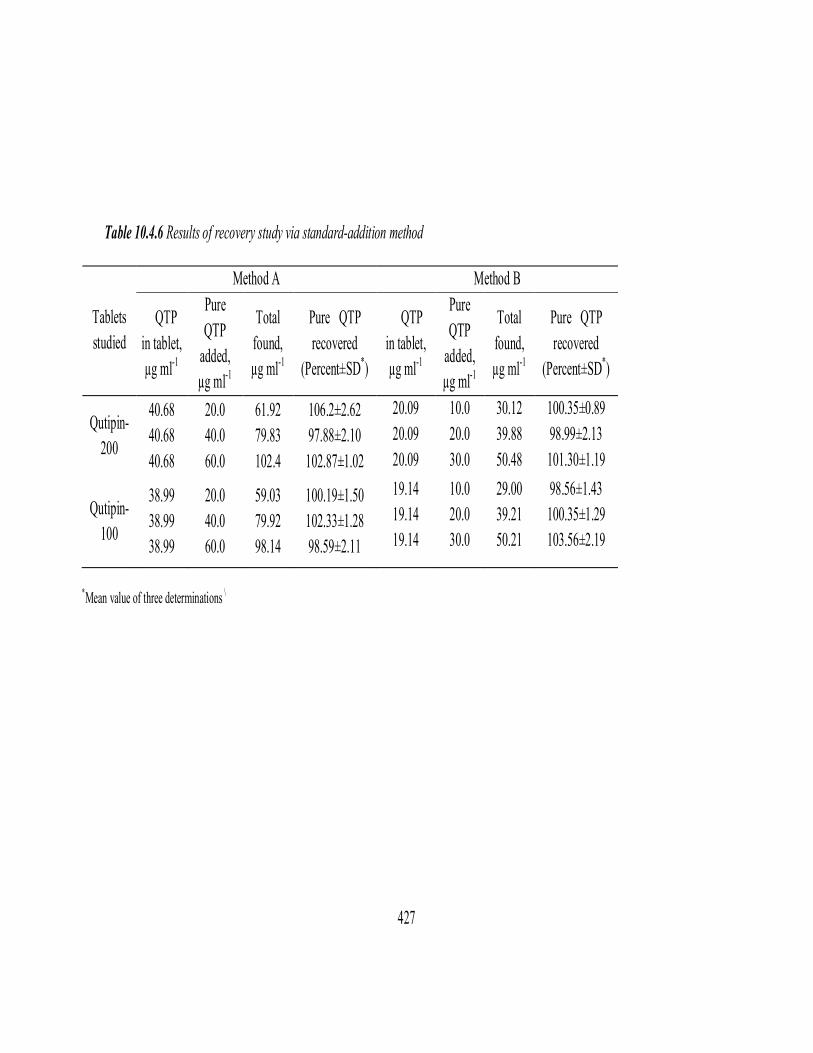
427
Table 10.4.6 Results of recovery study via standard-addition method
*Mean value of three determinations \
Tablets studied
Method A Method B
QTP in tablet, µg ml-1
Pure QTP
added, µg ml-1
Total found, µg ml-1
Pure QTP recovered
(Percent±SD*)
QTP in tablet, µg ml-1
Pure QTP
added, µg ml-1
Total found, µg ml-1
Pure QTP recovered
(Percent±SD*)
Qutipin-200
40.68 40.68 40.68
20.0 40.0 60.0
61.92 79.83 102.4
106.2±2.62 97.88±2.10 102.87±1.02
20.09 20.09 20.09
10.0 20.0 30.0
30.12 39.88 50.48
100.35±0.89 98.99±2.13 101.30±1.19
Qutipin-100
38.99 38.99 38.99
20.0 40.0 60.0
59.03 79.92 98.14
100.19±1.50 102.33±1.28 98.59±2.11
19.14 19.14 19.14
10.0 20.0 30.0
29.00 39.21 50.21
98.56±1.43 100.35±1.29 103.56±2.19
428
Section 10.5
SUMMARY AND CONCLUSIONS -Assessment of the methods
A simple, rapid and accurate potentiometric method with best performance
parameters when compared to existing titrimetric methods was developed for the
assay of QTF (Section 10.1). The method could be successfully applied to the
determination over 2-20 mg of QTF which shows broad applicability of the
method to the tablets. Considering the results obtained, it is possible to affirm that
the method is rapid, selective, accurate and precise and hence suitable for the
determination of QTF in tablets. The proposed method has the distinct advantages
over the existing methods in terms of simplicity of technique and ease of
performance and does not need expensive and highly sophisticate equipment or
high-cost organic solvents. The titration can be carried out with precision and
accuracy comparable to those obtained with aqueous titrations. Hence, the method
can be used in routine analysis in pharmaceutical quality control laboratories.
The author has also developed a reversed phase high performance liquid
chromatographic procedure (Section 10.2) for the assay of QTF in
pharmaceuticals and spiked human urine sample. This is the first ever reported
method which could be applied to determine QTF in human urine sample. Most of
the reported chromatographic methods are applicable to body fluids and only
couple of them to tablets, except GC, no methods were used for the assay of QTF
in human urine. The proposed method is fast and feasible. The method uses a
simple mobile phase compared to the multi-component mobile phases in many
reported methods. The separation and determination were achieved at ambient
temperature. This itself offers the advantages of low column back pressure, good
peak shape, improved column efficiency, higher theoretical plates and consistent
retention time. The method is applicable over the concentration range 0.09 - 18 µg
ml-1 with LOQ and LOD values of 0.09 and 0.03 µg ml-1, respectively. This
clearly indicates that amount of QTF down to 0.09 µg ml-1 can be detected in
urine. Hence, proposed procedure was successfully applied for the assay of QTF
in spiked human urine without any interference from other products present in the
urine and it seems to be very promising for the therapeutic drug monitoring of
patients undergoing chronic treatment with QTF.
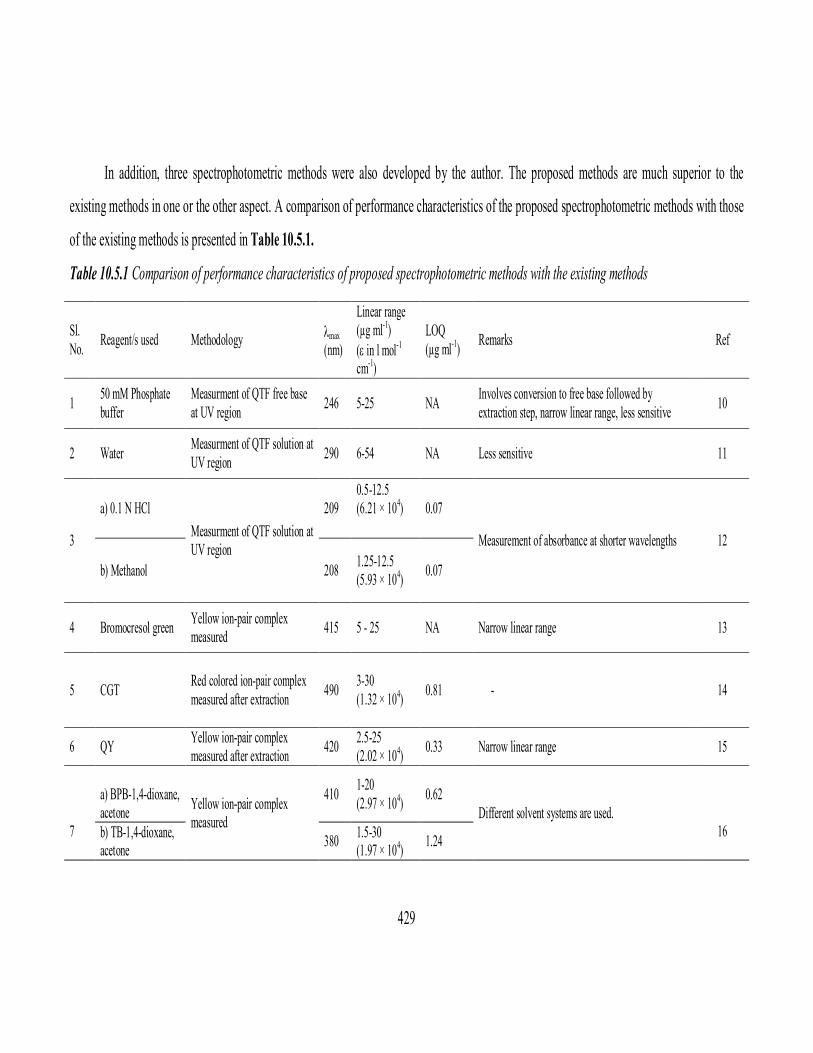
429
In addition, three spectrophotometric methods were also developed by the author. The proposed methods are much superior to the
existing methods in one or the other aspect. A comparison of performance characteristics of the proposed spectrophotometric methods with those
of the existing methods is presented in Table 10.5.1.
Table 10.5.1 Comparison of performance characteristics of proposed spectrophotometric methods with the existing methods
Sl. No. Reagent/s used Methodology max
(nm)
Linear range (µg ml-1) ( in l mol-1 cm-1)
LOQ (µg ml-1) Remarks Ref
1 50 mM Phosphate buffer
Measurment of QTF free base at UV region 246 5-25 NA Involves conversion to free base followed by
extraction step, narrow linear range, less sensitive 10
2 Water Measurment of QTF solution at UV region 290 6-54 NA Less sensitive 11
3
a) 0.1 N HCl Measurment of QTF solution at UV region
209 0.5-12.5 (6.21 × 10⁴)
0.07
Measurement of absorbance at shorter wavelengths 12
b) Methanol 208 1.25-12.5 (5.93 × 10⁴) 0.07
4 Bromocresol green Yellow ion-pair complex measured 415 5 - 25 NA Narrow linear range 13
5 CGT Red colored ion-pair complex measured after extraction 490 3-30
(1.32 × 10⁴) 0.81 - 14
6 QY Yellow ion-pair complex measured after extraction 420 2.5-25
(2.02 × 10⁴) 0.33 Narrow linear range 15
7
a) BPB-1,4-dioxane, acetone Yellow ion-pair complex
measured
410 1-20 (2.97 × 10⁴) 0.62
Different solvent systems are used.
16 b) TB-1,4-dioxane, acetone 380 1.5-30
(1.97 × 10⁴) 1.24
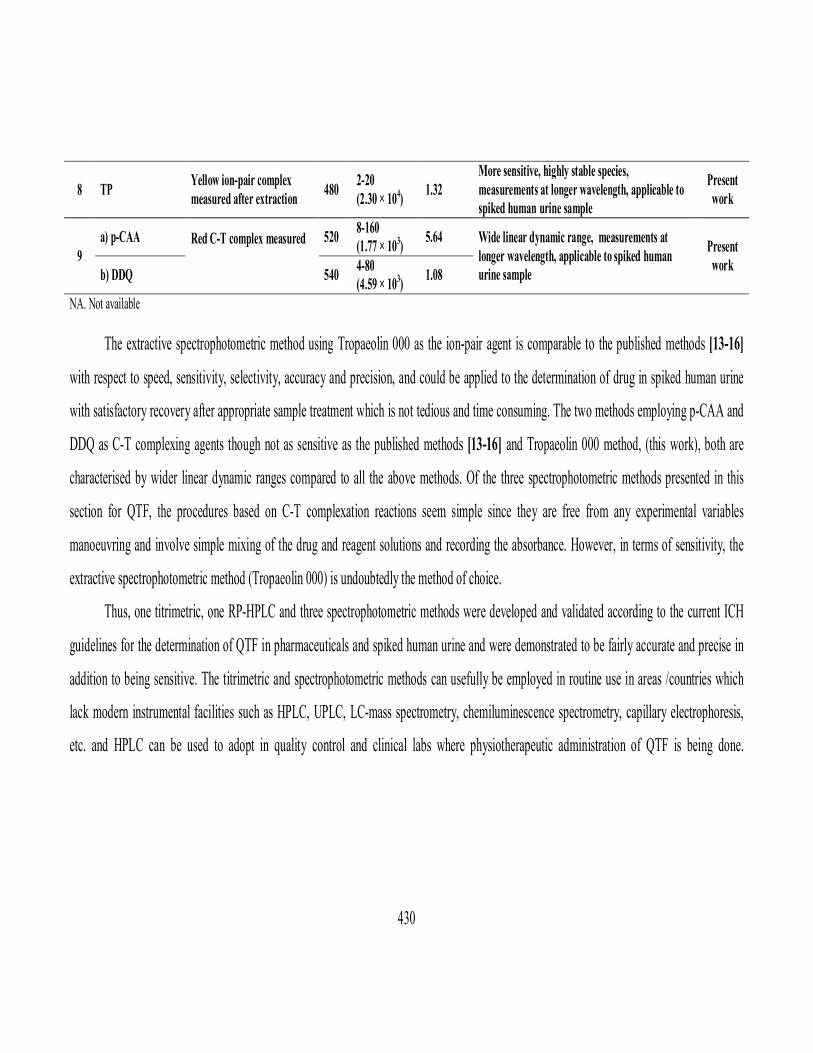
430
NA. Not available
The extractive spectrophotometric method using Tropaeolin 000 as the ion-pair agent is comparable to the published methods [13-16]
with respect to speed, sensitivity, selectivity, accuracy and precision, and could be applied to the determination of drug in spiked human urine
with satisfactory recovery after appropriate sample treatment which is not tedious and time consuming. The two methods employing p-CAA and
DDQ as C-T complexing agents though not as sensitive as the published methods [13-16] and Tropaeolin 000 method, (this work), both are
characterised by wider linear dynamic ranges compared to all the above methods. Of the three spectrophotometric methods presented in this
section for QTF, the procedures based on C-T complexation reactions seem simple since they are free from any experimental variables
manoeuvring and involve simple mixing of the drug and reagent solutions and recording the absorbance. However, in terms of sensitivity, the
extractive spectrophotometric method (Tropaeolin 000) is undoubtedly the method of choice.
Thus, one titrimetric, one RP-HPLC and three spectrophotometric methods were developed and validated according to the current ICH
guidelines for the determination of QTF in pharmaceuticals and spiked human urine and were demonstrated to be fairly accurate and precise in
addition to being sensitive. The titrimetric and spectrophotometric methods can usefully be employed in routine use in areas /countries which
lack modern instrumental facilities such as HPLC, UPLC, LC-mass spectrometry, chemiluminescence spectrometry, capillary electrophoresis,
etc. and HPLC can be used to adopt in quality control and clinical labs where physiotherapeutic administration of QTF is being done.
8 TP Yellow ion-pair complex measured after extraction 480 2-20
(2.30 × 10⁴) 1.32 More sensitive, highly stable species, measurements at longer wavelength, applicable to spiked human urine sample
Present work
9 a) p-CAA Red C-T complex measured
520 8-160
(1.77 × 10³) 5.64 Wide linear dynamic range, measurements at longer wavelength, applicable to spiked human urine sample
Present work b) DDQ 540 4-80
(4.59 × 10³) 1.08
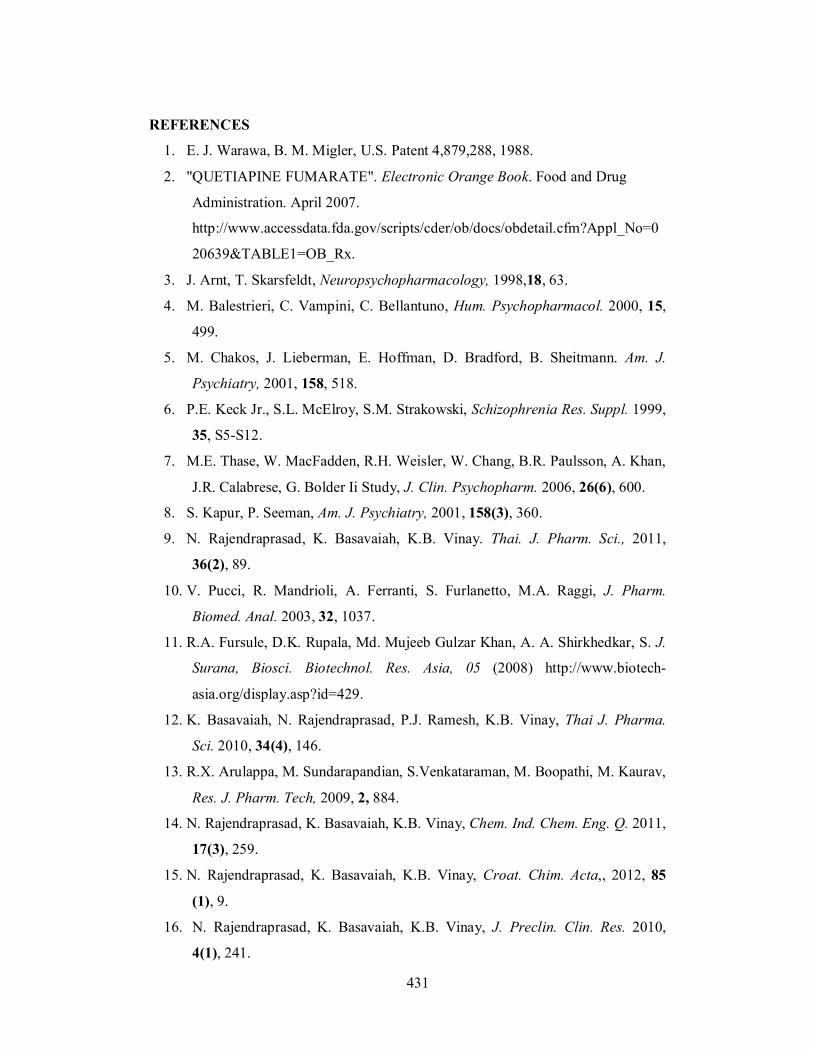
431
REFERENCES
1. E. J. Warawa, B. M. Migler, U.S. Patent 4,879,288, 1988.
2. "QUETIAPINE FUMARATE". Electronic Orange Book. Food and Drug
Administration. April 2007.
http://www.accessdata.fda.gov/scripts/cder/ob/docs/obdetail.cfm?Appl_No=0
20639&TABLE1=OB_Rx.
3. J. Arnt, T. Skarsfeldt, Neuropsychopharmacology, 1998,18, 63.
4. M. Balestrieri, C. Vampini, C. Bellantuno, Hum. Psychopharmacol. 2000, 15,
499.
5. M. Chakos, J. Lieberman, E. Hoffman, D. Bradford, B. Sheitmann. Am. J.
Psychiatry, 2001, 158, 518.
6. P.E. Keck Jr., S.L. McElroy, S.M. Strakowski, Schizophrenia Res. Suppl. 1999,
35, S5-S12.
7. M.E. Thase, W. MacFadden, R.H. Weisler, W. Chang, B.R. Paulsson, A. Khan,
J.R. Calabrese, G. Bolder Ii Study, J. Clin. Psychopharm. 2006, 26(6), 600.
8. S. Kapur, P. Seeman, Am. J. Psychiatry, 2001, 158(3), 360.
9. N. Rajendraprasad, K. Basavaiah, K.B. Vinay. Thai. J. Pharm. Sci., 2011,
36(2), 89.
10. V. Pucci, R. Mandrioli, A. Ferranti, S. Furlanetto, M.A. Raggi, J. Pharm.
Biomed. Anal. 2003, 32, 1037.
11. R.A. Fursule, D.K. Rupala, Md. Mujeeb Gulzar Khan, A. A. Shirkhedkar, S. J.
Surana, Biosci. Biotechnol. Res. Asia, 05 (2008) http://www.biotech-
asia.org/display.asp?id=429.
12. K. Basavaiah, N. Rajendraprasad, P.J. Ramesh, K.B. Vinay, Thai J. Pharma.
Sci. 2010, 34(4), 146.
13. R.X. Arulappa, M. Sundarapandian, S.Venkataraman, M. Boopathi, M. Kaurav,
Res. J. Pharm. Tech, 2009, 2, 884.
14. N. Rajendraprasad, K. Basavaiah, K.B. Vinay, Chem. Ind. Chem. Eng. Q. 2011,
17(3), 259.
15. N. Rajendraprasad, K. Basavaiah, K.B. Vinay, Croat. Chim. Acta,, 2012, 85
(1), 9.
16. N. Rajendraprasad, K. Basavaiah, K.B. Vinay, J. Preclin. Clin. Res. 2010,
4(1), 241.
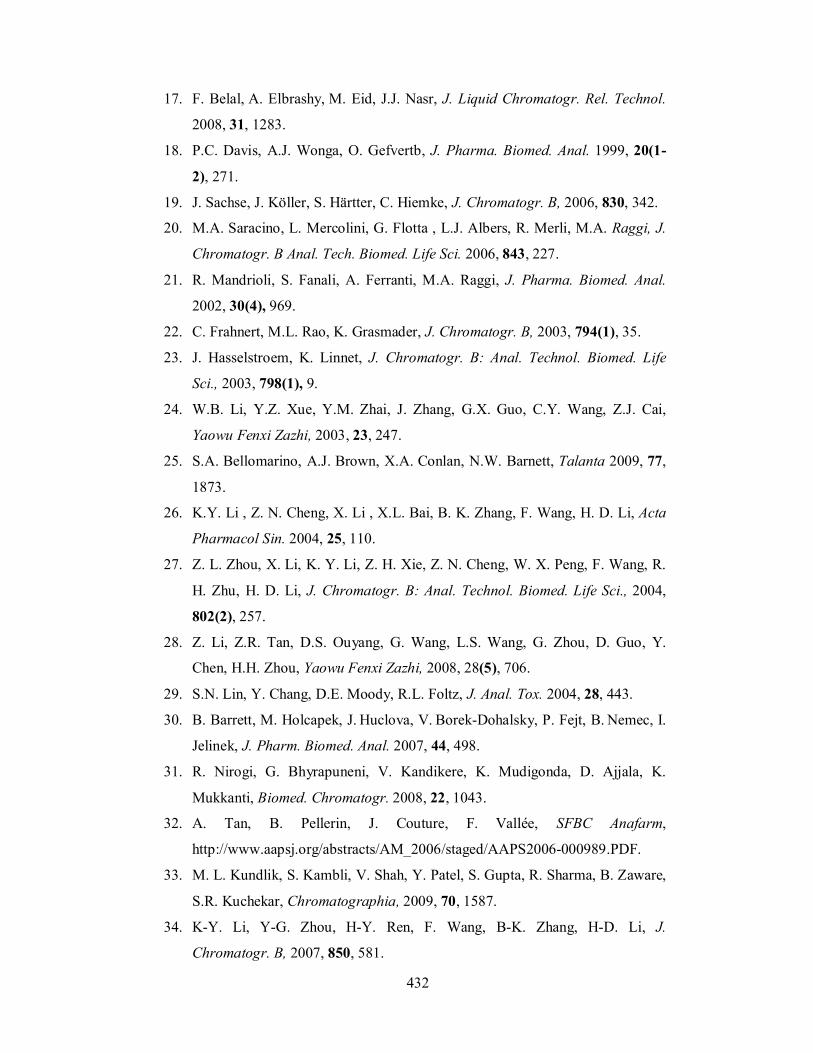
432
17. F. Belal, A. Elbrashy, M. Eid, J.J. Nasr, J. Liquid Chromatogr. Rel. Technol.
2008, 31, 1283.
18. P.C. Davis, A.J. Wonga, O. Gefvertb, J. Pharma. Biomed. Anal. 1999, 20(1-
2), 271.
19. J. Sachse, J. Köller, S. Härtter, C. Hiemke, J. Chromatogr. B, 2006, 830, 342.
20. M.A. Saracino, L. Mercolini, G. Flotta , L.J. Albers, R. Merli, M.A. Raggi, J.
Chromatogr. B Anal. Tech. Biomed. Life Sci. 2006, 843, 227.
21. R. Mandrioli, S. Fanali, A. Ferranti, M.A. Raggi, J. Pharma. Biomed. Anal.
2002, 30(4), 969.
22. C. Frahnert, M.L. Rao, K. Grasmader, J. Chromatogr. B, 2003, 794(1), 35.
23. J. Hasselstroem, K. Linnet, J. Chromatogr. B: Anal. Technol. Biomed. Life
Sci., 2003, 798(1), 9.
24. W.B. Li, Y.Z. Xue, Y.M. Zhai, J. Zhang, G.X. Guo, C.Y. Wang, Z.J. Cai,
Yaowu Fenxi Zazhi, 2003, 23, 247.
25. S.A. Bellomarino, A.J. Brown, X.A. Conlan, N.W. Barnett, Talanta 2009, 77,
1873.
26. K.Y. Li , Z. N. Cheng, X. Li , X.L. Bai, B. K. Zhang, F. Wang, H. D. Li, Acta
Pharmacol Sin. 2004, 25, 110.
27. Z. L. Zhou, X. Li, K. Y. Li, Z. H. Xie, Z. N. Cheng, W. X. Peng, F. Wang, R.
H. Zhu, H. D. Li, J. Chromatogr. B: Anal. Technol. Biomed. Life Sci., 2004,
802(2), 257.
28. Z. Li, Z.R. Tan, D.S. Ouyang, G. Wang, L.S. Wang, G. Zhou, D. Guo, Y.
Chen, H.H. Zhou, Yaowu Fenxi Zazhi, 2008, 28(5), 706.
29. S.N. Lin, Y. Chang, D.E. Moody, R.L. Foltz, J. Anal. Tox. 2004, 28, 443.
30. B. Barrett, M. Holcapek, J. Huclova, V. Borek-Dohalsky, P. Fejt, B. Nemec, I.
Jelinek, J. Pharm. Biomed. Anal. 2007, 44, 498.
31. R. Nirogi, G. Bhyrapuneni, V. Kandikere, K. Mudigonda, D. Ajjala, K.
Mukkanti, Biomed. Chromatogr. 2008, 22, 1043.
32. A. Tan, B. Pellerin, J. Couture, F. Vallée, SFBC Anafarm,
http://www.aapsj.org/abstracts/AM_2006/staged/AAPS2006-000989.PDF.
33. M. L. Kundlik, S. Kambli, V. Shah, Y. Patel, S. Gupta, R. Sharma, B. Zaware,
S.R. Kuchekar, Chromatographia, 2009, 70, 1587.
34. K-Y. Li, Y-G. Zhou, H-Y. Ren, F. Wang, B-K. Zhang, H-D. Li, J.
Chromatogr. B, 2007, 850, 581.
433
35. J.Y. Tu, P. Xu, D.H. Xu, H.D Li, Chromatographia 2008, 68, 525.
36. M.M. McMullin, Ther. Drug Monit. 1999, 21(4), 459.
37. V.N. Atanasov, K.P. Kanev, M.I. Mitewa, Central Europ. J. Med. 2008, 3,
327.
38. B. Dhandapani, A. Somasundaram, S.H. Raseed, M. Raja, K. Dhanabal, Int. J.
PharmTech Res. 2009, 1, 139.
39. R. Skibiński, Ł. Komsta, I. Kosztyła, J. Planar Chromatogr. Modern TLC,
2008, 21, 289.
40. S.R. Dhaneshwar, N.G. Patre, M.V. Mahadik, Acta Chromatographica 2009,
21, 83.
41. S. Radha Krishna, B.M. Rao, N. Someswara Rao, Rasayan J. Chem. 2008, 1,
466.
42. C.H. Bharathi, K.J. Prabahar, C.H.S. Prasad, M. Srinivasa Rao, G.N.
Trinadhachary, V. K. Handa, R. Dandala, A. Naidu, Pharmazie 2008, 63, 14.
43. I.V.S. Raju, P. Raghuram, J. Sriramulu, Chromatographia 2009, 70, 545.
44. S.A. Ozkan, B. Dogan, B. Uslu, Microchim. Acta, 2006, 153, 27.
45. S. Hillaert, L. Snoeck, W. van den Bossche, J. Chromatogr. 2004, 1033, 357.
46. N. El-Enany, A. El-Brashy, F. Belal, N. El-Bahay, Port. Electrochim. Acta,
2009, 27, 113.
47. R.N. Jiri Kucharski, L.A. Safarik, Text Book of “Titrations In Non-Aqueous
Solvents”, Elsevier Publishing Company, Amsterdam-London-New York,
1965, p-94.
48. J. Inczedy, T. Lengyel, A.M. Ure, IUPAC Compendium of Analytical
Nomenclature: Definitive Rules, Blackwell Science Inc, Boston 1998.
49. Guidance for Industry Bioanalytical Method Validation, US department of
Health and Human Services. Food and Drug administration Centre for Drug
Evaluation and Research. Rockville, MD, May, (2001),
http://www.fda.gov/eder/guidance/4252fnl.pdf.
50. W.C. Vocburgh, G.R. Cooper, J. Amer. Chem. Soc. 1941, 63, 437.
51. H. Zavis, D. Ludvik, K. Milan, S. Ladislaw, Frantisck, V. Handbook of
Organic Reagents in Inorganic Analysis. Translated by Stanislav, K, Dr.
Chalmers (The Series and Translation Editor: University of Aberdem, Ellis
Horwood Limited, Chichester, A Division of John Wiley & Sons IC, New
York, London, Sydney, Toronto. 1976, pp.364.

434
52. M. Walash, M.S-E. Din, M. E-S. Metwalli, M. Redashabana, Arch. Pharm.
Res., 2004, 27(7), 720.
53. M.E. Abdel-Hamid, M.A. Abuirjeie, Talanta, 1988, 35, 242.
54. N. Rahman, Md.N. Hoda, J. Pharm. Biomed. Anal. 2003, 31, 381.
55. J. Rose, Advanced Physico-chemical Experiments, Pitman and Sons, London,
1964, pp. 67.