Embed Size (px)
Citation preview
TVET research
STUDY ON EFFECTIVENESS OF TRAINING LEARNING
PRACTICES IN VOCATIONAL TRAINING CENTERS IN
SRI LANKA
(WITH SPECIAL REFERENCE TO THE NORTH WESTERN
PROVINCE)
Group No .08 (VTA & DTET)
(1) Mr. H.M.S. Jayathilake (Team Leader), Training Officer, VTA – Kurunegala,
(2) S.W.M.P.N. Wanninayake(Team Member), Training Officer, VTA - Maravila
(3) L.H.M.S. Bandara(Team Member), Instructor (English), Technical College - Anamaduwa
1
ABSTRACT
This study scopes at the effectiveness of training learning practices in vocational training
centers in VTASL. A questionnaire was the major research tool of this study. It was based on
the perception of students’ satisfaction on teaching learning practices of VTASL . A student
sample of 250 and a teachers’ sample of 50 were used for this study. The mirror questions were
asked from both students and the teachers. The answers were on a Likert scale which varies
from 0 to 4. The date interpretation was on both mean value and the standard deviation. To
calibrate data interpretation, frank ideas of five teachers and five students taken by an interview
were mentioned at the data analysis part. Questionnaires were based on 5 customer quality
dimensions developed by Valary A Seithmal; reliability, responsiveness, tangibility, empathy
and assurance.25 questions were asked in the questionnaire as 5 questions per each dimension.
According to the results of data analysis, it was obvious that the mean value of responses of
both the students and the teachers are highly satisfied or very highly satisfied for the indicators
that were considered to prepare the questionnaire. The standard deviation is also less than one
in almost all occasions apart from few instances. This result implies that the teaching learning
practices of VTASL are highly effective. But, with observations and individual discussions
with teachers and students , it was evident that there is a lack of materials , equipment and
improper classroom conditions. So, this research suggests to proceed the ongoing training
learning practices of VTASL fulfilling physical facilities including training materials,
equipment and maintaining proper classrooms environments.
2

CONTENTS
CHAPTER ONE......................................................................................................................................8
INTRODUCTION....................................................................................................................................8
1.1 INTRODUCTION TO RESEARCH........................................................................................8
1.2 RESEARCH PROBLEM..........................................................................................................8
1.3 RESEARCH QUESTION.......................................................................................................9
1.4 RESEARCH OBJECTIVES......................................................................................................9
1.5 RESEARCH HYPOTHESIS.....................................................................................................9
1.6 SIGNIFICANCE OF THE PRESENT RESEARCH...............................................................10
1.8 LIMITATIONS AND DELIMITATIONS..............................................................................10
1.9 METHODS OF DATA COLLECTION..................................................................................10
1.10 SCOPE AND THE COVERAGE............................................................................................10
1.11 POPULATION AND SAMPLE FRAME...............................................................................11
CHAPTER TWO..................................................................................................................................12
LITERATURE REVIEW....................................................................................................................12
2.1 INTRODUCTION..................................................................................................................12
2.2 THEORETICAL BACKGROUND...............................................................................................12
2.2.1 SERVICES.............................................................................................................................13
2.2.2 SERVICE QUALITY.............................................................................................................15
2.2.3 CUSTOMER...................................................................................................................16
2.2.4 CUSTOMER EXPECTATION.......................................................................................17
2.2.5 CUSTOMER PERCEPTION.........................................................................................19
2.2.6 CUSTOMER SATISFACTION...................................................................................21
2.2.7 CUSTOMER LOYALTY.......................................................................................................22
2.2.8 SERVICE QUALITY AND CUSTOMER SATISFACTION........................................22
2.2.9. STUDENTS AS CUSTOMERS..............................................................................................24
2.3 THEORETICAL FRAMEWORK...........................................................................................24
3
2.3.1 SERVICE QUALITY. 25
2.3.2 SERVICE QUALITY MODEL................................................................................................27
2.3.3 CUSTOMER SATISFACTION..............................................................................................34
2.3.4 SERVICE QUALITY VS CUSTOMER SATISFACTION........................................36
2.3.5 CUSTOMER LOYALTY................................................................................................38
2.4 CONCEPTUAL BACKGROUND..........................................................................................39
2.4.1 FIVE DIMENSIONS OF SERVICE QUALITY.............................................................40
2.5 CONCEPTUAL FRAMEWORK............................................................................................45
2.5.1 Reliability........................................................................................................................45
2.5.2 Responsiveness................................................................................................................46
2.5.3 Assurance........................................................................................................................46
2.5.4 Empathy.........................................................................................................................47
2.5.5 Tangibility.......................................................................................................................47
CHAPTER 3...........................................................................................................................................48
RESULTS (ANALYSIS).......................................................................................................................48
3.1 INTRODUCTION...................................................................................................................48
CHAPTER 4...........................................................................................................................................71
CONCLUSION AND RECOMMENDATIONS....................................................................................71
BIBLIOGRAPHY..................................................................................................................................73
ANNEXURE - 01..............................................................................................................................77
(QUESTIONNAIRE - FOR THE STUDENTS).................................................................................77
ANNEXURE – 2.................................................................................................................................86
(QUESTIONNAIRE FOR THE TEACHERS)...................................................................................86
4
CHAPTER ONE
INTRODUCTION
1.1 INTRODUCTION TO RESEARCH
This study scopes into the effectiveness of training learning practices in vocational training
centers in VTASL. To carry out this research, all the VTA centers in the North Western
province were selected. Out of all there centers, 250 students and 50 teachers were randomly
selected as the sample. The main research tool was a structured questionnaire which carries 25
questions. The questionnaire was based on five quality dimensions; reliability responsiveness,
assurance, empathy and tangibility and their satisfaction was assessed by the questions. The
answers of the students and teachers were scaled on the likert scale which carries five scales
from 0 to 4 (0, 1, 2, 3, 4) ; " not satisfied", " Satisfied up to some extent ", "Satisfied", "Highly
Satisfied", " Very Highly satisfied ". The data interpretation was done on mean value and the
standard deviation. As a calibration to the conclusions, two students and two teachers were
personally interviewed and their genuine ideas were also considered.
1.2 RESEARCH PROBLEM
The VTA is a leading institute in Sri Lanka in providing vocational training ,and it is honored
to be the biggest institute to provide the biggest number of NVQ certificates in Sri Lanka.
There are 254 VTA centers which cater the demand of vocational training of the youth aged
18 ; 24 island wide. Almost all the VTA centers are in the problem of lack of students for some
courses and there are complains that the students are not having higher jobs in private and
5
public sector. Moreover, at the on the job training and job placements, there are complains that
although students perform practical well, they are lack of theoretical knowledge. At the same
time, job providers complain that students have the problems of knowledge, attitudes,
interpersonal skills, communication skills, punctuality and time management etc. So, this study
will scope at how teaching learning process of VTA affect above mentioned problems which
are caused by the problems of the effectiveness.
1.3 RESEARCH QUESTION
Does the VTA Sri Lanka provide an effective teaching learning practice? .
1.4 RESEARCH OBJECTIVES
i. To study the effectiveness of training learning process of in Vocational Training
Centers in VTASL
ii. To analyze the problems caused by the effectiveness of Vocational Training
Centers in VTASL
iii. To suggest recommendations for the problems caused by the effectiveness of
Vocational Training Centers in VTASL
1.5 RESEARCH HYPOTHESIS
H 0 ; The VTA produces competent and confidence technicians regardless the
effectiveness of teaching learning process.
H 1; There is a co relation between the effectiveness of teaching learning practices in
VTA and producing competent and confidence technicians.
6
1.6 SIGNIFICANCE OF THE PRESENT RESEARCH
The findings of this research will directlybe useful for the Vocational Training Authority
(VTA) and the Ministry of skills development and vocational Training to make policies
regarding the development of VTASL.
1.8 LIMITATIONS AND DELIMITATIONS
Limitations- This research is based only on selected 25 questions under students satisfaction.
Delimitations- This method is applicable for numerous other problems that were not mentioned
in this study.
1.9 METHODS OF DATA COLLECTION
Primary data sources .
Primary data will be collected in questionnaires, interviews and observations.
Secondary data source
Secondary data will be collected from books on organizational management and data in the
VTA centers and web sited.
1.10 SCOPE AND THE COVERAGE
Scope of the present research is customer satisfaction i.e. Students’ satisfaction, in which it was
defined as satisfaction is customer's fulfillment response. It is a judgment that a product or
service feature, the product or service itself provides a pleasurable level of consumption –
related fulfillment.Coverage of the present research was confined to the factors relating to the
7
service quality.Service Quality Dimension refers to the five factor areas namely, Service
reliability, service responsiveness, assurance, empathy and tangibility.
1.11 POPULATION AND SAMPLE FRAME
The total students population for this study is 1055 which comprises of 710 students in the
Kurunegala district and 345 students in the Puttalamdistrict whereas86 total teachers
population which comprises of 52 teachers in the Kurunegala district and 34 teachers in the
Puttalama district. To carry out this research, nine VTA centers in the North Western province
were selected. These nine centres comprises of five VTA centres in the Kurunegala district and
four VTA centres in the Puttalama district. In the Kurunegala district , Saragama DVTA,
Mawathagama VTA, Dagama VTA, Udagama VTA , Hiripitiya VTA were taken into this
study whereas Polgahawea VTA, Bingiruya VTA, Hettipola VTA, centers were not taken in to
this research because of lack of accessibility due to time constrain.
In the Puttalam district,Marawilladvta,Anamaduwa VTA, NagawilluwavtaPuttalamavtc were
considered for this study whereas Dankotuwa VTA, Marawala VTA, Muhudukatuwa VTA
were not taken into this research because of difficulty in accessibility due to time constrain. The
questionnaire was distributed among randomly selected five students in each class and almost
all the teachers present in almost all the VTA centers in the North western Province. Out of all
there centers, 250 students and 50 teachers were randomly selected as a convenient sample.
8
CHAPTER TWO
LITERATURE REVIEW
2.1 INTRODUCTION
This chapterelaborates the literature review of the present research. It comprises of four
sections; Theoretical background, Theoretical framework, Conceptual background, Conceptual
framework.
This literature review presents an overview of the service quality dimension towards customer
satisfaction ie. students’ satisfaction. All five dimensions of service quality, reliability,
responsiveness, assurance, and empathy and tangibility will be discussed. In addition, it also
discusses service quality conceptual models and issues around those models. The study has
elaborated the impact of the quality dimensions of services towards quality of study programs
offered by technical colleges in Sri Lanka.
Literature which is related to this study has been surveyed and reviewed to describe the
dependent variable and impact of independent variables towards the dependent variable.
Researcher attempts to find literature through larger volume of text books, journals, magazines,
different academic points of views and some other sources like internet etc.
2.2 THEORETICAL BACKGROUND
This section describes the scope of the study. Scope of the study means it describes the
dependent variable. An extensive range of literature over the last years has examined the
9
concept of customer satisfaction in order to fulfill the customer perceptions about service
quality.
2.2.1 SERVICES
Service is very complex and about economic activities which is giving benefits to both
customer and the company. Service is also described as the performance of service providers.
When customers expect some value from this purchase besides the exchanging the ownership
there comes many value related elements such as time, price and delivery process. (Lovelock,
2007)
Services are deeds, processes, and performances provided by one entity or person for another
entity or person (Zeithaml, 2013). A service is an any activity or a benefit that one party can
offer to another which is essentially intangible and does not result in the ownership of anything
(Kotler, 2013).
A set of characteristics that meet the client’s needs, strengthen the links between the
organization and them, and enhance the clients’ value as well. (Walfried, et. al, 2000)
One of the most basic concepts in service marketing is the marketing mix, defined as the
elements an organization controls that can be used to satisfy or communicate with customers.
(Zeithaml, 2013).Traditionally, marketing mix consists of four components; commonly called
four P's. They are Product, Place, Promotion and Price. Because services are usually produced
and consumed simultaneously, customers are often present in the firm's factory, interact directly
with the firm's personnel and are actually part of the service production process. Therefore,
traditional marketing mix can be expanded for services as 7 P's with People, Physical evidences
and Process (Johns, 1999).
10
Product
The product in service marketing mix is intangible in nature. Like physical product such as a
soap or detergent service product cannot be measured.
Place
Place in case of determine where is the service product going to be located.
Promotion
Promotions have become a critical factor in the service marketing mix. It means activities that
communicate the merits of the products and persuade target customers to buy it.
Price
Pricing in case of services more difficult than in case of products.Gennerally service pricing
involves taking into consideration labour, material cost and overhead cost. By adding a profit
mark-up you get your final service pricing. It is the amount of money customers must pay to
obtain the product.
People
People are one of the elements of service marketing mix. All human actors who play a part in
service delivery and thus influence the buyer's perception: namely, the firm’s personnel, the
customer, and other customer, and other customers in the service environment.
Physical evidence
11
As said before services are intangible in nature. However to create better customer experience
tangible elements are also delivered with the service to enhance the better customer service.
Process
Service process is the way in which the service is delivered to the end customer. The
procedures, mechanisms and flow of activities by which the service is delivered - service
delivery and operating system.
(Source: www.marketing91.com)
(Valarie A Zeithaml, 2013) (Philip kotler, 2013)
2.2.2 SERVICE QUALITY
Service quality is such an important issue that it is considered a really significant concept in
today’s business world. It is regarded as a strategic organizational weapon. Service quality has
been increasingly recognized as a critical factor in the success of any business firm
(Parasuraman al, 1988).
The manner of treating with the customers at the time of delivering service referred as service
quality. (Jaina)
Service quality is considered as the combination of different experiences through the interaction
among customer employees and organizational environment. (Jamesb, 2011)
An assessment of how well a delivered service conforms to the client’s expectations. Service
businesses operators often assess the service quality provided to their customers in order to
12
improve their service, to quickly identify problems and better assess client’s satisfaction.
(www.businessdictionary.com)
Fogli (2006) defined, service quality as global judgment or attitude relating to particular
service, the customers overall impression of the relative inferiority or superiority of the
organization and its services. Valarie Zaithml,ParsuParasuraman, and leonard have identified
five dimension of service quality through their research. They defined the five dimensions as
stated below.
Reliability : Ability to perform the promised service dependably and
accurately.
Responsiveness : Willingness to help customers and provide prompt
service.
Assurance : Employee knowledge courtesy and their ability to
inspire trust and confidence.
Empathy : Caring, individualized attention given to customers
Tangibility : Appearance of physical facilities, equipment, personnel
and communication materials
2.2.3 CUSTOMERCustomers are the most important actors in the company’s microenvironment. A customer
(sometimes known as a client, buyer or purchaser) is the recipient of a good, service, product or
idea, obtained from a seller, vendor or service provider for a monitory or other valuable
consideration. (www.wikipedia.com)
13

A party that receives or consumes goods or services has the ability to choose between different
products and suppliers. (www.businessdictionary.com)
2.2.4 CUSTOMER EXPECTATION
Customer Expectation can be defined as the customers’ wish to get the standard service from
the service providers. (RoedigerVossa , 2007)
Customer Expectations are beliefs about service delivery that serve as standards or reference
points against which performance is judged. (Zeithaml, 2013).
Customer expectation plays a vital role in customer evaluation process of services. There are
mainly two types of customer expectations. They are,
Desired Service
The level of service the customer hopes to receive from service provider. It is a blend of what
the customer believes "can be" and "should be". The following 3 factors are influenced to
desired service,
o Personal Needs
o Personal Service Philosophy
o Derived Service Expectations
Adequate Service
Adequate service is the minimum level of service the customer will accept. Following factors
are influence to the adequate service.
14
o Perceived Service Alternatives
o Situational Factors
Predicted Service
This type of services expectation can be viewed as predictions made by customers who is about
what is likely to happen during an impending transaction or exchange. In this case, level of
adequate service decreases and zones of tolerance widen.
Zone of tolerance
The extent to which customers recognize and are willing to accept the variations of
expectations is called the zone of tolerance.
If the service performance is above the zone of tolerance at the top end, where performance
exceeds desired service, customer will be very pleased and probably quite surprised as well.
If service drops below adequate service, the minimum level considered acceptable, customers
will be frustrated and most likely dissatisfied with the service.
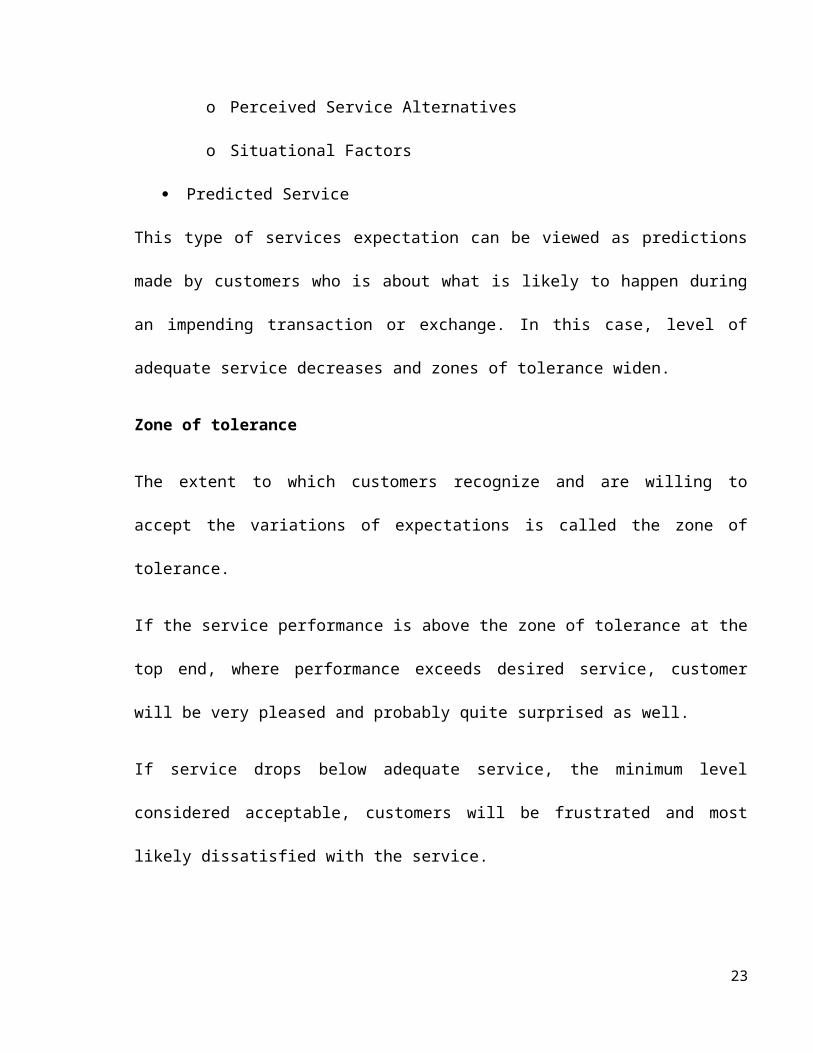
Customers do not particularly notice the service performance in the zone of tolerance range.
15
Adequate Service
Desired Service
Zone of tolerance
Figure 1: Zone of tolerance
Source :(ZeithmalParasuramanet al, 2013)
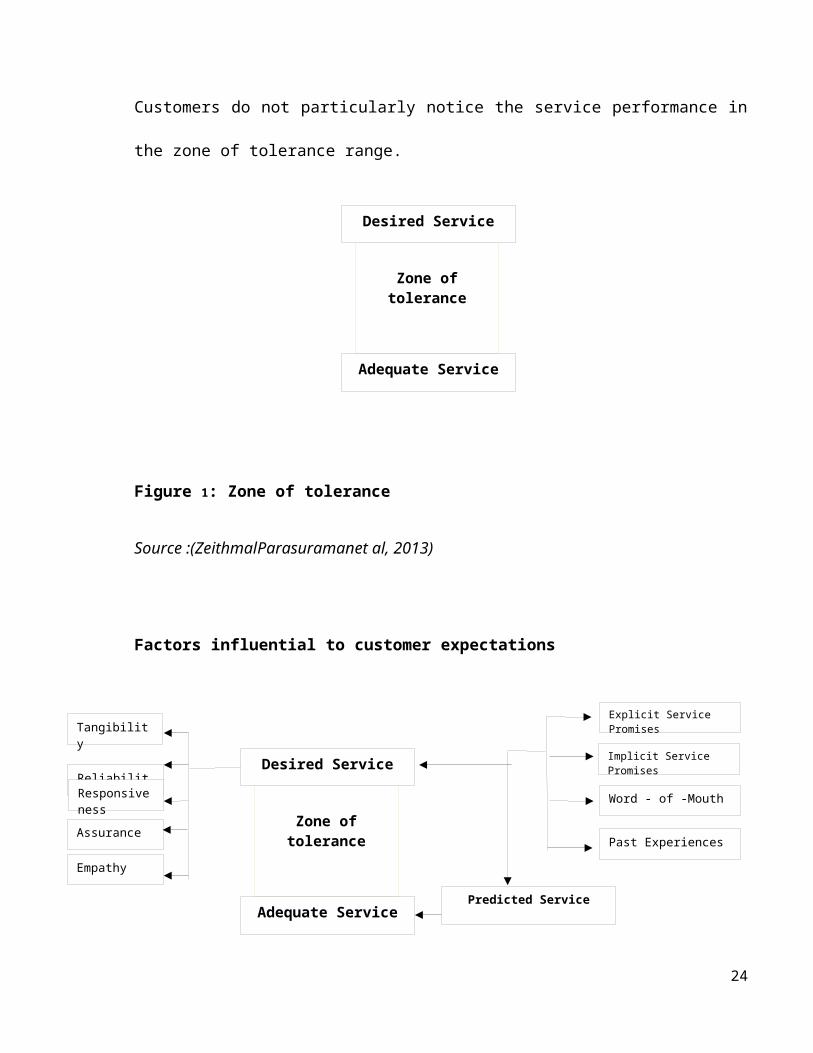
Factors influential to customer expectations
Figure 2: Illustration of factors that influences that predicted services
Source :(ZeithmalParasuramanet al, 2013)
2.2.5 CUSTOMER PERCEPTION
Customer perceptions are subjective assessment of actual service experience. Perceptions are
always considered relative to expectations because expectations are dynamic evaluations may
also shift over time, from person to person and from culture to culture.
Customers’ Expectations compared to Perceptions
16
Reliability
Responsiveness
Empathy
Assurance
Tangibility
Past Experiences
Word - of -Mouth
Implicit Service Promises
Explicit Service Promises
Predicted ServiceAdequate Service
Desired Service
Zone of tolerance
Parasuraman and Zeithmal ( 1985) have proposed that customer’s perception of service quality
is based on the comparison of their expectations (what they feel service providers should offer)
with their perceptions of the performance of the service provider.
They point out that expectation is viewed differently in both satisfaction literature and service
quality literature. In satisfaction literature, expectations are considered as ‘predictions’ by
customers about what is likely to happen during a particular transaction while in service quality
literature, they are viewed as desires or wants of consumers, that is, what they feel a service
provider ‘should’ offer rather than ‘would’ offer. It is important to understand and measure
customer’s expectations in order to identify any gaps in delivering services with quality that
could ensure satisfaction (Negi, 2009). Perceptions of customers are based solely on what they
receive from the service encounter (Douglas and Corner 2003)
Parasuraman (1985) identified 10 determinants used in evaluating service quality; reliability,
responsiveness, competence, access, courtesy, communication, credibility, security,
understanding the customer, and tangibles. Most of these determinants of service quality
require the customer to have had some experience in order to evaluate their level of service
quality ranging from ideal quality to completely unacceptable quality.
He further linked service quality to satisfaction by pointing out that when expected service is
greater than perceived service, perceived quality is less than satisfactory and will tend towards
totally unacceptable quality; when expected service equals perceived service, perceived quality
is satisfactory; when expected service is less than perceived service, perceived quality is more
than satisfactory and will tend towards ideal quality
17
2.2.6 CUSTOMER SATISFACTION
Concept of customer satisfaction has a central position in marketing as it is a major outcome of
marketing activity. Customer satisfaction has numerous definitions. Business dictionary defines
customer satisfaction as: The degree of satisfaction provided by the goods or services of a firm
as measured by the number of repeat customers. (Zeithmal, 2013). Believed that customer
satisfaction is customer evaluation on whether a product or service meets their requirements
and expectations. If the product or service fails to customer requirements and expectations, they
will feel unsatisfied. Kotler and Armstrong (1999) defined the customer satisfaction as the
customer’s perception that compares their pre-purchase expectations with post purchase
perception. In 2013 Kotler again stated as customer satisfaction depends on the products
perceived performance relative to a buyer’s expectations.
Oliver (1997) defines satisfaction as a “the consumer’s fulfillment response”, a post
consumption judgment by the consumer that a service providers a pleasing level of
consumption-related fulfillment including under over-fulfillment.
Anton [4] stated that customer satisfaction is a mental state achieved when a product or service
meets or exceeds the requirements and expectations of customers. This mental state leads to
customer repurchase and loyalty to a product or service. In today’s business world the key to
sustainable competitive advantage depends on delivering a high quality service, and ultimately
it will turn result in satisfied customers.
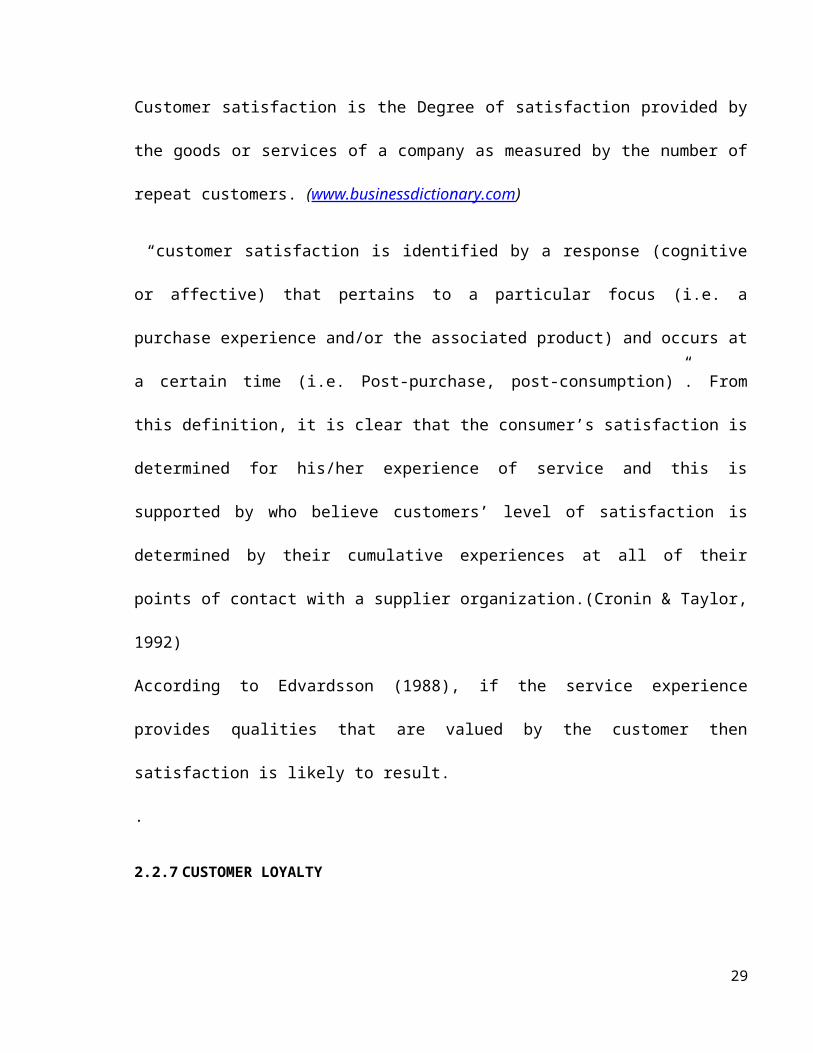
Customer satisfaction is the Degree of satisfaction provided by the goods or services of a
company as measured by the number of repeat customers. (www.businessdictionary.com)
18
“customer satisfaction is identified by a response (cognitive or affective) that pertains to a
particular focus (i.e. a purchase experience and/or the associated product) and occurs at a
certain time (i.e. Post-purchase, post-consumption)”. From this definition, it is clear that the
consumer’s satisfaction is determined for his/her experience of service and this is supported by
who believe customers’ level of satisfaction is determined by their cumulative experiences at all
of their points of contact with a supplier organization.(Cronin & Taylor, 1992)
According to Edvardsson (1988), if the service experience provides qualities that are valued by
the customer then satisfaction is likely to result.
.
2.2.7 CUSTOMER LOYALTY
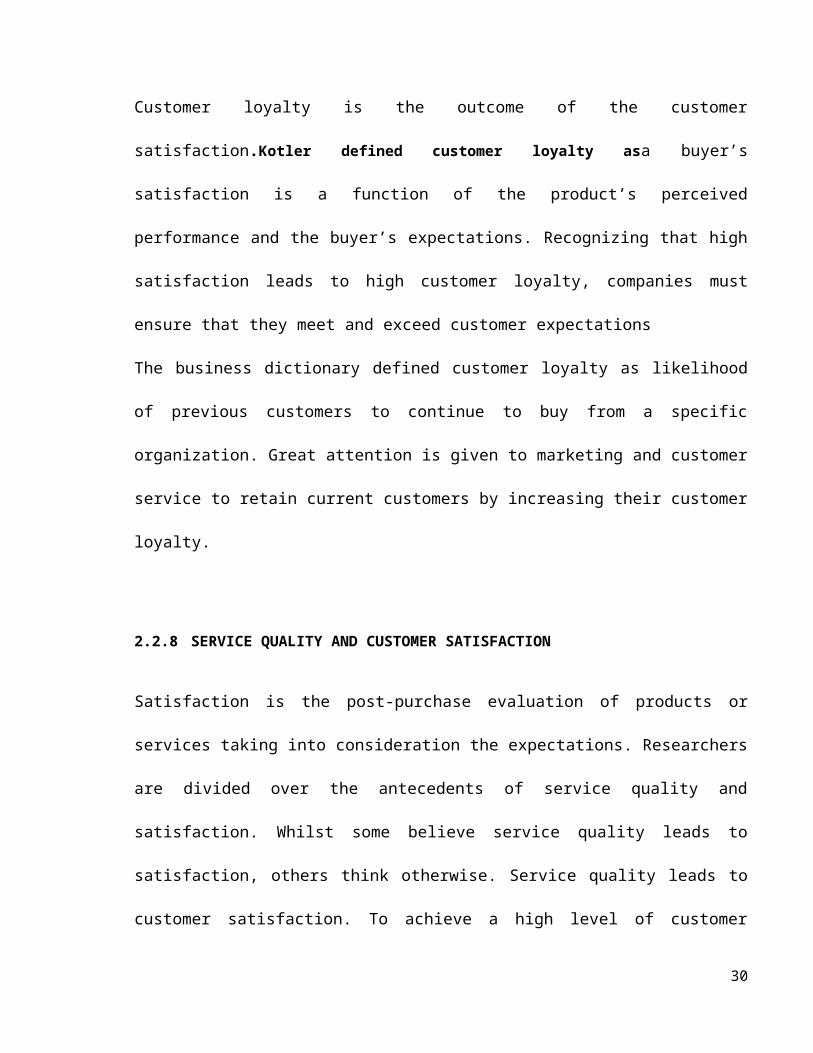
Customer loyalty is the outcome of the customer satisfaction.Kotler defined customer loyalty asa
buyer’s satisfaction is a function of the product’s perceived performance and the buyer’s
expectations. Recognizing that high satisfaction leads to high customer loyalty, companies must
ensure that they meet and exceed customer expectations
The business dictionary defined customer loyalty as likelihood of previous customers to
continue to buy from a specific organization. Great attention is given to marketing and
customer service to retain current customers by increasing their customer loyalty.
2.2.8 SERVICE QUALITY AND CUSTOMER SATISFACTION
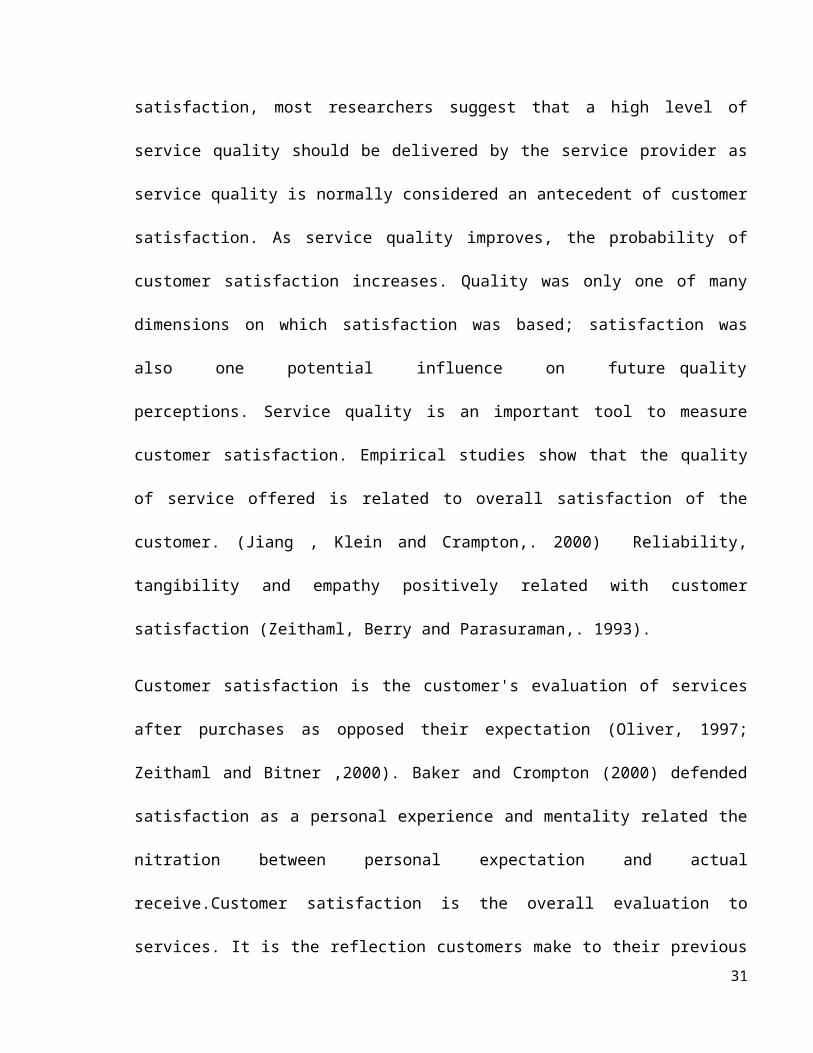
Satisfaction is the post-purchase evaluation of products or services taking into consideration the
expectations. Researchers are divided over the antecedents of service quality and satisfaction.
Whilst some believe service quality leads to satisfaction, others think otherwise. Service quality
19
leads to customer satisfaction. To achieve a high level of customer satisfaction, most
researchers suggest that a high level of service quality should be delivered by the service
provider as service quality is normally considered an antecedent of customer satisfaction. As
service quality improves, the probability of customer satisfaction increases. Quality was only
one of many dimensions on which satisfaction was based; satisfaction was also one
potential influence on future quality perceptions. Service quality is an important tool to
measure customer satisfaction. Empirical studies show that the quality of service offered is
related to overall satisfaction of the customer. (Jiang , Klein and Crampton,. 2000) Reliability,
tangibility and empathy positively related with customer satisfaction (Zeithaml, Berry and
Parasuraman,. 1993).
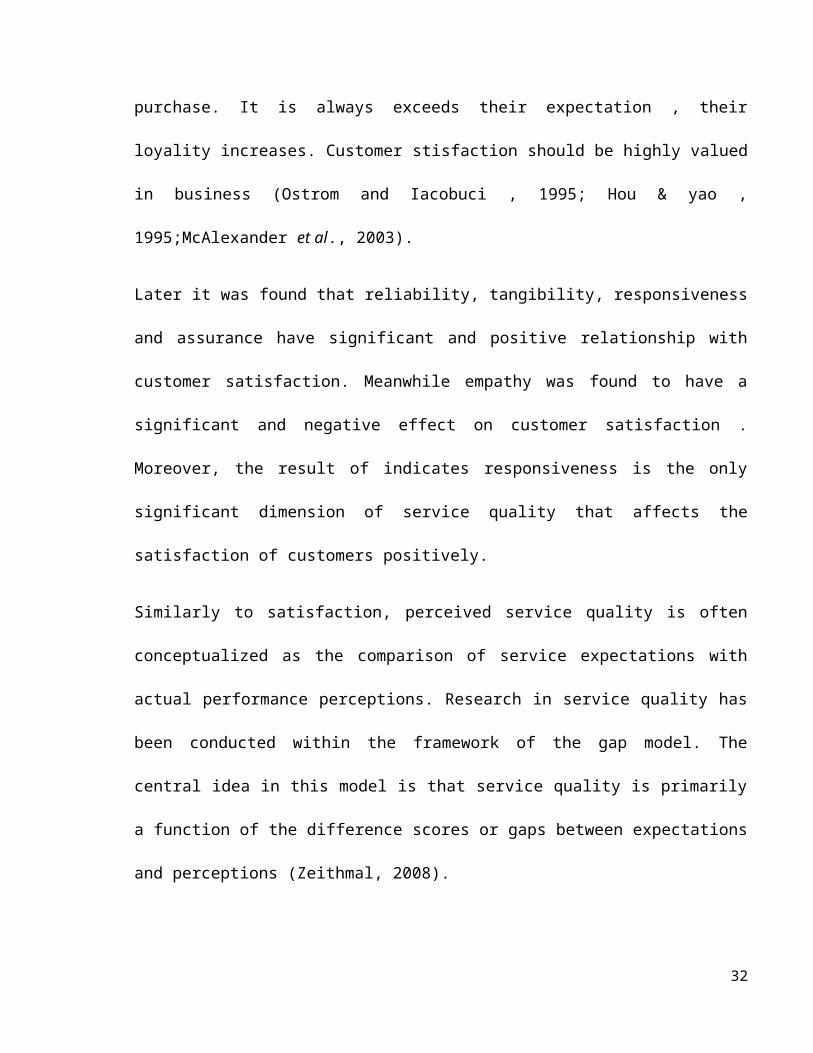
Customer satisfaction is the customer's evaluation of services after purchases as opposed their
expectation (Oliver, 1997; Zeithaml and Bitner ,2000). Baker and Crompton (2000) defended
satisfaction as a personal experience and mentality related the nitration between personal
expectation and actual receive.Customer satisfaction is the overall evaluation to services. It is
the reflection customers make to their previous purchase. It is always exceeds their
expectation , their loyality increases. Customer stisfaction should be highly valued in business
(Ostrom and Iacobuci , 1995; Hou & yao , 1995;McAlexander et al., 2003).
Later it was found that reliability, tangibility, responsiveness and assurance have significant and
positive relationship with customer satisfaction. Meanwhile empathy was found to have a
significant and negative effect on customer satisfaction . Moreover, the result of indicates
responsiveness is the only significant dimension of service quality that affects the satisfaction
of customers positively.
20
Similarly to satisfaction, perceived service quality is often conceptualized as the comparison of
service expectations with actual performance perceptions. Research in service quality has been
conducted within the framework of the gap model. The central idea in this model is that service
quality is primarily a function of the difference scores or gaps between expectations and
perceptions (Zeithmal, 2008).
2.2.9. STUDENTS AS CUSTOMERS
Rinchart (1993) offers two distant views of students as customers .for instance , those who
regard students as primary customers associate them being involved in the input and output as
the learning process. However, those who regard students as potential employers argue that it is
important to consider the economic reality of the situation where lesson content should be
failure to employers’ needs. Students in contexts have been regarded as internal customers with
the second group regarding future employers as external customers (Jaraiedi and Ritz ,1994).
They further argue that students have no conception of what they need to learn as such,
education is preparing them for the long term benefits of the future. It is with these long term
views that potential employers are regarded as primary customers while students, secondary
customers.
2.3 THEORETICAL FRAMEWORK
Theoretical framework is the theories related to the research questions and research objectives
of the study.
21
2.3.1 SERVICE QUALITY
Service quality is a critical element of customer perception and in the case of pure
services; service quality will be the dominant element in customer's evaluations.
This refers to the service as an integral part of the firm itself. Service leaders see the quality
of service as the foundation for competing. Service leaders also understand that service
quality is never ending, requires continued improvement and regular adaption. (Zeithamlet
al., 1990).
Other researchers view service quality as "the function of what customers expect and how well
the service firms perform in providing the service" (Lewis and Mitchell, 1990; Dotchin and
Oakland, 1994; Asubontenget al., 1996; Wisniewski and Donnelly, 1996). Parasuramanet al.,
(1985) define service quality as "the degree and direction of discrepancy between customers'
service expectation and perception". They explain that "if customer expectations are greater
than performance, then perceived service quality is less than satisfactory and vice versa”. It is
anticipated that by doing so service firms are able to meet or exceed customer's service quality
expectations by delivering consistently higher service quality
than competitors (Kotler, 1994).
According to Gronroos (2007), service quality is based on two different dimensions;
o technical quality
o functional quality
Gronroos describes the service experience on the basis of technical and functional elements.
Technical elements refer to what the customer receives from the service. The functional
elements refer to how the service is delivered. This model emphasizes that firms need to be
22
careful of their promises to customers, in that their marketing activities used to promote service
must be realistic.
Zeithmal (2008) has explained that the physical surroundings where the service is delivered
also an important factor in addition to above two dimensions.
Edvardsson (1988) expanded further above two dimensions as follows:
1. Technical Quality: Skills of the personnel and design of the service system
2. Integrative Quality: How different parts of the system work together
3. Functional Quality: the manner in which the service is delivered
4. Outcome Quality : whether actual service meets the promised service and the customer's
needs and expectations.
Parasuraman (1985), who addressed the issue as to how the customer makes an assessment of
service quality came up with ten determinants that can be used to measure service.
Access ( approachability and ease of contact)
Communication ( informing and listening to customers)
Competence ( Possession of required skills and knowledge to perform the service)
Courtesy ( attitude of contact personnel)
Credibility (trustworthiness and honesty)
Reliability ( consistency of performance and dependability)
Responsiveness (timelines of service and willingness of employees)
Security ( freedom from danger , risk or doubt)
Tangibles (physical evidence of service)
23
Understanding / knowing the customer ( making an effort to understand the customer's
needs)
Parasuraman , Valarie Zeithmal and Lenord Berry subsequently reduce these 10 determinants
to five, the following first 3 being the original ones and the seven original ones categorized into
(4) and (5): They are;
Reliability : ability to perform the promised service dependable and
accurately
Responsiveness : willingness to help customers and provide prompt service
Assurance : employee's knowledge and courtesy & their ability to inspire
confidence
Empathy : caring, individualized attention given to customers
Tangibles : appearance of physical facilities, equipment, personnel &
Communication
2.3.2 SERVICE QUALITY MODEL
Today the concept of quality has been changed due to the voice of the customer and customer
awareness. Therefore service providers are required to evaluate the quality level from customer
requirement & satisfaction benchmark point of view. Several quality models are introduced to
reduce the gap between customer & service providers. With the help of these quality models,
24
the service provider can understand customer requirements from quality perception in a better
way. Some of the models which are taken in to consideration during this study are:-
• Service quality model (Gronroos)
• SERVQUAL model
• Five Gaps model
• The Service-Profit Chain model
• Kano Model
SERVQUAL model
Starting from the first model suggested by Gronroos (1984), he made a distinction between
echnical and functional quality and based his measures on subjective consumers` perception
(Gronroos, 1984, in Garcia, Caro, 2010, p.93).
Parasuramanet al. (1986) suggested the SERVQUAL model based on disconfirmation of
expectations. He outlined five service quality dimensions applicable across industries and
service settings - tangibles, reliability, responsiveness, assurance and empathy (Parasuramanet
al., 1986). Later on building upon criticism of SERVQUAL, Cronin and Taylor (1992)
suggested another model called SERVPERF.
Examining differences or gaps between the desired level of services and that actually delivered
reveals where improvements in the service mix are required. In the original paper
Parasuramanet al. (1985) identify the 10 core components of service quality as,
Reliability
Involves consistency of performance and dependability.
25
The firm performs the service right the first time;
It also means that the firms keep promises.
Responsiveness
Concerns the willingness or readiness of employees to provide service.
Also involves timeliness of service.
Competence
Possession of the required skills and knowledge to perform the service.
Knowledge and skill of the contact personnel;
Knowledge and skill of operational support personnel;
Research capability of the firm.
Tangibles
Includes the physical evidence of the service.
The physical service facilities
Appearance of service personnel
Tools or equipment used to provide the service
Physical representations of the service
Other customers in the service facility
Access
Involves approachability and ease of contact
The service is easily accessible by telephone
Waiting time to receive service is not extensive
Convenient hours of operation for the service
Convenient location of the service facility
Courtesy
26
Involves politeness, respect, consideration and friendliness of contact personnel.
Showing consideration for the customer's property
Clean and neat appearance of public contact personnel
Communication
Means keeping customers informed in a language they can understand and listening to
them. It may mean that the firm has to adjust its language or sophistication for different
customers.
Explaining the service itself
Explaining how much the service will cost
Explaining the trade-offs between service and cost
Assuring the customer that a problem will be handled
Credibility
Involves trustworthiness, believability and honesty. It involves having the customer's best
interests at heart
Firm name and reputation contributes to credibility
Personal characteristics of the contact personnel
The degree of hard-sell involved in interactions with the customer
Security
Is the freedom from danger, risk, or doubt and involves:
Physical safety
Financial security
Confidentiality
Understanding and knowing the customer
27
Involves making the effort to understand the customer's needs.
Learning the customer's specific requirement
Providing individualized attention;
Recognizing the regular customer
Source: Adapted from (Parasuramanet al., 1985)
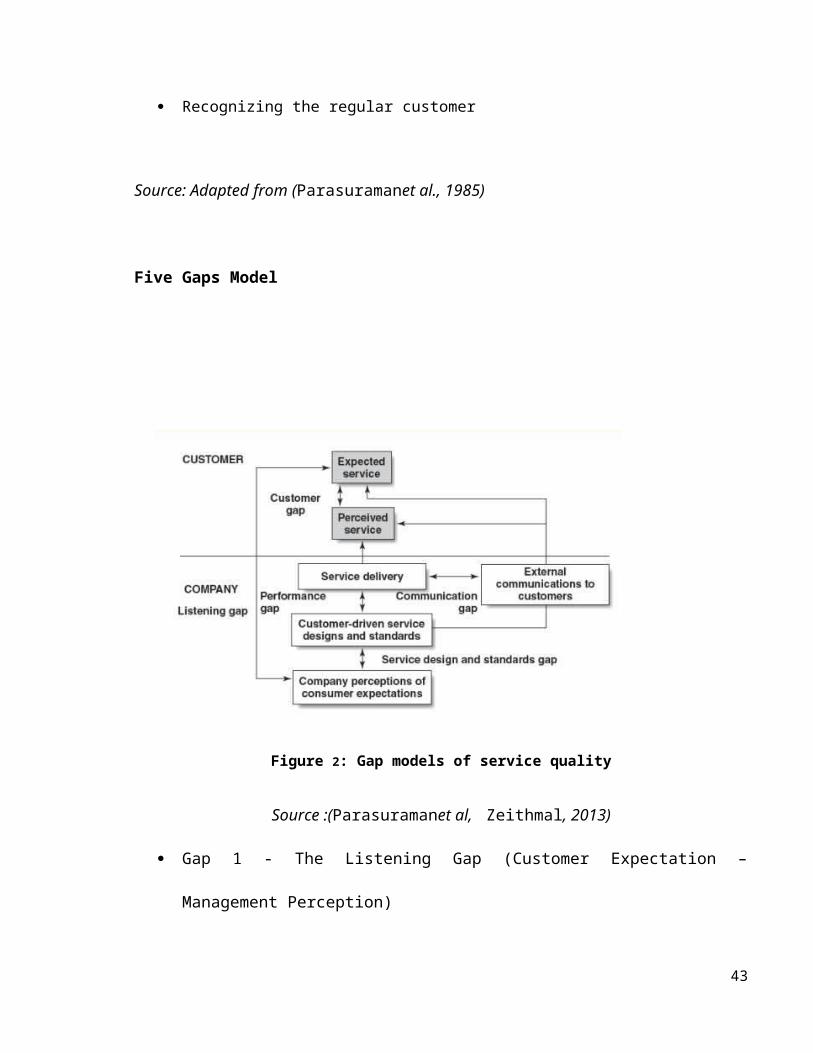
Five Gaps Model
Figure 2: Gap models of service quality
Source :(Parasuramanet al, Zeithmal, 2013)
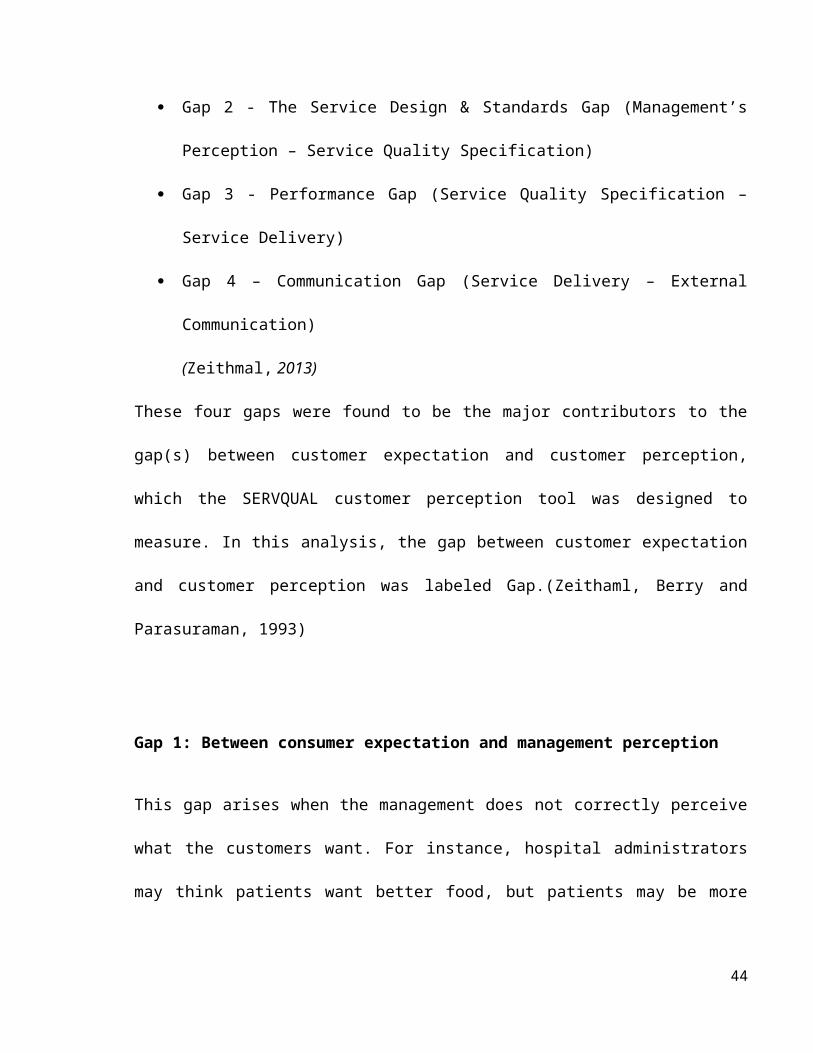
Gap 1 - The Listening Gap (Customer Expectation – Management Perception)
Gap 2 - The Service Design & Standards Gap (Management’s Perception – Service
Quality Specification)
28
Gap 3 - Performance Gap (Service Quality Specification – Service Delivery)
Gap 4 – Communication Gap (Service Delivery – External Communication)
(Zeithmal, 2013)
These four gaps were found to be the major contributors to the gap(s) between customer
expectation and customer perception, which the SERVQUAL customer perception tool was
designed to measure. In this analysis, the gap between customer expectation and customer
perception was labeled Gap.(Zeithaml, Berry and Parasuraman, 1993)
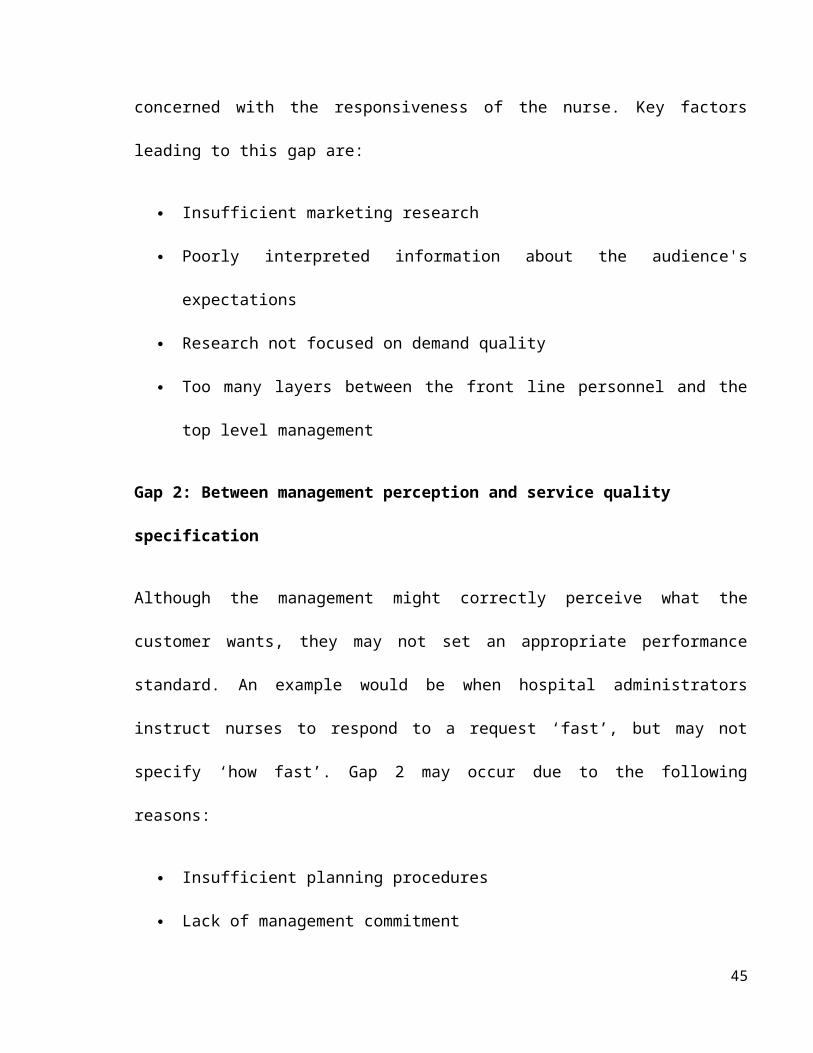
Gap 1: Between consumer expectation and management perception
This gap arises when the management does not correctly perceive what the customers want. For
instance, hospital administrators may think patients want better food, but patients may be more
concerned with the responsiveness of the nurse. Key factors leading to this gap are:
Insufficient marketing research
Poorly interpreted information about the audience's expectations
Research not focused on demand quality
Too many layers between the front line personnel and the top level management
Gap 2: Between management perception and service quality specification
Although the management might correctly perceive what the customer wants, they may not set
an appropriate performance standard. An example would be when hospital administrators
instruct nurses to respond to a request ‘fast’, but may not specify ‘how fast’. Gap 2 may occur
due to the following reasons:
29
Insufficient planning procedures
Lack of management commitment
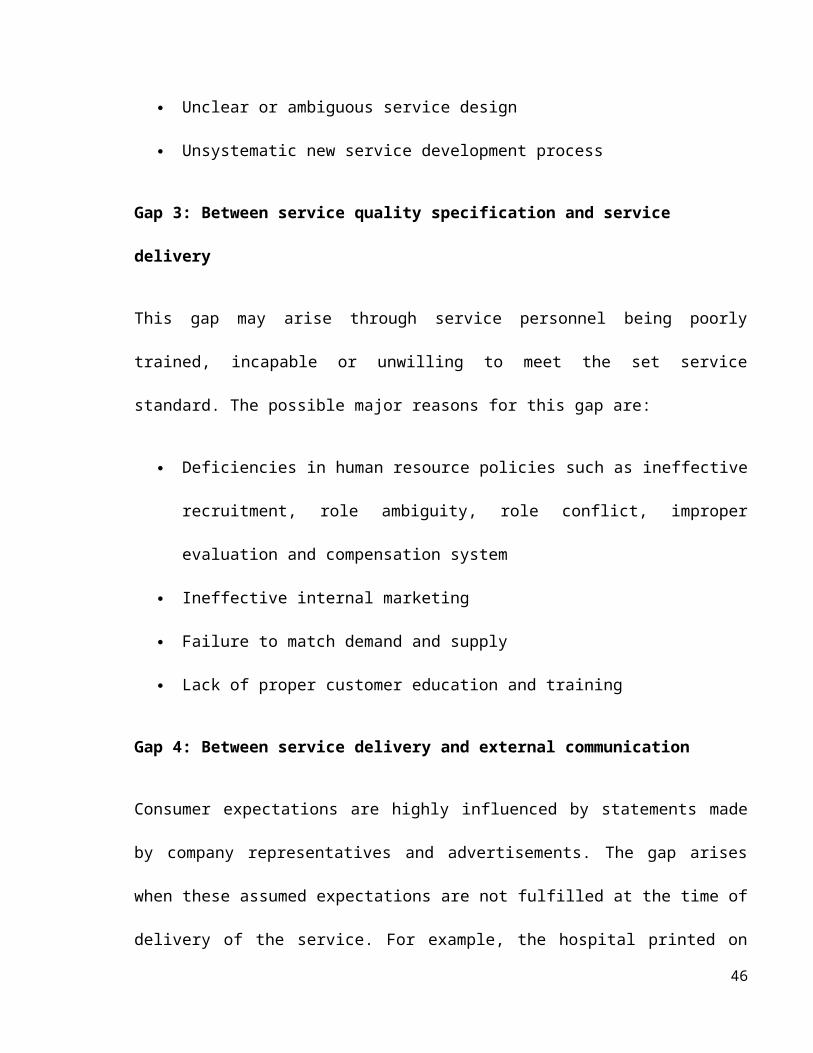
Unclear or ambiguous service design
Unsystematic new service development process
Gap 3: Between service quality specification and service delivery
This gap may arise through service personnel being poorly trained, incapable or unwilling to
meet the set service standard. The possible major reasons for this gap are:
Deficiencies in human resource policies such as ineffective recruitment, role ambiguity,
role conflict, improper evaluation and compensation system
Ineffective internal marketing
Failure to match demand and supply
Lack of proper customer education and training
Gap 4: Between service delivery and external communication
Consumer expectations are highly influenced by statements made by company representatives
and advertisements. The gap arises when these assumed expectations are not fulfilled at the
time of delivery of the service. For example, the hospital printed on the brochure may have
clean and furnished rooms, but in reality it may be poorly maintained, in which case the
patients' expectations are not met. The discrepancy between actual service and the promised
one may occur due to the following reasons:
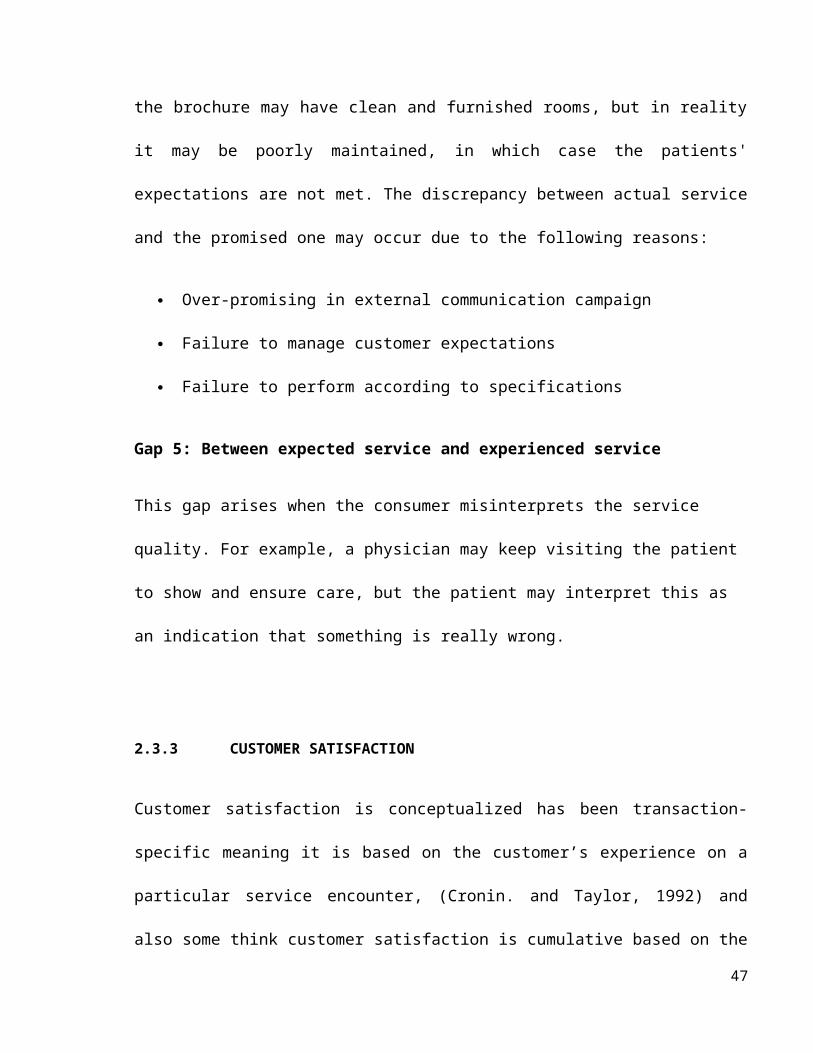
Over-promising in external communication campaign
30
Failure to manage customer expectations
Failure to perform according to specifications
Gap 5: Between expected service and experienced service
This gap arises when the consumer misinterprets the service quality. For example, a physician
may keep visiting the patient to show and ensure care, but the patient may interpret this as an
indication that something is really wrong.
2.3.3 CUSTOMER SATISFACTION
Customer satisfaction is conceptualized has been transaction-specific meaning it is based on the
customer’s experience on a particular service encounter, (Cronin. and Taylor, 1992) and also
some think customer satisfaction is cumulative based on the overall evaluation of service
experience (Johnson, 1996). These highlight the fact that customer satisfaction is based on
experience with service provider and also the outcome of service. Customer satisfaction is
considered an attitude (Yi, 1990).
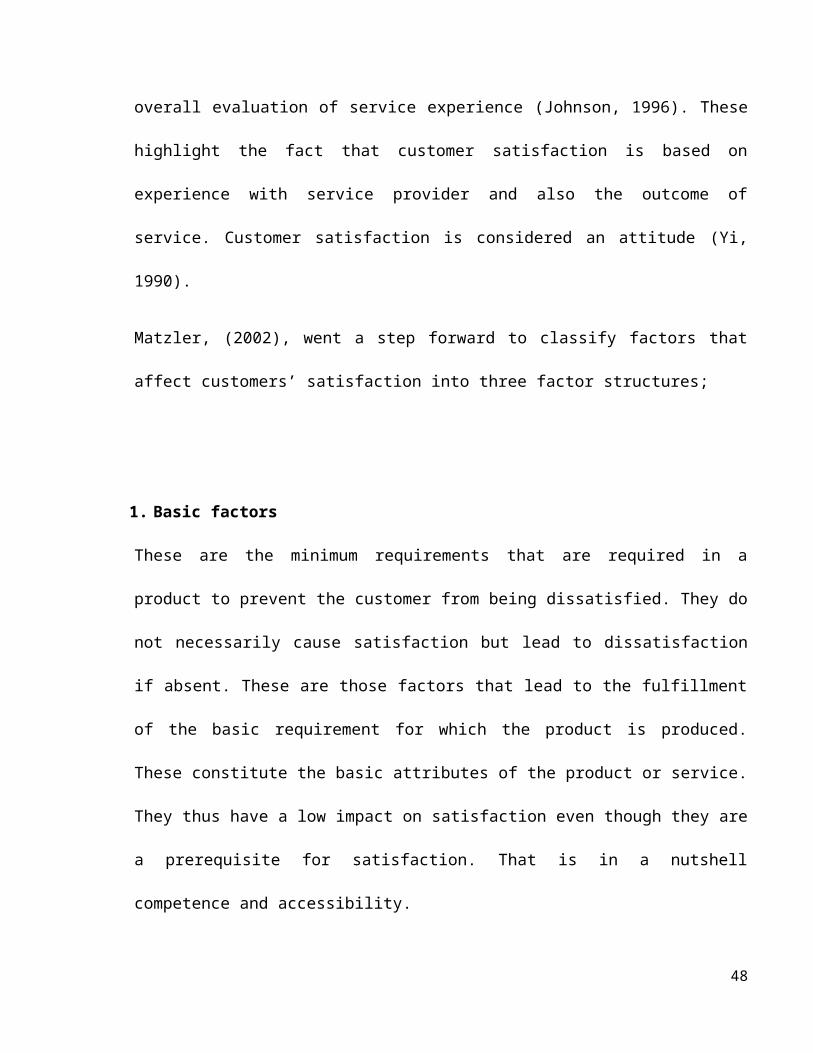
Matzler, (2002), went a step forward to classify factors that affect customers’ satisfaction into
three factor structures;
1. Basic factors
These are the minimum requirements that are required in a product to prevent the customer
from being dissatisfied. They do not necessarily cause satisfaction but lead to dissatisfaction if
31
absent. These are those factors that lead to the fulfillment of the basic requirement for which the
product is produced. These constitute the basic attributes of the product or service. They thus
have a low impact on satisfaction even though they are a prerequisite for satisfaction. That is in
a nutshell competence and accessibility.
2. Performance factors
These are the factors that lead to satisfaction if fulfilled and can lead to dissatisfaction if not
fulfilled. These include reliability and friendliness.
3. Excitement factors
These are factors that increase customers’ satisfaction if fulfilled but does not cause
dissatisfaction if not fulfilled which include project management.
32
2.3.4 SERVICE QUALITY VS CUSTOMER SATISFACTION
Satisfaction is the post-purchase evaluation of products or services taking into consideration the
expectations. Researchers are divided over the antecedents of service quality and satisfaction.
Whilst some believe service quality leads to satisfaction, others think otherwise. Service quality
leads to customer satisfaction. To achieve a high level of customer satisfaction, most
researchers suggest that a high level of service quality should be delivered by the service
provider as service quality is normally considered an antecedent of customer satisfaction. As
service quality improves, the probability of customer satisfaction increases. Quality was only
one of many dimensions on which satisfaction was based; satisfaction was also one
potential influence on future quality perceptions. Service quality is an important tool to
measure customer satisfaction. Empirical studies show that the quality of service offered is
related to overall satisfaction of the customer(Jiang, Klein and Crampton, 2000). Reliability,
tangibility and empathy positively related with customer satisfaction (Zeithaml, Berry and
Parasuraman, 1993)
Later it was found that reliability, tangibility, responsiveness and assurance have significant and
positive relationship with customer satisfaction. Meanwhile empathy was found to have a
significant and negative effect on customer satisfaction .Moreover, the result of indicates
responsiveness is the only significant dimension of service quality that affects the satisfaction
of customers positively.
Similarly to satisfaction, perceived service quality is often conceptualized as the comparison of
service expectations with actual performance perceptions. Research in service quality has been
conducted within the framework of the gap model. The central idea in this model is that service
33
quality is primarily a function of the difference scores or gaps between expectations and
perceptions (Zeithmal, 2008).
3.2.4.1 REASONS FOR MEASURING CUSTOMER SATISFACTION:
Customer satisfaction is considered to be one of the most important outcomes of all marketing
activities in a market-oriented firm. The obvious need for satisfying the firm’s customer is to
expand the business, to gain a higher market share, and to acquire repeat and referral business,
all of which lead to improved profitability (Barsky, 1992).In order to achieve this one thing to
be considered and addressed by the company is knowing of customers’ requirements which is
essential and it provides a better understanding of the way customers define the quality of the
service and the product. If the company understands customers’ requirements it is easier for
service providers to satisfy them. Knowing of customers’ satisfaction level and their
requirements will also help in finding out the best direction in which the company needs to go
on. (Hayes, 2008).Consumers becoming more sophisticated in their requirements and
increasingly demanding higher standards of services. To them service means customer
satisfaction, customer delight, customer relationship etc.
Therefore knowing customer satisfaction level for service provider is essential. It is widely
accepted that it is easier to sell to an existing customer than to find a new one; that is why
customer satisfaction level is a very important issue. Accordingly customers with problems
usually don't react and only 4% of them complain; normally a person with problem tells 9 other
people about it; while satisfied customers tell 5 other people about their good experiment;
keeping a current customer costs about 1/7 of the cost of acquiring a new customer. Therefore,
organizations need to understand that to what extent their customers would be satisfy
34
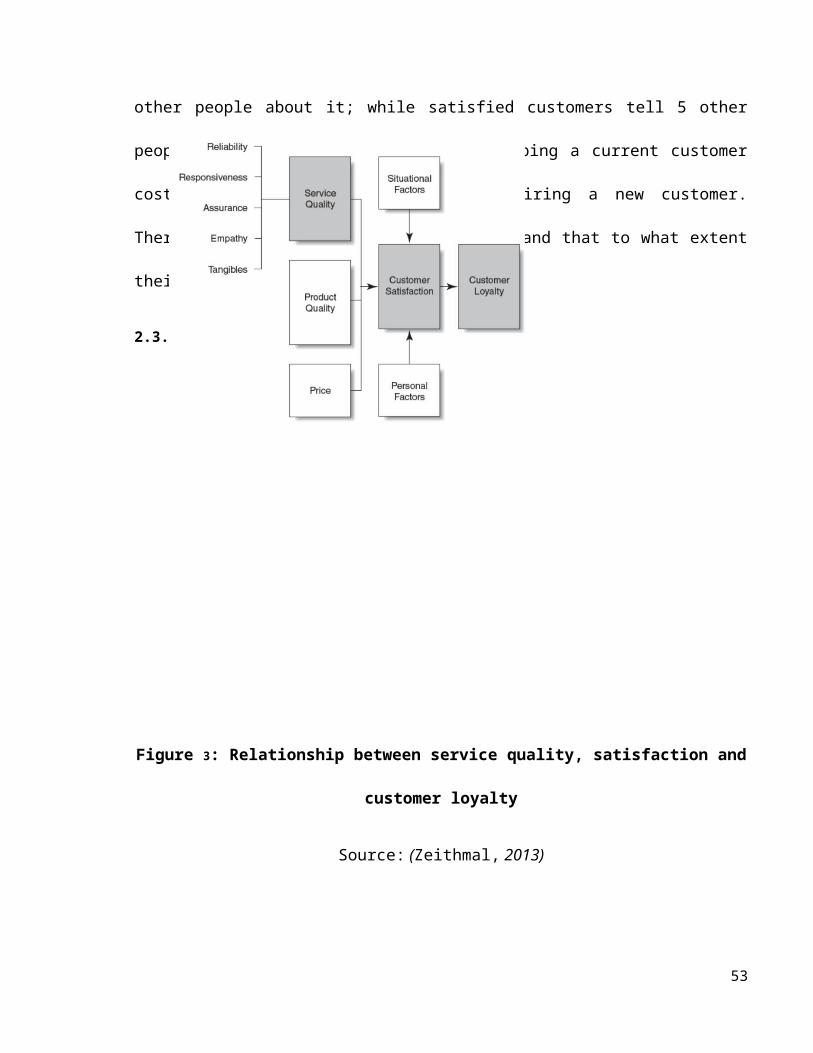
2.3.5 CUSTOMER LOYALTY
Figure 3: Relationship between service quality, satisfaction and customer loyalty
Source: (Zeithmal, 2013)
Both the service management and the marketing literatures suggest that there is a strong
theoretical foundation for an empirical exploration of the linkages between customer
satisfaction and customer loyalty. According to these literatures, customer satisfaction with the
service experience will lead to higher level of customer loyalty. Edvardsson (1988), states that
there is a strong and positive relationship between customer satisfaction and loyalty. A satisfied
customer is six times more likely to repurchase a product and share his experience with five or
six other people(Gronroos, 1984); further unsatisfied customer can banish more business from
the organization than ten highly satisfied customers do with higher customer satisfaction the
level of loyalty increases. It was found a significant positive relationship between customer
satisfaction and customer loyalty. Other several studies have indeed found satisfaction to be a
leading factor in determining loyalty. These studies have concluded that there is a significant
35
relationship between customer satisfaction and loyalty. They assert that high level of customer
satisfaction will result in increased loyalty for the firm and is positively associated with
repurchase intentions, positive words of mouth and profitability (Johnson, 1996).
On the basis of the above empirical literatures, customer satisfaction is indicated as a foremost
determinant of customer loyalty. There are disappointments of customers over the service
offered and the available services don’t match with the expectation of the customer. This study
addresses all these issues and tries to identify the dimension of quality which achieved least
together with its implication on customer satisfaction and loyalty.
2.4 CONCEPTUAL BACKGROUND
Specific dimensions of service quality have been identified through the pioneering research
ofZeithaml, Berry, and Parasuraman, 1993. Their research identified five specific dimensions
of service quality that apply across variety of service contexts.
36
Tangibility
Reliability
Responsiveness
Assurance
Empathy
Service Quality
On an operational level, service quality research has been dominated by the SERVQUAL
instrument, which commonly groups quality determinants into 5 basic clusters as illustrated in
Figure 4 (Parasuraman, 1985). Various scholars however pointed out that SERVQUAL is not a
generic measure that could be applied to any service and that it needs to be customized to the
specific service under consideration (Caruana, 1998).
2.4.1 FIVE DIMENSIONS OF SERVICE QUALITY
2.4.1.1 RELIABILITYReliability is the ability to perform services dependably and accurately in a consistent manner.
It contains five elements to assess the accuracy and credibility services. This dimension of
service quality evaluates the promises of an institute and its execution from customers' point of
view. Reliability is very important determinant of product quality besides good personal
service, staff attitude, knowledge and skills (Walker, 1990). Berry and Parasuraman (1991)
reported that reliable service is the outcome of the continuous improvement. Similarly in
another study, it is found that service reliability is the service “core” to most customers. So
managers should use every opportunity to build a “do-it-right-first” attitude (Berry et al., 1990).
2.4.1.2 RESPONSIVENESS
This dimension reflects the willingness or readiness of employees to provide quick services to
customers. Customers are very keen to employees' behavior in services industry . It was
37
Figure 4: Dimensions of Service Quality
reported that customers are very sensitive to employees' working environment in service
organizations (Brown and Mitchell, 1993). It was found that correct match between staff skills
and customers' expectation resulted in better service quality towards customers (Gollway and
Ho, 1996). Service recovery and problem solving have been recognized as important parts of
services quality (Hart et al., 1990; Dabholkaret al., 1996; Swanson and Kelley, 2001; Nelson
and Chan, 2005).
2.4.1.3 ASSURANCE
This dimension indicates the employees' knowledge, courtesy and their ability to convey trust
and confidence. Service quality is also linked to the customer satisfaction as how employees
use their knowledge & courtesy and their ability to incorporate trust and confidence.
Parasuramanet al. (1988) reported assurance as an essential dimension of service quality after
reliability and responsiveness towards satisfaction. It is found that an institute can create
customer satisfaction by ensuring trustworthy behavior and reflection of genuine commitments
to service provision (Nelson and Chan, 2005). Arasliet al. (2005) identified that assurance
dimension of service quality has the strongest impact on customer satisfaction that leads to
positive word of mouth outcome.
2.4.1.4 EMPATHY
This dimension shows the magnitude of caring and individual attention given to customers. In
an institute , customer care and individual attention is indispensable for the better performance
due to stiff competition. (Jabnoun and Al-Tamimi, 2003). It is suggested that employees'
commitment to deliver quality services, skillfully handling of conflicts and efficient delivery of
services resulted in satisfied customers for long term benefits (Nelson and Chan, 2005).
38
Malhotraet al. (2005) examined the difference in perceptions of service quality dimensions
between developing and developed countries. They found that in developing countries like
India and Philippines results were systematically and significantly different. It is found that
empathy is least preferred dimension of service quality by the customers .(Tahir and Abu
Bakar, 2007).Parasuramanet al. (1991)
2.4.1.5 TANGIBILITY
This dimension shows the physical aspects of the services as physical facilities, appearance of
personnel and tools used for the provision of services. It is more concerned with aesthetic part
of an institute. It is found that customers prefer tangible dimension of service quality .(Jabnoun
and Al-Tamimi, 2003).Zineldin (2005) studied the product/service quality and customer
relationship factors in Sweden. It is found that an institute can create customer relationships by
delivering added tangible and intangible elements of the core products. Strong competitive
positions are the outcome of product/service quality and differentiation.
Quality
Dimensions
Service
Instruments
Description
Reliability Reliability Consistency of service/dependability; i.e. the ability
to provide the service on time, accurately and
dependably
Responsiveness Responsiveness Willingness/readiness of employees; i.e. the ability
to deal effectively with complaints and promptness
of services
Credibility The extent to which the service is believed and
39
Assurance
trusted; involves honesty, trustworthiness and
believability
Courtesy The politeness, respect, consideration and
friendliness shown to the customers by the contact
personnel
Security The freedom from danger, risk and doubt
Competence The possession of staff of the necessary skill,
knowledge and information to perform the service
effectively
Empathy
Access The ease of approachability and contact
Communication Listening to customers and keeping them informed
about the service
Understanding the
Customer
Trying to understand the customer’s needs and their
requirementsTangibles Tangibles Physical condition of buildings and the environment,
appearance of personnel and condition of equipment
Figure 5: Determinants of service quality
Sources: Parasuramanet al., 1985; Ghobadianet al., 1994; Curry and Herbert, 1998;
Wisniewski, 2001
Five dimensions of SERVQUAL have been developed for the service sectors: tangibility,
reliability, assurance, responsiveness, and empathy (Van Iwaarden. et al, 2003).
40
The ten determinants that may influence the appearance of a gap are:
1. Competenceis the possession of the required skills and knowledge to perform the
service. For example, there may be competence in the knowledge and skill of contact
personnel, knowledge and skill of operational support personnel and research
capabilities of the organization.
2. Courtesy is the consideration for the customer's property and a clean and neat
appearance of contact personnel, manifesting as politeness, respect, and friendliness.
3. Credibility includes factors such as trustworthiness, belief and honesty. It involves
having the customer's best interests at prime position. It may be influenced by company
name, company reputation and the personal characteristics of the contact personnel.
4. Security enables the customer to feel free from danger, risk or doubt including physical
safety, financial security and confidentiality.
5. Access is approachability and ease of contact. For example, convenient office operation
hours and locations.
6. Communication means both informing customers in a language they are able to
understand and also listening to customers. A company may need to adjust its language
for the varying needs of its customers. Information might include for example,
explanation of the service and its cost, the relationship between services and costs and
assurances as to the way any problems are effectively managed.
7. Knowing the customer means making an effort to understand the customer's individual
needs, providing individualized attention, recognizing the customer when they arrive
and so on. This in turn helps to delight the customers by rising above their expectations.
41
8. Tangibles are the physical evidence of the service, for instance, the appearance of the
physical facilities, tools and equipment used to provide the service; the appearance of
personnel and communication materials and the presence of other customers in the
service facility.
9. Reliability is the ability to perform the promised service in a dependable and accurate
manner. The service is performed correctly on the first occasion, the accounting is
correct, records are up to date and schedules are kept.
10. Responsiveness is the readiness and willingness of employees to help customers by
providing prompt timely services, for example, mailing a transaction slip immediately
or setting up appointments quickly.
2.5 CONCEPTUAL FRAMEWORKThe conceptual framework is the underlying process which is applied to guide this study. All
the questions are based on students’ satisfaction. The questions are based on five quality
dimensions; reliability, responsiveness, assurance, empathy and tangibility.
2.5.1 ReliabilityReliability includes questions related to ability to perform the promised service dependably and
accurately. From question 1 to question 5 of the questionnaire measure the reliability dimension
and indicators of measuring the reliability are as follow.
Ability to understand students general requirements- (eg- timetables at correct time,
teachers availability, water, toilet, uniforms etc.)
Holding meetings to discuss students general problems – (eg-discussing problems at
daily assembly, weekly meeting)
42
Discussing students concurrent problems – (any problem that raised suddenly eg. Rain,
bus strike etc)
Solving students day to day problems-(eg, absence of teachers on particular day,
competitions, workshops etc.)
Commitment of the teachers to work ( the perception of the student)
2.5.2 Responsiveness
Responsiveness includes questions related to willingness to help customers and prompt service.
Questions related to the responsiveness dimension have been included in the questionnaire from
question 6 to question 10.
Pre preparation to teach- ( lesson plans, preparation of teaching aid etc.)
Teaching students enthusiastically ( students perception)
Discussing the students subject issues in a friendly manner ( students perception)
Giving feed backs to students where necessary ( students perception)
Being punctual when teaching ( students perception)
2.5.3 Assurance
Assurance includes questions related to the knowledge, ability and courteous of the teaching
staff. Questions related to the assurance dimension had been included in the questionnaire from
question 11 to question 15.
Giving the relevant theory knowledge to the students (according to the syllabus)
Giving the relevant practical knowledge to the students(according to the syllabus)
43
The degree of students’ understanding what teachers teach ( students perception)
The degree the students’ applicability of theory knowledge at work ( students
perception)
The degree the students’ applicability of practical knowledge at work ( students
perception)
2.5.4 Empathy
Empathy includes question related to the caring to the customers and additional facilities
provided by the service provider. Questions related to empathy dimension had been included in
the questionnaire from question 16 to question 20.
Paying attention to individual student when teaching ( students perception)
Taking effort to back up dull students when teaching ( students perception)
Having a plan to back up dull students ( students perception)
Having a plan to enhance the bright students ( students perception)
Degree of not being biased when teaching ( students perception)
2.5.5 TangibilityTangibility includes questions related to physical facilities, equipment and appearances of the
college and their staff. The following indicators which are related to this dimension were used
in the questionnaire from question 21 to question 25.
Availability instrument for lessons (tools, white boards, marker pens etc.)
Explaining the theory before practical clearly ( students perception)
44
Availability of support of technical assistant satisfactorily ( support of demonstrators,
technicians, repairing common equipments like fans etc)
Having a learning friendly classroom environment ( space, light, fans etc)
Using teaching aids when teaching ( using relevant teaching aid)
45
CHAPTER 3
RESULTS (ANALYSIS)
3.1 INTRODUCTION
This chapter analyses the results found from the questionnaires given to the students and
teachers of VTA. The mean value and the standard deviation for the answers of the teachers and
the students are compiled in this chapter.The answers of the students and teachers were scaled
on the Likert scale which carries five scales from 0 to 4 (0, 1, 2, 3, 4) where "0=not satisfied",
"1=Satisfied up to some extent", "2=Satisfied", "3=Highly Satisfied", "4=Very Highly
satisfied". The data interpretation is done by using the mean values and the standard deviations.
Answers of both students and teachers are compiled in the same table to view the difference of
the mean value and standard deviation. The answers for all the questions, indicators, are
mentioned respectively from question number 1 to 25. As a calibration to the results, oral
discussions with two teachers and students will be discussed under each question.
Standard deviation was used to measure the significance (Significance of the respondent
views). Here if standard deviation is less than one it means that respondent views are
homogenous. If standard deviation value is greater than one it means that those views were
heterogeneous. Accordingly, smaller the SD value considered, larger the effect of views of
which statistically known as "significant" as same as , larger the SD value considered, smaller
the effect of views of which statistically known as "Insignificant".
46
1. Ability to understand students general requirements
(x) SD
Students’ Views 3.40 0.91
Teachers’ Views 3.52 0.67
According to the above data, it is evident that both Mean values arebetween 3 and 4, which
means the mean values lie between “highly satisfied” to “very highly satisfied” level (3.4,
3.52). The mean value of students’ responses is 3.4 whereas the mean value of teachers’
responses is 3.52. There is only a little difference between mean values (1.2). It indicates that
the teachers have overestimated the level they understand students’ general requirements.
However,both students and teachers accepted that teachers understand students’ general
requirements truly well.
As far as the SD value is considered, the both values are less than one i.e. the mean values are
significant which means the effect of views is large.
Students’ oral comments –The comments of the students supported the above evidence.
Teachers’ oral comments -The comments of the teachers supported the above evidence.
2. Holding meetings to discuss students general problems
(x) SD
47
Students’ Views 2.90 0.89
Teachers’ Views 2.58 0.89
According to the above data, it is evident that both Mean values are between 2 and 3, which
means that the mean values lie between “satisfied” to “highly satisfied” level (2.9, 2.58). The
mean value of students’ responses is 2.9 whereas the mean value of teachers’ responses is 2.58.
There is only a little difference between mean values (0.32). It indicates that the teachers have
overestimated the level they hold meetings to discuss students general problems. However,
both students and teachers accepted that teachers understand students’ general requirements
truly well.
As far as the SD value is considered, the both values are less than one i.e. the mean values are
significant which means the effect of views is large.
Students’ oral comments – The comments of the students supported the above evidence.
Teachers’ oral comments - The comments of the teachers supported the above evidence.
3. Discussing students concurrent problems
(x) SD
Students’ Views 2.98 1.00
Teachers’ Views 2.76 0.88
48
According to the above data, it is evident that both Mean values are between 2 and 3, which
means that the mean values lie between “satisfied” to “highly satisfied” level (2.98, 2.76). The
mean value of students’ responses is 2.98 whereas the mean value of teachers’ responses is
2.76. There is only a little difference between mean values (0.32). It indicates that the teachers
have overestimated the level they discuss students’ concurrent problems. However, both
students and teachers accepted that teachers understand students’ general requirements truly
well.
As far as the SD value is considered, the both values are less than one i.e. the mean values are
significant which means the effect of views is large.
Students’ oral comments – The comments of the students supported the above evidence.
Teachers’ oral comments - The comments of the teachers supported the above evidence.
4. Solving students day to day problems
(x) SD
Students’ Views 3.02 0.97
Teachers’ Views 3.04 0.74
According to the above data, it is evident that both Mean values are between 3 and 4, which
means that the mean values lie between “highly satisfied” to “very highly satisfied”
levels(3.02, 3.04). The mean value of students’ responses is 3.02 whereas the mean value of
49
teachers’ responses is 3.04. There is not a significant difference between mean values (0.02). It
indicates that both students and teachers solve students’ day to day problems truly well.
As far as the SD value is considered, the both values are less than one i.e. the mean values are
significant which means the effect of views is large.
Students’ oral comments – The comments of the students supported the above evidence.
Teachers’ oral comments - The comments of the teachers supported the above evidence.
5. Commitment to work
(x) SD
Students’ Views 3.71 0.58
Teachers’ Views 3.84 0.36
According to the above data, it is evident that both Mean values are between 3 and 4, which
means that the mean values lie between “highly satisfied” to “very highly satisfied” level
(3.71, 3.84). The mean value of students’ responses is 3.71 whereas the mean value of teachers’
responses is 3.84. There is only a little difference between mean values (0.13). It indicates that
the teachers have overestimated the level of their commitment to work. However, both students
and teachers accepted that teachers are committed to work very well.
As far as the SD value is considered, the both values are less than one i.e. the mean values are
significant which means the effect of views is large.
Students’ oral comments – The comments of the students supported the above evidence.
50
Teachers’ oral comments - The comments of the teachers supported the above evidence.
6. Pre preparation to teach
(x) SD
Students’ Views 3.66 0.70
Teachers’ Views 3.80 0.40
According to the above data, it is evident that both Mean values are between 3 and 4, which
means that the mean values lie between “highly satisfied” to “very highly satisfied” level
(3.66, 3.80). The mean value of students’ responses is 3.66 whereas the mean value of teachers’
responses is 3.80. There is only a little difference between mean values (0.14). It indicates that
the teachers have overestimated the level of their pre preparation to work. However, both
students and teachers accepted that teachers are well prepared to work.
As far as the SD value is considered, the both values are less than one i.e. the mean values are
significant which means the effect of views is large.
Students’ oral comments – The comments of the students supported the above evidence.
Teachers’ oral comments - The comments of the teachers supported the above evidence.
7. Teaching students enthusiastically
(x) SD
Students’ Views 3.73 0.60
Teachers’ Views 3.82 0.38
51
According to the above data, it is evident that both Mean values are between 3 and 4, which
means that the mean values lie between “highly satisfied” to “very highly satisfied” level
(3.73, 3.82). The mean value of students’ responses is 3.73 whereas the mean value of teachers’
responses is 3.82. There is only a little difference between mean values (0.9). It indicates that
the teachers have overestimated the level they teach students enthusiastically. However, both
students and teachers accepted that teachers teach students very enthusiastically.
As far as the SD value is considered, the both values are less than one i.e. the mean values are
significant which means the effect of views is large.
Students’ oral comments – The comments of the students supported the above evidence.
Teachers’ oral comments - The comments of the teachers supported the above evidence.
8. Discussing the students subject issues in a friendly manner
(x) SD
Students’ Views 3.73 0.60
Teachers’ Views 3.72 0.49
According to the above data, it is evident that both Mean values are between 3 and 4, which
means that the mean values lie between “highly satisfied” to “very highly satisfied” level
(3.73, 3.72). The mean value of students’ responses is 3.73 whereas the mean value of teachers’
responses is 3.72. There is only a little difference between mean values (0.01). It indicates that
both teachers and students more or less accept that the teachers discuss the students’ subject
issues in a friendly manner.
52
As far as the SD value is considered, the both values are less than one i.e. the mean values are
significant which means the effect of views is large.
Students’ oral comments – The comments of the students supported the above evidence.
Teachers’ oral comments - The comments of the teachers supported the above evidence.
9. Giving feed backs to students where necessary
(x) SD
Students’ Views 3.45 0.76
Teachers’ Views 3.60 0.63
According to the above data, it is evident that both Mean values are between 3 and 4, which
means that the mean values lie between “highly satisfied” to “very highly satisfied” level
(3.45, 3.60). The mean value of students’ responses is 3.45 whereas the mean value of teachers’
responses is 3.60. There is only a little difference between mean values (0.15). It indicates that
the teachers have overestimated the level they give feed backs to students where necessary.
However, both students and teachers accepted that the teachers give feed backs to students
where necessary.
As far as the SD value is considered, the both values are less than one i.e. the mean values are
significant which means the effect of views is large.
Students’ oral comments – The comments of the students supported the above evidence.
Teachers’ oral comments - The comments of the teachers supported the above evidence.
10. Being punctual when teaching
53
(x) SD
Students’ Views 3.63 0.68
Teachers’ Views 3.52 0.53
According to the above data, it is evident that both Mean values are between 3 and 4, which
means that the mean values lie between “highly satisfied” to “very highly satisfied” level
(3.45, 3.60). The mean value of students’ responses is 3.45 whereas the mean value of teachers’
responses is 3.60. There is only a little difference between mean values (0.15). It indicates that
the teachers have overestimated the level they give feed backs to students where necessary.
However, both students and teachers accepted that the teachers give feed backs to students
where necessary.
As far as the SD value is considered, the both values are less than one i.e. the mean values are
significant which means the effect of views is large.
Students’ oral comments – The comments of the students supported the above evidence.
Teachers’ oral comments - The comments of the teachers supported the above evidence.
11. Giving the relevant theory knowledge to the students
(x) SD
Students’ Views 3.74 0.49
Teachers’ Views 3.9 0.30
According to the above data, it is evident that both Mean values are between 3 and 4, which
mean means, “highly satisfied” to “very highly satisfied” (3.74, 3.9). The mean value of
54
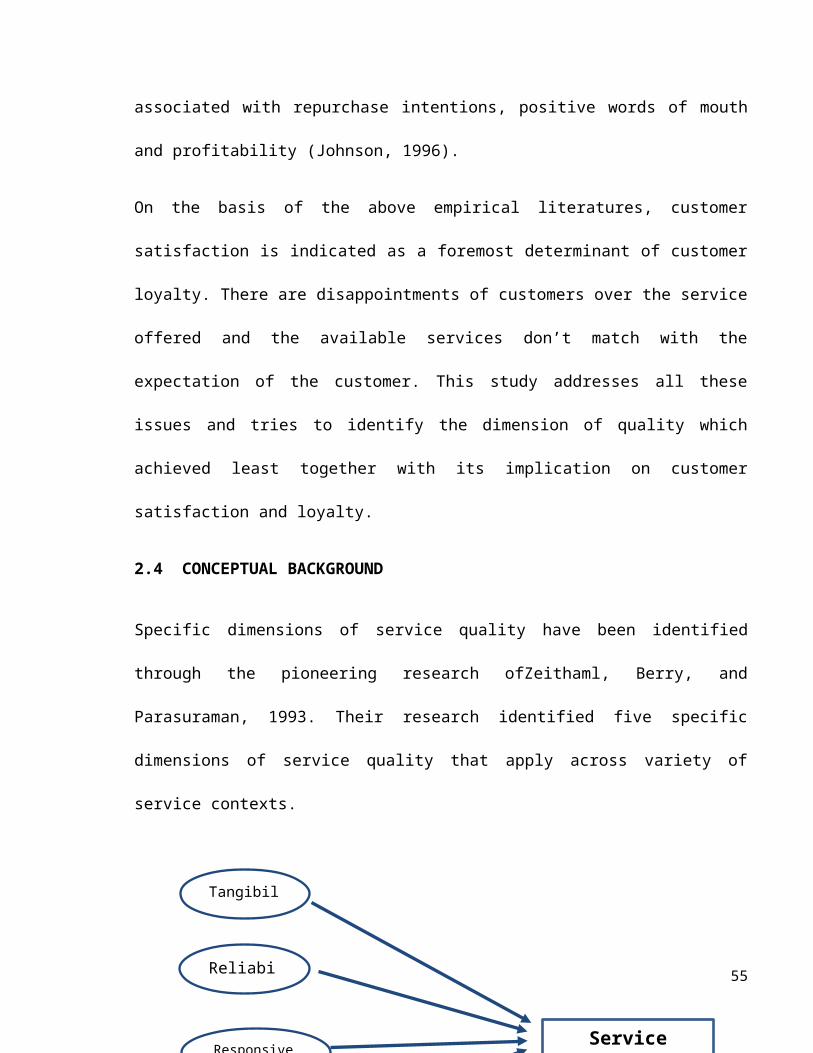
students’ responses is 3.74 whereas the mean value of teachers’ responses is 3.9. There is only a
little difference between mean values (0.15). It indicates that the teachers have overestimated
the level they give relevant theory knowledge to the students. However, both students and
teachers accepted that teachers give relevant theory knowledge to the students truly well.
As far as the SD value is considered, the both values are less than one i.e. the mean values are
significant which means the effect of views is large.
Students’ oral comments – The comments of the students supported the above evidence.
Teachers’ oral comments - The comments of the teachers supported the above evidence.
12. giving the relevant practical knowledge to the students
(x) SD
Students’ Views 3.69 0.57
Teachers’ Views 3.80 0.40
According to the above data, it is evident that both Mean values are between 3 and 4, which
mean means, “highly satisfied” to “very highly satisfied” (3.74, 3.9). The mean value of
students’ responses is 3.74 whereas the mean value of teachers’ responses is 3.9. There is only a
little difference between mean values (0.15). It indicates that the teachers have overestimated
the level they give relevant theory knowledge to the students. However, both students and
teachers accepted that teachers give relevant theory knowledge to the students truly well.
As far as the SD value is considered, the both values are less than one i.e. the mean values are
significant which means the effect of views is large.
Students’ oral comments – The comments of the students supported the above evidence.
55
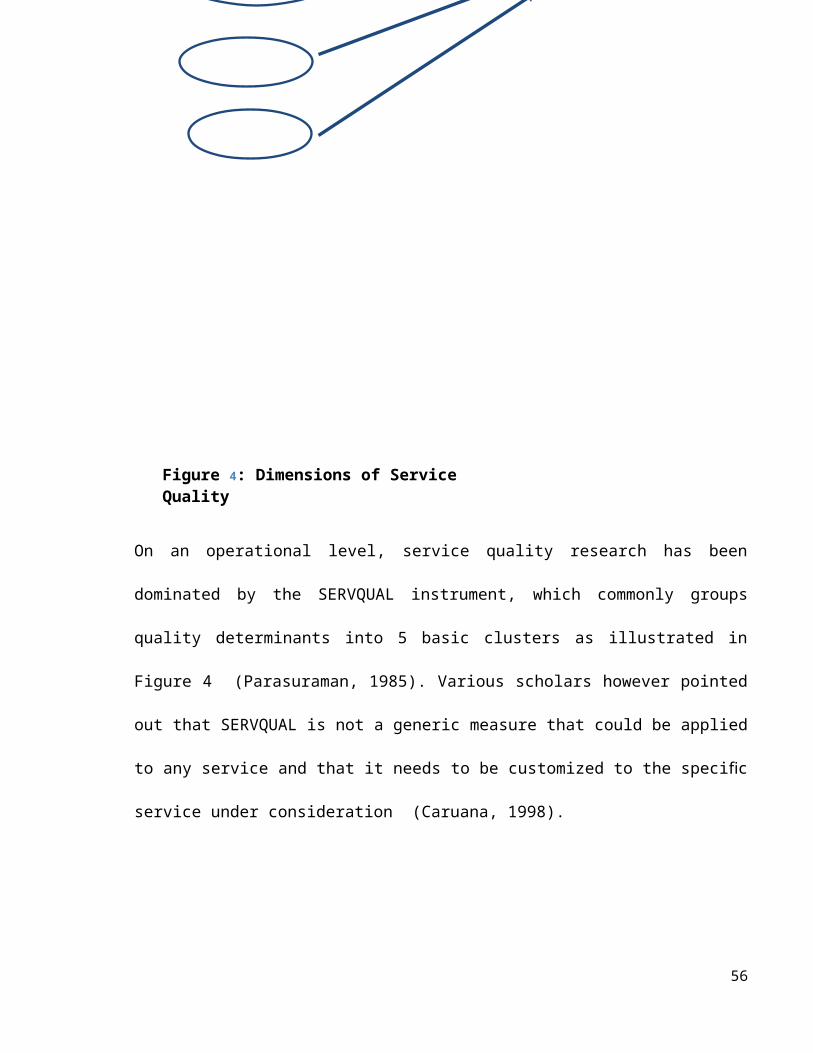
Teachers’ oral comments –Although teachers mentioned above remarks , they claimed that
they have severe problem of lack of material and not having material on time. They claimed
that due to lack of relevant officers who take necessary steps to purchase materials.
13. The degree of students’ understanding what teachers teach
(x) SD
Students’ Views 3.66 0.58
Teachers’ Views 3.02 0.73
According to the above data, it is evident that both Mean values are between 3 and 4, which
mean means, “highly satisfied” to “very highly satisfied” (3.66, 3.02). The mean value of
students’ responses is 3.66 whereas the mean value of teachers’ responses is 3.02. There is abig
difference between mean values (0.54). It indicates that the teachers have overestimated the
degree of students’ understanding what teachers teach.However, both students and teachers
accepted that the degree of students’ understanding what teachers teachto the students truly
well.
As far as the SD value is considered, the both values are less than one i.e. the mean values are
significant which means the effect of views is large.
Students’ oral comments – The comments of the students supported the above evidence.
Teachers’ oral comments - The comments of the teachers supported the above evidence.
14. The degree the students’ applicability of theory knowledge at work
56
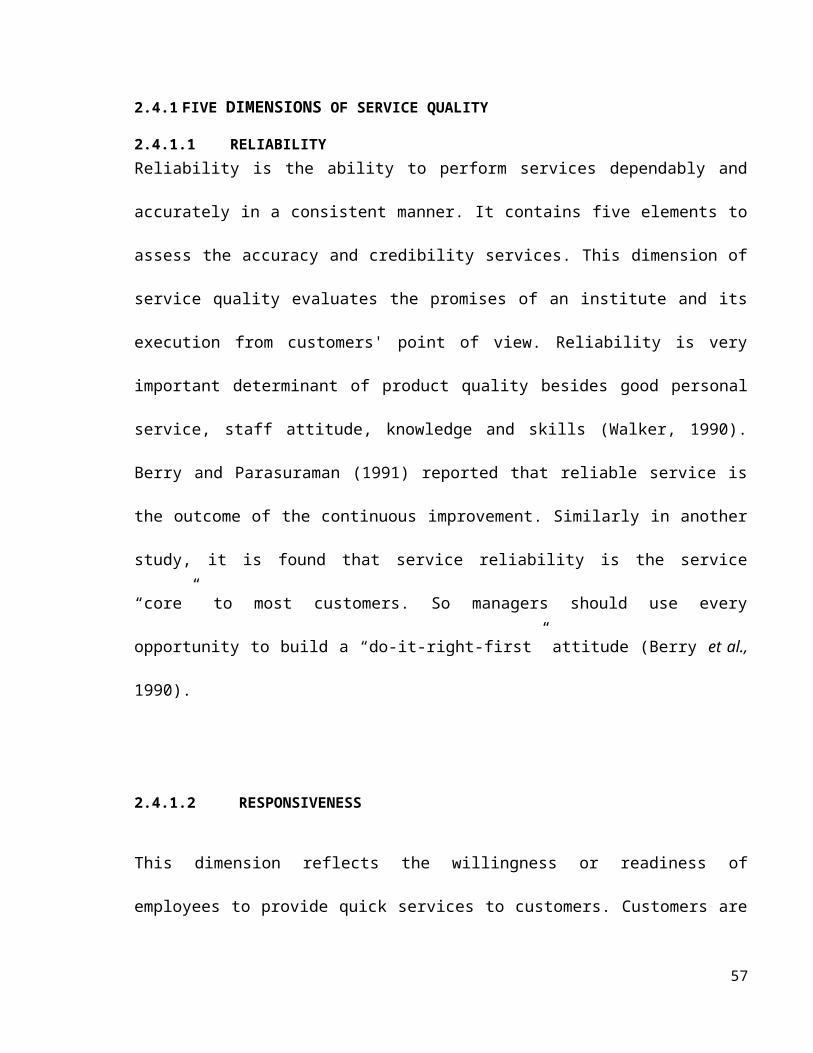
(x) SD
Students’ Views 3.45 0.76
Teachers’ Views 3.05 0.64
According to the above data, it is evident that both Mean values are between 3 and 4, which
mean means, “highly satisfied” to “very highly satisfied” (3.45, 3.05). The mean value of
students’ responses is 3.45 whereas the mean value of teachers’ responses is 3.05. There is a
big difference between mean values (0.4). It indicates that the teachers have overestimated the
degree the students’ applicability of theory knowledge at work. However, both students and
teachers accepted that the degree of the students’ applicability of theory knowledge at work
truly well.
As far as the SD value is considered, the both values are less than one i.e. the mean values are
significant which means the effect of views is large.
Students’ oral comments – The comments of the students supported the above evidence.
Teachers’ oral comments - The comments of the teachers supported the above evidence.
15. The degree the students’ applicability of practical knowledge at work
(x) SD
Students’ Views 3.46 0.77
Teachers’ Views 3.64 0.55
According to the above data, it is evident that both Mean values are between 3 and 4, which
mean means, “highly satisfied” to “very highly satisfied” (3.46, 3.64). The mean value of
students’ responses is 3.46 whereas the mean value of teachers’ responses is 3.64. There is a
57
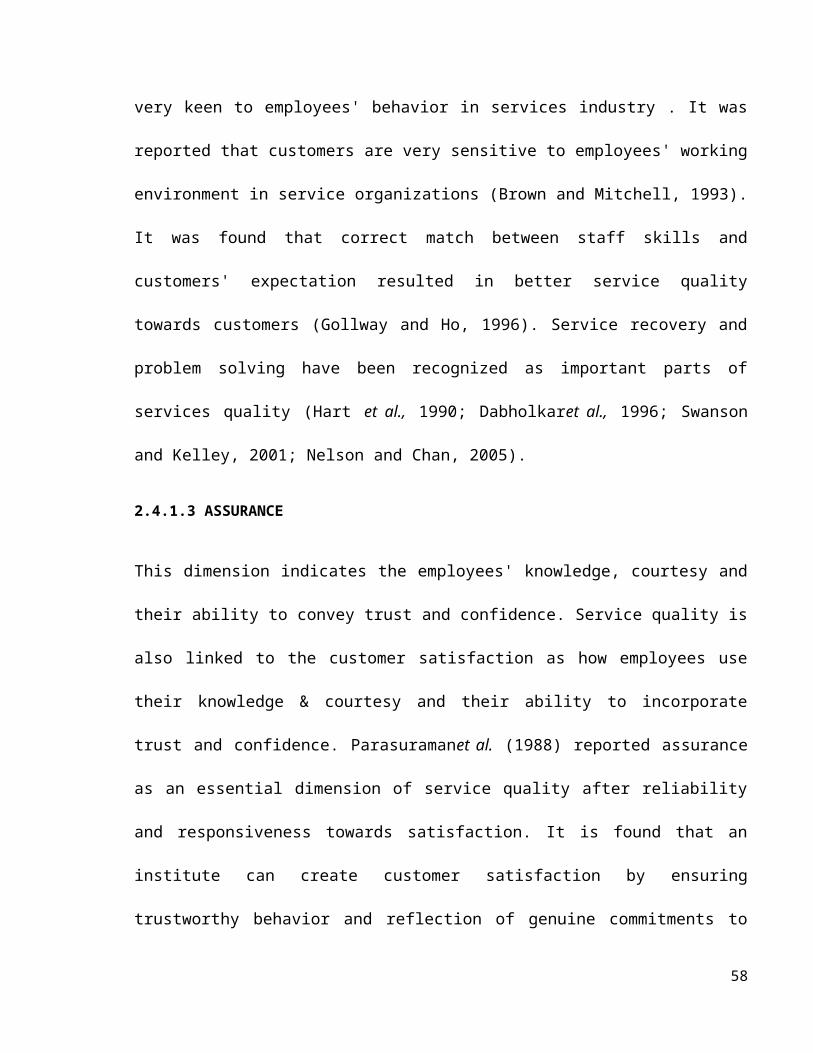
little difference between mean values (0.18). It indicates that the teachers have overestimated
the degree the students’ applicability of practical knowledge at work. However, both students
and teachers accepted that the degree of the students’ applic
As far as the SD value is considered, the both values are less than one i.e. the mean values are
significant which means the effect of views is large.
ability of practical knowledge at work truly well.
Students’ oral comments – The comments of the students supported the above evidence.
Teachers’ oral comments - The comments of the teachers supported the above evidence.
16. Paying attention to individual student when teaching
(x) SD
Students’ Views 3.65 0.73
Teachers’ Views 3.66 0.51
According to the above data, it is evident that both Mean values are between 3 and 4, which
mean means, “highly satisfied” to “very highly satisfied” (3.65, 3.66). The mean value of
students’ responses is 3.65 whereas the mean value of teachers’ responses is 3.66. There is
onlya little difference between mean values (0.01). It indicates that the teachers have little
overestimated the degree of paying attention to individual student when teaching. However,
both students and teachers accepted that the degree of paying attention to individual student
when teaching truly well.
58
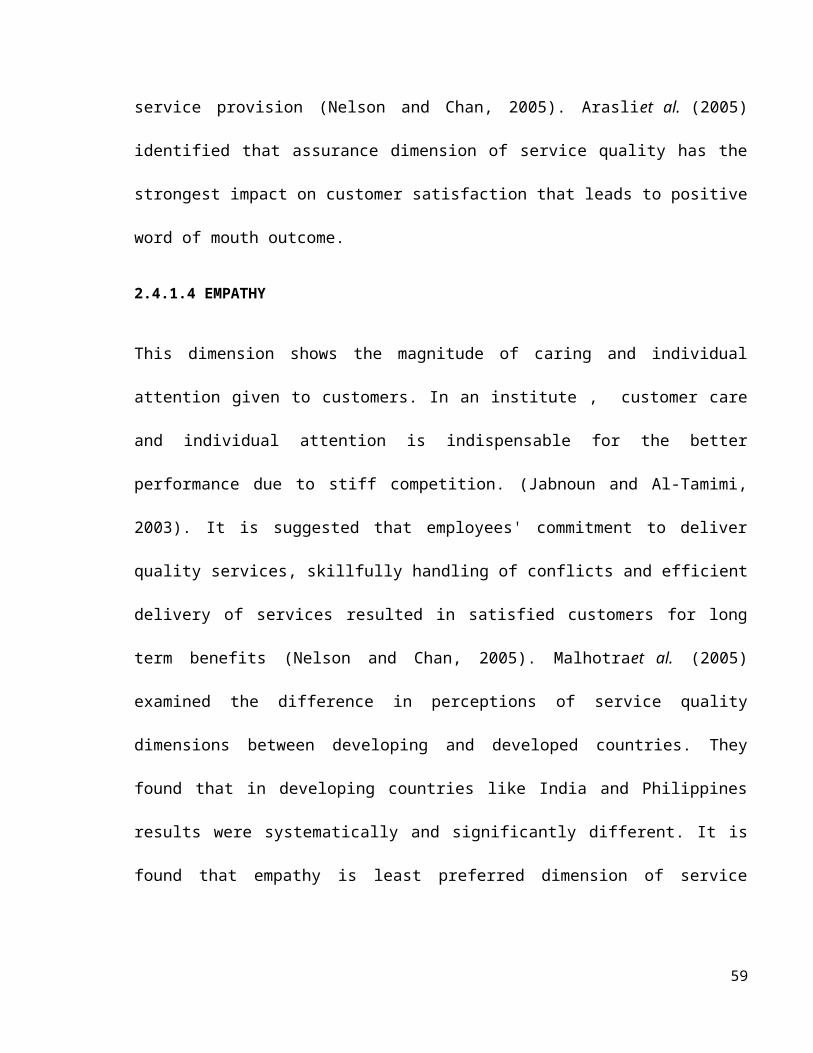
As far as the SD value is considered, the both values are less than one i.e. the mean values are
significant which means the effect of views is large.
Students’ oral comments – The comments of the students supported the above evidence.
Teachers’ oral comments - The comments of the teachers supported the above evidence.
17. Taking effort to back up dull students when teaching
(x) SD
Students’ Views 3.64 0.61
Teachers’ Views 3.54 0.57
According to the above data, it is evident that both Mean values are between 3 and 4, which
mean means, “highly satisfied” to “very highly satisfied” (3.64, 3.54). The mean value of
students’ responses is 3.64 whereas the mean value of teachers’ responses is 3.54. There is
only a little difference between mean values (0.1). It indicates that the students have little
overestimated the degree of taking effort to back up dull students when teaching. However,
both students and teachers accepted that the degree of taking effort to back up dull students
when teaching truly well.
As far as the SD value is considered, the both values are less than one i.e. the mean values are
significant which means the effect of views is large.
Students’ oral comments – The comments of the students supported the above evidence.
Teachers’ oral comments - The comments of the teachers supported the above evidence.
18. Having a plan to back up dull students
59
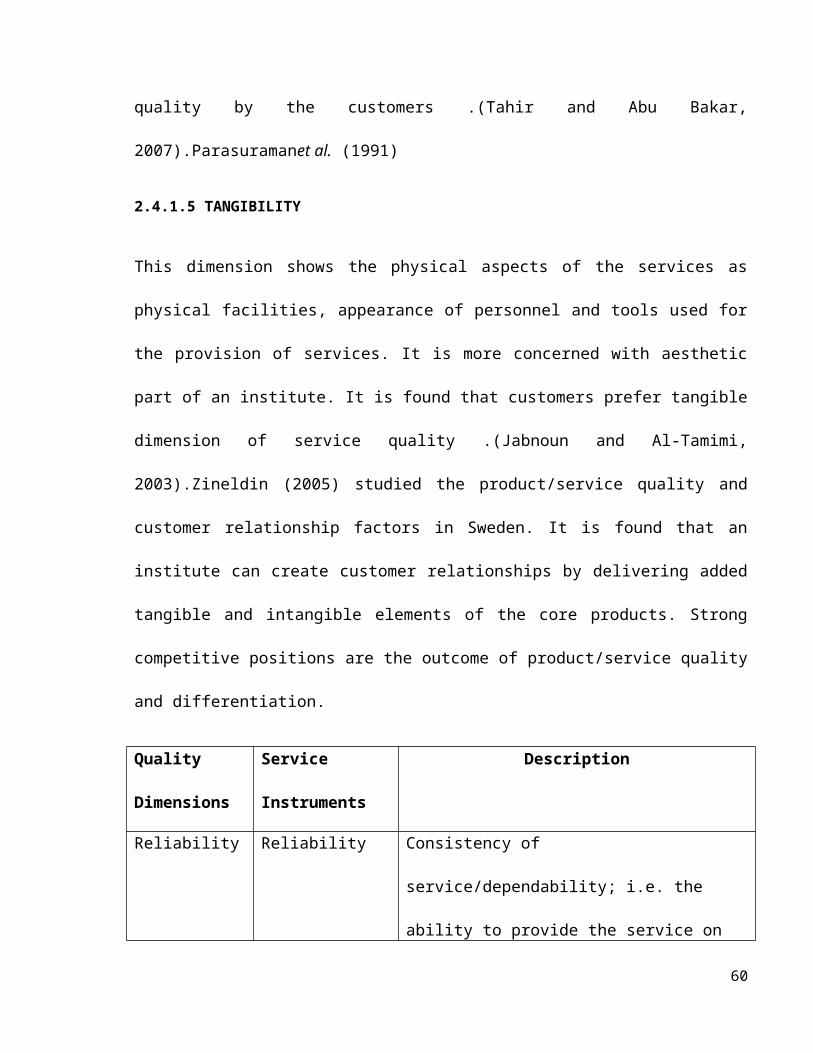
(x) SD
Students’ Views 3.33 0.87
Teachers’ Views 3.32 0.70
According to the above data, it is evident that both Mean values are between 3 and 4, which
mean means, “highly satisfied” to “very highly satisfied” (3.33, 3.32). The mean value of
students’ responses is 3.33 whereas the mean value of teachers’ responses is 3.32. There is
only a little difference between mean values (0.01). It indicates that the students have little
overestimated the degree of having a plan to back up dull students. However, both students
and teachers accepted that the degree of having a plan to back up dull students truly well.
As far as the SD value is considered, the both values are less than one i.e. the mean values are
significant which means the effect of views is large.
Students’ oral comments – The comments of the students supported the above evidence.
Teachers’ oral comments - The comments of the teachers supported the above evidence.
19. Having a plan to enhance the bright students
(x) SD
Students’ Views 3.23 0.91
Teachers’ Views 3.30 0.70
According to the above data, it is evident that both Mean values are between 3 and 4, which
mean means, “highly satisfied” to “very highly satisfied” (3.32, 3.30). The mean value of
students’ responses is 3.32 whereas the mean value of teachers’ responses is 3.30. There is
only a little difference between mean values (0.02). It indicates that the students have little
60
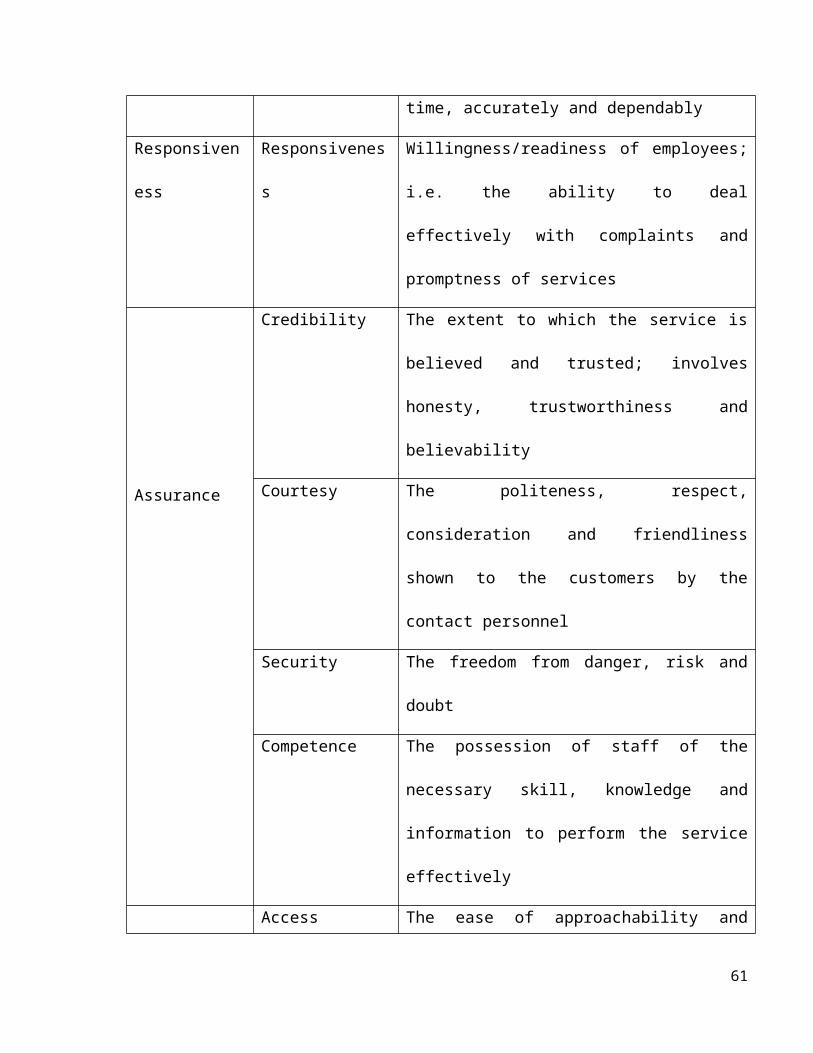
overestimated the degree of having a plan to enhance the bright students. However, both
students and teachers accepted that the degree of having a plan to enhance the bright students
truly well.
As far as the SD value is considered, the both values are less than one i.e. the mean values are
significant which means the effect of views is large.
Students’ oral comments – The comments of the students supported the above evidence.
Teachers’ oral comments - The comments of the teachers supported the above evidence.
20. Degree of not being biased when teaching
(x) SD
Students’ Views 3.28 1.22
Teachers’ Views 3.78 0.54
According to the above data, it is evident that both Mean values are between 3 and 4, which
mean means, “highly satisfied” to “very highly satisfied” (3.28, 3.78). The mean value of
students’ responses is 3.28 whereas the mean value of teachers’ responses is 3.78. There is
only a little difference between mean values (0.5). It indicates that the teachers have
muchoverestimated the degree of not being biased when teaching. However, both students and
teachers accepted that the degree of degree of not being biased when teaching truly well.
As far as the SD value is considered, the SD value of students side is more than one i.e. the
mean value is significant which means the effect of views is large whereas the SD value of
61
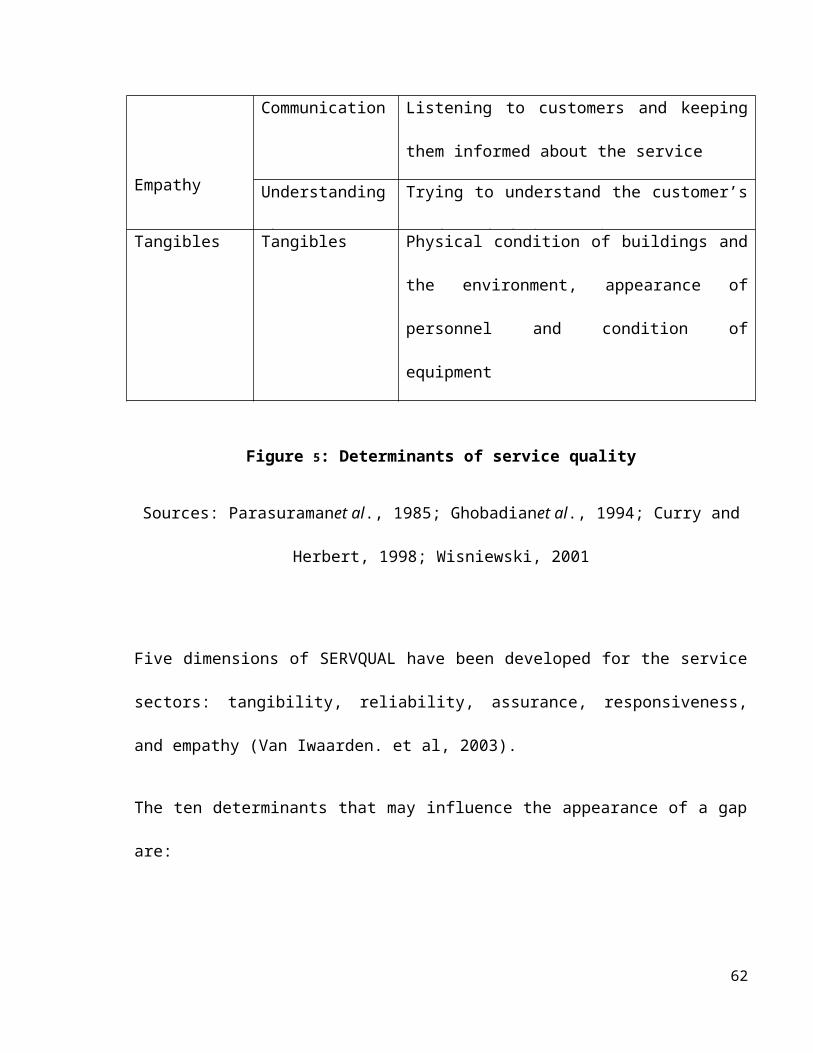
teachers side is less than one i.e. the mean values are significant which means the effect of
views is large.
Students’ oral comments – The comments of the students supported the above evidence.
Teachers’ oral comments - The comments of the teachers supported the above evidence.
21. Availability instrument for lessons
(x) SD
Students’ Views 2.91 1.04
Teachers’ Views 2.86 0.93
According to the above data, it is evident that both Mean values are between 2 and 3, which
mean means, “satisfied” to “highly satisfied” (2.91, 2.86). The mean value of students’
responses is 2.91 whereas the mean value of teachers’ responses is 2.86. There is only a little
difference between mean values (0.05). It indicates that the students have little overestimated
the degree of availability instrument for lessons. However, both students and teachers accepted
that the degree of degree of availability instrument for lessons truly well.
As far as the SD value is considered, the SD value of students side is more than one i.e. the
mean value is significant which means the effect of views is large whereas the SD value of
teachers side is less than one i.e. the mean values are significant which means the effect of
views is large.
Students’ oral comments – The comments of the students supported the above evidence.
Teachers’ oral comments –Although teachers mentioned above idea in the questionnaire, they
claimed that there is lack of material for practicals and also they claimed that machines and
62
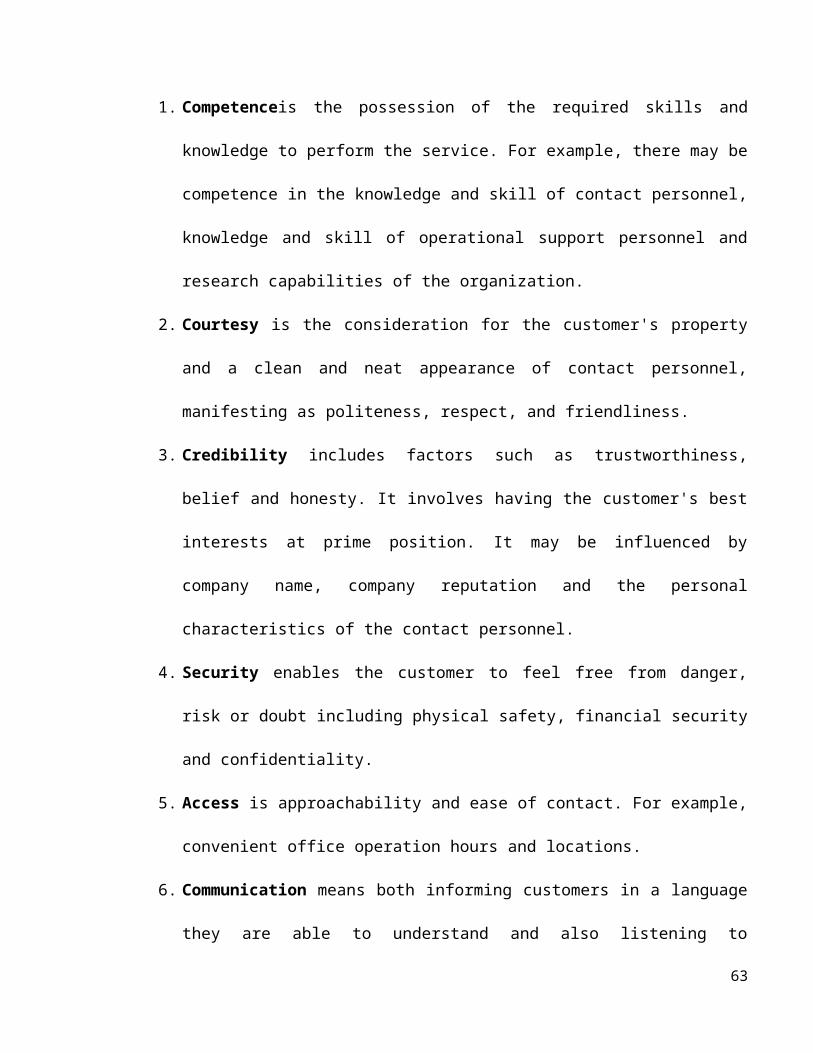
practical equipment are broken. In some occasions, teachers claimed that little equipment like
square piles, grinders etc. were not available.
22. Explaining the theory before practical clearly
(x) SD
Students’ Views 3.68 0.63
Teachers’ Views 3.76 0.42
According to the above data, it is evident that both Mean values are between 3 and 4, which
mean means, “highly satisfied” to “very highly satisfied” (3.68, 3.76). The mean value of
students’ responses is 3.68 whereas the mean value of teachers’ responses is 3.76There is only a
little difference between mean values (0.8). It indicates that the teachers have little
overestimated the level of explaining the theory before practical clearly. However, both
students and teachers accepted that the level of explaining the theory before practical truly
well.
As far as the SD value is considered, the both values are less than one i.e. the mean values are
significant which means the effect of views is large.
Students’ oral comments – The comments of the students supported the above evidence.
Teachers’ oral comments - The comments of the teachers supported the above evidence.
23. Availability of support of technical assistant satisfactorily
(x) SD
Students’ Views 2.54 1.16
63
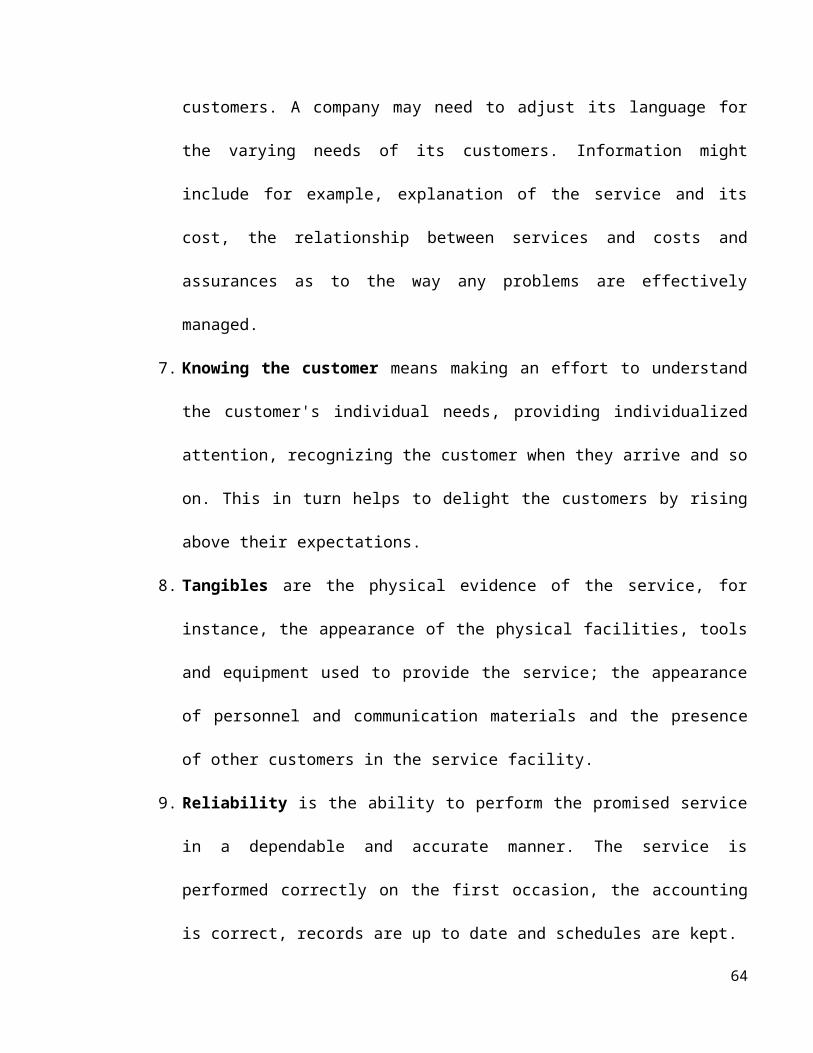
Teachers’ Views 2.62 0.97
According to the above data, it is evident that both Mean values are between 2 and 3, which
mean means, “satisfied” to “highly satisfied” (2.58, 2.62). The mean value of students’
responses is 2.58 whereas the mean value of teachers’ responses is 2.62. There is only a little
difference between mean values (0.04). It indicates that the teachers have little overestimated
the degree of availability of support of technical assistant satisfactorily. However, both students
and teachers accepted that the degree of availability of support of technical assistant truly well.
As far as the SD value is considered, the SD value of students side is more than one i.e. the
mean value is significant which means the effect of views is large whereas the SD value of
teachers side is less than one i.e. the mean values are significant which means the effect of
views is large.
Students’ oral comments – The comments of the students supported the above evidence.
Teachers’ oral comments - The comments of the teachers supported the above evidence.
24. Using teaching aids when teaching
(x) SD
Students’ Views 3.36 0.83
Teachers’ Views 3.28 0.77
According to the above data, it is evident that both Mean values are between 3 and 4, which
mean means, “highly satisfied” to “very highly satisfied” (3.36, 3.28). The mean value of
students’ responses is 3.36 whereas the mean value of teachers’ responses is 3.28. There is
64
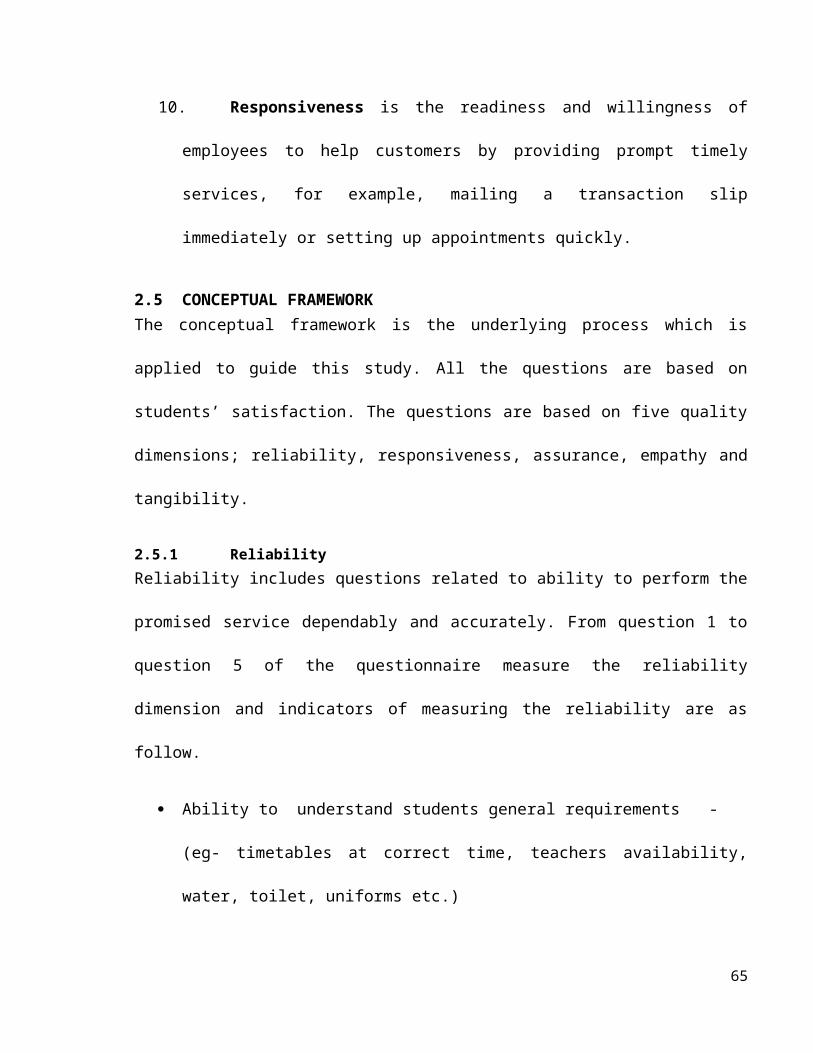
only a little difference between mean values (0.08). It indicates that the students have little
overestimated the level of using teaching aids when teaching. However, both students and
teachers accepted that the level of using teaching aids when teaching truly well.
As far as the SD value is considered, the both values are less than one i.e. the mean values are
significant which means the effect of views is large.
Students’ oral comments – The comments of the students supported the above evidence.
Teachers’ oral comments - Although the teachers mentioned the above idea, teachers in
some centres claimed that they are lack of models like engines, gear boxes etc.
25. Having a friendly classroom environment
(x) SD
Students’ Views 3.19 1.11
Teachers’ Views 3.14 0.91
According to the above data, it is evident that both Mean values are between 3 and 4, which
mean means, “highly satisfied” to “very highly satisfied” (3.19, 3.14). The mean value of
students’ responses is 3.19 whereas the mean value of teachers’ responses is 3.14. There is
only a little difference between mean values (0.05). It indicates that the students have little
overestimated the level of having a friendly classroom environment. However, both students
and teachers accepted that the level of having a friendly classroom environment truly well.
As far as the SD value is considered, the SD value of students side is more than one i.e. the
mean value is significant which means the effect of views is large whereas the SD value of
65
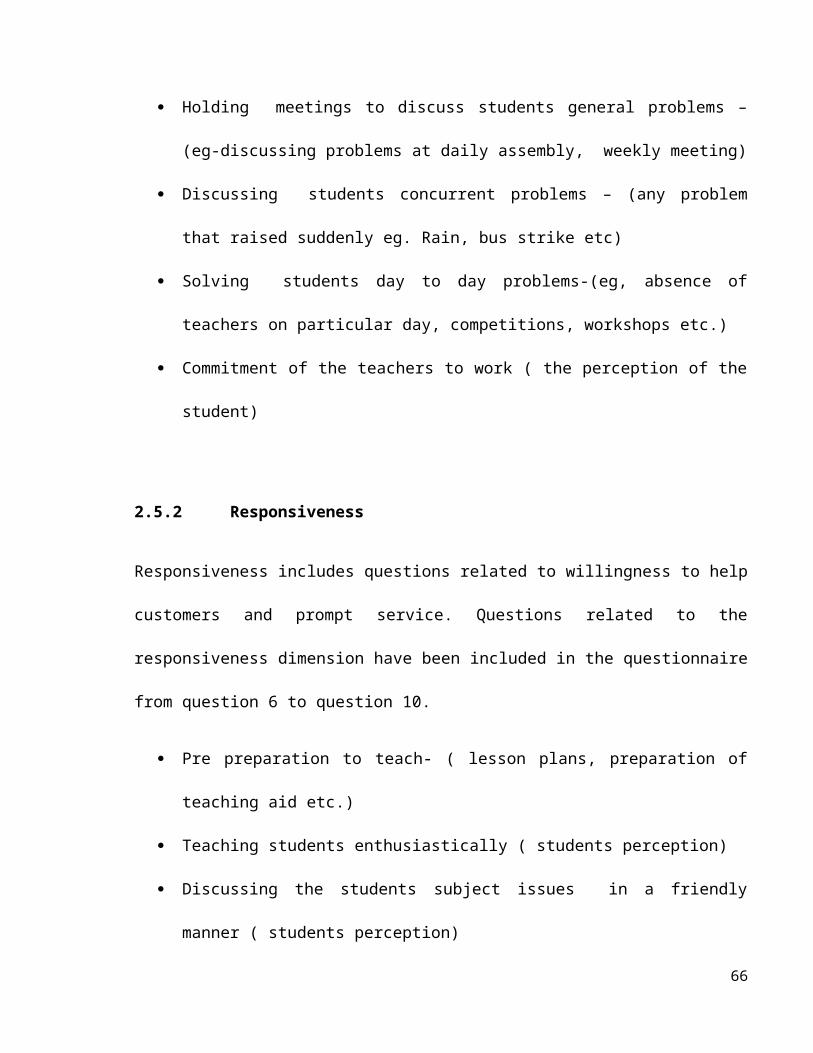
teachers side is less than one i.e. the mean values are significant which means the effect of
views is large.
Students’ oral comments – The comments of the students supported the above evidence.
Teachers’ oral comments –Although the teachers mentioned the above idea, they claimed
that the classroom conditions were not good. Even with the researchers’ observations, it was
evident that the class room conditions were not good. The space, light, ventilation, furniture etc.
were not in good condition.
66
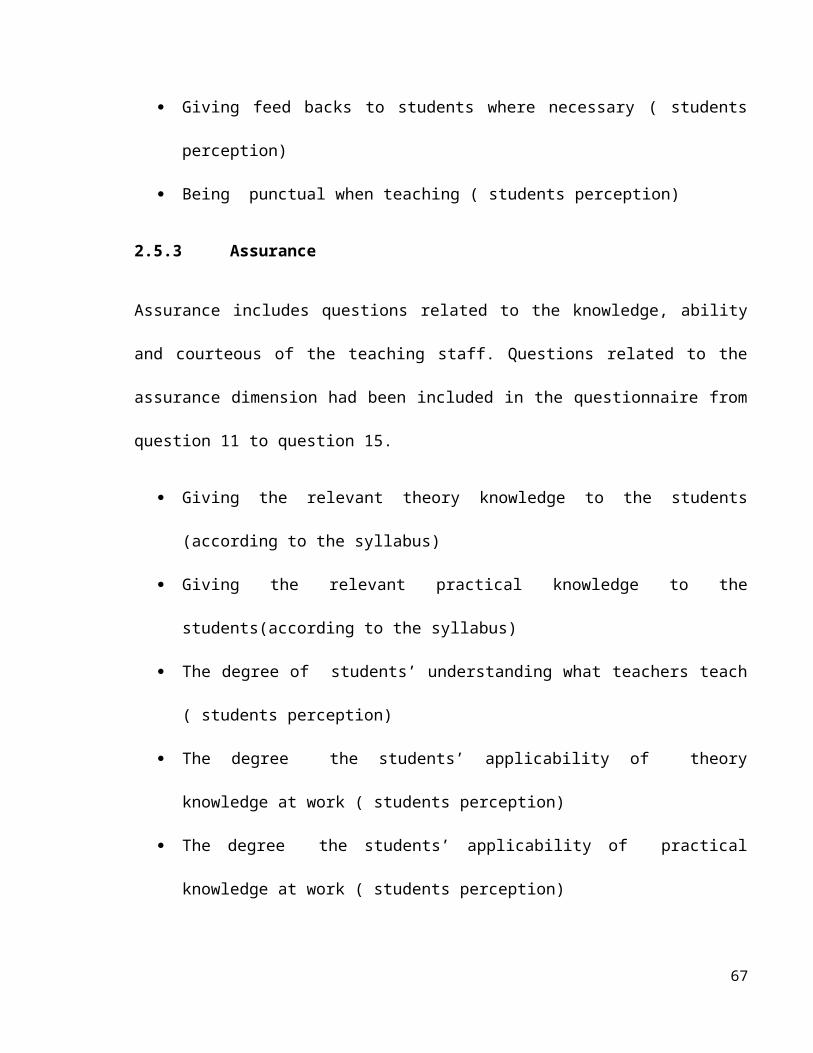
CHAPTER 4
CONCLUSION AND RECOMMENDATIONS
As far as the results from the data analysis is considered, it is obvious that the students and
teachers have responded positively to the 25 questions of the questionnaire. Out of the 25
questions, their answers for 21 questions are between highly satisfied to very highly satisfied
level, i.e. between 3-4 in the Likert scale. Just for four questions; question number 2,3,21 and
23, their responses are between satisfied to highly satisfied level, i.e. between 2-3 in the Likert
scale. So, it is evident that the students and the teachers are satisfied with the teaching learning
practices in the VTASL. So, the H 0 ; The VTA produces competent and confidence
technicians regardless the effectiveness of teaching learning process, can be rejected whereas
H 1; There is a co relation between the effectiveness of teaching learning practices in VTA and
producing competent and confidence technicians, can be accepted.
Apart from the data analysis from the questionnaire,face to face interviews with the students
and teachers were conducted by the researcher. There by, some solitary deviant characteristics
of the teaching learning practices of the VTASL were identified. But, those problems were not
identified from the answers to the questionnaire. Oral answers for questions number 12, 21, 24
and 25 showed these deviant characteristics.
As far as question number 12 , giving the relevant practical knowledge to the students , is
concerned, both teachers and students of almost all the centers claimed that there is a scarcity of
materials and equipment for practical.
67
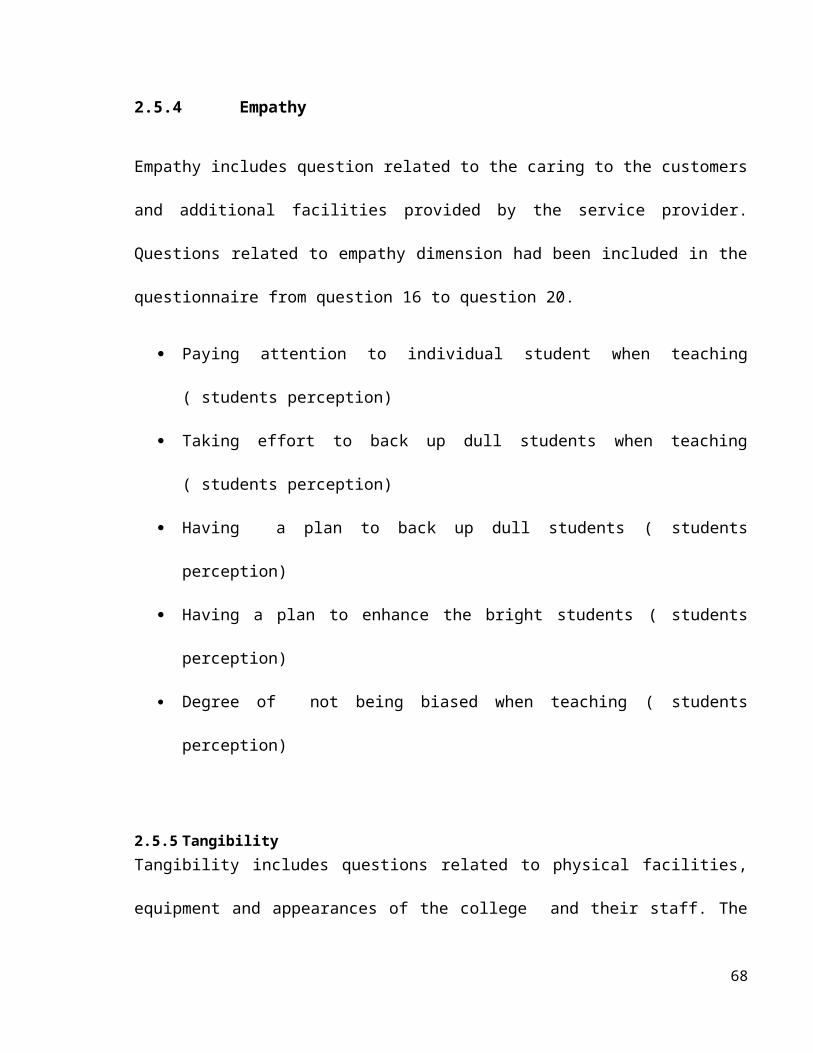
As far as the question number 21 is considered;Availability instrument for lessons, Although
teachers mentioned that they were very highly satisfied with the Availability instrument for
lessons, in the oral discussions , they claimed that there is lack of material for practical and also
they claimed that machines and practical equipment are broken. In some occasions, teachers
claimed that even little equipment like square piles, grinders etc. were not available.
As far as the question number 24 is considered; Using teaching aids when teaching, Although
the teachers mentioned that they were highly satisfied with using teaching aids when teaching,
teachers in some centres claimed that they are lack of models like engines, gear boxes etc.
As far as question number 25 ,having a friendly classroom environment, is concerned, both
teachers and students mentioned that they are highly satisfied with the classroom environment,
but in many centers, the classroom environment was not satisfactory. The light, space,
ventilation etc. were in a poor condition and both teachers and the students claimed on it and
this situation was obvious for any visitor.
As far as the standard deviation is considered, on the teachers side , the standard deviation for
all the 25 questions was less than one which means the answers are significant. On the students’
side , the standard deviation for 20 questions was less than one. For other 5 questions the
standard deviation was more than one. It means that the answers for these 5 questions were
insignificant, heterogeneous.
Finally, it can be mentioned that the teaching learning practices of VTASL run well regardless
some problematic individual situations. So, the researchers recommend continuing the ongoing
process adding some development practices.
68
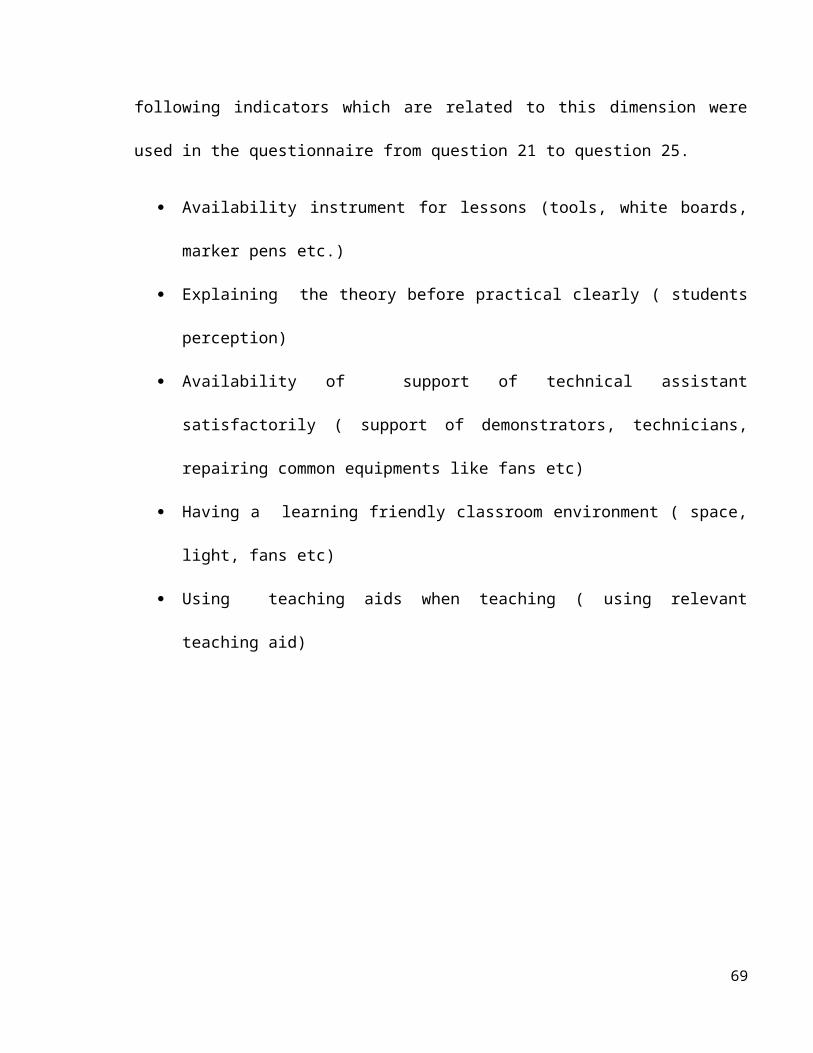
The researcher suggest to make materials and equipment available for practical in the VTA
centres. Alse the researcher suggest repairing the broken machines or replacing them. Even the
litte equipment con do a lot in teaching learning practices , the researcher suggest to make little
equipment like square piles, grinders etc available. The researcher suggest to provide models
like engines, gear boxes available for places where necessary.
The researcher also suggests to make a friendly classroom environmentwhere light, space,
ventilation etc. are satisfactory for the teaching learning practices.
69
BIBLIOGRAPHY
Anderson, E. Fornell, C. And Rust, R.T (1997) „Customer satisfaction, productivity and profitability: differences between goods and services‟. Marketing science, vol.16 no.2, pp.129-45.
Auh, S.And Johnson, M. D. (2005). Compatibility effects in evaluations of satisfaction and loyalty. Journal of Economic Psychology. 26, 35 – 57.
Beerli.A. (2004).A Model of Customer Loyalty in the Retail Banking Market. pp.253 - 275.Barsky. (1992).www.businessdictionary.com. [Online] http://www.
businessdictionary.com.
Berry, L.L. (1995) Relationship marketing of services- growing interest, emerging COSE: Its impact perspectives‟. Journal of the Academy of marketing science, vol.23 No.4, pp.236-45.
Buttle, F. (2004) „Customer relationship management: Concepts and tools, Elsevier, oxford.
Caruana, A. M. (1998). “Service quality and satisfaction – the moderating role of value”. European Journal of Marketing, Vol. 34 Nos 11/12, pp. 1338-52. .
Clark, M. (1997) Modeling the impact of customer- employee relationships on customer retention rates in a major UK retail bank management decisions, 35(4), pp.293-301.
Cronin Joseph Jr J, Taylor S . (1992)."Measuring Service Quality: A Reexamination and Extension," .
Cronin, J.J.J. and Taylor, S.A. (1992). “Measuring service quality: a reexamination and extension”. Journal of Marketing, Vol. 56 No. 3, , pp. 55-68.
Crosby, L.A, Evans, K.R. and Cowles, D. (1990) Relationship quality in services selling: An interpersonal influence perspective‟. Journal of marketing, vol. 54, July, pp.68-81.
Dawkins, P.M and Reichheld, F.F. (1990) „Customer retention as a competitive weapon‟. Directors and board, summer, pp.42-7.
70
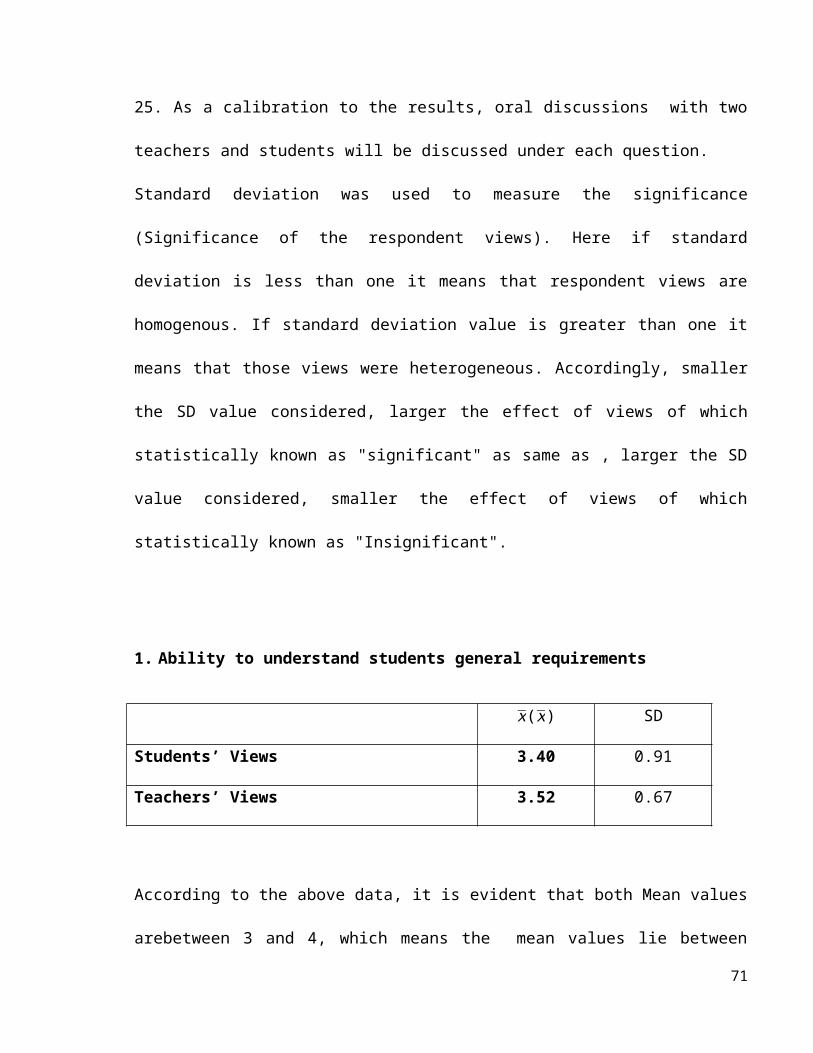
Douglas L, Connor R. (2003). Attitudes to service quality- the expectation gap. Nutrition & Food Science, Vol. 33 Number 4, p.165-172.
Druker,P.F.(1973) Management,Task,Reponsibilities, and Practices. Harper and Row, New York.
Edvardsson .(1988). www.marketing91.com. [Online] 2007. http://www. marketing91.com.
Faizan, M. M., NAwaz, M. S. Khan, Z. (2011). Impact of customer satisfaction on customer loyalty and intention to switch: Evidence from Banking sector of Pakistan International Journal of Busioness and Social Science. 2(16).
Fogli.(2006).www.businessdictionary.com. [Online] http://www.
businessdictionary.com.
Gerpott, T.J, Rams, W. & Schinder, A. (2001). Customer retention, loyalty and satisfaction in the German mobile cellular telecommunications market. Telecommunications policy., 25, 249-269.
Gronroos, C. (1984). “A service quality model and its marketing implications”. European Journal of Marketing, Vol. 18 No. 4, pp. 36-44.
Gronroos, C. (2007). “A service quality model and its marketing implications”.
Hansemark, O.C, and Albinson, M. (2004). Customer satisfaction and retention: The experiences of Individual employees. Managing service Quality. 14(1), 40-57.
Jamesb. (2011).www.businessdictionary.com. [Online] http://www.
businessdictionary.com.
Jiang, J.J., Klein, G. and Crampton, S.M. (2000). “A note on SERVQUAL reliability and validity in information system service quality measurement”,. Decision Sciences, Vol. 31 No. 3, pp. 725-44.
Johns, N. (1999). What is this thing called service?,. European Journal of Marketing, Vol. 33. , p.958-973.
Johnson, J. (1996). “Linking employee perceptions of service climate to customer satisfaction”. Personnel Psychology, Vol. 49 No. 4, pp. 831-851.
Lee, H., Lee, Y. & Yoo, D. . (2000). The determinants of perceived service quality and its relationship with satisfaction . Journal of Service Marketing, Vol. 14, Number 3. , p.217-231.
71
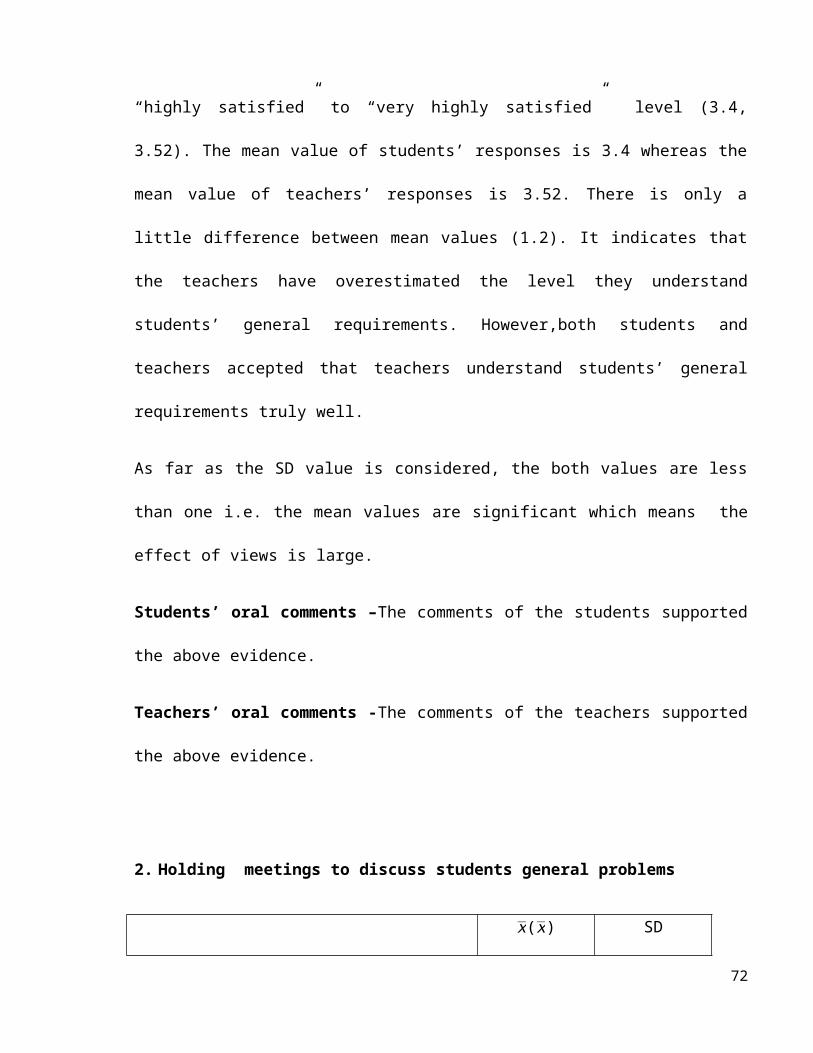
Lovelock. (2007). www.marketing91.com. [Online] 2007. http://www. marketing91.com.
Matzler. (2002). www.marketing91.com. [Online] 2007. http://www. marketing91.com.
Mohsan, F, Nawaz, M.M, Khan, M.S, Shallkat, Z and Aslam, N.(2011) Impact of customer satisfaction on customer loyalty and intentions to switch: Evidence from banking sector of Pakistan. Intrnational Journal of business and social science. Vol.2 No.16.
Negi, R. (2009). Determining customer satisfaction through perceived service quality: A study of Ethiopian mobile users,. International Journal of Mobile Marketing.
Nelson & Chan. (2005). www.marketing91.com. [Online] 2013. http://www. marketing91.com.
Oliver. (1997) .www.businessdictionary.com. [Online] http://www.
businessdictionary.com.
Parasuraman. (1988). A conceptual model of service quality and its implications . Journal of Marketing, Vol. 49, 41-50.
Parasuraman, et al, Zeithmal VA. (1985)."A conceptual model of service quality and its implication for future research".
Rust, R. T.Zahorik, A. (1993). Customer Satisfaction, Customer Retention and Market Share. Journal Retail Summer 69 (2). 193 – 215.
Samuel, E. (2006).Customer satisfaction in the mobile telecommunications in Nigeria.
Tam, J. (2004). “Customer satisfaction, service quality and perceived value: an integrative model”. Journal of Marketing Management, Vol. 20, pp. 897-917.
Taylor, S. A. And Baker, T. L. (1994). An assessment of the relationship between service quality and customer satisfaction in the formation of customers‟ purchase intentions. Journal of Retailing 70 (2) 163 – 178.
Van Iwaarden. et al. (2003).Service Quality Dimensions.
Walker. (1990).www.marketing91.com. [Online] 2013. http://www. marketing91.com
Wickramasinghe, E.S (2004) Principles of Management & Organizational theory. 1st Ed. Asliya Printers, No 259, Colombo Road , Kurunegala .
Wickramasinghe, E.S (2012) Research methods in Business Management and Organizational theory: A Gide to postgraduate thesis writing.1st Ed. Asliya Printers, No 259 , Colombo Road , Kurunegala .
Wickramasinghe, E.S (2012) Organizational Behaviour. 1st Ed. Asliya Printers, No
72
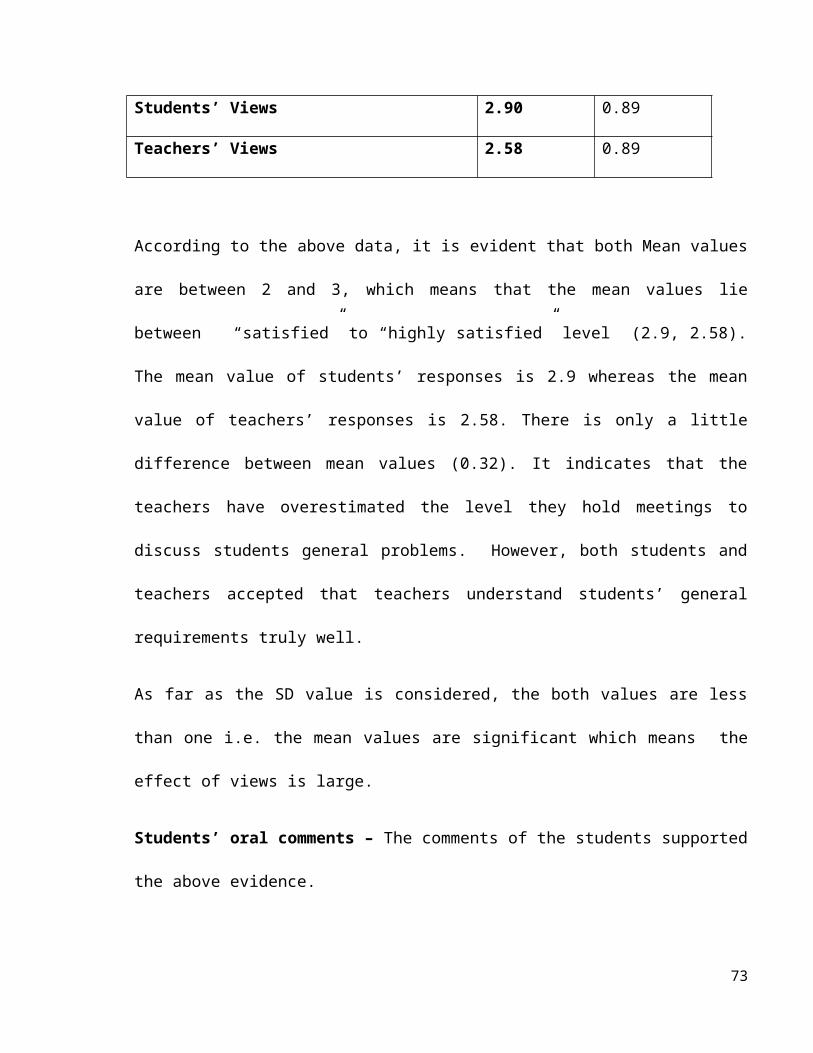
259, Colombo Road, Kurunegala.
Yi, Y. (1990). A critical review of consumer satisfaction, in Zeithaml, V.(Eds). Review of Marketing, p.68-123. .
Zeithaml, V.A., Berry, L.L. and Parasuraman, A. (1993). “The nature and determinants of customer expectations of service”. Journal of the Academy of Marketing Science, Vol. 21 No. 1, pp. 1-12.
Zeithmal, V. A. (2008). "Service Marketing".
Zeithmal, V. A.,Kotler ,p.(2013). www.marketing91.com. [Online] 2013. http://www. marketing91.com
73
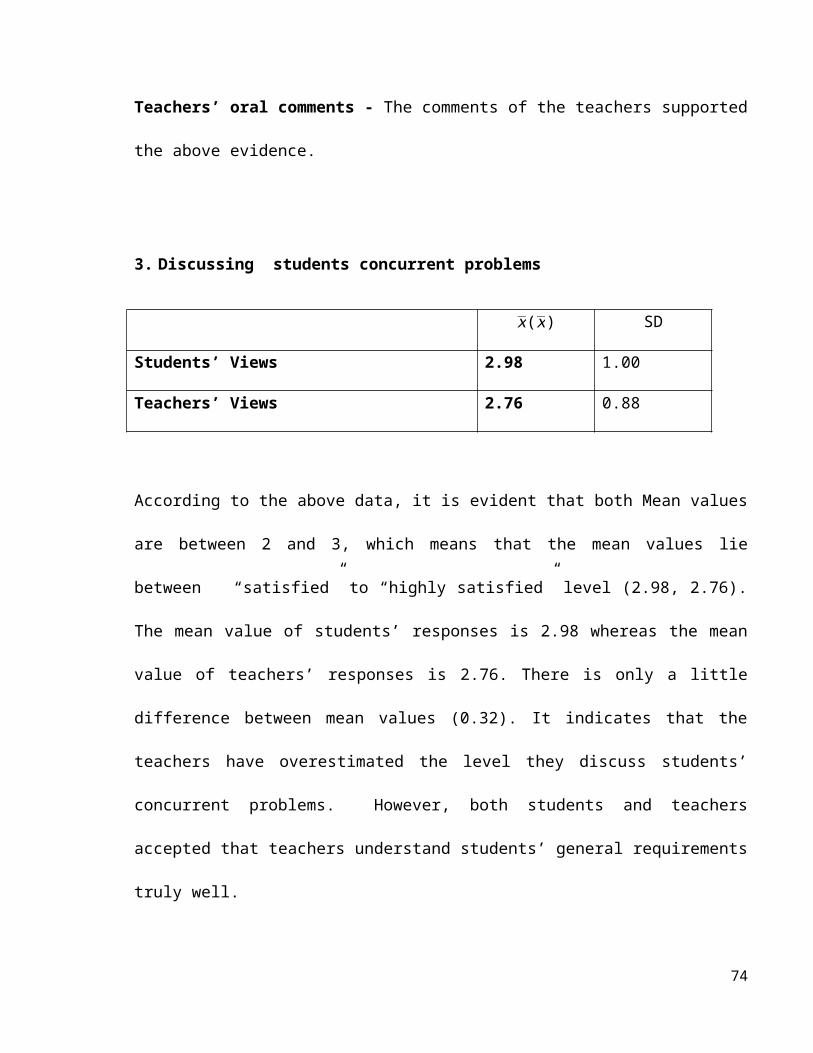
ANNEXURE - 01
(QUESTIONNAIRE - FOR THE STUDENTS)
Service Reliability:
01. Are you satisfied with the degree that teachers understand your general requirements ?
i. Highly satisfied
ii. Satisfied up to some extent
iii. No Idea
iv. Not satisfied
v. No, not satisfied at all
02. Are you satisfied with the process of holding meetings by the teachers to discuss students
general problems?
i. Highly satisfied
ii. Satisfied up to some extent
iii. No Idea
iv. Not satisfied
v. No, not satisfied at all
03. Are you satisfied with the degree of discussing students’ concurrent problems by the
teachers?
i. Highly satisfied
ii. Satisfied up to some extent
iii. No Idea
iv. Not satisfied
v. No, not satisfied at all
04. Are you satisfied with the way of solving students’ day to day problems by the teachers?
i. Highly satisfied
ii. Satisfied up to some extent
iii. No Idea
74
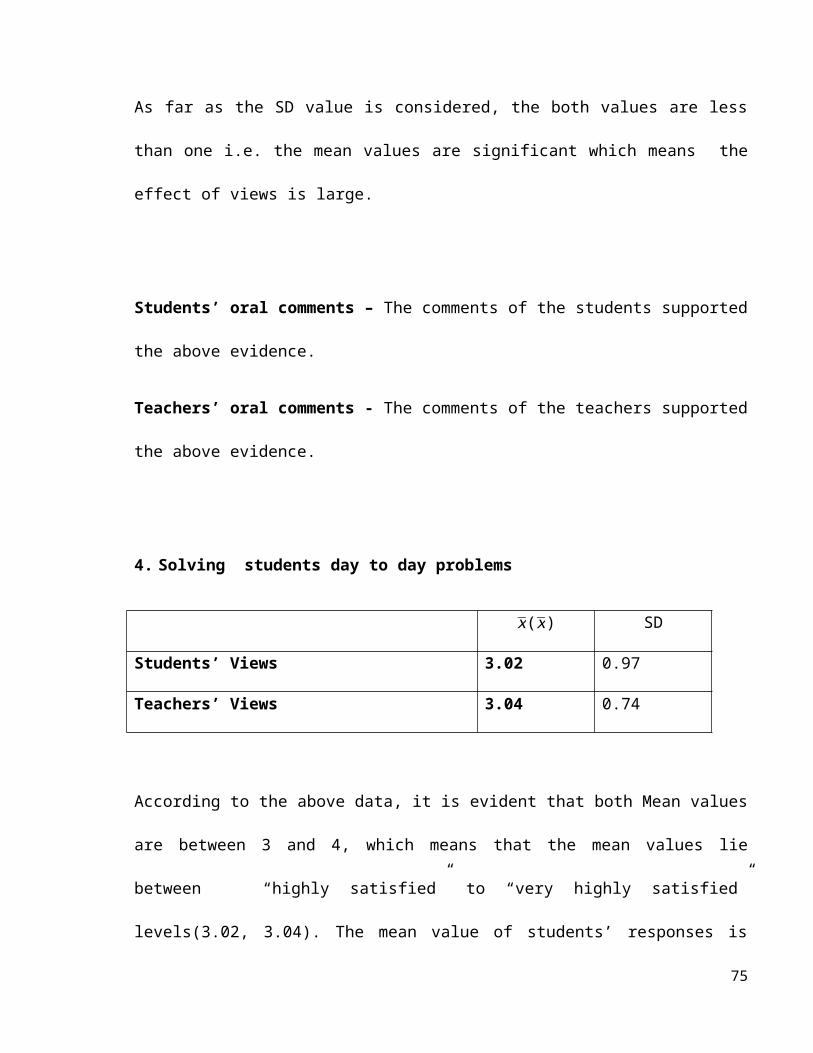
iv. Not satisfied
v. No, not satisfied at all
05. Are you satisfied with theCommitment of the teachers to teach ?
i. Highly satisfied
ii. Satisfied up to some extent
iii. No Idea
iv. Not satisfied
v. No, not satisfied at all
Service Responsiveness:
06. Are you satisfied with the level of pre preparation of the teachers to teach?
i. Highly satisfied
ii. Satisfied up to some extent
iii. No Idea
iv. Not satisfied
v. No, not satisfied at all
07. Are you satisfied with level of teaching of the teachers to students enthusiastically?
i. Highly satisfied
ii. Satisfied up to some extent
iii. No Idea
iv. Not satisfied
v. No, not satisfied at all
08. Are you satisfied with the level of discussing the students subject issues in a friendly manner by
your teachers?
i. Highly satisfied
ii. Satisfied up to some extent
iii. No Idea
iv. Not satisfied
v. No, not satisfied at all
75
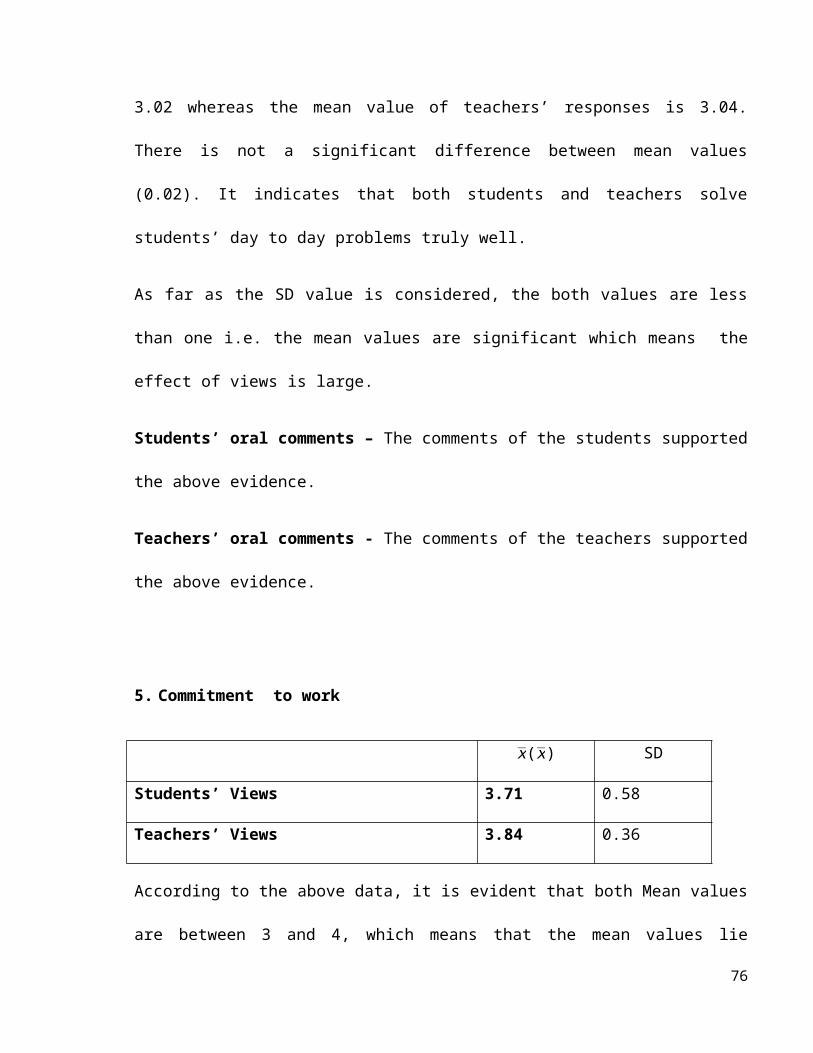
09. Are you satisfied with the level of giving feed backs to students where necessary by your
teachers?
i. Highly satisfied
ii. Satisfied up to some extent
iii. No Idea
iv. Not satisfied
v. No, not satisfied at all
10. Are you satisfied with the punctuality of your teachers when teaching?
i. Highly satisfied
ii. Satisfied up to some extent
iii. No Idea
iv. Not satisfied
v. No, not satisfied at all
11. Are you satisfied with disseminating the relevant theory knowledge to the students by your
teachers?
i. Highly satisfied
ii. Satisfied up to some extent
iii. No Idea
iv. Not satisfied
v. No, not satisfied at all
12. Are you satisfied with the disseminating the relevant practical knowledge to the students by
your teachers?
i. Highly satisfied
ii. Satisfied up to some extent
iii. No Idea
iv. Not satisfied
76
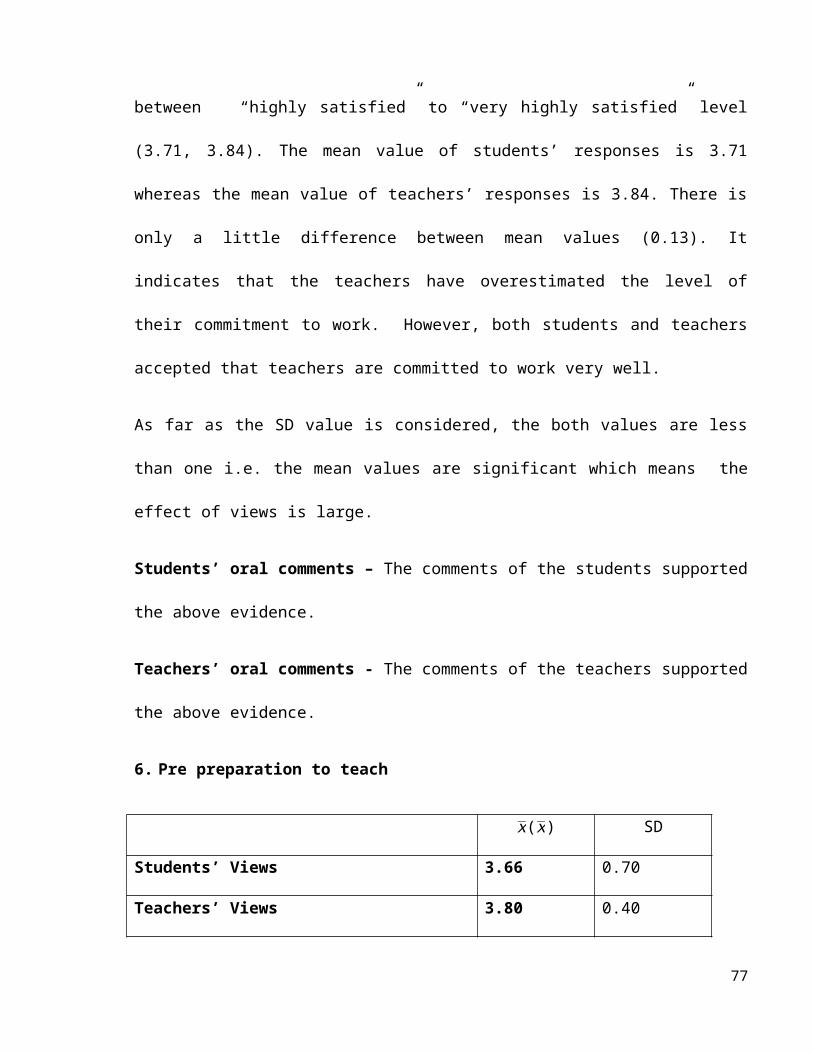
v. No, not satisfied at all
13. Are you satisfied with the degree of your understanding what teachers teach?
i. Highly satisfied
ii. Satisfied up to some extent
iii. No Idea
iv. Not satisfied
v. No, not satisfied at all
14. Are you satisfied with the degree of applicability of your theory knowledge at work?
i. Highly satisfied
ii. Satisfied up to some extent
iii. No Idea
iv. Not satisfied
iv. No, not satisfied at all
15. Are you satisfied with the degree of applicability of your practical knowledge at work?
i. Highly satisfied
ii. Satisfied up to some extent
iii. No Idea
iv. Not satisfied
v. No, not satisfied at all
Empathy
16. Are you satisfied with the degree of paying attention to individual student by your teachers
when teaching?
i. Highly satisfied
ii. Satisfied up to some extent
77
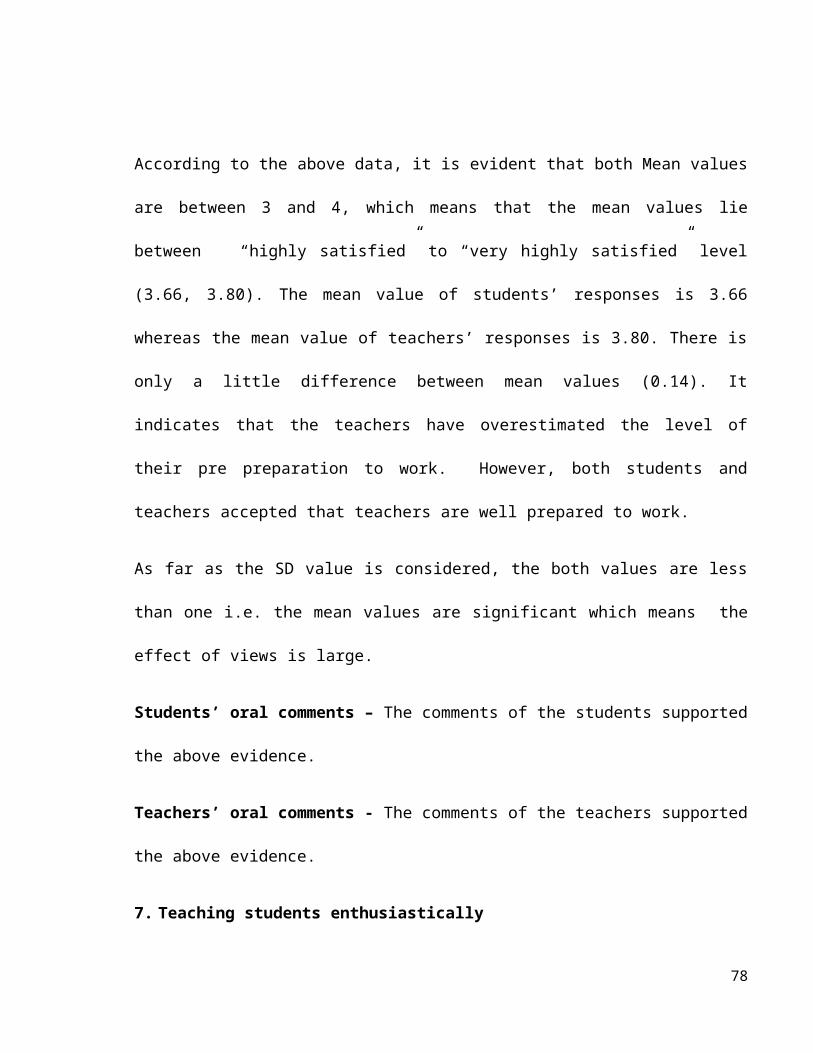
iii. No Idea
iv. Not satisfied
v. No, not satisfied at all
17. Are you satisfied about the degree of taking effort to back up dull students by your teachers
when teaching?
i. Highly satisfied
ii. Satisfied up to some extent
iii. No Idea
iv. Not satisfied
v. No, not satisfied at all
18. Are you satisfied with the degree of planning of teachers to back up dull students?
i. Highly satisfied
ii. Satisfied up to some extent
iii. No Idea
iv. Not satisfied
v. No, not satisfied at all
19. Are you satisfied with the degree of planning of your teachers to enhance the bright students?
i. Highly satisfied
ii. Satisfied up to some extent
iii. No Idea
iv. Not satisfied
v. No, not satisfied at all
20. Are you satisfied with the degree of being impartial by your teachers when teaching?
i. Highly satisfied
ii. Satisfied up to some extent
iii. No Idea
iv. Not satisfied
78
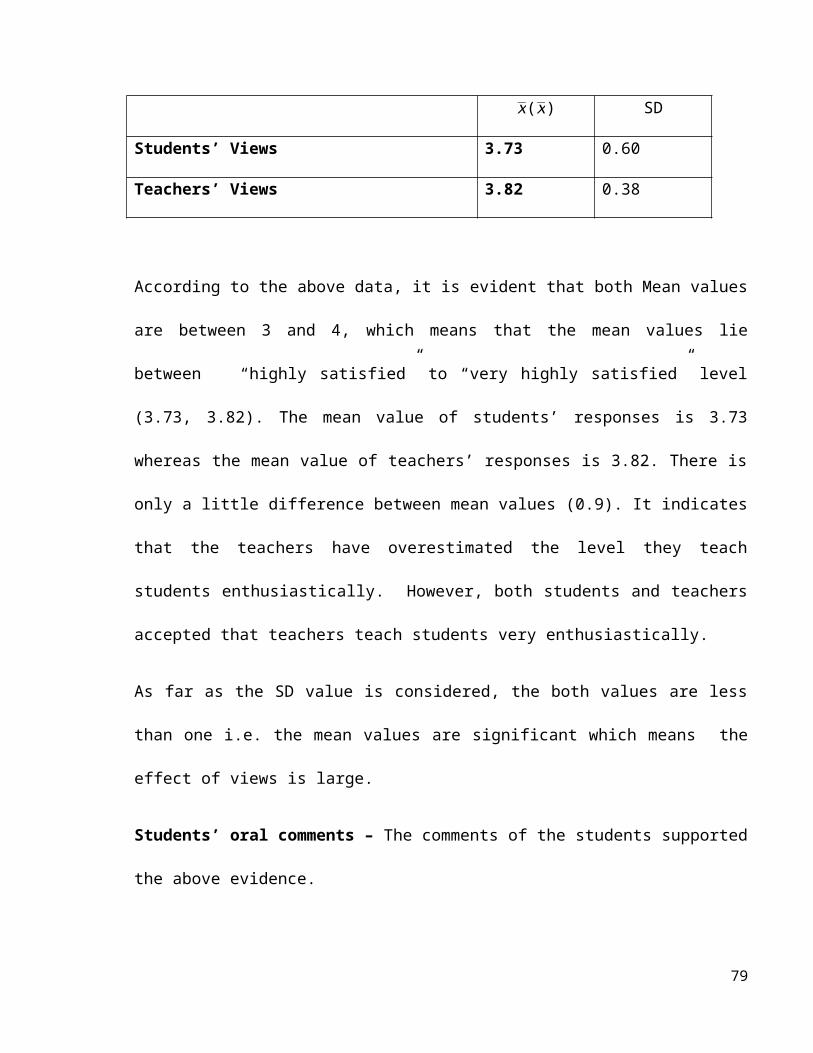
v. No, not satisfied at all
Tangibility:
21. Are you satisfied with level ofavailability of instrument for lessons ?
i. Highly satisfied
ii. Satisfied up to some extent
iii. No Idea
iv. Not satisfied
v. No, not satisfied at all
22. Are you satisfied with the level of clear explanation of theory before practical by your
teachers ?
i. Highly satisfied
ii. Satisfied up to some extent
iii. No Idea
iv. Not satisfied
v. No, not satisfied at all
23. Are you satisfied with the availability of support from technical assistant satisfactorily?
i. Highly satisfied
ii. Satisfied up to some extent
iii. No Idea
iv. Not satisfied
v. No, not satisfied at all
24. Are you satisfied with the degree of using teaching aids by your teachers when teaching ?
i. Highly satisfied
ii. Satisfied up to some extent
79
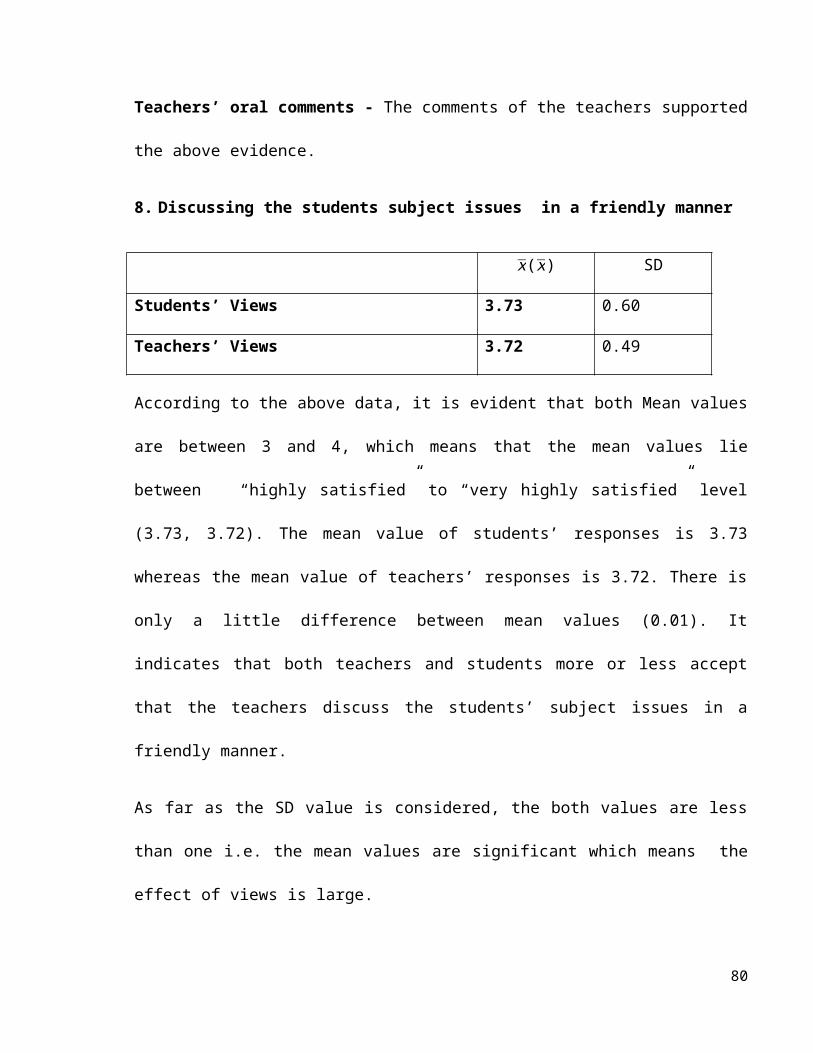
iii. No Idea
iv. Not satisfied
v. No, not satisfied at all
25. Are you satisfied with the level of having a friendly classroom environment?
i. Highly satisfied
ii. Satisfied up to some extent
iii. No Idea
iv. Not satisfied
v. No, not satisfied at all
ANNEXURE – 2
(QUESTIONNAIRE FOR THE TEACHERS)
.
Service Reliability:
01. Are you satisfied with the degree that you understand the students general requirements?
i. Highly satisfied
ii. Satisfied up to some extent
iii. No Idea
iv. Not satisfied
v. No, not satisfied at all
80
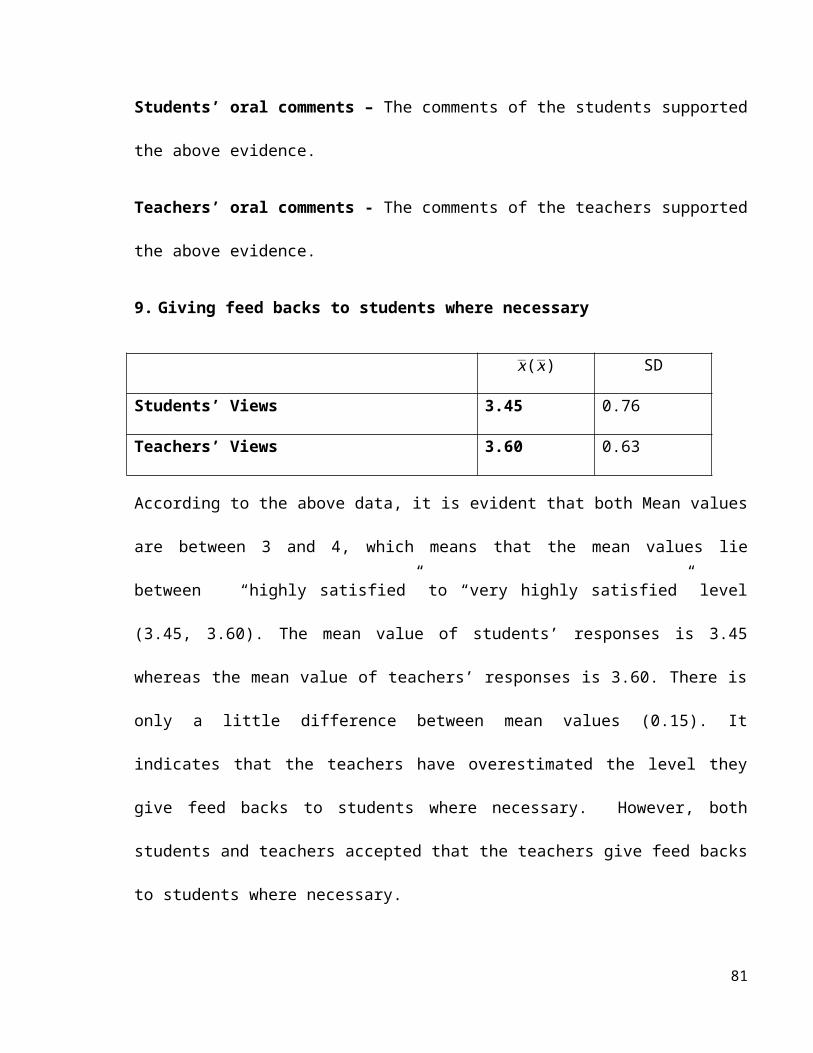
02. Are you satisfied with the frequency of holding meetings to discuss students general problems ?
i. Highly satisfied
ii. Satisfied up to some extent
iii. No Idea
iv. Not satisfied
v. No, not satisfied at all
03. Are you satisfied with the degree of discussing students’ concurrent problems by you?
i. Highly satisfied
ii. Satisfied up to some extent
iii. No Idea
iv. Not satisfied
vi. No, not satisfied at all
04. Are you satisfied with the way of solving students’ day to day problems by you?
i. Highly satisfied
ii. Satisfied up to some extent
iii. No Idea
iv. Not satisfied
v. No, not satisfied at all
05. Are you satisfied with your Commitment to teach ?
i. Highly satisfied
ii. Satisfied up to some extent
iii. No Idea
iv. Not satisfied
v. No, not satisfied at all
81
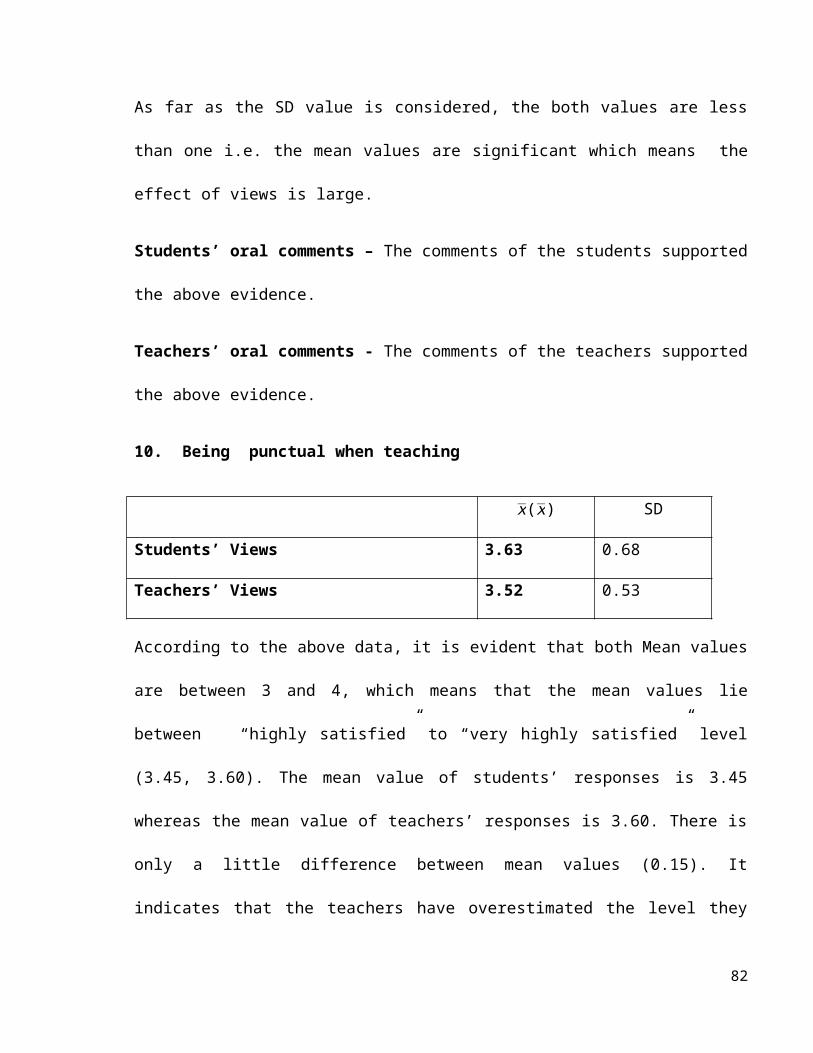
Service Responsiveness:
06. Are you satisfied with the level of your pre preparation to to teach?
i. Highly satisfied
ii. Satisfied up to some extent
iii. No Idea
iv. Not satisfied
v. No, not satisfied at all
07. Are you satisfied with level of your enthusiasm to teach?
i. Highly satisfied
ii. Satisfied up to some extent
iii. No Idea
iv. Not satisfied
v. No, not satisfied at all
08. Are you satisfied with the level of discussing the students subject issues in a friendly manner by
your teachers?
i. Highly satisfied
ii. Satisfied up to some extent
iii. No Idea
iv. Not satisfied
v. No, not satisfied at all
09. Are you satisfied with the level that you give feed backs to students where necessary?
i. Highly satisfied
ii. Satisfied up to some extent
iii. No Idea
iv. Not satisfied
v. No, not satisfied at all
82
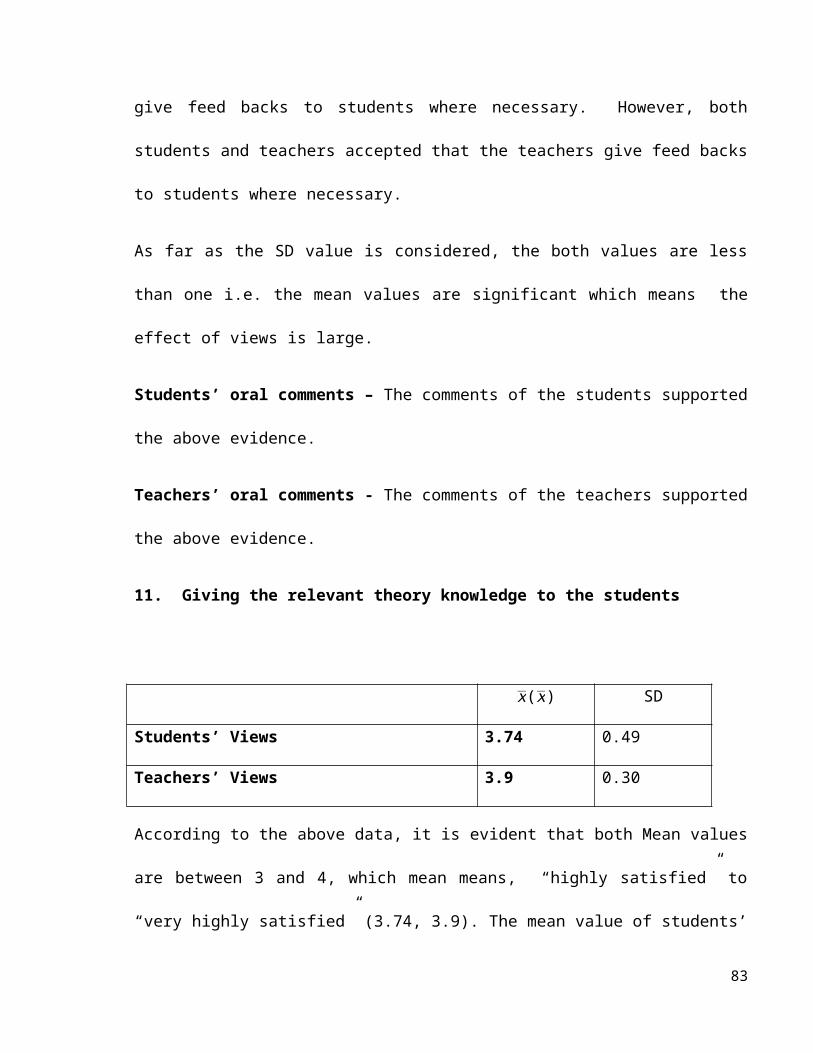
10. Are you satisfied with your punctuality when teaching?
i. Highly satisfied
ii. Satisfied up to some extent
iii. No Idea
iv. Not satisfied
v. No, not satisfied at all
Assurance
11. Are you satisfied with disseminating the relevant theory knowledge to the students by you?
i. Highly satisfied
ii. Satisfied up to some extent
iii. No Idea
iv. Not satisfied
v. No, not satisfied at all
12. Are you satisfied with the disseminating the relevant practical knowledge to the students by
you?
i. Highly satisfied
ii. Satisfied up to some extent
iii. No Idea
iv. Not satisfied
v. No, not satisfied at all
13. Are you satisfied with the degree of your understanding what you teach to the students ?
i. Highly satisfied
ii. Satisfied up to some extent
iii. No Idea
iv. Not satisfied
v. No, not satisfied at all
83
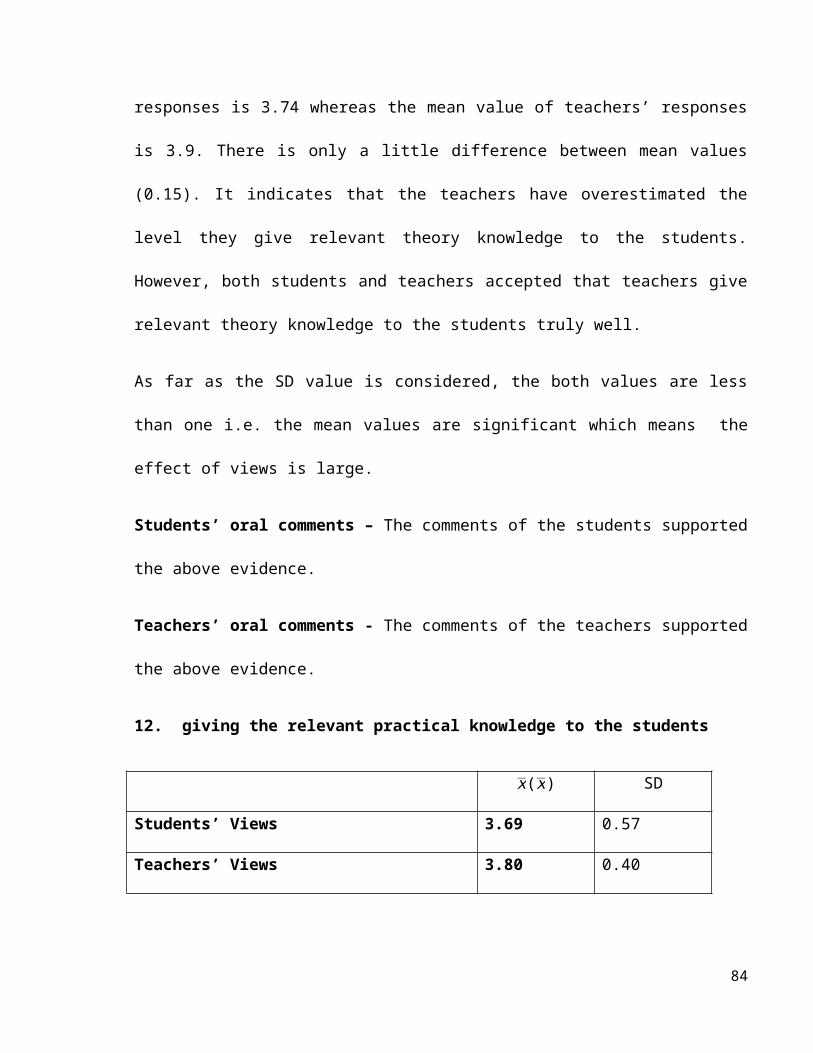
14. Are you satisfied with the degree of applicability of your students’ theory knowledge at
work?
i. Highly satisfied
ii. Satisfied up to some extent
iii. No Idea
iv. Not satisfied
v. No, not satisfied at all
15. Are you satisfied with the degree of applicability of your students’ practical knowledge at
work?
i. Highly satisfied
ii. Satisfied up to some extent
iii. No Idea
iv. Not satisfied
v. No, not satisfied at all
Empathy
16. Are you satisfied with the degree of your attention to individual student when you teach?
i. Highly satisfied
ii. Satisfied up to some extent
iii. No Idea
iv. Not satisfied
v. No, not satisfied at all
17. Are you satisfied about the degree of taking effort to back up dull students when you teach?
i. Highly satisfied
ii. Satisfied up to some extent
iii. No Idea
iv. Not satisfied
84
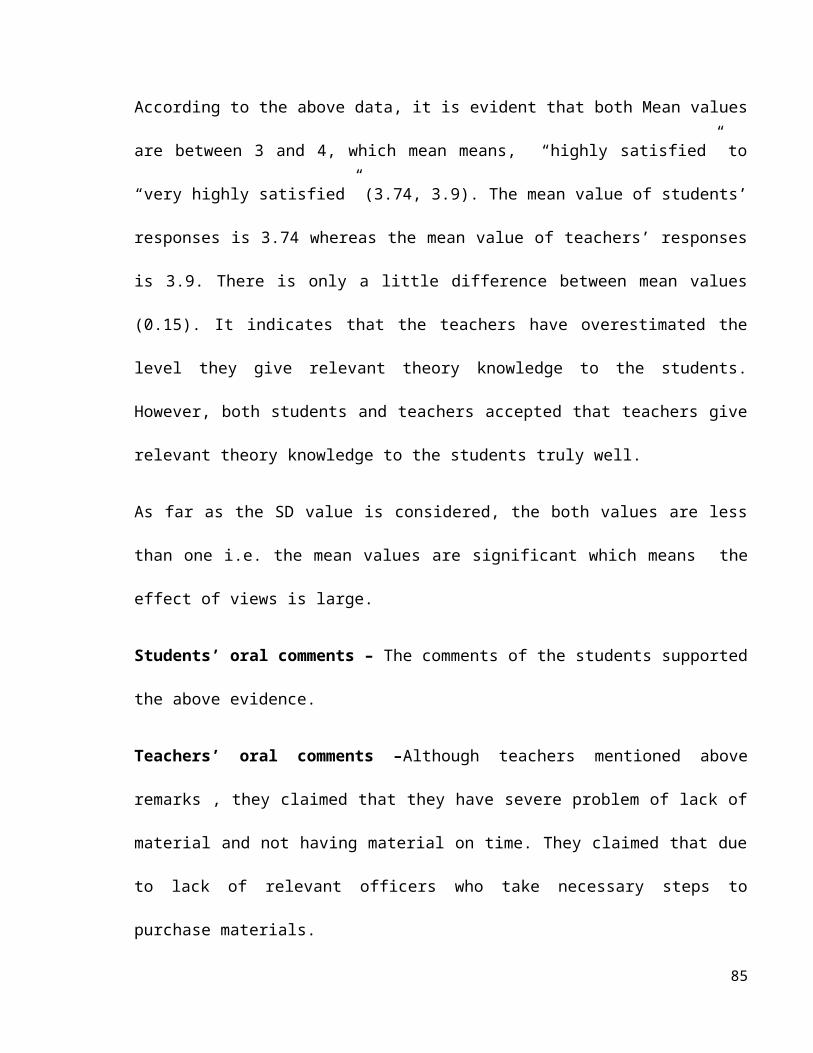
v. No, not satisfied at all
18. Are you satisfied with the degree of your planning to back up dull students?
i. Highly satisfied
ii. Satisfied up to some extent
iii. No Idea
iv. Not satisfied
v. No, not satisfied at all
19. Are you satisfied with the degree of your planning to enhance the brighter students?
i. Highly satisfied
ii. Satisfied up to some extent
iii. No Idea
iv. Not satisfied
v. No, not satisfied at all
20. Are you satisfied with the degree of being impartial by you when teaching?
i. Highly satisfied
ii. Satisfied up to some extent
iii. No Idea
iv. Not satisfied
v. No, not satisfied at all
Tangibility:
21. Are you satisfied with level ofavailability of instrument for lessons ?
i. Highly satisfied
ii. Satisfied up to some extent
iii. No Idea
iv. Not satisfied
v. No, not satisfied at all
22. Are you satisfied with the level of clear explanation of theory before practical by you?
85
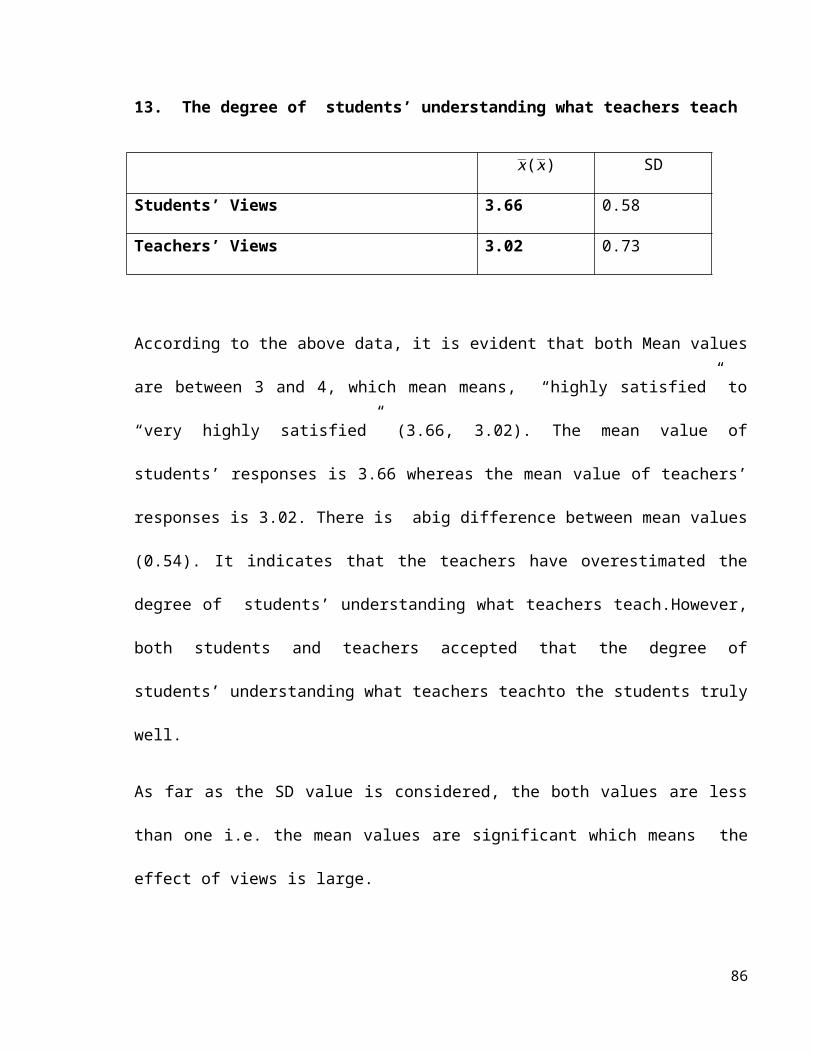
i. Highly satisfied
ii. Satisfied up to some extent
iii. No Idea
iv. Not satisfied
vii. No, not satisfied at all
23. Are you satisfied with the availability of support from technical assistant satisfactorily?
i. Highly satisfied
ii. Satisfied up to some extent
iii. No Idea
iv. Not satisfied
v. No, not satisfied at all
24. Are you satisfied with the degree of using teaching aids by you when teaching ?
i. Highly satisfied
ii. Satisfied up to some extent
iii. No Idea
iv. Not satisfied
v. No, not satisfied at all
25. Are you satisfied with the level of having a friendly classroom environment for the students?
i. Highly satisfied
ii. Satisfied up to some extent
iii. No Idea
iv. Not satisfied
v. No, not satisfied at all
86
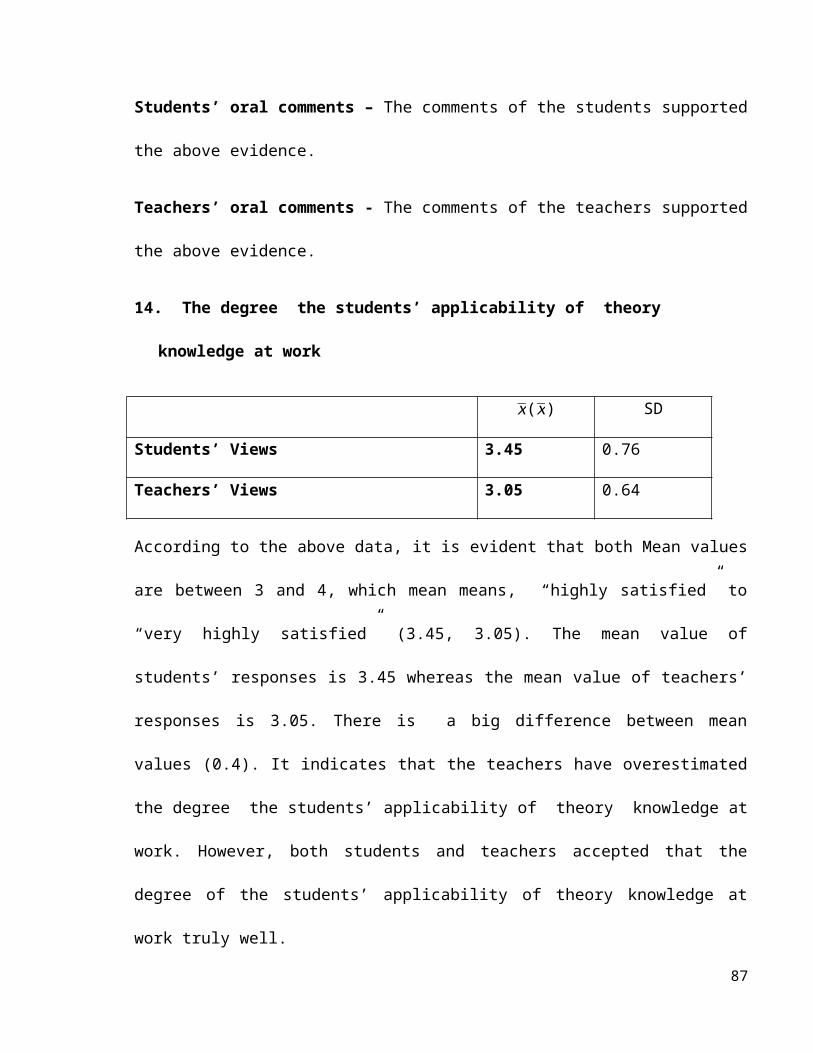
87