Embed Size (px)
Citation preview
287
CHAPTER VI
SWOT ANALYSIS OF VENTURE CAPITAL UNDERTAKINGS
INTRODUCTION
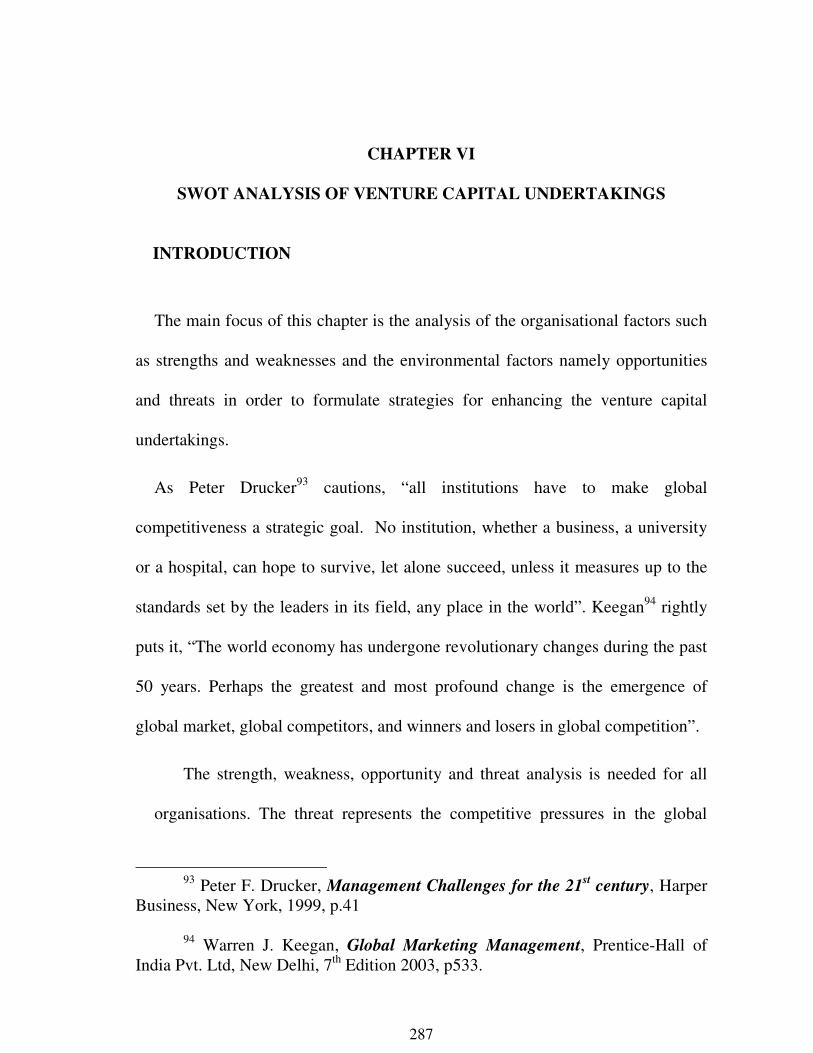
The main focus of this chapter is the analysis of the organisational factors such
as strengths and weaknesses and the environmental factors namely opportunities
and threats in order to formulate strategies for enhancing the venture capital
undertakings.
As Peter Drucker93 cautions, “all institutions have to make global
competitiveness a strategic goal. No institution, whether a business, a university
or a hospital, can hope to survive, let alone succeed, unless it measures up to the
standards set by the leaders in its field, any place in the world”. Keegan94 rightly
puts it, “The world economy has undergone revolutionary changes during the past
50 years. Perhaps the greatest and most profound change is the emergence of
global market, global competitors, and winners and losers in global competition”.
The strength, weakness, opportunity and threat analysis is needed for all
organisations. The threat represents the competitive pressures in the global
93 Peter F. Drucker, Management Challenges for the 21
st century, Harper
Business, New York, 1999, p.41
94 Warren J. Keegan, Global Marketing Management, Prentice-Hall of India Pvt. Ltd, New Delhi, 7th Edition 2003, p533.

288
economy. Nowadays, all organizations encounter threats and opportunities. The
success of the organisation depends upon how the organisation converts its
threats into opportunities. For that conversion, the organisation has to go for
self evaluation i.e. analyse their weakness and strength.
6.1 SWOT Analysis
SWOT is a tool created by Albert Humphrey in the 1970’s. It is used today as a
basic process of examining the factors in business that pertains to both success
and failure, allowing companies to evaluate their current situation95.
SWOT analysis is used to identify strategies for enhancing competitiveness of
venture capital fund companies. Hence, the organisational factors (i.e., the
strengths and weakness) and the environmental factors (i.e., the opportunities and
threats) are analysed to formulate strategies for enhancing competitiveness of
venture capital fund companies in Tamil Nadu.
6.1.1. Strengths
Strength means the core competencies, corporate capabilities and resources that
provide the basis for strategy formulation. It is the competitive advantage and
positive factor possessed by the organisation to face the competition and to satisfy
the customers’ needs and wants. In the venture capital undertakings have come
95 Kim Warren, Strategic Management, John Wiley and Sons Ltd, 2008,
ISBN 978-0-470-06067-4
289
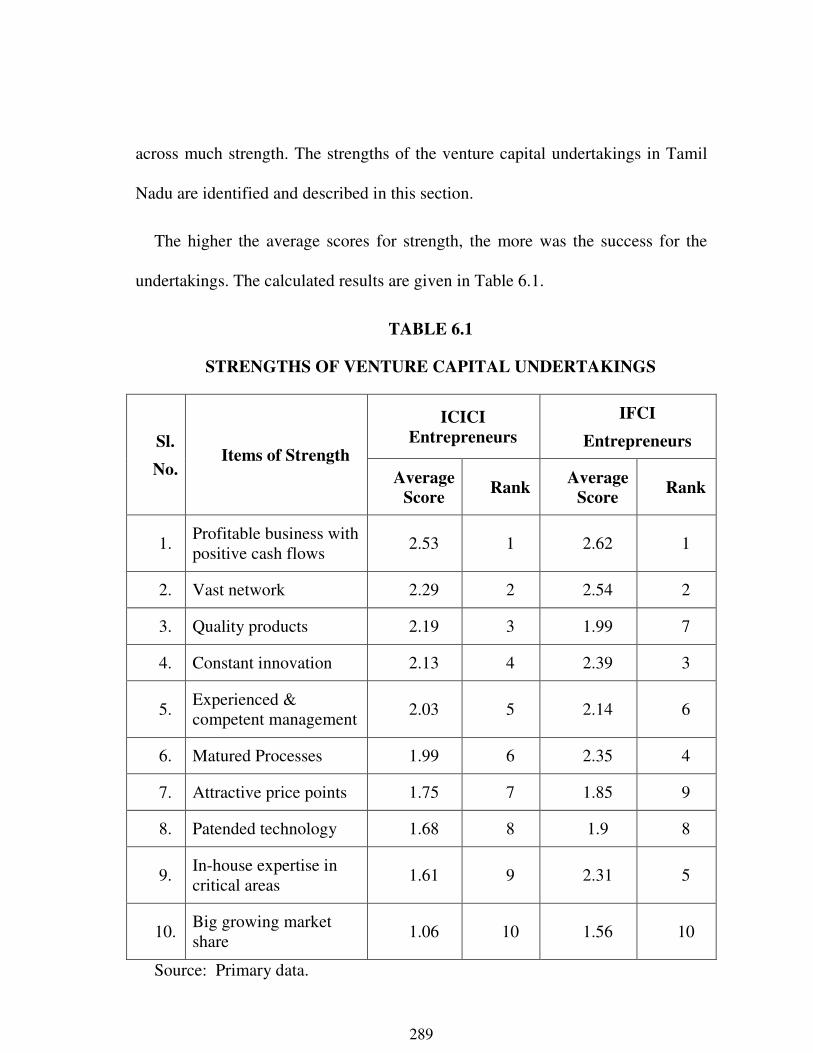
across much strength. The strengths of the venture capital undertakings in Tamil
Nadu are identified and described in this section.
The higher the average scores for strength, the more was the success for the
undertakings. The calculated results are given in Table 6.1.
TABLE 6.1
STRENGTHS OF VENTURE CAPITAL UNDERTAKINGS
Sl.
No. Items of Strength
ICICI
Entrepreneurs
IFCI
Entrepreneurs
Average
Score Rank
Average
Score Rank
1. Profitable business with positive cash flows
2.53 1 2.62 1
2. Vast network 2.29 2 2.54 2
3. Quality products 2.19 3 1.99 7
4. Constant innovation 2.13 4 2.39 3
5. Experienced & competent management
2.03 5 2.14 6
6. Matured Processes 1.99 6 2.35 4
7. Attractive price points 1.75 7 1.85 9
8. Patended technology 1.68 8 1.9 8
9. In-house expertise in critical areas
1.61 9 2.31 5
10. Big growing market share
1.06 10 1.56 10
Source: Primary data.
290
It is observed from table 6.1 that the statement namely profitable business
with positive cash flows ranked first by both the category of entrepreneurs
among ICICI and IFCI venture capital companies. The vast net work is the next
strength for both types of entrepreneurs. Ranking differs for other strengths and
the big growing market share is considered as the least strength by both
category of entrepreneurs.
6.1.2. Weaknesses
Weaknesses are the qualities that prevent the organization from
accomplishing their mission and achieving their full potential. These
weaknesses deteriorate influences on the organizational success and growth.
Weaknesses are the critical part of business that must either be strengthened or
hidden from the competitors, which tend to decrease the competencies of the
firm, in comparison with its competitors. The following are considered as
weaknesses of the venture capital undertakings.
The average score of each weakness of ICICI and IFCI venture capital
companies’ entrepreneurs is presented in table 6.2:

291
TABLE 6.2
WEAKNESSES OF VENTURE CAPITAL UNDERTAKINGS
Sl.
No. Items of Weaknesses
ICICI
Entrepreneurs
IFCI
Entrepreneurs
Average
Score Rank
Average
Score Rank
1. Technological of obsolescence
2.06 1 2.14 2
2. Poor inventory control 1.99 2 2.19 1
3. Limited product life 1.88 3 0.99 10
4. Poor planning and decision making
1.80 4 2.01 3
5. Inefficient processes 1.79 5 1.99 4
6. High prices due to inefficiencies
1.67 6 1.86 5
7. Lack of research and development
1.43 7 1.75 6
8. Lack of marketing expertise
1.33 8 1.51 7
9. Unproductive workforce 1.22 9 1.33 8
10. Lack of working capital 1.03 10 1.22 9
Source: Primary data.
It is clear from table 6.2, that ICICI entrepreneurs accorded first place to
technological of obsolescence with an average score of 2.06 and . The
292
entrepreneurs viewed poor inventory control as the second weakness with an
average score of 1.99. The lack of working capital was accorded last place.
The entrepreneurs of IFCI observed poor inventory control as the first
weakness with an average score of 2.19, technological of obsolescence was
ranked second with an average score of 2.14. The limited product life was
accorded the last rank by IFCI entrepreneurs.
6.1.3. Opportunities
An opportunity is a major favourable situation in the firm’s environment.
Opportunities are the benefits that are likely to occur from external environment.
The various opportunities that promoted their undertakings were listed and the
entrepreneurs were asked to rank them in the order of importance.
The average score of each opportunity of ICICI and IFCI venture capital
companies’ entrepreneurs is presented in table 6.3.
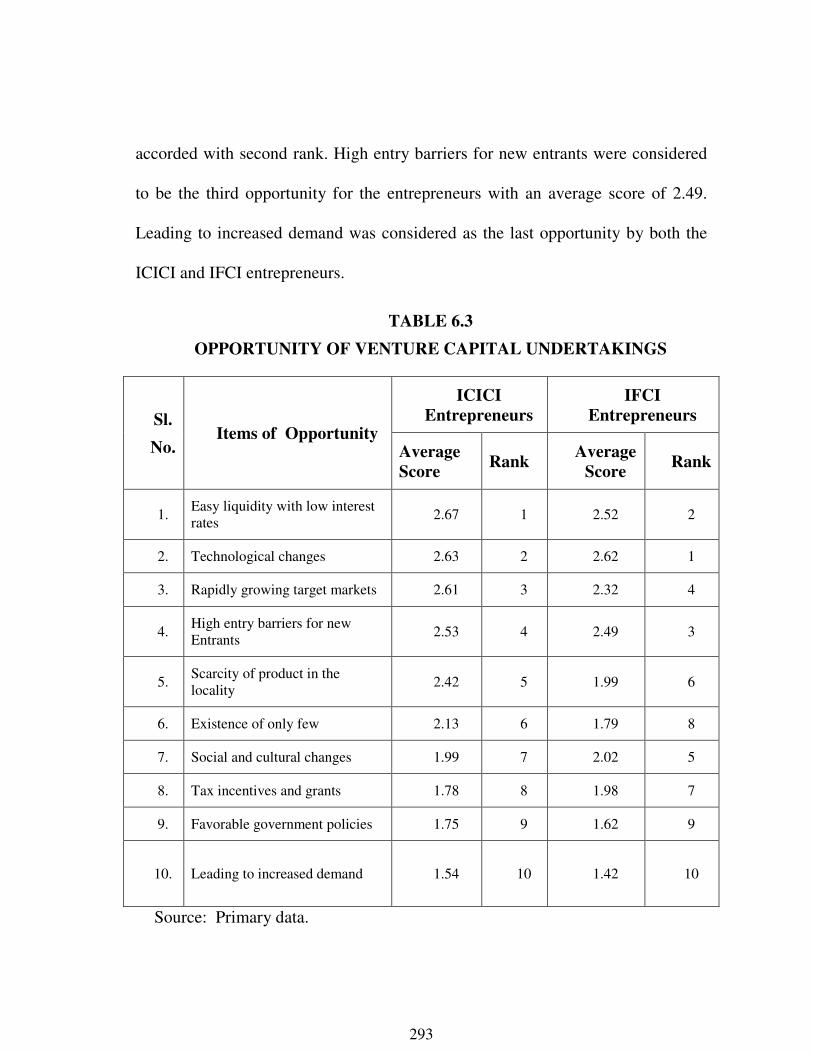
Table 6.3 presents the major opportunities for venture capital undertakings.
ICICI entrepreneurs accorded easy liquidity with low interest rates as the first
opportunity with a score of 2.67. The technological changes was ranked second
with an average score of 2.63. Leading to increased demand was viewed as the
least ranked opportunity for ICICI venture capital undertakings.
The IFCI entrepreneurs perceived technological changes as the first opportunity
with an average score of 2.62 and easy liquidity with low interest rates was
293
accorded with second rank. High entry barriers for new entrants were considered
to be the third opportunity for the entrepreneurs with an average score of 2.49.
Leading to increased demand was considered as the last opportunity by both the
ICICI and IFCI entrepreneurs.
TABLE 6.3
OPPORTUNITY OF VENTURE CAPITAL UNDERTAKINGS
Sl.
No. Items of Opportunity
ICICI
Entrepreneurs
IFCI
Entrepreneurs
Average
Score Rank
Average
Score Rank
1. Easy liquidity with low interest rates
2.67 1 2.52 2
2. Technological changes 2.63 2 2.62 1
3. Rapidly growing target markets 2.61 3 2.32 4
4. High entry barriers for new Entrants
2.53 4 2.49 3
5. Scarcity of product in the locality
2.42 5 1.99 6
6. Existence of only few 2.13 6 1.79 8
7. Social and cultural changes 1.99 7 2.02 5
8. Tax incentives and grants 1.78 8 1.98 7
9. Favorable government policies 1.75 9 1.62 9
10. Leading to increased demand 1.54 10 1.42 10
Source: Primary data.
294
6.1.4. Threats
Threats arise when conditions in external environment pose a danger to the
reliability and profitability of the organization’s business. Threats are
uncontrollable. When a threat comes, the stability and survival can be at stake.
The variations and possible exceptions put off the energetic functioning of
the organisation. Venture capital entrepreneurs faced many problems like
changing Government policies, fluctuations in currency value, shipment cost,
changing demand and so on.
The average score of threats given by the ICICI and IFCI entrepreneurs are
given in Table 6.4.
295
TABLE 6.4
THREAT OF VENTURE CAPITAL UNDERTAKINGS
Sl.
No
.
Items of Threat
ICICI
Entrepreneurs
IFCI
Entrepreneurs
Average
Score Rank
Average
Score Rank
1. High tax rates 1.94 1 1.28 3
2. Confusing and unstable government regulations and procedures
1.65 2 1.33 2
3. Poor quality of labour force 1.59 3 0.69 6
4. Poor law and order 1.53 4 0.99 5
5. Corruption 1.42 5 0.53 7
6. Low entry barriers 1.22 6 1.62 1
7. Too much of corruption 1.04 7 0.29 10
8. Inequitable and harsh legal framework
0.91 8 1.14 4
9. High cost and shortage of raw materials
0.71 9 0.49 8
10. Poor infrastructure 0.61 10 0.33 9
Source: Primary data.
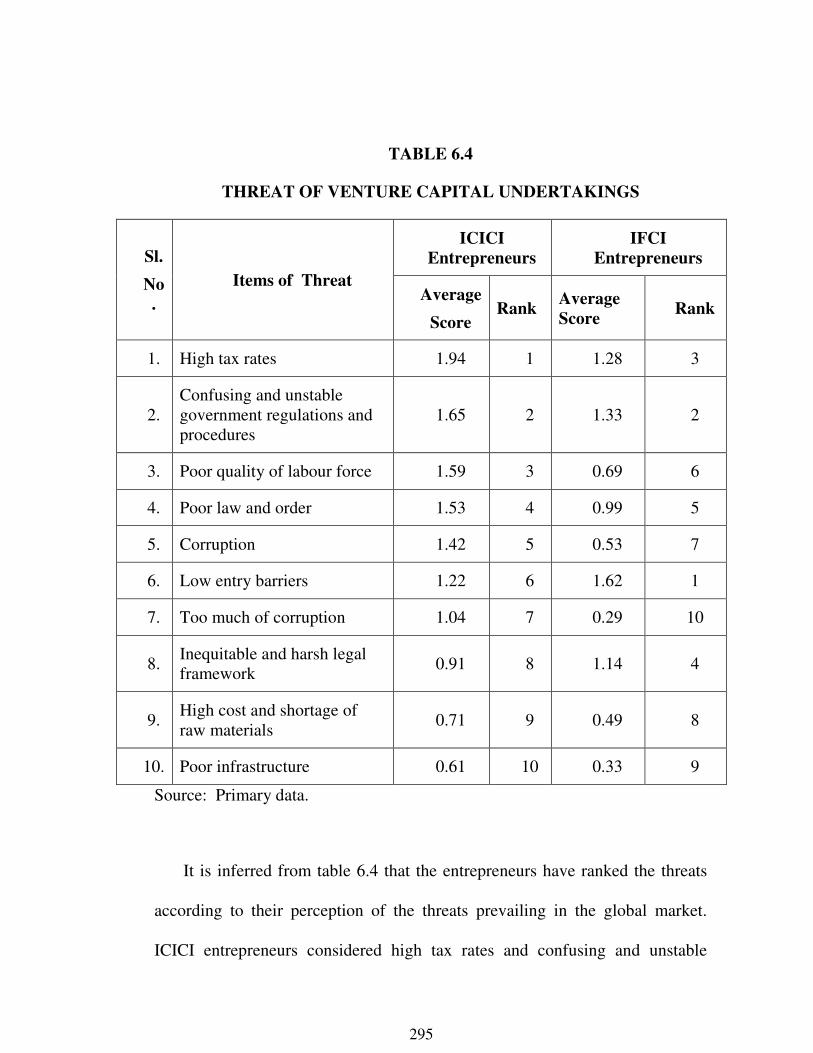
It is inferred from table 6.4 that the entrepreneurs have ranked the threats
according to their perception of the threats prevailing in the global market.
ICICI entrepreneurs considered high tax rates and confusing and unstable
296
government regulations and procedures as their first and second threats,
respectively. Poor infrastructure is ranked as the tenth threat.
In case of IFCI entrepreneurs ranked low entry barriers as their first and
foremost threat with an average score of 1.62. Confusing and unstable
government regulations and procedures and high tax rates were ranked second
and third respectively by the IFCI entrepreneurs. They considered too much of
corruption as the tenth threat.
6.2 DISTRIBUTION OF VENTURE CAPITAL ENTREPRENEURS
BASED ON SWOT
Frequency distribution is used to evaluate the relative weightage between
overall strengths, weaknesses, opportunities and threats of venture capital
undertakings. Weighted score based on the rank is given to each of the
statements.
The weightage given were 5, 4, 3, 2 and 1 for strongly agree, agree,
neutral, disagree and strongly disagree respectively. The weighted score thus
arrived at was converted into % of maximum possible score, that is, for example
for ten strengths identified the maximum possible score was 750. Thus, %score
of all items of strengths, weaknesses, opportunities and threats for each of the
entrepreneurs was calculated.
The individual score % of each entrepreneurs was analysed and to draw
further inference a frequency distribution of entrepreneurs with score % in the

297
class intervals of 0 – 10 %, 10-20 %, 20-30 %, 30-40 %, 40-50 %, 50-60 %, 60-70
%, 70-80 %, 80-90 % and 90-100 % was made for strength, weakness,
opportunities and threats separately having obtained the number of entrepreneurs
in each class intervals, the % of entrepreneurs was calculated to draw appropriate
conclusions on differences in the relative scores of strengths, weaknesses,
opportunities and threats and is presented in Table 6.5
TABLE 6.5
SWOT ANALYSIS OF VENTURE CAPITAL UNDERTAKINGS
Score percentage
percentage of Entrepreneurs
Strength Weakness Opportunity Threat
0 – 10 17 0 21 0
11 – 20 21 1 32 0
21 – 30 28 5 20 3
31 – 40 15 4 12 6
41 – 50 10 12 9 12
51 – 60 4 24 3 14
61 – 70 3 25 2 22
71 – 80 2 19 1 24
81 – 90 0 8 0 12
91 – 100 0 2 0 7
Total 100 100 100 100
Source: Primary data
Skewness is used to analyse the distribution of strengths, weaknesses,
opportunities and threats of the venture capital undertakings. According to

298
Garrett, “A distribution is said to be skewed, when the mean and the median fall
at the different points in the distribution, and the balance is shifted to one side or
the other-to left or right”96. Skewness is calculated with the help of Karl Pearson’s
coefficient of Skewness formula:
Mean - Mode Skp = ------------------------- Standard Deviation
Skp = Karl Pearson’s coefficient of Skewness.
The Skewness for SWOT analysis of venture capital undertaking
entrepreneurs is calculated with the data in Table 6.5 and the calculated Mean,
Mode, Standard Deviation and Skp value are presented in Table 6.6.
96 S.P.Gupta, Statistical Methods, Sultan Chand & Sons, New Delhi, 32nd
Revised Edition 2004, pp 330-334

299
TABLE 6.6
KARL PEARSON’S CO-EFFICIENT OF SKEWNESS
SWOT Variables Mean Mode Standard
Deviation
Skp
Strengths 26.4 23.5 16.7 0.17
Weaknesses 60.6 61.43 16.87 -2.57
Opportunities 22.8 14.78 15.59 0.51
Threats 65.1 68.5 16.58 -0.2
Source: Primary data
Table 6.6 depicts positive Skewness in the case of strength and
opportunities whereas negative Skewness in the distribution of weakness and
threats. This means that Skp value is relatively less skewed in case of strength
and opportunities and more skewed for threats and weaknesses.
The entrepreneurs gave more score %age of distribution to strength and
opportunity as they consider it as more important and posses it in their
undertakings in Tamil Nadu.
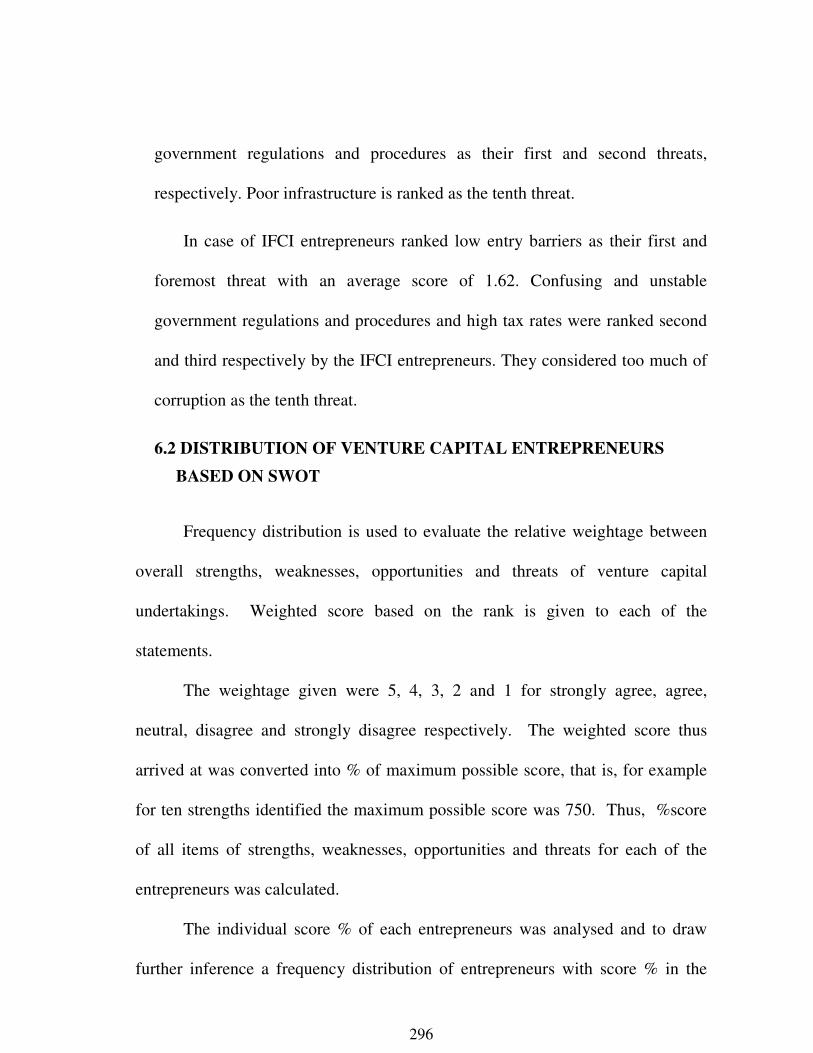
The following figure 6.1 shows the distribution of strength, weakness,
opportunities and threats of venture capital undertakings in Tami Nadu.
300
FIG 6.1 SWOT ANALYSIS OF VENTURE CAPITAL UNDERTAKINGS
It is clear from the figure 6.1 that the strength and opportunity curve have
longer tail towards the right and it is said to be positively skewed. Whereas the
weaknesses and threats curve have longer tail towards the left, so it is said to be
negatively skewed. Thus, the positive factors such as strength and opportunity
were considered more important for venture capital undertakings than the negative
factors threats and weakness. This is a very significant pointer to the positive
attitude of entrepreneurs and their confidence in their enterprises’ ability to
survive and prosper.

301
Among the positive factors of strength and opportunities, the Skp value of
strength is close to central point of tendency and the Skp value of opportunities is
away from the central point. It shows that entrepreneurs consider the individual
qualities of strength that they possess inside the organisation as more important
than opportunity.
Similarly, among the negative factors of threats and weakness, threats from
external environment were considered even less important than the weakness of
the individual.
6.3 FACTORS INFLUENCING THE PROBLEMS FACED BY THE
VENTURE CAPITAL UNDERTAKINGS
In order to study the factors influencing the problems faced by the
entrepreneurs of venture capital undertakings, the researcher has found
the following twenty problems and they are qualified by using Likert’s five point
scale.
1. Lack of Raw Material
2. Lack of Skilled Labour
3. Lack of Unskilled labour
4. Lack of Research & development
5. Lack of Technical assistance
6. Lack of Managerial assistance

302
7. Lack of Financial assistance
8. Limited demand
9. Severe competition
10. Global recession
11. Poor Infrastructural facilities
12. Poor Legal System
13. Stringent Labour Laws
14. Corruption
15. Lack of readily available information
16. Licences
17. Multiple and high taxes
18. Red tapism and procedural Hazzles
19. Poor awareness as to venture Capital
20. Lack of quick exit routes
The five point scale consists of very high, high, moderate, little and very
little. The score of each statement in the five point scale is five, four three, two
and one respectively. In the present study, the principal factor analysis method
with the Orthogonal Varimax Rotation is used to identify the factors influencing
the problems faced by entrepreneurs of venture capital undertakings.
303
The principal component factor analysis method was applied to the inter
correlation matrix of the twenty dimensions of the problems and the results were
rotated using the Kaiser Varimax criteria. The data validity for factor analysis has
been examined with the help of the Kaiser-Meyer-Olkin (KMO) measures of
sampling adequacy and the Bartlett test of Sphericity. The KMO measure of
0.6037 at the zero level significance of chi-square satisfies the validity of data for
factor analysis. The factor analysis results in seven factors. The factor loading of
the variables in seven factors, its communality, Eigen value and %age of variable
explained are shown in Table 6.7.
Table 6.7 gives the loadings received by the factors under F1, F2, F3, F4 and F5
for venture capital undertakings. Table reveals the rotated factor loadings for the
twenty problems faced by the venture capital undertaking entrepreneurs in Tamil
Nadu. It is clear from Table 6.7 that all the twenty problems have been extracted
into five major factors namely F1, F2, F3, F4 and F5. The factors with identified
the new names which influence the problems faced by the entrepreneurs.

304
TABLE 6.7
ROTATED FACTOR MATRIX FOR PROBLEMS FACED BY THE
RESPONDENTS
Sl.
No
.
Variables Facto
r 1
Facto
r 2
Facto
r 3
Factor
4
Facto
r 5 h
2
1. Lack of Managerial assistance 0.8346 0.1396 0.0352 0.2696 0.0085 0.7900
2. Lack of Unskilled labour 0.7675 0.1167 0.1325 0.2495 0.1199 0.6968
3. Lack of Skilled Labour 0.7031 0.0907 0.3063 0.0815 0.1616 0.6291
4. Lack of Technical assistance 0.6933 0.1737 0.2943 0.1131 0.1662 0.6378
5. Stringent Labour Laws 0.6631 0.1589 0.3714 -0.0056 0.0995 0.6127
6. Lack of Raw Material 0.1779 0.8180 0.0074 0.1621 0.0920 0.7355
7. Limited demand 0.0888 0.7922 0.1091 0.1724 0.0496 0.6795
8. Severe competition 0.0190 0.7747 0.1796 -0.0894 0.3100 0.7368
9. Lack of Financial assistance 0.2987 0.6845 0.0768 0.0845 0.1676 0.5989
10. Poor Infrastructural facilities 0.2597 0.1797 0.7588 0.2163 -0.0299 0.7232
11. Poor Legal System 0.1963 -0.0531 0.7333 0.3293 0.1655 0.7148
12. Global recession 0.4114 0.2256 0.7218 0.0444 0.1374 0.7619
13. Corruption 0.2135 0.1079 0.6660 0.4672 0.1071 0.7304
14. Lack of Research & development 0.2668 0.1450 0.1257 0.8248 0.0881 0.7961
15. Lack of readily available information
0.1523 0.1333 0.2050 0.8158 0.2001 0.7885
16. Licences 0.1056 0.0598 0.3440 0.7513 0.1412 0.7174
17. Poor awareness as to venture Capital
0.1056 0.1329 0.0857 0.1802 0.8487 0.7889
18. Lack of quick exit routes 0.1721 0.1035 0.0623 0.0773 0.8199 0.7223
19. Multiple and high taxes 0.0975 0.2826 0.1028 0.1446 0.7985 0.7885
20. Red tapism and procedural Hazzles
0.1752 0.1260 0.2081 0.0469 0.6859 0.7546
Eigen Value 7.2711 2.2261 1.6759 1.3720 1.0747
%age Variance 38.30 11.70 8.80 7.20 5.70
Cumulative %age 38.30 50.00 58.80 66.00 71.70
The first factor is designed as “Lack of Human Resource Management”
on the basis of the loaded variables. Five variables in this category are important
with high factor loading. It indicates that among the various performance scale,
‘Lack of Managerial assistance (0.8346)’, ‘Lack of Unskilled labour (0.7675)’,
‘Lack of Skilled Labour (0.7031)’, ‘Lack of Technical assistance (0.6933)’ and ‘

305
Stringent Labour Laws (0.6631)’ are important attributes in this category. Thus,
the lack of human resource management is identifying an important factor to
influence the problems of venture capital undertakings entrepreneurs in
Tamil Nadu.
The second factor is narrated as “Lack of raw material and finance” on
the basis of the loaded variables. Four variables in this category are important
with high factor loading. It indicates that among the various performance scale,
‘Lack of Raw Material (0.8180)’, ‘Limited demand (0.7922)’, ‘Severe
competition (0.7747)’ and ‘Lack of Financial assistance (0.6845)’ are important
attributes in this category. Thus, the lack of raw material and financial assistance
is identifying an important factor to influence the problems faced by the
entrepreneurs of venture capital undertakings.
The third factor is prescribed as “Poor Infrastructural facilities” on the
basis of the loaded variables. Four variables in this category are important with
high factor loading. It indicates that among the various performance scale, ‘Poor
Infrastructural facilities (0.7588)’, ‘Poor Legal System (0.7333)’, ‘Global
recession (0.7218)’ and ‘Corruption (0.6660)’ are important attributes in this
category. Thus, the poor infrastructural facilities are identifying an important
factor to influence the problems faced by the entrepreneurs of venture capital
undertakings.
306
The fourth factor is highlighted as “Lack of Research and Development”
on the basis of the loaded variables. Three variables in this category are important
with high factor loading. It indicates that among the various performance scale,
‘Lack of Research & development (0.8248)’, ‘Lack of readily available
information (0.8158)’ and ‘Licences (0.7513)’ are important attributes in this
category. Thus, the lack of research and development are identifying an important
factor to influence the problems faced by the entrepreneurs of venture capital
undertakings in Tamil Nadu.
The fifth factor is designed as “Lack of awareness on venture capital” on
the basis of the loaded variables. Four variables in this category is important with
high factor loading. It indicates that among the various performance scale, ‘Poor
awareness as to venture Capital (0.84870’, ‘Lack of quick exit routes (0.8199)’,
‘Multiple and high taxes (0.79850’ and ‘Red tapism and procedural Hazzles
(0.6859)’ are important attributes in this category. Thus, the lack of awareness on
venture capital is identifying an important factor to influence the problems faced
by the entrepreneurs of venture capital undertakings in Tamil Nadu.
6.4. FACTORS INFLUENCING THE PROMOTIONAL MEASURES FOR
PROMOTION OF VENTURE CAPITAL BUSINESS The analysis on factors influencing the entrepreneurs to promote the
venture capital fund for their undertaking are Create of awareness on venture
307
capital activities through informed websites/ Seminar /Conferences, Vigorous
promotional measures such as venture fairs / Venture Clubs Venture networks,
Establishment of business incubators, Fiscal and tax incentives, Corporate sectors
encouraged to participate in venture capital, FIs and high net worth individuals
encouraged to invest in venture funds, Encouragement to One Person Company
/Limited Liability Partnership, Establishing single window clearance for venture
capital undertaking, Moderate and make transparent and accessible IPR
infrastructure, Special commercial courts to deal with commercial disputes,
Simplifying bankruptcy loss, Strengthening secondary market for small
Companies, Creating new instruments like venture debt instruments, Development
of systematic risk management system like SMERA credit rating etc. and
Developing recognition and rewards system for venture capital undertakings.
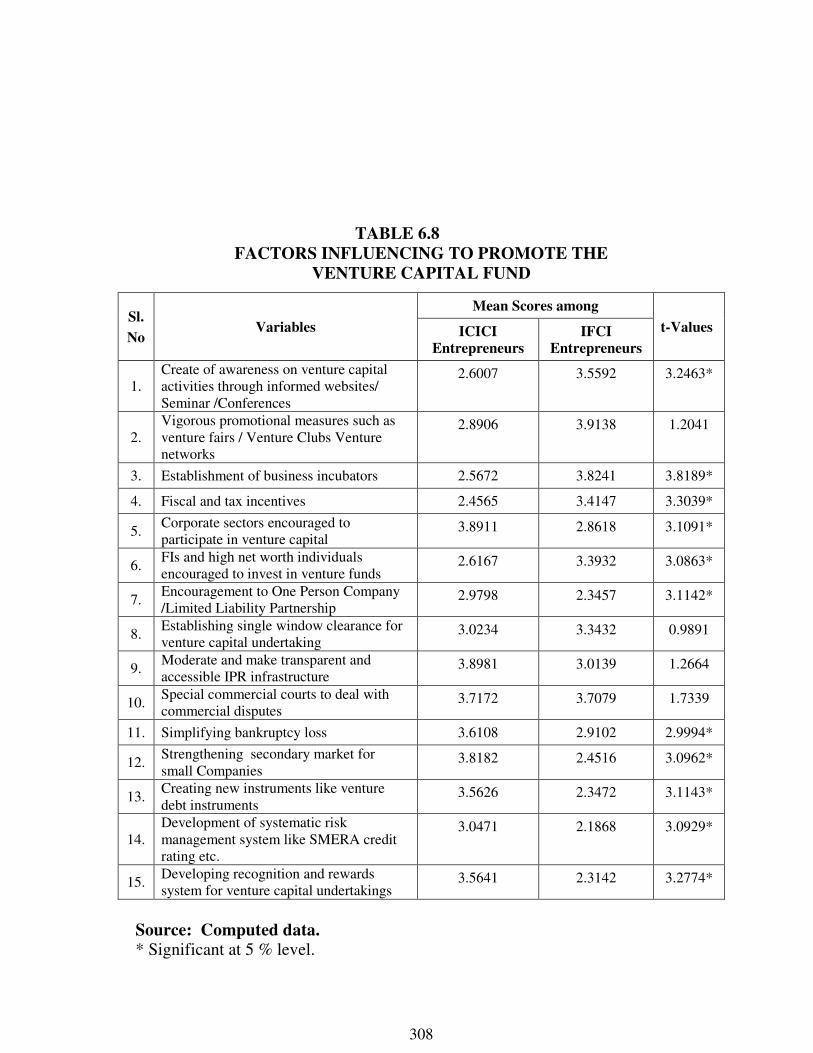
In order to find out the significant relationship among venture capital fund
companies regarding the factors influencing to promote the venture capital fund,
t-test was applied. The importance of the variables that influence to promote the
venture capital fund has been furnished with the help of its mean score and the
computed results of t-test in Table 6.8.
308
TABLE 6.8
FACTORS INFLUENCING TO PROMOTE THE
VENTURE CAPITAL FUND
Sl.
No Variables
Mean Scores among
t-Values ICICI
Entrepreneurs
IFCI
Entrepreneurs
1. Create of awareness on venture capital activities through informed websites/ Seminar /Conferences
2.6007 3.5592 3.2463*
2. Vigorous promotional measures such as venture fairs / Venture Clubs Venture networks
2.8906 3.9138 1.2041
3. Establishment of business incubators 2.5672 3.8241 3.8189*
4. Fiscal and tax incentives 2.4565 3.4147 3.3039*
5. Corporate sectors encouraged to participate in venture capital
3.8911 2.8618 3.1091*
6. FIs and high net worth individuals encouraged to invest in venture funds
2.6167 3.3932 3.0863*
7. Encouragement to One Person Company /Limited Liability Partnership
2.9798 2.3457 3.1142*
8. Establishing single window clearance for venture capital undertaking
3.0234 3.3432 0.9891
9. Moderate and make transparent and accessible IPR infrastructure
3.8981 3.0139 1.2664
10. Special commercial courts to deal with commercial disputes
3.7172 3.7079 1.7339
11. Simplifying bankruptcy loss 3.6108 2.9102 2.9994*
12. Strengthening secondary market for small Companies
3.8182 2.4516 3.0962*
13. Creating new instruments like venture debt instruments
3.5626 2.3472 3.1143*
14. Development of systematic risk management system like SMERA credit rating etc.
3.0471 2.1868 3.0929*
15. Developing recognition and rewards system for venture capital undertakings
3.5641 2.3142 3.2774*
Source: Computed data.
* Significant at 5 % level.

309
It is found from Table 6.9 that the important variables that influence the
entrepreneurs to promote the venture capital fund through ICICI are Moderate and
make transparent and accessible IPR infrastructure, Corporate sectors encouraged
to participate in venture capital and Strengthening secondary market for small
Companies since the mean scores are 3.8981, 3.8911 and 3.8182 respectively.
Among the entrepreneurs belonging to the IFCI, Vigorous promotional measures
such as venture fairs / Venture Clubs Venture networks, Establishment of business
incubators and Special commercial courts to deal with commercial disputes, since
the mean scores are 3.9138, 3.8241 and 3.7079. Regarding the perception on the
factors influencing the entrepreneurs to promote venture capital fund, the
significant difference among the two group of entrepreneurs has been identified in
the perception experience and competency of the entrepreneur, Create of
awareness on venture capital activities through informed websites/ Seminar
/Conferences, Establishment of business incubators, Fiscal and tax incentives,
Corporate sectors encouraged to participate in venture capital, FIs and high
networth individuals encouraged to invest in venture funds, Encouragement to
One Person Company /Limited Liability Partnership, Simplifying bankruptcy
loss, Strengthening secondary market for small Companies, Creating new
instruments like venture debt instruments, Development of systematic risk
management system like SMERA credit rating etc., and Developing recognition
310
and rewards system for venture capital undertakings since the respective ‘t’
statistics are significant at 5 % level.
6.5. FACTORS INFLUENCING THE PREFERENCE LEVEL FOR EXIT
OPTIONS
The analysis on factors influencing the entrepreneurs to exit their venture
capital undertaking are Selling of the stake to strategic buyer, Initial Public
offering in India or overseas, Sale to any other venture capital fund or private
equity fund, Secondary sale in stock market, Merger with an existing listed
company and Management / Company buy-back.
In order to find out the significant relationship among venture capital fund
companies regarding the factors influencing to exit their venture capital
undertakings, t-test was applied. The importance exit options that influence to
exit from their venture capital undertakings has been presented with the help of its
mean score and the computed results of t-test in Table 6.9.
311
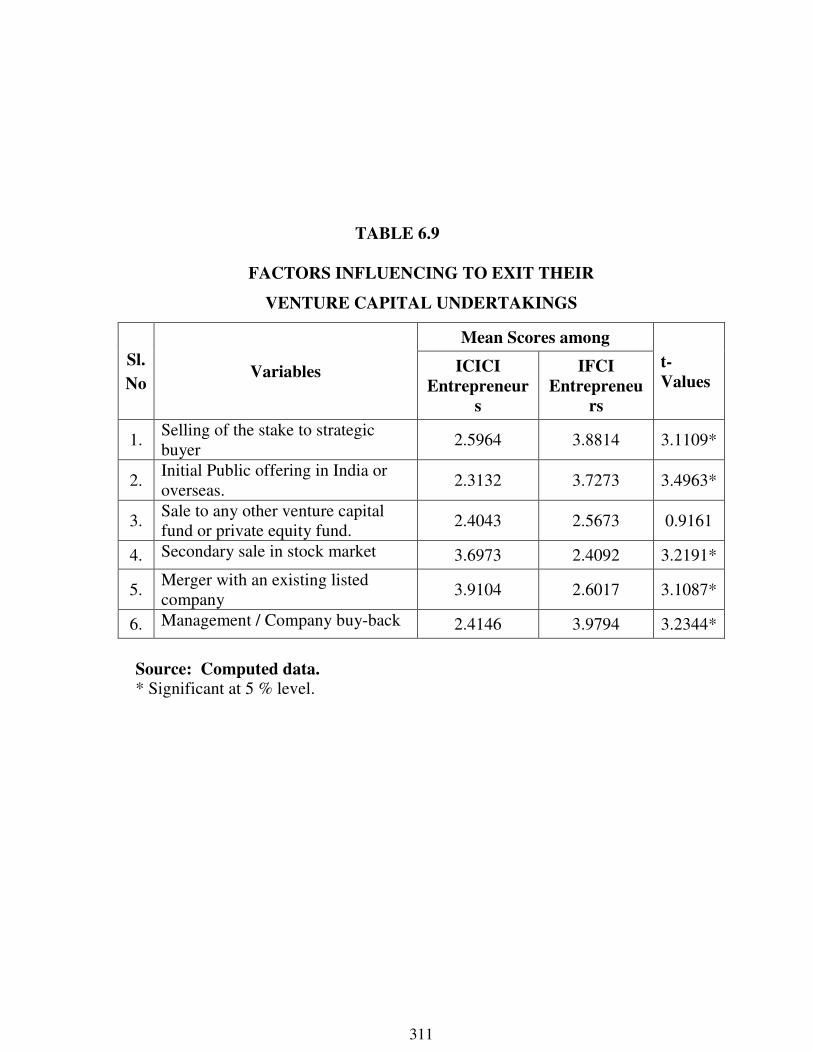
TABLE 6.9
FACTORS INFLUENCING TO EXIT THEIR
VENTURE CAPITAL UNDERTAKINGS
Sl.
No Variables
Mean Scores among
t-
Values ICICI
Entrepreneur
s
IFCI
Entrepreneu
rs
1. Selling of the stake to strategic buyer
2.5964 3.8814 3.1109*
2. Initial Public offering in India or overseas.
2.3132 3.7273 3.4963*
3. Sale to any other venture capital fund or private equity fund.
2.4043 2.5673 0.9161
4. Secondary sale in stock market 3.6973 2.4092 3.2191*
5. Merger with an existing listed company
3.9104 2.6017 3.1087*
6. Management / Company buy-back 2.4146 3.9794 3.2344*
Source: Computed data.
* Significant at 5 % level.
312
ICICI entrepreneurs
t-values0
2
4
ICICI entrepreneurs
IFCI entrepreneurs
t-values
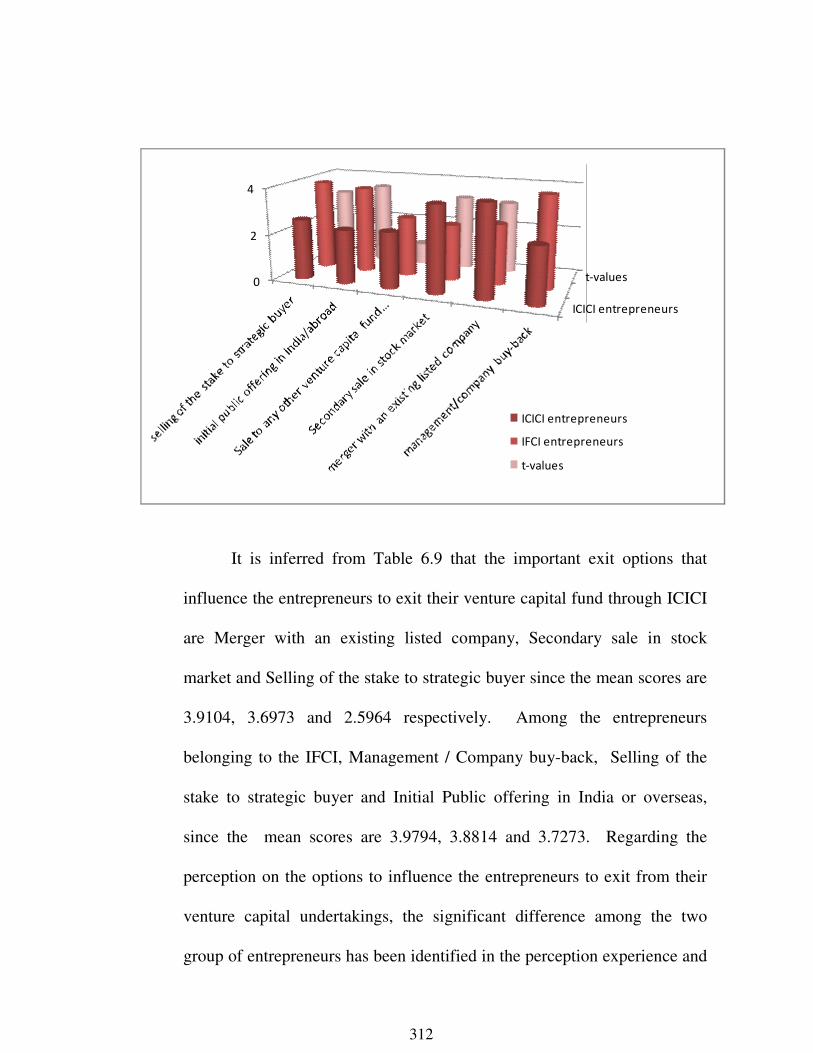
It is inferred from Table 6.9 that the important exit options that
influence the entrepreneurs to exit their venture capital fund through ICICI
are Merger with an existing listed company, Secondary sale in stock
market and Selling of the stake to strategic buyer since the mean scores are
3.9104, 3.6973 and 2.5964 respectively. Among the entrepreneurs
belonging to the IFCI, Management / Company buy-back, Selling of the
stake to strategic buyer and Initial Public offering in India or overseas,
since the mean scores are 3.9794, 3.8814 and 3.7273. Regarding the
perception on the options to influence the entrepreneurs to exit from their
venture capital undertakings, the significant difference among the two
group of entrepreneurs has been identified in the perception experience and
313
competency of the entrepreneur, Selling of the stake to strategic buyer,
Initial Public offering in India or overseas, Secondary sale in stock market,
Merger with an existing listed company and Management / Company buy-
back, since the respective ‘t’ statistics are significant at 5% level.