Embed Size (px)
Citation preview
156
CHAPTER –VI
SOCIO-ECONOMIC STATUS OF DRYLAND FARMERS
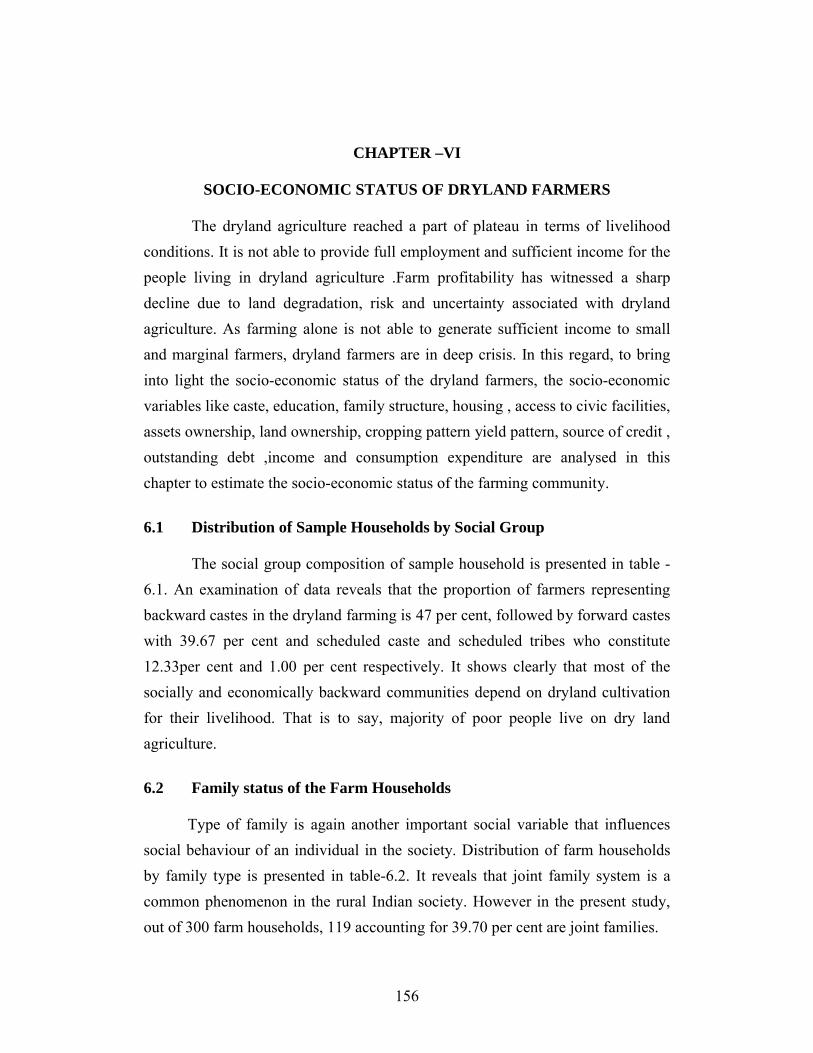
The dryland agriculture reached a part of plateau in terms of livelihood
conditions. It is not able to provide full employment and sufficient income for the
people living in dryland agriculture .Farm profitability has witnessed a sharp
decline due to land degradation, risk and uncertainty associated with dryland
agriculture. As farming alone is not able to generate sufficient income to small
and marginal farmers, dryland farmers are in deep crisis. In this regard, to bring
into light the socio-economic status of the dryland farmers, the socio-economic
variables like caste, education, family structure, housing , access to civic facilities,
assets ownership, land ownership, cropping pattern yield pattern, source of credit ,
outstanding debt ,income and consumption expenditure are analysed in this
chapter to estimate the socio-economic status of the farming community.
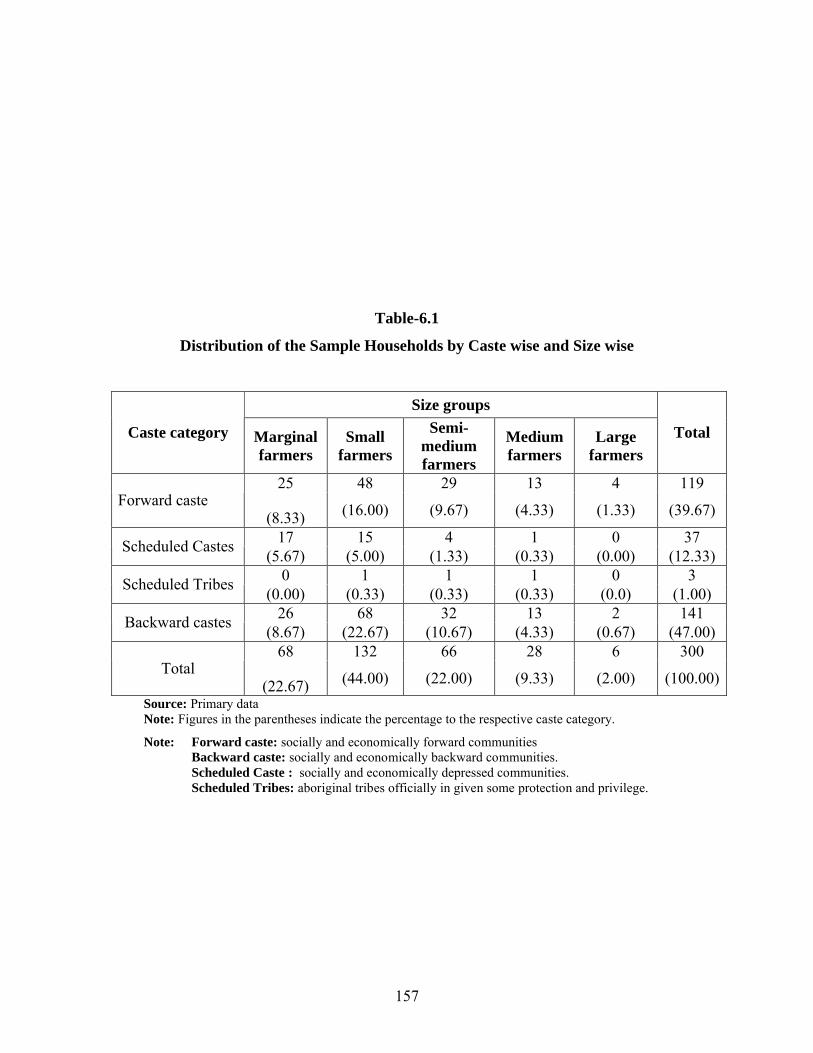
6.1 Distribution of Sample Households by Social Group
The social group composition of sample household is presented in table -
6.1. An examination of data reveals that the proportion of farmers representing
backward castes in the dryland farming is 47 per cent, followed by forward castes
with 39.67 per cent and scheduled caste and scheduled tribes who constitute
12.33per cent and 1.00 per cent respectively. It shows clearly that most of the
socially and economically backward communities depend on dryland cultivation
for their livelihood. That is to say, majority of poor people live on dry land
agriculture.
6.2 Family status of the Farm Households
Type of family is again another important social variable that influences
social behaviour of an individual in the society. Distribution of farm households
by family type is presented in table-6.2. It reveals that joint family system is a
common phenomenon in the rural Indian society. However in the present study,
out of 300 farm households, 119 accounting for 39.70 per cent are joint families.
157
Table-6.1
Distribution of the Sample Households by Caste wise and Size wise
Size groups
Caste category Marginal farmers
Small farmers
Semi-medium farmers
Medium farmers
Large farmers
Total
25 48 29 13 4 119Forward caste
(8.33) (16.00) (9.67) (4.33) (1.33) (39.67)
17 15 4 1 0 37Scheduled Castes
(5.67) (5.00) (1.33) (0.33) (0.00) (12.33)0 1 1 1 0 3
Scheduled Tribes(0.00) (0.33) (0.33) (0.33) (0.0) (1.00)
26 68 32 13 2 141Backward castes
(8.67) (22.67) (10.67) (4.33) (0.67) (47.00)68 132 66 28 6 300
Total(22.67) (44.00) (22.00) (9.33) (2.00) (100.00)
Source: Primary dataNote: Figures in the parentheses indicate the percentage to the respective caste category.
Note: Forward caste: socially and economically forward communities Backward caste: socially and economically backward communities.Scheduled Caste : socially and economically depressed communities. Scheduled Tribes: aboriginal tribes officially in given some protection and privilege.
158
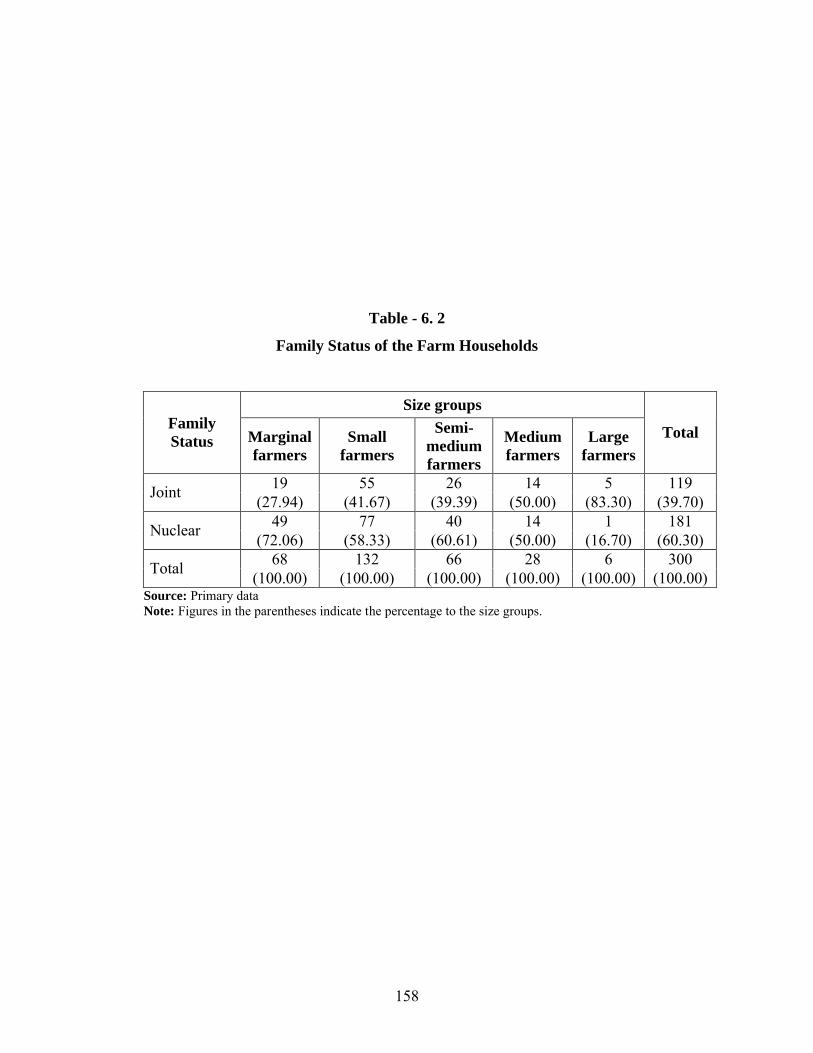
Table - 6. 2
Family Status of the Farm Households
Size groups FamilyStatus Marginal
farmersSmall
farmers
Semi-medium farmers
Medium farmers
Large farmers
Total
19 55 26 14 5 119Joint
(27.94) (41.67) (39.39) (50.00) (83.30) (39.70)49 77 40 14 1 181
Nuclear(72.06) (58.33) (60.61) (50.00) (16.70) (60.30)
68 132 66 28 6 300Total
(100.00) (100.00) (100.00) (100.00) (100.00) (100.00)Source: Primary dataNote: Figures in the parentheses indicate the percentage to the size groups.
159
The general notion is that as development takes place, people prefer
nuclear family norm. This nuclear family system still exists in the study area
inspite of its backwardness. The joint family system is closely associated with
large farms. Proportion of joint families to the total farm households increases
with the farm size. The proportion of nuclear families decreases with the farm
size. Nuclear family system found to be more among marginal and small farm
households.
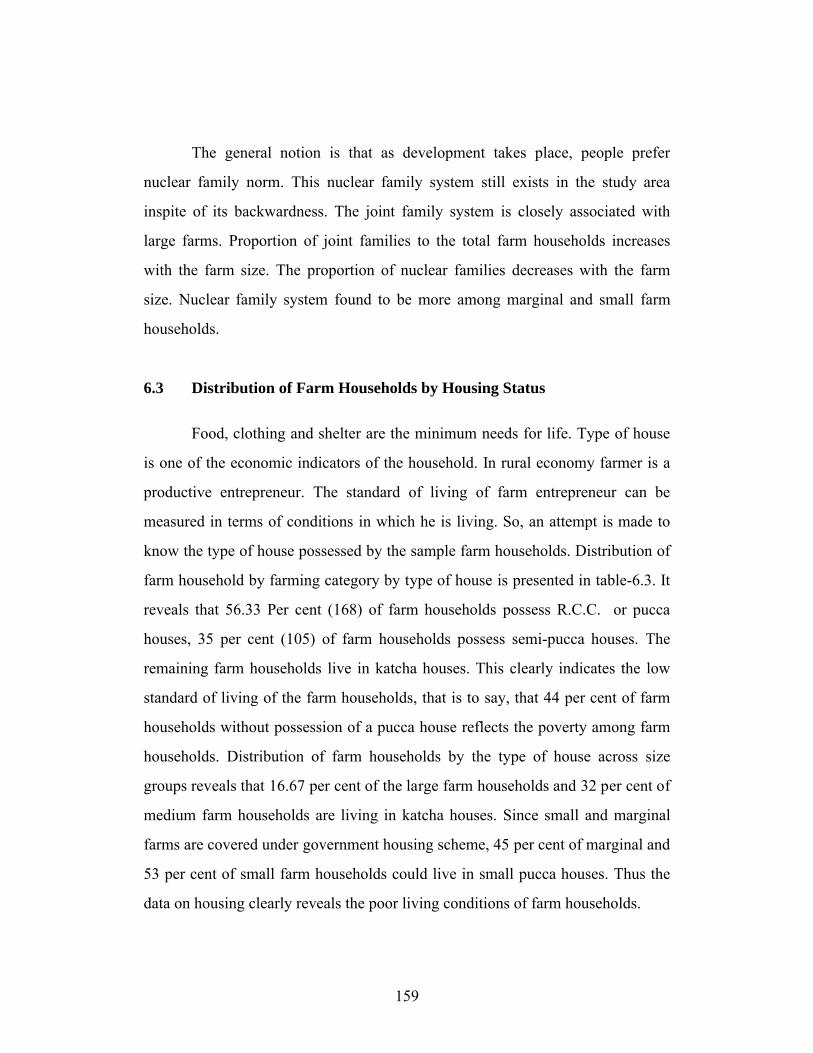
6.3 Distribution of Farm Households by Housing Status
Food, clothing and shelter are the minimum needs for life. Type of house
is one of the economic indicators of the household. In rural economy farmer is a
productive entrepreneur. The standard of living of farm entrepreneur can be
measured in terms of conditions in which he is living. So, an attempt is made to
know the type of house possessed by the sample farm households. Distribution of
farm household by farming category by type of house is presented in table-6.3. It
reveals that 56.33 Per cent (168) of farm households possess R.C.C. or pucca
houses, 35 per cent (105) of farm households possess semi-pucca houses. The
remaining farm households live in katcha houses. This clearly indicates the low
standard of living of the farm households, that is to say, that 44 per cent of farm
households without possession of a pucca house reflects the poverty among farm
households. Distribution of farm households by the type of house across size
groups reveals that 16.67 per cent of the large farm households and 32 per cent of
medium farm households are living in katcha houses. Since small and marginal
farms are covered under government housing scheme, 45 per cent of marginal and
53 per cent of small farm households could live in small pucca houses. Thus the
data on housing clearly reveals the poor living conditions of farm households.
160
Table - 6. 3
Housing Status of the Farm Households
Size groups
Housing Status
Marginal farmers
Small farmers
Semi-medium farmers
Medium farmers
Large farmers
Total
31 71 42 19 5 168Pucca
(45.59) (53.71) (63.64) (67.86) (83.33) (56.33)28 44 23 9 1 107
Semi-Pucca(41.18) (33.33) (34.85) (32.14) (16.67) (35.00)
9 15 1 0 0 25Katcha
(13.23) (11.36) (1.51) (8.30) (0.00) (8.33)0 2 0 0 0 2
Anyother(0.0) (1.50) (0.0) (0.0) (0.0) (0.67)68 132 66 28 6 300
Total(100.00) (100.00) (100.00) (100.00) (100.00) (100.00)
Source: Primary dataNote: Figures in the parentheses indicate the percentage to the size groups.
161
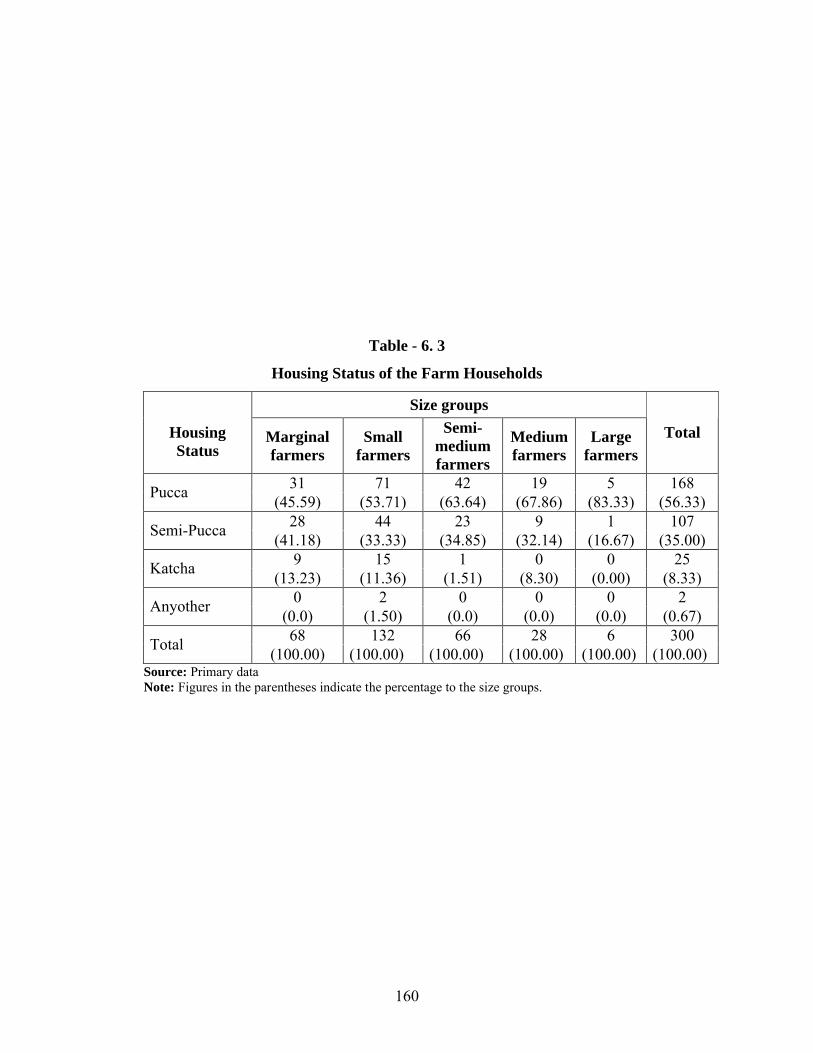
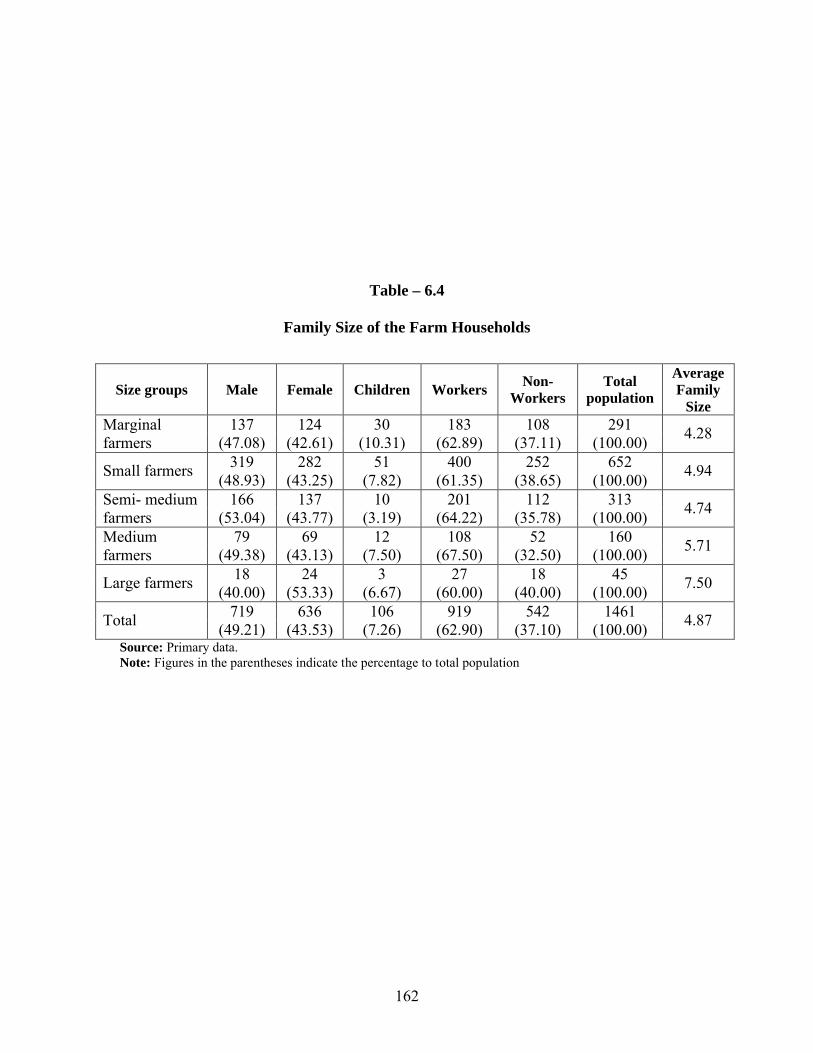
6.4 Composition of Population and Family Size
The demographic profile of the selected sample households revealing the
sizes of their respective families is distributed as per the farm sizes. As shown in
the table- 6.4, male population constitutes 47.08 per cent to the total composition
of sample households and that of female constitutes 42.61 per cent and the
children constitute 10.31 per cent. It is observed that the proportionate size of
male population is higher than that of female in all farming categories and it is
higher among semi-medium farms when compared to other farm size groups. It is
almost same with the medium (49.38 per cent) and small farmers (48.93). As for
children they constitute higher proportion among marginal (10.31 per cent) and
small farms (7.82 per cent). With regard to female population, their proportion is
higher among large farmers. The average size of the family is small for marginal
and small farms when compared with the other farmers. Among all farming
categories the average family size of large farms is high, which is ‘7.50’. The
average size of the family of the total farm household is 4.87.
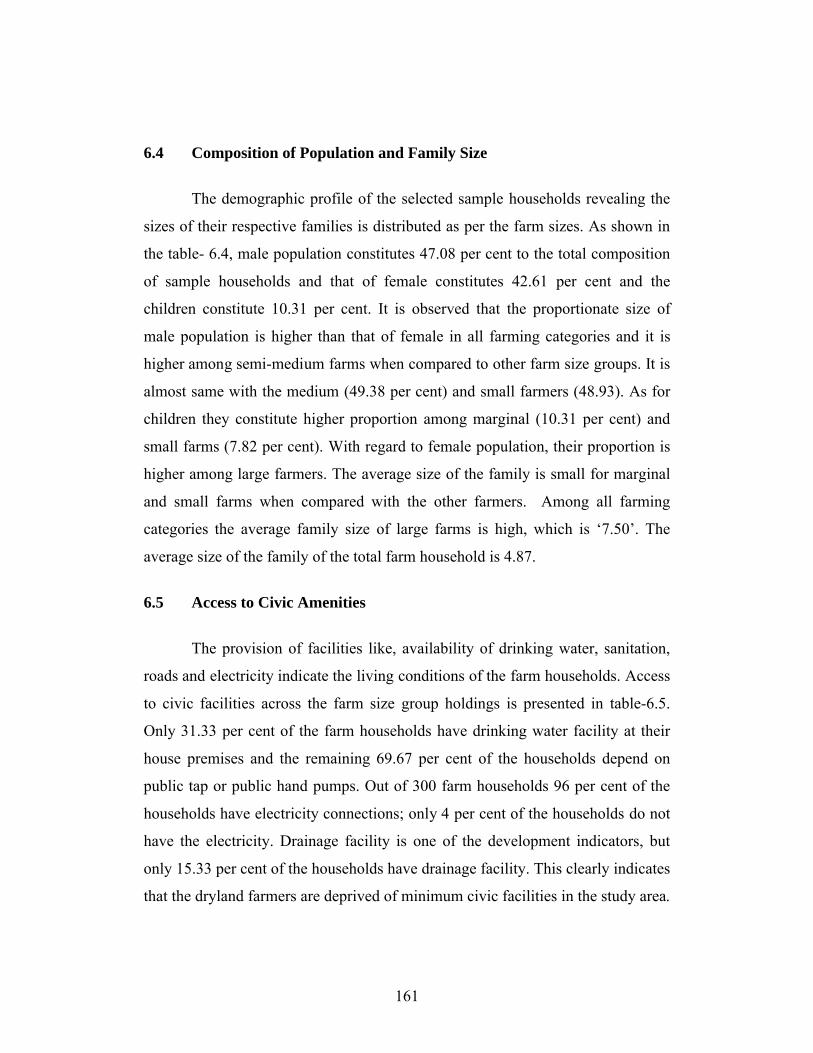
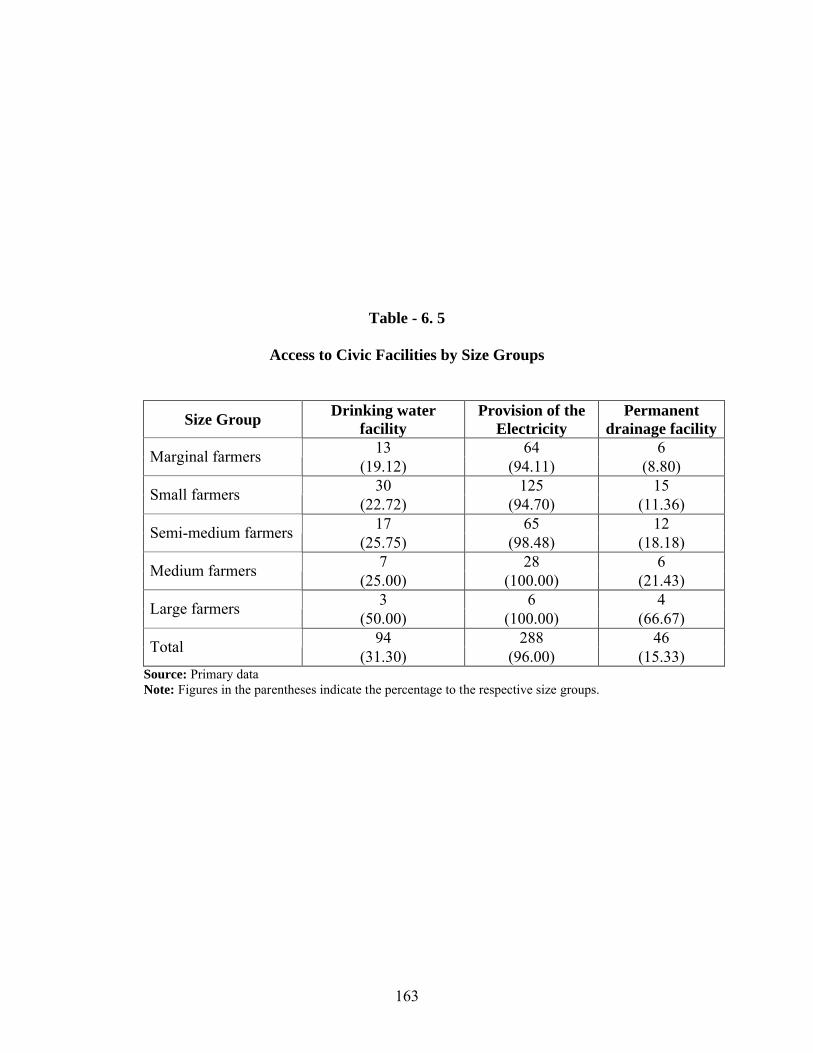
6.5 Access to Civic Amenities
The provision of facilities like, availability of drinking water, sanitation,
roads and electricity indicate the living conditions of the farm households. Access
to civic facilities across the farm size group holdings is presented in table-6.5.
Only 31.33 per cent of the farm households have drinking water facility at their
house premises and the remaining 69.67 per cent of the households depend on
public tap or public hand pumps. Out of 300 farm households 96 per cent of the
households have electricity connections; only 4 per cent of the households do not
have the electricity. Drainage facility is one of the development indicators, but
only 15.33 per cent of the households have drainage facility. This clearly indicates
that the dryland farmers are deprived of minimum civic facilities in the study area.
162
Table – 6.4
Family Size of the Farm Households
Size groups Male Female Children WorkersNon-
WorkersTotal
population
Average Family
Size137 124 30 183 108 291Marginal
farmers (47.08) (42.61) (10.31) (62.89) (37.11) (100.00)4.28
319 282 51 400 252 652Small farmers(48.93) (43.25) (7.82) (61.35) (38.65) (100.00)
4.94
166 137 10 201 112 313Semi- medium farmers (53.04) (43.77) (3.19) (64.22) (35.78) (100.00)
4.74
79 69 12 108 52 160Medium farmers (49.38) (43.13) (7.50) (67.50) (32.50) (100.00)
5.71
18 24 3 27 18 45Large farmers(40.00) (53.33) (6.67) (60.00) (40.00) (100.00)
7.50
719 636 106 919 542 1461Total(49.21) (43.53) (7.26) (62.90) (37.10) (100.00)
4.87
Source: Primary data.Note: Figures in the parentheses indicate the percentage to total population
163
Table - 6. 5
Access to Civic Facilities by Size Groups
Size GroupDrinking water
facilityProvision of the
ElectricityPermanent
drainage facility 13 64 6
Marginal farmers(19.12) (94.11) (8.80)
30 125 15Small farmers
(22.72) (94.70) (11.36)17 65 12
Semi-medium farmers(25.75) (98.48) (18.18)
7 28 6Medium farmers
(25.00) (100.00) (21.43)3 6 4
Large farmers(50.00) (100.00) (66.67)
94 288 46Total
(31.30) (96.00) (15.33)Source: Primary dataNote: Figures in the parentheses indicate the percentage to the respective size groups.
164
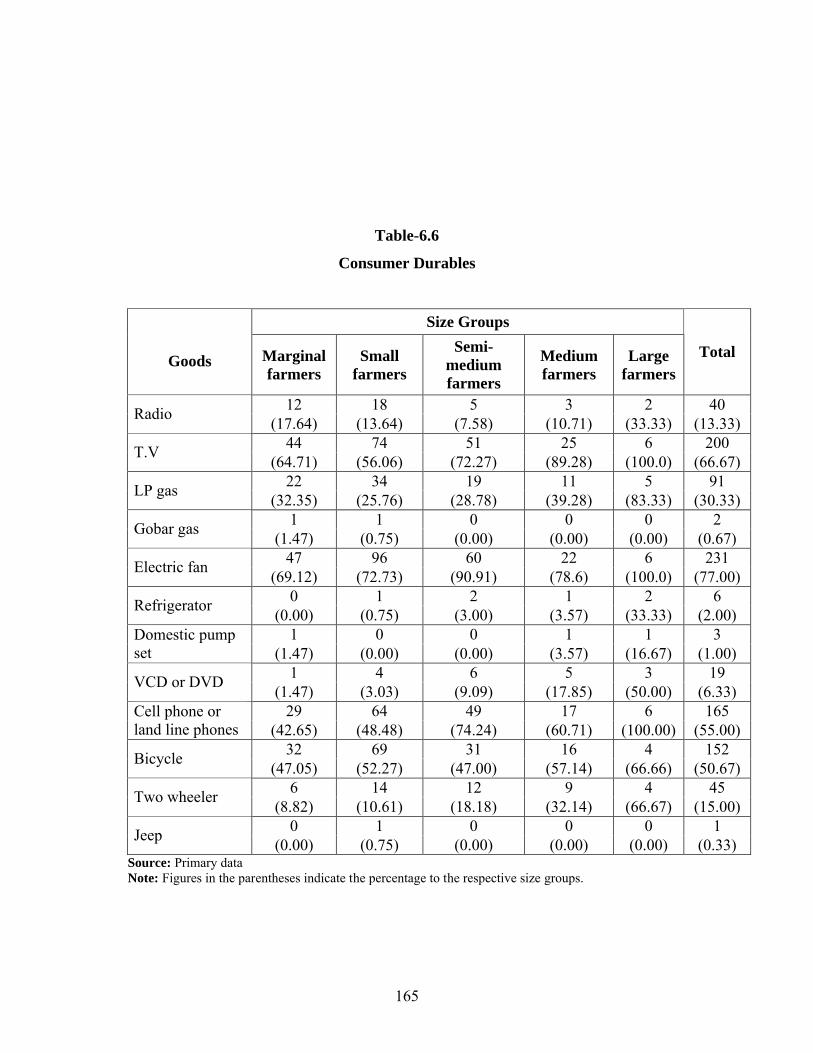
6.6 Possession of Consumer Goods
The possession of consumer durable goods represents the socio-economic
status of households. The distribution of households by the possession of
consumer durables across the farm size groups is presented in table-6.6. Only
13.33 per cent of the households have Radio, 66.67 per cent of the farm
households have TV, 30.33 per cent have LP Gas, 77 per cent have electric fans.
55 per cent have cell phones, 50.67 per cent have bicycles, 15 per cent have two
wheelers, 6.33 per cent have VCD/ DVD players, 2 per cent have refrigerator and
1 per cent of farm households have domestic pump sets. Though, LPG gas is one
of the basic needs of the households, 70 per cent of the dryland farmers do not
have access to it. They depend on firewood for cooking. The data further reveals
that T.V and electric fan have become important consumer goods.
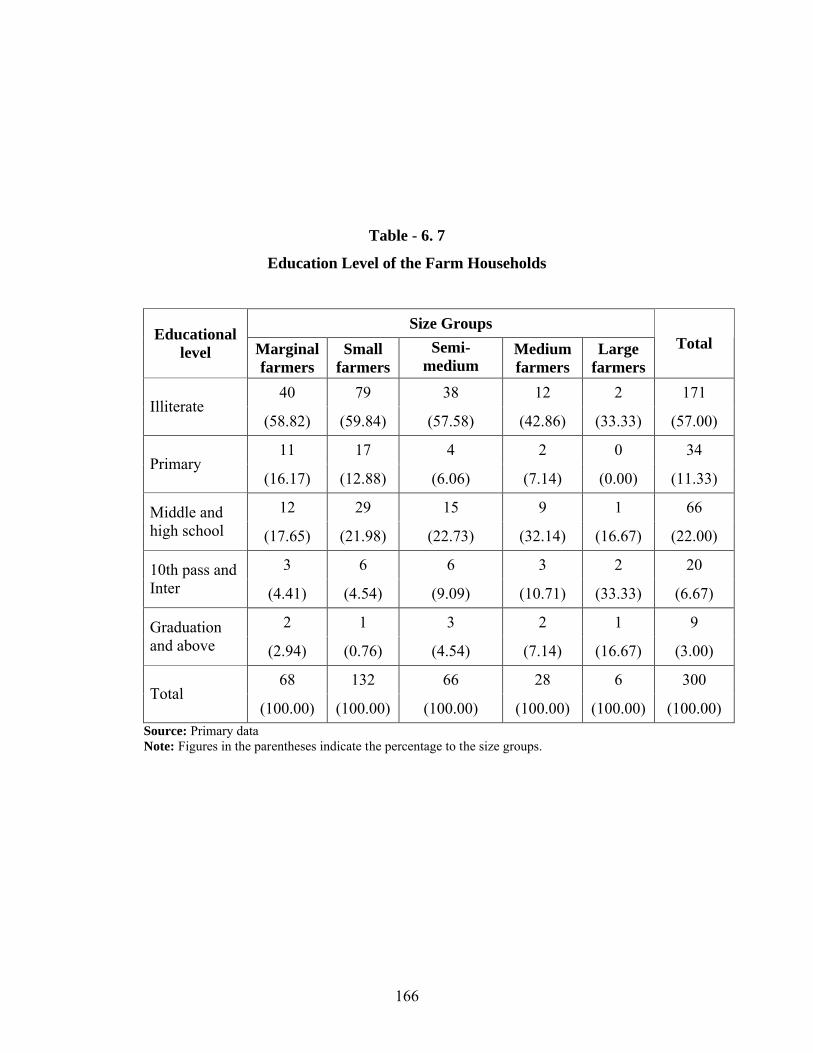
6.7 Education Levels of the Farm Households
Level of literacy is one of the important parameters that indicate the social
and economic status of farm households. This in turn brings in change in
economic status. The level of literacy among sample farm households by the size
of the farms is presented in table-6 7. The data reveals that 57 per cent of heads of
the farm households do not have any formal education. Of the remaining farm
households, 11.33 per cent of the farmers have primary education, 22 percent of
the farmers have school level education and 10 per cent of the dryland farmers
have got educated above 10th level. The data on literacy among the dryland
farmers appears to be low when compared to overall state rural population
literacy, which is 47 per cent.
165
Table-6.6
Consumer Durables
Size Groups
Goods Marginal farmers
Small farmers
Semi-medium farmers
Medium farmers
Large farmers
Total
12 18 5 3 2 40Radio
(17.64) (13.64) (7.58) (10.71) (33.33) (13.33)44 74 51 25 6 200
T.V(64.71) (56.06) (72.27) (89.28) (100.0) (66.67)
22 34 19 11 5 91LP gas
(32.35) (25.76) (28.78) (39.28) (83.33) (30.33)1 1 0 0 0 2
Gobar gas(1.47) (0.75) (0.00) (0.00) (0.00) (0.67)
47 96 60 22 6 231Electric fan
(69.12) (72.73) (90.91) (78.6) (100.0) (77.00)0 1 2 1 2 6
Refrigerator(0.00) (0.75) (3.00) (3.57) (33.33) (2.00)
1 0 0 1 1 3Domestic pumpset (1.47) (0.00) (0.00) (3.57) (16.67) (1.00)
1 4 6 5 3 19VCD or DVD
(1.47) (3.03) (9.09) (17.85) (50.00) (6.33)29 64 49 17 6 165Cell phone or
land line phones (42.65) (48.48) (74.24) (60.71) (100.00) (55.00)32 69 31 16 4 152
Bicycle(47.05) (52.27) (47.00) (57.14) (66.66) (50.67)
6 14 12 9 4 45Two wheeler
(8.82) (10.61) (18.18) (32.14) (66.67) (15.00)0 1 0 0 0 1
Jeep(0.00) (0.75) (0.00) (0.00) (0.00) (0.33)
Source: Primary dataNote: Figures in the parentheses indicate the percentage to the respective size groups.
166
Table - 6. 7
Education Level of the Farm Households
Size Groups Educational
level Marginal farmers
Small farmers
Semi-medium farmers
Medium farmers
Large farmers
Total
40 79 38 12 2 171Illiterate
(58.82) (59.84) (57.58) (42.86) (33.33) (57.00)
11 17 4 2 0 34Primary
(16.17) (12.88) (6.06) (7.14) (0.00) (11.33)
12 29 15 9 1 66Middle and high school (17.65) (21.98) (22.73) (32.14) (16.67) (22.00)
3 6 6 3 2 2010th pass and Inter (4.41) (4.54) (9.09) (10.71) (33.33) (6.67)
2 1 3 2 1 9Graduation and above (2.94) (0.76) (4.54) (7.14) (16.67) (3.00)
68 132 66 28 6 300Total
(100.00) (100.00) (100.00) (100.00) (100.00) (100.00)Source: Primary dataNote: Figures in the parentheses indicate the percentage to the size groups.
167
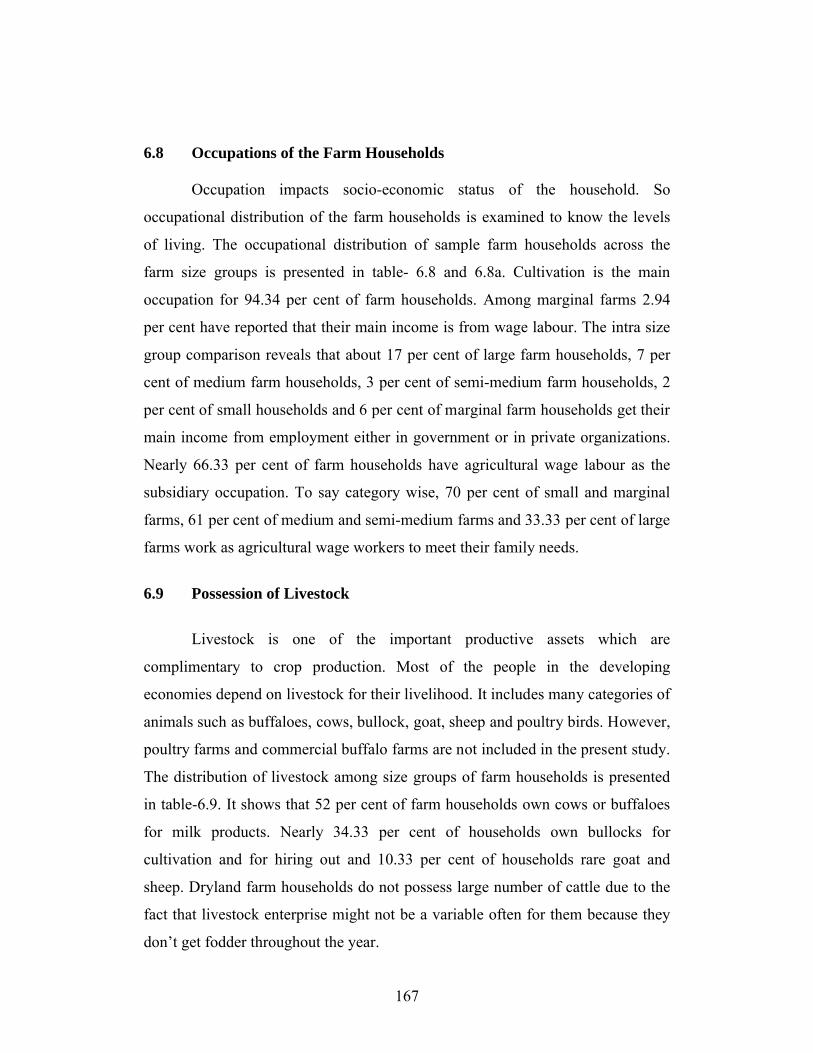
6.8 Occupations of the Farm Households
Occupation impacts socio-economic status of the household. So
occupational distribution of the farm households is examined to know the levels
of living. The occupational distribution of sample farm households across the
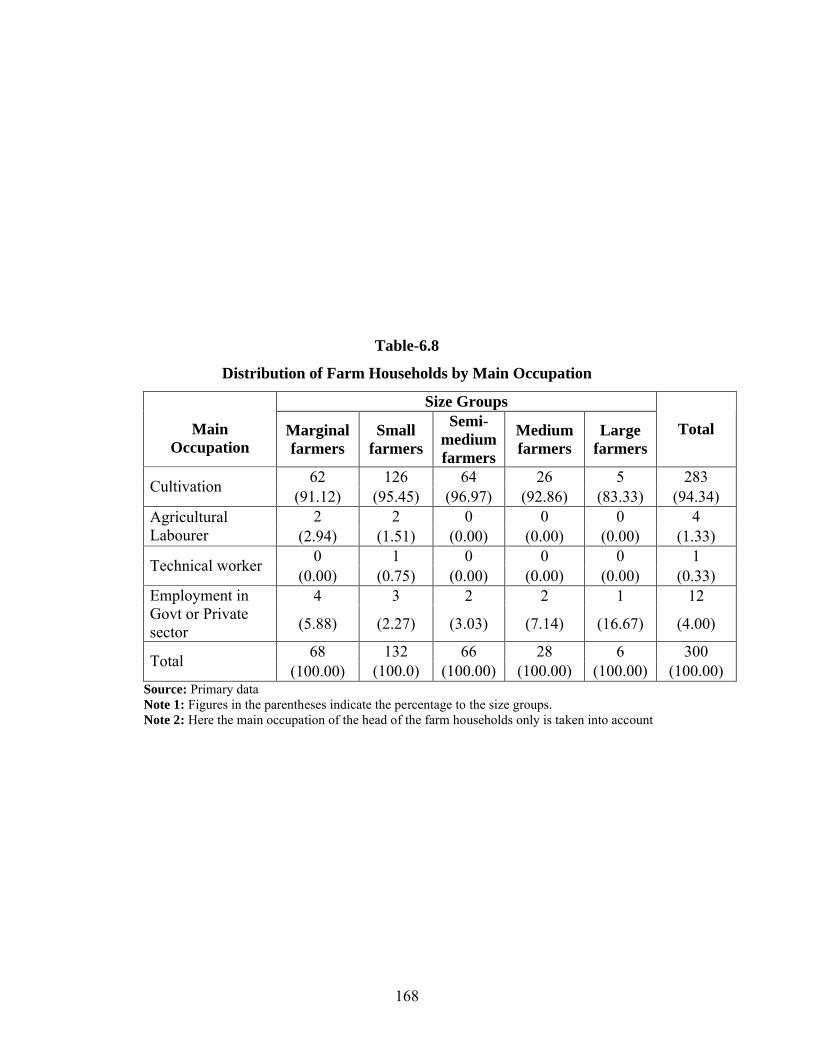
farm size groups is presented in table- 6.8 and 6.8a. Cultivation is the main
occupation for 94.34 per cent of farm households. Among marginal farms 2.94
per cent have reported that their main income is from wage labour. The intra size
group comparison reveals that about 17 per cent of large farm households, 7 per
cent of medium farm households, 3 per cent of semi-medium farm households, 2
per cent of small households and 6 per cent of marginal farm households get their
main income from employment either in government or in private organizations.
Nearly 66.33 per cent of farm households have agricultural wage labour as the
subsidiary occupation. To say category wise, 70 per cent of small and marginal
farms, 61 per cent of medium and semi-medium farms and 33.33 per cent of large
farms work as agricultural wage workers to meet their family needs.
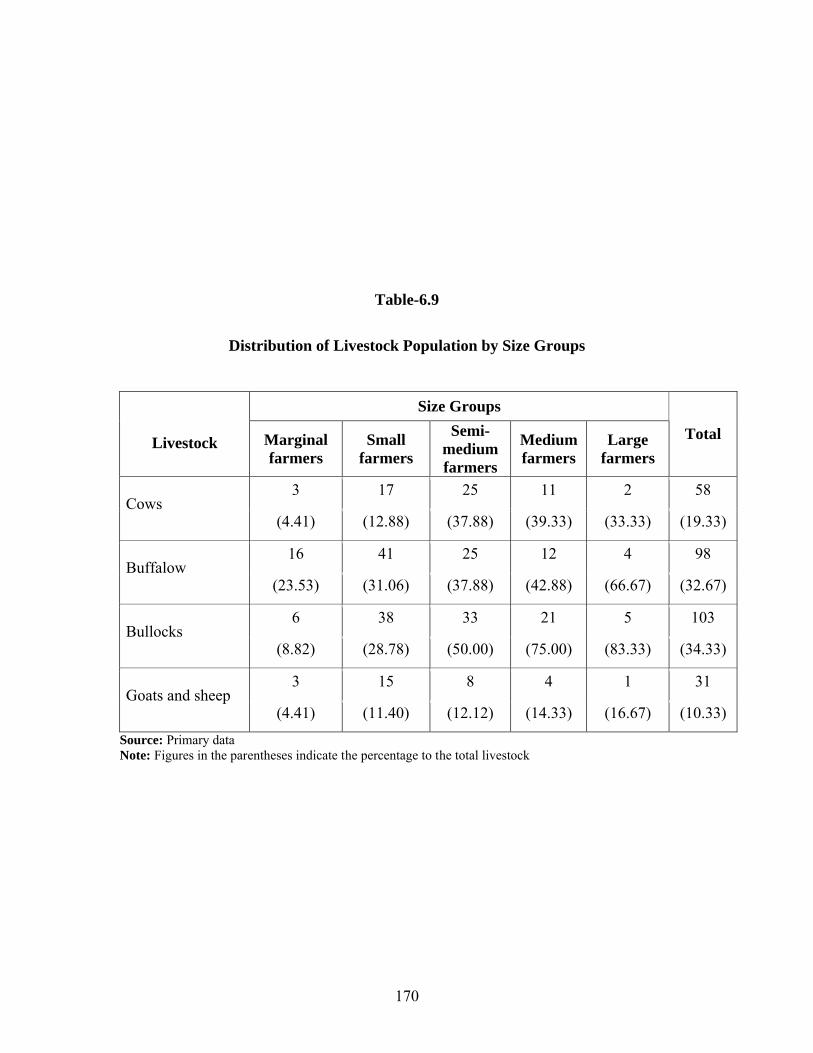
6.9 Possession of Livestock
Livestock is one of the important productive assets which are
complimentary to crop production. Most of the people in the developing
economies depend on livestock for their livelihood. It includes many categories of
animals such as buffaloes, cows, bullock, goat, sheep and poultry birds. However,
poultry farms and commercial buffalo farms are not included in the present study.
The distribution of livestock among size groups of farm households is presented
in table-6.9. It shows that 52 per cent of farm households own cows or buffaloes
for milk products. Nearly 34.33 per cent of households own bullocks for
cultivation and for hiring out and 10.33 per cent of households rare goat and
sheep. Dryland farm households do not possess large number of cattle due to the
fact that livestock enterprise might not be a variable often for them because they
don’t get fodder throughout the year.
168
Table-6.8
Distribution of Farm Households by Main Occupation
Size Groups
Main Occupation
Marginal farmers
Small farmers
Semi-medium farmers
Medium farmers
Large farmers
Total
62 126 64 26 5 283Cultivation
(91.12) (95.45) (96.97) (92.86) (83.33) (94.34)2 2 0 0 0 4Agricultural
Labourer (2.94) (1.51) (0.00) (0.00) (0.00) (1.33)0 1 0 0 0 1
Technical worker(0.00) (0.75) (0.00) (0.00) (0.00) (0.33)
4 3 2 2 1 12Employment in Govt or Privatesector (5.88) (2.27) (3.03) (7.14) (16.67) (4.00)
68 132 66 28 6 300Total
(100.00) (100.0) (100.00) (100.00) (100.00) (100.00)Source: Primary dataNote 1: Figures in the parentheses indicate the percentage to the size groups. Note 2: Here the main occupation of the head of the farm households only is taken into account
169
Table - 6.8 (a)
Subsidiary Occupation of the Farm Households
Size Groups Subsidiary occupation Marginal
farmersSmall
farmers
Semi-medium farmers
Medium farmers
Large farmers
Total
8 25 19 8 2 62No subsidary occupation (11.76) (18.94) (28.79) (28.57) (33.33) (20.67)
7 5 2 2 1 17Cultivation
(10.29) (3.79) (3.03) (7.14) (16.67) (5.66)48 92 40 17 2 199Agricultural
Labourer (70.59) (69.70) (60.61) (60.71) (33.33) (66.33)1 4 2 1 0 8
Artisan(1.47) (3.03) (3.03) (3.57) (0.00) (2.67)
4 0 0 0 0 4Server
(5.88) (0.00) (0.00) (0.00) (0.00) (1.33)0 4 1 0 1 6
Technical worker(0.03) (3.03) (1.52) (0.0) (16.67) (2.00)
0 2 0 0 0 2Govt and Private Employment (0.00) (1.51) (0.00) (0.00) (0.00) (0.67)
0 0 2 0 0 2Business
(0.00) (0.00) (3.03) (0.00) (0.00) (0.67)68 132 66 28 6 300
Total(100.00) (100.00) (100.00) (100.00) (100.00) (100.00)
Source: Primary dataNote 1: Figures in the parentheses indicate the percentage to the total size groups.Note 2: Here the subsidiary occupation of the head of the farm households only is taken into account
170
Table-6.9
Distribution of Livestock Population by Size Groups
Size Groups
Livestock Marginal farmers
Small farmers
Semi-medium farmers
Medium farmers
Large farmers
Total
3 17 25 11 2 58Cows
(4.41) (12.88) (37.88) (39.33) (33.33) (19.33)
16 41 25 12 4 98Buffalow
(23.53) (31.06) (37.88) (42.88) (66.67) (32.67)
6 38 33 21 5 103Bullocks
(8.82) (28.78) (50.00) (75.00) (83.33) (34.33)
3 15 8 4 1 31Goats and sheep
(4.41) (11.40) (12.12) (14.33) (16.67) (10.33)
Source: Primary dataNote: Figures in the parentheses indicate the percentage to the total livestock
171
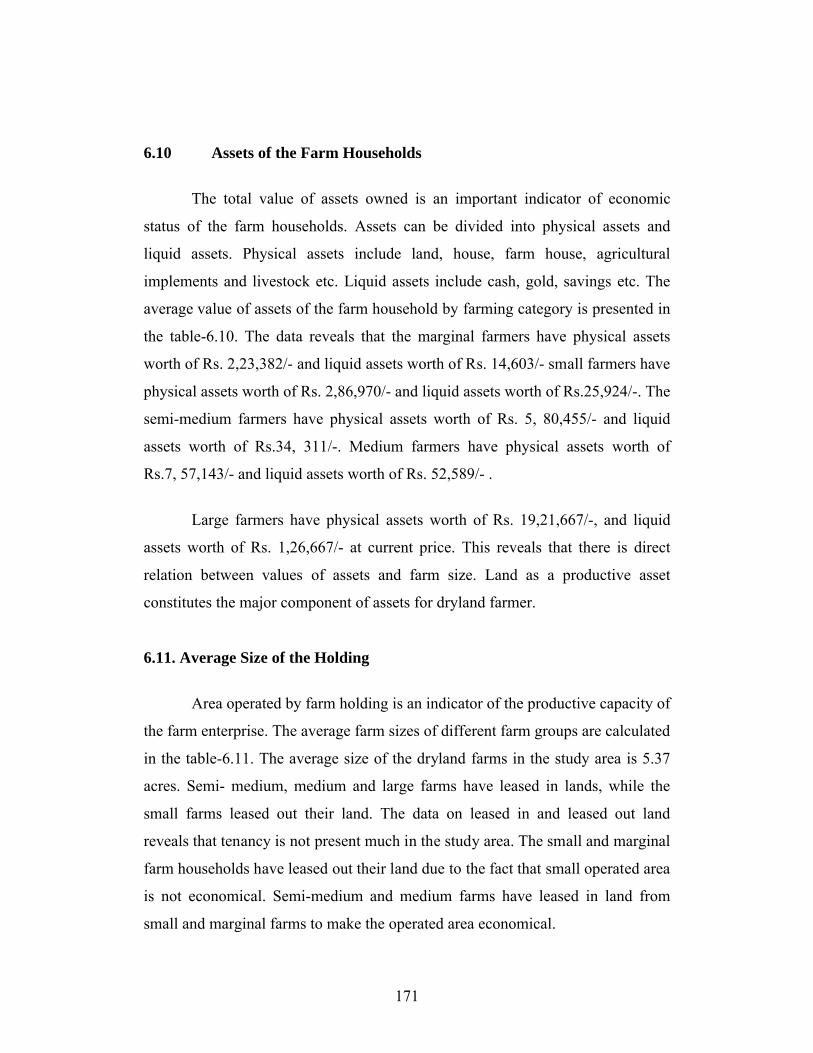
6.10 Assets of the Farm Households
The total value of assets owned is an important indicator of economic
status of the farm households. Assets can be divided into physical assets and
liquid assets. Physical assets include land, house, farm house, agricultural
implements and livestock etc. Liquid assets include cash, gold, savings etc. The
average value of assets of the farm household by farming category is presented in
the table-6.10. The data reveals that the marginal farmers have physical assets
worth of Rs. 2,23,382/- and liquid assets worth of Rs. 14,603/- small farmers have
physical assets worth of Rs. 2,86,970/- and liquid assets worth of Rs.25,924/-. The
semi-medium farmers have physical assets worth of Rs. 5, 80,455/- and liquid
assets worth of Rs.34, 311/-. Medium farmers have physical assets worth of
Rs.7, 57,143/- and liquid assets worth of Rs. 52,589/- .
Large farmers have physical assets worth of Rs. 19,21,667/-, and liquid
assets worth of Rs. 1,26,667/- at current price. This reveals that there is direct
relation between values of assets and farm size. Land as a productive asset
constitutes the major component of assets for dryland farmer.
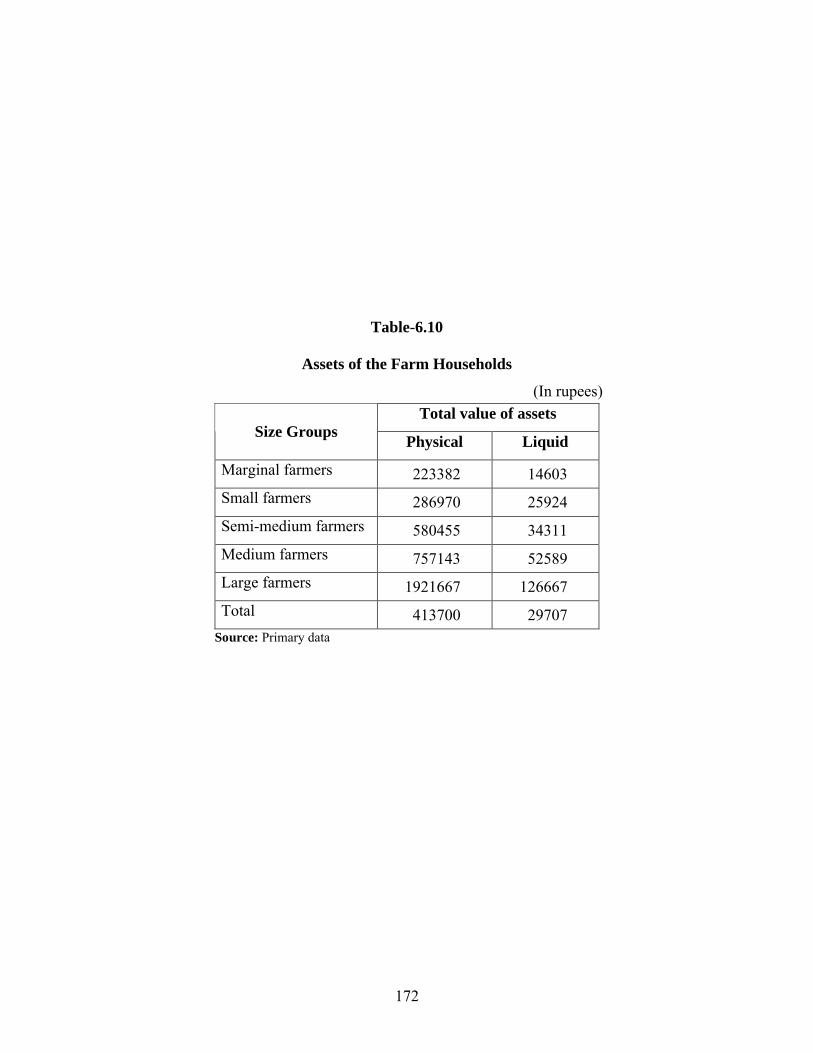
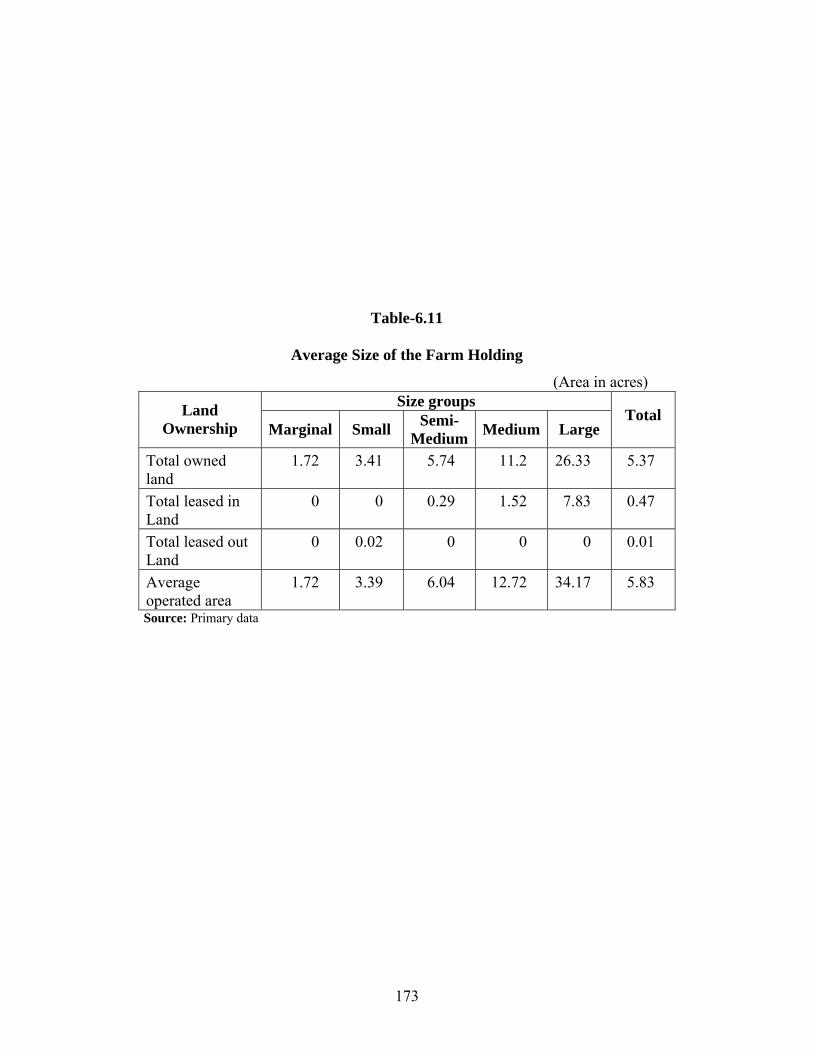
6.11. Average Size of the Holding
Area operated by farm holding is an indicator of the productive capacity of
the farm enterprise. The average farm sizes of different farm groups are calculated
in the table-6.11. The average size of the dryland farms in the study area is 5.37
acres. Semi- medium, medium and large farms have leased in lands, while the
small farms leased out their land. The data on leased in and leased out land
reveals that tenancy is not present much in the study area. The small and marginal
farm households have leased out their land due to the fact that small operated area
is not economical. Semi-medium and medium farms have leased in land from
small and marginal farms to make the operated area economical.
172
Table-6.10
Assets of the Farm Households
(In rupees)
Source: Primary data
Total value of assetsSize Groups
Physical Liquid
Marginal farmers 223382 14603
Small farmers 286970 25924
Semi-medium farmers 580455 34311
Medium farmers 757143 52589
Large farmers 1921667 126667
Total 413700 29707
173
Table-6.11
Average Size of the Farm Holding
(Area in acres)Size groups
Land Ownership Marginal Small
Semi-Medium
Medium LargeTotal
Total owned land
1.72 3.41 5.74 11.2 26.33 5.37
Total leased in Land
0 0 0.29 1.52 7.83 0.47
Total leased outLand
0 0.02 0 0 0 0.01
Average operated area
1.72 3.39 6.04 12.72 34.17 5.83
Source: Primary data
174
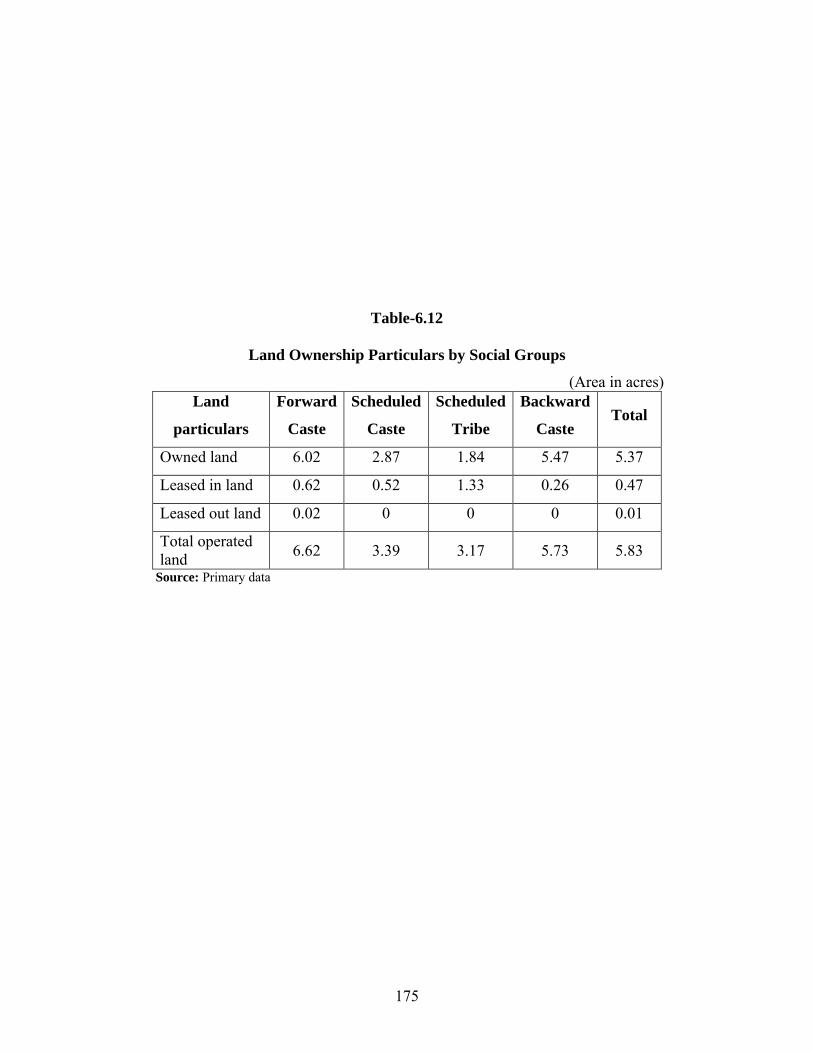
6.12 Land Ownership Particulars by Social Groups
Majority of the people living in dryland regions earn livelihood from
cultivation. The necessary conditions for improving standard of living of the
people living on agriculture is, just and rational distribution of land among
different categories of people. The distribution of lands among different social
groups is presented in table-6.12. Farmers are divided as per social category,
namely Forward Caste (FC), Scheduled Caste (SC), Scheduled Tribes (ST) and
Backward Caste (BC) to identify the relation between social status and land
ownership. The distribution of farm households as per social category shows that
the average size of land owned by forward caste is 6.02 acres (90.94 per cent),
while their average leased in land and leased out land sizes respectively are 0.62
acres and 0.30 acres (9.37 and 0.30 per cent). The average size of land owned by
Scheduled Caste is 2.87 acres and their average size of leased in land is 0.52
acres. The average owned land among Schedule Tribes and Backward Castes are
1.84 acres and 5.47 acres respectively. Further some of the Scheduled Tribes and
Backward Castes have leased in land of 1.33 acres and 0.26 acres respectively.
There is a close relation between farm size and social hierarchy.
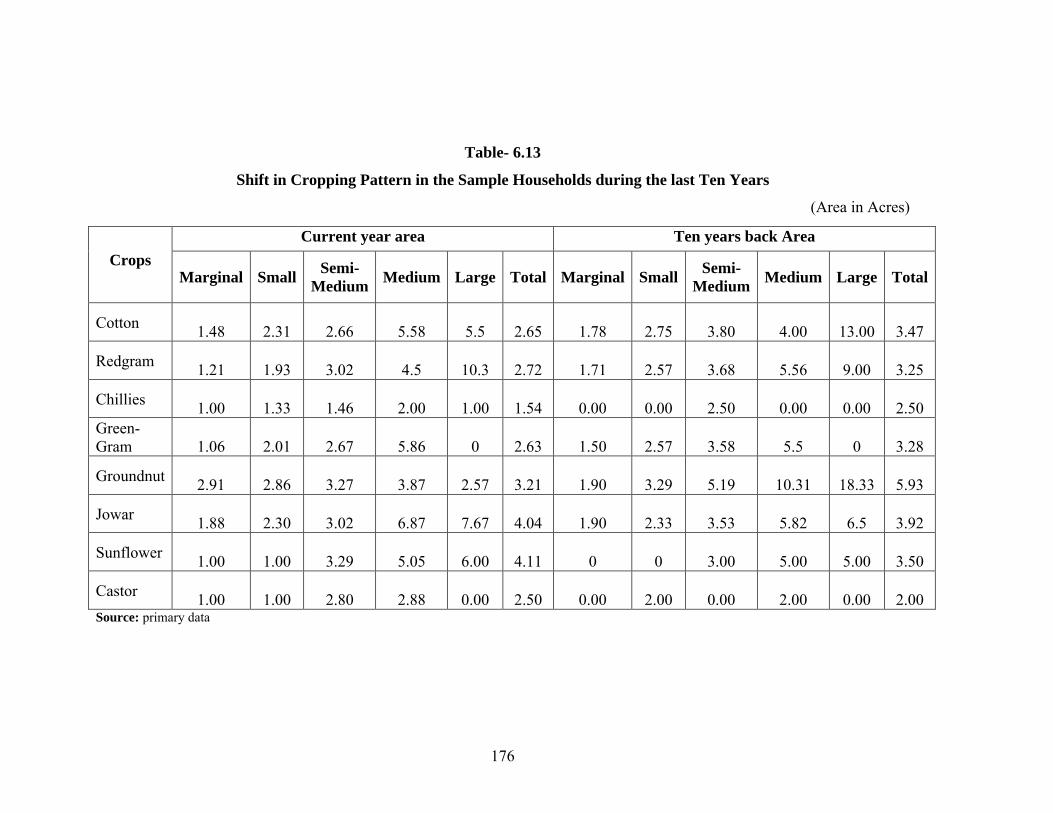
6.13 Cropping Pattern of the Sample Households
The shift in cropping pattern of the sample households in a period of ten
years is presented in table-6.13. As shown in the table, there is no significant shift
in the area under different crops. Ten years ago, the largest average cropped area
found to be of groundnut, while it is shifted to sunflower in the current year. The
average cropped areas of chillies, castor, cotton and groundnut have also
decreased. The average area under pulses has also declined during the ten years
period. It is also to be noted that the average cropped areas of jowar and
sunflower crops have declined. Further, it can also be said that this decline in
cropped areas has occurred in order to reduce the investment on crops as the
financial status of the farm households in the study areas is at stake due to drought
conditions.
175
Table-6.12
Land Ownership Particulars by Social Groups
(Area in acres)Land
particulars
Forward
Caste
Scheduled
Caste
Scheduled
Tribe
Backward
CasteTotal
Owned land 6.02 2.87 1.84 5.47 5.37
Leased in land 0.62 0.52 1.33 0.26 0.47
Leased out land 0.02 0 0 0 0.01
Total operated land
6.62 3.39 3.17 5.73 5.83
Source: Primary data
176
Table- 6.13
Shift in Cropping Pattern in the Sample Households during the last Ten Years
(Area in Acres)
Source: primary data
Current year area Ten years back Area
CropsMarginal Small
Semi-Medium
Medium Large Total Marginal SmallSemi-
MediumMedium Large Total
Cotton1.48 2.31 2.66 5.58 5.5 2.65 1.78 2.75 3.80 4.00 13.00 3.47
Redgram1.21 1.93 3.02 4.5 10.3 2.72 1.71 2.57 3.68 5.56 9.00 3.25
Chillies1.00 1.33 1.46 2.00 1.00 1.54 0.00 0.00 2.50 0.00 0.00 2.50
Green-Gram 1.06 2.01 2.67 5.86 0 2.63 1.50 2.57 3.58 5.5 0 3.28
Groundnut2.91 2.86 3.27 3.87 2.57 3.21 1.90 3.29 5.19 10.31 18.33 5.93
Jowar1.88 2.30 3.02 6.87 7.67 4.04 1.90 2.33 3.53 5.82 6.5 3.92
Sunflower1.00 1.00 3.29 5.05 6.00 4.11 0 0 3.00 5.00 5.00 3.50
Castor1.00 1.00 2.80 2.88 0.00 2.50 0.00 2.00 0.00 2.00 0.00 2.00

177
It is also to be noted that the farmers have shifted their crops to sunflower,
which is a low investment crop, from groundnut, chillies and cotton, which are
high investment crops.
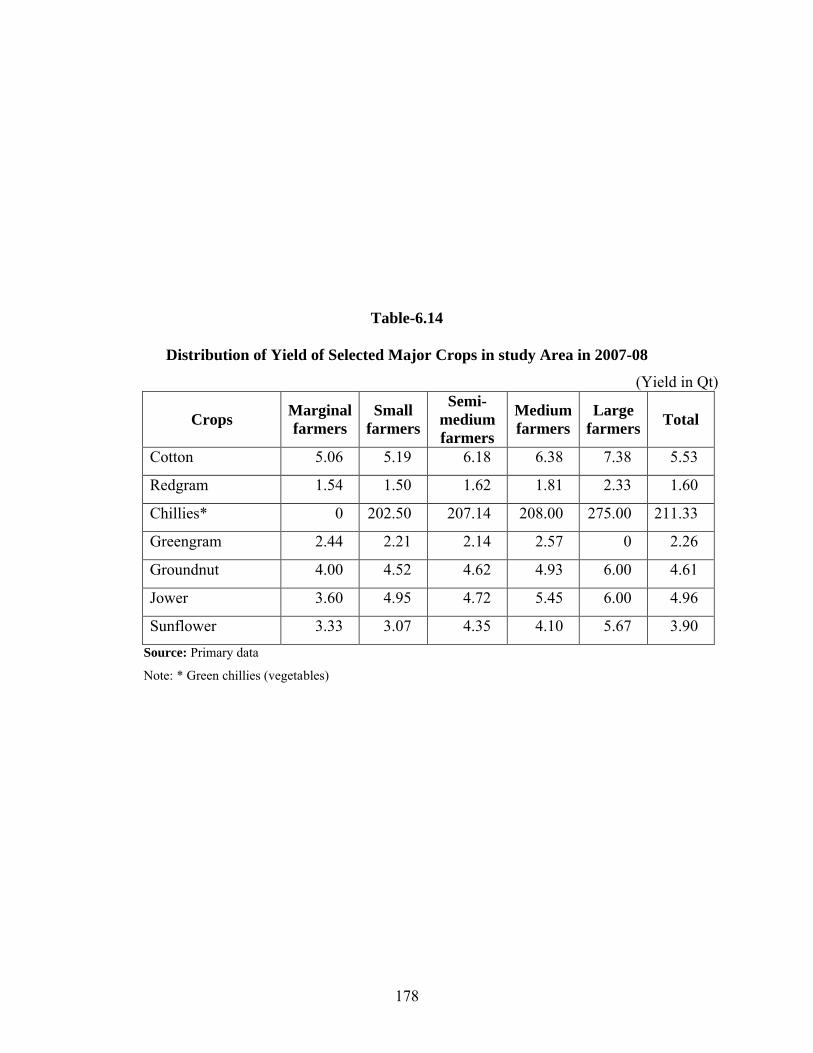
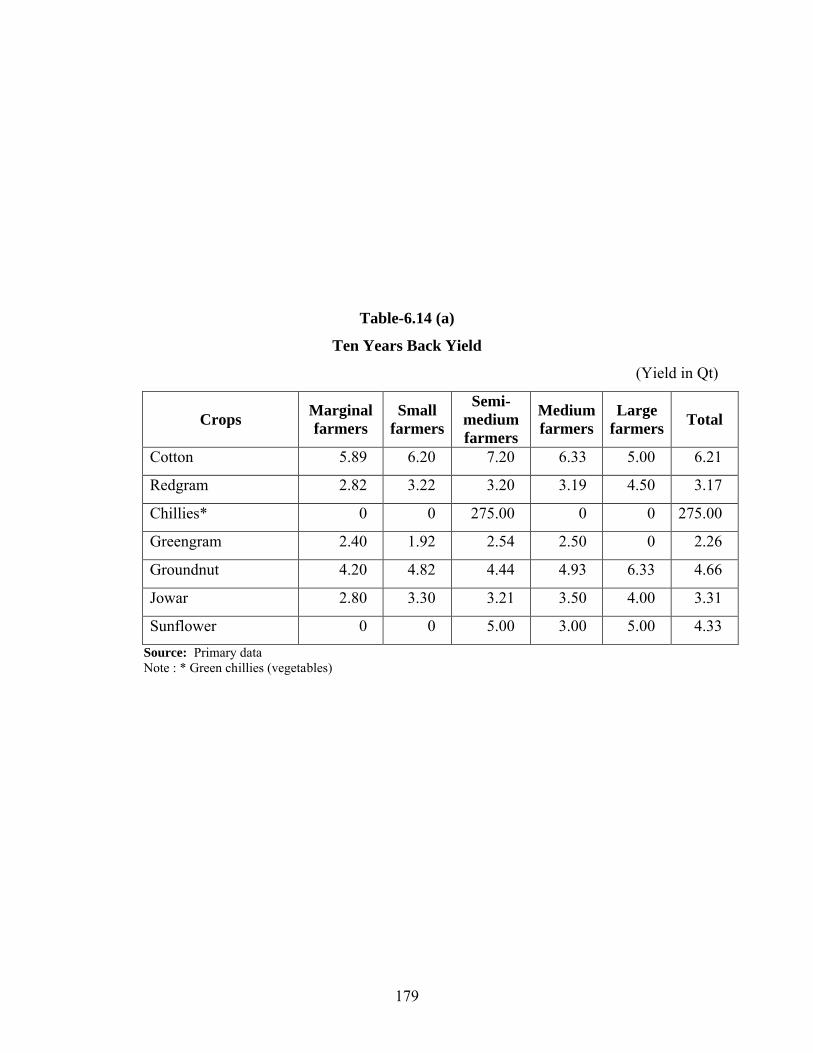
6.14 Distribution of Yields of Selected Major Crops (1998-1999 to 2008-
2009)
An observation is made in respect of yields of major crops in the selected
areas during the decade. The statistics displayed in tables-6.14 and 6.14(a) clearly
show that there is a significant decline in the yields of major crops during the ten
years period. The rate of decline varies across the size groups. The declining
yields indicate the declining productive capacity of land. Land degradation is
found to be the major contributing factor for declining yields. The data on crop
yield in two periods clearly reveals a direct relation between ten years yield and
farm size. Per acre yield of major crop increases with farm size in both periods
6.15 Source of Credit
In the dryland cultivation, agricultural credit assumes more importance
when compared to other irrigated farming. Limited availability of money for
farmers to save does not allow them to finance farm expenses. Though private
agencies play an exploitative role, credit through institutional channels is the only
way to break agricultural stagnation in dryland regions
So the farmers depend on loan to meet the costs in raising the crops.
Farmers are engaged in cultivation to make profit out of capital by investing on
land and extracting surplus value from work, but as a means of self-employment
and family maintenance, typically, a farmer in India, particularly in dryland
regions would still be the owner cultivator, who mainly cultivates land with
family labour. The returns they get from land in a large measure are a response of
their family labour expected in the production process. However, since cultivation
needs cash investments, farmers have to borrow money to carry out the
agricultural activities, either from government or from cooperative institution or
from private money lenders
178
Table-6.14
Distribution of Yield of Selected Major Crops in study Area in 2007-08
(Yield in Qt)
CropsMarginal farmers
Small farmers
Semi-medium farmers
Medium farmers
Large farmers
Total
Cotton 5.06 5.19 6.18 6.38 7.38 5.53
Redgram 1.54 1.50 1.62 1.81 2.33 1.60
Chillies* 0 202.50 207.14 208.00 275.00 211.33
Greengram 2.44 2.21 2.14 2.57 0 2.26
Groundnut 4.00 4.52 4.62 4.93 6.00 4.61
Jower 3.60 4.95 4.72 5.45 6.00 4.96
Sunflower 3.33 3.07 4.35 4.10 5.67 3.90
Source: Primary data
Note: * Green chillies (vegetables)
179
Table-6.14 (a)
Ten Years Back Yield
(Yield in Qt)
CropsMarginal farmers
Small farmers
Semi-medium farmers
Medium farmers
Large farmers
Total
Cotton 5.89 6.20 7.20 6.33 5.00 6.21
Redgram 2.82 3.22 3.20 3.19 4.50 3.17
Chillies* 0 0 275.00 0 0 275.00
Greengram 2.40 1.92 2.54 2.50 0 2.26
Groundnut 4.20 4.82 4.44 4.93 6.33 4.66
Jowar 2.80 3.30 3.21 3.50 4.00 3.31
Sunflower 0 0 5.00 3.00 5.00 4.33
Source: Primary dataNote : * Green chillies (vegetables)
180
It should be kept in mind that unlike other professions and occupations,
farmers do not receive their income on a daily or weekly or monthly basis.
Income for them comes only at the end of the crop season. So, farmers borrow
money not only to meet the cultivation expenses, but also to meet their
consumption and family needs. It is also difficult to demarcate clearly the loans
taken by farmers as the ones taken for cultivation purpose and family needs, as
they may spend the loan amount on both, as the situation demands.
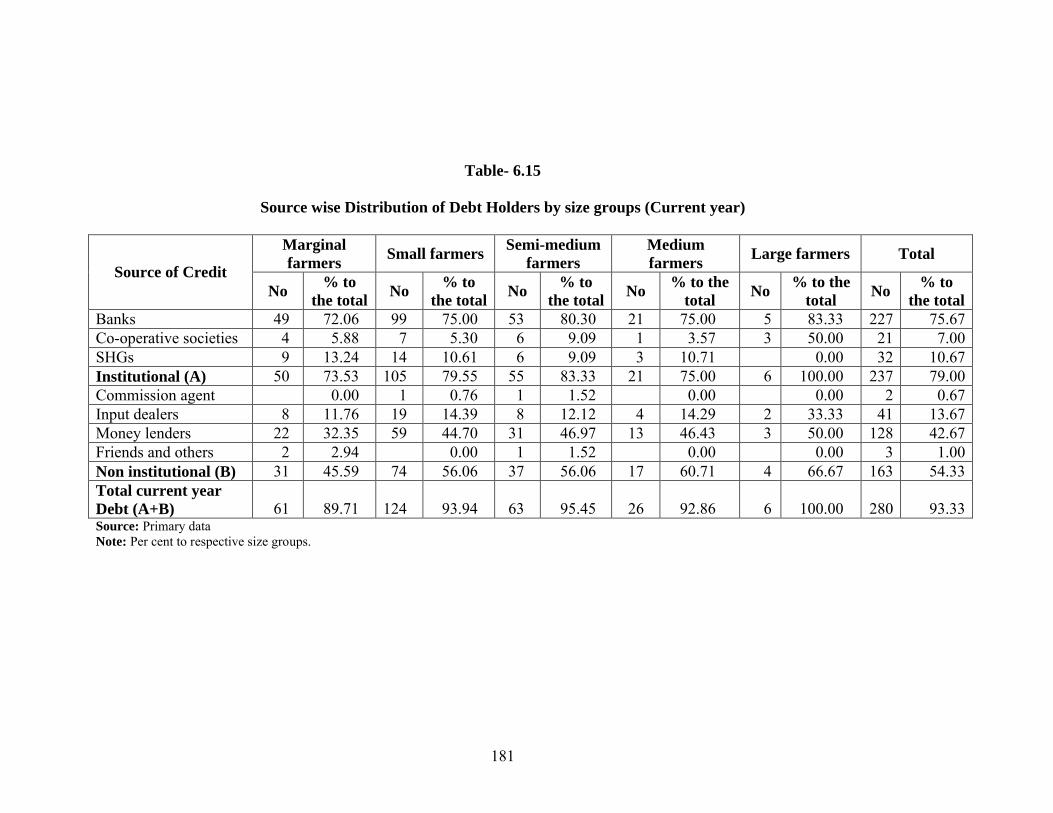
The credit requirements of the farms are met by obtaining loans from
institutional and non- institutional agencies. Institutional agencies particularly that
provide loan to farmers are banks, cooperative societies and bank sponsored self
help groups. The non institutional agencies include commission agents, input
dealers, money lenders and others. The distribution of farms by source wise credit
is presented in the table 6.15.
The credit made available through banks and co-operative societies is
found to be main component in the study area. Nearly 75 per cent of farm
households found to have access to bank credit. Nearly 10 per cent of the farm
households who do not have access to bank credit are getting loan from self-help
groups. Nearly 80 per cent of marginal and small farm households, 84 per cent of
semi-medium farm households, 81 per cent of medium farms and 83 per cent of
large farm households will borrow loans from banks. The role of co-operative
societies found to be very limited in meeting the credit requirements of the farms.
Inspite of institutional support in meeting the credit needs of the farms in the
study area, the non-institutional sources of farm credit are found to be very
important in the composition of total credit needs of the farm households. Nearly
54 per cent of the farm households are depending on non-institutional sources also
to meet their total credit requirements.
181
Table- 6.15
Source wise Distribution of Debt Holders by size groups (Current year)
Marginal farmers
Small farmersSemi-medium
farmersMedium farmers
Large farmers TotalSource of Credit
No % to
the totalNo
% to the total
No % to
the totalNo
% to the total
No % to the
totalNo
% to the total
Banks 49 72.06 99 75.00 53 80.30 21 75.00 5 83.33 227 75.67Co-operative societies 4 5.88 7 5.30 6 9.09 1 3.57 3 50.00 21 7.00SHGs 9 13.24 14 10.61 6 9.09 3 10.71 0.00 32 10.67Institutional (A) 50 73.53 105 79.55 55 83.33 21 75.00 6 100.00 237 79.00Commission agent 0.00 1 0.76 1 1.52 0.00 0.00 2 0.67Input dealers 8 11.76 19 14.39 8 12.12 4 14.29 2 33.33 41 13.67Money lenders 22 32.35 59 44.70 31 46.97 13 46.43 3 50.00 128 42.67Friends and others 2 2.94 0.00 1 1.52 0.00 0.00 3 1.00Non institutional (B) 31 45.59 74 56.06 37 56.06 17 60.71 4 66.67 163 54.33Total current year Debt (A+B) 61 89.71 124 93.94 63 95.45 26 92.86 6 100.00 280 93.33Source: Primary data Note: Per cent to respective size groups.
182
Further, it is found that irrespective of the farm size, the proportions of
farm households borrowing from non institutional sources are same. The
institutional agencies are not able to meet the credit requirements of the farmers.
The farmers in the study area are borrowing loan from money lenders,
commission agents and input dealers at high interest rates.
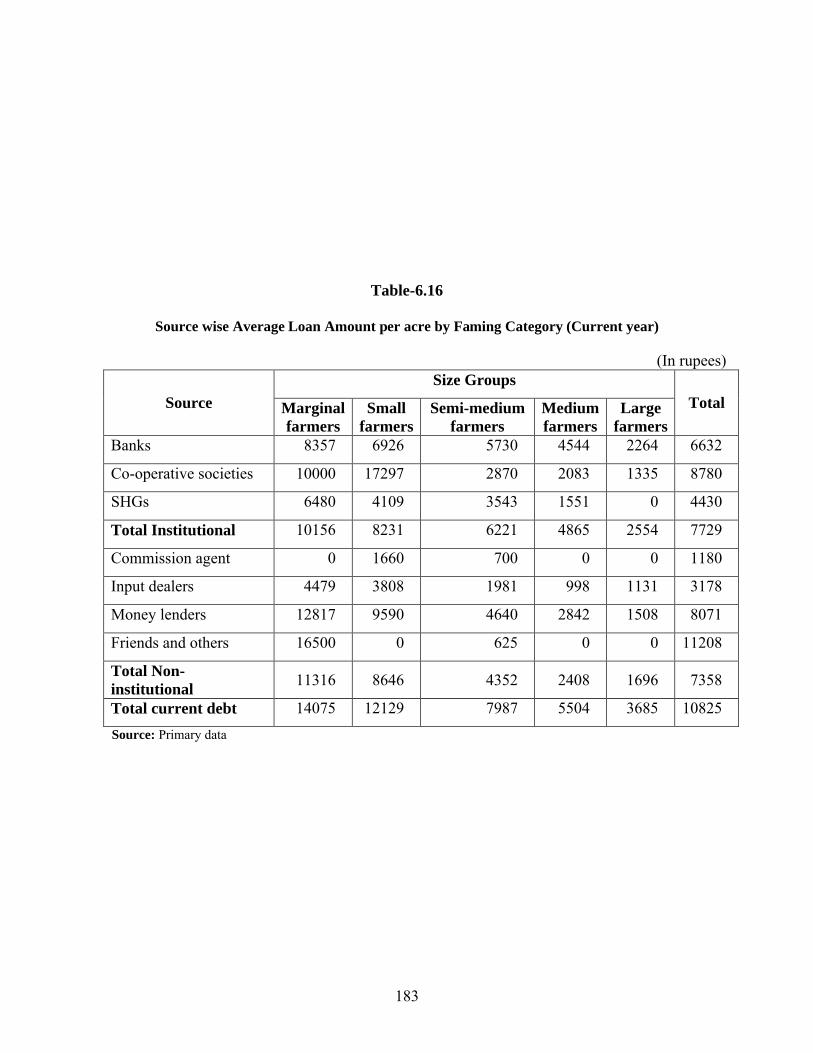
6.16 Amount Borrowed from Different Sources
The average loan amount borrowed by farm households from different
sources is presented in the table-6.16. The loan which is borrowed from banks on
an average is Rs 6632/- per acre. For marginal farms it is Rs 8357/- per acre and
Rs 2264 per acre for large farms. That is, per acre average credit by banks is
decreasing when farm size is increasing. Farmer who has availed credit from co-
operative society has got Rs 8780/- per acre and small farmers have borrowed Rs
4430/- per acre. The marginal farms who have availed loan from non-institutional
agencies have received Rs 11316/- per acre, while it is Rs 8646/- in case of small
farms, Rs 4352/- in case of semi-medium farms, Rs. 2408/- in case of medium
farms and Rs. 1696/- per acre in case of large farms. Per acre credit from non-
institutional sources is higher among small and marginal farms. Per acre loan
from both institutional and non institutional sources is found to be Rs 10825/- per
acre. The loan borrowed per acre is found to be increasing with the decreasing
farm size. The small and marginal farms need credit to meet their family
expenditure also when they work in their farms. So per acre credit might be
increasing with the decreasing in farm size.
Return to cultivation and absence of non-farm opportunities are said to be
the indication of the larger socio- economic analysis of dryland cultivation. This
will alienated by multiple risks like, income, yield, price and credit among others.
This has led to the incidence of indebtedness among farm households.
183
Table-6.16
Source wise Average Loan Amount per acre by Faming Category (Current year)
(In rupees)Size Groups
Source Marginal farmers
Small farmers
Semi-medium farmers
Medium farmers
Large farmers
Total
Banks 8357 6926 5730 4544 2264 6632
Co-operative societies 10000 17297 2870 2083 1335 8780
SHGs 6480 4109 3543 1551 0 4430
Total Institutional 10156 8231 6221 4865 2554 7729
Commission agent 0 1660 700 0 0 1180
Input dealers 4479 3808 1981 998 1131 3178
Money lenders 12817 9590 4640 2842 1508 8071
Friends and others 16500 0 625 0 0 11208
Total Non-institutional
11316 8646 4352 2408 1696 7358
Total current debt 14075 12129 7987 5504 3685 10825
Source: Primary data
184
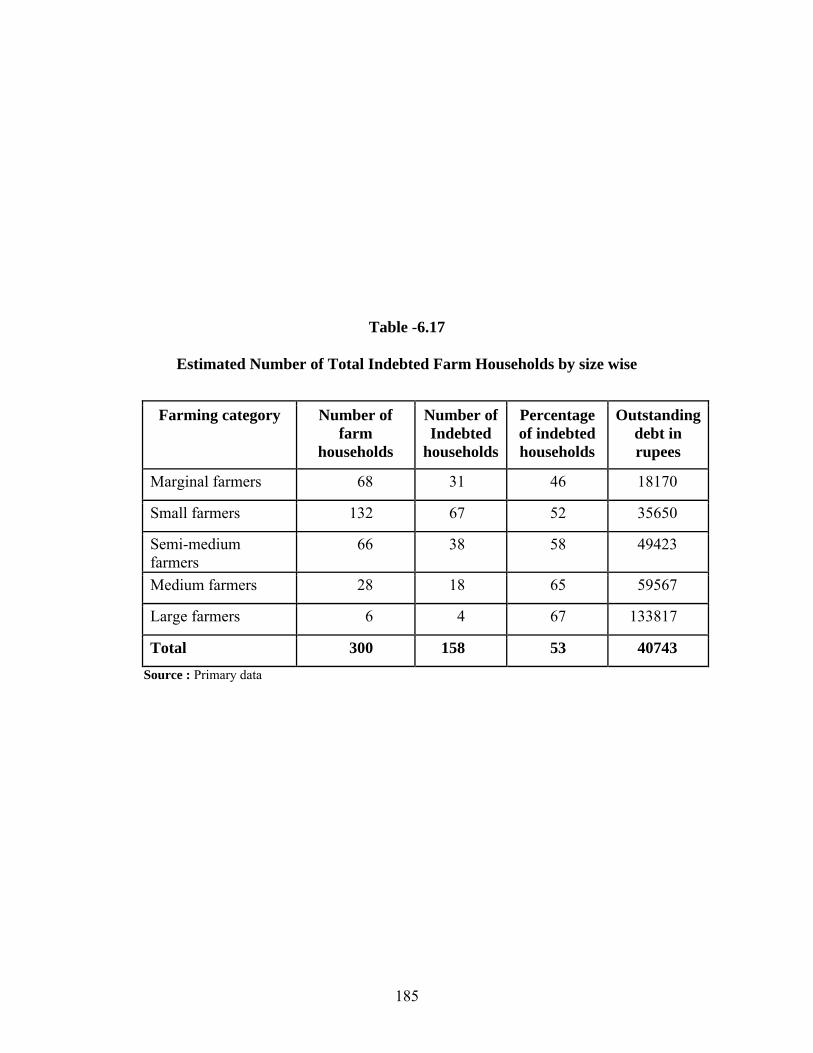
6.17 Indebtedness among Farm Households
The indebtedness among farm households is the indication of distress in
dryland cultivation. The outstanding debt of the farm households by size wise and
source wise is presented in the table-6.17. A farmer gets income from cultivation,
farming other than cultivation, other agricultural activities, wage employment,
non-farm employment, pension and other sources. A farm household is
considered to be indebted if he could not repay the loan out of the total receipts
from all sources of income at the end of the agricultural year.
The indebtedness of farm households is presented in the table. Out of 300
farm households, 80 per cent are reported to be indebted. The prevalence of
indebtedness is increasing with the farm size. The percentage of indebted farm
households is high among large and medium farms. About 46 per cent of the
marginal, 52 per cent of small, 58 per cent of semi-medium, 65 per cent of
medium, 67 per cent of large farms are reported to be indebted. A farm household
on an average reported to be indebted an amount of Rs 40743/-. Average
outstanding debt among marginal, small, semi-medium, medium and large farms
are found to be Rs 18120/-, 35650/-, Rs 49423/-, Rs 59567/- and Rs 133817/-
respectively. Farmers have reported that they are repaying the loans taken from
banks, cooperatives societies and self-help groups at the end of the year by
borrowing from other non-institutional sources. So this credit limits gets
enhanced. It leads to a situation that debt gets accumulated over the years. Thus
the debt brings out situation of debt trap among farm households. This clearly
reveals the stress conditions of households
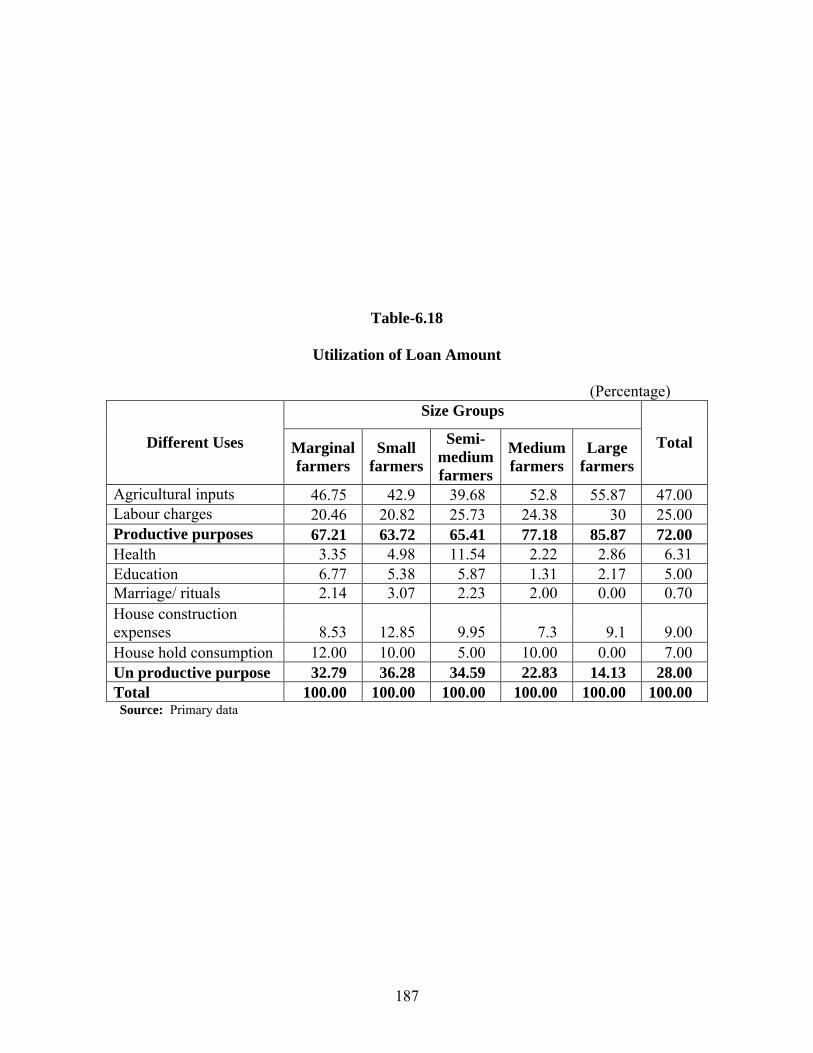
6.18 Utilization of Loan Amount
The main purpose of agricultural loan is to meet the expenses in crop
cultivation. The farmers get income only at the end of crop season. As there is no
other main source of income other than agriculture, the farmers borrow money not
185
Table -6.17
Estimated Number of Total Indebted Farm Households by size wise
Farming category Number of farm
households
Number of Indebted
households
Percentage of indebted households
Outstanding debt in rupees
Marginal farmers 68 31 46 18170
Small farmers 132 67 52 35650
Semi-medium farmers
66 38 58 49423
Medium farmers 28 18 65 59567
Large farmers 6 4 67 133817
Total 300 158 53 40743
Source : Primary data
186
only to meet the agricultural expenditure but also to meet the consumption
expenses and other socio-domestic needs. In this regard, the relation between
indebtedness and loan utilization has to be examined to understand the roots of
indebtedness. The utilization of loan by farm households is presented in the
table-6.18.
The table shows that most of the farm households have invested the major
portion of loan amount i.e., 72 per cent on productive purpose, such as
agricultural inputs, labour charges. They have incurred 47 per cent of the amount
on agricultural inputs and 25 per cent of the amount spent on labour charges.
Same trend is observed in all farm size groups with slight differences. The large
farmers have spent almost all the loan amount on productive purpose which is
85.87 per cent of the total debt.
The farmers have spent on an average 28 per cent of loan amount on
unproductive purpose. Of this 9 per cent of the amount is spent on house
construction under Indiramma Housing Scheme. Next, they have spent on an
average 7 per cent on household consumption and 6.3 per cent and 5 per cent on
health and education. When distributed among different farming categories small
farms stand at first place in investing 12 per cent of amount on house
construction, semi-medium and marginal farms followed them by spending 9.95
per cent and 8.53 per cent of amount on an average.
The marginal, small and medium farms have spent on an average 12 per
cent and 10 per cent of amount on household consumption purpose. The semi
medium farms have spent on average 11.54 per cent of loan amount on health.
The marginal farmers stand at first place in investing 6.77 per cent of amount on
education followed by semi-medium and small farmers spending 5.38 per cent
and 5.87 per cent of amount.
187
Table-6.18
Utilization of Loan Amount
(Percentage)Size Groups
Different Uses Marginal farmers
Small farmers
Semi-medium farmers
Medium farmers
Large farmers
Total
Agricultural inputs 46.75 42.9 39.68 52.8 55.87 47.00Labour charges 20.46 20.82 25.73 24.38 30 25.00Productive purposes 67.21 63.72 65.41 77.18 85.87 72.00Health 3.35 4.98 11.54 2.22 2.86 6.31Education 6.77 5.38 5.87 1.31 2.17 5.00Marriage/ rituals 2.14 3.07 2.23 2.00 0.00 0.70House construction expenses 8.53 12.85 9.95 7.3 9.1 9.00House hold consumption 12.00 10.00 5.00 10.00 0.00 7.00Un productive purpose 32.79 36.28 34.59 22.83 14.13 28.00Total 100.00 100.00 100.00 100.00 100.00 100.00Source: Primary data
188
It is observed that 72 per cent of farm households have invested amount
borrowed, on productive purpose and 28 per cent of them have invested on
unproductive purpose. The data clearly reveals that the indebtedness among farm
households is due to un-productive consumption like social ceremonies, marriages
and other religious ceremonies
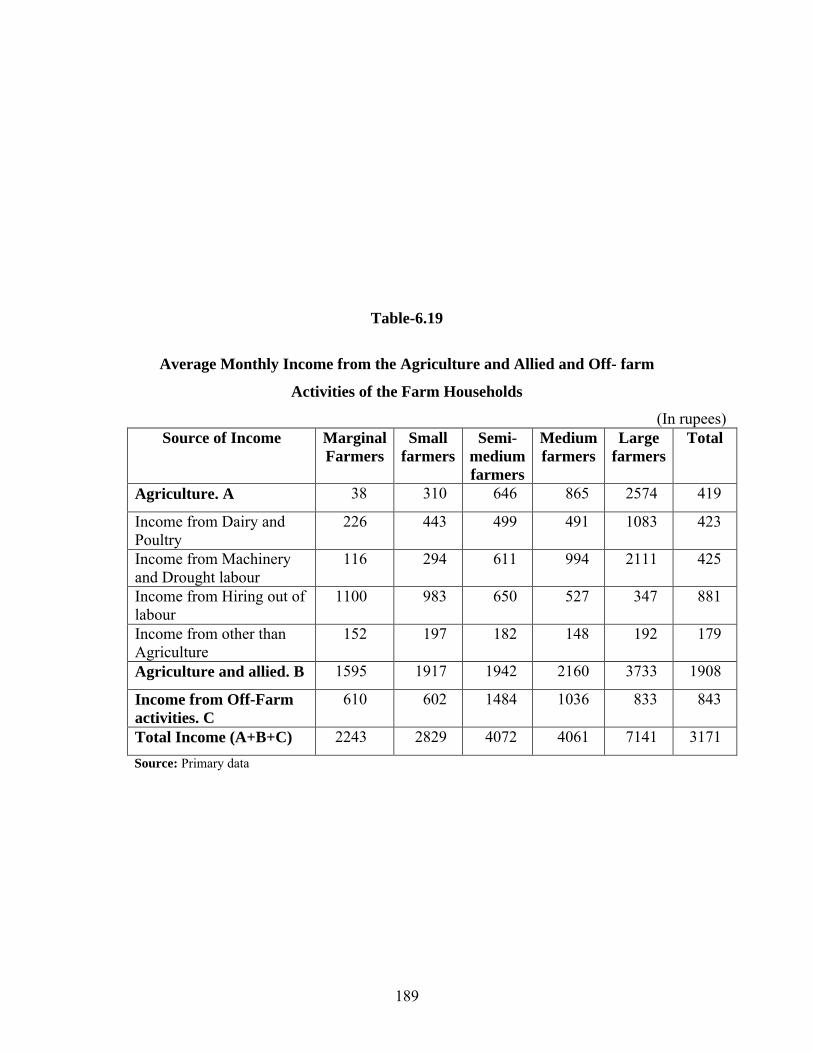
6.19 Average Monthly Income of the Respondents
The average total monthly income of the households across farm size
groups is presented in the table-6.19. The average monthly income is Rs. 3,171/-
(annual income of Rs.3,80,491/-). The table reveals that among the different
sources consider, income from the hiring out labour is the most important source
of income for farm household. In the study area, average monthly income from
cultivation is Rs.419/-, while the monthly income from the hiring out of labour is
Rs.881/- Income for farm household from hiring out machinery and drought
animals is Rs.425/-. Income generated from non-farm business is Rs. 843/- and
income from dairy and poultry is Rs. 423/-. However there is a large difference in
the total income across the size groups of farm households. The total income for
marginal and small farms was much lower than that for the other size groups.
Income from cultivation for marginal and small farm households is found to be
very low. The share of monthly income from cultivation in total income is much
lower among marginal, small and semi-medium farm households than that of the
other size groups. The above analysis clearly reveals that the income from
cultivation is not sufficient to meet all the basic necessities of the family. From
cultivation an average household gets a net income of Rs.419/- (on annual income
of Rs. 5031/-). In order to cross poverty line, one household needs more than Rs.
20000/-. Incomes of marginal and small farms from cultivation are found to be
much lower than that of the average farm household consumption accounting for
58 per cent and the remaining 27 per cent of the expenditure is spent on non-food
expenditure.
189
Table-6.19
Average Monthly Income from the Agriculture and Allied and Off- farm
Activities of the Farm Households
(In rupees)Source of Income Marginal
FarmersSmall
farmersSemi-
medium farmers
Medium farmers
Large farmers
Total
Agriculture. A 38 310 646 865 2574 419
Income from Dairy and Poultry
226 443 499 491 1083 423
Income from Machinery and Drought labour
116 294 611 994 2111 425
Income from Hiring out of labour
1100 983 650 527 347 881
Income from other than Agriculture
152 197 182 148 192 179
Agriculture and allied. B 1595 1917 1942 2160 3733 1908
Income from Off-Farm activities. C
610 602 1484 1036 833 843
Total Income (A+B+C) 2243 2829 4072 4061 7141 3171
Source: Primary data
190
Many of the households depend on wage and non-farm business to
augment their incomes even though incomes may not be sufficient to meet basic
necessities including health and education. The monthly average farmer
household expenditure is Rs. 5525/- the average monthly income of the farmer is
Rs.3171/- which indicates that the income received is not sufficient to meet the
minimum family needs.
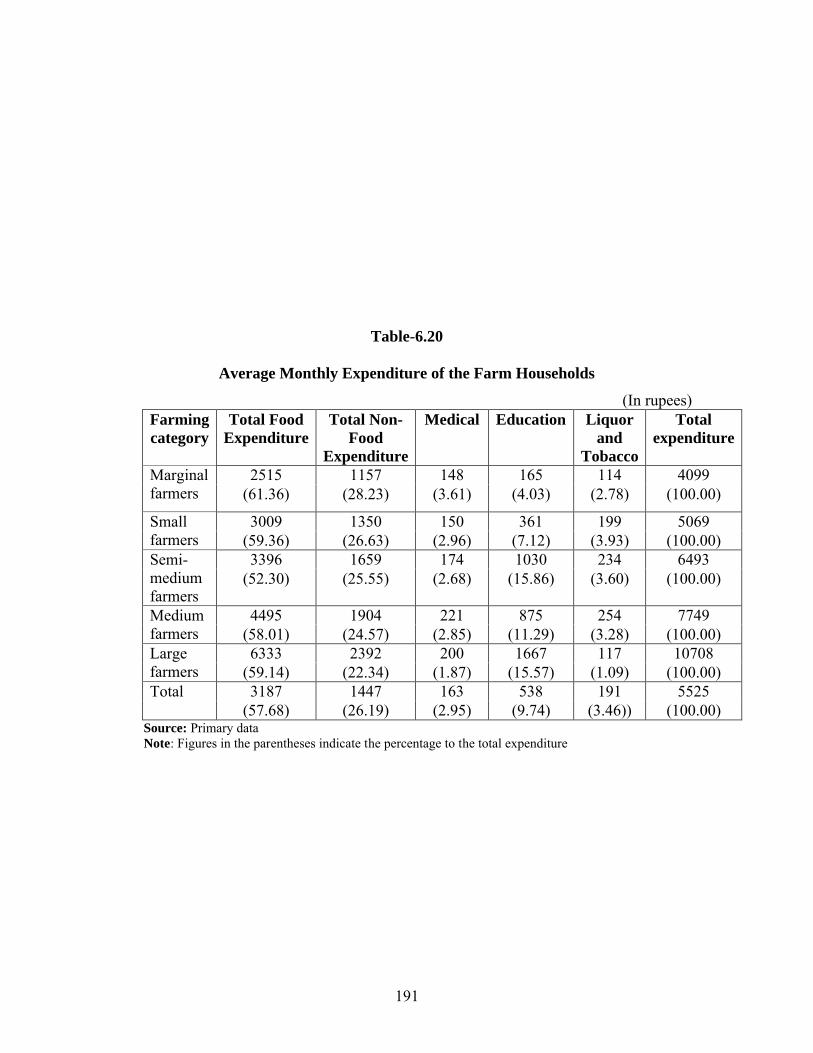
6.20 Average Monthly Household Expenditure
Income and proportion of income spent on consumption are indicators that
are used in poverty and consumption studies. The monthly consumption
expenditure here refers to food items like cereal and cereals products, pulses,
edible oil, milk, curd and other milk products, eggs, fish, meat, vegetables and
fruits, sugar, salt and other spices, and other food items. The non-food items like
education, medical, clothing’, soaps, detergents, toothpaste and other cosmetics,
electricity, liquor, pan and tobacco, fuel and lighting, telephone, consumer
durables, rent, and other miscellaneous goods and services. This is the
consumption expenditure which measures the standard of living. The average
consumption expenditure of different size groups are presented in the table-6.20.
Farmers find it difficult to meet their consumption needs from their income. Some
of them have to borrow or spend less time of flow returns from cultivation. The
consumption expenditure in cases of marginal and small farms is found to be
bellowing their income. In a normal crop year with no emergent expenses coming
in between, the small farmers should be in a position to save a little. The medium
farmers will normally have some surplus after meeting the family expenses. The
large farmers will be in a position to save a considerable part of the income. The
table shows that the large share of monthly per capita expenditure goes for food
consumption accounting for 58 per cent and the remaining 27 per cent of the
expenditure is spent on non-food expenditure.
191
Table-6.20
Average Monthly Expenditure of the Farm Households
(In rupees)Farming category
Total Food Expenditure
Total Non-Food
Expenditure
Medical Education Liquor and
Tobacco
Total expenditure
2515 1157 148 165 114 4099Marginal farmers (61.36) (28.23) (3.61) (4.03) (2.78) (100.00)
3009 1350 150 361 199 5069Small farmers (59.36) (26.63) (2.96) (7.12) (3.93) (100.00)
3396 1659 174 1030 234 6493Semi-medium farmers
(52.30) (25.55) (2.68) (15.86) (3.60) (100.00)
4495 1904 221 875 254 7749Medium farmers (58.01) (24.57) (2.85) (11.29) (3.28) (100.00)
6333 2392 200 1667 117 10708Large farmers (59.14) (22.34) (1.87) (15.57) (1.09) (100.00)
3187 1447 163 538 191 5525Total(57.68) (26.19) (2.95) (9.74) (3.46)) (100.00)
Source: Primary dataNote: Figures in the parentheses indicate the percentage to the total expenditure
192
The lions share of non- food expenditure is nearly 10 per cent which is
spent on education and 3.5 per cent expenditure is spent on liquor, pan and
tobacco and the remaining percentage of among is spent on medical expenses.
The expenditure on non food items has increased during recent years. This
expenditure on non-food expenditure is essential now-a-days. The expenditure on
medical and education purposes has become essential expenditure. Farm
households are found to be struggling hard to meet the consumption expenditure
out of cultivation. This leads to the conclusion that the monthly consumption
expenditure is greater than the monthly realized income and food taking the lion’s
share of expenditure. This is a greater probability for households to consuming
less than the recommended minimum nutrition intake levels. Though the monthly
per capita consumption expenditure is increasing with the size of the land
possessed, family size also found to be increasing with the size of the land
possessed. i.e., even large and medium farm households are consuming less than
the recommended minimum intake levels in the study area.
To sum up, the above analysis of the socio-economic dimensions of
dryland farmers reveal that socio-economic conditions of the farm households are
poor in the study area. The socio-economic structure does not have any direct
influence on the cultivation. From the analysis it is clearly evident that 47 per cent
of the farmers belong to backward caste, 39.67 per cent of farm households
belong to forward caste and 13.33 per cent are scheduled caste and scheduled
tribes communities.
The data on family system clearly reveals that 60 per cent of the families
are nuclear families. The average size of the family of the total farm households is
4.87. Among all farming categories the average family size of large farms is high,
which is ‘7.50, while the overall average size among the family is small for
marginal and small farms when compared with other farmers.
193
Distribution of farm households by the housing status across size groups
reveals that 55 per cent, 47 per cent, 32 per cent, 16.67 per cent of marginal,
small, semi-medium, medium and large farm households are living in katcha
houses. Thus the data on housing clearly indicates the poor living conditions of
farm households. The data on civic amenities reveals that 69.67 per cent of the
households are depending on public tap or public hand pumps for drinking water.
Only 15.33 per cent of the households have drainage facility. Nearly 70 per cent
of the dryland farmers do not have LPG gas. They depend on firewood for
cooking. The data further reveals that T.V and electric fan have become important
consumer goods.
The data on literacy reveals that 57 per cent of farm households are
illiterates which shows that the literacy rate is low when compared to overall state
rural population literacy, which is 47 per cent. The occupation structure of the
farm households reveals that for 94.34 per cent of farm households cultivation is
the main occupation. Nearly 66.33 per cent of farm households have agricultural
wage labour as the subsidiary occupation. Dryland farm households do not
possess large number of cattle due to the fact that livestock enterprise might not
be a variable often for them because they don’t get fodder throughout the year.
Thus there is direct relation between values of assets and farm size. Land as a
productive asset constitutes the major component of asset for dryland farmer.
The average size of the dryland farms in the study area is 5.37 acres.
Semi- medium, medium and large farms have leased in lands. The data on leased
in and leased out land reveals that tenancy is not present much in the study area.
The distribution of land among different social categories reveals that there is
close relation between farm size and social hierarchy.
194
It can also be said that this decline in cropped areas has occurred in order
to reduce the investment on crops as the financial status of the farm households in
the study areas is at stake due to drought conditions. It is also to be noted the
farmers have shifted their crops to sunflower, a low investment crops from
groundnut, chillies and cotton, which are high investment crops.
Nearly 75 per cent of farm households found to have access to bank credit.
Nearly 54 per cent of the farm households depend on non institutional sources
also to meet their total credit requirements. It is found that irrespective of the farm
size, the proportion of farm households borrowing from non institutional sources
is same. The institutional agencies are not able to meet the credit requirements of
the farmers. The farmers in the study area are borrowing loan from money lenders
or commission agents or input dealers at high interest rates.
The per acre loan borrowed is found to be increasing with the decreasing
farm size. The small and marginal farms need credit to meet their family
expenditure when they work in their farms. So per acre credit might be increasing
with decreasing in farm size. Indebtedness among farm households reveals that 80
per cent of farm households are reported to be indebted. Average outstanding debt
among marginal, small, semi-medium, medium and large farms are found to be
Rs 18,120/-, Rs. 35,650/-, Rs. 49,423/-, Rs. 59,567/- and Rs. 1,33,817/-
respectively. It leads to a situation that debt gets accumulated over the year. Thus
the debt brings out situation of debt trap among farm households. This clearly
reveals the stress conditions of households. It is observed that 72 per cent of farm
households have invested amount borrowed on productive purpose and 28 per
cent of them have invested on unproductive purpose. The data clearly reveals the
indebtedness among farm households due to unproductive consumption like
social ceremonies, marriages and other religious ceremonies.
195
The above analysis clearly reveals that the income from cultivation is not
sufficient to meet all the basic necessities of the families. From cultivation an
average household gets a net income of Rs.419/- (an annual income of Rs. 5,031).
One household needs more than Rs. 20,000/- in order to cross poverty line.
Incomes of marginal and small farms from cultivation are found to be much lower
than the average income of farm household. Many of the households depend on
wage and non-farm business to augment their incomes. Even these incomes may
not be sufficient to meet basic necessities including health and education. While
the monthly average farmer household expenditure is Rs. 5,525/- the average
monthly farmer income is Rs.3,171/- which indicates that the income reveals that
the income received is not sufficient to meet the minimum family needs; that the
monthly consumption expenditure is greater than the monthly realized income and
food taking the lion’s share of expenditure. This is a greater probability for
households to consuming less than the recommended minimum nutrition intake
levels. Though the monthly per capita consumption expenditure is increasing with
the size of the land possessed family size also found to be increasing with the size
of the land possessed. i.e., even large and medium farm households consuming
less than the recommended minimum intake levels in the study area.