Embed Size (px)
Citation preview
CHAPTER -VI
PROBLEMS OF NASHIK CITY
CHAPTER -VI
PROBLEMS OF NASHIK CITY
6.1 INTRODUCTION
6.2 HOUSING PROBLEM
188
6.2.1 INTRODUCTION
6.2.2 GROWTH OF RESIDENTIAL HOUSES
6.2.3 SECTORWISE HOUSING PATTERN
6.2.4 STRUCTURE AND LIVING CONDITION
6.3 CITY BUS TRANSPORATION
6.3.1 INTRODUCTION
6.3.2 GROWTH OF CITY BUSES AND PASSENGERS
6.3.3 IMPORTANT CITY BUS ROUTES
6.3.4 PROBLEMS OF CITY BUS TRANSPORTATION
6.4 WATER SUPPLY
6.4.1 INTRODUCTION
6.4.2 EXISTING WATER SUPPLY SYSTEM
6.4.3 GROWTH OF WATER SUPPLY
6.4.4 DISTRIBUTION OF WATER SUPPLY
6.4.5 QUALITY OF WATER
6.5 PROBLEM OF POPULATION
6.5.1 INTRODUCTION
6.5.2 WATER POLLUTION
6.5.3 AIR POLLUTION
6.5.4 NOISE POLLUTION
6.5.5 SOLID WASTE POLLUTION
6.6 HEALTH PROBLEM
6.6.1 INTRODUCTION 6.6.2HEALTH CARE FACILITIES
CHAPTER - VI
PROBLEMS OF NASHIK CITY
6.1 INTRODUCTION:
We, today, live in a built environment which suffers from the spatial side-
effects of technological overdose that has been administrated in hurry. The faceless
189
uninspiring architecture, blood pressure increasing traffic conditions, lungs hollowing
pollution, social interaction discouraging housing areas tension creating psychos cape,
crime, corruption prone city sphere the filth clogged wings of birds the oxygen
gasping creature are some of the consequences of the indiscriminate technology
application in pursuit of short term economic goals to attend civilization which we
call cities. Some the key urban problems that are worldwide in their character and
severity basically due to both expansion of population and physical expansion of the
cities.1
The developing world’s cities have their characteristic problems. The
explosive increase in population, gross inadequacy of infrastructural facilities and
services, overcrowding and traffic jams, ribbon development, crumbling old city
centers, urban blight, neighborhood degradation, expansion of slums and spontaneous
settlements, insanitary backyards and public places etc., culminating in an urban
crisis, are characteristics of the cities of developing countries.2
In this chapter the major urban problems, of Nashik city has been studied such
as housing, city bus transportation, water supply, pollution and health.
6.2 HOUSING PROBLEM:
6.2.1 INTRODUCTION:
Housing is one of the three basic needs of mankind. The modern concept of
housing is the home in which all the basic needs of a family are fulfilled. At present
there is acute shortage of houses in urban areas and much of the available
accommodation is qualitatively of sub standard type. Due to unplanned
industrialization, the problem of housing has become grave in urban area. This is due
to the excessive rural-urban migration, and natural growth of population. Although the
population is growing fast but the houses are not built in same proportion. As a result
there is a grave housing problem in urban areas. According to 1991 census the
shortage of houses in urban areas is about 40 million in India.3
6.2.2 GROWTH OF RESIDENTIAL HOUSES:
Shortage of housing accommodation is chronic disease of the city. It is a
global problem and like Nashik city, every city has been facing this problem. Nashik
city is expanding in its population day by day but it has created problem of houses
because it is difficult to provide houses to such a large population. It is observed from
the Table VI-I that there were 20,630 numbers of houses in 1971. The numbers of
190
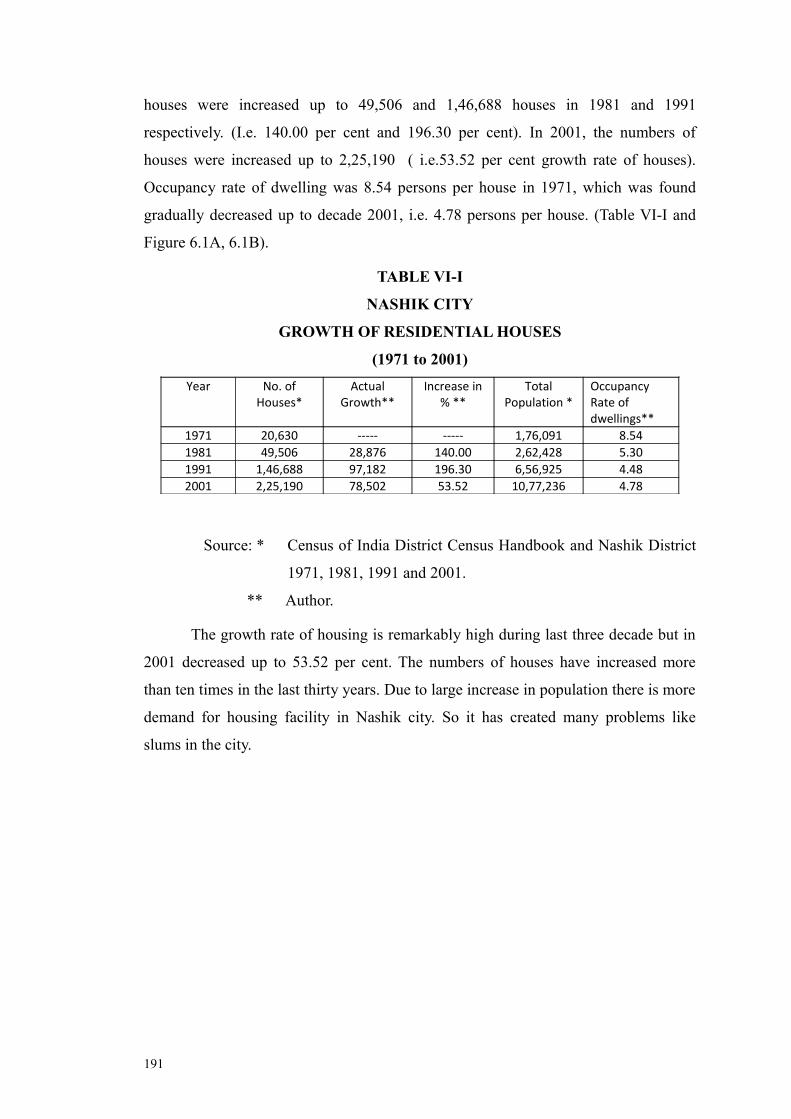
houses were increased up to 49,506 and 1,46,688 houses in 1981 and 1991
respectively. (I.e. 140.00 per cent and 196.30 per cent). In 2001, the numbers of
houses were increased up to 2,25,190 ( i.e.53.52 per cent growth rate of houses).
Occupancy rate of dwelling was 8.54 persons per house in 1971, which was found
gradually decreased up to decade 2001, i.e. 4.78 persons per house. (Table VI-I and
Figure 6.1A, 6.1B).
TABLE VI-I
NASHIK CITY
GROWTH OF RESIDENTIAL HOUSES
(1971 to 2001)
Year No. of Houses*
ActualGrowth**
Increase in % **
TotalPopulation *
OccupancyRate of dwellings**
1971 20,630 ----- ----- 1,76,091 8.541981 49,506 28,876 140.00 2,62,428 5.301991 1,46,688 97,182 196.30 6,56,925 4.482001 2,25,190 78,502 53.52 10,77,236 4.78
Source: * Census of India District Census Handbook and Nashik District
1971, 1981, 1991 and 2001.
** Author.
The growth rate of housing is remarkably high during last three decade but in
2001 decreased up to 53.52 per cent. The numbers of houses have increased more
than ten times in the last thirty years. Due to large increase in population there is more
demand for housing facility in Nashik city. So it has created many problems like
slums in the city.
191
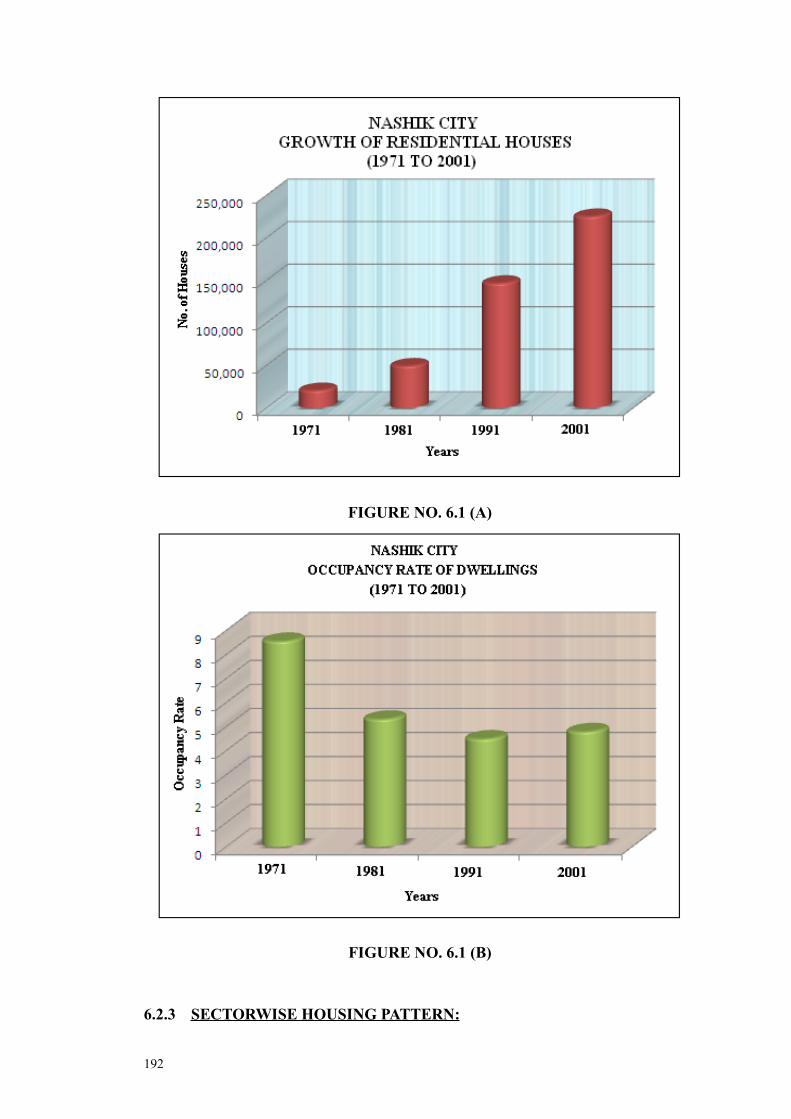
FIGURE NO. 6.1 (A)
FIGURE NO. 6.1 (B)
6.2.3 SECTORWISE HOUSING PATTERN:
192
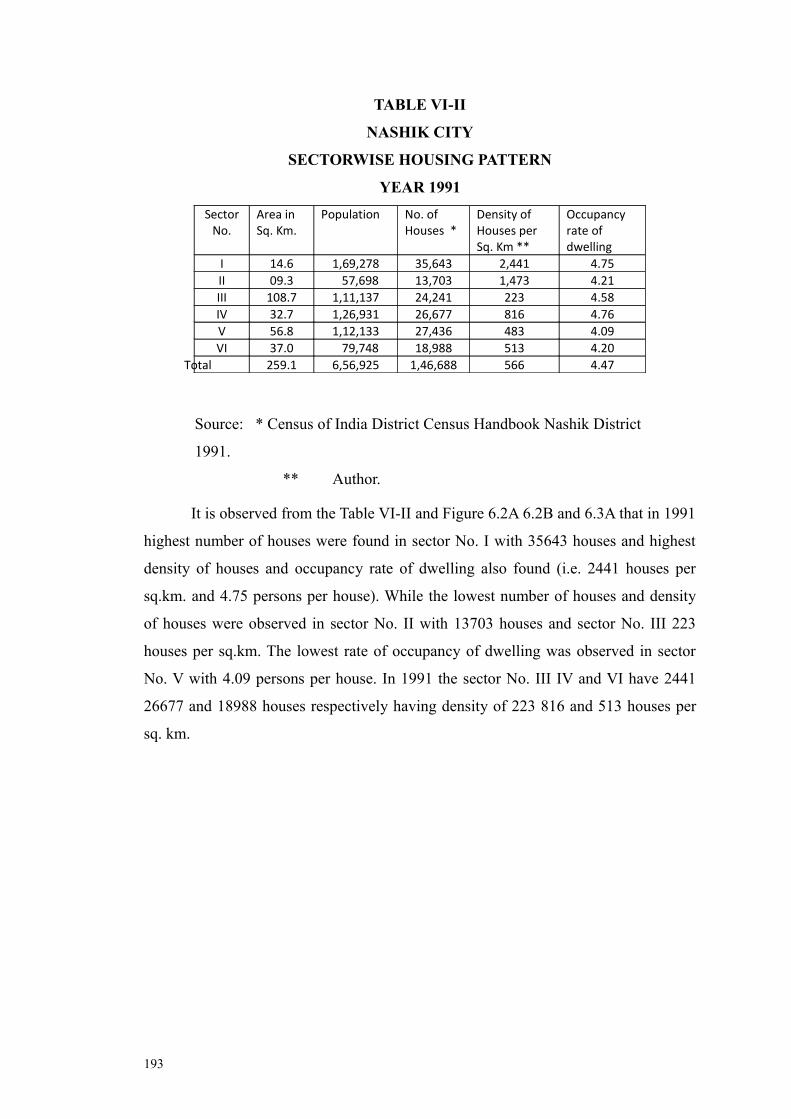
TABLE VI-II
NASHIK CITY
SECTORWISE HOUSING PATTERN
YEAR 1991
Sector No.
Area in Sq. Km.
Population No. of Houses *
Density of Houses per Sq. Km **
Occupancy rate of dwelling
I 14.6 1,69,278 35,643 2,441 4.75II 09.3 57,698 13,703 1,473 4.21III 108.7 1,11,137 24,241 223 4.58IV 32.7 1,26,931 26,677 816 4.76V 56.8 1,12,133 27,436 483 4.09VI 37.0 79,748 18,988 513 4.20
Total 259.1 6,56,925 1,46,688 566 4.47
Source: * Census of India District Census Handbook Nashik District
1991.
** Author.
It is observed from the Table VI-II and Figure 6.2A 6.2B and 6.3A that in 1991
highest number of houses were found in sector No. I with 35643 houses and highest
density of houses and occupancy rate of dwelling also found (i.e. 2441 houses per
sq.km. and 4.75 persons per house). While the lowest number of houses and density
of houses were observed in sector No. II with 13703 houses and sector No. III 223
houses per sq.km. The lowest rate of occupancy of dwelling was observed in sector
No. V with 4.09 persons per house. In 1991 the sector No. III IV and VI have 2441
26677 and 18988 houses respectively having density of 223 816 and 513 houses per
sq. km.
193
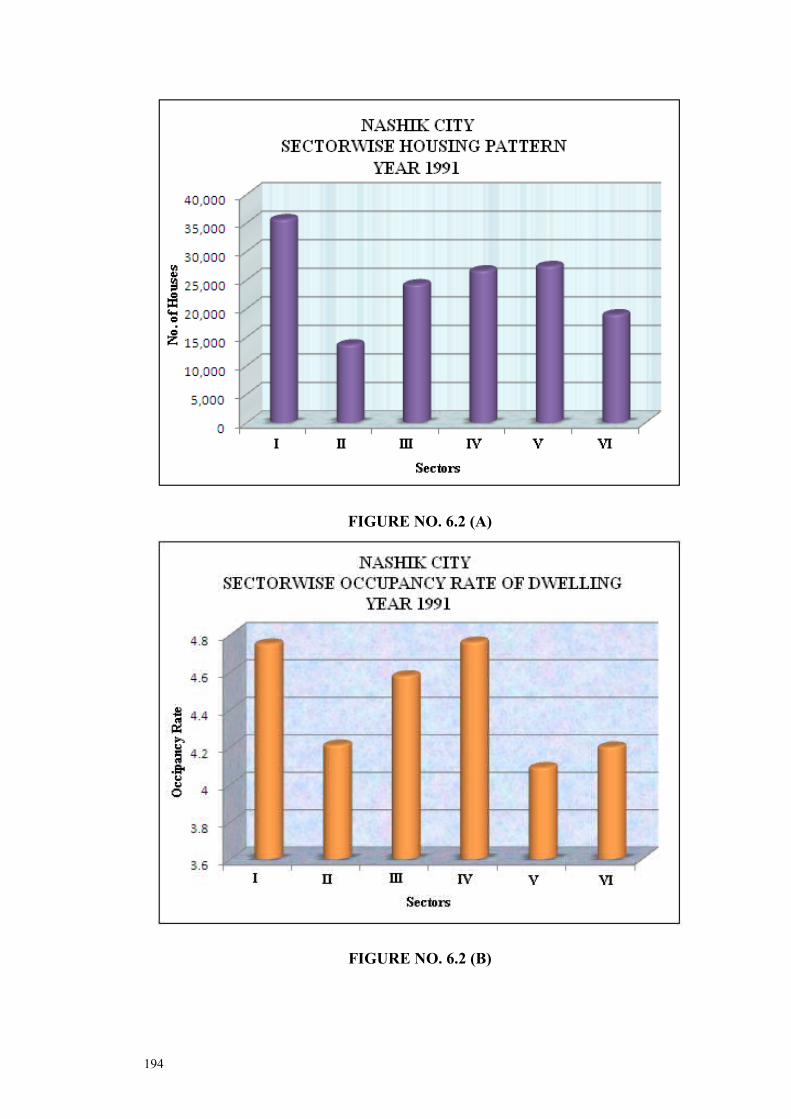
FIGURE NO. 6.2 (A)
FIGURE NO. 6.2 (B)
194

FIGURE NO. 6.3
TABLE VI-III
NASHIK CITY
SECTORWISE HOUSING PATTERN
YEAR 2001
195
Sector No.
Area in Sq. Km.
Population No. of Houses *
Density of Houses per Sq. Km **
Occupancy rate of dwelling
I 14.6 1,65,423 32,874 2,252 5.03II 09.3 1,23,481 25,685 2,762 4.81III 108.7 2,14,950 42,719 393 5.03IV 32.7 1,90,326 37,688 1,153 5.05V 56.8 2,14,256 48,497 854 4.42VI 37.0 1,68,800 37,727 1,020 4.47
Total 259.1 10,77,236 2,25,190 869 4.78
Source: * Census of India District Census Handbook Nashik District 2001
** Author.
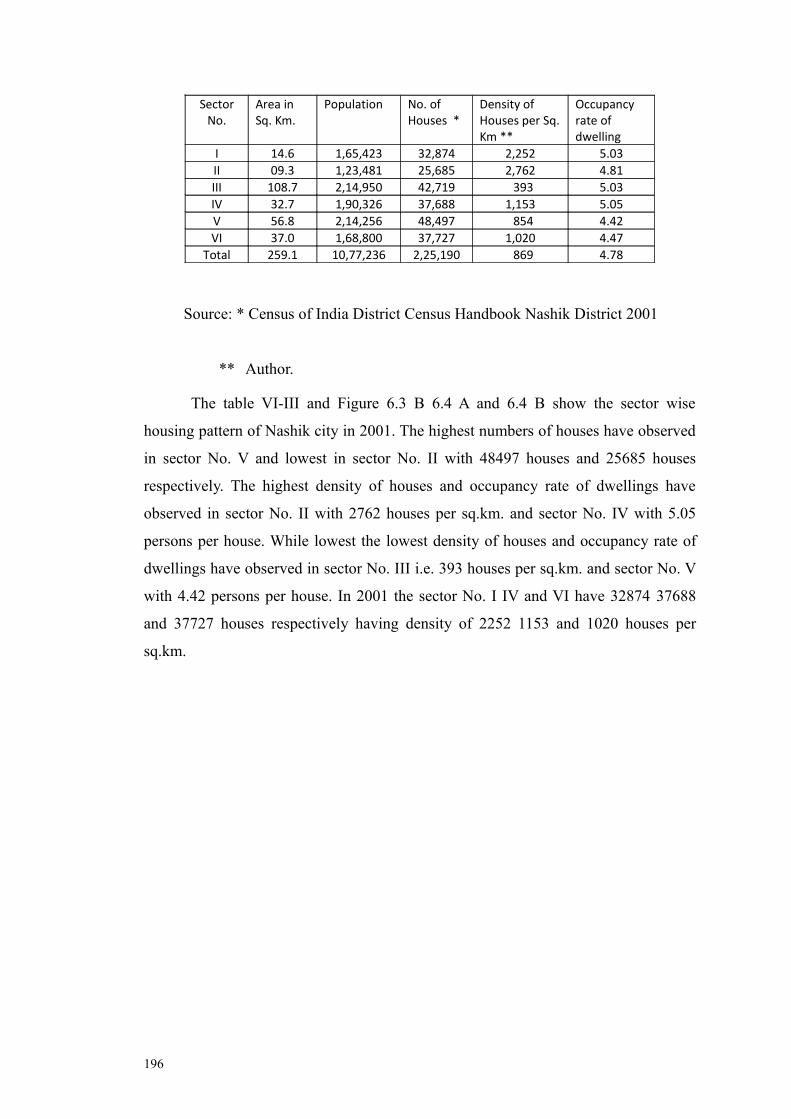
The table VI-III and Figure 6.3 B 6.4 A and 6.4 B show the sector wise
housing pattern of Nashik city in 2001. The highest numbers of houses have observed
in sector No. V and lowest in sector No. II with 48497 houses and 25685 houses
respectively. The highest density of houses and occupancy rate of dwellings have
observed in sector No. II with 2762 houses per sq.km. and sector No. IV with 5.05
persons per house. While lowest the lowest density of houses and occupancy rate of
dwellings have observed in sector No. III i.e. 393 houses per sq.km. and sector No. V
with 4.42 persons per house. In 2001 the sector No. I IV and VI have 32874 37688
and 37727 houses respectively having density of 2252 1153 and 1020 houses per
sq.km.
196
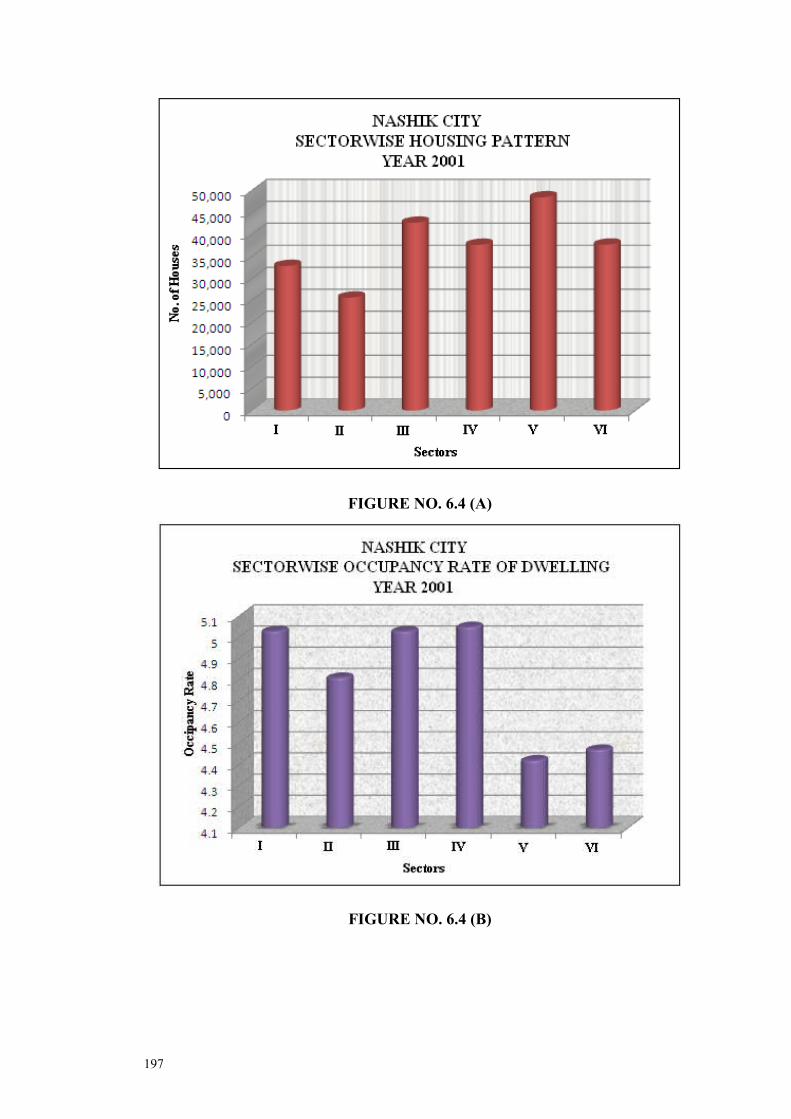
FIGURE NO. 6.4 (A)
FIGURE NO. 6.4 (B)
197
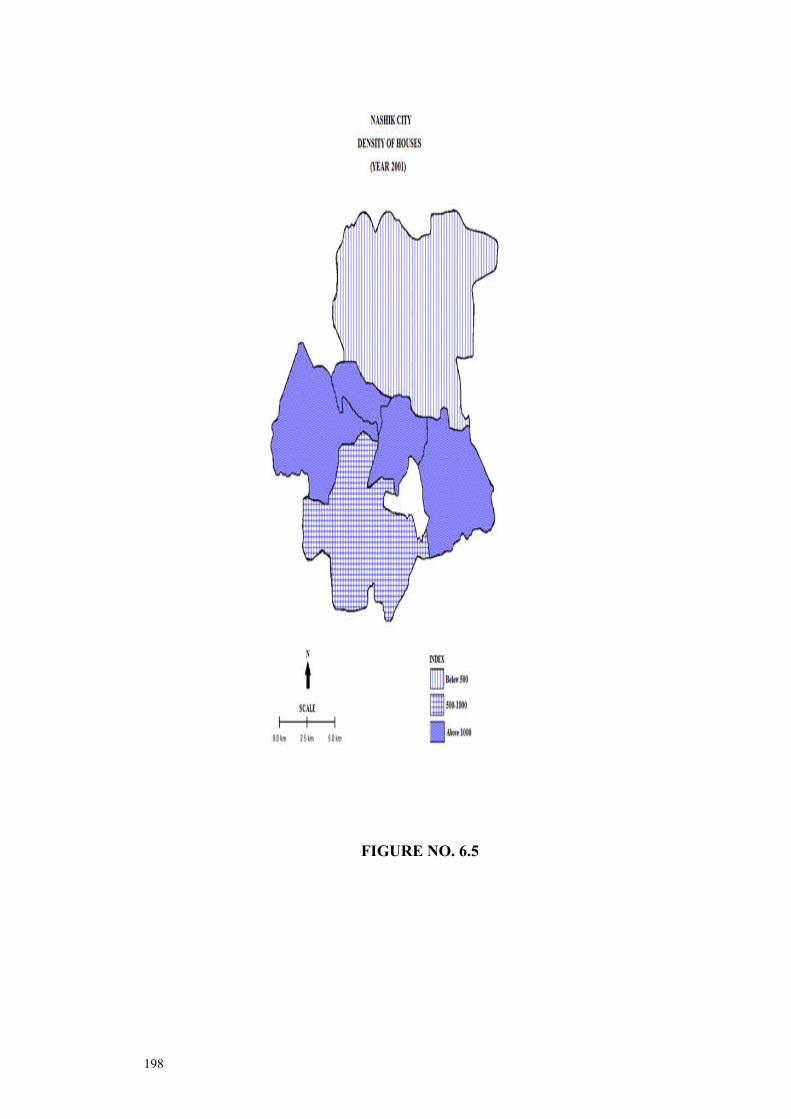
FIGURE NO. 6.5
198
6.2.4 STRUCTURE AND LIVING CONDITION:
The study of living conditions in any city is based on the ownership and
dwelling units the housing structure and the average number of dwelling per units.4 As
the collection of data of the entire city is not possible so the sample data has been
collected through field work. The study region has been divided into three groups:
i) Core area
ii) Extended area
iii) Gaonthans
The core area shows distinct feature like high housing density and old
structure of the houses. Generally houses are built up of mud stones and bricks some
times demolishing the old structures and developed huge apartments with ownership
flats. So all type of houses both old and modern found in the sector No. III which is
the core area of Nashik city.
The extended area of Nashik city includes Gangapur road, Nashik road, Cidco,
Satpur, Dwarka, Pathardi road, Peth road, Dindori road, Makhamalabad road, Adgaon,
Hirawadi, Khate Gali, Upnagar, Wadala road, Indira Nagar and Jail road etc.
Mahatma Nagar, Model Colony, College road and Gangapur road have
occupied by the rich class of society while middle class of society occupied remaining
part of extended area. Most of the house structures in extended area are modern type
of R.C.C. construction with burnt brick walls plastered with cement.
The houses in gaothan of Chadegaon, Chehadi, Devlaligaon, Panchak,
Vihitgaon, Vadner, Pimpalgaon Khamb, Pathardi, Chunchale, Pimpalgaon Bhuhulla,
Gangapur, Anadwali, Makhamalabad and Mhasrul are very old type construction with
poor structural conditions and also with lack of public amenities.
It is observed that the trend of residential development is mostly around the
Chadegaon, Chehadi, Devlaligaon, Panchak, Vihitgaon, Vadner, Pimpalgaon Khamb,
Pathardi, Cunchale, Pimpalgaon Bhuhulla, Gangapur, Anadwali, Makhamalabad and
Mhasrul. Most of the lands have been laid out into plots; however all the plots have
not yet been built-up. These are in process of development. The residential
development takes place along with the main traffic routes the interior lands are
however in undeveloped stage for want of necessary infrastructure facilities and some
lands are good agricultural land.
199
6.3 CITY BUS TRANSPORTATION:
6.3.1 INTRODUCTION:
An efficient pattern of circulation is an important requirement of the urban
communities for its proper functioning circulation network links of different parts of
the city together and keeps the entire urban community into one compact unit.5 A
rapid increase in population and the urban sprawl necessitate an efficient movement
of the people within the urban areas. The transport system is so indispensable that the
urban system will break down if it breaks down.
The inefficiency of public transport is a curse particularly for the poor strata of
society because the high cost of inefficiency might place the poorest sections out of
the system and those who use the system are made to pay through their nose. Further
the inefficiency of the public transport system many a time compels commuters to
incur additional expenditure on hired vehicles.6
In Nashik city Maharashtra State Road Transport Corporation (MSRTC) runs
the buses for city commuters. This city bus service started in 1979 with 25 buses. The
city buses serve the area from Nimani to CBS. There are 346 city bus routes in
operation with 1330 crew members operating them. The route from Nimani bus stop
to Nashik road Railway Station a distance of 12 to 13 Kms has the maximum
frequency of buses. Maximum length of city bus is 32 km from Nimani to Sukhane.
The capacity of each bus is forty five passengers with forty five seats and ten
standings.
However the bus services offered inadequate to cater to the volume of the
existing intra city travel demand. It has to run the services covering the growth centers
and not only within municipal limits. Bus services have operated from Nashik city
viewed in terms of the frequency accessibility coverage; comfort etc. the level of
service is far from being a city service. In fact it would appear that MSRTC have
hardly any desire to operate a full-fledged city bus service in Nashik city.
200
6.3.2 GROWTH OF CITY BUSES AND PASSENGERS:
TABLE VI-IV
NASHIK CITY
NUMBER OF BUSES ROUTES AND PASSENGERS
Sr. No.
Year Total Buses
Growth in % **
No of Total
Routes *
No. of Passengers *
Growth in Passenger
(%)
1 1995-96 130 -- 285 1,17,892 --2 2000-01 145 11.54 305 1,23,847 05.053 2005-06 185 27.59 346 1,40,393 13.364 2010-11 190 02.70 376 1,55,378 10.67
Source: ** MSRTS Office Record
* Author.
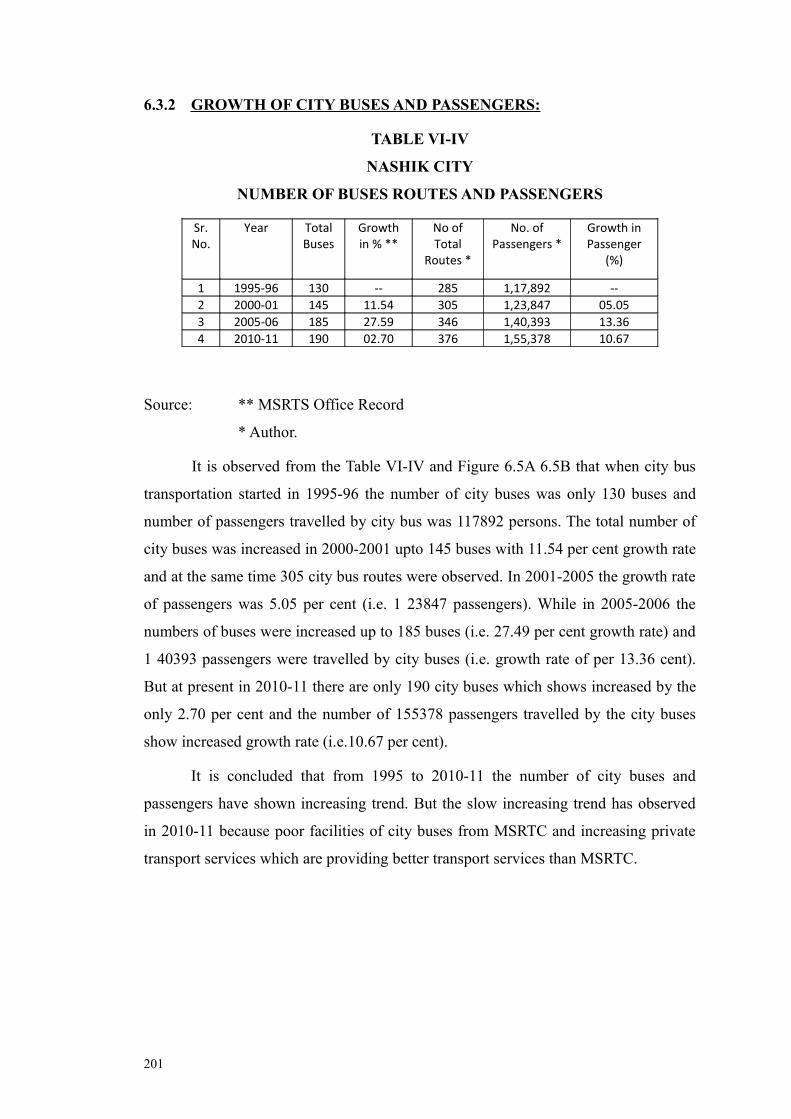
It is observed from the Table VI-IV and Figure 6.5A 6.5B that when city bus
transportation started in 1995-96 the number of city buses was only 130 buses and
number of passengers travelled by city bus was 117892 persons. The total number of
city buses was increased in 2000-2001 upto 145 buses with 11.54 per cent growth rate
and at the same time 305 city bus routes were observed. In 2001-2005 the growth rate
of passengers was 5.05 per cent (i.e. 1 23847 passengers). While in 2005-2006 the
numbers of buses were increased up to 185 buses (i.e. 27.49 per cent growth rate) and
1 40393 passengers were travelled by city buses (i.e. growth rate of per 13.36 cent).
But at present in 2010-11 there are only 190 city buses which shows increased by the
only 2.70 per cent and the number of 155378 passengers travelled by the city buses
show increased growth rate (i.e.10.67 per cent).
It is concluded that from 1995 to 2010-11 the number of city buses and
passengers have shown increasing trend. But the slow increasing trend has observed
in 2010-11 because poor facilities of city buses from MSRTC and increasing private
transport services which are providing better transport services than MSRTC.
201
FIGURE NO. 6.6 (A)
FIGURE NO. 6.6 (B)
6.3.3 IMPORTANT CITY BUS ROUTES:
202
The city bus transportation of Nashik city is controlled by the Six major
terminal points and majority of these terminals are surrounded City. The major
terminal points are Nashik Road Railway Station Nimani Bhagur Deolali Camp
Satpur and Melabus Stand. These are Nimani and Panchavati in the heart of city from
which all city buses are operated in different areas of city.
TABLE VI-V
NASHIK CITY
TERMINAL POINTS AND TRIPS OF CITY BUSES
(Trips From Bus-stand)
(YEAR 2011)
Sr. No.
Terminal Points Total No. of Trips Per day
% to Total
1 Nashik Road 1,240 28.992 Nimani 856 20.013 Bhagur 685 16.014 Satpur 599 14.005 Deolali Camp 513 11.996 Mahamarg Bus Stand 385 09.00
Total 4,278 100
Source: MSRTC Office Record.
It is observed from Table VI-V and Figure 6.6 that the per day total number of
city bus trips are 4278. Out of which 28.99 per cent city bus trips are operated to
Nashik road which is the highest percentage of trips. Except these Nimani (20.01
percent) Bhagur (16.01 per cent) Satpur (14.00 per cent) Deolali Camp (11.99 per
cent) and Melabus Stand (09.00 per cent) are the major terminal points of city buses
in Nashik city.
203
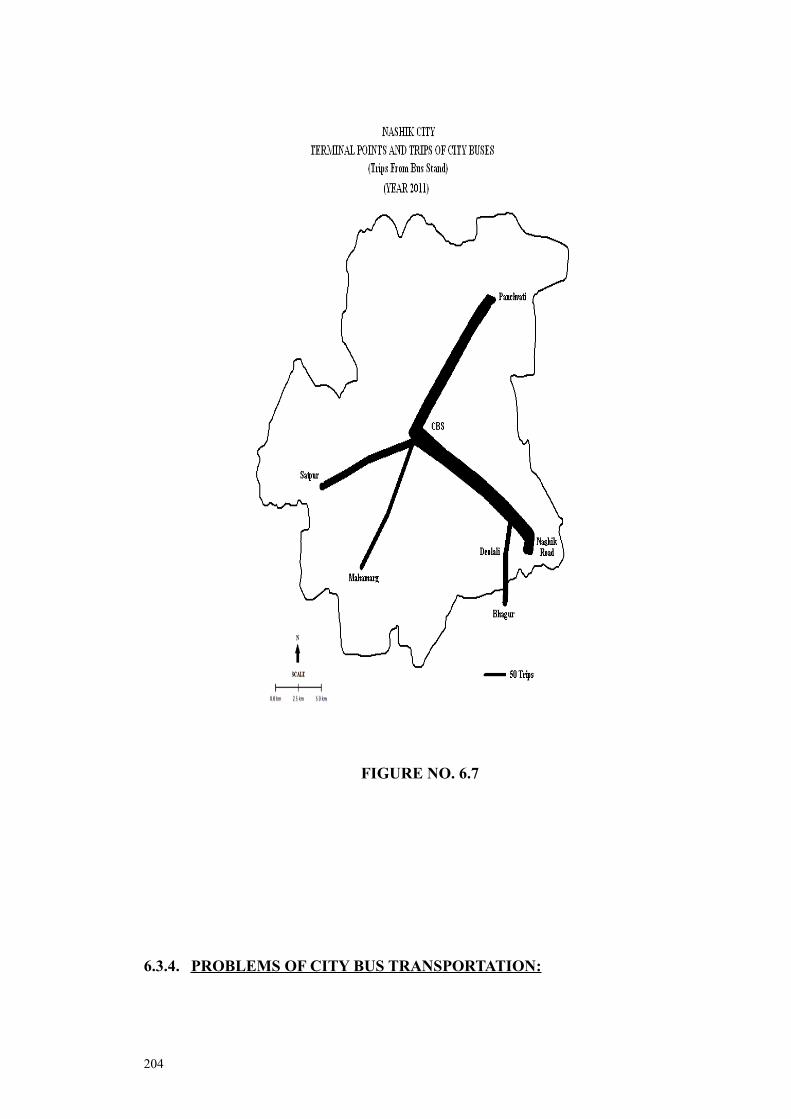
FIGURE NO. 6.7
6.3.4. PROBLEMS OF CITY BUS TRANSPORTATION:
204
It is observed that MSRTC is covering a route length of total 42,000 km. a day
with its 190 poorly maintained buses on 376 skeleton routes. The buses have a high
operating cost and poor patronage with heavily subsidized for structure. This results
in present loss of 5.28 paisa per bus per km. At the same time the decline in the
passenger share can be attributed to inadequate frequency unreliable schedules and
uncomfortable journeys.7 The study has two important observations. One the current
bus operation is not financially sustainable for the present operator. Second city bus
service is neither the core competency of MSRTC nor the operator has the necessary
to have a more meaningful bus service. The situation is further exacerbated by very
poor financial health of MSRTC itself with the Government of Maharashtra having
already taken the policy decision to dis-invest the same if the situation does not
improve. In view of aforesaid the days are not very far off if the city suddenly finds
itself without any urban bus transport system.
TABLE VI-VI
NASHIK CITY
OPERATING CHARACTERISTICS OF CITY BUS SERVICE (YEAR 2011)
Sr. No. Description Value1 Number of Routes Served 3762 Cost of operation per km 34.513 Earning per km 29.234 Load Factor 68.125 Vehicle Utilization 225.23km/day6 Maximum Number of Passenger Carried
Daily1,40,000
7 Average Daily Kms of Running 225km8 Daily Firebox Collection 12,00,0009 Staff Bus Ratio 6.43
Source: MSRTC Records.
The Table VI-VI gives some of the critical operational statistics of existing bus
operations by MSRTC in the city. Table also shows the present loss of 4.28 paisa per
bus per km. The vehicle operating cost forms a vital component of the transportation
cost. It is sum total of both the fixed (such as capital cost registration fees taxes etc.)
and variable cost (such as cost of fuel oils spare parts etc.).
TABLE VI-VII
NASHIK CITY
COMMUTERS AND MODE OF TRANSPORT (YEAR 2011)
205
Sr. No.
Mode of transport % Share of Passengers
1 City Bus 20.082 Auto rickshaw 28.203 Pedestrians 09.604 Bicycles 05.905 Two Wheelers 25.096 Four Wheelers 09.60
Total 100
Source: Comprehensive Traffic and Transportation study of Nashik City -
Tata Consultancy Service Mumbai.
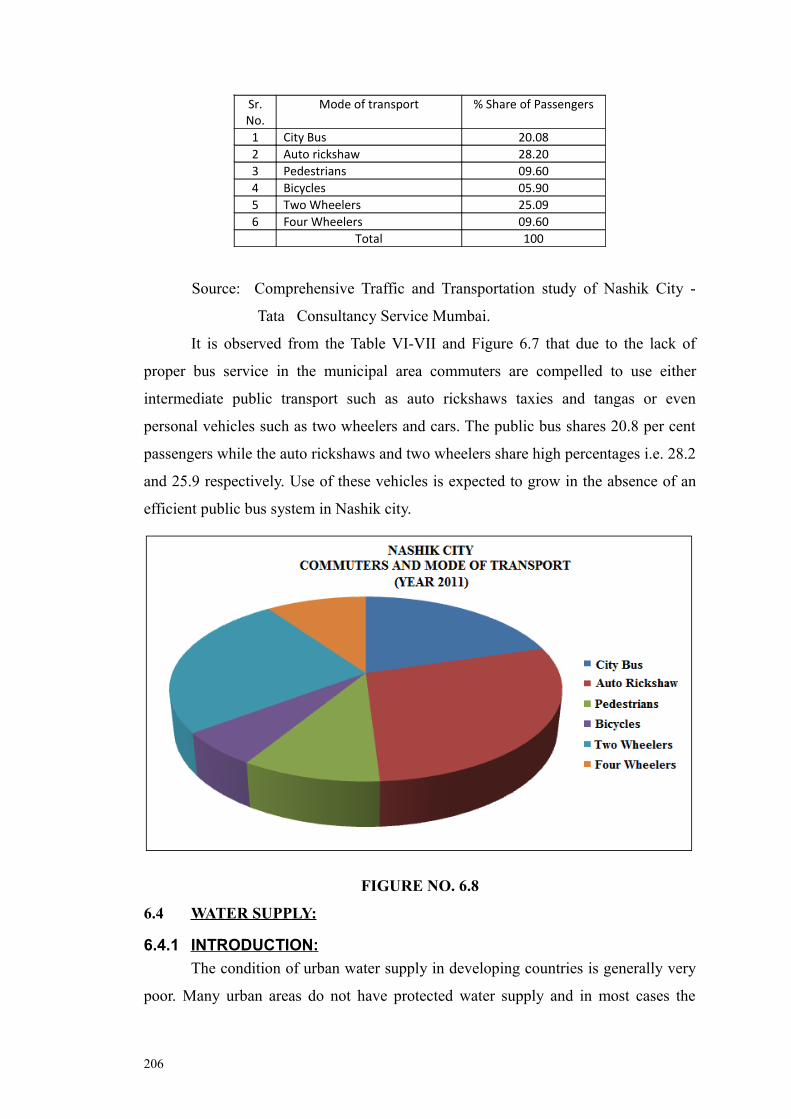
It is observed from the Table VI-VII and Figure 6.7 that due to the lack of
proper bus service in the municipal area commuters are compelled to use either
intermediate public transport such as auto rickshaws taxies and tangas or even
personal vehicles such as two wheelers and cars. The public bus shares 20.8 per cent
passengers while the auto rickshaws and two wheelers share high percentages i.e. 28.2
and 25.9 respectively. Use of these vehicles is expected to grow in the absence of an
efficient public bus system in Nashik city.
FIGURE NO. 6.8
6.4 WATER SUPPLY:
6.4.1 INTRODUCTION: The condition of urban water supply in developing countries is generally very
poor. Many urban areas do not have protected water supply and in most cases the
206
supply is quite inadequate. The provision of safe and adequate water supply for the
ever increasing population and hygienic disposal of wastes is a basic necessity for the
healthy living of the urban community. The urgency for water supply and sanitation
measures assume special importance in a tropical country like India which is subject
of periodic wars with water and filth borne diseases viz. cholera dysentery typhoid
and gastro-enteric fevers. An organized water supply system also provides an
opportunity for speedy removal of human excrete and other offensive wastes through
water flushed sewers. Unfortunately in the sub-continent of India no one cares to
discuss the methods as fecal disposal.8
Nashik city comes under the semi-arid region of Maharashtra where the water
scarcity problem and drinking water problem carries major importance throughout the
year. So it is necessary to proper study of water supply system and related problems
for the proper planning of available water.
6.4.2 EXISTING WATER SUPPLY SYSTEM: Godavari River flows through Nashik City. As far city water supply is
concerned city is traditionally dependent on Godavari River. In 1954 Gangapur dam
was constructed. It had a total storage of 7200 mcft. Over a period the storage has
been reduced to 5630 mcft. There is a reservation of water in the dam to the extent of
only 1194 mcft. Dam water further reserved for MIDC in Nashik and Eklahara
thermal power station situated in Nashik. Considering all these reservations of water
for non irrigation purposes there is very less water available for irrigation. Over a
period right bank canal has fully stopped the irrigation. For making up part irrigation
dam is being replenished through upstream dams. One other source is from Darna
dam which is about 28 km from Nashik city is dam was constructed in the year 1934
with storage capacity of 7149 mcft. Presently NMC is having reservation of 350 mcft.
in this storage. The NMC is constructing one weir with gets on river Darna near
village Chehedi with storage capacity of 144 mcft. From the following tables it can be
revealed that Corporation drinking water demand inconstantly increasing. Present
developed capacity is now becoming inadequate. For future population of 2031 the
full capacity remains nearly half the required capacity. For 2021 demand new source
along with upstream dams will become obligatory. In the later stage however
additional source can be thought of. At present Phase-I work is considered for year
2016.As per CPHEEO manual the design period after the completion of the
components should be as follows –
207
Item n Period
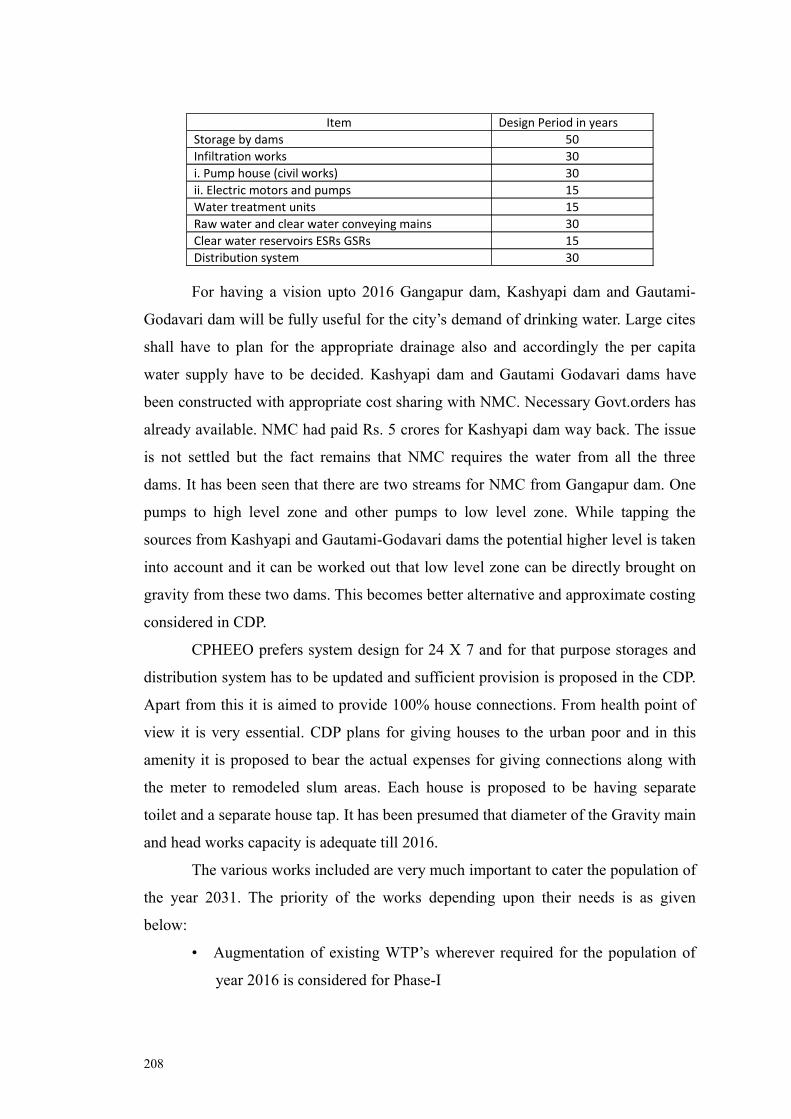
Item Design Period in yearsStorage by dams 50Infiltration works 30i. Pump house (civil works) 30ii. Electric motors and pumps 15Water treatment units 15Raw water and clear water conveying mains 30Clear water reservoirs ESRs GSRs 15Distribution system 30
For having a vision upto 2016 Gangapur dam, Kashyapi dam and Gautami-
Godavari dam will be fully useful for the city’s demand of drinking water. Large cites
shall have to plan for the appropriate drainage also and accordingly the per capita
water supply have to be decided. Kashyapi dam and Gautami Godavari dams have
been constructed with appropriate cost sharing with NMC. Necessary Govt.orders has
already available. NMC had paid Rs. 5 crores for Kashyapi dam way back. The issue
is not settled but the fact remains that NMC requires the water from all the three
dams. It has been seen that there are two streams for NMC from Gangapur dam. One
pumps to high level zone and other pumps to low level zone. While tapping the
sources from Kashyapi and Gautami-Godavari dams the potential higher level is taken
into account and it can be worked out that low level zone can be directly brought on
gravity from these two dams. This becomes better alternative and approximate costing
considered in CDP.
CPHEEO prefers system design for 24 X 7 and for that purpose storages and
distribution system has to be updated and sufficient provision is proposed in the CDP.
Apart from this it is aimed to provide 100% house connections. From health point of
view it is very essential. CDP plans for giving houses to the urban poor and in this
amenity it is proposed to bear the actual expenses for giving connections along with
the meter to remodeled slum areas. Each house is proposed to be having separate
toilet and a separate house tap. It has been presumed that diameter of the Gravity main
and head works capacity is adequate till 2016.
The various works included are very much important to cater the population of
the year 2031. The priority of the works depending upon their needs is as given
below:
• Augmentation of existing WTP’s wherever required for the population of
year 2016 is considered for Phase-I
208
• Simultaneously storage capacity is to be added accordingly to cater the
increasing demand.
• The distribution network is to be strengthened wherever new areas are
developed.
• New sources of water for drinking purpose need to be identified and
developed as the present sources will be inadequate in the future for the
rising population.9
6.4.3 GROWTH OF WATER SUPPLY:
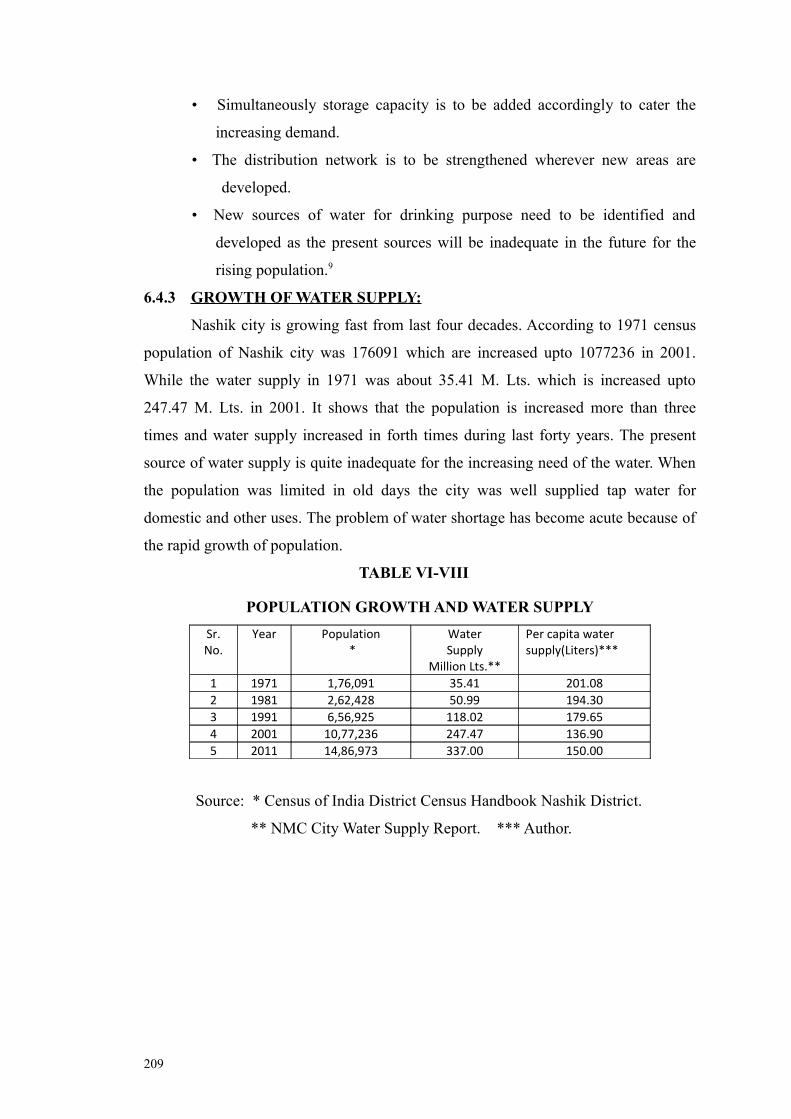
Nashik city is growing fast from last four decades. According to 1971 census
population of Nashik city was 176091 which are increased upto 1077236 in 2001.
While the water supply in 1971 was about 35.41 M. Lts. which is increased upto
247.47 M. Lts. in 2001. It shows that the population is increased more than three
times and water supply increased in forth times during last forty years. The present
source of water supply is quite inadequate for the increasing need of the water. When
the population was limited in old days the city was well supplied tap water for
domestic and other uses. The problem of water shortage has become acute because of
the rapid growth of population.
TABLE VI-VIII
POPULATION GROWTH AND WATER SUPPLY
Sr. No.
Year Population *
WaterSupply
Million Lts.**
Per capita water supply(Liters)***
1 1971 1,76,091 35.41 201.082 1981 2,62,428 50.99 194.303 1991 6,56,925 118.02 179.654 2001 10,77,236 247.47 136.905 2011 14,86,973 337.00 150.00
Source: * Census of India District Census Handbook Nashik District.
** NMC City Water Supply Report. *** Author.
209
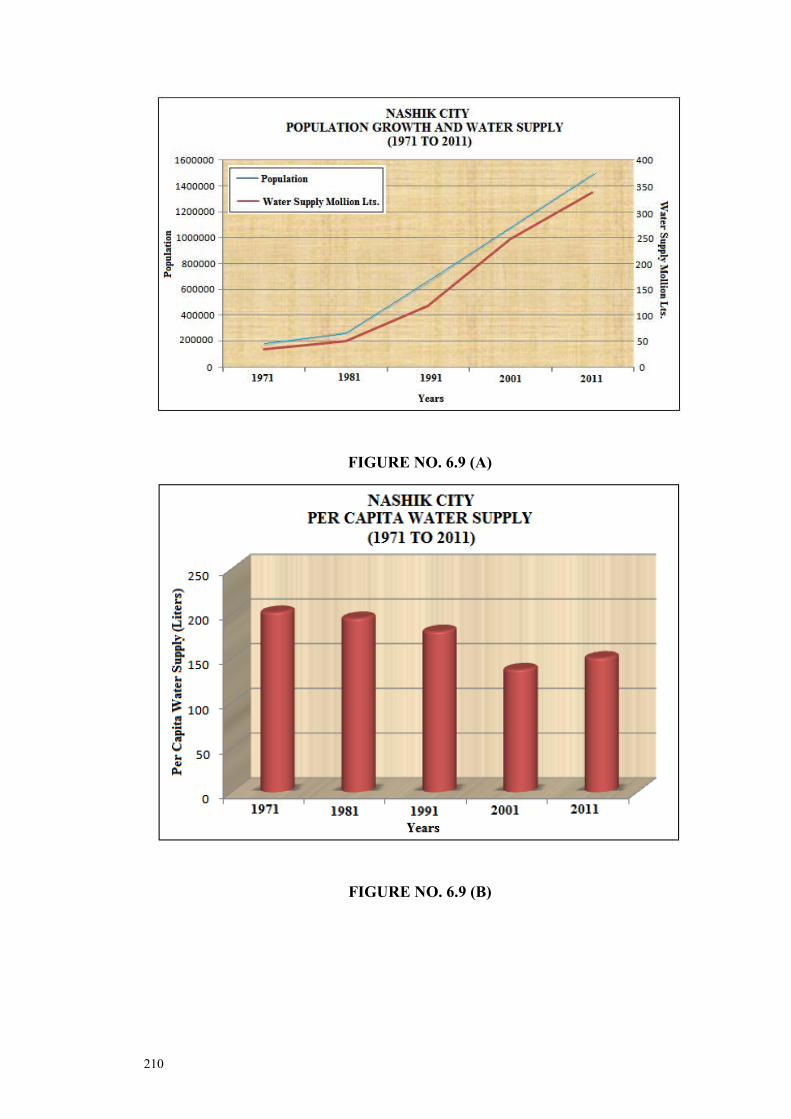
FIGURE NO. 6.9 (A)
FIGURE NO. 6.9 (B)
210
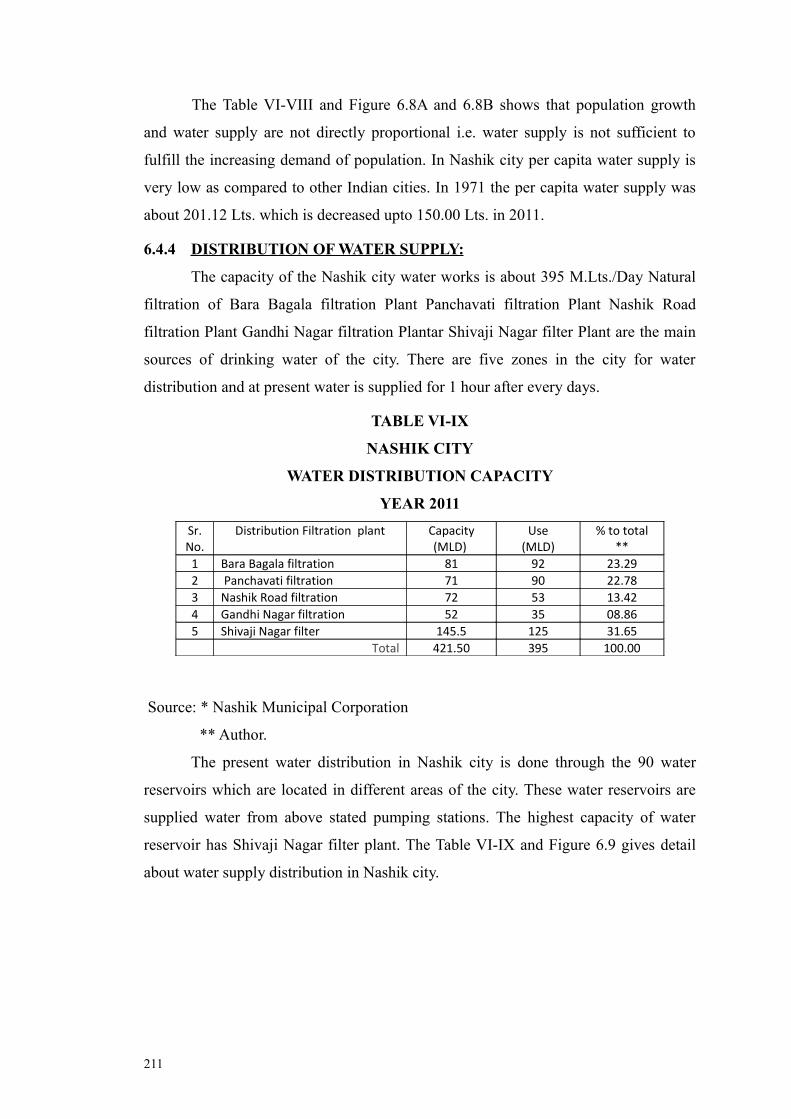
The Table VI-VIII and Figure 6.8A and 6.8B shows that population growth
and water supply are not directly proportional i.e. water supply is not sufficient to
fulfill the increasing demand of population. In Nashik city per capita water supply is
very low as compared to other Indian cities. In 1971 the per capita water supply was
about 201.12 Lts. which is decreased upto 150.00 Lts. in 2011.
6.4.4 DISTRIBUTION OF WATER SUPPLY:
The capacity of the Nashik city water works is about 395 M.Lts./Day Natural
filtration of Bara Bagala filtration Plant Panchavati filtration Plant Nashik Road
filtration Plant Gandhi Nagar filtration Plantar Shivaji Nagar filter Plant are the main
sources of drinking water of the city. There are five zones in the city for water
distribution and at present water is supplied for 1 hour after every days.
TABLE VI-IX
NASHIK CITY
WATER DISTRIBUTION CAPACITY
YEAR 2011
Sr. No.
Distribution Filtration plant Capacity(MLD)
Use(MLD)
% to total**
1 Bara Bagala filtration 81 92 23.292 Panchavati filtration 71 90 22.783 Nashik Road filtration 72 53 13.424 Gandhi Nagar filtration 52 35 08.865 Shivaji Nagar filter 145.5 125 31.65
Total 421.50 395 100.00
Source: * Nashik Municipal Corporation
** Author.
The present water distribution in Nashik city is done through the 90 water
reservoirs which are located in different areas of the city. These water reservoirs are
supplied water from above stated pumping stations. The highest capacity of water
reservoir has Shivaji Nagar filter plant. The Table VI-IX and Figure 6.9 gives detail
about water supply distribution in Nashik city.
211
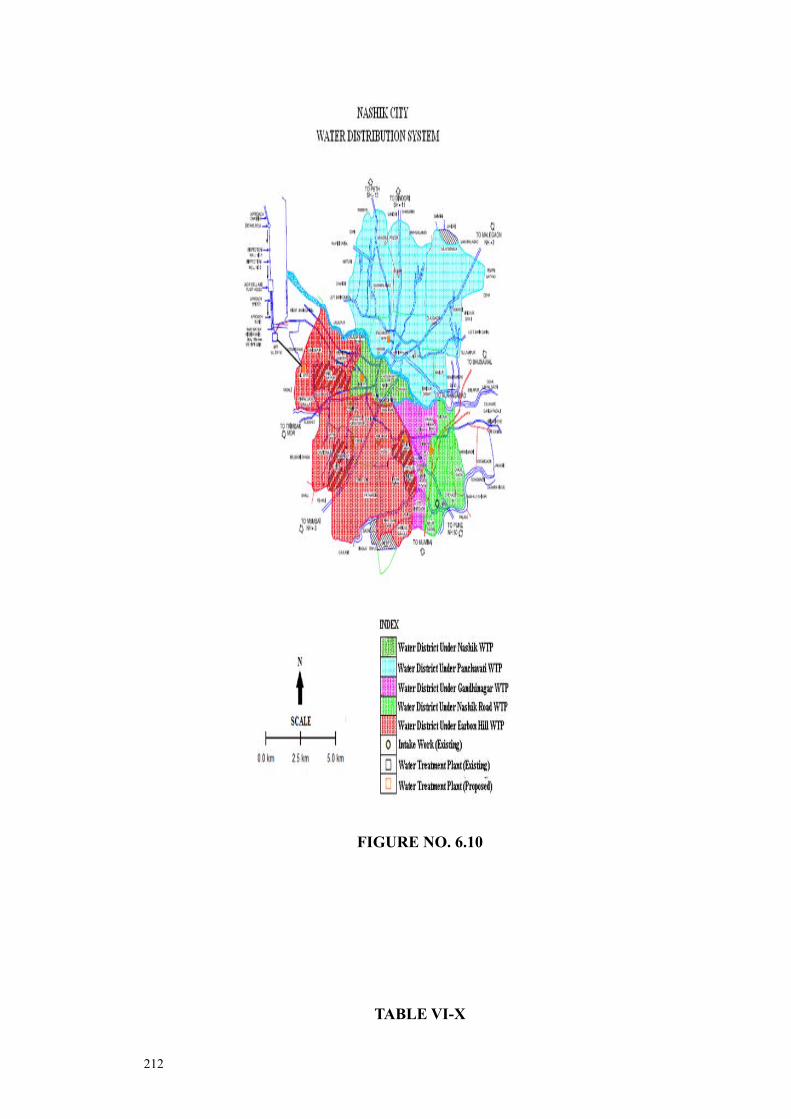
FIGURE NO. 6.10
TABLE VI-X
212
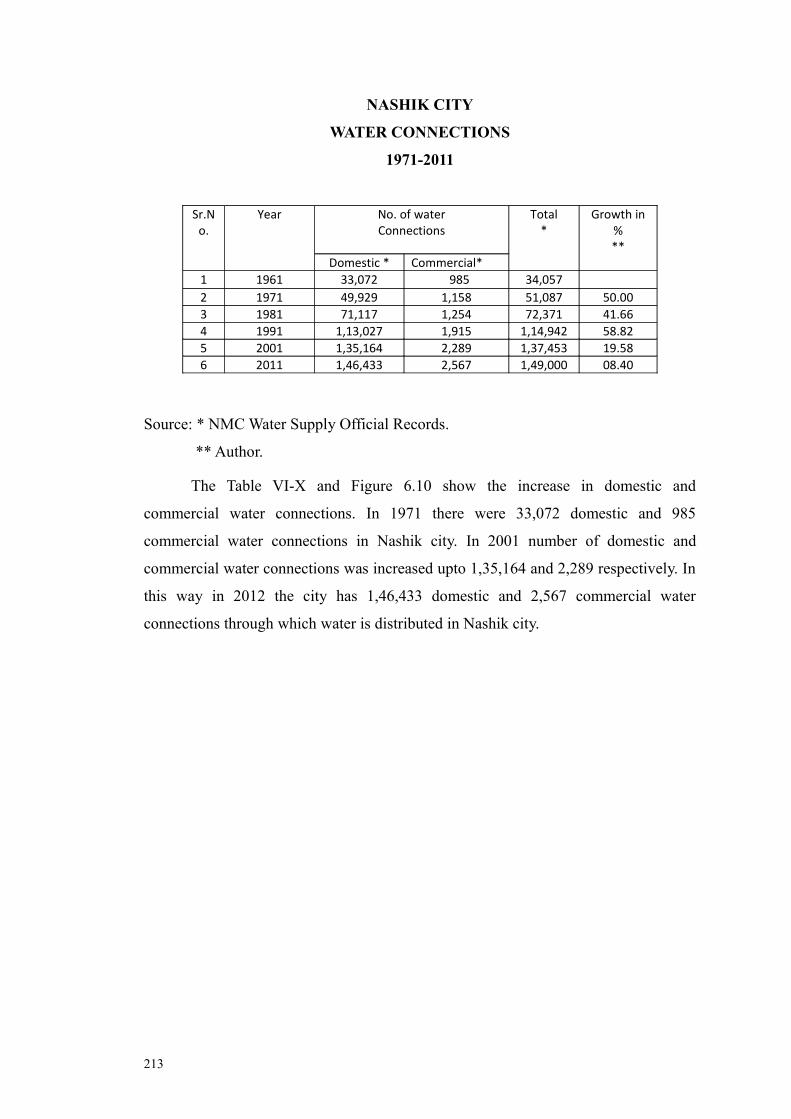
NASHIK CITY
WATER CONNECTIONS
1971-2011
Sr.No.
Year No. of waterConnections
Total*
Growth in %**
Domestic * Commercial*1 1961 33,072 985 34,0572 1971 49,929 1,158 51,087 50.003 1981 71,117 1,254 72,371 41.664 1991 1,13,027 1,915 1,14,942 58.825 2001 1,35,164 2,289 1,37,453 19.586 2011 1,46,433 2,567 1,49,000 08.40
Source: * NMC Water Supply Official Records.
** Author.
The Table VI-X and Figure 6.10 show the increase in domestic and
commercial water connections. In 1971 there were 33,072 domestic and 985
commercial water connections in Nashik city. In 2001 number of domestic and
commercial water connections was increased upto 1,35,164 and 2,289 respectively. In
this way in 2012 the city has 1,46,433 domestic and 2,567 commercial water
connections through which water is distributed in Nashik city.
213
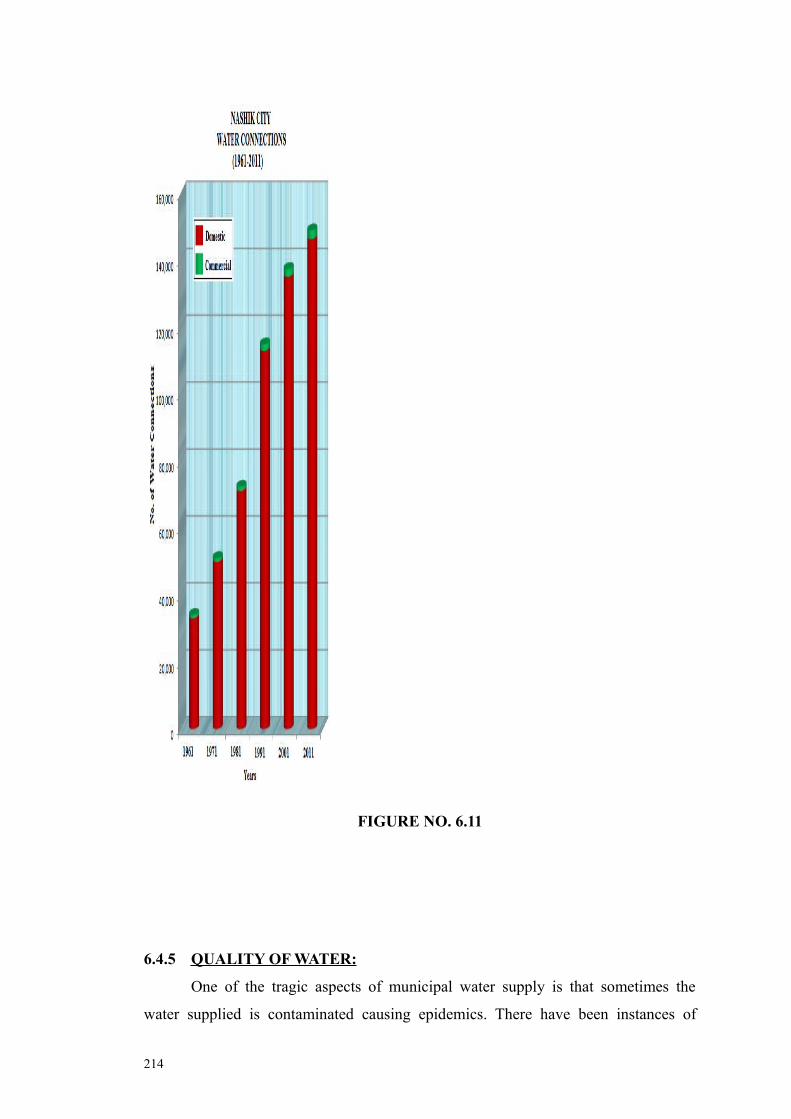
FIGURE NO. 6.11
6.4.5 QUALITY OF WATER:
One of the tragic aspects of municipal water supply is that sometimes the
water supplied is contaminated causing epidemics. There have been instances of
214

municipal sewage getting mixed up with the drinking water supply. Only less than a
half of the collected sewage is treated and the rest is discharged in rivers resulting the
contamination of water and thus exposing 70-90 per cent of people to unsafe drinking
water.10 The quality of drinking water is polluted in particular seasons. It is observed
that water is polluted mostly at the beginning of rainy season. It gives scope for rising
gastrointestinal disorders like dysentery diarrhea cholera jaundice typhoid etc.
Industrial effluents are released into water streams; this is caused to damage liver
kidney respiratory system and nervous system of aquatic animals and kill them.
The contamination of drinking water of Nashik city is increased due to
improper running of water filter plants. Most of the water supplying pipelines is old
and damaged; this is also major cause of drinking water pollution. It needs to remove
all these problems for getting pure and fresh water to Nashik citizen.
6.5 PROBLEM OF POLLUTION:
6.5.1 INTRODUCTION:
Pollution may be defined as the undesirable changes in the physical biological
and chemical characteristics of air water noise and soil which can adversely affect on
human health and its property ecosystem and its routine life style. In Nashik as a fast
developing city there is rapid growth in industrial sector and urban development
subsequently along with transportation as one of the major influencing factor.
Ambient Air Quality is an alarming issue in cities with special reference to traffic and
industrial activities giving rise to serious health hazards. Taking this point into
consideration the air quality is monitored by local authorities / government
organizations and private agencies individually or in association with each other.
Nashik is the fastest developing city in the Maharashtra Region. Due to urbanization
and industrialization development rate also increasing day by day and the population
also increasing and creates an impact on city environment. On one hand there is
increase in the rate of industrialization and on the other hand deforestation lack of
rainfall high temperature and growing vehicular population make the adverse impact
on the air and noise environment and creating the problems of the city. So there is a
necessity of protection and balancing the environmental factor in the city
environment.
6.5.2 WATER POLLUTION:
Water is one of the prime necessities of life. Water resources have been most
exploited natural system since man strode the earth. It shows the result by causing
215

water quality deterioration. World Health Organization (1966) defined water pollution
as ‘Foreign Materials either from natural or other sources are contaminated with water
supplies and may be harmful to life because of their toxity reduction of normal
oxygen level of water aesthetically unsuitable effects and spread of epidemic
diseases.’11 Here an attempt has been made to study the problem of water pollution
Nashik city.
The Table VI-XI shows the various pollutants contain in drinking water bore
well water dug well water Nalla Godavari River and lake of the Nashik city. It is
observed that the highest PH value is found in Ramkund while lowest PH value is
found Anadwali. The high electrical conductivity and high amount oxygen demand
biochemical oxygen demand chemical oxygen demand is observed in Anadwali
Shaunagar and Dwarka respectively. The higher amount is may be due to continuous
addition of household waste sewage and sewer lines into the all water.
TABLE VI-XI
NASHIK CITY
CONTAIN OF WATER POLLUTANTS (2012)
Sr. No
Station Parameter
Ph DO BOD COD HardNess
Ca Mg Chloride
Alkalinity
Oil &Grease
1 Somshwar 7.6 4.9 7.5 17 90 50 25 40.5 48 902 Anadwali 7.5 5.0 12 31 75 37 24 56.19 55 753 K.T.H.M. 7.8 5.1 7.4 15 52 24 01 39.15 65 564 Ramwadi 8.5 3.6 32 80 60 28 21 34.75 120 685 Ramkund 8.6 3.8 34 75 85 42 30 40 135 806 Amrdham 7.8 3.2 37 92 80 45 26 37.75 160 457 Kmblewdi 8.2 2.0 45 110 80 47 36 215 125 468 Shaunagar 8.0 2.7 63.3 117 100 55 35 257 138 669 Vinynagar 8.1 1.2 48 122 70 38 28 225 193 43
10 Dwarka 7.8 1.5 44.6 113.5 66 35 22 220 150 4011 Takli 7.6 2.4 40 112 120 64 40 171.9 160 75
12 Panchk 7.8 4.1 35 80.5 104 57 35 148.8 138 56
Values are given in mg/ l except ph. Source: - M.P.C.B. Nashik Office.
High chlorides concentration was observed in the Takali may be due to
bathing washing and activities of human and animals.
6.5.3 AIR POLLUTION:
The pollution of our environment is one of the biggest hazards that humanity
faces today. Urban air pollution has worsened the health in the cities of both
216
developed and developing countries. The health impacts in developing world have
driven by population growth industrialization and increased vehicle use. The
combustion of fossil fuel and their products are responsible for a sizeable amount of
anthropogenic air pollution and this problem is particularly acute in urban areas.12
According to World Health Organization (WHO) “air pollution is defined as limited to
situation in which the outdoor ambient atmosphere contains materials in concentration
which are harmful to man and his surrounding environment.’’12
Nashik city is a trade and commercial centre of North Maharashtra. The
population of Nashik has increased by 50.33 per cent during 1981-91 and 63.98 per
cent during 1991-2001. Now the population of Nashik is about 1486973 persons. With
the growing population the numbers of vehicles are also increasing continuously. As a
result the levels of air pollution are increasing day by day in the city. This growing
trend of air pollution is a serious threat to the health of population. The National
Highway No. 03 and 50 is passing through the city is an additional source of air
pollution to the area.
During the last 2 to 3 years Nashik Municipal Corporation is monitoring the ambient air quality in the city through recognized laboratory at various commercial spots e.g. Pathardi Phata Mumbai Naka Dwarka Circle and CBS for the parameters viz. Respirable Suspended Particulate Matter (RSPM) Sulphur Dioxide (SO2) Oxides of Nitrogen (NOx) and Carbon Monoxide (CO). The RSPM level is found to be in the range of 65 to 80 μg/m3 at Pathardi Phata and Mumbai Naka whereas 90 to 95 μg/m3at CBS and Dwarka Circle. The CO level is also exceeding the prescribed limit. This is mainly due to heavy traffic conditions. NMC is also monitoring the air quality at Municipal Solid Waste Management Project i.e. Compost Factory in order to assess the impact of the same on the surrounding environment. Ambient Air Quality to be maintained in accordance with National Ambient Air Quality Standards as per Environment (Protection) Rules 1986 under Environment (Protection) Act 1986.
217
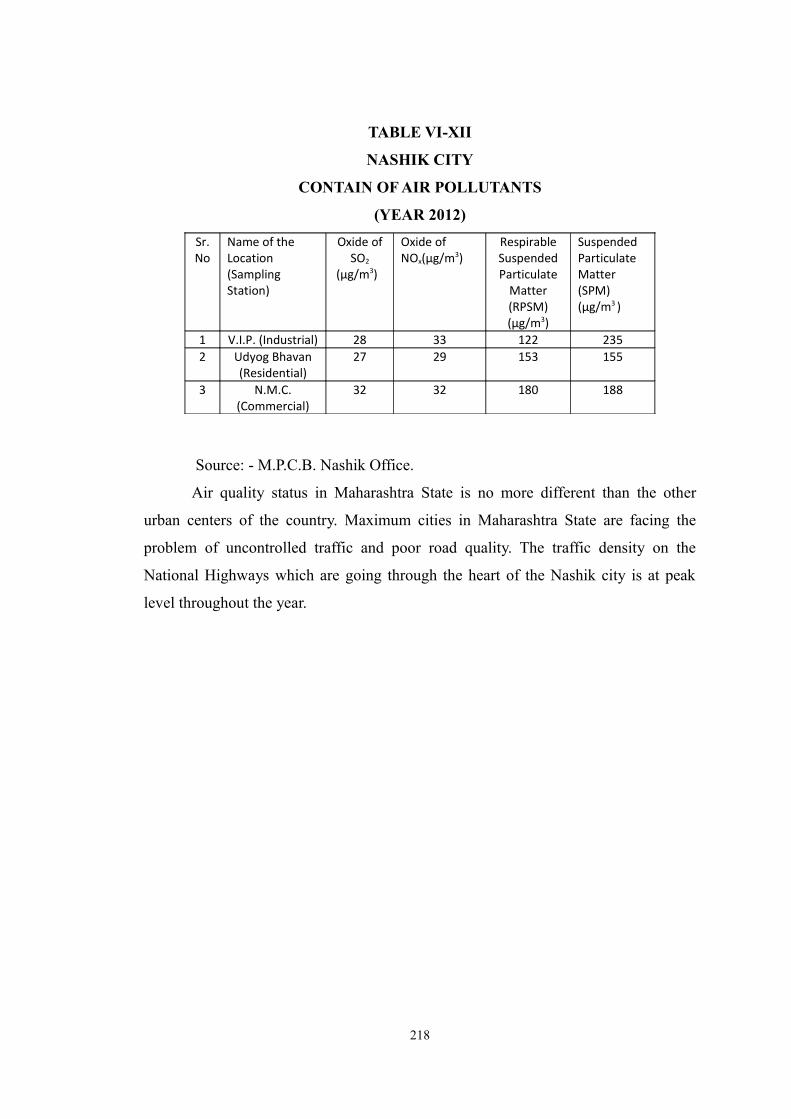
TABLE VI-XII
NASHIK CITY
CONTAIN OF AIR POLLUTANTS
(YEAR 2012)
Sr. No
Name of the Location (Sampling Station)
Oxide of SO2
(μg/m3)
Oxide of NOx(μg/m3)
Respirable Suspended Particulate
Matter (RPSM) (μg/m3)
Suspended Particulate Matter (SPM) (μg/m3 )
1 V.I.P. (Industrial) 28 33 122 2352 Udyog Bhavan
(Residential)27 29 153 155
3 N.M.C.(Commercial)
32 32 180 188
Source: - M.P.C.B. Nashik Office.
Air quality status in Maharashtra State is no more different than the other
urban centers of the country. Maximum cities in Maharashtra State are facing the
problem of uncontrolled traffic and poor road quality. The traffic density on the
National Highways which are going through the heart of the Nashik city is at peak
level throughout the year.
218
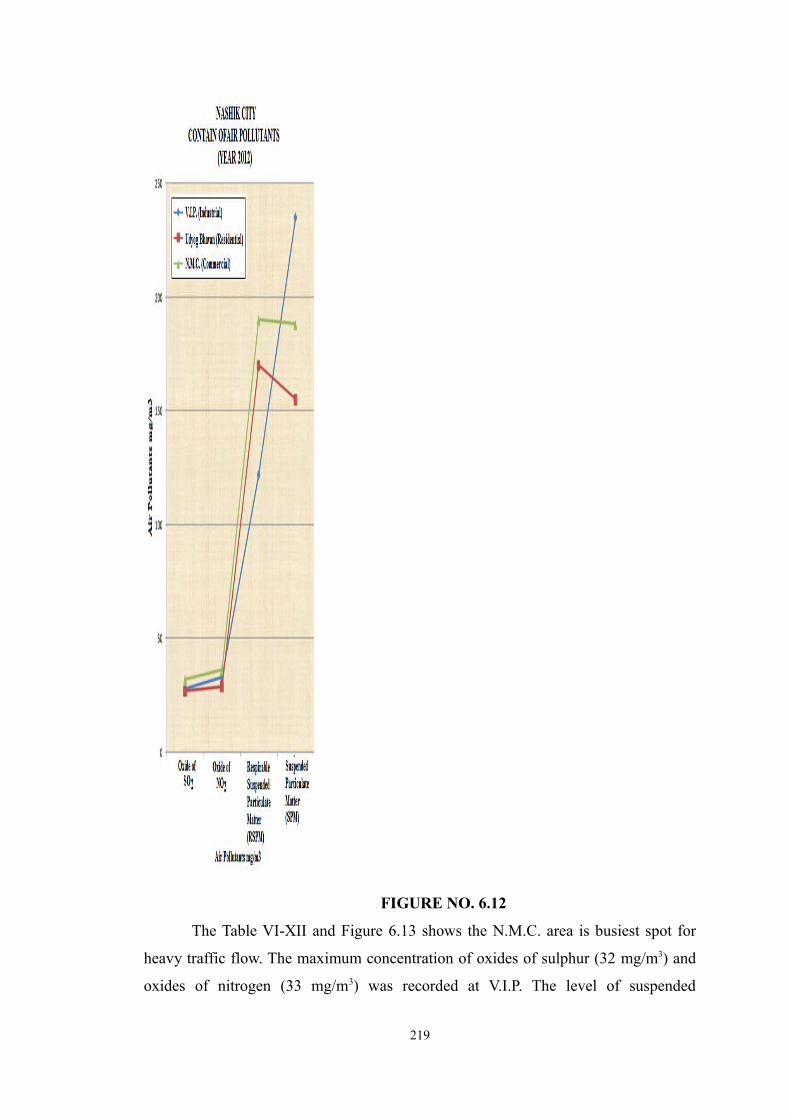
FIGURE NO. 6.12
The Table VI-XII and Figure 6.13 shows the N.M.C. area is busiest spot for
heavy traffic flow. The maximum concentration of oxides of sulphur (32 mg/m3) and
oxides of nitrogen (33 mg/m3) was recorded at V.I.P. The level of suspended
219
particulate matter (SPM) 190 mg/m3 and respirable suspended particulate matter
(RPSM) 235 mg/m3 were recorded at these locations.
The levels of oxides of Sulphur were lower than the prescribed limit at
residential area of the city. The levels of air pollutants are likely to increase in the
winter and summer season. Winter season is characterized by low wind speed and
ultimately less dispersion of air pollutants. In summer the dust get air borne due to
heavy wind currents.
6.5.4 NOISE POLLUTION:
Noise, by definition, is unwanted sound. Noise pollution can be defined as
unwanted or offensive sounds that unreasonably intrude into our daily activities (EPA,
1974). Sound, which pleases the ears, is music and that which cause pain and
annoyance, is noise. The major adverse effects of noise on human beings and
Environment is the physiological features like breathing amplitude, blood pressure,
Heartbeat rate, pulse rate and blood cholesterol are affected. It causes pain, ringing in
the ears, feeling of tiredness, thereby effecting the functioning of human system. The
working performance of workers/human will be affected as they will be losing their
concentration. Long exposure to high sound levels cause loss of hearing. But has an
adverse impact on hearing function. It affects the sleeping there by inducing the
people to become restless, loosing concentration and presence of mind during their
activities. Animals are also susceptible to noise pollution as well. It damages the
nervous system of the animals. Vibrations caused by noise indirectly weaken the
edifice of buildings, bridges and monuments. It creates waves, which can be very
harmful and cause damage to the building.13
Noise emitted from every source in the environment is an undesirable by
product of our modern way of life. Today transportation has become major contributor
to overall noise pollution. Unfortunately in the planning of major roads and highway
projects in India future expansion of urban centers is not taken into consideration. As
a result i) unplanned road traffic in city was observed and the highways are passing
through the heart of most urban centers ii) intolerable road traffic is adversely
affecting the nearby population exposed to continuous noise pollution and iii) it is
difficult to determine the impact of noise being slow and long lasting.
The mild noise can be annoying while excessive noise can be destroying a
person’s hearing ability. Research has shown that high noise levels are several
220
physiological and psychological problems. In India the total contribution of traffic
noise is about 55 per cent of the total noise pollution.
Ambient Air Quality including Noise levels are also monitored during various
festivals like Diwali and Ganesh Utsav for assessing its impact. During such festivals
the noise level is almost found to be in range of 85 to 100 dB which is harmful for
public health. The air quality was specially monitored during Kumbhamela including
microbiological testing in ambient air.
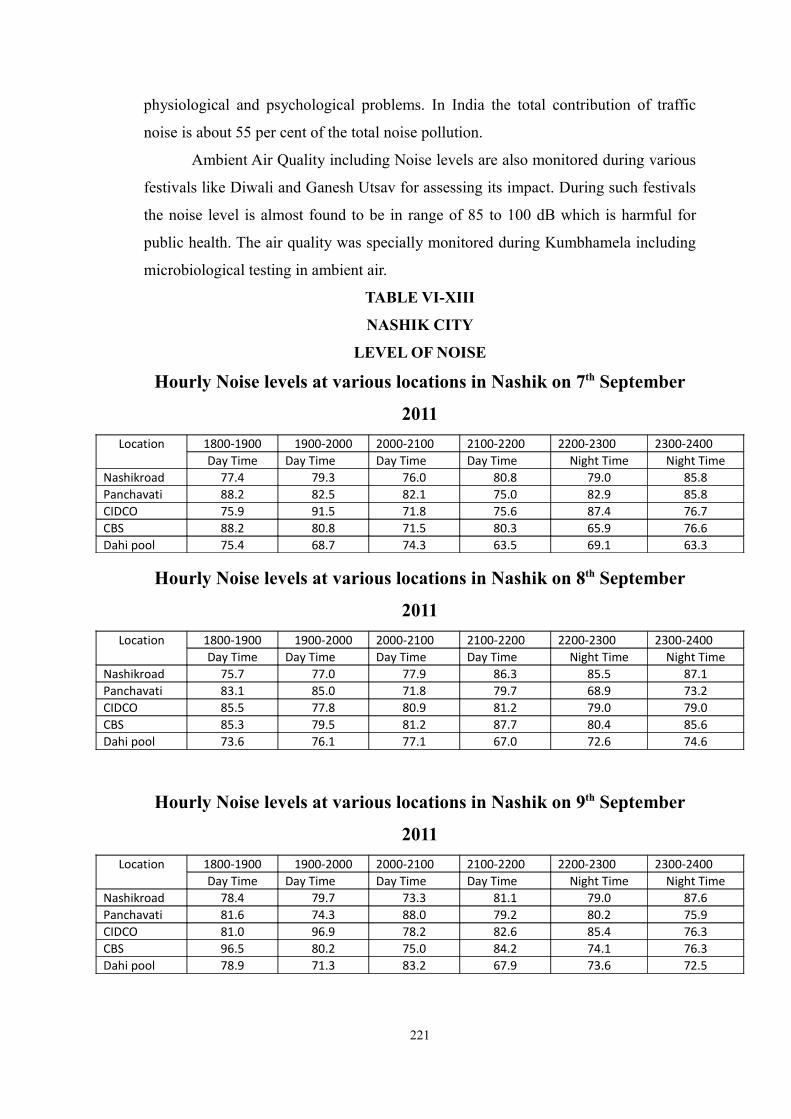
TABLE VI-XIII
NASHIK CITY
LEVEL OF NOISE
Hourly Noise levels at various locations in Nashik on 7th September
2011
Location 1800-1900 1900-2000 2000-2100 2100-2200 2200-2300 2300-2400Day Time Day Time Day Time Day Time Night Time Night Time
Nashikroad 77.4 79.3 76.0 80.8 79.0 85.8Panchavati 88.2 82.5 82.1 75.0 82.9 85.8CIDCO 75.9 91.5 71.8 75.6 87.4 76.7CBS 88.2 80.8 71.5 80.3 65.9 76.6Dahi pool 75.4 68.7 74.3 63.5 69.1 63.3
Hourly Noise levels at various locations in Nashik on 8th September
2011
Location 1800-1900 1900-2000 2000-2100 2100-2200 2200-2300 2300-2400Day Time Day Time Day Time Day Time Night Time Night Time
Nashikroad 75.7 77.0 77.9 86.3 85.5 87.1Panchavati 83.1 85.0 71.8 79.7 68.9 73.2CIDCO 85.5 77.8 80.9 81.2 79.0 79.0CBS 85.3 79.5 81.2 87.7 80.4 85.6Dahi pool 73.6 76.1 77.1 67.0 72.6 74.6
Hourly Noise levels at various locations in Nashik on 9th September
2011
Location 1800-1900 1900-2000 2000-2100 2100-2200 2200-2300 2300-2400Day Time Day Time Day Time Day Time Night Time Night Time
Nashikroad 78.4 79.7 73.3 81.1 79.0 87.6Panchavati 81.6 74.3 88.0 79.2 80.2 75.9CIDCO 81.0 96.9 78.2 82.6 85.4 76.3CBS 96.5 80.2 75.0 84.2 74.1 76.3Dahi pool 78.9 71.3 83.2 67.9 73.6 72.5
221
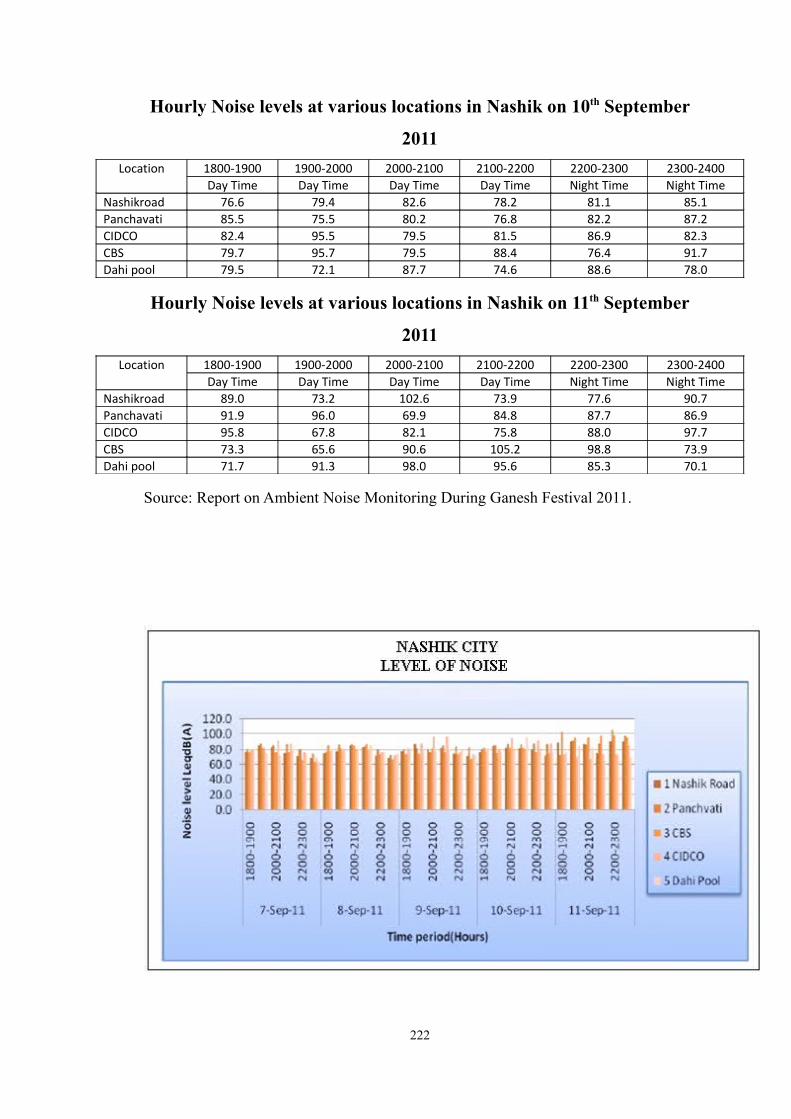
Hourly Noise levels at various locations in Nashik on 10th September
2011
Location 1800-1900 1900-2000 2000-2100 2100-2200 2200-2300 2300-2400Day Time Day Time Day Time Day Time Night Time Night Time
Nashikroad 76.6 79.4 82.6 78.2 81.1 85.1Panchavati 85.5 75.5 80.2 76.8 82.2 87.2CIDCO 82.4 95.5 79.5 81.5 86.9 82.3CBS 79.7 95.7 79.5 88.4 76.4 91.7Dahi pool 79.5 72.1 87.7 74.6 88.6 78.0
Hourly Noise levels at various locations in Nashik on 11th September
2011
Location 1800-1900 1900-2000 2000-2100 2100-2200 2200-2300 2300-2400Day Time Day Time Day Time Day Time Night Time Night Time
Nashikroad 89.0 73.2 102.6 73.9 77.6 90.7Panchavati 91.9 96.0 69.9 84.8 87.7 86.9CIDCO 95.8 67.8 82.1 75.8 88.0 97.7CBS 73.3 65.6 90.6 105.2 98.8 73.9Dahi pool 71.7 91.3 98.0 95.6 85.3 70.1
Source: Report on Ambient Noise Monitoring During Ganesh Festival 2011.
222
FIGURE NO. 6.13
The Table VI-XIII and Figure 6.13 shows tremendous increase in noise levels
at sampling stations of Nashik city. Normal level of sound intensity is 60 dB but all
study centers having more than 60 dB sound intensity which cause the noise pollution
in the city. The morning and evening hours are characterized by heavy traffic hours at
Dwarka, Ravivar Karanja, C.B.S. and Cidco. At the locations the noise levels ranges
between 70 to 99 dB (Average). Lower levels of noise are recorded in the afternoon
session except Dwarka. Heavy traffic flow generating higher noise is observed at
Dwarka Chowk. Only at Ravivar Karanja the lower noise levels are recorded in the
morning and afternoon session.
6.5.5 SOLID WASTE POLLUTION:
With rapid urbanization in recent years like a Nashik city numbers of cities in
India are experiencing waste management problems similar to other major cities in the
world. Solid waste pollution creates number of environmental problems viz. air
ground and surface water pollution. The depletion in quantity and quality of
environmental resources has adverse impacts on life. Leach ate from waste dumpsites
can potentially enter in the ground or surface water resources. The sources of
Municipal solid waste are houses shops markets hotels schools colleges and road
sweepings. A variety of biodegradable and non-biodegradable materials are present in
the above wastes. It contains food waste paper plastic rubber rags metals glass yard
waste and packaging materials agricultural waste etc. The unplanned collection of
waste in community bins and its transportation to disposal site into open vehicles
causes real public nuisance.
Municipal Solid Waste contains the waste generated from commercial and
residential areas (paper plastic vegetable parts cloths bags rubber glass etc.) Its
management includes proper collection segregation storage transportation processing
and disposal.
In the study region nearly around 225 MT of solid waste is generated per day.
A compost factory has been established by the corporation for converting garbage into
valuable compost/manure. The garbage is collected with the help of special vehicles
named “Ghantagadi” with Lorries/Trucks 4 Mini Lorries/Trucks 3 Tracer Trailers 18
Tipper Trucks (Ghantagadi) 124. Nashik Municipal Corporation has established one
laboratory at the site where garbage and compost is analyzed for general parameters.
223
There are about 2000 public dust bins on various road sides in city with per
500 kg waste material capacity. Even after it is not possible to collect whole solid
waste of the city and collected solid waste is not properly processed. The general
practices of solid waste management in Indian cities are as follows-
* Open dumping method.
* Scientific land filling method.
* Composting method.
* Energy recovery method.
* Recycling method.
Out of above methods only open dumping method is used in the study region
but in some cases composting method is also used i.e. for the vegetables market
wastes. But composting and dumping is not done by scientific method. Due to
absence of proper method of solid waste management high solid waste pollution and
their effect is observed in Nashik city.
TABLE VI-XIV
NASHIK CITY
SOLID WASTE POLLUTION
Sr.No.
DumpingStations
PHValue
Conductivity
(Milimhos)
Alkalinity
Mg/Lit
Sulphate
Mg/Lit
COD Mg/Lit
BOD Mg/Lit
Nitrates%
PhospHate
Mg/Lit1 Vilohli 8.2 4.25 4587 1581 6541 3524 18 42
Source: - Environmental Status Report 2004-05 by J.M.C
It is observed from the Table VI-XIV that the leachate generated from the solid
waste dumping sides carries high pollution load. Higher level of hardness BOD COD
total solids total dissolved solid total suspended solid chlorides and nitrates were
observed in the leachate. The leachate generated from Agra road dumpsite shows high
amount of alkalinity electrical conductivity nitrates and phosphates. This shows the
need of proper process for solid waste management in Nashik city.
6.6 HEALTH PROBLEM:
6.6.1 INTRODUCTION:
224
Health envisages the full development of the physical mental and spiritual
powers with which an individual is endowed. This mean there is always scope for
further improvement of health i.e. health plus. The health promotion can be achieved
by higher standard of living viz. good food proper housing adequate working facilities
etc. Positive health means promotion of health at its optimum. Thus the positive
concept of health is embodied in the definition of World Health Organization as
“Health is a state of complete physical mental and social well being and not merely
absence of disease or infirmity.14
Urban health in developing countries has distinctive characteristics. There are
communicable diseases on one hand and proliferation of non-communicable diseases
triggered by urbanization and industrialization on the other. This dual characteristic
complicates the health scenario. Added to this is the fact that much of the natural
environment which contributes to the etiological factors of diseases is lost or replaced
by a man-made environment. While physical stress factors of the natural environment
are buffered both communicable and degenerative diseases thrive under a new system
of bio-social interaction.15
The Municipal Finances Enquiry Committee appointed by the Karnataka
Government has observed the characteristics of the towns and cities in India and most
developing countries as “A work along the streets of a town or city will show that not
much attention is paid to the removal of dirt filth garbage the cleaning of dustbins and
other elementary and vital services.’’16 The committee adds: “The citizens themselves
are not conscious of the feelings of neighbors and pedestrians and all sorts of waste
matter including human refuse are thrown on the streets or footpaths. The house-holds
allow their children to freely use the footpaths as latrines.” Public health services are
quite inadequate. In fact the unhygienic conditions and the absence or inadequacy of
the drainage and conservancy services breed many contagious diseases.
Health of a nation is not depending on number of doctors and hospitals but
there are several factors too. It may be one of the many factors. It depends on food
habits living condition and ecology changing habits immunity to medical services. All
these situations are deteriorating so fast that it will not be a surprise if India will be an
unenviable country with so called diseases of poverty and affluence coexisting with
each other. In addition of course a factor this indirectly controls our health in the
literacy rate.17
6.6.2 HEALTH CARE FACILITIES:225
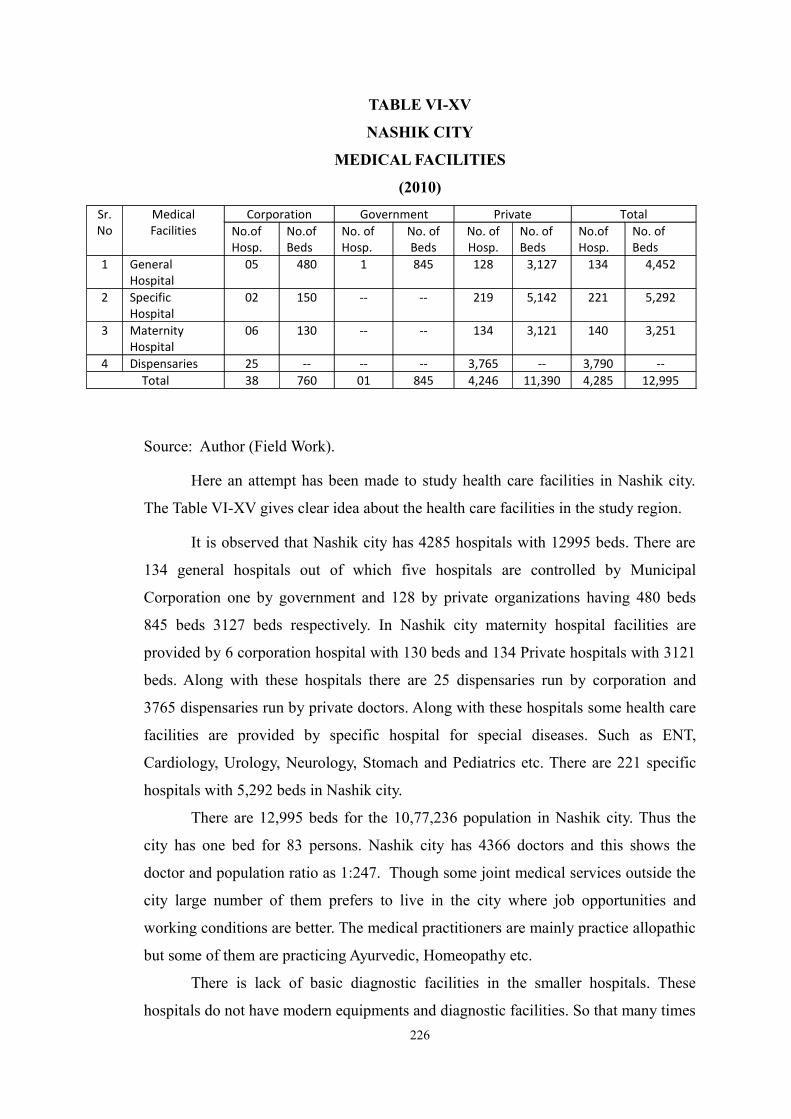
TABLE VI-XV
NASHIK CITY
MEDICAL FACILITIES
(2010)
Sr.No
MedicalFacilities
Corporation Government Private TotalNo.of Hosp.
No.of Beds
No. of Hosp.
No. of Beds
No. of Hosp.
No. of Beds
No.of Hosp.
No. of Beds
1 GeneralHospital
05 480 1 845 128 3,127 134 4,452
2 SpecificHospital
02 150 -- -- 219 5,142 221 5,292
3 MaternityHospital
06 130 -- -- 134 3,121 140 3,251
4 Dispensaries 25 -- -- -- 3,765 -- 3,790 --Total 38 760 01 845 4,246 11,390 4,285 12,995
Source: Author (Field Work).
Here an attempt has been made to study health care facilities in Nashik city.
The Table VI-XV gives clear idea about the health care facilities in the study region.
It is observed that Nashik city has 4285 hospitals with 12995 beds. There are
134 general hospitals out of which five hospitals are controlled by Municipal
Corporation one by government and 128 by private organizations having 480 beds
845 beds 3127 beds respectively. In Nashik city maternity hospital facilities are
provided by 6 corporation hospital with 130 beds and 134 Private hospitals with 3121
beds. Along with these hospitals there are 25 dispensaries run by corporation and
3765 dispensaries run by private doctors. Along with these hospitals some health care
facilities are provided by specific hospital for special diseases. Such as ENT,
Cardiology, Urology, Neurology, Stomach and Pediatrics etc. There are 221 specific
hospitals with 5,292 beds in Nashik city.
There are 12,995 beds for the 10,77,236 population in Nashik city. Thus the
city has one bed for 83 persons. Nashik city has 4366 doctors and this shows the
doctor and population ratio as 1:247. Though some joint medical services outside the
city large number of them prefers to live in the city where job opportunities and
working conditions are better. The medical practitioners are mainly practice allopathic
but some of them are practicing Ayurvedic, Homeopathy etc.
There is lack of basic diagnostic facilities in the smaller hospitals. These
hospitals do not have modern equipments and diagnostic facilities. So that many times
226
serious patients have to be rushed to Pune, Mumbai. Even the ratio of doctors and
people and beds and persons are good in city the quality of medical facilities are very
poor. It needs to improve the health care facilities in the city.
REFERENCES
1. K. Siddhartha and S. Mukherjee, (2002), ‘Cities Urbanization and urban
systems’, Kisalaya Publications Pvt. Ltd., Delhi, P.P.197 198.
2. Cherunilam Francis (1984) ‘Urbanization in Developing Countries’ A Socio-
economic and Demographic Analysis Himalaya Publishing House Mumbai P.
112.
3. Mandal R. B. (2000) ‘Urban Geography’ Concept Publishing Company New
Delhi P. 412.
4. Zodage S. B. (2001) ‘Impact of Urban Growth on Environment - A Study of
Kolhapur’ (A unpublished Ph.D. Thesis) P.143.
5. Lal H. (1987) ‘City and Urban Fringe - A Case Study of Bareilly’ Concept
Publishing Company New Delhi P. 123.
6. Cherunilam Francis (1984) ‘Urbanization in Developing Countries - A Socio
Economic and Demographic Analysis’ Himalaya Publishing House Mumbai P.
123.
7. A Report on ‘Comprehensive Traffic and Transportation Study of Nashik City’
(2011) Tata Consultancy Services Mumbai.
8. T. Lee and Burton J. (1965) ‘Future Water Supply for Indian Cities’ Deccan
Geographer P.P. 3-4.
227
9. Development Plan Report of NASHIK City (2002) Town Planning
Department Maharashtra State P. P. 31 32.
10. Bijlani H. U. (1977) ‘Urban Problems’ Indian Institute of Public
Administration New Delhi P. P. 122-140.
11. Singh Savindra (2000) ‘Environmental Geography’ Prayag Pustak Bhawan
Allahabad P. 437.
12. Environmental Status Report (2010-11) Nashik Municipal Corporation Nashik
(Maharashtra).
13. Report on Ambient Noise Monitoring During Ganesh Festival 2011. M.P.C.B.
P.P. 8
14. Ghosh R. N. (1980) ‘Manual of Social and Preventive Medical’ Vijaya
Publishing House Calcutta P. P. 5- 6.
15. Hazra Jayati (March 2000) Calcutta - A Study of Urban Health Geographical
Review of India Vol. 62 No. 1.
16. Rama Rao S. and Nagaswara Rao M. Economic of Urban Local Public Sector
Op. Cit P. 85.
17. Zodage S. B. (2001) Impact of Urban Growth on Environment - A case study
of Kolhapur. (A Unpublished Ph.D. Thesis) P. P. 170-171.
******
228