Embed Size (px)
Citation preview
Rural-Urban Distribution
Paper 2, Volume 2 of 2011, A.P.80
CHAPTER - VILiteracy of Rural - Urban
6.1. Literates and Illiterates - Concept
As per Census, a person aged seven and above who can both read and write with understanding in any language, istreated as literate. A person, who can only read but cannot write, is not literate. In the Censuses prior to 1991, childrenbelow 5 years of age were treated as illiterates. It was decided at 1991 Census that all children in the age group 0-6, wouldbe treated as illiterate by definition and the population aged seven years and above only would be classified as literate orilliterate. The same criterion has been retained in the Censuses of 2001 and 2011. Further, a person need not receive anyformal education or acquire any minimum qualification to be treated as literate.
6.2. Literacy Rate - Definition
In earlier Censuses upto 1981, it was customary to arrive at the literacy rate by taking into account the total popula-tion. Literacy rate if calculated excluding the population in the age-group of 0-6 from the total population is appropriatesince population aged 7 years and above only are classified as literates, hence accordingly adopted since 1991.
6.3 Trends - India and Andhra Pradesh
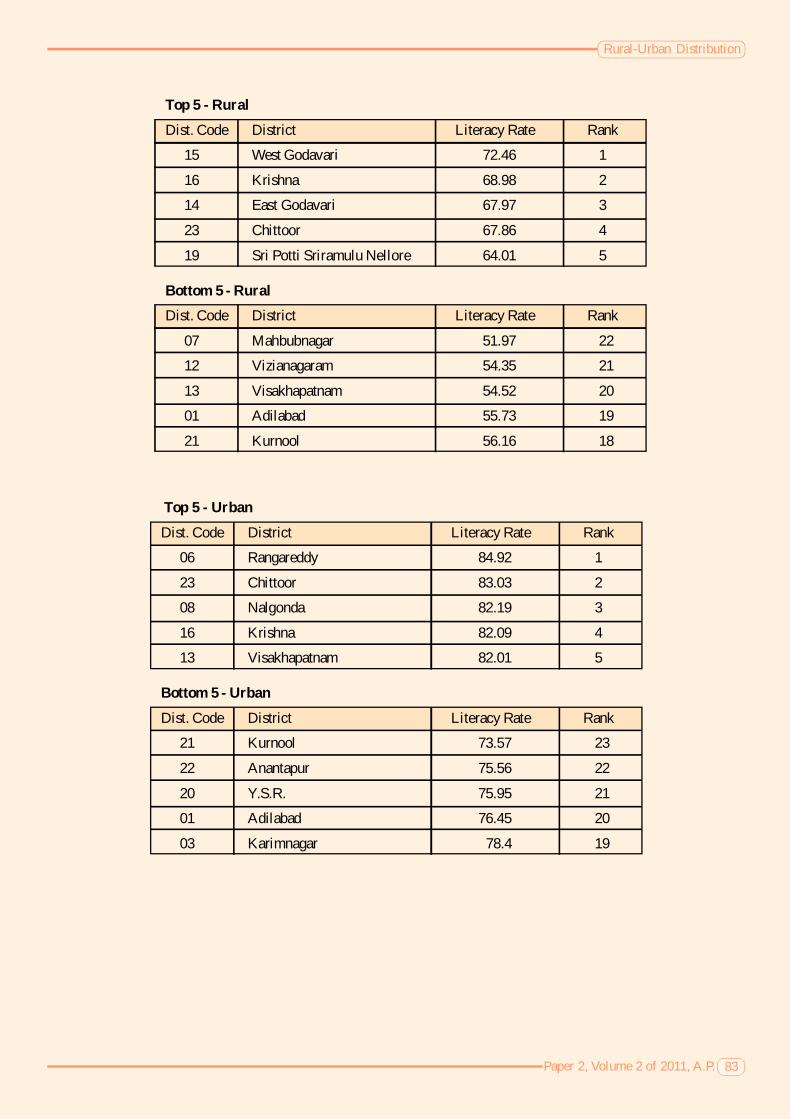
Out of 1,051,404,135 persons aged 7 and above in the country as per 2011 provisional population 778,454,120 areliterates - 493,020,878 from rural and 285,433,242 from urban. The literacy rate for India in Census 2011 is 74.04, withthat of males and females at 82.14 and 65.46 respectively. In rural areas the literacy rate is 68.91 (male: 78.57, female:58.75) and in urban it is 84.98 (male: 89.67, female: 79.92). The gap of 21.59 percentage points recorded between maleand female literacy rates in 2001 Census has reduced to 16.68 percentage points in 2011. This gap is 19.82 points in ruraland 9.75 points in urban areas.
In Andhra Pradesh progressive literacy rates have been registering in all the censuses over the previous census. As perthe provisional population totals of Census 2011, out of the total population of 84,665,533, the number of persons agedseven years and above is 76,022,847. Out of this, 51,438,510 are literates and 24,584,337 are illiterates. There is apopulation increase of 9,984,697 persons in the age group of seven years and above during 2001-2011, while 11,504,187additional persons have become literates during the decade. The total number of illiterates has come down from 26,103,827in 2001 to 24,584,337 in 2011, showing a decline by 1,519,490 persons. Though literacy rate of the State with 67.66 ishigher than that of 2001 census (60.47), the literacy ranking of state has slipped from 28 in 2001 to 31 in 2011. Only in 5districts literacy rate is improved by approximately 10 points and above over their corresponding figures of 2001. How-ever, the literacy gap between male and female is decreased from 19.89 of 2001 to 15.82 of 2011.
6.3.1 Literacy Rural/Urban
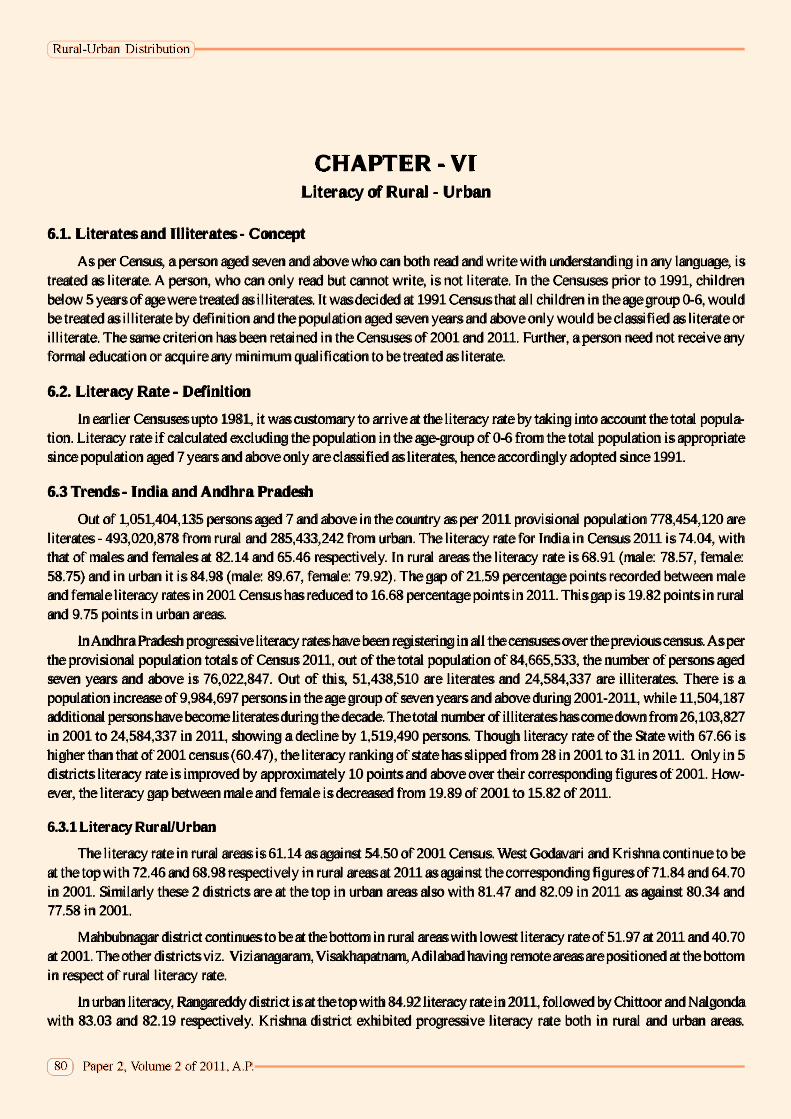
The literacy rate in rural areas is 61.14 as against 54.50 of 2001 Census. West Godavari and Krishna continue to beat the top with 72.46 and 68.98 respectively in rural areas at 2011 as against the corresponding figures of 71.84 and 64.70in 2001. Similarly these 2 districts are at the top in urban areas also with 81.47 and 82.09 in 2011 as against 80.34 and77.58 in 2001.
Mahbubnagar district continues to be at the bottom in rural areas with lowest literacy rate of 51.97 at 2011 and 40.70at 2001. The other districts viz. Vizianagaram, Visakhapatnam, Adilabad having remote areas are positioned at the bottomin respect of rural literacy rate.
In urban literacy, Rangareddy district is at the top with 84.92 literacy rate in 2011, followed by Chittoor and Nalgondawith 83.03 and 82.19 respectively. Krishna district exhibited progressive literacy rate both in rural and urban areas.

Rural-Urban Distribution
Paper 2, Volume 2 of 2011, A.P. 81
Visakhapatnam district showed much disparity in rural-urban literacy performance in 2011 Census. It ranked 5th in urbanliteracy as against 20th in rural literacy. Kurnool and Adilabad districts showed lower literacy rate both in rural and urbanareas in 2011.
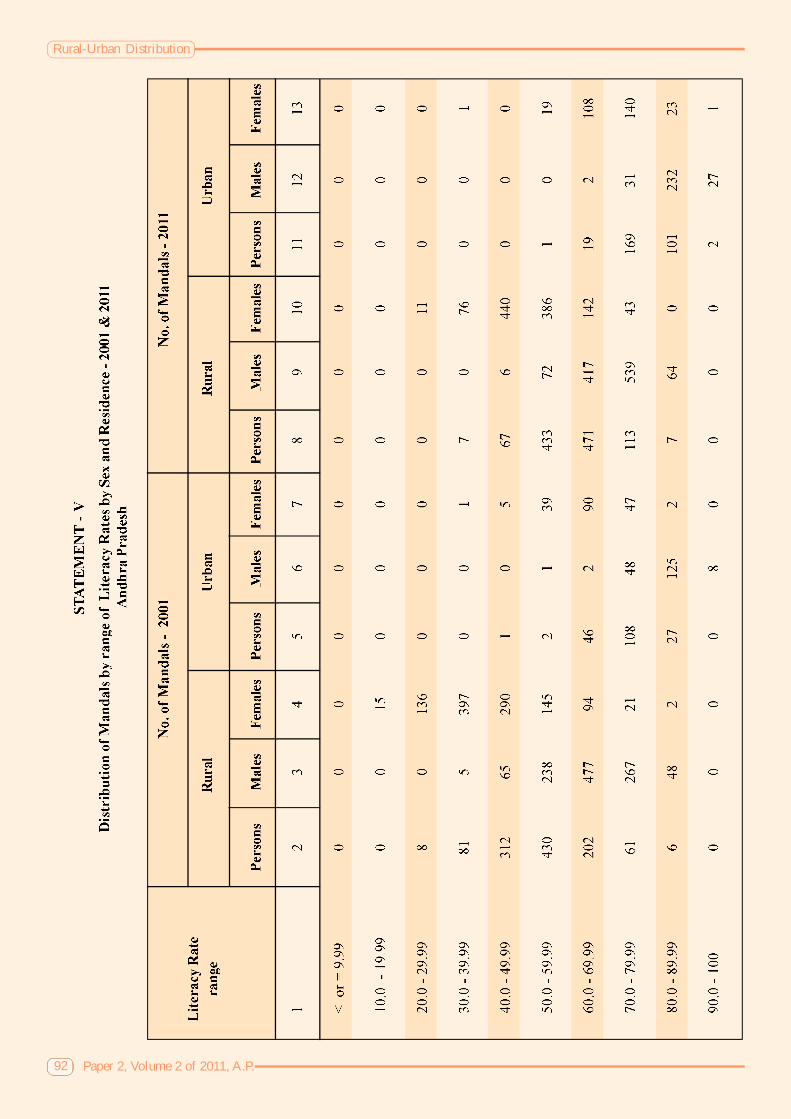
The rural literacy rate at mandal level, 471 mandals are in the range of 60.0-69.9 at 2011 as against 202 in 2001Census. Similarly in urban areas at 2011 Census 169 mandals are in 70.0-79.9 range, as against 108 in 2001 Census. Asagainst 27 mandals of 2001 Census, 103 mandals recorded urban literacy rate of 80 and above in 2011 Census. Theirstatus is on par with the urban State average of 80.54.
Further it is observed that in urban areas in 2011census 2 mandals viz. Keesara (93.16) of Rangareddy district andHimayathnagar (90.03) of Hyderabad district attained above 90% literacy against nil record in 2001. Similarly in urbanareas male literacy is above 90% in 27 mandals as against 8 in 2001. Female literacy is found above 90% only in Keesaramandal (90.53) in urban area in 2011 for the first time.
6.3.2. Number of literates and illiterates among population aged 7 years and above and their changeAndhra Pradesh: 2001-2011
TOTAL
Persons Males Females
1 2 3 4
Population (aged 7 and above)
2001 6,60,38,150 3,33,40,092 3,26,98,058
2011 7,60,22,847 3,80,61,551 3,79,61,296
Increase in 2011 over 2001 99,84,697 47,21,459 52,63,238
Literates
2001 3,99,34,323 2,34,44,788 1,64,89,535
2011 5,14,38,510 2,87,59,782 2,26,78,728
Increase in 2011 over 2001 1,15,04,187 53,14,994 61,89,193
Illiterates
2001 2,61,03,827 98,95,304 1,62,08,523
2011 2,45,84,337 93,01,769 1,52,82,568
Increase in 2011 over 2001 -15,19,490 -5,93,535 -9,25,955
Literates / Illiterates
6.4 Ranks held by the districts in literacy in 1961, 2001 and 2011
It is interesting to see the relative positions of the districts at top and the bottom in literacy at three important censusesviz. 1961, 2001 and 2011, 1961 being the first census after formation of the state, 2001 and 2011 being the previous andpresent censuses. While Hyderabad district continues to be at the top in all the Censuses, West Godavari and Krishnadistricts moved in between 2nd and 3rd rank with Rangareddy district joining as new entrant in 2011 Census. Among thoseat the bottom ranking Mahbubnagar district continues to be in the last 3 positions.
Top Three Positions in 1961, 2001 and 2011 Censuses
District 1961Literacy Rate District 2001Literacy Rate District 2011Literacy Rate
Hyderabad 40.76 Hyderabad 78.78 Hyderabad 80.96
Krishna 36.1 West Godavari 73.53 Rangareddy 78.05
West Godavari 35.58 Krishna 68.85 Krishna 74.37

Rural-Urban Distribution
Paper 2, Volume 2 of 2011, A.P.82
Census Year 1961 1971 1981 1991 2001 2011
Andhra Pradesh 21.19 24.57 35.66 44.08 60.5 67.66
Literacy Rate 1961-2011
Bottom Three Positions in 1961, 2001 and 2011 Censuses
District 1961Literacy Rate District 2001Literacy Rate District 2011Literacy Rate
Mahbubnagar 15.81 Medak 51.65 Kurnool 61.13
Karimnagar 15.06 Vizianagaram 51.07 Vizianagaram 59.49
Adilabad 13.77 Mahbubnagar 44.41 Mahbubnagar 56.06
Note: Literacy Rates for 1961 and 1971 related to the total population. The rates for the years 1981 to 2011related to the population aged seven years and above.
After formation of the State in 1956, the first census was conducted in 1961 where in the literacy rate was recorded as21.19 for the State. It grew to 67.66 in 2011 showing a substantial increase over a period of 50 years. This increasing trendis observed in all the Districts in the State.
6.5 Progress in female literacy
At National level, 65.46% of the female population is literate as per Provisional Population Totals of Census 2011. InAndhra Pradesh 59.74% of the female population is only literate and the State positioned at 29th rank .
Even though the female literacy is low in the State, keeping in view the negligible number of literate females account-ing for only 12.03% in 1961, one can say that the present status is not totally disappointing.
Census Years 1961 1971 1981 1991 2001 2011
Andhra Pradesh 12.03 15.75 24.16 32.72 50.4 59.74
Female Literacy Rate 1961-2011
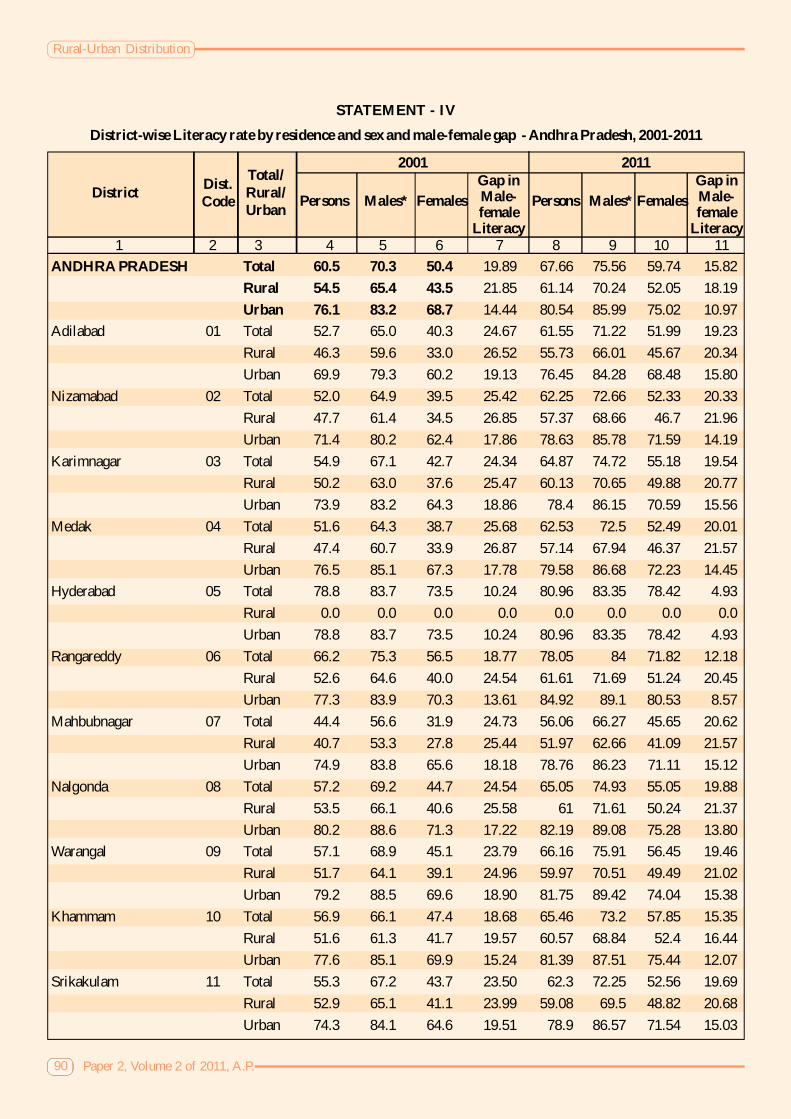
The female literaty at 12.03% in 1961 increased nearly 5 times to 59.74% in 2011, i.e, over a period of 50 years asagainst the corsponding increase in male literary from 30.19% to 75.56%. In the State the gap of 19.89 percentage pointsrecorded in male/female literacy rate in 2001 Census is reduced to 15.82 percentage points in 2011. Similarly the gap inrural area is 18.19 and that of urban area is 10.97 percentage points.
6.7 Literates and Illiterates by Gender in the State
Out of total 11,504,187 literates added during the decade, females (6,189,193) outnumbered males (5,314,994).Similarly in the total decrease of 1,519,490 illiterates, females (925,955) out number males (593,535). The above twochanges are clear indication of the fact that the gender gap in literacy is narrowing down in the state.
Rural-Urban Distribution
Paper 2, Volume 2 of 2011, A.P. 83
Top 5 - Rural
Dist. Code District Literacy Rate Rank
15 West Godavari 72.46 1
16 Krishna 68.98 2
14 East Godavari 67.97 3
23 Chittoor 67.86 4
19 Sri Potti Sriramulu Nellore 64.01 5
Bottom 5 - Rural
Dist. Code District Literacy Rate Rank
07 Mahbubnagar 51.97 22
12 Vizianagaram 54.35 21
13 Visakhapatnam 54.52 20
01 Adilabad 55.73 19
21 Kurnool 56.16 18
Top 5 - Urban
Dist. Code District Literacy Rate Rank
06 Rangareddy 84.92 1
23 Chittoor 83.03 2
08 Nalgonda 82.19 3
16 Krishna 82.09 4
13 Visakhapatnam 82.01 5
Bottom 5 - Urban
Dist. Code District Literacy Rate Rank
21 Kurnool 73.57 23
22 Anantapur 75.56 22
20 Y.S.R. 75.95 21
01 Adilabad 76.45 20
03 Karimnagar 78.4 19

Rural-Urban Distribution
Paper 2, Volume 2 of 2011, A.P.84
Rural-Urban Distribution
Paper 2, Volume 2 of 2011, A.P. 85
Rural-Urban Distribution
Paper 2, Volume 2 of 2011, A.P.86
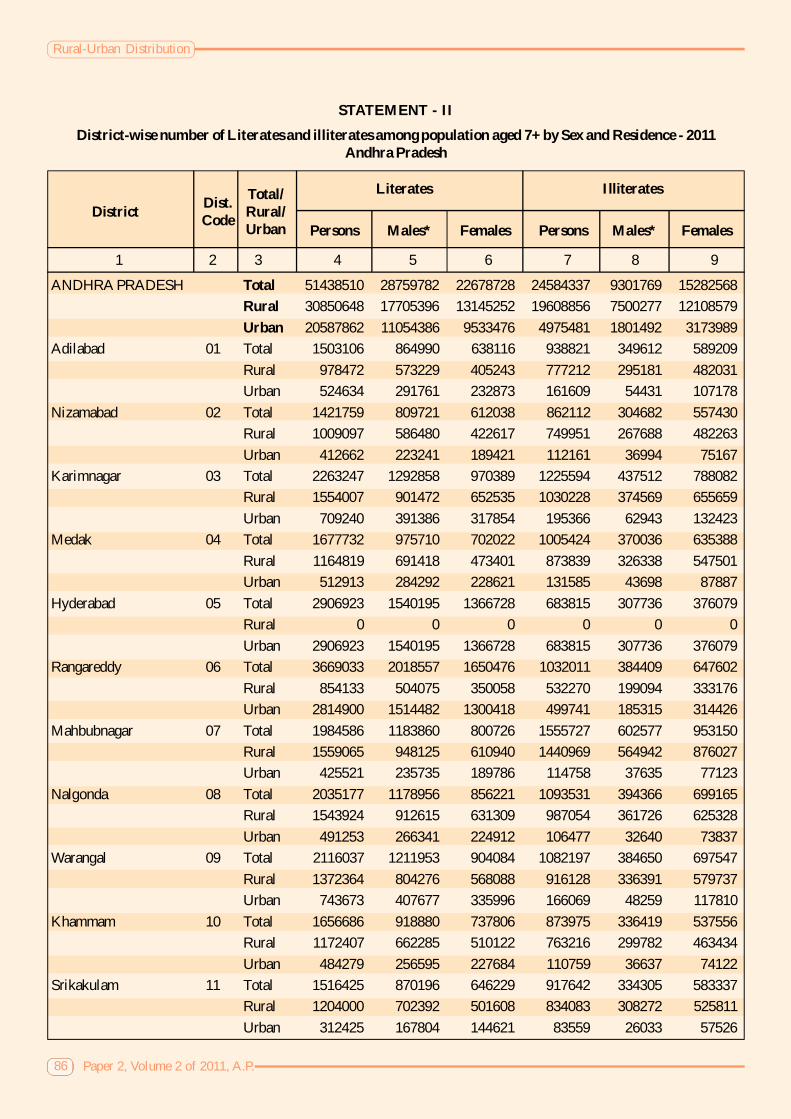
STATEMENT - II
District-wise number of Literates and illiterates among population aged 7+ by Sex and Residence - 2011Andhra Pradesh
ANDHRA PRADESH Total 51438510 28759782 22678728 24584337 9301769 15282568Rural 30850648 17705396 13145252 19608856 7500277 12108579Urban 20587862 11054386 9533476 4975481 1801492 3173989
Adilabad 01 Total 1503106 864990 638116 938821 349612 589209Rural 978472 573229 405243 777212 295181 482031Urban 524634 291761 232873 161609 54431 107178
Nizamabad 02 Total 1421759 809721 612038 862112 304682 557430Rural 1009097 586480 422617 749951 267688 482263Urban 412662 223241 189421 112161 36994 75167
Karimnagar 03 Total 2263247 1292858 970389 1225594 437512 788082Rural 1554007 901472 652535 1030228 374569 655659Urban 709240 391386 317854 195366 62943 132423
Medak 04 Total 1677732 975710 702022 1005424 370036 635388Rural 1164819 691418 473401 873839 326338 547501Urban 512913 284292 228621 131585 43698 87887
Hyderabad 05 Total 2906923 1540195 1366728 683815 307736 376079Rural 0 0 0 0 0 0Urban 2906923 1540195 1366728 683815 307736 376079
Rangareddy 06 Total 3669033 2018557 1650476 1032011 384409 647602Rural 854133 504075 350058 532270 199094 333176Urban 2814900 1514482 1300418 499741 185315 314426
Mahbubnagar 07 Total 1984586 1183860 800726 1555727 602577 953150Rural 1559065 948125 610940 1440969 564942 876027Urban 425521 235735 189786 114758 37635 77123
Nalgonda 08 Total 2035177 1178956 856221 1093531 394366 699165Rural 1543924 912615 631309 987054 361726 625328Urban 491253 266341 224912 106477 32640 73837
Warangal 09 Total 2116037 1211953 904084 1082197 384650 697547Rural 1372364 804276 568088 916128 336391 579737Urban 743673 407677 335996 166069 48259 117810
Khammam 10 Total 1656686 918880 737806 873975 336419 537556Rural 1172407 662285 510122 763216 299782 463434Urban 484279 256595 227684 110759 36637 74122
Srikakulam 11 Total 1516425 870196 646229 917642 334305 583337Rural 1204000 702392 501608 834083 308272 525811Urban 312425 167804 144621 83559 26033 57526
1 2 3 4 5 6 7 8 9
District Dist.Code
Total/Rural/Urban
Literates Illiterates
Persons Males* Females Persons Males* Females
Rural-Urban Distribution
Paper 2, Volume 2 of 2011, A.P. 87
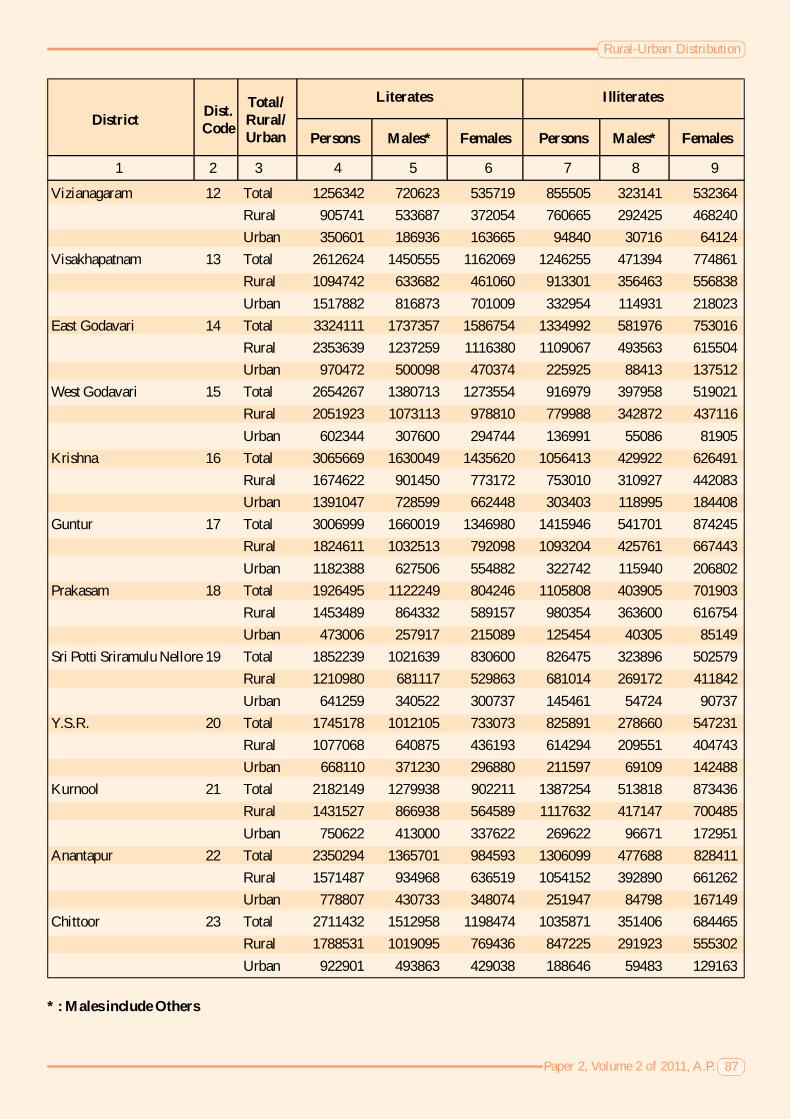
* : Males include Others
Vizianagaram 12 Total 1256342 720623 535719 855505 323141 532364Rural 905741 533687 372054 760665 292425 468240Urban 350601 186936 163665 94840 30716 64124
Visakhapatnam 13 Total 2612624 1450555 1162069 1246255 471394 774861Rural 1094742 633682 461060 913301 356463 556838Urban 1517882 816873 701009 332954 114931 218023
East Godavari 14 Total 3324111 1737357 1586754 1334992 581976 753016Rural 2353639 1237259 1116380 1109067 493563 615504Urban 970472 500098 470374 225925 88413 137512
West Godavari 15 Total 2654267 1380713 1273554 916979 397958 519021Rural 2051923 1073113 978810 779988 342872 437116Urban 602344 307600 294744 136991 55086 81905
Krishna 16 Total 3065669 1630049 1435620 1056413 429922 626491Rural 1674622 901450 773172 753010 310927 442083Urban 1391047 728599 662448 303403 118995 184408
Guntur 17 Total 3006999 1660019 1346980 1415946 541701 874245Rural 1824611 1032513 792098 1093204 425761 667443Urban 1182388 627506 554882 322742 115940 206802
Prakasam 18 Total 1926495 1122249 804246 1105808 403905 701903Rural 1453489 864332 589157 980354 363600 616754Urban 473006 257917 215089 125454 40305 85149
Sri Potti Sriramulu Nellore 19 Total 1852239 1021639 830600 826475 323896 502579Rural 1210980 681117 529863 681014 269172 411842Urban 641259 340522 300737 145461 54724 90737
Y.S.R. 20 Total 1745178 1012105 733073 825891 278660 547231Rural 1077068 640875 436193 614294 209551 404743Urban 668110 371230 296880 211597 69109 142488
Kurnool 21 Total 2182149 1279938 902211 1387254 513818 873436Rural 1431527 866938 564589 1117632 417147 700485Urban 750622 413000 337622 269622 96671 172951
Anantapur 22 Total 2350294 1365701 984593 1306099 477688 828411Rural 1571487 934968 636519 1054152 392890 661262Urban 778807 430733 348074 251947 84798 167149
Chittoor 23 Total 2711432 1512958 1198474 1035871 351406 684465Rural 1788531 1019095 769436 847225 291923 555302Urban 922901 493863 429038 188646 59483 129163
1 2 3 4 5 6 7 8 9
District Dist.Code
Total/Rural/Urban
Literates Illiterates
Persons Males* Females Persons Males* Females
Rural-Urban Distribution
Paper 2, Volume 2 of 2011, A.P.88
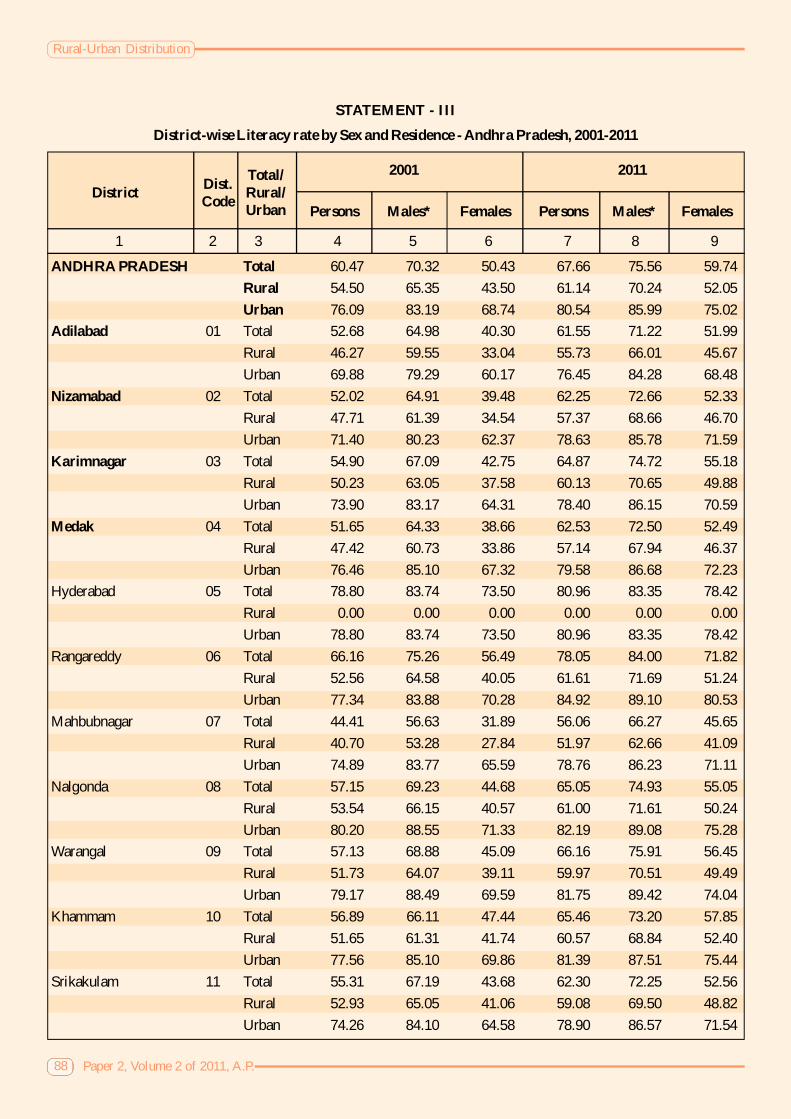
STATEMENT - III
District-wise Literacy rate by Sex and Residence - Andhra Pradesh, 2001-2011
ANDHRA PRADESH Total 60.47 70.32 50.43 67.66 75.56 59.74Rural 54.50 65.35 43.50 61.14 70.24 52.05Urban 76.09 83.19 68.74 80.54 85.99 75.02
Adilabad 01 Total 52.68 64.98 40.30 61.55 71.22 51.99Rural 46.27 59.55 33.04 55.73 66.01 45.67Urban 69.88 79.29 60.17 76.45 84.28 68.48
Nizamabad 02 Total 52.02 64.91 39.48 62.25 72.66 52.33Rural 47.71 61.39 34.54 57.37 68.66 46.70Urban 71.40 80.23 62.37 78.63 85.78 71.59
Karimnagar 03 Total 54.90 67.09 42.75 64.87 74.72 55.18Rural 50.23 63.05 37.58 60.13 70.65 49.88Urban 73.90 83.17 64.31 78.40 86.15 70.59
Medak 04 Total 51.65 64.33 38.66 62.53 72.50 52.49Rural 47.42 60.73 33.86 57.14 67.94 46.37Urban 76.46 85.10 67.32 79.58 86.68 72.23
Hyderabad 05 Total 78.80 83.74 73.50 80.96 83.35 78.42Rural 0.00 0.00 0.00 0.00 0.00 0.00Urban 78.80 83.74 73.50 80.96 83.35 78.42
Rangareddy 06 Total 66.16 75.26 56.49 78.05 84.00 71.82Rural 52.56 64.58 40.05 61.61 71.69 51.24Urban 77.34 83.88 70.28 84.92 89.10 80.53
Mahbubnagar 07 Total 44.41 56.63 31.89 56.06 66.27 45.65Rural 40.70 53.28 27.84 51.97 62.66 41.09Urban 74.89 83.77 65.59 78.76 86.23 71.11
Nalgonda 08 Total 57.15 69.23 44.68 65.05 74.93 55.05Rural 53.54 66.15 40.57 61.00 71.61 50.24Urban 80.20 88.55 71.33 82.19 89.08 75.28
Warangal 09 Total 57.13 68.88 45.09 66.16 75.91 56.45Rural 51.73 64.07 39.11 59.97 70.51 49.49Urban 79.17 88.49 69.59 81.75 89.42 74.04
Khammam 10 Total 56.89 66.11 47.44 65.46 73.20 57.85Rural 51.65 61.31 41.74 60.57 68.84 52.40Urban 77.56 85.10 69.86 81.39 87.51 75.44
Srikakulam 11 Total 55.31 67.19 43.68 62.30 72.25 52.56Rural 52.93 65.05 41.06 59.08 69.50 48.82Urban 74.26 84.10 64.58 78.90 86.57 71.54
1 2 3 4 5 6 7 8 9
District Dist.Code
Total/Rural/Urban
2001 2011
Persons Males* Females Persons Males* Females
Rural-Urban Distribution
Paper 2, Volume 2 of 2011, A.P. 89
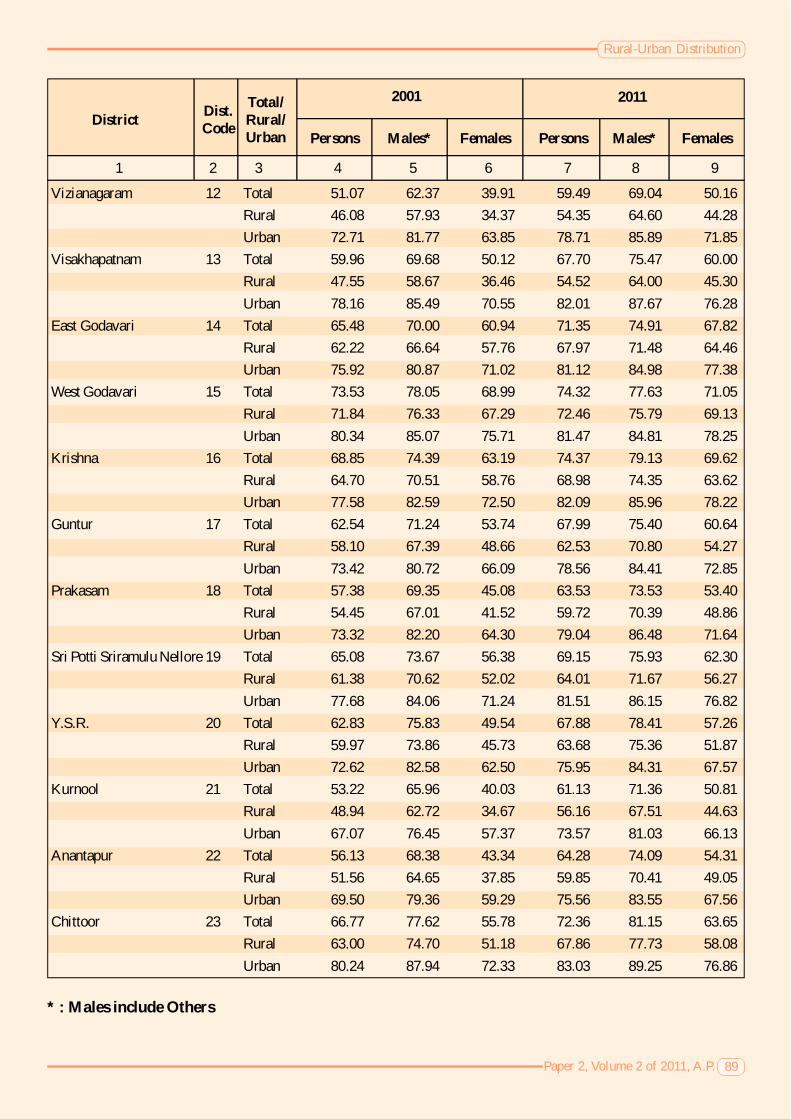
* : Males include Others
Vizianagaram 12 Total 51.07 62.37 39.91 59.49 69.04 50.16Rural 46.08 57.93 34.37 54.35 64.60 44.28Urban 72.71 81.77 63.85 78.71 85.89 71.85
Visakhapatnam 13 Total 59.96 69.68 50.12 67.70 75.47 60.00Rural 47.55 58.67 36.46 54.52 64.00 45.30Urban 78.16 85.49 70.55 82.01 87.67 76.28
East Godavari 14 Total 65.48 70.00 60.94 71.35 74.91 67.82Rural 62.22 66.64 57.76 67.97 71.48 64.46Urban 75.92 80.87 71.02 81.12 84.98 77.38
West Godavari 15 Total 73.53 78.05 68.99 74.32 77.63 71.05Rural 71.84 76.33 67.29 72.46 75.79 69.13Urban 80.34 85.07 75.71 81.47 84.81 78.25
Krishna 16 Total 68.85 74.39 63.19 74.37 79.13 69.62Rural 64.70 70.51 58.76 68.98 74.35 63.62Urban 77.58 82.59 72.50 82.09 85.96 78.22
Guntur 17 Total 62.54 71.24 53.74 67.99 75.40 60.64Rural 58.10 67.39 48.66 62.53 70.80 54.27Urban 73.42 80.72 66.09 78.56 84.41 72.85
Prakasam 18 Total 57.38 69.35 45.08 63.53 73.53 53.40Rural 54.45 67.01 41.52 59.72 70.39 48.86Urban 73.32 82.20 64.30 79.04 86.48 71.64
Sri Potti Sriramulu Nellore 19 Total 65.08 73.67 56.38 69.15 75.93 62.30Rural 61.38 70.62 52.02 64.01 71.67 56.27Urban 77.68 84.06 71.24 81.51 86.15 76.82
Y.S.R. 20 Total 62.83 75.83 49.54 67.88 78.41 57.26Rural 59.97 73.86 45.73 63.68 75.36 51.87Urban 72.62 82.58 62.50 75.95 84.31 67.57
Kurnool 21 Total 53.22 65.96 40.03 61.13 71.36 50.81Rural 48.94 62.72 34.67 56.16 67.51 44.63Urban 67.07 76.45 57.37 73.57 81.03 66.13
Anantapur 22 Total 56.13 68.38 43.34 64.28 74.09 54.31Rural 51.56 64.65 37.85 59.85 70.41 49.05Urban 69.50 79.36 59.29 75.56 83.55 67.56
Chittoor 23 Total 66.77 77.62 55.78 72.36 81.15 63.65Rural 63.00 74.70 51.18 67.86 77.73 58.08Urban 80.24 87.94 72.33 83.03 89.25 76.86
1 2 3 4 5 6 7 8 9
District Dist.Code
Total/Rural/Urban
2011
Persons Males* Females Persons Males* Females
2001
Rural-Urban Distribution
Paper 2, Volume 2 of 2011, A.P.90
STATEMENT - IV
District-wise Literacy rate by residence and sex and male-female gap - Andhra Pradesh, 2001-2011
ANDHRA PRADESH Total 60.5 70.3 50.4 19.89 67.66 75.56 59.74 15.82Rural 54.5 65.4 43.5 21.85 61.14 70.24 52.05 18.19Urban 76.1 83.2 68.7 14.44 80.54 85.99 75.02 10.97
Adilabad 01 Total 52.7 65.0 40.3 24.67 61.55 71.22 51.99 19.23Rural 46.3 59.6 33.0 26.52 55.73 66.01 45.67 20.34Urban 69.9 79.3 60.2 19.13 76.45 84.28 68.48 15.80
Nizamabad 02 Total 52.0 64.9 39.5 25.42 62.25 72.66 52.33 20.33Rural 47.7 61.4 34.5 26.85 57.37 68.66 46.7 21.96Urban 71.4 80.2 62.4 17.86 78.63 85.78 71.59 14.19
Karimnagar 03 Total 54.9 67.1 42.7 24.34 64.87 74.72 55.18 19.54Rural 50.2 63.0 37.6 25.47 60.13 70.65 49.88 20.77Urban 73.9 83.2 64.3 18.86 78.4 86.15 70.59 15.56
Medak 04 Total 51.6 64.3 38.7 25.68 62.53 72.5 52.49 20.01Rural 47.4 60.7 33.9 26.87 57.14 67.94 46.37 21.57Urban 76.5 85.1 67.3 17.78 79.58 86.68 72.23 14.45
Hyderabad 05 Total 78.8 83.7 73.5 10.24 80.96 83.35 78.42 4.93Rural 0.0 0.0 0.0 0.0 0.0 0.0 0.0 0.0Urban 78.8 83.7 73.5 10.24 80.96 83.35 78.42 4.93
Rangareddy 06 Total 66.2 75.3 56.5 18.77 78.05 84 71.82 12.18Rural 52.6 64.6 40.0 24.54 61.61 71.69 51.24 20.45Urban 77.3 83.9 70.3 13.61 84.92 89.1 80.53 8.57
Mahbubnagar 07 Total 44.4 56.6 31.9 24.73 56.06 66.27 45.65 20.62Rural 40.7 53.3 27.8 25.44 51.97 62.66 41.09 21.57Urban 74.9 83.8 65.6 18.18 78.76 86.23 71.11 15.12
Nalgonda 08 Total 57.2 69.2 44.7 24.54 65.05 74.93 55.05 19.88Rural 53.5 66.1 40.6 25.58 61 71.61 50.24 21.37Urban 80.2 88.6 71.3 17.22 82.19 89.08 75.28 13.80
Warangal 09 Total 57.1 68.9 45.1 23.79 66.16 75.91 56.45 19.46Rural 51.7 64.1 39.1 24.96 59.97 70.51 49.49 21.02Urban 79.2 88.5 69.6 18.90 81.75 89.42 74.04 15.38
Khammam 10 Total 56.9 66.1 47.4 18.68 65.46 73.2 57.85 15.35Rural 51.6 61.3 41.7 19.57 60.57 68.84 52.4 16.44Urban 77.6 85.1 69.9 15.24 81.39 87.51 75.44 12.07
Srikakulam 11 Total 55.3 67.2 43.7 23.50 62.3 72.25 52.56 19.69Rural 52.9 65.1 41.1 23.99 59.08 69.5 48.82 20.68Urban 74.3 84.1 64.6 19.51 78.9 86.57 71.54 15.03
1 2 3 4 5 6 7 8 9 10 11
District Dist.Code
Total/Rural/Urban Persons FemalesMales*
2001Gap inMale-female
Literacy
2011
Persons FemalesMales*Gap inMale-female
Literacy

Rural-Urban Distribution
Paper 2, Volume 2 of 2011, A.P. 91
* : Males include Others
Vizianagaram 12 Total 51.1 62.4 39.9 22.46 59.49 69.04 50.16 18.88Rural 46.1 57.9 34.4 23.56 54.35 64.6 44.28 20.32Urban 72.7 81.8 63.8 17.93 78.71 85.89 71.85 14.04
Visakhapatnam 13 Total 60.0 69.7 50.1 19.56 67.7 75.47 60 15.47Rural 47.5 58.7 36.5 22.22 54.52 64 45.3 18.70Urban 78.2 85.5 70.6 14.93 82.01 87.67 76.28 11.39
East Godavari 14 Total 65.5 70.0 60.9 9.06 71.35 74.91 67.82 7.09Rural 62.2 66.6 57.8 8.87 67.97 71.48 64.46 7.02Urban 75.9 80.9 71.0 9.85 81.12 84.98 77.38 7.60
West Godavari 15 Total 73.5 78.0 69.0 9.05 74.32 77.63 71.05 6.58Rural 71.8 76.3 67.3 9.04 72.46 75.79 69.13 6.66Urban 80.3 85.1 75.7 9.36 81.47 84.81 78.25 6.56
Krishna 16 Total 68.8 74.4 63.2 11.20 74.37 79.13 69.62 9.51Rural 64.7 70.5 58.8 11.75 68.98 74.35 63.62 10.73Urban 77.6 82.6 72.5 10.09 82.09 85.96 78.22 7.74
Guntur 17 Total 62.5 71.2 53.7 17.51 67.99 75.4 60.64 14.76Rural 58.1 67.4 48.7 18.73 62.53 70.8 54.27 16.53Urban 73.4 80.7 66.1 14.63 78.56 84.41 72.85 11.56
Prakasam 18 Total 57.4 69.4 45.1 24.27 63.53 73.53 53.4 20.13Rural 54.5 67.0 41.5 25.49 59.72 70.39 48.86 21.53Urban 73.3 82.2 64.3 17.89 79.04 86.48 71.64 14.84
Sri Potti Sriramulu Nellore 19 Total 65.1 73.7 56.4 17.28 69.15 75.93 62.3 13.63Rural 61.4 70.6 52.0 18.60 64.01 71.67 56.27 15.40Urban 77.7 84.1 71.2 12.82 81.51 86.15 76.82 9.33
Y.S.R. 20 Total 62.8 75.8 49.5 26.29 67.88 78.41 57.26 21.15Rural 60.0 73.9 45.7 28.13 63.68 75.36 51.87 23.49Urban 72.6 82.6 62.5 20.08 75.95 84.31 67.57 16.74
Kurnool 21 Total 53.2 66.0 40.0 25.93 61.13 71.36 50.81 20.55Rural 48.9 62.7 34.7 28.05 56.16 67.51 44.63 22.88Urban 67.1 76.5 57.4 19.08 73.57 81.03 66.13 14.90
Anantapur 22 Total 56.1 68.4 43.3 25.04 64.28 74.09 54.31 19.78Rural 51.6 64.6 37.9 26.79 59.85 70.41 49.05 21.36Urban 69.5 79.4 59.3 20.07 75.56 83.55 67.56 15.99
Chittoor 23 Total 66.8 77.6 55.8 21.84 72.36 81.15 63.65 17.50Rural 63.0 74.7 51.2 23.52 67.86 77.73 58.08 19.65Urban 80.2 87.9 72.3 15.61 83.03 89.25 76.86 12.39
1 2 3 4 5 6 7 8 9 10 11
District Dist.Code
Total/Rural/Urban Persons FemalesMales*
LiteratesGap inMale-female
Literacy
Literates
Persons FemalesMales*Gap inMale-female
Literacy
Rural-Urban Distribution
Paper 2, Volume 2 of 2011, A.P.92
Rural-Urban Distribution
Paper 2, Volume 2 of 2011, A.P. 93
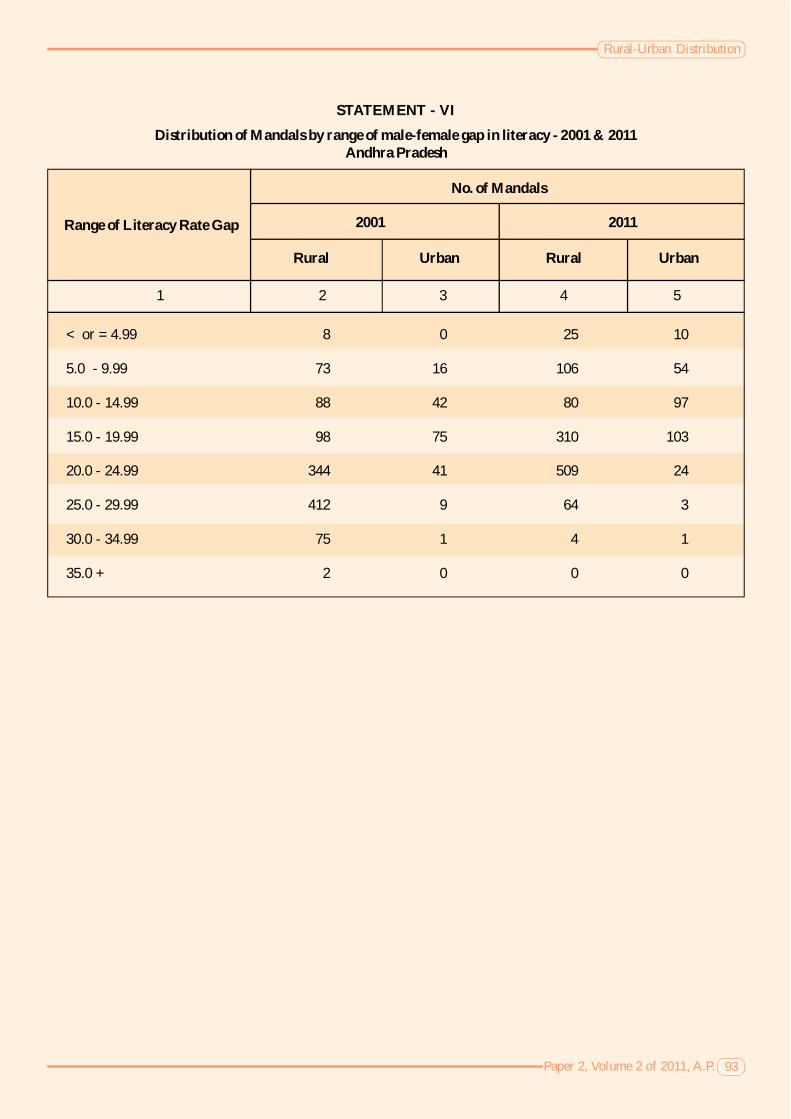
STATEMENT - VI
Distribution of Mandals by range of male-female gap in literacy - 2001 & 2011Andhra Pradesh
1 2 3 4 5
Range of Literacy Rate Gap 2001
< or = 4.99 8 0 25 10
5.0 - 9.99 73 16 106 54
10.0 - 14.99 88 42 80 97
15.0 - 19.99 98 75 310 103
20.0 - 24.99 344 41 509 24
25.0 - 29.99 412 9 64 3
30.0 - 34.99 75 1 4 1
35.0 + 2 0 0 0
No. of Mandals
2011
Rural Urban Rural Urban
Rural-Urban Distribution
Paper 2, Volume 2 of 2011, A.P.94
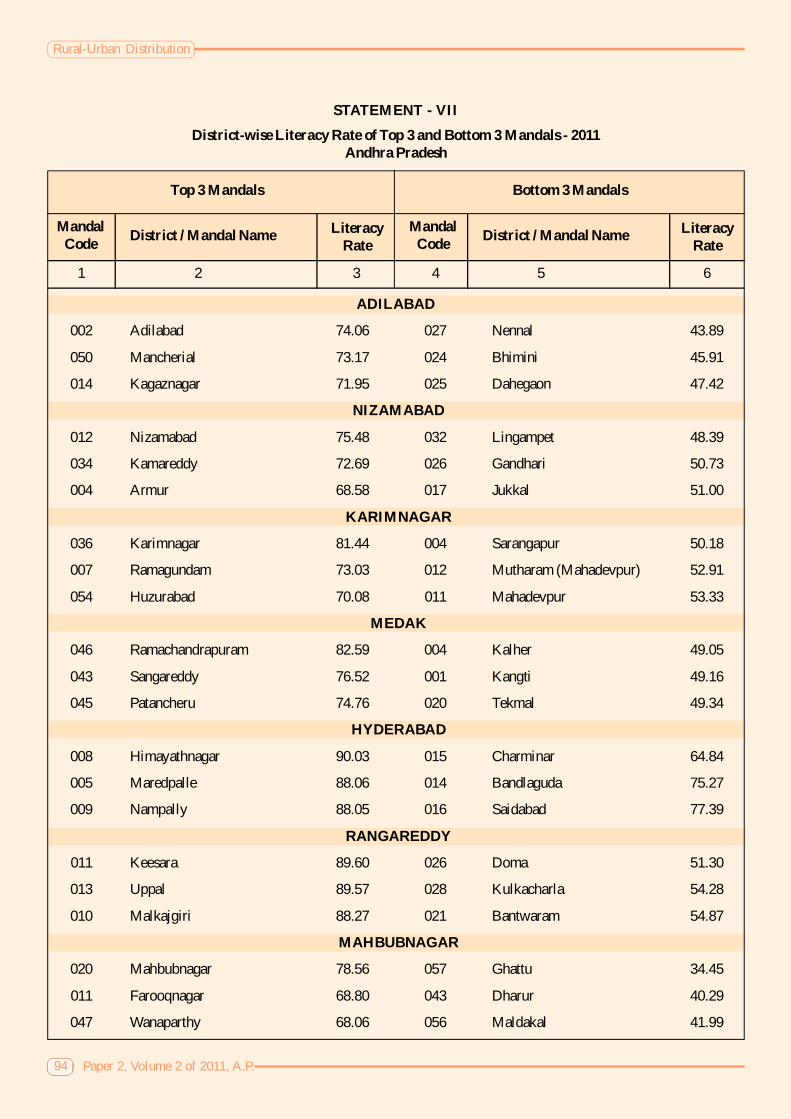
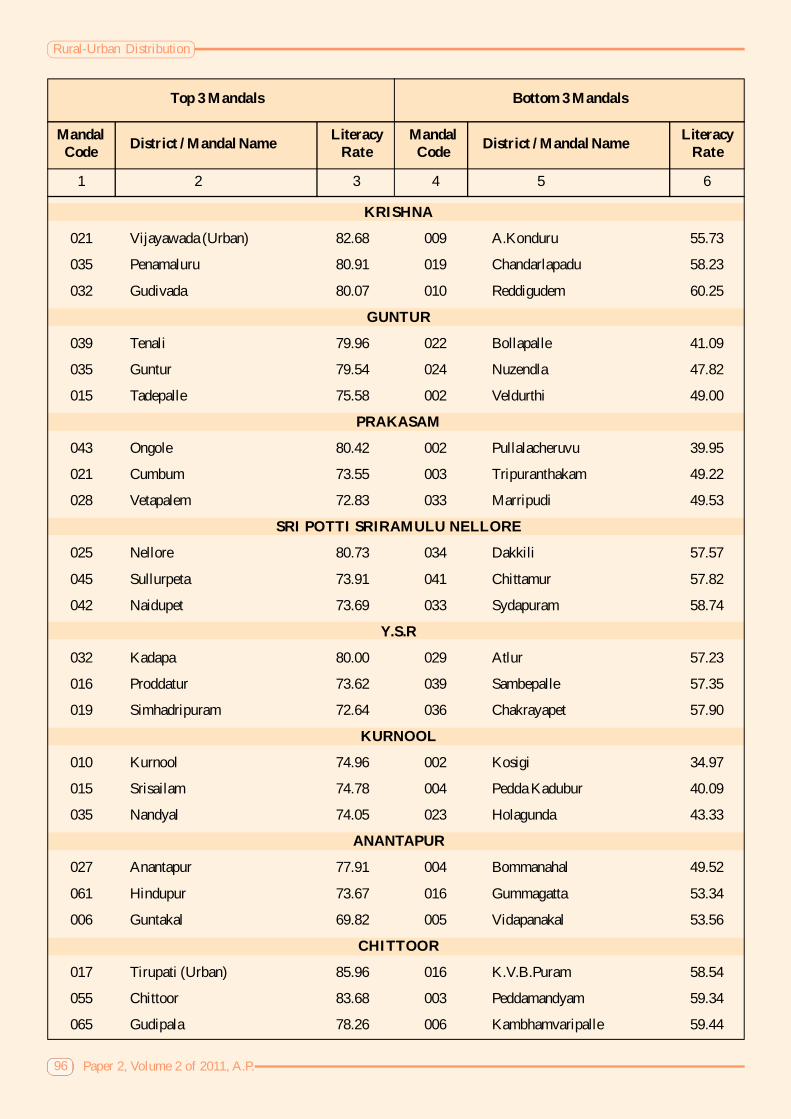
STATEMENT - VII
District-wise Literacy Rate of Top 3 and Bottom 3 Mandals - 2011Andhra Pradesh
1 2 3 4 5 6
MandalCode District / Mandal Name
Top 3 Mandals
ADILABAD
002 Adilabad 74.06 027 Nennal 43.89
050 Mancherial 73.17 024 Bhimini 45.91
014 Kagaznagar 71.95 025 Dahegaon 47.42
NIZAMABAD
012 Nizamabad 75.48 032 Lingampet 48.39
034 Kamareddy 72.69 026 Gandhari 50.73
004 Armur 68.58 017 Jukkal 51.00
KARIMNAGAR
036 Karimnagar 81.44 004 Sarangapur 50.18
007 Ramagundam 73.03 012 Mutharam (Mahadevpur) 52.91
054 Huzurabad 70.08 011 Mahadevpur 53.33
MEDAK
046 Ramachandrapuram 82.59 004 Kalher 49.05
043 Sangareddy 76.52 001 Kangti 49.16
045 Patancheru 74.76 020 Tekmal 49.34
HYDERABAD
008 Himayathnagar 90.03 015 Charminar 64.84
005 Maredpalle 88.06 014 Bandlaguda 75.27
009 Nampally 88.05 016 Saidabad 77.39
RANGAREDDY
011 Keesara 89.60 026 Doma 51.30
013 Uppal 89.57 028 Kulkacharla 54.28
010 Malkajgiri 88.27 021 Bantwaram 54.87
MAHBUBNAGAR
020 Mahbubnagar 78.56 057 Ghattu 34.45
011 Farooqnagar 68.80 043 Dharur 40.29
047 Wanaparthy 68.06 056 Maldakal 41.99
Bottom 3 Mandals
LiteracyRate
MandalCode District / Mandal Name Literacy
Rate

Rural-Urban Distribution
Paper 2, Volume 2 of 2011, A.P. 95
1 2 3 4 5 6
MandalCode District / Mandal Name
Top 3 Mandals
NALGONDA
034 Nalgonda 80.03 040 Chandam Pet 51.37
026 Suryapet 76.56 042 Nampalle 53.34
052 Miryalaguda 73.88 046 Pedda Adiserla Palle 53.47
WARANGAL
024 Hanamkonda 83.85 040 Gudur 53.07
035 Warangal 81.31 050 Kuravi 55.55
028 Jangaon 73.70 030 Devaruppula 55.86
KHAMMAM
035 Khammam (Urban) 78.66 010 Chintur 44.14
016 Kothagudem 75.97 012 Velairpadu 51.14
005 Manuguru 73.78 009 Kunavaram 54.15
SRIKAKULAM
034 Srikakulam 77.34 002 Seethampeta 49.63
007 Palasa 70.75 037 Ranastalam 52.59
030 Amadalavalasa 70.27 018 Regidi Amadalavalasa 53.07
VIZIANAGARAM
030 Vizianagaram 78.04 012 Pachipenta 45.00
006 Parvathipuram 67.52 018 Mentada 46.33
028 Kothavalasa 66.66 017 Dattirajeru 49.39
VISAKHAPATNAM
027 Visakhapatnam (Urban) 83.70 008 G.Madugula 39.58
029 Gajuwaka 83.28 001 Munchingi Puttu 39.69
026 Visakhapatnam (Rural) 81.15 005 Ananthagiri 39.72
EAST GODAVARI
058 Amalapuram 84.34 003 Y. Ramavaram 44.69
023 Rajahmundry (Urban) 84.28 008 Rowthulapudi 51.60
054 Razole 83.11 011 Gangavaram 53.49
WEST GODAVARI
045 Palacole 82.89 003 T.Narasapuram 62.39
029 Tanuku 82.06 008 Gopalapuram 67.11
035 Penumantra 80.36 009 Koyyalagudem 67.17
Bottom 3 Mandals
LiteracyRate
MandalCode District / Mandal Name Literacy
Rate
Rural-Urban Distribution
Paper 2, Volume 2 of 2011, A.P.96
1 2 3 4 5 6
MandalCode District / Mandal Name
Top 3 Mandals
KRISHNA
021 Vijayawada (Urban) 82.68 009 A.Konduru 55.73
035 Penamaluru 80.91 019 Chandarlapadu 58.23
032 Gudivada 80.07 010 Reddigudem 60.25
GUNTUR
039 Tenali 79.96 022 Bollapalle 41.09
035 Guntur 79.54 024 Nuzendla 47.82
015 Tadepalle 75.58 002 Veldurthi 49.00
PRAKASAM
043 Ongole 80.42 002 Pullalacheruvu 39.95
021 Cumbum 73.55 003 Tripuranthakam 49.22
028 Vetapalem 72.83 033 Marripudi 49.53
SRI POTTI SRIRAMULU NELLORE
025 Nellore 80.73 034 Dakkili 57.57
045 Sullurpeta 73.91 041 Chittamur 57.82
042 Naidupet 73.69 033 Sydapuram 58.74
Y.S.R
032 Kadapa 80.00 029 Atlur 57.23
016 Proddatur 73.62 039 Sambepalle 57.35
019 Simhadripuram 72.64 036 Chakrayapet 57.90
KURNOOL
010 Kurnool 74.96 002 Kosigi 34.97
015 Srisailam 74.78 004 Pedda Kadubur 40.09
035 Nandyal 74.05 023 Holagunda 43.33
ANANTAPUR
027 Anantapur 77.91 004 Bommanahal 49.52
061 Hindupur 73.67 016 Gummagatta 53.34
006 Guntakal 69.82 005 Vidapanakal 53.56
CHITTOOR
017 Tirupati (Urban) 85.96 016 K.V.B.Puram 58.54
055 Chittoor 83.68 003 Peddamandyam 59.34
065 Gudipala 78.26 006 Kambhamvaripalle 59.44
Bottom 3 Mandals
LiteracyRate
MandalCode District / Mandal Name Literacy
Rate