Embed Size (px)
Citation preview
C H A P T E R T W O
Voltage- and Current-Clamp Methods
for Determination of Planar Lipid
Bilayer Properties
Peter Kramar,1 Damijan Miklavcic,1 Malgorzata Kotulska,2
and Alenka Macek Lebar1,*
Contents
1. Introduction 30
2. Measurement Systems 32
2.1. Voltage Clamp 33
2.2. Current Clamp 46
3. Methods for Determination of Planar Lipid Bilayer Properties 49
3.1. Capacitance (C) 49
3.2. Resistance (R) 53
3.3. Breakdown Voltage (Ubr) 54
3.4. Fluctuations (c) 57
3.5. Other Physical Properties 58
4. Conclusions 60
References 66
Abstract
Biological membranes, the barriers that envelope the cell and its inner organelles,
play a crucial role in the normal functioning of cells. The simplest model of these
biological membranes is the planar lipid bilayer. Because its geometry allows
chemical and electrical access to both sides of the bilayer, the physical properties
of this model membrane can be easily measured. Usually, a thin bimolecular film
composed of specified phospholipids and organic solvent is formed on a small
aperture in a hydrophobic partition separating two compartments containing
aqueous solutions. From the electrical point of view, a planar lipid bilayer can be
considered as an imperfect capacitor; therefore, two electrical properties,
Advances in Planar Lipid Bilayers and Liposomes, Volume 11 # 2010 Elsevier Inc.
ISSN 1554-4516, DOI: 10.1016/S1554-4516(10)11002-3 All rights reserved.
1 Faculty of Electrical Engineering, University of Ljubljana, Ljubljana, Slovenia2 Institute of Biomedical Engineering and Instrumentation, Wroclaw University of Technology,Wroclaw, Poland
* Corresponding author: Tel.: þ386 1 4768 770; Fax: þ386 1 4264 658E-mail address: [email protected]
29
capacitance (C) and resistance (R), determine most of its behavior. Electrodes
placed in theaqueous compartments oneach sideof theplanar lipid bilayer permit
the measurement of current and voltage across the model membrane. The two
measuring techniques most commonly used to measure the properties of planar
lipid bilayers are voltage-clamp methods and current-clamp methods.
The focus of this chapter is to review measurement systems and methods for
the determination of the physical properties of planar lipid bilayers.
1. Introduction
Biological membranes, the barriers that envelope the cell and its innerorganelles, play an important role in normal functioning of the cells. Themembranes maintain crucial concentration gradients by acting as a selectivefilter for water-soluble ions and molecules [1]. Although biological mem-branes are composed of lipids, proteins, and small amounts of carbohydrates,the barrier function is assured by the thin layer of amphipathic phospholipids,which in polar liquid environments spontaneously arranges in various formsof lipid bilayers. A basic understanding of the properties and functioning ofbiological membranes can be obtained by investigating model systems, such asartificial liposomes or vesicles, which mimic the geometry and size of cellmembranes, but are void of ion channels and the multitude of other embed-ded components commonly present in cells. The artificial planar bilayer lipidmembrane (BLM) is the simplest model of a lipid system. It is usually formedacross a small hole in a hydrophobic partition that separates two compart-ments filled with aqueous solutions. The advantage of the BLM is that bothsides of the membrane can be easily altered and probed by electrodes.
Two methods of BLM formation are in common use. In one technique,the BLM is created by spreading a solution of lipids dissolved in an organicsolvent. This method was introduced by Mueller and colleagues [2] and isnamed the painting technique. Both compartments of the chamber are filledwith salt solutions and a dispersion of lipids is drawn across the hole in thepartition separating them using a small paintbrush or a plastic rod. Thecluster of lipids thins out in the center of the hole spontaneously forming abilayer (Fig. 1). In the other procedure, the bilayer is formed from theapposition of two lipid monolayers [3]. A lipid solution in a volatile solventis spread on the water–air interface of each compartment. Evaporation ofthe solvent creates a monolayer on the surface of the aqueous solution.When the monolayer formation is completed the water level in bothcompartments is raised above the hole and the bilayer is formed (Fig. 2).
A number of techniques have been developed to allow investigations ofthe functions and physical properties of these thin and fragile structures.Electrical measurements are a straightforward way to characterize the barrier
30 P. Kramar et al.

function of a bilayer—its ability to prevent the flow of ions. From anelectrical point of view, a planar lipid bilayer can be easily imagined as animperfect capacitor, which means that the capacitance (C) has a finiteparallel resistance (R). The typical resistance is very high since the hydro-phobic core is impermeable to any charged species, and it is called a gigaseal.But the resistance drops dramatically even if a few nanometer-sized holesare present in a lipid bilayer. Formation of pores can be induced by a strongelectric field externally applied to the BLM, and electrical measurementspermit determination of BLM breakdown voltage (Ubr). The electricalproperties of the BLM are dependent on the physical properties of the lipidsthat compose the bilayer. Elasticity modulus and surface tension, for example,can be calculated from the electrical characteristics of the BLM.
Two electrical measurement methods are common (Fig. 3): the voltage-clamp method and the current-clamp method. When the voltage-clampmethod is used, a voltage signal is applied to the planar lipid bilayer: astep change [4], pulse [5–7], linear rising [8], or some other shape of the
A B C
t (min)
Figure 1 Planar lipid bilayer formation by the painted technique [2]. (A) Lipid mole-cules are painted on the aperture by pipette or brush. (B) The cluster of lipid moleculeson the aperture. Lipid molecules are slowly spreading across the aperture. Nonusedlipid molecules flow to the water solution surface. (C) Planar lipid bilayer is formed onthe hole by thinning process.
A B C
t (s)
Figure 2 The folding method [3]. (A) Layer of lipid molecules on the salt solution.(B) The levels of the salt solution are slowly raised above the hole. (C) Planar lipidbilayer is formed on the hole.
Voltage- and Current-Clamp of Planar Lipid Bilayer 31
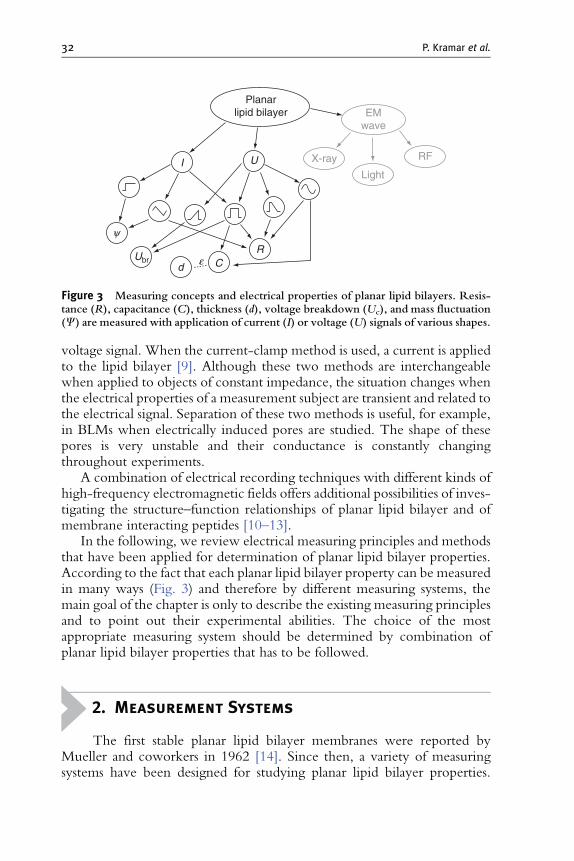
voltage signal. When the current-clamp method is used, a current is appliedto the lipid bilayer [9]. Although these two methods are interchangeablewhen applied to objects of constant impedance, the situation changes whenthe electrical properties of a measurement subject are transient and related tothe electrical signal. Separation of these two methods is useful, for example,in BLMs when electrically induced pores are studied. The shape of thesepores is very unstable and their conductance is constantly changingthroughout experiments.
A combination of electrical recording techniques with different kinds ofhigh-frequency electromagnetic fields offers additional possibilities of inves-tigating the structure–function relationships of planar lipid bilayer and ofmembrane interacting peptides [10–13].
In the following, we review electrical measuring principles and methodsthat have been applied for determination of planar lipid bilayer properties.According to the fact that each planar lipid bilayer property can be measuredin many ways (Fig. 3) and therefore by different measuring systems, themain goal of the chapter is only to describe the existing measuring principlesand to point out their experimental abilities. The choice of the mostappropriate measuring system should be determined by combination ofplanar lipid bilayer properties that has to be followed.
2. Measurement Systems
The first stable planar lipid bilayer membranes were reported byMueller and coworkers in 1962 [14]. Since then, a variety of measuringsystems have been designed for studying planar lipid bilayer properties.
Planarlipid bilayer EM
wave
X-ray
Light
RFI U
RCd
Ubr
y
e
Figure 3 Measuring concepts and electrical properties of planar lipid bilayers. Resis-tance (R), capacitance (C), thickness (d), voltage breakdown (Uc), and mass fluctuation(C) are measured with application of current (I) or voltage (U) signals of various shapes.
32 P. Kramar et al.

Measuring principles have been improved during the years, as well as thelipid chambers and measurement instrument accuracies. This review ofmeasuring systems is divided into two parts according to the nature of thestimulus—voltage or current. Some basic characteristics of the systems, suchas type of stimulating signal, number and material of electrodes volume ofthe chamber, etc., are given in Appendix A.
2.1. Voltage Clamp
2.1.1. System Hanai–Haydon–TaylorThe system was published in 1964 [15]. Within this system, DC and ACsignals were applied to a planar lipid bilayer (Fig. 4). The DC signal wassupplied by an accumulator. The voltage was controlled by a potentiometer.The current and resistance measurements were taken by electrometer.In the AC measurements, the capacitance and conductance were measuredby two bridges, the Universal Bridge and Radio Frequency Bridge, whichwere designed on the basis of the transformer ratio-arm principle. Theaccuracy of the measurements was generally better than 1%. Two signalgenerators covering the ranges 50 Hz–100 kHz and 100 kHz–5 MHz wereused, calibrated against standard frequencies. The bridge balance wasdetected with an oscilloscope with a preamplifier and a communicationsreceiver. Two Ag–AgCl electrodes for DC measurements and two blackplatinum electrodes for AC measurements were immersed in salt solution.
Electrometer
Planarlipid bilayer
Planarlipid bilayer
Glasschamber
Glasschamber
Pt−Pt electrodes
Bridge
RF
RF bridge
Teflon pot
Teflon potAg−AgCl electrodes
A B
Figure 4 System Hanai–Haydon–Taylor. The figure was drawn according to descrip-tion in Ref. [15].
Voltage- and Current-Clamp of Planar Lipid Bilayer 33

The chamber had outer and inner parts. The outer part was made of glasscell from tubing of 4 cm � 4 cm bore. The inner part was made out ofTeflon rod. The aperture for planar lipid bilayer was about 0.141 cm indiameter made by punching. The thickness of Teflon around the aperturewas about 0.05 cm. The whole chamber was enclosed in a double-walledbox for temperature stabilization by a water shell. The temperature duringexperiments was controlled with an accuracy of �0.5 �C. Planar lipidbilayer was formed by the painted technique with a small brush.
The system was applied to quantitative assessment of the BLM molecularcomposition. Membrane thickness was obtained from the capacitance mea-surements that were obtained by a capacitance to voltage conversion method.
2.1.2. System Rosen–SuttonThe system was first published in 1968 [16]. Its main part was an AC signalgenerator with amplitude of 5 mV and frequency range from 100 Hz to2 MHz (Fig. 5). Electrodes were connected to the transformer ratio-armbridge. The bridge was initially balanced at a given planar lipid bilayercapacitance, which allowed DC potential to be applied between the electro-des during the AC measurements. The amplitudes of the DC potentials wereup to 200 mV. An oscilloscope monitored Lassajous figures to permit obser-vation of the conductance and capacitance contribution. The AC signal wasapplied through the bridge to planar lipid bilayer and to X channel of theoscilloscope. The planar lipid bilayer response was traced on Y channel. Fourelectrodes were immersed in salt solution. TwoCalomel electrodes were usedfor measurement of transmembrane voltage by electrometer while voltagesignal was delivered by two platinum electrodes. The planar lipid bilayer waspainted across a round hole of about 1 mm in diameter.
Electro-meter
Electro-meter
Signalgenerator
Oscillo-scope
Phasedetector
X–Yplotter
Planarlipid bilayer
Calomel electrodesPlatinum electrodes
Voltagesource
Bridge
Figure 5 System Rosen–Sutton [16].
34 P. Kramar et al.
The system was applied to study an influence of the temperature andconcentration of the salt solution on the electrical parameters of planar lipidbilayer [16].
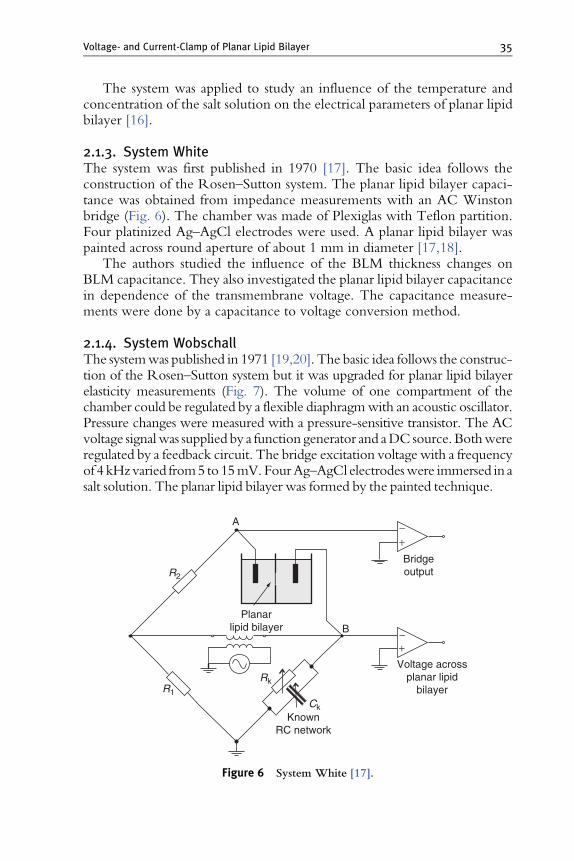
2.1.3. System WhiteThe system was first published in 1970 [17]. The basic idea follows theconstruction of the Rosen–Sutton system. The planar lipid bilayer capaci-tance was obtained from impedance measurements with an AC Winstonbridge (Fig. 6). The chamber was made of Plexiglas with Teflon partition.Four platinized Ag–AgCl electrodes were used. A planar lipid bilayer waspainted across round aperture of about 1 mm in diameter [17,18].
The authors studied the influence of the BLM thickness changes onBLM capacitance. They also investigated the planar lipid bilayer capacitancein dependence of the transmembrane voltage. The capacitance measure-ments were done by a capacitance to voltage conversion method.
2.1.4. System WobschallThe systemwas published in 1971 [19,20]. The basic idea follows the construc-tion of the Rosen–Sutton system but it was upgraded for planar lipid bilayerelasticity measurements (Fig. 7). The volume of one compartment of thechamber could be regulated by a flexible diaphragmwith an acoustic oscillator.Pressure changes were measured with a pressure-sensitive transistor. The ACvoltage signalwas supplied by a function generator and aDC source. Bothwereregulated by a feedback circuit. The bridge excitation voltage with a frequencyof 4 kHzvaried from5 to15mV. FourAg–AgCl electrodeswere immersed in asalt solution. The planar lipid bilayer was formed by the painted technique.
A
BPlanar
lipid bilayer
Bridgeoutput
+
+−
−
Voltage acrossplanar lipid
bilayer
KnownRC network
R2
R1
Rk
Ck
Figure 6 System White [17].
Voltage- and Current-Clamp of Planar Lipid Bilayer 35

The capacitance of planar lipid bilayer in dependence of voltage andfrequency was measured by a capacitance to voltage conversion method.
The construction of the chamber had a possibility of concaving the planarlipid bilayer in the shape of lens, which extended the area of BLM. This ideawas employed to study the BLM capacitance in relation to its surface [20].The elasticity of planar lipid bilayer at its breakdown was determined [19].
In the latter versions of this experimental system, the bridge was replacedby an impedance meter [21].
2.1.5. System Montal–MuellerMontal and Mueller published the design of their measuring system in 1972[3]. It was one of the first measuring systems that combined concepts of bothmeasuring principles: voltage clamp and current clamp. The measuring
Σ
Σ
Carrieroscillator
4 kHz
Dif.amp.
V(t)
Oscilloscope
V(t)
Oscilloscope
DC bias
AC bridge
RxCxV
I
IV
Planarlipid bilayer
1x
Membranevoltage
regulator
Ref.
Ref.
Capacitancedemodulator
(PSD)
Phasesensitivedetector
Phasesensitivedetector
Pressuretransiver
Modulationoscillator
8 Hz
Functiongenerator
Poweramplifier
Acousticaldriver
Figure 7 System Wobshall [19,20].
36 P. Kramar et al.

principle was selected by two switches (Fig. 8). In the scheme, two amplifiercircuits are present; the circuit on the left is voltage amplifier while thecircuit on the right is current to voltage converter in the voltage-clampmode (the switches are in position u) and voltage to current converter in thecurrent-clamp mode (the switches are in position i). In voltage-clamp mode,the applied voltage is measured at connecting point U and the voltage thatcorresponds to current flowing through the planar lipid bilayer is measured atconnecting point I. In the current-clampmode, the applied current is recordedat connecting point I and the transmembrane voltage ismeasured at connectingpoint U. For planar lipid bilayer stimulation and correspondingmeasurements,two Calomel electrodes immersed in salt solution were used. The salt solutionfilled the Teflon chamber, which was divided into two compartments by 25mm thick Teflon foil with an aperture of about 0.25 mm in diameter.The dimension of each compartment was (18 � 12) mm2. The planar lipidbilayer was formed by the folding method [3].
The system was used for measurement of BLM capacitance and resis-tance. The capacitance was measured by charging method.
2.1.6. System BenzThe system was published in 1976 [6,7]. It is one of the simplest systems forobserving planar lipid bilayers (Fig. 9). It consists of DC signal generator withthe amplitude range from 10mV to 5.4 V, switch, and battery supplied chargegenerator. The function of the switch was accomplished with FET transistor2N5653. The output signal was a square pulse with duration from 500 ms to500 ms. Oscilloscope Tektronix 7633 was used to measure the voltageresponse on planar lipid bilayer. The signal was filtered to the band of 80 Hzto 40 MHz. Two Ag–AgCl electrodes were immersed in a salt solution.The volume of each compartment of the Teflon chamber was of about3 cm3. In most cases, the area of the aperture was of about 2 mm2. The planarlipid bilayer was formed by painted technique.
100 kΩ100 kΩ
Inpu
ts
100 kΩ
74 pF
Planarlipid bilayer
u
u
U
i
i
1 GΩ
100 MΩ
10 MΩ
100 kΩ
100 kΩ +−
+−
I
Figure 8 System Montal–Mueller [3].
Voltage- and Current-Clamp of Planar Lipid Bilayer 37

Benz et al. studied the capacitance of planar lipid bilayers using adischarge method. Most of the phospholipids used in their studies weresynthesized in their own laboratory. In most cases, they used 0.1 M NaCl asthe salt solution. They estimated thickness of the planar lipid bilayers andobserved the thinning process of the planar lipid bilayers by capacitancemeasurement. The same system was used to investigate voltage breakdownas a function of salt concentration and pH [7].
The system was applied by the group of Chernomordik, whose experi-mental and theoretical studies made a great impact on understanding of theplanar lipid bilayer breakdown process and related phenomena [4,22,23].They observed fluctuations of the current with amplitude of about 10�11
A as a consequence of applying the voltage (100 mV–1 V) to the BLM.The membrane lifetime at a given voltage was also tested, defined asthe time corresponding to the onset of an irreversible growth of current.
2.1.7. System Alvarez–LatorreThe system was published in 1978 [24]. The construction of the system wassimilar to the measuring systems based on the Winston Bridge [16,17,19].Since the authors were interested in measuring changes in membranecapacitance rather than the absolute capacitance, they used differentialamplifier to subtract the charging current of the membrane from thecharging current of the equivalent RC network (Fig. 10). The resistanceand capacitance of the equivalent RC network was set by the planar lipidbilayer capacitance measurement. The method based on 5 kHz, 10 mVpeak-to-peak voltage waveform, which was only applied on a planar lipidbilayer. Two Ag–AgCl electrodes, one on each side of planar lipid bilayer,were immersed in the salt solution. The Teflon chamber consisted of twoparts; each part had an area of 4 cm2. A thin Teflon sheet of 19 mm wasinserted between the reservoirs. The planar lipid bilayer was formed by thefolding method. The output of the differential amplifier was further ampli-fied and recorded with a sampling frequency of 2 MHz.
2N5653
Pulsegenerator
Planarlipid bilayer
Bandfilter
Oscilloscope
V(t)
80 Hz–40 Mhz
10 mV–5.4 V
Figure 9 System Benz. The figure was drawn according to description in Ref. [6].
38 P. Kramar et al.
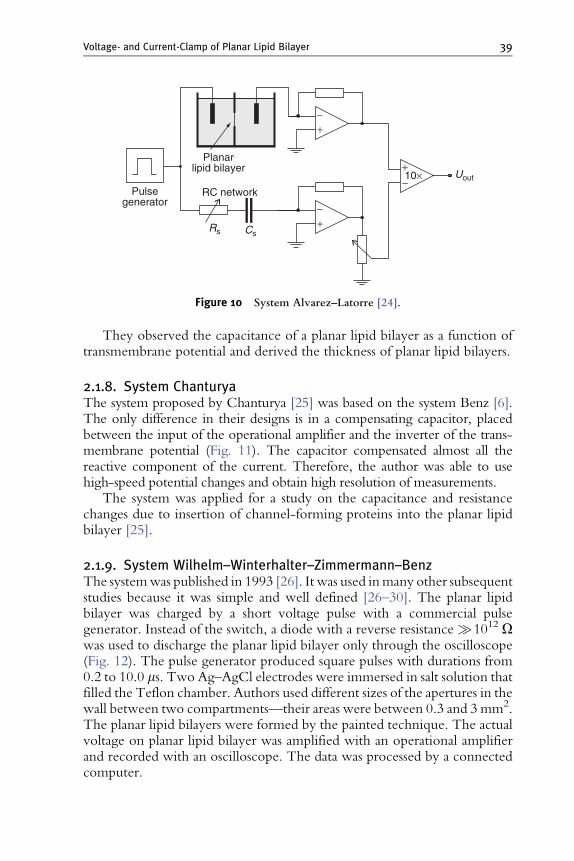
They observed the capacitance of a planar lipid bilayer as a function oftransmembrane potential and derived the thickness of planar lipid bilayers.
2.1.8. System ChanturyaThe system proposed by Chanturya [25] was based on the system Benz [6].The only difference in their designs is in a compensating capacitor, placedbetween the input of the operational amplifier and the inverter of the trans-membrane potential (Fig. 11). The capacitor compensated almost all thereactive component of the current. Therefore, the author was able to usehigh-speed potential changes and obtain high resolution of measurements.
The system was applied for a study on the capacitance and resistancechanges due to insertion of channel-forming proteins into the planar lipidbilayer [25].
2.1.9. System Wilhelm–Winterhalter–Zimmermann–BenzThe systemwas published in 1993 [26]. It was used inmany other subsequentstudies because it was simple and well defined [26–30]. The planar lipidbilayer was charged by a short voltage pulse with a commercial pulsegenerator. Instead of the switch, a diode with a reverse resistance �1012 Owas used to discharge the planar lipid bilayer only through the oscilloscope(Fig. 12). The pulse generator produced square pulses with durations from0.2 to 10.0 ms. Two Ag–AgCl electrodes were immersed in salt solution thatfilled the Teflon chamber. Authors used different sizes of the apertures in thewall between two compartments—their areas were between 0.3 and 3 mm2.The planar lipid bilayers were formed by the painted technique. The actualvoltage on planar lipid bilayer was amplified with an operational amplifierand recorded with an oscilloscope. The data was processed by a connectedcomputer.
Pulsegenerator
Rs Cs+−
+−
+−
RC network
Planarlipid bilayer
10× Uout
Figure 10 System Alvarez–Latorre [24].
Voltage- and Current-Clamp of Planar Lipid Bilayer 39

Because many studies were based on this measuring system, a palette oflipids was tested [27–30]. Salt solutions differed from study to study as wellas the volume of the lipids. The influence of the planar lipid bilayercomposition on the breakdown voltage, capacitance, and rupture kinetics[27–29] was investigated [26,30].
Glasswindow
Planarlipid bilayer
Um(t)
Oscilloscope
Pulsegenerator Amplifier
electrodes
A
50Ω1–10 MΩ
Ag–AgCl
Glasswindow
V(t)
Planarlipid bilayer
Pulsegenerator
DigitalstorageoscilloscopePassive
probe10 MΩ
B
50Ω
Figure 12 (A) SystemWilhelm–Winterhalter–Zimmermann–Benz [26]. (B) Updatedversion of the system with an Digital Storage Oscilloscope described in Refs. [27–30].
Signalgenerator
Cc
3
Planarlipid bilayer
A/D
4 56
1
2
Figure 11 Sistem Chanturya [25]. 1. Signal Generator, 2. and 3. invertors, 4. analog todigital converter, 5. Personal Computer, 6. Printer.
40 P. Kramar et al.

2.1.10. System Yamaguchi–NakanishiThe system was published in 1993 [12]. It used combination of electric andoptic measurements of planar lipid bilayer properties (Fig. 13). The authorssimultaneously measured electrical characteristics and molecular structures ofplanar lipid bilayer as well as morphological changes. Planar lipid bilayer wasexposed to sinus signal 7 mVRMS/1 KHz. The response was measured withLCR meter. The measured data was acquired to the computer. During theelectric measurement, the halogen or xenon light was used. Light reflection ofplanar lipid bilayer was observed and recorded by a color video camera. Twoplatinum/platinum electrodes were immersed in a salt solution. Chamberconsisted of two quartz cells separated by Teflon 0.05 mm thick film, wherean aperture of 0.7 mm in diameter was formed. The planar lipid bilayer wasformed by the painted technique [12].
The authors measured changes in capacitance and resistance of planarlipid bilayer upon the irradiation by light.
2.1.11. System Sharma–Stebe–TungThe system was an upgrade of the Benz system and it was described in 1996[5,31]. FET switch was replaced by fast two pole analog switch. One of theswitch poles was connected to the signal generator output and the otherpole was connected on resistor of 1 MO. Voltage source consisted of anarbitrary waveform synthesizer board interfaced to a computer (Fig. 14).A square voltage pulse, which decayed linearly to zero to constitute anegative sloped ramp, and square voltage pulses from 10 ms to 10 s weregenerated. Four Ag–AgCl electrodes were inserted in the Teflon chambervia agar bridges. Two electrodes served to measure voltage across the bilayerby differential amplifier and the other two to apply voltage across the planar
Computer LRCD2 lamp
Electrodes
Halogen lampFilter
Xe lampMonochromator
Planarlipid bilayer
Videotimer
Video taperecorder Quartz
cellOptical
fiber
Multichannelphotodetector
Siliconrubbergasket
Mic
rosc
ope
CCDmeter
colorcamera
Colormonitor
Figure 13 Sistem Yamaguchi–Nakanishi [12].
Voltage- and Current-Clamp of Planar Lipid Bilayer 41
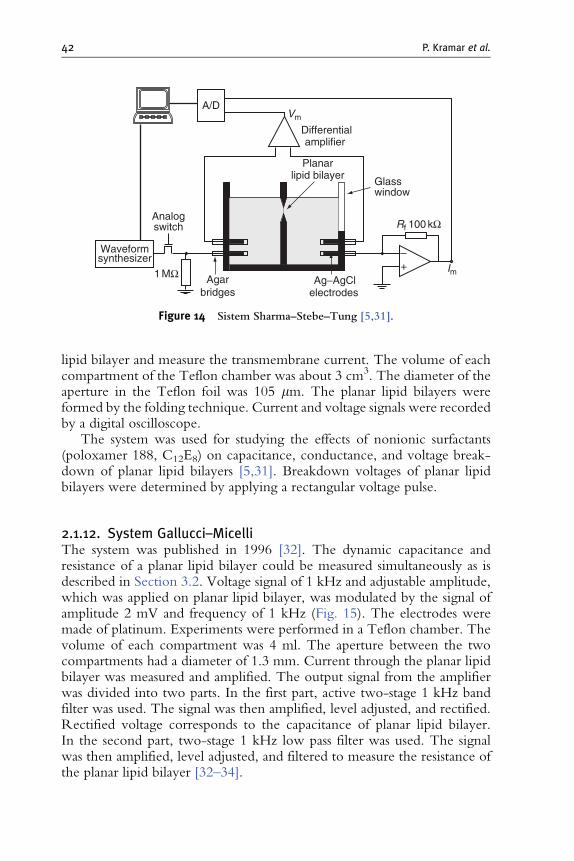
lipid bilayer and measure the transmembrane current. The volume of eachcompartment of the Teflon chamber was about 3 cm3. The diameter of theaperture in the Teflon foil was 105 mm. The planar lipid bilayers wereformed by the folding technique. Current and voltage signals were recordedby a digital oscilloscope.
The system was used for studying the effects of nonionic surfactants(poloxamer 188, C12E8) on capacitance, conductance, and voltage break-down of planar lipid bilayers [5,31]. Breakdown voltages of planar lipidbilayers were determined by applying a rectangular voltage pulse.
2.1.12. System Gallucci–MicelliThe system was published in 1996 [32]. The dynamic capacitance andresistance of a planar lipid bilayer could be measured simultaneously as isdescribed in Section 3.2. Voltage signal of 1 kHz and adjustable amplitude,which was applied on planar lipid bilayer, was modulated by the signal ofamplitude 2 mV and frequency of 1 kHz (Fig. 15). The electrodes weremade of platinum. Experiments were performed in a Teflon chamber. Thevolume of each compartment was 4 ml. The aperture between the twocompartments had a diameter of 1.3 mm. Current through the planar lipidbilayer was measured and amplified. The output signal from the amplifierwas divided into two parts. In the first part, active two-stage 1 kHz bandfilter was used. The signal was then amplified, level adjusted, and rectified.Rectified voltage corresponds to the capacitance of planar lipid bilayer.In the second part, two-stage 1 kHz low pass filter was used. The signalwas then amplified, level adjusted, and filtered to measure the resistance ofthe planar lipid bilayer [32–34].
A/D
Analogswitch
Vm
Differential
Glasswindow
Rf 100 kΩ
Ag−AgClAgarbridges
1 MΩ
electrodes
Im+−
Planarlipid bilayer
amplifier
Waveformsynthesizer
Figure 14 Sistem Sharma–Stebe–Tung [5,31].
42 P. Kramar et al.

The general aim of the authors was investigation of channel insertioninto planar lipid bilayer and corresponding electrical properties. Thedynamic capacitance and resistance of planar lipid bilayers were measuredsimultaneously.
2.1.13. System Hanyu–Yamada–MatsumotoHanyu and coworkers [11] developed an experimental system that couldmeasure ionic current and fluorescence emission of an artificial planar lipidbilayer, while controlling the membrane potential. Their experimental workwas mostly dedicated to structural changes and functioning of ion channels.
The main part of the measuring system was an Axopatch200A (AxonInstruments, Inc. Foster City, USA). The program pClamp was used forvoltage generation as well as for measuring the current through the planarlipid bilayer and analyses. Four Ag–AgCl electrodes were inserted in thespecially designed chamber via agar bridges. Two electrodes served tomeasure current across the bilayer while the other two applied the voltageacross the planar lipid bilayer. As in the previous system designed by Sharmaet al. [31], the thin Teflon foil (25 mm thick) was inserted between twosymmetrical parts of Teflon chamber. The diameter of the hole in the foilwas 120 mm. The planar lipid bilayer was formed by the folding technique.
Schematic diagram of the experimental system developed for measuringthe fluorescent emissions from the planar lipid bilayer is shown in Fig. 16.The excitation light was focused on the planar lipid bilayer (80 mm indiameter) with an objective lens so that only an area of the planar lipidbilayer was irradiated. The fluorescent emissions were collected through the
Planarlipid bilayer
1 Hz + 1 kHz
R1 C1
Generalamplifier
Absolute signalrectifier
Amplifier andlevel adjust
Active 2 stagepass filter 1 kHz
Active 2 stagelow pass filter
1 HzAmplifier andlevel adjust
Clear RC filter
Outputimpedance
adapter
Outputimpedance
adapter
V1h
V1l
Figure 15 Sistem Gallucci–Micelli [32–34].
Voltage- and Current-Clamp of Planar Lipid Bilayer 43
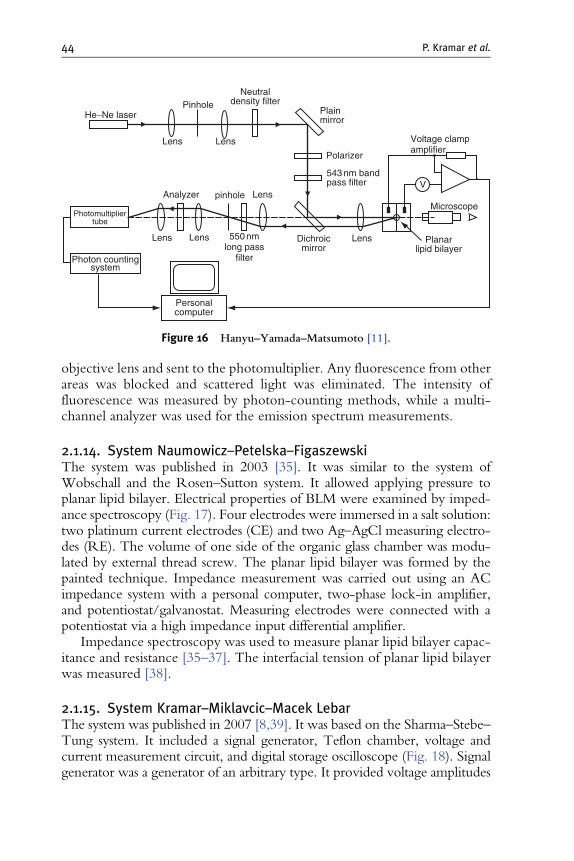
objective lens and sent to the photomultiplier. Any fluorescence from otherareas was blocked and scattered light was eliminated. The intensity offluorescence was measured by photon-counting methods, while a multi-channel analyzer was used for the emission spectrum measurements.
2.1.14. System Naumowicz–Petelska–FigaszewskiThe system was published in 2003 [35]. It was similar to the system ofWobschall and the Rosen–Sutton system. It allowed applying pressure toplanar lipid bilayer. Electrical properties of BLM were examined by imped-ance spectroscopy (Fig. 17). Four electrodes were immersed in a salt solution:two platinum current electrodes (CE) and two Ag–AgCl measuring electro-des (RE). The volume of one side of the organic glass chamber was modu-lated by external thread screw. The planar lipid bilayer was formed by thepainted technique. Impedance measurement was carried out using an ACimpedance system with a personal computer, two-phase lock-in amplifier,and potentiostat/galvanostat. Measuring electrodes were connected with apotentiostat via a high impedance input differential amplifier.
Impedance spectroscopy was used to measure planar lipid bilayer capac-itance and resistance [35–37]. The interfacial tension of planar lipid bilayerwas measured [38].
2.1.15. System Kramar–Miklavcic–Macek LebarThe system was published in 2007 [8,39]. It was based on the Sharma–Stebe–Tung system. It included a signal generator, Teflon chamber, voltage andcurrent measurement circuit, and digital storage oscilloscope (Fig. 18). Signalgenerator was a generator of an arbitrary type. It provided voltage amplitudes
He−Ne laserPinhole
Lens Lens
LensLens
Analyzer
Personalcomputer
Photon countingsystem
Photomultipliertube
pinhole Lens
Lens 550 nmlong pass
filter
Neutraldensity filter
Plainmirror
Polarizer
543 nm bandpass filter
Voltage clampamplifier
Microscope
V
Planarlipid bilayer
Dichroicmirror
Figure 16 Hanyu–Yamada–Matsumoto [11].
44 P. Kramar et al.

from�5 toþ5V. Itwas controlled by customdesigned software (Genpyrrha),which allowed drawing of arbitrary voltage signals. On the output of the signalgenerator was a switch that disconnected the output of the signal generator andconnected the electrodes to the 1MO resistor. The switch was able to turn off
3
2
1
45
6RE1CE1
9710
8RE2CE2
Dif.amp. Potentiostat
Lock-inamplifier
Figure 17 System Naumowicz–Petelska–Figaszewski [37]. 1. Syringe, 2. Externalthread screw, 3. Handwheel, 4. Steel tube, 5. Tight Teflon Piston, 6. Connectormade of organic glass, 7. Platinum current electrode, 8. The chamber made of organicglass, 9. A tight Teflon attachement, 10. A forming sphere for planar lipid bilayer.
CPUMCF5204
5
.05.1.2.51
2
.05.1.2.51
2
Main Delayed
.05.1.2.51
2
Trigger Polarity
LevelSource
200100502010
Traceseparation
FocusIntensityHorizontalposition
5
200100502010
.05.1.2.51
2 A/CA/C
D/CD/C
GNDGND
A/CA/C
D/CD/C
GNDGND
5
200100502010
VerticalPosition
VerticalPosition
5
200100502010
1 2
34
Sig. gen. module
Vm Am
RS232GenPyrrha
Frq. extendermodule
Figure 18 Experimental system. 1. The microprocessor board with MCF5024 proces-sor and two modules. Signal generator module generates arbitrary signals. Frequencyextender module is realized in programmable integrated circuit (FPGA) and is used forfrequency extension. 2. Chamber for forming planar lipid bilayer and two Ag–AgClelectrodes. 3. Modules for current and voltage amplification. 4. Oscilloscope for datacollection and storage.
Voltage- and Current-Clamp of Planar Lipid Bilayer 45

the signal generator in 2 ns. This way planar lipid bilayer capacitance wasmeasured. Two Ag–AgCl electrodes, one on each side of the planar lipidbilayer, were inserted into the salt solution. The Teflon chamber consisted oftwo parts—each part was a cubed reservoir of 5.3 cm3 in volume. Between thereservoirs a 25 mm thin Teflon sheet was inserted. A diameter of the aperturewas 105 mm. The planar lipid bilayer was formed by the folding method.Transmembrane voltage was measured by LeCroy differential amplifier 1822.The same electrodes were also used to measure the transmembrane current.Both signals were stored by the oscilloscope LeCroy Waverunner-2 354M inMatlab format. All sampled signals could be analyzed in MatlabTM softwareafter the experiments.
The authors measured Ubr by means of a linearly rising signal and thecapacitance of the planar lipid bilayers of various compositions [8].
2.2. Current Clamp
2.2.1. System CariusThe system was published in 1976 [40]. Symmetric AC Bridge was the mainpart of the measuring system (Fig. 19). The variable resistor RK and thecapacitor decadeCK, used for compensation, were in series. Without a planarlipid bilayer in the chamber, the electrode and electrolyte resistance werecompensated with RK¼R0 and CK¼C0, when the capacitor C0 was in serieswith the cell by means of switch S. With the planar lipid bilayer in thechamber, the increase in the compensation resistance needed (RK�R0)corresponded to the loss of the planar lipid bilayer capacitor, represented bythe equivalent series planar lipid bilayer resistance. A DC bias voltage up to�200 mV was provided at the planar lipid bilayer by a voltage controlledcurrent source. The bridge balance was controlled by a phase-sensitivedetector (lock-in amplifier) tuned to the frequency of the oscillator. Whenthe out-of-phase signal vanished at proper settings RK, the in-phase signaloutput of the lock-in amplifier was proportional to (CBLM � CK), providedthat the difference was small compared to CK. The AC voltage on the planarlipid bilayer was 3 or 6 mVRMS, when only the capacitance was recorded.Another lock-in amplifier was used for the detection of the second harmonic.For these measurements, the AC voltage on the planar lipid bilayer was 20–60mVRMS and the DC voltage varied between 0 and �160 mV. When thesecond and third harmonics were measured simultaneously by the two lock-in amplifiers, bridge balance was controlled by an AC voltmeter with a bandpass filter at the input. The electrodes were Ag–AgCl–platinum blackelectrodes. The chamber was made of Teflon. In most cases, the diameterof the aperture was about 0.9 mm. The planar lipid bilayer was formed by thepainted technique. The output signals were recorded.
The system was applied to measurements of the transmembrane voltagedependence on the BLM capacitance.
46 P. Kramar et al.

2.2.2. System Robello–GliozziThe systemwas published in 1989 [41]. The group performed experiments oncurrent–voltages relationship of planar lipid bilayer under voltage-clamp con-dition in previous years [42]. Later on, they changed their measuring system toa current-clamp mode. The planar lipid bilayer was in a feedback network ofthe operational amplifier which acted as a current–voltage converter (Fig. 20).The current value was selected with resistor on the amplifier input. Thecurrent–voltage characteristics were obtained by exposing the planar lipidbilayer to a triangular signal with 8–10 min period [41]. By constant currentof 10–20 pA, the fluctuations in planar lipid bilayers were studied [43–45].TwoAg–AgCl electrodes were immersed in salt solution. The volume of eachcompartment of the Teflon chamberwas about 2ml. The Teflon foil betweentwo compartments was 12 mm thick. The diameter of the apertures was from100 to 200 mm. The planar lipid bilayer was formed by the folding method.The output signal was low-pass filtered at 250Hz (24 db/octave) and recordedto the computer with a sampling frequency of 1 kHz.
AC-DVMVoltagecontrolledcurrentsource
U=REF
V(t)
V(t)
OscilloscopeLock-in amplifier
Lock-in amplifier
R0
C0
S
RK
OscillatorU~REFU~
f
CK
Tuned frequency 2fPhase 90�
Tuned frequency fPhase 0�
Oscilloscope
Planarlipid bilayer
Figure 19 System Carius [40].
Voltage- and Current-Clamp of Planar Lipid Bilayer 47

The authors observed voltage breakdown, current–voltage characteristic,and fluctuations of planar lipid bilayer. The system was later on upgraded toextremely low current value source (10 pA) [47].
2.2.3. System Kalinowski–FigaszewskiThe system was published in 1992 [48]. The system included two modules(Fig. 21). The first module was capacity to period converter, used formeasuring the BLM capacitance [48,49] (see Section 3.1). The secondmodule was a potentiostat–galvanostat for planar lipid bilayer studies undercurrent clamp [50]. Both modules were controlled with a personal computer.
Planarlipid bilayer
Uout
C1
R1
−+
Uin
Figure 20 System Robello–Gliozzi [41–47].
Programmablegalvanostat
Source
Current S1
S2
V
CE1 RE1
Planarlipid bilayer
RE2 CE2
Figure 21 System Kalinowski–Figaszewski [48–51].
48 P. Kramar et al.

The output signal was programmable [51]. The potentiostat had a negativefeedback for equalization of operational amplifier input voltage. The chamberwas made of one piece Teflon with two compartments, each 10 cm3 ofvolume. Between the compartments was the aperture of 1 mm in diameter.Four Ag–AgCl electrodes were immersed in a salt solution; two of themwereCE and two other reference electrodes (RE). The switch S1 disconnected thecurrent flowing through the electrodes. The switch S2 caused short circuit ofthe CE and forced planar lipid bilayer potential to zero.
The system was applied for recording the transmembrane voltage, espe-cially for the electroporation studies the trace of building voltage on planarlipid bilayer was observed due to constant current clamp [9,52].
3. Methods for Determination of Planar Lipid
Bilayer Properties
3.1. Capacitance (C)
The capacitance (C) is the parameter considered the best tool for probing thestability and integrity of planar lipid bilayers and for this reason it ismeasured forevery bilayer, even when other properties are the main focus of the measure-ments. There are three main methods for determination of planar lipid bilayercapacitance: a discharge method, a capacitance to period conversion method,and a capacitance to voltage conversion method. For comparison betweendifferent studies, the measured value of the capacitance must be normalized tothe size of the planar lipid bilayer surface and the specific capacitance of theplanar lipid bilayer, that is, the capacitance per unit area, is usually given.
3.1.1. Discharge methodThe most common and simplest method for measuring planar lipid bilayercapacitance is measurement of the voltage discharge time constant[5,6,8,26,27,30,31,39,53]. Only a voltage generator, a fast switch, and anoscilloscope are needed for its implementation. To make the measurement, aplanar lipid bilayer is first charged by a voltage pulse. At the end of the pulse,the charged lipid bilayer is discharged through a resistor of known resistanceand the discharging process monitored with an oscilloscope (Fig. 22).
The voltage uðtÞ on the planar lipid bilayer decreases exponentially:
uðtÞ ¼ U0e�t=t: ð1Þ
Here, U0 is the amplitude of the voltage pulse and t is a time constant.The time constant depends on the capacitance (C ) and resistance (R) whichcome from the planar lipid bilayer and the electronic system,
Voltage- and Current-Clamp of Planar Lipid Bilayer 49

t ¼ RC: ð2Þ
The resistance of the electronic system is usually known and is muchlower than the resistance of planar lipid bilayer (�108 O); therefore, thecapacitance of planar lipid bilayer can be determined in two steps. First, thecapacitance of the electronic system is measured without the planar lipidbilayer, CSYS. Then, the capacitance of the electronic system with the planarlipid bilayer and salt solution CSBLM is determined. The capacitance of planarlipid bilayer CBLM is then obtained as a difference between CSYS and CSBLM:
CBLM ¼ CSYS � CSBLM: ð3Þ
In early experiments, the planar lipid bilayer charging process was alsoused for planar lipid bilayer capacitance determination. Montal and Mueller[3] calculated the capacitance of planar lipid bilayers from the currentrecords in response to a voltage step signal:
C ¼ I
DU
ð10
I dt; ð4Þ
where I is the current and DU the amplitude of the voltage. In the constantvoltagemode, the time constant and gain of the current record depends on thevalue of the feedback resistor in the current measuring amplifier. Because thecapacity currents are small, the feedback resistance was kept about 100 kO.
0 100 200 300 400
t (ms)
0.3U
(V
)I (
mA
)U (V)I (mA)
0.2
0.1
0
−0.1 u (t) = U0e– t–T
Figure 22 Planar lipid bilayer capacitance measurement by discharge method.
50 P. Kramar et al.

3.1.2. A capacitance to period conversion methodThe electrical parameters of the planar lipid bilayer can also be measured bymeans of an alternating voltage signal, which offers the advantage of elim-inating the effect of possible electrode polarization.
Kalinowski and Figaszewski [48] constructed an instrument (Fig. 23),which converts planar lipid bilayer capacitance to a train of rectangularpulses. During the measurement, the planar lipid bilayer is charged anddischarged with a constant current. The charge–discharge cycle duration isproportional to the membrane capacitance.
In the circuit in Fig. 23, the capacitance of planar lipid bilayer isrepresented by the capacitor CBLM. The voltage at the point D is amplifiedby a noninverting amplifier with the gain k:
B
C
D
B
A
+1.6 V
+5 V
−5 V
−5 V
+5 V
+15 mV
−15 mVT
−1.6 V
Q
Tr
1V−–5 V
50ΩR1
LM108A+
−
+−
+−
160 pF
D8.8 MR3
68 kR4
C
R2 5 k
A
6
8 4 NE555
Output3
B
A
S
R
V+ +5 V
2
7CBLMC1
Figure 23 Measurement of planar lipid bilayer capacitance by capacitance to periodconversion method. (A) Schematic diagram of the capacity-to-period converter [48].(B) Voltage wave of the capacity-to-period converter [48].
Voltage- and Current-Clamp of Planar Lipid Bilayer 51

k ¼ R1 þ R2
R2
: ð5Þ
The amplified signal is an input of the integrated circuit NE555. Twovoltage comparators are contained in the integrated circuit, both with oneof their inputs connected to the voltage from the amplifier output (A) whilethe other input is one of the voltages from the voltage divider, which isrealized by three resistors. Depending on the voltage levels at the inputs Rand S, the output of the cell (B) is switched to a low or high state. The resultis a square wave signal, which has a well-defined period. The voltage acrossthe planar lipid bilayer can be calculated as
UBLM ¼ 2
3V1
k¼ 2VR1
3ðR1 þ R2Þ : ð6Þ
The measurement is divided into two steps. First, the capacitor is chargedwith the current passing across resistorsR4 in R3 and transistor Tr is off. Then,the capacitor is discharged due to the current across the transistor, which is aconsequence of a changed state of the cell. The current flows across resistorR3 and transistor Tr. The product of the voltage and time in one period is:
TV ¼ UBLMðR3 þ R4ÞCBLM þ UBLMR3CBLM: ð7Þ
If R4 � R3 and V ¼ Vþ ¼ jV�j, then the period is:
T ¼ 2UBLMR3CBLM
V: ð8Þ
3.1.3. A capacitance to voltage conversion methodWhen a sinusoidally varying signal is applied to the planar lipid bilayer, itsimpedance is important. Since capacitors ‘‘conduct’’ current in proportion tothe rate of voltage change, they pass more current for faster changing voltages,and less current for slower changing voltages. Therefore, the capacitive part ofthe impedance–capacitive reactance in ohms for any capacitor is inverselyproportional to the frequency of the alternating current. According to thistheory, the capacitances of planar lipid bilayers were often measured using ACWheatstone bridge [15–17], which contain a variable resistor in parallel with avariable capacitor in the known arm. When the bridge is balanced at a givenfrequency, the settings of the known arm give the parallel equivalent capaci-tance and resistance of the circuit connected to its unknown terminals. Sincethe planar lipid bilayer is immersed in electrolyte, the bridge measuresthe parallel equivalent impedance of the membrane–electrolyte system.
52 P. Kramar et al.

The parallel equivalent capacitance can be represented by the membranecapacitance and the stray capacitance associated with electrodes in series withelectrolyte resistance; therefore, appropriate equivalent circuit and transformequations should be used to relate membrane capacitance to the elements ofthe bridge. A convenient technique for displaying AC impedance data is theCole–Cole diagram.
Micelli et al. [33] measured the capacitance of planar lipid bilayers byapplying sinusoidally varying voltage with amplitude of 2 mV and thefrequency of 1 kHz. At this high frequency, almost all of the current crossesthe reactive part of the planar lipid bilayer and its resistance is negligible.The rectified voltage is proportional to the planar lipid bilayer capacitance.By using a set of test values for the capacitance, which were one by oneincluded in measuring system, they parameterized the relation betweenmeasured voltage and capacitance. The hyperbolic relation with twoknown parameters a and b was obtained:
CBLM ¼ aV1h
b� V1h
: ð9Þ
3.2. Resistance (R)
Planar lipid bilayermembranes exhibit resistance in the range of few gigaohms.The resistance is usually calculated in accordance with Ohm’s law as a ratio ofvoltage applied to (or measured on) the planar lipid bilayer and current whichflows through it. As mentioned earlier, the electrical parameters of planar lipidbilayer can also be measured by means of an alternating current. The continu-ous monitoring of capacitance is useful in trackingmembrane thickness, whilethe continuous monitoring of the resistance allows studies of protein–lipidinteractions and planar lipid bilayer fluctuations.
Gallucci and coworkers [32] presented an electrical circuit appropriatefor continuous monitoring of planar lipid bilayer capacitance and resistancesimultaneously. An input voltage was composed of two sinusoidally varyingsignals: one with variable amplitude (0.1–1.5 V) and frequency of 1 Hz andanother with amplitude of 2 mV and frequency of 1 kHz. The planar lipidbilayer and the measuring device are shown with equivalent circuits on theleft side in Fig. 24. According to the associated vector graph on the right sidein Fig. 24, the following relations can be written:
V1 cosð’� ’1Þ þ VBLM cosð’BLM � ’Þ ¼ Vs ð10ÞV1 sinð’� ’1Þ ¼ VBLM sinð’BLM � ’Þ ð11Þ
oCBLMVBLM ¼ I sin’BLM: ð12Þ
Voltage- and Current-Clamp of Planar Lipid Bilayer 53

The current I is the vector sum of the currents crossing the resistance R1
and capacitance C1 of the measuring device:
I ¼ V1
ffiffiffiffiffiffiffiffiffiffiffiffiffiffiffiffiffiffiffiffiffiffiffiffiffiffiffiffiffiffiffiffiffiðoC1Þ2 þ 1
R1
� �s: ð13Þ
If the capacitance of the planar lipid bilayer has already been measured(see Section 3.1), the phase angles ’BLM and ’ as well as the voltage VBLM
can be determined. The resistance of the planar lipid bilayer is then obtainedfrom the relation:
RBLM ¼ VBLM
I cos’: ð14Þ
3.3. Breakdown Voltage (Ubr)
The electrical modulation of biological membrane physical propertiescaused by electrical oscillations and excitations are natural processes in livingorganisms. Applications of external electric fields, especially those based onthe phenomenon of electroporation, have gained increasing importance formanipulations in biological cells and tissues [54]. The structural changes inbiological membranes induced by an external electric field involve rear-rangement of the phospholipid bilayer and lead to the formation of aqueouspores. If the electric field does not exceed some critical adequate strengthand duration, the membrane returns to its normal state after the end of theexposure to the electric field; the electroporation is reversible. However, ifthe exposure to the electric field is too long or the strength of the electricfield is too high, the membrane does not reseal after the end of the exposure,
VBLM V1
V1
VS
VBLM
C1I
CBLM
j
jBLMj1
I
RBLMI
I
IR1
R1
C1
RBLM(t)
CBLM(t)
1 Hz + 1 kHz
Vs
I
Figure 24 Left: Equivalent circuit of the planar lipid bilayer (BLM) and of themeasurement device. Vs is an input voltage. VBLM and V1 are the planar lipid bilayerand output voltages, respectively. R1 is electrical resistance and C1 the capacitance ofthe measuring circuit; RBLM and CBLM are the resistance of planar lipid bilayer andcapacitance, respectively. Right: Vector scheme of the voltages and currents in thecircuit no the left [32–34].
54 P. Kramar et al.

and the electroporation is irreversible. The underlying mechanisms for theseproperties are dependent on the lipid component of biological membrane,and can be studied on planar lipid bilayers.
Application of a steady voltage in the order of few hundred millivoltsacross a planar lipid bilayer causes the membrane to break. Most often thebreakdown voltage (Ubr) of the planar lipid bilayer is determined by apply-ing a rectangular voltage pulse (10 ms–10 s) (Fig. 25). The amplitude of thevoltage pulse is increased in small steps until the breakdown of the bilayer isobtained [5]. First, the voltage pulse charges up the planar lipid bilayer.Above a critical voltage (Ubr) defects are created in the planar lipid bilayerallowing an increase of the current through the bilayer [4]. Usually, planarlipid bilayer collapses when the breakdown voltage is exceeded.
Using the rectangular voltage pulse measuring protocol, the number ofapplied voltage pulses is not known in advance and each planar lipid bilayeris exposed to a voltage stress many times. Such a pretreatment of the planarlipid bilayer affects its stability and consequently the determined breakdownvoltage of the planar lipid bilayer [4]. Another approach for the breakdownvoltage determination was suggested by Kramar et al. [8]. Using a linearrising signal, the breakdown voltage of a planar lipid bilayer is determinedby only a single voltage exposure (Fig. 26).
The slope of the linear rising signal and the peak voltage of the signalmust be selected in advance. The breakdown voltage (Ubr) is defined as thevoltage at the moment tbr when a sudden increase of the current through theplanar lipid bilayer is observed. Time (tbr) is defined as the lifetime of theplanar lipid bilayer at a chosen slope of the linear rising signal (Fig. 26).Because the planar lipid bilayer lifetime depends on the applied voltage[5,55] and the planar lipid bilayer pretreatment [4], Ubr and tbr are measuredat a variety of slopes. Using nonlinear regression (Fig. 27), a two parametercurve can be fitted to the data
U ¼ a
1� e�t=b; ð15Þ
U (V)I (mA)
t (s)
Figure 25 Measurement of planar lipid bilayer breakdown voltage (Ubr) by succes-sional rectangular pulses. The amplitude of the voltage pulse (gray) is incremented insmall steps until the breakdown of the bilayer is observed as sudden increase of current(black) [5].
Voltage- and Current-Clamp of Planar Lipid Bilayer 55

100
tbr
0−0.2
0
0.4
0.8
1.2
1.6U
(V
)I (
mA
)U (V)I (mA)
Ubr
200 300 400t (ms)
Figure 26 Measurement of planar lipid bilayer breakdown voltage (Ubr) by linearrising signal. Breakdown voltage is defined as the voltage (gray) at the moment tbr whensudden increase of the current (black) through the planar lipid bilayer is observed [8].
0
0.8
20 40 60
POPCPOPC + 1mM C12E8POPC:POPC (3:7)
I.
I.
4.8 kV/s5.5 kV/s7.8 kV/s
11.5 kV/s16.7 kV/s21.6 kV/s48.1 kV/s
tbr (ms)80 100 120
II.
III.IV.V.VI.VII.
0.6
Uc
(v)
0.4
0.2
0.0
II.III.IV.V.VI.VII.
Figure 27 The breakdown voltage (Ubr) (dots and triangles) of planar lipid bilayerswith different chemical composition as a function of lifetime tbr. The gray lines showseven different slopes of applied liner rising voltage signal. Dash, dotted, and dash-dotted curves represent two parameters curve [15] fitted to data.
56 P. Kramar et al.

whereU is Ubr measured at different slopes; t is corresponding tbr; and a and bare parameters. Parameter a is an asymptote of the curve which corresponds tominimal breakdown voltageUbrMIN for a specific planar lipid bilayer chemicalcomposition. Parameter b governs the inclination of the curve.
3.4. Fluctuations (c)
Fluidity of the lipid membrane must produce local fluctuations of the mem-brane microscopic parameters. Appearance of transient defects and pores inthe membrane structure affects its conductance, producing fluctuations. Tran-sient changes of the membrane electrical properties also accompany proteininsertion into the membrane. Voltage-clamp studies with low-value fieldsare typically applied for recording capacitance and conductance changes,following insertion of channel-forming proteins into the planar lipid bilayer(e.g., Ref. [25]).
The fluctuations are even more pronounced under a strong electric fieldthat is sufficient to electroporate the membrane. The pore appearance ispreceded by lipid reorganization resulting in the events of transient mem-brane permeability to ions. Related to these phenomena, fluctuations of thecurrent were observed prior to an irreversible breakdown of a planar lipidbilayer [4]; the fluctuation amplitude was about 10�11 A. After electropo-ration, it is very unlikely for an electropore to maintain its rim fixed, hencepore fluctuations are theoretically expected. Since the electroporationunder voltage-clamp conditions results in very fast pore expansion leadingto rapidmembrane breakdown, an experimental study on the pore dynamics,in the voltage-clamp mode, required application of very short pulses thatcould protect the membrane from destruction [56,57]. The experimentreported in Ref. [57] approximated a typical lifetime of an electroporecreated under voltage-clamp conditions (250 mV) as 3 ms. Conductancefluctuations recorded in these experiments were attributed to a poredynamics. In such a study, however, the voltage was clamped above thebreaking potential and, because of the high value of the potential,the appearance of multiple pores is almost certain. The combined dynamicsof several pores may have accounted for the observed fluctuations and singlepore dynamics was blurred. At higher voltages, an irreversible membranebreakdown was studied by voltage-clamp techniques [27,31].
Exposure of the planar lipid bilayer to a constant current (0.1–2.0 nA)does not rupture the bilayer rapidly. The membrane slowly accumulates thecharge and when the first pore appears, the transmembrane potentialdecreases, preventing subsequent electropore appearance, which permitsthe hypothesis of a single pore formation. Fluctuations observed in thesecurrent-clamp experiments are caused by opening and closing of a singlepore [9,49–52,58]. The natural electropore fluctuations are enhanced by anegative feedback inherent to the current-clamp electroporation method.
Voltage- and Current-Clamp of Planar Lipid Bilayer 57
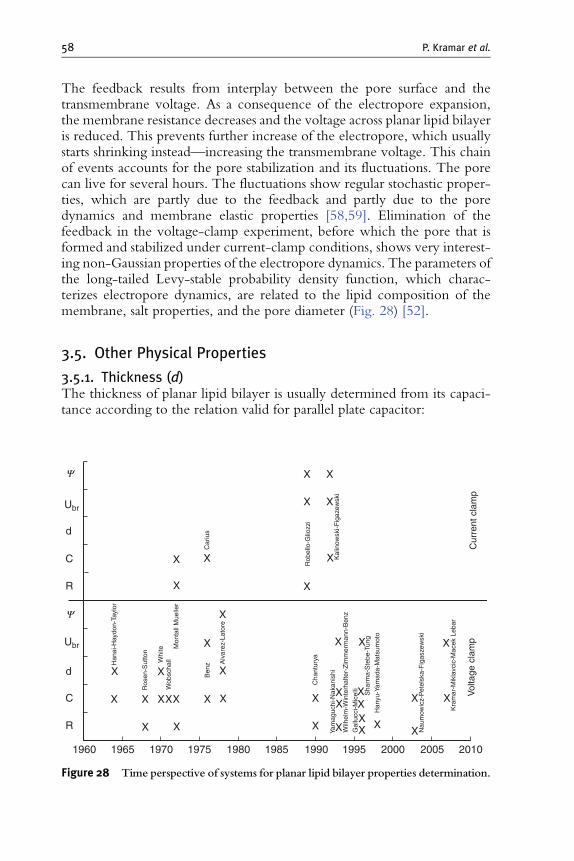
The feedback results from interplay between the pore surface and thetransmembrane voltage. As a consequence of the electropore expansion,the membrane resistance decreases and the voltage across planar lipid bilayeris reduced. This prevents further increase of the electropore, which usuallystarts shrinking instead—increasing the transmembrane voltage. This chainof events accounts for the pore stabilization and its fluctuations. The porecan live for several hours. The fluctuations show regular stochastic proper-ties, which are partly due to the feedback and partly due to the poredynamics and membrane elastic properties [58,59]. Elimination of thefeedback in the voltage-clamp experiment, before which the pore that isformed and stabilized under current-clamp conditions, shows very interest-ing non-Gaussian properties of the electropore dynamics. The parameters ofthe long-tailed Levy-stable probability density function, which charac-terizes electropore dynamics, are related to the lipid composition of themembrane, salt properties, and the pore diameter (Fig. 28) [52].
3.5. Other Physical Properties
3.5.1. Thickness (d)The thickness of planar lipid bilayer is usually determined from its capaci-tance according to the relation valid for parallel plate capacitor:
1960
Ubr
Ubr
d
d
C
X X
X X
X
X
X X X
XX
X
XXX X XX XXXX
XX
X
X
X
XXX
XXXXXX
X X
XC
R
R
Y
Y
Han
ai-H
aydo
n-Ta
ylor
Ros
en-S
utto
n
Whi
teW
obsc
hall
Mon
tall
Mue
ller
Ben
z Alv
arez
-Lat
ore
Rob
ello
-Glio
zzi
Car
ius
Kal
inow
ski-F
igaz
ewsk
i
Cha
ntur
ya
Yam
aguc
hi-N
akan
ishi
Wilh
elm
-Win
terh
alte
r-Z
imm
erm
ann-
Ben
z
Gal
lucc
i-Mic
elli
Sha
rma-
Ste
be-T
ung
Han
yu-Y
amad
a-M
atsu
mot
o
Nau
mow
icz-
Pet
elsk
a-F
igas
zew
ski
Kra
mar
-Mik
lavc
ic-M
acek
Leb
ar
Vol
tage
cla
mp
Cur
rent
cla
mp
1965 1970 1975 1980 1985 1990 1995 2000 2005 2010
Figure 28 Time perspective of systems for planar lipid bilayer properties determination.
58 P. Kramar et al.

d ¼ ee0A
CBLM
: ð16Þ
In this equation, A stands for the area of planar lipid bilayer andCBLM, e0,and e for its capacitance, the permittivity of the free space, and the relativestatic permittivity, respectively. It is usually assumed that the relative staticpermittivity inside lipid bilayer equals to 2.1 [24].
3.5.2. Elasticity (E) and surface tension (s)A macroscopic approach using the theory of elasticity of solid bodies andliquid crystals can be applied to describe mechanical properties of lipidbilayers. In 1973, Helfrich proposed a theory and possible experiments ofelastic properties measurements on planar lipid bilayers [60]. As the anisot-ropy of lipid bilayers is clearly expressed, several elasticity modules arerequired to describe its viscoelastic properties. Depending on the directionsof the membrane deformation, we distinguish volume compressibility, areacompressibility, unilateral extension along membrane plane, and transversalcompression.
Experimentally, lipid bilayer mechanical properties were commonlymeasured on giant unilamellar vesicles [61–64]. Pressure was applied on amembrane with micropipette aspiration method; the properties weremeasured by means of video microscopy [65]. From experiments on planarlipid bilayer, Winterhalter and coworkers [66] reported that dynamics lightscattering allowed quantifying viscoelastic properties in nonperturbativeway, while Wobschall calculated membrane elasticity and breaking strengthfrom measurement of capacitance of the planar lipid bilayer as it was bowedunder a known pressure. Transversal elasticity modulus cannot be measureddirectly due to small thickness of the membrane and extremely smallchanges of the thickness upon deformation. It can be estimated throughcapacitance measurement with a special electrostriction method which isbased on measurements of the amplitude of higher current harmonics [67].
Sabotin with coworkers [68] presented an estimation of the planar lipidbilayer transversal elasticity (E) and surface tension (s) by means of visco-elastic predictive model of Dimitrov [69] and measured planar lipid bilayercapacitance and break down voltage. The model considers the lipid bilayeras a viscoelastic, isotropic material that can be represented as a standard solidmodel, composed of a Kelvin body in series with a linear spring. Originally,this model predicts the critical voltage and critical time needed to collapse amembrane at applied voltage. Critical voltage corresponds to breakdownvoltage (UbrMIN) and critical time to life time (tbr) of planar lipid bilayer.The parameters of model are Young’s transversal elasticity modulus (E),surface tension (s), viscosity (m), thickness of the membrane (h), and
Voltage- and Current-Clamp of Planar Lipid Bilayer 59

permittivity of membrane (em). If Ubr is measured by linear rising signal(Fig. 26), the corresponding planar lipid bilayer lifetime (tbr) is always finite[8]. Generic model equation that still contains tbr [69] gives the relation:
Ubr ¼ffiffiffiffiffiffiffiffiffiffiffiffiffinþ k
tbr
4
r: ð17Þ
The relation can be fitted to the data obtained experimentally by thebreakdown voltage determination using linear rising signal [8]. Parameters nand k, which are obtained through fitting, served to calculateYoung’s elasticitymodulus (E ) and surface tension (s) of planar lipid bilayer. Specific capacitance(cBLM) has to be measured, while other parameters such as thickness (h ¼ 3.5nm) and viscosity (m ¼ 6 Ns/m2) can be taken from Ref. [69].
4. Conclusions
In this chapter, we have reviewed setups and experimental methodsapplied to study of the properties of planar lipid bilayers. The planar lipidbilayer presents a good model of the plasma membrane where the behaviorof the lipid part is not obscured by other components of the real cellmembrane. In particular, the influence of the conductive protein ionchannels could be eliminated. The development of measuring systems wasenabled by discovery of the first technique for forming stable planar lipidbilayers in 1962. This discovery permitted design of a range of instrumentsuseful for measuring planar lipid bilayer characteristics by different methods,allowing a more complete picture of planar lipid bilayer physical propertiesand membrane-related phenomena like electroporation. The measurementmethods vary from simple electrical setups, which allowed for the firstexperiments and demonstrated basic lipid bilayer characteristics, to morerecent advanced systems, frequently combining electrical and nonelectricalmethods, such as optical or mechanical.
In the field of electrical measurements on biological objects with non-constant resistance, there are two major approaches to the topic. Onemethod is based on the voltage-controlled measurements, in which differ-ent shapes of an alternating voltage are applied on the planar lipid bilayer.In the other method, the current shape and value are controlled. The planarlipid bilayer characteristics that are observed during the experiment dictatethe choice of the measuring principle. The experiments carried out by thepresented systems showed viscoelastic properties of planar lipid bilayers,temporal changes in the electroporated membrane, and fluctuation char-acteristics of an electropore.
60 P. Kramar et al.

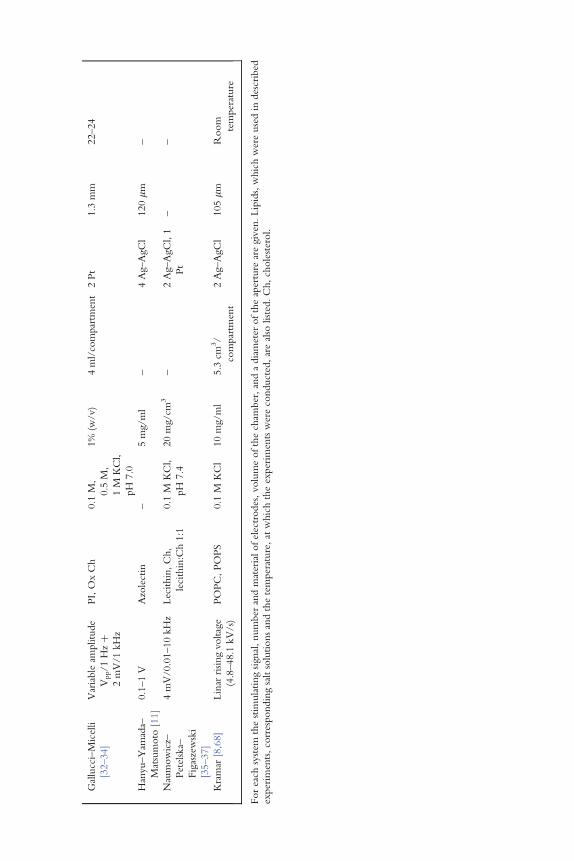
Table
1Descriptionofmeasuringsystems
System
Stimulating
signal
Lipid
Salt
solution
Lipid
preparation
Volume
ofthe
cham
ber
Electrodes
Aperture
diameter
Temperature
(�C)
Rosen–Sutton[16]
AC:5mV/500Hz,
DC:�200mV
Lecitin
1mM,
10mM,
100mM,
1M
KCl
orNaC
l
1%(w
/v)
–2Calomelþ
2Pt
1mm
22
White[17,18]
AC:20mV/100Hz
Oxidized
cholesterol,
lecithin
KCl,pH
7.1
35mg/m
l–
4platinized
Ag–AgCl
1.6
mm
20
Wobshall[19,20]
AC:5–15mVRMS/
4kHz
Cholesterol,
HDTAC
40mM
KCl,
pH
6.7
12mg/m
l–
4Ag–AgCl
1.68mm
30
Montal–Mueller[3]
Voltagepulse10ms,
37.5
mV;
Constantcurrent
20pA
Egglecithin,
cholesterol,
glyceroldioleate,
bovin
cardiolipin,
gramicidin
0.01M
NaC
l,
pH
5.5
–(18�
12)mm
2/
compartm
ent
2Calomel
0.25mm
Room
temperature
Benz[6,7]
10mV–2V/500ms–
500ms
PC,DPhPC,
DOPC,POPC,
PE,OxCh
1M
KCl,
0.1
M
NaC
l,
pH
6
2%(w
/v)
3cm
3/
compartm
ent
2Ag–AgCl
2mm
2(area);
0.2–0.3mm
25
Abidor-
Chernomordik-
Chizmadzhev-
Pastushenko[4]
100mV/1
ms,400
mV/1
msEgglecithin;Ch:
lecitin2:1
0.1
MNaC
l
þ10M
Tris–
HCl,
pH
7.4
40mg/cm
3–
–1mm
27
(continued)
AppendixA.Review
ofMeasuringSystems

Table
1(continued)
System
Stimulating
signal
Lipid
Salt
solution
Lipid
preparation
Volume
ofthe
cham
ber
Electrodes
Aperture
diameter
Temperature
(�C)
Alvares-Latore
[24]
10mV/5
kHz
––
–4cm
2/
compartm
ent
2Ag–AgCl
––
Robello–Gliozzi
[41,43–45]
Squarewaves
40
mV,current
ramp(0.17pA/s),
triangularsignal
2.5
�10�3Hz
Egglecithin:Ch1:1,
PC:Ch(4:1),PC,
Ch,DPhPC,PS
10mM
Tris–Cl,
pH¼7
.5,
0.1
M,
1M
KCl
10mg/m
l2ml/
compartm
ent
2Ag–AgCl
100–150,160,
200mm
25
Chanturya[25,70]
10mV–1V/10–100
msPC:Ch2:1
10mM
Tris,
pH¼7
.4
20mg/m
l9ml
Ag–AgCl
0.6
mm
26–29
Kalinovski-
Figazew
ski
[48–50]
Constantcurrent:
0.005,0.2,0.3,
2nA;step
0.2
nA/10s;
rectangularsignal:
8�
0.2
nA/10s
PC:Ch,lecithin,PS
0.1
MKCl,
pH
7.0
20mg/m
l10cm
3/
compartm
ent
4Ag–AgCl
(0.5
�80)
mm
1mm
23–25
Wilhelm–
Winterhalter–
Zim
mermann–
Benz[26–30]
10mV–2V/500ms–
500ms
OxCh(þ
DOPCor
þPE),azolectin,
DPHPC,PS,
DOPC,DOPE
10mM,
100mM,
1M,2
M,
3M
KCl.
pH¼6
,7
1ml,5mg/m
l,
10mg/m
l,
40mg/m
l
5ml/ compartm
ent,
15ml/
compartm
ent
2Ag–AgCl
100–200mm
,
0.3–3mm,
1mm,
2mm
2
(area)
20,22,25,30
Yam
aguchi–
Nakanishi[12]
7mVRMS/1
kHz
GMO
0.1
MKCl
62mg/m
l–
2Pt
0.7
mm
25
Sharma–Stebe–
Tung[5,31]
100mV/10ms,510
msPOPC,azolectin
100mM
KCl,
pH¼7
.4
10mg/m
l20
mg/m
l
3ml/compartm
ent
4Ag–AgCl
75–100mm
,
105mm
22–24
Gallucci–Micelli
[32–34]
Variableam
plitude
Vpp/1
Hzþ
2mV/1
kHz
PI,OxCh
0.1
M,
0.5
M,
1M
KCl,
pH
7.0
1%(w
/v)
4ml/compartm
ent
2Pt
1.3
mm
22–24
Hanyu–Yam
ada–
Matsumoto
[11]
0.1–1V
Azolectin
–5mg/m
l–
4Ag–AgCl
120mm
–
Naumowicz–
Petelska–
Figaszewski
[35–37]
4mV/0.01–10kHz
Lecithin,Ch,
lecithin:Ch1:1
0.1
MKCl,
pH
7.4
20mg/cm
3–
2Ag–AgCl,1
Pt
––
Kramar[8,68]
Linar
risingvoltage
(4.8–48.1
kV/s)
POPC,POPS
0.1
MKCl
10mg/m
l5.3
cm3/
compartm
ent
2Ag–AgCl
105mm
Room
temperature
Foreach
system
thestim
ulatingsignal,number
andmaterialofelectrodes,volumeofthecham
ber,andadiameter
oftheaperture
aregiven.Lipids,whichwereusedin
described
experim
ents,correspondingsaltsolutionsandthetemperature,atwhichtheexperim
entswereconducted,arealso
listed.Ch,cholesterol.

Table
2Propertiesofplanarlipid
bilayers
ofvariouslipid
compositionsandparameters
atwhichtheywere
measured
Lipid
Saltsolution
T(ms)
Shapeofthe
signal
Ubr(m
V)
C(mF/cm
2)
R(M
Ocm
2)
d(nm)
References
Azolecitin
0.1
MKCl
10
423.4�2
9.4
0.59�0
.21
––
[31]
510
441.6�2
3.2
DOPC
0.1
MNaC
l–
–0.37�0
.01
0.40
4.97�0
.17
[6]
DOPE
0.1
MNaC
l–
–0.37�0
.01
0.40
5.00�0
.16
[6]
DPhPC
0.1
MKCl
–390�2
00.6–0.75
7.85–17.76
–[41,43,45,46]
1M
KCl
––
0.74–1.13
24.3–54.9
–[43,44]
0.1
MKCl
10
546�1
5–
––
[27,30,44]
0.1
MNaC
l–
–0.36�0
.02
0.40
5.08�0
.21
[6]
0.1
MKCl
––
0.9–1
––
[57]
DPhPS
0.1
MKCl
10
530�1
5–
––
[27,30]
Lecithin
1e-3–1M
NaC
lorKCl
––
0.32–0.64
1–10
–[16]
OxCh
1M
KCl
––
0.40
0.25
–[34]
0.1
MKCl
––
0.45�0
.01
0.21�0
.01
–[32]
0.5
MKCl
0.47�0
.04
0.23�0
.01
1M
KCl
0.40�0
.01
0.20�0
.03
1M
KCl
10
–0.56
–3.3
[7]
PC
0.1
MKCl
–280�3
00.75
––
[41,46]
0.1
MNaC
l–
–0.34�0
.01
0.40
5.48�0
.17
[6]
PE
0.1
MNaC
l–
–0.33�0
.01
0.40
5.67�0
.22
[6]
AppendixB.Review
ofMeasuredPropertiesonPlanarLipidBilayer

PI
1M
KCl
––
0.25
0.4
–[34]
0.1
MKCl
––
0.30�0
.01
0.37�0
.01
–[32]
0.5
MKCl
0.27�0
.01
0.34�0
.01
1M
KCl
0.25�0
.01
0.38�0
.06
POPC
0.1
MKCl
10
400�6
––
–[27,30]
0.1
MKCl
10
450�2
40.59�0
.15
––
[5]
100
398�1
9
103
331�2
0
104
282�2
6
105
258�9
106
213�1
8
107
167�6
POPS
0.1
MKCl
10
410�2
0–
––
[27,30]
PS
0.1
MKCl
–500�
50
––
–[46]
PC
þCh
0.1
MKCl
–270�
20
––
–[46]
PC
þPE
0.1
NaC
l–
–0.1
––
[25]
Lecithin
þCh1:1
0.1
MKCl
––
0.38–0.61
0.014–2.12
–[20]
10mM
Tris–Cl
––
––
–[21]
Foreach
lipid
compositionbreak
downvoltage(U
br),capacitance
(C),resistance
(R),andthickens(d)aregiven.Saltsolutionthatwasusedin
experim
ents,aswellas
shapeanddurationofthestim
ulatingsignalarealso
presented.
REFERENCES
[1] R.B. Gennis, Biomembranes, Molecular Structure and Function, Springer,New York, 1989.
[2] P. Mueller, D.O. Rudin, H.T. Tien, W.C. Wescott, Methods for the formation ofsingle bimolecular lipid membranes in aqueous solution, J. Phys. Chem. 67 (1963)534–535.
[3] M. Montal, P. Mueller, Formation of bimolecular membranes from lipid monolayersand a study of their electrical properties, PNAS 69 (1972) 3561–3566.
[4] I.G. Abidor, V.B. Arakelyan, L.V. Chernomordik, Y.A. Chizmadzhev,V.F. Pastushenko, M.R. Tarasevich, Electric breakdown of bilayer lipid membranesI. The main experimental facts and their qualitative discussion, Bioelectrochem.Bioenerg. 6 (1979) 37–52.
[5] G.C. Troiano, L. Tung, V. Sharma, K.J. Stebe, The reduction in electroporationvoltages by the addition of surfactant to planar lipid bilayer, Biophys. J. 75 (1998)880–888.
[6] R. Benz, K. Janko, Voltage-induced capacitance relaxation of lipid bilayer membranes;effects on membrane composition, Biochim. Biophys. Acta 455 (1976) 721–738.
[7] R. Benz, F. Beckers, U. Zimmermann, Reversible electrical breakdown of lipid bilayermembranes: A charge-pulse relaxation study, J. Membr. Biol. 48 (1979) 181–204.
[8] P. Kramar, D. Miklavcic, A. Macek Lebar, Determination of the lipid bilayer break-down voltage by means of a linear rising signal, Bioelectrochemistry 70 (2007) 23–27.
[9] S. Kalinowski, G. Ibron, K. Bryl, Z. Figaszewski, Chronopotentiometric studies ofelectroporation of bilayer lipid membranes, Biochim. Biophys. Acta 1396 (1998)204–212.
[10] A. Blume, Lipids, in: D. Waltz, J. Teissie, G. Milazzo (Eds.), Bioelectrochemistry ofMembranes Birkhauser, Basel-Boston-Berlin, 2004, pp. 24–61.
[11] Y. Hanyu, T. Yamada, G. Matsumoto, Simultaneous measurement of spectroscopicand physiological signals from a planar bilayer system: Detecting voltage-dependentmovement of a membrane-incorporated peptide, Biochemistry 1998 (1998)15376–15382.
[12] H. Yamaguchi, H. Nakanishi, Characterization of the preparation process and thephotochemical control of electrical properties of bilayer lipid membranes containingazobenzene chromopores, Biochim. Biophys. Acta 1148 (1993) 179–184.
[13] T.F. Eibert, M. Alaydrus, F. Wilczewski, V.W. Hansen, Electromagnetic and thermalanalysis for lipid bilayer membranes exposed to RF fields, IEEE Trans. Biomed. Eng.46 (1999) 1013–1021.
[14] P. Mueller, D.O. Rudin, H.T. Tien, W.C. Wescott, Reconstitution of a cell mem-brane structure in vitro and its transformation into an excitable system, Nature194 (1962) 979–980.
[15] T. Hanai, D.A. Haydon, J. Taylor, An investigation by electrical methods of lecitin-in-hydrocarbon films in aqueous solutions, Proc. R. Soc. Lond. Ser. A Math. Phys. Sci.281 (1964) 377–391.
[16] D. Rosen, A.M. Sutton, The effects of a direct current potential bias on the electricalproperties of bimolecular lipid membranes, Biochim. Biophys. Acta 163 (1968)226–233.
[17] S.H. White, A study of lipid bilayer membrane stability using precise measurements ofspecific capacitance, Biophys. J. 10 (1970) 1127–1147.
[18] S.H. White, T.E. Thompson, Capacitance, area, and thickness variations in thin lipidfilms, Biochim. Biophys. Acta 323 (1973) 7–22.
[19] D. Wobschall, Bilayer membrane elasticity and dynamic response, J. Colloid InterfaceSci. 36 (1971) 385–423.
66 P. Kramar et al.

[20] D. Wobschall, Voltage dependance of bilayer membrane capacitance, J. Colloid Inter-face Sci. 40 (1972) 417–423.
[21] K.U. Maheswari, T. Ramachandran, D. Rajaji, Interaction of cisplatin with planarmodel membranes—dose dependent change in electrical characteristics, Biochim.Biophys. Acta 1463 (2000) 230–240.
[22] L.V. Chernomordik, S.I. Sukharev, I.G. Abidor, Y.A. Chizmadzhev, Breakdown oflipid bilayer membranes in an electric field, Biochim. Biophys. Acta 736 (1983)203–213.
[23] L.V. Chernomordik, S.I. Sukharev, S.V. Popov, V.F. Pastushenko, A.V. Sokirko,I.G. Abidor, et al. The electrical breakdown of cell and lipid membranes: thesimilarity of phenomenologies, Biochim. Biophys. Acta 902 (1987) 360–373.
[24] O. Alvarez, R. Latorre, Voltage-dependent capacitance in lipid bilayers made frommonolayers, Biophys. J. 21 (1978) 1–17.
[25] A.N. Chanturiya, Detection of transient capacitance increase associated with channelformation in lipid bilayers, Biochim. Biophys. Acta 1026 (1990) 248–250.
[26] C. Wilhelm, M. Winterhalter, U. Zimmermann, R. Benz, Kinetics o pore size duringirreversible electrical breakdown of lipid bilayer membranes, Biophys. J. 64 (1993)121–128.
[27] A. Diederich, G. Bahr, M. Winterhalter, Influence of surface charges on the rupture ofblack lipid membranes, Phys. Rev. E 58 (1998) 4883–4889.
[28] A. Diederich, G. Bahr, M. Winterhalter, Influence of polylysine on the rupture ofnegatively charged membranes, Langmuir 14 (1998) 4597–4605.
[29] A. Diederich, M. Strobel, W. Meier, M. Winterhalter, Viscosity- and inertia-limitedrupture of dextran-supported black lipid membranes, J. phys. Chem. B 103 (1999)1402–1407.
[30] W. Meier, A. Graff, A. Diederich, M. Winterhalter, Stabilization of planar lipidmembranes: a stratified layer approach, Biochim. Biophys. Acta 2000 (2000)4559–4562.
[31] V. Sharma, K. Uma Maheswari, J.C. Murphy, L. Tung, Poloxamer 188 decreasessusceptibility of artificial lipid membranes to electroporation, Biophys. J. 71 (1996)3229–3241.
[32] E. Gallucci, S. Micelli, G. Monticelli, Pore formation in lipid bilayer membranes madeof phosphatidylinositol and oxidized cholesterol followed by means of alternatingcurrent, Biophys. J. 71 (1996) 824–831.
[33] S. Micelli, E. Gallucci, V. Picciarelli, Studies of mitochondrial porin incorporationparameters and voltage-gated mechanism with different black lipid membranes,Bioelectrochemistry 52 (2000) 63–75.
[34] S. Micelli, E. Gallucci, D. Meleleo, V. Stipani, V. Picciarelli, Mitochondrial porinincorporation into black lipid membranes: ionic and gating contribution to the totalcurrent, Bioelectrochemistry 75 (2002) 97–106.
[35] M. Naumowicz, A.D. Petelska, Z.A. Figaszewski, Capacitance and resistance of thebilayer lipid membrane formed of phosphatidylcholine and cholesterol, Cell. Mol. Biol.Lett. 8 (2003) 5–18.
[36] M. Naumowicz, Z.A. Figaszewski, Impedance spectroscopic investigation of thebilayer lipid membranes formed from the phosphatidylserine–ceramide mixture,J. Membr. Biol. 227 (2009) 67–75.
[37] M. Naumowicz, A.D. Petelska, Z.A. Figaszewski, Impedance analysis ofphosphatidylcholine–cholesterol system in bilayer lipid membranes, Electrochim.Acta 50 (2005) 2155–2161.
[38] A.D. Petelska, M. Naumowicz, Z.A. Figaszewski, Complex formation equilibria intwo-component bilayer lipid membrane: interfacial tension method, J. Membr. Biol.228 (2009) 71–77.
Voltage- and Current-Clamp of Planar Lipid Bilayer 67

[39] P. Kramar, D. Miklavcic, A. Macek-Lebar, A system for the determination of planarlipid membrane voltage and its applications, IEEE Trans. Nanobiosci. 8 (2009)132–138.
[40] W. Carius, Voltage dependence of bilayer membrane capacitance. Harmonic responseto ac excitation with dc bias, J. Colloid Interface Sci. 57 (1976) 301–307.
[41] M. Robello, A. Gliozzi, Conductance transition induced by an electric field in lipidbilayers, Biochim. Biophys. Acta 982 (1989) 173–176.
[42] M. Robello, M. Fresia, L. Maga, A. Grasso, S. Ciani, Permeation of divalent cationsthrough a-latrotoxin channels in lipid bilayers: steady-state current-voltage relation-ships, J. Membr. Biol. 95 (1987) 55–62.
[43] A. Ridi, E. Scalas, M. Robello, A. Gliozzi, Linear response of a fluctuating lipid bilayer,Thin Solid Films 327–329 (1998) 796–799.
[44] E. Scalas, A. Ridi, M. Robello, A. Gliozzi, Flicker noise in bilayer lipid membranes,Europhys. Lett. 43 (1998) 101–105.
[45] A. Ridi, E. Scalas, A. Gliozzi, Noise measurements in bilayer lipid membranes duringelectroporation, The Eur. Phys. J. E 2 (2000) 161–168.
[46] I. Genco, A. Gliozzi, A. Relini, M. Robello, E. Scalas, Electroporation in symmetricand asymmetric membranes, Biochim. Biophys. Acta 1149 (1993) 10–18.
[47] E. Pescio, A. Ridi, A. Gliozzi, A picoampere current generator for membrane electro-poration, Rev. Sci. Instrum. 71 (2000) 1740–1744.
[48] S. Kalinowski, Z. Figaszewski, A new system for bilayer lipid membrane capacitancemeasurements: method, apparatus and applications, Biochim. Biophys. Acta1112 (1992) 57–66.
[49] S. Kalinowski, Z. Figaszewski, A four-electrode system for measurement of bilayerlipid membrane capacitance, Meas. Sci. Technol. 6 (1995) 1034–1049.
[50] S. Kalinowski, Z. Figaszewski, A four-electrode potentiostat–galvanostat for studies ofbilayer lipid membranes, Meas. Sci. Technol. 6 (1995) 1050–1055.
[51] S. Koronkiewicz, S. Kalinowski, K. Bryl, Programmable chronopotentiometry as atool for the study of electroporation and resealing of pores in bilayer lipid membranes,Biochim. Biophys. Acta 1561 (2002) 222–229.
[52] M. Kotulska, Natural fluctuations of an electropore show fractional Levy stable motion,Biophys. J. 92 (2007) 2412–2421.
[53] J. Vargas, J.M. Alarcon, E. Rojas, Displacement currents associated with the insertionof Alzheimer Disease amyloid (beta)-peptide into planar bilayer membranes, Biophys.J. 79 (2000) 934–944.
[54] D. Miklavcic, M. Puc, Electroporation, Wiley Encyclopedia of BiomedicalEngineering, Wiley, New York, 2006.
[55] A. Macek-Lebar, G.C. Troiano, L. Tung, D. Miklavcic, Inter-pulse interval betweenrectangular voltage pulses affects electroporation threshold of artificial lipid bilayers,IEEE Trans. Nanobiosci. 1 (2002) 116–120.
[56] V.F. Antonov, V.V. Petrov, A.A. Molnar, D.A. Predvoditelev, A.S. Ivanov, Theappearance of single ion channels in unmodified lipid bilayer membrane at the phasetransition temperature, Nature 283 (1980) 585–588.
[57] K.C. Melikov, V.A. Frolov, A. Shcherbakov, A.V. Samsonov, Y.A. Chizmadzhev,L.V. Chernomordik, Voltage-induced nonconductive pre-pores and metastable singlepores in unmodified planar lipid bilayer, Biophys. J. 80 (2001) 1829–1836.
[58] M. Kotulska, S. Koronkiewicz, S. Kalinowski, Self-similar processes and flicker noisefrom a fluctuating nanopore in a lipid membrane, Phys. Rev. E 69 (2004)031920–031930.
[59] S. Koronkiewicz, K. Bryl, Cholesterol-induced variations in fluctuations of the pores inbilayer lipid membrane, Cell. Mol. Biol. Lett. 4 (1999) 567–582.
68 P. Kramar et al.

[60] W. Helfrich, Elastic properties of lipid bilayers—theory and possible experiments, Z.Naturforsch. C J. Biosci. C 28 (1973) 693–703.
[61] R. Kwok, E.A. Evans, Thermoelasticity of large lecithin bilayer vesicles, Biophys. J.35 (1981) 637–652.
[62] E. Evans, D. Needham, Physical properties of surfactant bilayer membranes: thermaltransitions, elasticity, rigidity, cohesion, and colloidal interactions, J. Phys. Chem.91 (1987) 4219–4228.
[63] B.L.-S. Mui, P.R. Cullis, E.A. Evans, T.D. Madden, Osmotic properties of largeunilamellar vesicles prepared by extrusion, Biophys. J. 64 (1993) 443–453.
[64] E. Evans, W. Rawicz, Elasticity of ‘‘fuzzy’’ biomembranes, Phys. Rev. Lett. 79 (1997)2379–2382.
[65] J. Genova, A. Zheliaskova, M.D. Mitov, The influence of sucrose on the elasticity ofSOPC lipid membrane studied by the analysis of thermally induced shape fluctuations,Colloids Surf. A—Physicochem. Eng. Asp. 282 (2006) 420–422.
[66] M. Winterhalter, Black lipid membranes, Curr. Opin. Colloid Interface Sci. 5 (2000)250–255.
[67] T. Hianik, Structure and physical properties of biomembranes and model membranes,Acta Phys. Slovaca 56 (2006) 687–806.
[68] I. Sabotin, A. Macek Lebar, D. Miklavcic, P. Kramar, Measurement protocol for planarlipid bilayer viscoelastic properties, IEEE Trans. Dielectr. Electr. Insul. 16 (2009)1236–1242.
[69] D.S. Dimitrov, Electric field-induced breakdown of lipid bilayers and cell-membranes—a thin viscoelastic film model, J. Membr. Biol. 78 (1984) 53–60.
[70] A.N. Chanturiya, G. Basanez, U. Schubert, P. Henklein, J.W. Yewdell,J. Zimmerberg, PB1-F2, an influenza A virus-encoded proapoptotic mitochondrialprotein, creates variably sized pores in planar lipid membranes, J. Virol. 78 (2004)6304–6312.
Voltage- and Current-Clamp of Planar Lipid Bilayer 69


![Elementary [Ca21 signals generated by electroporation ...lbk.fe.uni-lj.si/pdfs/fj1999.pdf · Elementary [Ca21] i signals generated by electroporation functionally mimic those evoked](https://img.pdfslide.us/doc/110x75/5c690a0109d3f29b758c8021/elementary-ca21-signals-generated-by-electroporation-lbkfeuni-ljsipdfs.jpg)